Embed Size (px)
Citation preview
KSE Limited
Independent Equity Research Enhancing investment decisions
In-depth analysis of the fundamentals and valuation
Business ProspectsFinancial Performance
Corporate Governance
Management Evaluation

CRISIL Independent Equity Research Team Mukesh Agarwal [email protected] +91 (22) 3342 3035 Director Tarun Bhatia [email protected] +91 (22) 3342 3226 Director- Capital Markets Analytical Contacts Chetan Majithia [email protected] +91 (22) 3342 4148 Sudhir Nair [email protected] +91 (22) 3342 3526 Suresh Guruprasad [email protected] +91 (22) 3342 3531 Sagar Parikh [email protected] +91 (22) 3342 3502 Vishal Rampuria [email protected] +91 (22) 3342 3525 Nihag Shah [email protected] +91 (22) 3342 3533 Bhaskar Bukrediwala [email protected] +91 (22) 3342 1983 Ravi Dodhia [email protected] +91 (22) 3342 3508 Urmil Shah [email protected] +91 (22) 3342 8135 Neeta Khilnani [email protected] +91 (22) 3342 1882 Niyati Dave [email protected] +91 (22) 3342 3569 Suhel Kapur [email protected] +91 (22) 3342 4149 Amit Murarka [email protected] +91 (22) 3342 3578 Aishvarya Dadheech [email protected] +91 (22) 3342 1994 Amit Kawle [email protected] +91 (22) 3342 1972 Charulata Gaidhani [email protected] +91 (22) 3342 3587 Sector Contacts Nagarajan Narasimhan [email protected] +91 (22) 3342 3536 Ajay D'Souza [email protected] +91 (22) 3342 3567 Manoj Mohta [email protected] +91 (22) 3342 3554 Sachin Mathur [email protected] +91 (22) 3342 3541 Sridhar C [email protected] +91 (22) 3342 3546 Business Development Contacts Vinaya Dongre [email protected] +91 99 202 25174 Sagar Sawarkar [email protected] +91 98 216 38322 Sejal Kothari [email protected] +91 99 206 25746 Salil Srivastava [email protected] +91 98 339 96430 Supriya Tapase [email protected] +91 98 207 45668 Vipin Saboo [email protected] +91 98 207 79873
CRISIL’s Equity Offerings The Equity Group at CRISIL Research provides a wide range of services including: Independent Equity Research IPO Grading White Labelled Research Valuation on companies for use of Institutional Investors, Asset Managers, Corporates
Other Services by the Research group include CRISINFAC Industry research on over 60 industries and Economic Analysis Customised Research on Market sizing, Demand modelling and Entry strategies Customised research content for Information Memorandum and Offer documents

Explanation of CRISIL Fundamental and Valuation (CFV) matrix The CFV Matrix (CRISIL Fundamental and Valuation Matrix) addresses the two important analysis of an investment making process – Analysis of Fundamentals (addressed through Fundamental Grade) and Analysis of Returns (Valuation Grade)
Fundamental Grade CRISIL’s Fundamental Grade represents an overall assessment of the fundamentals of the company graded in relation to other listed equity securities in India. The grade facilitates easy comparison of fundamentals between companies, irrespective of the size or the industry they operate in. The grading factors in the following:
Business Prospects: Business prospects factors in Industry prospects and company’s future financial performance Management Evaluation: Factors such as track record of the management, strategy are taken into consideration Corporate Governance: Assessment of adequacy of corporate governance structure and disclosure norms
The grade is assigned on a five-point scale from grade 5 (indicating Excellent fundamentals) to grade 1 (Poor fundamentals)
CRISIL Fundamental Grade Assessment 5/5 Excellent fundamentals 4/5 Superior fundamentals 3/5 Good fundamentals 2/5 Moderate fundamentals 1/5 Poor fundamentals
Valuation Grade CRISIL’s Valuation Grade represents an assessment of the potential value in the company stock for an equity investor over a 12 month period. The grade is assigned on a five-point scale from grade 5 (indicating strong upside from the current market price (CMP)) to grade 1 (strong downside from the CMP).
CRISIL Valuation Grade Assessment 5/5 Strong upside (>25% from CMP) 4/5 Upside (10-25% from CMP) 3/5 Align (+-10% from CMP) 2/5 Downside (negative 10-25% from CMP) 1/5 Strong downside (<-25% from CMP) Analyst Disclosure Each member of the team involved in the preparation of the grading report, hereby affirms that there exists no conflict of interest that can bias the grading recommendation of the company. Additional Disclosure This report has been sponsored by NSE - Investor Protection Fund Trust (NSEIPFT). Disclaimer: This Exchange-commissioned Report (Report) is based on data publicly available or from sources considered reliable. CRISIL Ltd. (CRISIL) does not represent that it is accurate or complete and hence, it should not be relied upon as such. The data / Report are subject to change without any prior notice. Opinions expressed herein are our current opinions as on the date of this Report. Nothing in this Report constitutes investment, legal, accounting or tax advice or any solicitation, whatsoever. The subscriber / user assumes the entire risk of any use made of this data / Report. CRISIL especially states that it has no financial liability, whatsoever, to the subscribers / users of this Report. This Report is for the personal information only of the authorized recipient in India only. This Report should not be reproduced or redistributed or communicated directly or indirectly in any form to any other person – especially outside India or published or copied in whole or in part, for any purpose.

CRISIL Equities
Company Name Limited
4
List of companies under coverage
Initiating Coverage 3QFY10 Update Sl.
No. Report Date
Company Name Sector CMP M. Cap (Rs. Mn)
Fundamental value
Fundamental grade
Fundamental value
Fundamental grade
1 02-Feb-10 Aarti Industries Chemicals 49 3,757 56 3/5 56 3/5
2 31-Jan-10 ABG Shipyard Shipping 315 10,286 242 3/5 259 3/5
3 01-Feb-10 Apollo hospitals Hospitals 712 44,102 642 4/5 724 4/5
4 04-May-10 Beardsell Limited Packaging/Expanded Polystyrene 64 245 54 3/5 - -
5 06-Apr-10 Dhanuka Agritech Ltd Pesticides 271 2,483 283 3/5 - -
6 29-Jan-10 DLF Real Estate 335 568,495 356 3/5 356 3/5
7 27-Jan-10 Dolphin Offshore Oil & Gas 385 6,060 315 3/5 417 3/5
8 05-Feb-10 EID Parry Sugar 348 30,050 394 4/5 395 4/5
9 01-Feb-10 Everest Kanto Manufacturing 131 13,252 270 4/5 135 4/5
10 11-May-10 GKB Ophthalmics Ltd Ophthalmic Lens 48 199 52 2/5 - -
11 23-Feb-10 Havells India Ltd Capital Goods 533 32,070 614 4/5 - -
12 29-Jan-10 Hero Honda Automobiles 1,889 377,240 1,747 5/5 1937# 5/5#13 02-Mar-10 Hindusthan National
Glass & Industries Ltd. Packaging/Glass 240 21,049 314 4/5 - -
14 11-Feb-10 Indiabulls Securities Financial Services 31 7,932 60 4/5 48 4/5
15 05-Feb-10 JBF Industries Textiles 111 6,882 119 3/5 129 3/5
16 05-Feb-10 JM Financial Financial Services 39 30,550 57 4/5 57 4/517 21-Jan-10 KKCL Fashion and
apparels 265 3,292 336 3/5 - -
18 01-Feb-10 KRBL Agriculture/Rice 194 4,716 340 3/5 340 3/5
19 11-May-10 KSE Limited Animal Feed 210 673 200 3/5 - -
20 31-Jan-10 NTPC Power 214 1,764,537 228 5/5 231 5/5
21 29-Jan-10 Pantaloon Retail (India) Retail 406 77,282 * 4/5 * 4/522 04-Feb-10 Phoenix Mills Real Estate 203 29,404 160 2/5 183 2/523 22-Apr-10 Polaris Software Information
Technology 186 18,407 247 4/5 - -
24 19-Apr-10 Sangam (India) Ltd Textiles 33 1,380 46 3/5 46 5/525 03-Feb-10 UTV Software Media and
Entertainment 498 17,066 548 3/5 538 3/5
26 07-May-10 Zylog System Information Technology
456 7,494 530 3/5 - -
CMP - Current Market Price (as on date of respective report)
M Cap - Market Capitalisation (as on date of respective report)
*NA - Not Applicable (Company has requested for a fundamental grading only)
# Includes Q4FY10 result update
1
Independent Research Report - KSE Ltd‘Good fundamentals and aligned valuation’ Industry: Animal Feed
Date: May 11, 2010
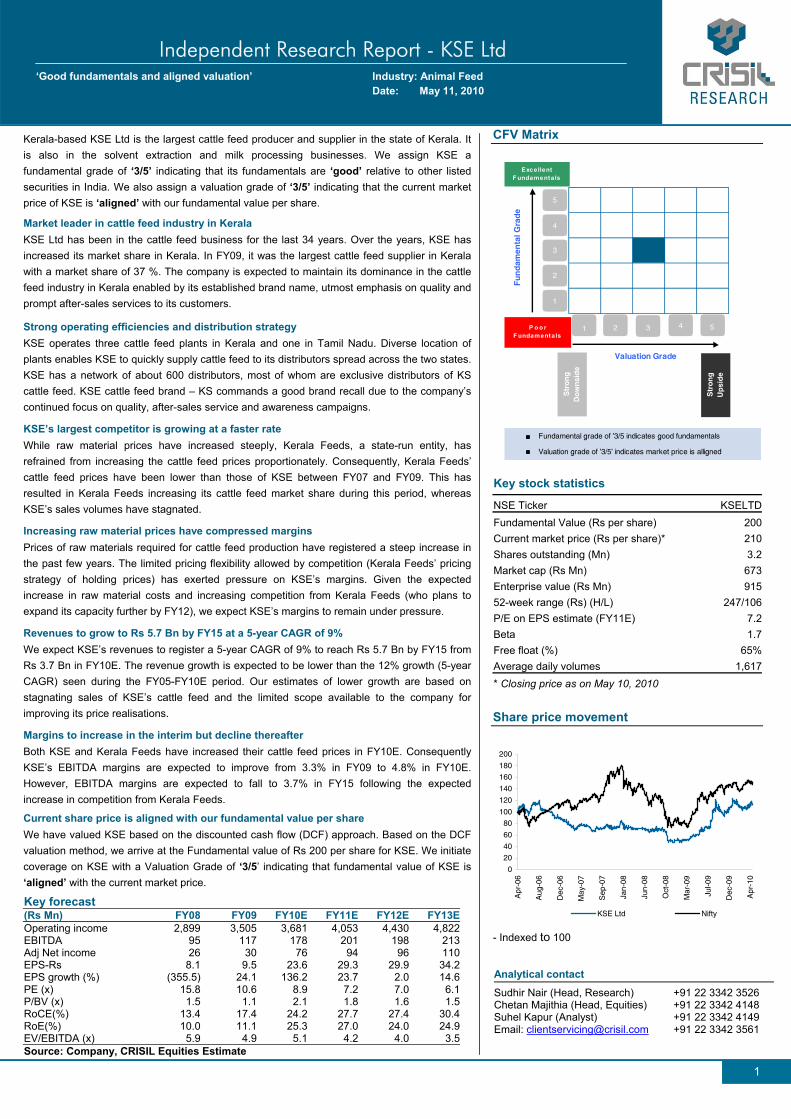
Kerala-based KSE Ltd is the largest cattle feed producer and supplier in the state of Kerala. It is also in the solvent extraction and milk processing businesses. We assign KSE a fundamental grade of ‘3/5’ indicating that its fundamentals are ‘good’ relative to other listed securities in India. We also assign a valuation grade of ‘3/5’ indicating that the current market price of KSE is ‘aligned’ with our fundamental value per share.
Market leader in cattle feed industry in Kerala KSE Ltd has been in the cattle feed business for the last 34 years. Over the years, KSE has increased its market share in Kerala. In FY09, it was the largest cattle feed supplier in Kerala with a market share of 37 %. The company is expected to maintain its dominance in the cattle feed industry in Kerala enabled by its established brand name, utmost emphasis on quality and prompt after-sales services to its customers.
Strong operating efficiencies and distribution strategy KSE operates three cattle feed plants in Kerala and one in Tamil Nadu. Diverse location of plants enables KSE to quickly supply cattle feed to its distributors spread across the two states. KSE has a network of about 600 distributors, most of whom are exclusive distributors of KS cattle feed. KSE cattle feed brand – KS commands a good brand recall due to the company’s continued focus on quality, after-sales service and awareness campaigns.
KSE’s largest competitor is growing at a faster rate While raw material prices have increased steeply, Kerala Feeds, a state-run entity, has refrained from increasing the cattle feed prices proportionately. Consequently, Kerala Feeds’ cattle feed prices have been lower than those of KSE between FY07 and FY09. This has resulted in Kerala Feeds increasing its cattle feed market share during this period, whereas KSE’s sales volumes have stagnated.
Increasing raw material prices have compressed margins Prices of raw materials required for cattle feed production have registered a steep increase in the past few years. The limited pricing flexibility allowed by competition (Kerala Feeds’ pricing strategy of holding prices) has exerted pressure on KSE’s margins. Given the expected increase in raw material costs and increasing competition from Kerala Feeds (who plans to expand its capacity further by FY12), we expect KSE’s margins to remain under pressure.
Revenues to grow to Rs 5.7 Bn by FY15 at a 5-year CAGR of 9% We expect KSE’s revenues to register a 5-year CAGR of 9% to reach Rs 5.7 Bn by FY15 from Rs 3.7 Bn in FY10E. The revenue growth is expected to be lower than the 12% growth (5-year CAGR) seen during the FY05-FY10E period. Our estimates of lower growth are based on stagnating sales of KSE’s cattle feed and the limited scope available to the company for improving its price realisations.
Margins to increase in the interim but decline thereafter Both KSE and Kerala Feeds have increased their cattle feed prices in FY10E. Consequently KSE’s EBITDA margins are expected to improve from 3.3% in FY09 to 4.8% in FY10E. However, EBITDA margins are expected to fall to 3.7% in FY15 following the expected increase in competition from Kerala Feeds.
Current share price is aligned with our fundamental value per share We have valued KSE based on the discounted cash flow (DCF) approach. Based on the DCF valuation method, we arrive at the Fundamental value of Rs 200 per share for KSE. We initiate coverage on KSE with a Valuation Grade of ‘3/5’ indicating that fundamental value of KSE is ‘aligned’ with the current market price.
Key forecast (Rs Mn) FY08 FY09 FY10E FY11E FY12E FY13EOperating income 2,899 3,505 3,681 4,053 4,430 4,822EBITDA 95 117 178 201 198 213Adj Net income 26 30 76 94 96 110EPS-Rs 8.1 9.5 23.6 29.3 29.9 34.2EPS growth (%) (355.5) 24.1 136.2 23.7 2.0 14.6PE (x) 15.8 10.6 8.9 7.2 7.0 6.1P/BV (x) 1.5 1.1 2.1 1.8 1.6 1.5RoCE(%) 13.4 17.4 24.2 27.7 27.4 30.4RoE(%) 10.0 11.1 25.3 27.0 24.0 24.9EV/EBITDA (x) 5.9 4.9 5.1 4.2 4.0 3.5Source: Company, CRISIL Equities Estimate
CFV Matrix
Fundamental grade of '3/5 indicates good fundamentals
Valuation grade of '3/5' indicates market price is alligned
1
2
3
4
5
1 2 3 4 5
Valuation Grade
Fu
nd
amen
tal G
rad
e
P o o r F undamentals
ExcellentF undamentals
Str
on
gD
ow
nsi
de
Str
on
gU
psi
de
Key stock statistics NSE Ticker KSELTDFundamental Value (Rs per share) 200Current market price (Rs per share)* 210Shares outstanding (Mn) 3.2Market cap (Rs Mn) 673Enterprise value (Rs Mn) 91552-week range (Rs) (H/L) 247/106P/E on EPS estimate (FY11E) 7.2Beta 1.7Free float (%) 65%Average daily volumes 1,617* Closing price as on May 10, 2010
Share price movement
0
20
40
60
80
100
120
140
160
180
200
Apr
-06
Aug
-06
Dec
-06
May
-07
Sep
-07
Jan-
08
Jun-
08
Oct
-08
Mar
-09
Jul-0
9
Dec
-09
Apr
-10
KSE Ltd Nifty
- Indexed to 100
Analytical contact
Sudhir Nair (Head, Research) +91 22 3342 3526 Chetan Majithia (Head, Equities) +91 22 3342 4148 Suhel Kapur (Analyst) +91 22 3342 4149 Email: [email protected] +91 22 3342 3561
CRISIL Equities
KSE Limited
2
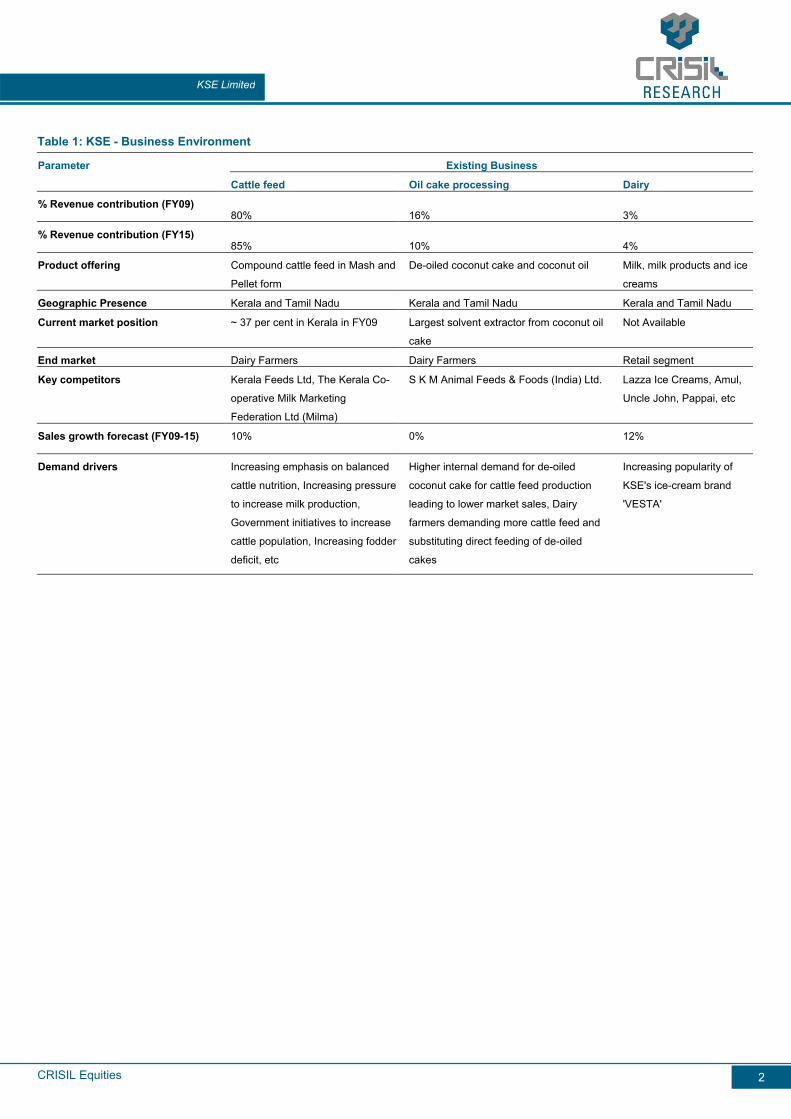
Table 1: KSE - Business Environment
Parameter Existing Business
Cattle feed Oil cake processing Dairy
% Revenue contribution (FY09) 80% 16% 3%
% Revenue contribution (FY15) 85% 10% 4%
Product offering Compound cattle feed in Mash and
Pellet form
De-oiled coconut cake and coconut oil Milk, milk products and ice
creams
Geographic Presence Kerala and Tamil Nadu Kerala and Tamil Nadu Kerala and Tamil Nadu
Current market position ~ 37 per cent in Kerala in FY09 Largest solvent extractor from coconut oil
cake
Not Available
End market Dairy Farmers Dairy Farmers Retail segment
Key competitors Kerala Feeds Ltd, The Kerala Co-
operative Milk Marketing
Federation Ltd (Milma)
S K M Animal Feeds & Foods (India) Ltd. Lazza Ice Creams, Amul,
Uncle John, Pappai, etc
Sales growth forecast (FY09-15) 10% 0% 12%
Demand drivers Increasing emphasis on balanced
cattle nutrition, Increasing pressure
to increase milk production,
Government initiatives to increase
cattle population, Increasing fodder
deficit, etc
Higher internal demand for de-oiled
coconut cake for cattle feed production
leading to lower market sales, Dairy
farmers demanding more cattle feed and
substituting direct feeding of de-oiled
cakes
Increasing popularity of
KSE's ice-cream brand
'VESTA'
CRISIL Equities
KSE Limited
3
Grading Rationale
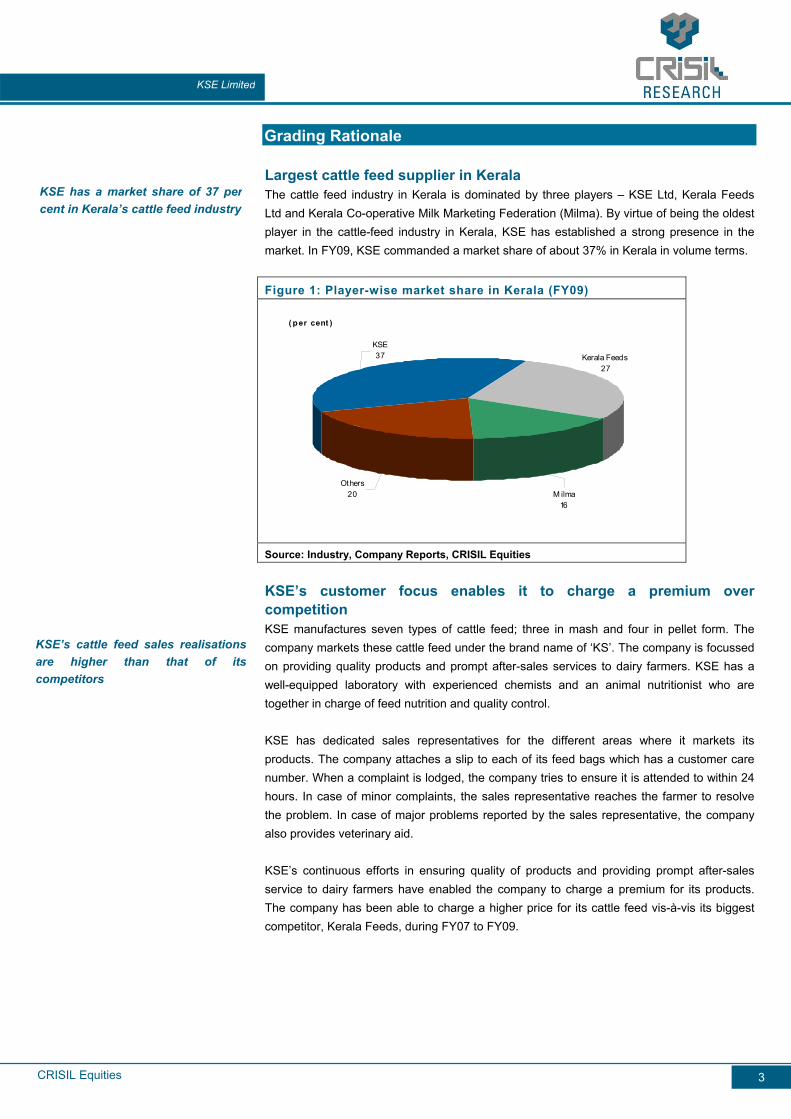
Largest cattle feed supplier in Kerala The cattle feed industry in Kerala is dominated by three players – KSE Ltd, Kerala Feeds Ltd and Kerala Co-operative Milk Marketing Federation (Milma). By virtue of being the oldest player in the cattle-feed industry in Kerala, KSE has established a strong presence in the market. In FY09, KSE commanded a market share of about 37% in Kerala in volume terms.
Figure 1: Player-wise market share in Kerala (FY09)
Others20 M ilma
16
Kerala Feeds27
KSE37
( p er cent )
Source: Industry, Company Reports, CRISIL Equities
KSE’s customer focus enables it to charge a premium over competition KSE manufactures seven types of cattle feed; three in mash and four in pellet form. The company markets these cattle feed under the brand name of ‘KS’. The company is focussed on providing quality products and prompt after-sales services to dairy farmers. KSE has a well-equipped laboratory with experienced chemists and an animal nutritionist who are together in charge of feed nutrition and quality control.
KSE has dedicated sales representatives for the different areas where it markets its products. The company attaches a slip to each of its feed bags which has a customer care number. When a complaint is lodged, the company tries to ensure it is attended to within 24 hours. In case of minor complaints, the sales representative reaches the farmer to resolve the problem. In case of major problems reported by the sales representative, the company also provides veterinary aid.
KSE’s continuous efforts in ensuring quality of products and providing prompt after-sales service to dairy farmers have enabled the company to charge a premium for its products. The company has been able to charge a higher price for its cattle feed vis-à-vis its biggest competitor, Kerala Feeds, during FY07 to FY09.
KSE has a market share of 37 percent in Kerala’s cattle feed industry
KSE’s cattle feed sales realisationsare higher than that of itscompetitors

CRISIL Equities
KSE Limited
4
Figure 2: Average cattle feed realisations: KSE versus Kerala
Feeds
6.8 6.8 6.9
7.6
9.5
6.46.6
7.0
7.8
9.7
6.0
6.5
7.0
7.5
8.0
8.5
9.0
9.5
10.0
FY05 FY06 FY07 FY08 FY09
( R s/ Kg )
Kerala Feeds KSE
Source: CMIE, Company Reports, CRISIL Equities
Diversified plant locations and a wide distribution network ensure quicker reach to dairy farmers KSE owns four cattle feed plants. Three plants are located in different districts of Kerala and one plant is based in Tamil Nadu. Given the history of labour issues in Kerala, KSE had started a cattle feed plant in Swaminathapuram, Tamil Nadu in 1988. In addition to exploring the cattle feed market in Tamil Nadu, the unit served as a risk mitigation strategy. About 60% of cattle feed from Swaminathapuram unit was being sold in Kerala and the balance in Tamil Nadu. However, after expanding capacities in FY10, in Kerala, KSE is now focussing on selling more of Swaminathapuram unit’s production in Tamil Nadu itself.
Diverse locations of plants ensure quick reach of feed to KSE’s distributors at a low cost. This in turn enables the distributors to provide feed to their dealers who are able to effectively meet the dairy farmer’s demand. The company has a network of about 600 distributors for its cattle feed business and most of them are exclusive distributors of KS cattle feed. A distributor would typically have about 20 sub-dealers who sell cattle feed to dairy farmers.
KSE is also outsourcing manufacturing of cattle feed in some other districts of Kerala where it does not have its own plant. Outsourcing of a part of its manufacturing is also undertaken with the primary objective of reaching quickly to distributors and saving on freight costs.
Capacity expansion to result in lesser outsourcing In FY09, KSE’s three plants in Kerala had a combined capacity of 126,000 tonnes per annum, while its plant in Tamil Nadu had a capacity of 53,000 tonnes. In FY10, the company has expanded capacity by setting up a new plant with a capacity of 175,000 tonnes at Irinjalikuda in Kerala. Consequently, the company’s total capacity of the cattle feed division has almost doubled from 179,000 tonnes in FY09 to 354,000 tonnes in FY10.
KSE’s cattle feed capacity expandedfrom 179,000 tpa in FY09 to 354,000tpa in FY10
KSE has 3 plants in differentdistricts of Kerala and 1 plant inTamil Nadu
CRISIL Equities
KSE Limited
5
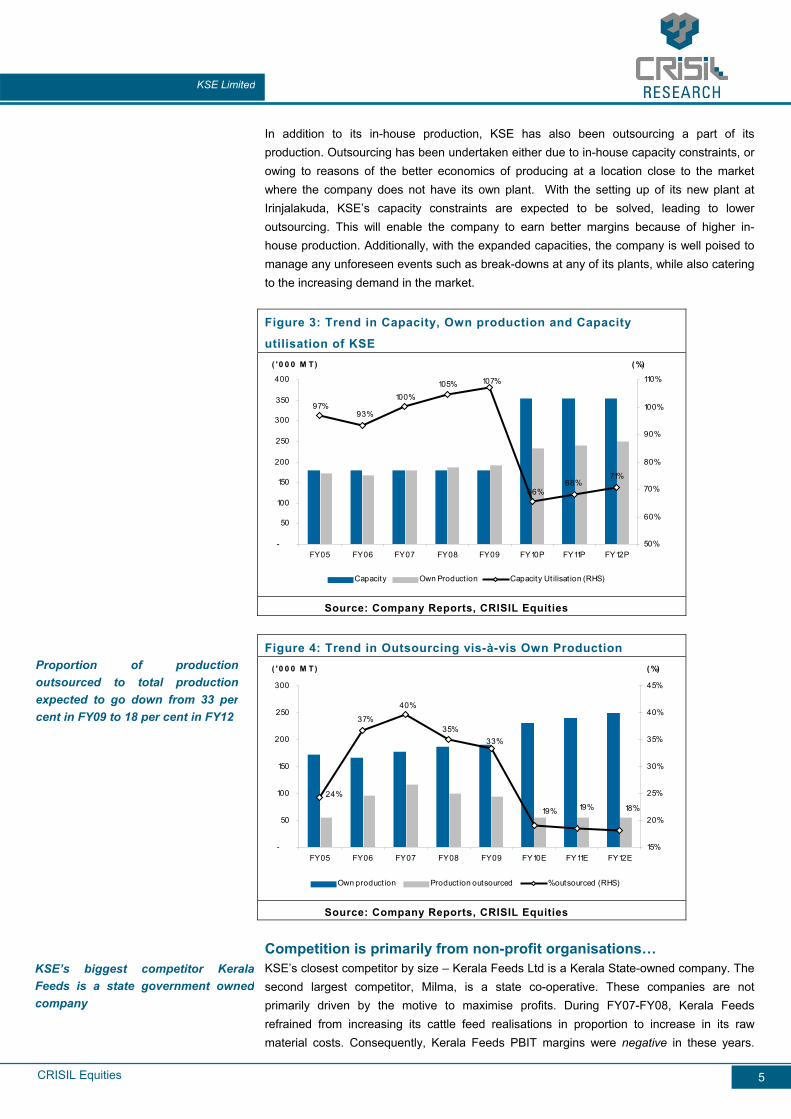
In addition to its in-house production, KSE has also been outsourcing a part of its production. Outsourcing has been undertaken either due to in-house capacity constraints, or owing to reasons of the better economics of producing at a location close to the market where the company does not have its own plant. With the setting up of its new plant at Irinjalakuda, KSE’s capacity constraints are expected to be solved, leading to lower outsourcing. This will enable the company to earn better margins because of higher in-house production. Additionally, with the expanded capacities, the company is well poised to manage any unforeseen events such as break-downs at any of its plants, while also catering to the increasing demand in the market.
Figure 3: Trend in Capacity, Own production and Capacity
utilisation of KSE
71%68%
66%
107%105%100%
93%97%
-
50
100
150
200
250
300
350
400
FY05 FY06 FY07 FY08 FY09 FY10P FY11P FY12P
( ' 0 0 0 M T )
50%
60%
70%
80%
90%
100%
110%
( %)
Capacity Own Production Capacity Ut ilisat ion (RHS)
Source: Company Reports, CRISIL Equities
Figure 4: Trend in Outsourcing vis-à-vis Own Production
24%
37%
40%
35%33%
19% 19% 18%
-
50
100
150
200
250
300
FY05 FY06 FY07 FY08 FY09 FY10E FY11E FY12E
( ' 0 0 0 M T )
15%
20%
25%
30%
35%
40%
45%
( %)
Own production Product ion outsourced % outsourced (RHS)
Source: Company Reports, CRISIL Equities
Competition is primarily from non-profit organisations… KSE’s closest competitor by size – Kerala Feeds Ltd is a Kerala State-owned company. The second largest competitor, Milma, is a state co-operative. These companies are not primarily driven by the motive to maximise profits. During FY07-FY08, Kerala Feeds refrained from increasing its cattle feed realisations in proportion to increase in its raw material costs. Consequently, Kerala Feeds PBIT margins were negative in these years.
Proportion of productionoutsourced to total productionexpected to go down from 33 percent in FY09 to 18 per cent in FY12
KSE’s biggest competitor KeralaFeeds is a state government ownedcompany

CRISIL Equities
KSE Limited
6
They became marginally positive only in FY09 when the company increased its selling price in line with the increase in its cost of raw materials. On the contrary, KSE, a private profit-oriented enterprise, is forced to strike a balance between maintaining its market share while securing its profits. In its attempt to pass on the increase in raw material costs to dairy farmers, the price of its cattle feed has risen vis-a-vis Kerala Feeds’s cattle feed. As a result, Kerala Feeds’s sales volumes have grown in the last 3 years (FY07 to FY09), while KSE’s sales volumes have stagnated.
Figure 5: Average Cattle Feed Realisations Figure 6: Trend in cattle feed sales volume
6.8 6.8 6.9
7.6
9.5
6.46.6
7.0
7.8
9.7
6.0
6.5
7.0
7.5
8.0
8.5
9.0
9.5
10.0
FY05 FY06 FY07 FY08 FY09
( R s/ Kg )
Kerala Feeds KSE
-
50
100
150
200
250
300
350
FY05 FY06 FY07 FY08 FY09 FY05 FY06 FY07 FY08 FY09
Kerala Feeds KSE
( ' 0 0 0 M T )
Source: CMIE, Company Reports, CRISIL Equities Source: Company Reports, CRISIL Equities
Figure 7: Trend in PBIT margins of cattle feed
business
Figure 8: Trend in RoCE
8.4%
6.3%
-2.2% -2.3%
4.1%
0.3%1.5%
0.2%
3.7%
7.8%
-4.0%
-2.0%
0.0%
2.0%
4.0%
6.0%
8.0%
10.0%
FY05 FY06 FY07 FY08 FY09
( %)
Kerala Feeds KSE
-7.6%-10.8%
29.6%
20.9%
1.0%
13.4%
1.2%
18.9%
24.4%
17.4%
-15.0%
-10.0%
-5.0%
0.0%
5.0%
10.0%
15.0%
20.0%
25.0%
30.0%
35.0%
FY05 FY06 FY07 FY08 FY09
( %)
Kerala Feeds KSE
Source: Company Reports, CRISIL Equities Source: Company Reports, CRISIL Equities
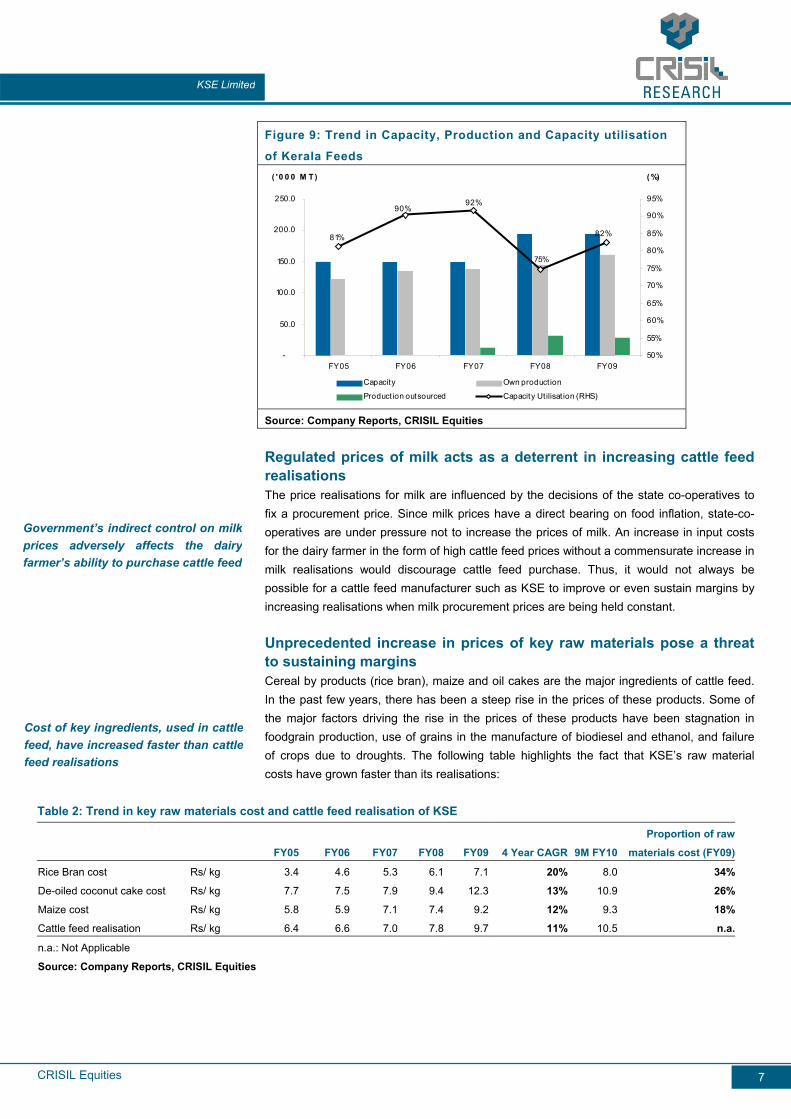
…..and is catching up fast Kerala Feeds has already embarked upon the expansion plan of its cattle feed business. It is setting up a new plant with a capacity of 90,000 tonnes per annum which is expected to come on-stream in FY12. The total capacity of the company will thus increase from 195,000 tonnes per annum in FY09 to 285,000 tonnes in FY12. Enhanced capacities of Kerala Feeds will increase the competition level for KSE.
Kerala Feeds is expanding itscapacity by 90,000 tonnes per annumin FY12
CRISIL Equities
KSE Limited
7
Figure 9: Trend in Capacity, Production and Capacity utilisation
of Kerala Feeds
82%
75%
92%90%
81%
-
50.0
100.0
150.0
200.0
250.0
FY05 FY06 FY07 FY08 FY09
( ' 0 0 0 M T )
50%
55%
60%
65%
70%
75%
80%
85%
90%
95%
( %)
Capacity Own production
Production outsourced Capacity Utilisat ion (RHS) Source: Company Reports, CRISIL Equities
Regulated prices of milk acts as a deterrent in increasing cattle feed realisations The price realisations for milk are influenced by the decisions of the state co-operatives to fix a procurement price. Since milk prices have a direct bearing on food inflation, state-co-operatives are under pressure not to increase the prices of milk. An increase in input costs for the dairy farmer in the form of high cattle feed prices without a commensurate increase in milk realisations would discourage cattle feed purchase. Thus, it would not always be possible for a cattle feed manufacturer such as KSE to improve or even sustain margins by increasing realisations when milk procurement prices are being held constant.
Unprecedented increase in prices of key raw materials pose a threat to sustaining margins Cereal by products (rice bran), maize and oil cakes are the major ingredients of cattle feed. In the past few years, there has been a steep rise in the prices of these products. Some of the major factors driving the rise in the prices of these products have been stagnation in foodgrain production, use of grains in the manufacture of biodiesel and ethanol, and failure of crops due to droughts. The following table highlights the fact that KSE’s raw material costs have grown faster than its realisations:
Table 2: Trend in key raw materials cost and cattle feed realisation of KSE
Proportion of raw
FY05 FY06 FY07 FY08 FY09 4 Year CAGR 9M FY10 materials cost (FY09)
Rice Bran cost Rs/ kg 3.4 4.6 5.3 6.1 7.1 20% 8.0 34%
De-oiled coconut cake cost Rs/ kg 7.7 7.5 7.9 9.4 12.3 13% 10.9 26%
Maize cost Rs/ kg 5.8 5.9 7.1 7.4 9.2 12% 9.3 18%
Cattle feed realisation Rs/ kg 6.4 6.6 7.0 7.8 9.7 11% 10.5 n.a.
n.a.: Not Applicable
Source: Company Reports, CRISIL Equities
Cost of key ingredients, used in cattlefeed, have increased faster than cattlefeed realisations
Government’s indirect control on milkprices adversely affects the dairyfarmer’s ability to purchase cattle feed

CRISIL Equities
KSE Limited
8
The company’s cattle feed business performance has been better in 9MFY10 as the increase in realisations has been higher as compared to the increase in raw materials costs. However, it is important to note that the factors leading to an increase in the prices of key ingredients such as stagnation in foodgrain production and increased emphasis on bio-fuel mandates will continue to put upward pressure on raw material prices. On the other hand, factors such as indirect government control on milk prices and willingness of competition to hold the prices of cattle feed will continue to restrain KSE from increasing its sales realisations in future.
Ice cream business on a growth trajectory KSE started producing ice creams from 2002 and launched its ice-cream brand – ‘VESTA’. The growth of its ice-cream business has been driven by the company’s ability to differentiate the product based on its taste. The company uses cream from milk processed in-house to give its ice-creams the taste of fresh milk cream. Even without incurring high promotional expenditure, the company has been able to increase the sales of its ice-creams over the years. This is evident from the growth in sales volumes witnessed by the ice cream business.
Figure 10: Trend in capacity and sales volume of Ice-creams
business
106%
81%
119%
82%75%
-
100
200
300
400
500
600
700
800
900
FY05 FY06 FY07 FY08 FY09
( Ki lo Lit res)
70%
75%
80%
85%
90%
95%
100%
105%
110%
115%
120%
( %)
Capacity Sales volume Capacity ut ilisat ion (RHS)
Source: Company Reports, CRISIL Equities
Considering the increasing demand for its ice-creams, the company is in the process of doubling its capacity to about 1,500 kilo litres per annum by the end of 2010, from 750 kilo litres in FY09 at an estimated cost of about Rs 10 million. Although the contribution of ice-creams to KSE’s total revenues is very low at about 1%, any increase in revenues from this business would lend upward support to margins as ice-creams business is a higher margins business (EBITDA margin of 10-12 per cent) vis-à-vis cattle feed.
Ice-cream sales have more thandoubled in 4 years to reach 791 kilolitres in FY09
KSE is in the process of doubling itsice-cream producing capacity to 1,500kilo litres per annum
CRISIL Equities
KSE Limited
9
Financial Outlook
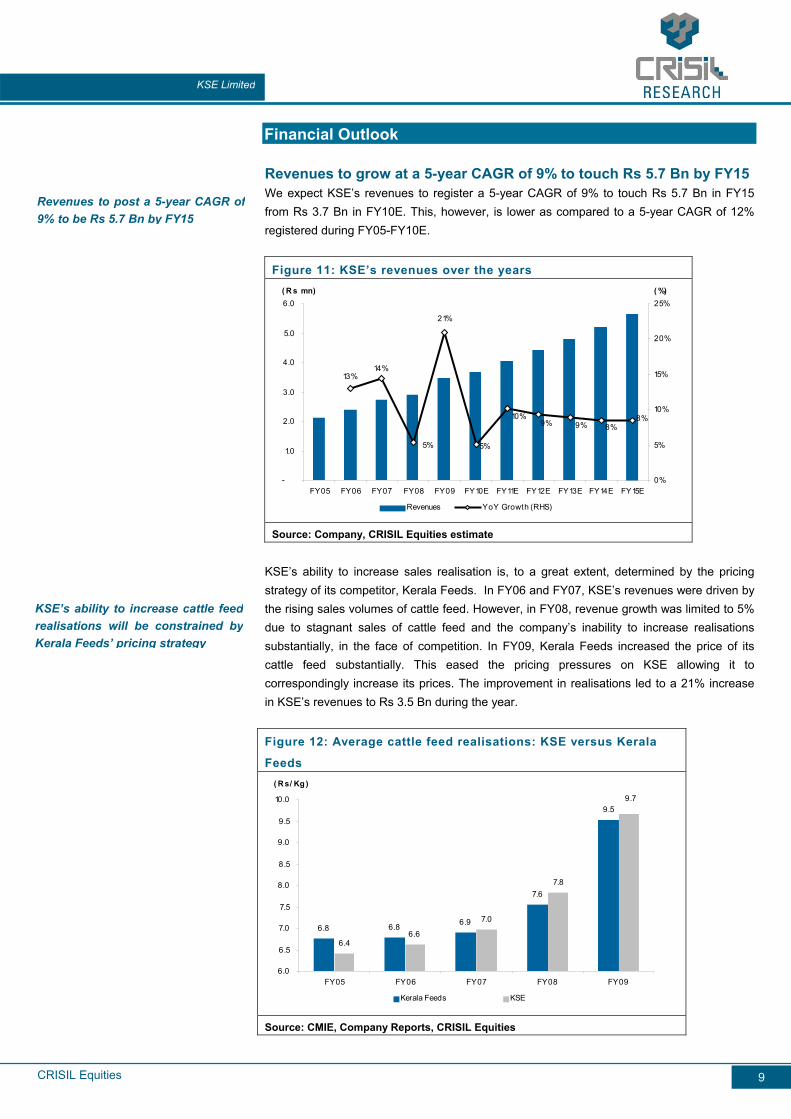
Revenues to grow at a 5-year CAGR of 9% to touch Rs 5.7 Bn by FY15 We expect KSE’s revenues to register a 5-year CAGR of 9% to touch Rs 5.7 Bn in FY15 from Rs 3.7 Bn in FY10E. This, however, is lower as compared to a 5-year CAGR of 12% registered during FY05-FY10E.
Figure 11: KSE’s revenues over the years
8%8%9%9%
10%
5%
21%
5%
14%13%
-
1.0
2.0
3.0
4.0
5.0
6.0
FY05 FY06 FY07 FY08 FY09 FY10E FY11E FY12E FY13E FY14E FY15E
( R s mn)
0%
5%
10%
15%
20%
25%( %)
Revenues YoY Growth (RHS)
Source: Company, CRISIL Equities estimate
KSE’s ability to increase sales realisation is, to a great extent, determined by the pricing strategy of its competitor, Kerala Feeds. In FY06 and FY07, KSE’s revenues were driven by the rising sales volumes of cattle feed. However, in FY08, revenue growth was limited to 5% due to stagnant sales of cattle feed and the company’s inability to increase realisations substantially, in the face of competition. In FY09, Kerala Feeds increased the price of its cattle feed substantially. This eased the pricing pressures on KSE allowing it to correspondingly increase its prices. The improvement in realisations led to a 21% increase in KSE’s revenues to Rs 3.5 Bn during the year.
Figure 12: Average cattle feed realisations: KSE versus Kerala
Feeds
6.8 6.8 6.9
7.6
9.5
6.46.6
7.0
7.8
9.7
6.0
6.5
7.0
7.5
8.0
8.5
9.0
9.5
10.0
FY05 FY06 FY07 FY08 FY09
( R s/ Kg )
Kerala Feeds KSE
Source: CMIE, Company Reports, CRISIL Equities
Revenues to post a 5-year CAGR of 9% to be Rs 5.7 Bn by FY15
KSE’s ability to increase cattle feedrealisations will be constrained byKerala Feeds’ pricing strategy

CRISIL Equities
KSE Limited
10
Going forward, we expect growth in sales volume of KSE to be lower as compared to the growth in volumes seen in the past. Our estimation of future sales takes into consideration the faster growth in sales volumes achieved by Kerala Feeds by holding prices of cattle feed and also its capacity expansion plans.
EBITDA margins to increase to 4.8% in FY10E; decline to 3.7% by FY15 We expect KSE to earn an EBITDA margin of 4.8% in FY10E as compared to 3.3% earned in FY09. However, this is expected to slip to around 3.7% in FY15. PAT margins are expected to increase from 0.9% in FY09 to 2.1% in FY10E, and stabilise at these levels in FY15.
The likely increase in margins for FY10E would be because of higher realisations for KSE’s cattle feed without much increase in raw material cost for the year. The expected reduction in EBITDA margins from FY12 would be because of higher competition from Kerala Feeds which is expanding capacities in FY12. This is most likely to result in a higher proportionate increase in raw material costs for KSE than the selling prices of its cattle feed.
Unlike EBITDA margins, PAT margins are expected to decline only slightly during the FY10 to FY15 period, due to lower interest costs. This is because KSE is expected to pay off a substantial portion of its debt in the absence of any major capital expenditure plans.
Figure 13: KSE’s EBITDA and PAT margins over the years
-0.4%
3.7%4.1%4.4%4.5%
5.0%4.8%
3.3%3.3%
1.2%
5.0%
6.4%
2.0%2.1%2.3%2.2%2.3%2.1%
0.9%0.9%
2.5%3.1%
-1.0%
0.0%
1.0%
2.0%
3.0%
4.0%
5.0%
6.0%
7.0%
FY05 FY06 FY07 FY08 FY09 FY10E FY11E FY12E FY13E FY14E FY15E
( %)
EBITDA margin PAT margin
Source: Company Reports, CRISIL Equities
The reduction in EBITDA margins in FY07 were mainly due to KSE’s inability to pass on an increase in its raw material costs to dairy farmers. KSE’s margins were further compressed by the losses of its dairy division. KSE’s margins improved in FY08 and FY09 as the company was able to increase its cattle feed realisations and also turnaround its dairy business. The increase in cattle feed realisations was possible because of the increase in sales realisations by Kerala Feeds.
Going forward, price-based competition from Kerala Feeds will continue to deter KSE’s prospects to increase its cattle feed realisations. Also, since Kerala Feeds is in the process of expanding capacity from FY12, we believe that it will continue to hold prices low to gain market share.
KSE’s growth in sales volume isexpected to be lower than growthachieved in the past 5 years
EBITDA margins likely to becompressed due to KSE’s inabilityto pass on an increase in rawmaterials costs

CRISIL Equities
KSE Limited
11
PAT margin and RoE to increase in FY10 but decline slightly by FY15 We expect KSE’s PAT margin and RoE to increase in FY10 but decline slightly thereafter. PAT margin is expected to increase from 0.9% in FY09 to 2.1% in FY10 but dip slightly to 2.0% in FY15. RoE is also expected to increase from 11.1% in FY09 to 25.3% in FY10 but dip thereafter to 23.6% in FY15. However, RoCE is expected to continue its uptrend from 17.4% in FY09 to 24.2% in FY10 and further to 31.0% in FY15.
Figure 14: KSE’s RoCE, RoE and PAT margin over the years
2.5%
-0.4%
0.9% 0.9%
2.1%2.3% 2.2% 2.3%
2.1% 2.0%
-10.0%
-5.0%
0.0%
5.0%
10.0%
15.0%
20.0%
25.0%
30.0%
35.0%
FY06 FY07 FY08 FY09 FY10E FY11E FY12E FY13E FY14E FY15E
( %)
-1.0%
-0.5%
0.0%
0.5%
1.0%
1.5%
2.0%
2.5%
3.0%
( %)
RoCE RoE PAT margin (RHS)
Source: Company, CRISIL Equities estimate
Absence of any major capex to keep gearing at low levels We expect gearing to remain quite comfortable, since the company is not expected to resort to debt in the absence of any major capital expansion. KSE plans to fund the expansion of its ice-cream business (estimated capital expenditure of about Rs 10 million) through internal accruals. Thus, we expect the company to utilise its cash accruals to pay off its debts, which will lower its gearing in future. We expect the gearing to reduce from 1.1 times in FY09 to 0.6 times in FY11 and further to 0.1 times in FY15.
Gearing to fall from 1.1 times inFY09 to 0.6 times in FY11 andfurther to 0.1 times in FY15
CRISIL Equities
KSE Limited
12
Management Overview
CRISIL’s Fundamental Grading methodology includes a broad assessment of management quality, apart from other key factors such as industry and business prospects, and financial performance.
Established track record The promoters, Mr. M.C. Paul (CMD) and Mr A.P. George hail from business families renowned for running coconut oil mills. Mr. M.C. Paul has been actively associated with the development of KSE from its inception in 1963. With KSE’s first cattle feed plant being commissioned in 1976, the management now possesses 34 years experience in the cattle feed industry.
Although the oil milling experience of promoters does not have much relevance for the cattle feed industry, the promoters have been able to drive the business with their business acumen. During Mr. M.C. Paul’s tenure as MD since 1994, the business of the company has grown substantially registering steady growth in terms of turnover, profits and reserves. The company has won the National Productivity Award consecutively for eleven years between 1996-97 and 2006-07 for the best productivity performance in the category of Animal Feed Processing Industry.
Over the years, the management has displayed its ability to increase market share and more recently to maintain market share in the face of tough competition from Kerala Feeds – a state government owned company.
Experienced second line of management The board is ably supported by a second line of management that has spent a considerable amount of time with the company. Mr Anand Menon - Chief General Manager has been with KSE since 1977. Currently the President of Cochin Chamber of Commerce, Mr Menon was awarded the Management Excellence Award from Trichur Management Association in 2001. Other key personnel include Dr. George Mathen – Chief Nutritionist (joined KSE in 2002), Mr A.L. Jose – Chief Purchase Manager (joined KSE in 1977) and Mr Cherian V. Vattathara – Chief Marketing Manager (joined KSE in 1999).
The company also has a practice of hiring personnel from the adjoining locality. This practice has worked well for KSE in avoiding employee attrition.
Collective decision-making process KSE follows a process of collective decision making within the organisation. The key second line management personnel along with the board members take important decisions which shape the future course of business.
As a norm, KSE has one board meeting towards the end of each month. A committee of key second line management meets once in a fortnight to review the company’s performance to present it to the board in the board meetings. Proposals, if any, are brought to the board by the committee for discussions. The proposals are accepted or rejected after much debate and deliberations amongst the board members and the key management personnel. Such extensive processes ensure cohesiveness of decision making but may sometimes compromise on the speed of decision making.
Promoters are from businessfamilies renowned for runningcoconut oil mills
Key management personnel havebeen with KSE for a fairly long time

CRISIL Equities
KSE Limited
13
Management to face challenges in scaling up its ice-creams business Although KSE has achieved considerable success in scaling up its cattle feed business over the last three decades, the management was not successful in its milk processing business which the company had ventured into in 2000. After making losses for 8 years, KSE was able to turn around its dairy division in FY08 by significantly scaling down volumes and increasing production of its ice-cream which the company started producing in 2002.
KSE which has so far done well in increasing the sales volume of its ice creams has further plans to scale up capacity. However, ice-creams being a highly competitive business, the ability of the management to successfully increase market share to higher levels would be a challenge.

CRISIL Equities
KSE Limited
14
Corporate Governance
CRISIL’s fundamental grading methodology includes a broad assessment of corporate governance and management quality, apart from other key factors such as industry and business prospects, and financial performance. In this context, CRISIL Research analyses shareholding structure, board composition, typical board processes, disclosure standards and related-party transactions. Any qualifications by regulators or auditors also serve as useful inputs while assessing a company’s corporate governance.
Overall, corporate governance at KSE presents good practices supported by a strong and fairly independent board. Although the current board does not have relevant industry experience, we feel, given their vast experience they would be able to constructively contribute to the board. We feel that company's corporate governance practices are adequate and it meets the minimum required levels.
Board Composition KSE's board comprises of ten members of whom six are independent members. This is in accordance with the stipulated SEBI listing guidelines. Given the background of directors, we believe that the board in place at KSE is fairly diversified.
Board Processes The balance sheet disclosures are sufficient to gauge the involvement of board members in meetings. The company has various committees in place to support corporate governance practices. The company's disclosures are sufficient to analyse various business aspects of the company. CRISIL Equities was assessed from its interactions with independent directors of the company that the quality of agenda papers and the level of debate of discussions at the Board meetings is good. In FY09, all directors except one were able to attend all the twelve board meetings held in that year.
Others We feel that the independent directors are well aware of the business of the company and are fairly engaged in all the major decisions, which reflect well on the company's corporate governance practices. Further, the audit committee is chaired by an independent director and it meets at regular intervals.
KSE’s corporate governancepractices are adequate and meetminimum required standards
KSE’s board comprises tendirectors, of whom six areindependent directors
CRISIL Equities
KSE Limited
15
Key risks
Pricing pressures from competition KSE’s closest competitors are either state-run (Kerala Feeds) or a state-cooperative (Milma), which are essentially non-profit organisations. Kerala Feeds, for example, operates under the government’s guiding principle of making available cattle feed to farmers at lower rates. Therefore, during the FY07 to FY09 period, when there was a steep increase in the cost of raw materials, Kerala Feeds did not pass it on through a corresponding increase in prices. KSE was constrained by this pricing strategy adopted by Kerala Feeds and had to absorb the cost escalation, which exerted pressure on its margins. KSE’s ability to increase cattle feed realisations will therefore continue to be constrained by Kerala Feeds pricing policy.
Increasing raw material prices In the past few years, there has been a steep rise in the prices of cereal by-products, maize, oilseeds and oil cakes. Some of the major factors driving the rise in the prices of these products are stagnating foodgrain production, grains being used for the manufacture of bio-fuels and failure of crops due to droughts. While some of these factors are temporary (failure of crops due to droughts) other factors are not so. As a result, the prices of raw materials are expected to continue their uptrend.
High degree of competition in the ice-cream business KSE ventured into the production and marketing of ice-creams in 2002 and launched its brand, ‘VESTA’. Considering the growth in its ice-creams sales volume, KSE has planned to double its ice-cream production capacity by FY12.
KSE’s competitors in the ice-cream segment are Lazza Ice Creams which is an international brand in the business of ice-creams and the market leader in South India. Other prominent brands in existence in Kerala for over two decades are Amul, Uncle John and Pappai amongst others. Thus, increasingly, KSE will continue to face stiff competition from these players in increasing its market share in ice-creams.
KSE would be constrained inincreasing its cattle feed pricesbecause of competitor’s pricingstrategy

CRISIL Equities
KSE Limited
16
Valuation Grading Grade:3/5
We have valued KSE’s business using the discounted free cash flow to firm method (DCF). Based on the DCF method, the fundamental value of KSE’s business works out to be Rs 200 per share which implies FY11 P/E of 6.8x and FY12 P/E of 6.7x based on an estimated EPS of Rs 29.3 and Rs 29.9, respectively. Accordingly, we initiate our coverage on KSE with a Valuation Grade of ‘3/5’. This grade indicates that the current market price of KSE is ‘Aligned’ with the fundamental price.
The following are the key factors in our valuation: We have considered discounted free cash flows from FY11 to FY15 We have assumed a target debt-equity ratio of 0.1 times We have assumed a terminal growth of 3 per cent after FY15
Given the increasing competition from a state-owned company whose tendency has been to keep cattle feed prices low despite increasing costs, KSE’s financial performance, including its cash flows, are highly vulnerable to its ability to pass on increase in raw material prices to dairy farmers. We are aware of these challenges and remain cautious in our forecasts.
Below is the sensitivity table of Fundamental Value to assumptions of WACC and terminal growth rate:
Table 3: Sensitivity to WACC and terminal growth rate
Sensitivity of PO to WACC and Terminal growth rateTerminal Growth Rate
WACC 1.0% 2.0% 3.0% 4.0% 5.0%
14.2% 211 225 242 263 288
15.2% 193 205 219 236 256
16.2% 179 189 200 214 230
17.2% 166 175 184 196 209
18.2% 155 162 171 180 191
Source: CRISIL Equities estimate
Our Valuation Grade of ‘3/5’indicates that the current marketprice is aligned with theFundamental Value per share

CRISIL Equities
KSE Limited
17
Company Overview
KSE Ltd began operations in 1972 by setting up Kerala’s first solvent extraction plant to extract coconut oil from coconut oil cakes. Subsequently, in 1976 the company set up a plant to manufacture ready mixed cattle feed. In the last three decades, KSE has emerged as a leader in solvent extraction from coconut oil cakes and also the largest cattle feed producer and supplier in Kerala. In 2000, KSE entered the business of procuring, processing and marketing milk and milk products. In 2002, KSE started producing and marketing ice-creams.
Today, KSE Ltd is predominantly a cattle feed producer with about 80% of its revenues in FY09 coming from the sales of cattle feed.
Table 4: KSE’s developments since inception 1972 Company began operations by setting up a 40 MTs per day solvent extraction plant in
Irinjalakuda, Kerala 1976 Company set up a 50 MTs per day ready-mixed cattle feed plant in Irinjalakuda 1979 Production capacity of cattle feed plant in Irinjalakuda increased to 60 MTs per day 1980 Solvent extraction plant capacity in Irinjalakuda increased to 60 MTs per day 1983 A fully automatic new cattle feed plant of 120 MTs per day capacity commissioned in
Irinjalakuda 1984 Solvent extraction plant capacity in Irinjalakuda increased to 80 MTs per day 1987 Production capacity of cattle feed plant in Irinjalakuda increased to 180 MTs per day 1988 A new cattle feed plant of 100 MTs per day capacity commissioned in Swaminathapuram,
Tamilnadu 1989 Solvent extraction plant capacity in Swaminathapuram increased to 100 MTs per day 1990 Production capacity of cattle feed plant in Swaminathapuram increased to 150 MTs per day1996 A new cattle feed plant of 240 MTs per day capacity commissioned in Vedagiri, Kerala 1998 KSE acquired a cattle feed manufacturing unit at Palakkad, Kerala 2000 Company began procuring, processing and marketing milk and milk products 2002 VESTA' ice-cream launched 2003 Started production of cattle feed in a leased plant at Edayar, Kerala 2006 100 MTs per day physical refining plant commissioned 2006 200 MTs per day sovent extraction plant at Koratty commissioned. Solvent plant at
Irinjalakuda dismantled 2008 Ice cream production unit commissioned at Thalayuthu, Tamil Nadu 2009 A new cattle feed plant of 500 MTs per day capacity commissioned in Irinjalakuda Source: Company, CRISIL Equities
Business Overview KSE’s business is divided into three segments – Cattle feed division, oil cake processing division and dairy division.
Cattle Feed KSE’s cattle feed division is engaged in the production and marketing of cattle feed. KSE’s cattle feed is largely made up of de-oiled rice bran cake, maize and de-oiled coconut cake. Some quantities of cottonseeds are added to make a balanced feed mixture. The company produces seven types of cattle feed, three in mash form and four in pellet form:
KSE started its cattle feed plant in1976

CRISIL Equities
KSE Limited
18
Table 5: Cattle feed manufactured by KSE
Mash Pellet
KS Ordinary KS Deluxe
KS Special KS Deluxe Plus
KS Super KS Supreme - Bypass protein feed
KS Premium Plus
Source: Company, CRISIL Equities
KSE is the largest producer and supplier of cattle feed in Kerala. In FY09, KSE had three cattle feed plants operating in Kerala and one in Tamil Nadu. In FY10, KSE has commissioned another plant in Kerala which has almost doubled its production capacity to 354,000 metric tones per annum. Besides, KSE also outsources some of it production.
Table 6: Capacity and location of cattle feed plants of KSE in FY10 ('000 MT per annum)
Location State Existing capacity New capacity Total capacity
Irinjalakuda Kerala 45 175 220
Vedagiri Kerala 72 - 72
Palakkad Kerala 9 - 9
Swaminathapuram Tamil Nadu 53 - 53
Total 179 175 354
Source: Company, CRISIL Equities
Oil Cake Processing KSE’s oil cake processing division extracts coconut oil from coconut oil cakes by using solvent extraction technology. The company operates two solvent extraction plants with a total capacity to process 90 thousand metric tones of coconut oil cake per annum. In FY09, the oil cake processing division contributed 16% to the company’s total revenues.
Table 7: Capacity and location of solvent extraction plants of KSE in FY10
('000 metric tonnes per annum) Location State TotalKoratty Kerala 60Swaminathapuram Tamil Nadu 30Total 90Source: Company, CRISIL Equities
The coconut oil obtained from processing coconut oil cakes is sold in bulk volumes to various industries in Kerala and Tamil Nadu.
The de-oiled coconut cake obtained after extracting oil is purified and used as an ingredient in KSE’s cattle feed. Over the years, the proportion of de-oiled coconut cake consumed internally has increased with increasing production of cattle feed. The proportion of de-oiled coconut oil cake consumed internally has increased from 45% in FY05 to 55% in FY09. The proportion of de-oiled coconut cake consumed internally is expected to increase in line with the increase in KSE’s cattle feed production.
The balance de-oiled cake (after meeting internal requirements) is marketed as Jersy copra cake in Kerala and Tamil Nadu. The protein rich, highly palatable cake has a long shelf life
CRISIL Equities
KSE Limited
19
and is used by dairy farmers as a feed for cattle.
Dairy business KSE’s dairy division is engaged in procuring, processing and marketing milk and milk products. The company’s ice-cream business also falls under this division.
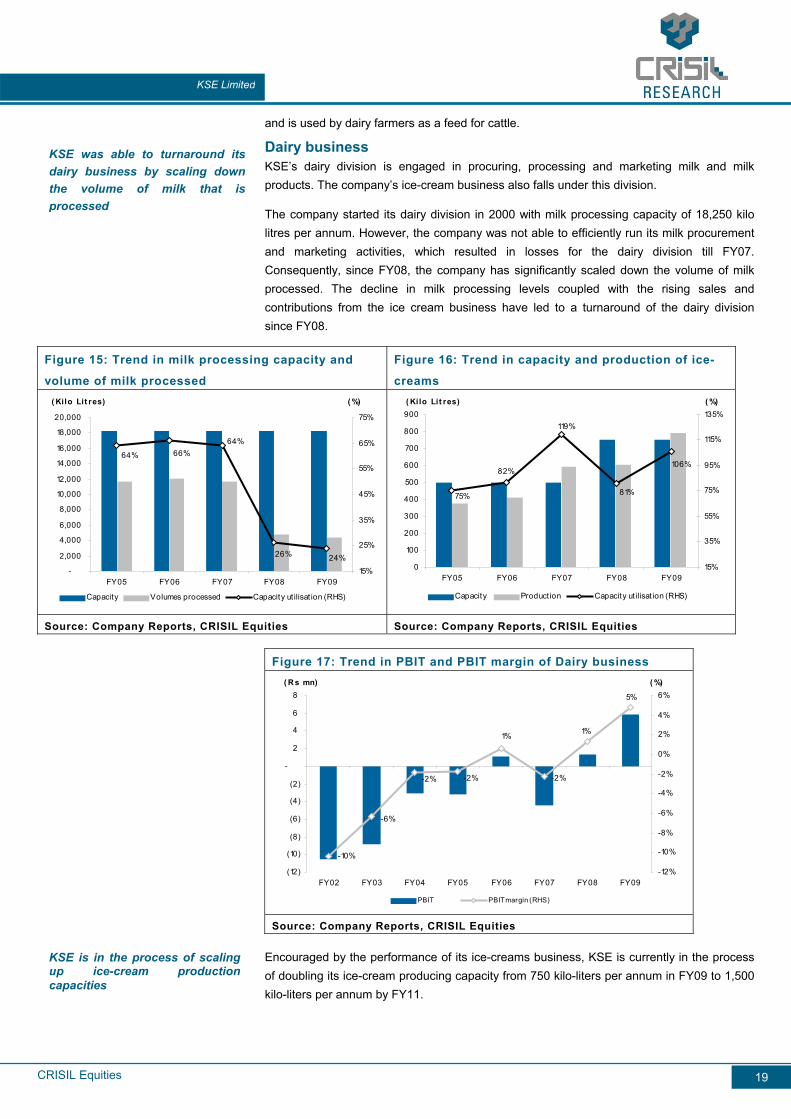
The company started its dairy division in 2000 with milk processing capacity of 18,250 kilo litres per annum. However, the company was not able to efficiently run its milk procurement and marketing activities, which resulted in losses for the dairy division till FY07. Consequently, since FY08, the company has significantly scaled down the volume of milk processed. The decline in milk processing levels coupled with the rising sales and contributions from the ice cream business have led to a turnaround of the dairy division since FY08.
Figure 15: Trend in milk processing capacity and
volume of milk processed
Figure 16: Trend in capacity and production of ice-
creams
24%26%
64%66%64%
-
2,000
4,000
6,000
8,000
10,000
12,000
14,000
16,000
18,000
20,000
FY05 FY06 FY07 FY08 FY09
( Kilo Lit res)
15%
25%
35%
45%
55%
65%
75%
( %)
Capacity Volumes processed Capacity ut ilisat ion (RHS)
106%
81%
119%
82%
75%
0
100
200
300
400
500
600
700
800
900
FY05 FY06 FY07 FY08 FY09
( Kilo Lit res)
15%
35%
55%
75%
95%
115%
135%( %)
Capacity Production Capacity ut ilisat ion (RHS)
Source: Company Reports, CRISIL Equities Source: Company Reports, CRISIL Equities
Figure 17: Trend in PBIT and PBIT margin of Dairy business
-10%
5%
1%
-2%
1%
-2%-2%
-6%
(12)
(10)
(8)
(6)
(4)
(2)
-
2
4
6
8
FY02 FY03 FY04 FY05 FY06 FY07 FY08 FY09
( R s mn)
-12%
-10%
-8%
-6%
-4%
-2%
0%
2%
4%
6%( %)
PBIT PBIT margin (RHS)
Source: Company Reports, CRISIL Equities
Encouraged by the performance of its ice-creams business, KSE is currently in the process of doubling its ice-cream producing capacity from 750 kilo-liters per annum in FY09 to 1,500 kilo-liters per annum by FY11.
KSE was able to turnaround itsdairy business by scaling downthe volume of milk that isprocessed
KSE is in the process of scaling up ice-cream production capacities
CRISIL Equities
KSE Limited
20
Industry Overview
Cattle feed Cattle feed largely consists of oil cakes, maize and cereal by products, mixed in a pre-determined proportion to provide a desired level of nutrition to the cattle. Coarse grains and cottonseed are usually added to make a balanced feed mixture. Other products such as molasses, mango seed kernel, mahowa cake, neem cake, amongst others may also be added to the feed. Intake of cattle feed improves the general health condition of the cattle, which in turn leads to a high yield of good quality milk that is rich in fat, protein and sweetness.
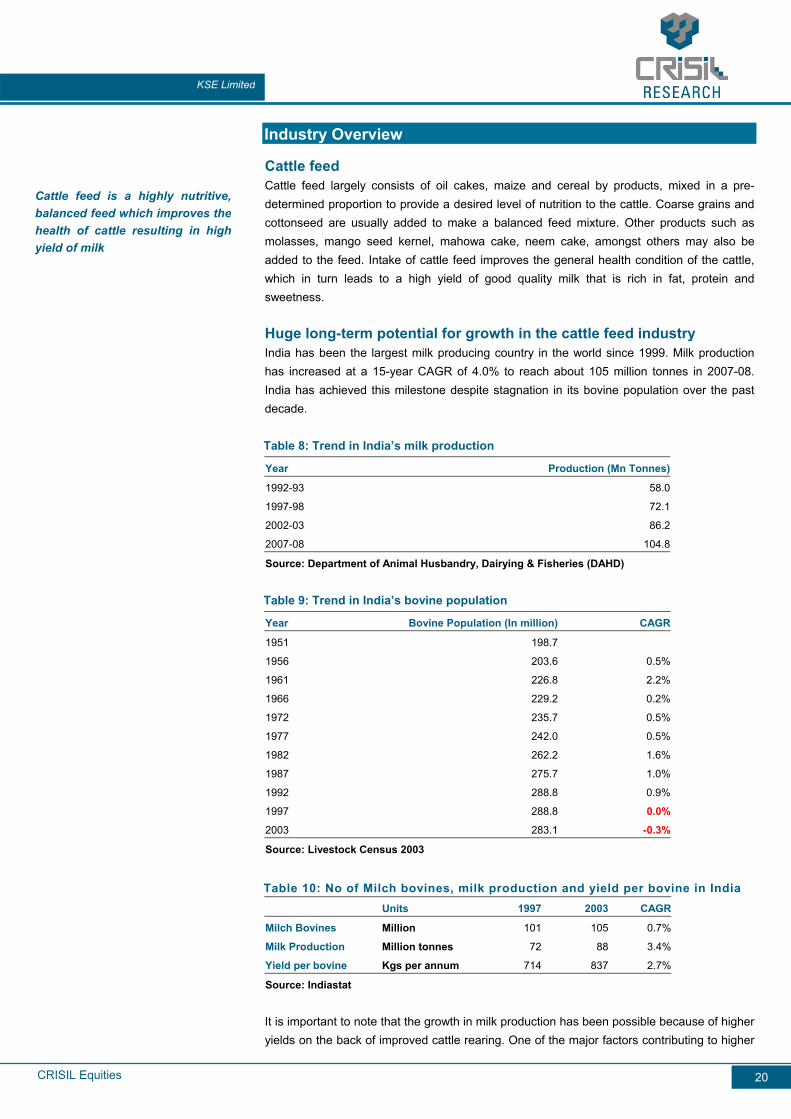
Huge long-term potential for growth in the cattle feed industry India has been the largest milk producing country in the world since 1999. Milk production has increased at a 15-year CAGR of 4.0% to reach about 105 million tonnes in 2007-08. India has achieved this milestone despite stagnation in its bovine population over the past decade.
Table 8: Trend in India’s milk production
Year Production (Mn Tonnes)
1992-93 58.0
1997-98 72.1
2002-03 86.2
2007-08 104.8
Source: Department of Animal Husbandry, Dairying & Fisheries (DAHD)
Table 9: Trend in India’s bovine population
Year Bovine Population (In million) CAGR
1951 198.7
1956 203.6 0.5%
1961 226.8 2.2%
1966 229.2 0.2%
1972 235.7 0.5%
1977 242.0 0.5%
1982 262.2 1.6%
1987 275.7 1.0%
1992 288.8 0.9%
1997 288.8 0.0%
2003 283.1 -0.3%
Source: Livestock Census 2003
Table 10: No of Milch bovines, milk production and yield per bovine in India Units 1997 2003 CAGR
Milch Bovines Million 101 105 0.7%
Milk Production Million tonnes 72 88 3.4%
Yield per bovine Kgs per annum 714 837 2.7%
Source: Indiastat
It is important to note that the growth in milk production has been possible because of higher yields on the back of improved cattle rearing. One of the major factors contributing to higher
Cattle feed is a highly nutritive,balanced feed which improves thehealth of cattle resulting in highyield of milk

CRISIL Equities
KSE Limited
21
yields has been the increased emphasis on balanced nutrition for bovines resulting in increased consumption of cattle feed. However, potential for further increase in cattle feed consumption is much higher in the long term.
Research suggests that about 1 kg of compound cattle feed needs to be fed to a milch bovine for every 2 litres of milk produced. Based on this requirement, the total potential for compound cattle feed in 2008-09 is estimated at 55 million metric tonnes. Against this, the supply of cattle feed was only to the tune of 7 million tonnes. Thus there is a lot of potential for an increase in cattle feed consumption in the long run in order to increase milk production in the country.
Table 11: Cattle feed potential demand and supply in India
Year Milk Production Potential demand
based on ideal
compound cattle
feed consumption
Compound cattle
feed supply
Growth potential
(Mn tonnes) (Mn tonnes) (Mn tonnes) (Mn tonnes)
2008-09 110.0 55.0 7.0 48.0
Source: The Compound Feed Manufacturers Association, CRISIL Equities
The demand for cattle feed would also get an impetus due to the yawning gap in the availability of green and dry fodder in India.
Table 12: Supply and demand of green and dry fodder in India (In Mn MT)
Year Supply Demand Deficit as % of demand Green Dry Green Dry Green Dry2005 390 443 1025 569 62.0 22.12010 395 451 1061 589 62.8 23.52015 401 466 1097 609 63.5 23.62020 406 473 1134 630 64.2 24.82025 411 488 1170 650 64.9 24.9
Source: Kerala Livestock Development Board
Government initiatives for industry growth The compound cattle feed industry is driven by the consumption potential of bovines in the country. The demand of the cattle feed would grow in line with the growth in the number of bovines in India. Various proactive policy and financial measures have been taken up by ‘The Department of Animal Husbandry, Dairying & Fisheries, Ministry of Agriculture, Government of India’ (DAHD) to boost the growth in the livestock sector as a whole. Some of the key measures which are expected to augur well for the growth in cattle include:
Increase in allocation to DAHD from Rs 25 billion in the 10th plan to Rs 82 billion in the 11th plan.
Establishment of Central Cattle Development Organizations in different regions of the country to produce genetically superior breeds of bull calves and storage of good quality frozen semen.
National Project for Cattle & Buffalo Breeding which envisages genetic up-gradation on priority basis and also focuses on the development and conservation of important indigenous breeds.
The cattle feed industry has the potential to grow 8 times itscurrent size based on idealconsumption norms
Government’s initiative toincrease bovine population willaugur well for increased cattlefeed consumption
CRISIL Equities
KSE Limited
22
The efforts of DAHD have led to eradication of some of the fatal diseases in cattle during the 10th plan. Further, as the nutritive value of feed and fodder has a significant bearing on the productivity of livestock, strong emphasis has been given by the DAHD to measures such as high technology breeding, farmer awareness and fodder development amongst others.
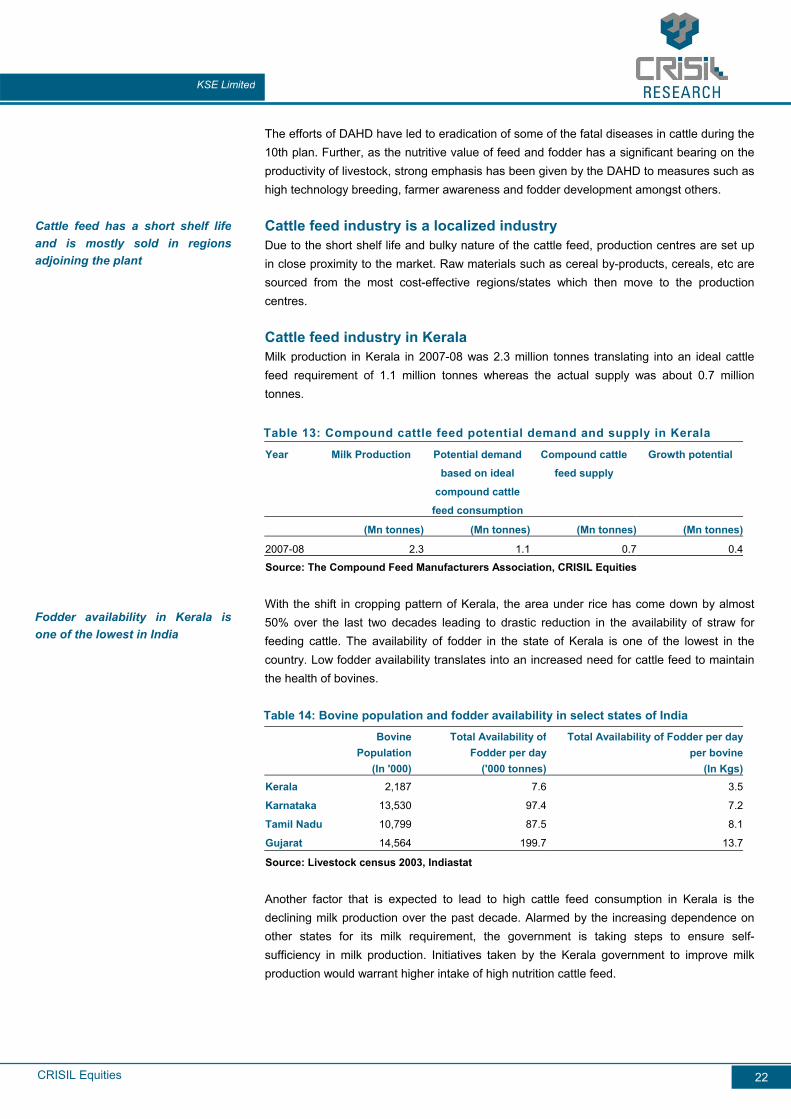
Cattle feed industry is a localized industry Due to the short shelf life and bulky nature of the cattle feed, production centres are set up in close proximity to the market. Raw materials such as cereal by-products, cereals, etc are sourced from the most cost-effective regions/states which then move to the production centres.
Cattle feed industry in Kerala Milk production in Kerala in 2007-08 was 2.3 million tonnes translating into an ideal cattle feed requirement of 1.1 million tonnes whereas the actual supply was about 0.7 million tonnes.
Table 13: Compound cattle feed potential demand and supply in Kerala
Year Milk Production Potential demand
based on ideal
compound cattle
feed consumption
Compound cattle
feed supply
Growth potential
(Mn tonnes) (Mn tonnes) (Mn tonnes) (Mn tonnes)
2007-08 2.3 1.1 0.7 0.4
Source: The Compound Feed Manufacturers Association, CRISIL Equities
With the shift in cropping pattern of Kerala, the area under rice has come down by almost 50% over the last two decades leading to drastic reduction in the availability of straw for feeding cattle. The availability of fodder in the state of Kerala is one of the lowest in the country. Low fodder availability translates into an increased need for cattle feed to maintain the health of bovines.
Table 14: Bovine population and fodder availability in select states of India
Bovine
PopulationTotal Availability of
Fodder per day Total Availability of Fodder per day
per bovine (In '000) ('000 tonnes) (In Kgs)Kerala 2,187 7.6 3.5
Karnataka 13,530 97.4 7.2
Tamil Nadu 10,799 87.5 8.1
Gujarat 14,564 199.7 13.7
Source: Livestock census 2003, Indiastat
Another factor that is expected to lead to high cattle feed consumption in Kerala is the declining milk production over the past decade. Alarmed by the increasing dependence on other states for its milk requirement, the government is taking steps to ensure self-sufficiency in milk production. Initiatives taken by the Kerala government to improve milk production would warrant higher intake of high nutrition cattle feed.
Cattle feed has a short shelf lifeand is mostly sold in regions adjoining the plant
Fodder availability in Kerala isone of the lowest in India
CRISIL Equities
KSE Limited
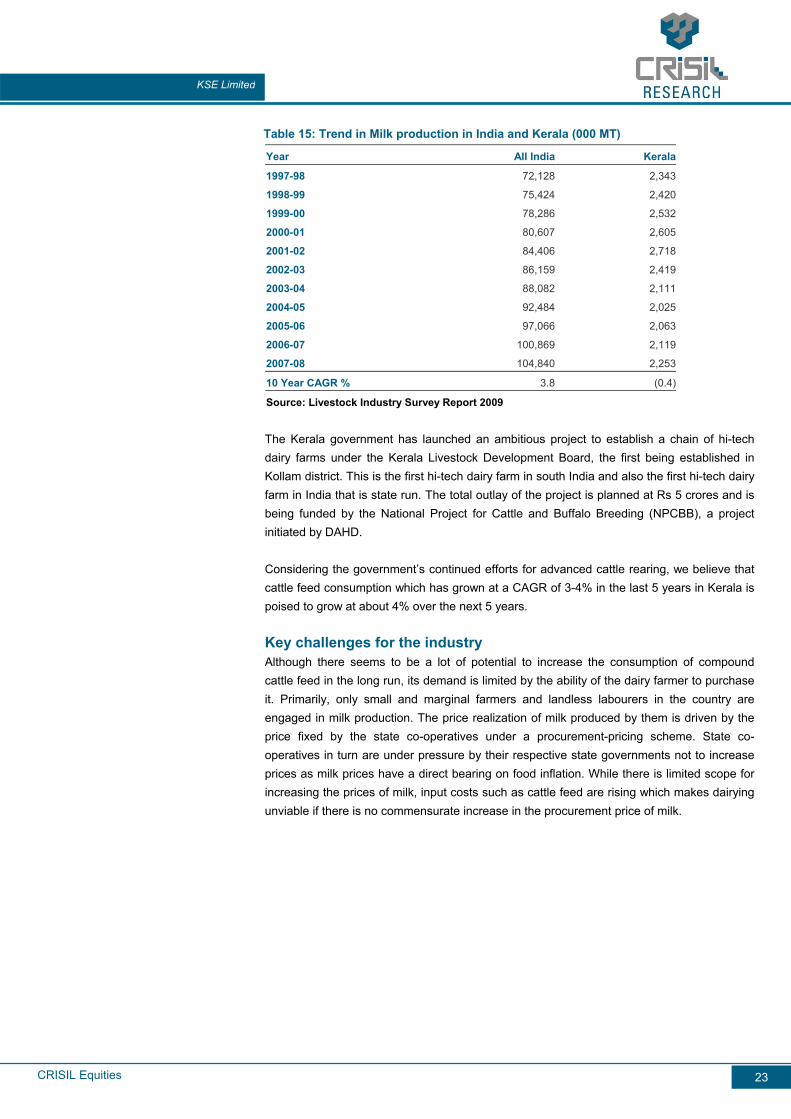
23
Table 15: Trend in Milk production in India and Kerala (000 MT)
Year All India Kerala
1997-98 72,128 2,343
1998-99 75,424 2,420
1999-00 78,286 2,532
2000-01 80,607 2,605
2001-02 84,406 2,718
2002-03 86,159 2,419
2003-04 88,082 2,111
2004-05 92,484 2,025
2005-06 97,066 2,063
2006-07 100,869 2,119
2007-08 104,840 2,253
10 Year CAGR % 3.8 (0.4)
Source: Livestock Industry Survey Report 2009
The Kerala government has launched an ambitious project to establish a chain of hi-tech dairy farms under the Kerala Livestock Development Board, the first being established in Kollam district. This is the first hi-tech dairy farm in south India and also the first hi-tech dairy farm in India that is state run. The total outlay of the project is planned at Rs 5 crores and is being funded by the National Project for Cattle and Buffalo Breeding (NPCBB), a project initiated by DAHD.
Considering the government’s continued efforts for advanced cattle rearing, we believe that cattle feed consumption which has grown at a CAGR of 3-4% in the last 5 years in Kerala is poised to grow at about 4% over the next 5 years.
Key challenges for the industry Although there seems to be a lot of potential to increase the consumption of compound cattle feed in the long run, its demand is limited by the ability of the dairy farmer to purchase it. Primarily, only small and marginal farmers and landless labourers in the country are engaged in milk production. The price realization of milk produced by them is driven by the price fixed by the state co-operatives under a procurement-pricing scheme. State co-operatives in turn are under pressure by their respective state governments not to increase prices as milk prices have a direct bearing on food inflation. While there is limited scope for increasing the prices of milk, input costs such as cattle feed are rising which makes dairying unviable if there is no commensurate increase in the procurement price of milk.
CRISIL Equities
KSE Limited
24
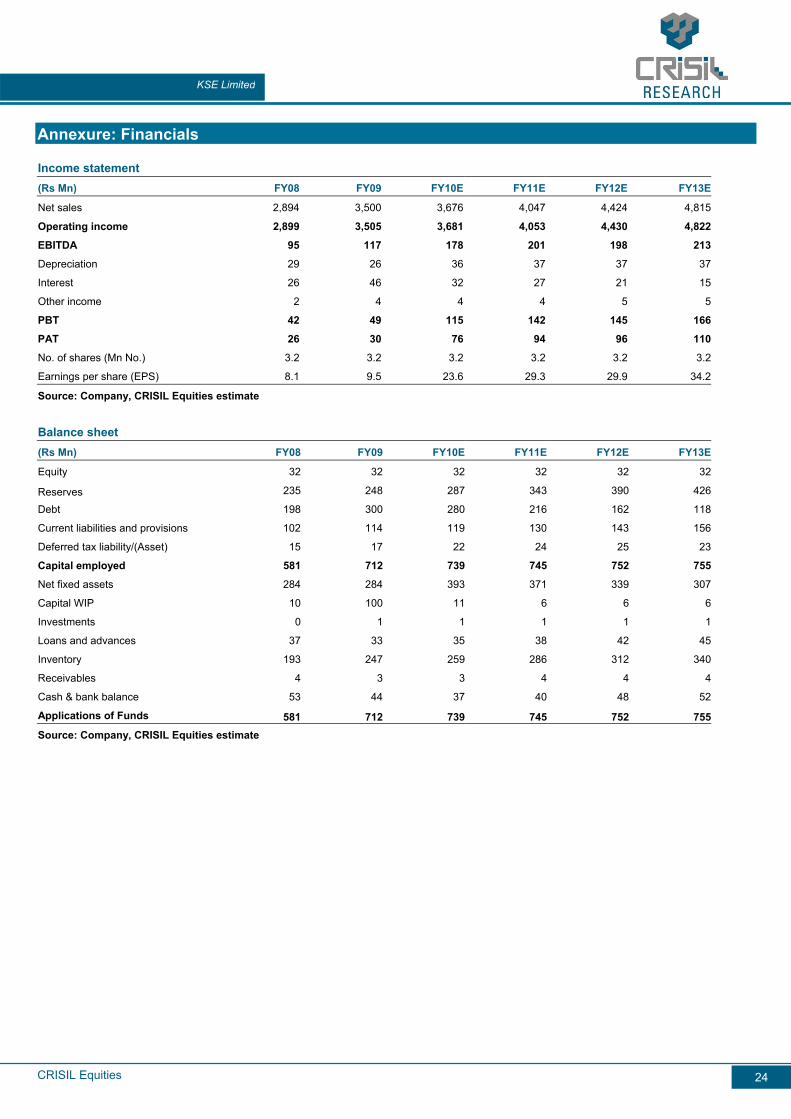
Annexure: Financials Income statement
(Rs Mn) FY08 FY09 FY10E FY11E FY12E FY13E
Net sales 2,894 3,500 3,676 4,047 4,424 4,815
Operating income 2,899 3,505 3,681 4,053 4,430 4,822
EBITDA 95 117 178 201 198 213
Depreciation 29 26 36 37 37 37
Interest 26 46 32 27 21 15
Other income 2 4 4 4 5 5
PBT 42 49 115 142 145 166
PAT 26 30 76 94 96 110
No. of shares (Mn No.) 3.2 3.2 3.2 3.2 3.2 3.2
Earnings per share (EPS) 8.1 9.5 23.6 29.3 29.9 34.2
Source: Company, CRISIL Equities estimate
Balance sheet
(Rs Mn) FY08 FY09 FY10E FY11E FY12E FY13E
Equity 32 32 32 32 32 32
Reserves 235 248 287 343 390 426
Debt 198 300 280 216 162 118
Current liabilities and provisions 102 114 119 130 143 156
Deferred tax liability/(Asset) 15 17 22 24 25 23
Capital employed 581 712 739 745 752 755
Net fixed assets 284 284 393 371 339 307
Capital WIP 10 100 11 6 6 6
Investments 0 1 1 1 1 1
Loans and advances 37 33 35 38 42 45
Inventory 193 247 259 286 312 340
Receivables 4 3 3 4 4 4
Cash & bank balance 53 44 37 40 48 52
Applications of Funds 581 712 739 745 752 755Source: Company, CRISIL Equities estimate
CRISIL Equities
KSE Limited
25
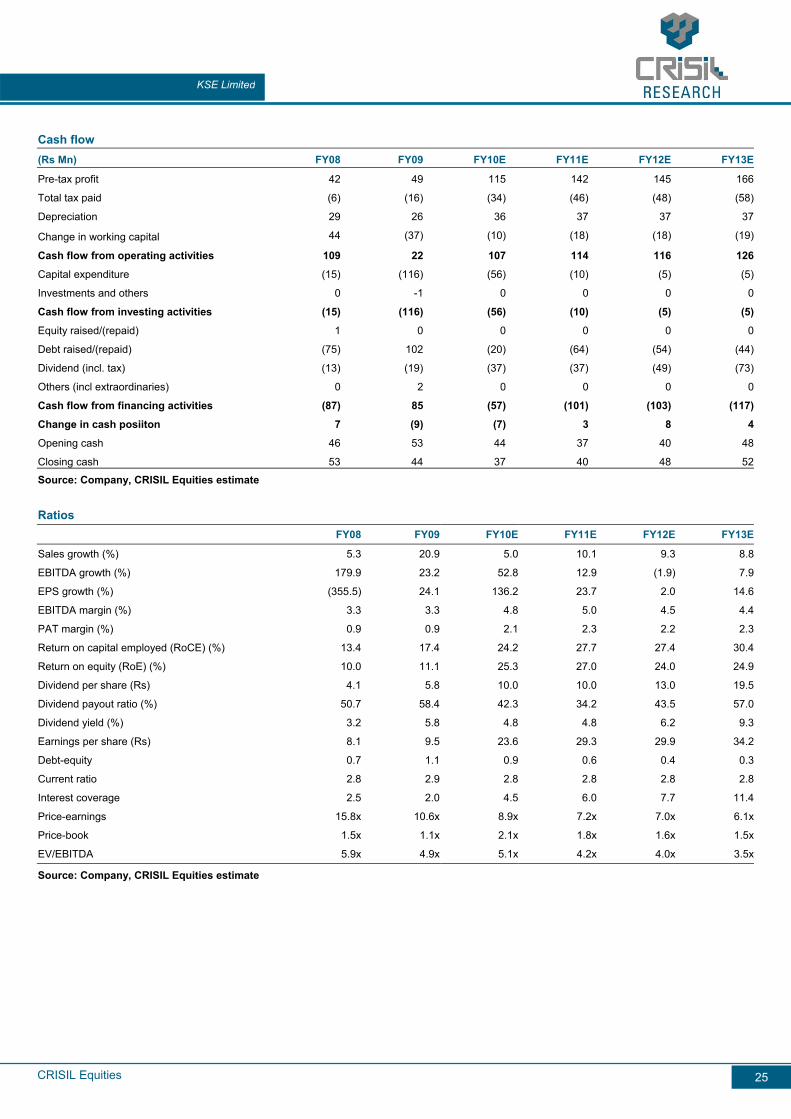
Cash flow
(Rs Mn) FY08 FY09 FY10E FY11E FY12E FY13E
Pre-tax profit 42 49 115 142 145 166
Total tax paid (6) (16) (34) (46) (48) (58)
Depreciation 29 26 36 37 37 37
Change in working capital 44 (37) (10) (18) (18) (19)
Cash flow from operating activities 109 22 107 114 116 126
Capital expenditure (15) (116) (56) (10) (5) (5)
Investments and others 0 -1 0 0 0 0
Cash flow from investing activities (15) (116) (56) (10) (5) (5)
Equity raised/(repaid) 1 0 0 0 0 0
Debt raised/(repaid) (75) 102 (20) (64) (54) (44)
Dividend (incl. tax) (13) (19) (37) (37) (49) (73)
Others (incl extraordinaries) 0 2 0 0 0 0
Cash flow from financing activities (87) 85 (57) (101) (103) (117)
Change in cash posiiton 7 (9) (7) 3 8 4
Opening cash 46 53 44 37 40 48
Closing cash 53 44 37 40 48 52
Source: Company, CRISIL Equities estimate Ratios
FY08 FY09 FY10E FY11E FY12E FY13E
Sales growth (%) 5.3 20.9 5.0 10.1 9.3 8.8
EBITDA growth (%) 179.9 23.2 52.8 12.9 (1.9) 7.9
EPS growth (%) (355.5) 24.1 136.2 23.7 2.0 14.6
EBITDA margin (%) 3.3 3.3 4.8 5.0 4.5 4.4
PAT margin (%) 0.9 0.9 2.1 2.3 2.2 2.3
Return on capital employed (RoCE) (%) 13.4 17.4 24.2 27.7 27.4 30.4
Return on equity (RoE) (%) 10.0 11.1 25.3 27.0 24.0 24.9
Dividend per share (Rs) 4.1 5.8 10.0 10.0 13.0 19.5
Dividend payout ratio (%) 50.7 58.4 42.3 34.2 43.5 57.0
Dividend yield (%) 3.2 5.8 4.8 4.8 6.2 9.3
Earnings per share (Rs) 8.1 9.5 23.6 29.3 29.9 34.2
Debt-equity 0.7 1.1 0.9 0.6 0.4 0.3
Current ratio 2.8 2.9 2.8 2.8 2.8 2.8
Interest coverage 2.5 2.0 4.5 6.0 7.7 11.4
Price-earnings 15.8x 10.6x 8.9x 7.2x 7.0x 6.1x
Price-book 1.5x 1.1x 2.1x 1.8x 1.6x 1.5x
EV/EBITDA 5.9x 4.9x 5.1x 4.2x 4.0x 3.5x
Source: Company, CRISIL Equities estimate
CRISIL Equities
KSE Limited
26
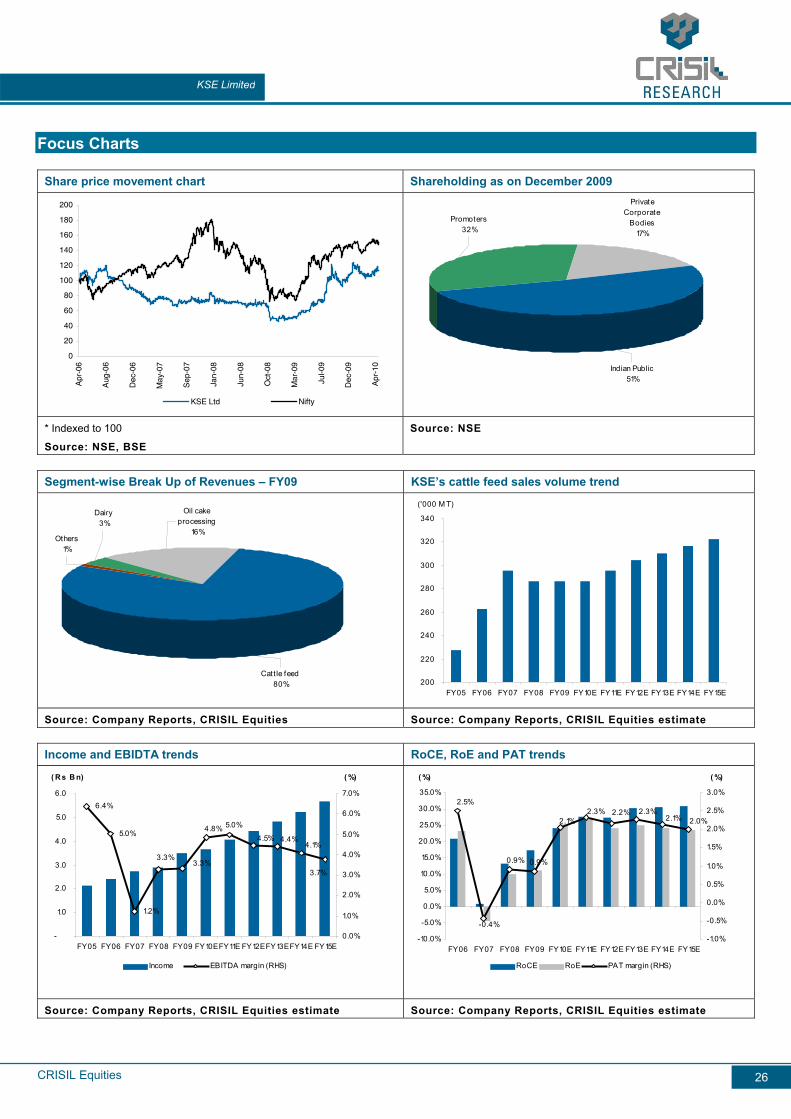
Focus Charts
Share price movement chart Shareholding as on December 2009
0
20
40
60
80
100
120
140
160
180
200
Apr
-06
Aug
-06
Dec
-06
May
-07
Sep
-07
Jan-
08
Jun-
08
Oct
-08
Mar
-09
Jul-0
9
Dec
-09
Apr
-10
KSE Ltd Nifty
Indian Public51%
Private Corporate
Bodies17%
Promoters32%
* Indexed to 100
Source: NSE, BSE
Source: NSE
Segment-wise Break Up of Revenues – FY09 KSE’s cattle feed sales volume trend
Catt le feed80%
Oil cake processing
16%
Dairy3%
Others1%
200
220
240
260
280
300
320
340
FY05 FY06 FY07 FY08 FY09 FY10E FY11E FY12E FY13E FY14E FY15E
('000 M T)
Source: Company Reports, CRISIL Equities Source: Company Reports, CRISIL Equities estimate
Income and EBIDTA trends RoCE, RoE and PAT trends
6.4%
5.0%
1.2%
3.3%3.3%
4.8% 5.0%
4.5% 4.4%4.1%
3.7%
-
1.0
2.0
3.0
4.0
5.0
6.0
FY05 FY06 FY07 FY08 FY09 FY10EFY11E FY12EFY13EFY14E FY15E
( R s B n)
0.0%
1.0%
2.0%
3.0%
4.0%
5.0%
6.0%
7.0%
( %)
Income EBITDA margin (RHS)
2.5%
-0.4%
0.9% 0.9%
2.1%2.3% 2.2% 2.3%
2.1% 2.0%
-10.0%
-5.0%
0.0%
5.0%
10.0%
15.0%
20.0%
25.0%
30.0%
35.0%
FY06 FY07 FY08 FY09 FY10E FY11E FY12E FY13E FY14E FY15E
( %)
-1.0%
-0.5%
0.0%
0.5%
1.0%
1.5%
2.0%
2.5%
3.0%
( %)
RoCE RoE PAT margin (RHS)
Source: Company Reports, CRISIL Equities estimate Source: Company Reports, CRISIL Equities estimate

This page is intentionally left blank
CRISIL Equities
Company Name Limited
5
For further detailsor more information, please contact:
Client ServicingCRISIL Research
CRISIL HouseCentral Avenue
Hiranandani Business ParkPowai, Mumbai - 400 076, India.
Phone +91 (22) 3342 3561/ 62Fax +91 (22) 3342 3501
E-mail: [email protected]: [email protected]
www.ier.co.in
About CRISIL Limited CRISIL is India's leading Ratings, Research, Risk and Policy Advisory Company About CRISIL Research CRISIL Research is India's largest independent, integrated research house. We leverage our unique,integrated research platform and capabilities spanning the entire economy-industry-companyspectrum to deliver superior perspectives and insights to over 600 domestic and global clients,through a range of subscription products and customised solutions.
Mumbai CRISIL House Central Avenue Hiranandani Business Park Powai, Mumbai - 400 076, India. Phone +91 (22) 3342 8026/29/35 Fax +91 (22) 3342 8088
New Delhi The Mira G-1 (FF),1st Floor, Plot No. 1&2 Ishwar Nagar, Near Okhla Crossing New Delhi -110 065, India. Phone +91 (11) 4250 5100, 2693 0117-21 Fax +91 (11) 2684 2212/ 13
Bangaluru W-101, Sunrise Chambers 22, Ulsoor Road Bengaluru - 560 042, India. Phone +91 (80) 4117 0622 Fax +91 (80) 2559 4801
Kolkata ‘Horizon’, Block ‘B’, 4th floor 57 Chowringhee Road Kolkata - 700 071, India. Phone +91 (33) 2283 0595 Fax +91 (33) 2283 0597
Chennai Mezzanine Floor, Thappar House 43 / 44, Montieth Road Egmore Chennai - 600 008, India. Phone +91 (44) 2854 6205/06, 2854 6093 Fax +91 (44) 2854 7531