Embed Size (px)
Citation preview

APPROVED: Weihuan Zhao, Major Professor Vish Prasad, Committee Member Xiaohua Li, Committee Member Sheldon Shi, Committee Member Kuruvilla John, Chair of the Department of
Mechanical and Energy Engineering
Hanchen Huang, Dean of College of Engineering
Victor Prybutok, Dean of the Toulouse Graduate School
INCREASING EFFECTIVE THERMAL RESISTANCE OF BUILDING ENVELOPE’S
INSULATION USING POLYURETHANE FOAM INCORPORATED
WITH PHASE CHANGE MATERIAL
Yassine Houl
Thesis Prepared for the Degree of
MASTER OF SCIENCE
UNIVERSITY OF NORTH TEXAS
May 2019

Houl, Yassine. Increasing Effective Thermal Resistance of Building Envelope’s
Insulation Using Polyurethane Foam Incorporated with Phase Change Material. Master
of Science (Mechanical and Energy Engineering), May 2019, 63 pp., 11 tables, 25
figures, 2 appendices, 25 numbered references.
Incorporating insulation material with phase change materials (PCMs) could help
enhance the insulation capability for further building energy savings by reducing the
HVAC loadings. During the phase change process between the solid and liquid states,
heat is being absorbed or released by PCMs depending on the surrounding
temperature. This research explores the benefits of a polyurethane (PU)-PCM
composite insulation material through infiltrating paraffin wax as PCM into PU open cell
foam. The new PU-PCM composite provides extra shielding from the exterior hot
temperatures for buildings. Through this study, it was demonstrated that PU-PCM
composite insulation could potentially help building energy savings through reducing the
loads on the HVAC systems based on the building energy modeling using EnergyPlus.
The Zero Energy Lab (ZØE) at the University of North Texas was modeled and studied
in the EnergyPlus. It is a detached building with all wall facades exposed to the ambient.
It was determined that the new PU-PCM insulation material could provide 14% total
energy saving per year and reduce the electricity use due to cooling only by around
30%.

ii
Copyright 2019
By
Yassine Houl

iii
ACKNOWLEDGEMENTS
I would like to thank Dr. Weihuan Zhao for her time and efforts to help me learn
and succeed in this research by providing educated suggestions and guidance to
achieve the research goals.
I would also like to thank Dr. Sheldon Shi and Dr. Liping Cai for helping with the
infiltration process for the composite samples at their lab. In addition, I would like to
thank my committee members Dr. Vish Prasad and Dr. Xiaohua Li for their support and
encouragements.
I would like to thank every professor and graduate student I came across during
my journey and helped motivate and encourage me to succeed.
iv
TABLE OF CONTENTS
Page
ACKNOWLEDGEMENTS ............................................................................................... iii
LIST OF TABLES ............................................................................................................vi
LIST OF FIGURES ......................................................................................................... vii
CHAPTER 1. INTRODUCTION ....................................................................................... 1
1.1 Background ................................................................................................ 2
1.2 Motivation .................................................................................................. 5
1.3 Research Goal and Objectives .................................................................. 5
CHAPTER 2. LITERATURE REVIEW ............................................................................. 7
2.1 Types of Foam Insulation ........................................................................... 7
2.2 Difference between PU Foam and Other Insulation Types ........................ 8
2.3 Different Types of PCMs ............................................................................ 9
2.4 PCM Incorporation in Building Envelope.................................................. 12
2.5 PU Foam-PCM Composites ..................................................................... 14
CHAPTER 3. EXPERIMENTAL MEASUREMENTS OF THERMAL PROPERTIES OF PCMs AND PU FOAM - PCM COMPOSITES ............................................................... 16
3.1 Description of Selected PCM ................................................................... 16
3.2 Open Porosity Test of PU Foam .............................................................. 16
3.3 Impregnating the PCM into the Open Cell PU Foam ............................... 18
3.4 Thermal Conductivity Measurement Using Hot Disk Thermal Constant Analyzer ................................................................................................... 20
3.5 Thermal Properties Measurements Using Differential Scanning Calorimetry .............................................................................................. 21
CHAPTER 4. NUMERICAL STUDY OF FOAM INSULATION IMPREGNATED WITH PCM .............................................................................................................................. 24
4.1 Numerical Heat Transfer Model ............................................................... 24
4.2 EnergyPlus Building Simulation ............................................................... 28
CHAPTER 5. RESULTS AND DISCUSSION ................................................................ 31
5.1 Thermal Properties Characterization ....................................................... 31

v
5.1.1 Thermal Conductivities by Hot Disk Thermal Constant Analyzer .. 32
5.1.2 Specific Heat and Latent Heat of Fusion by DSC Measurements . 33
5.2 Heat Transfer Simulation Results ............................................................ 34
5.3 Mixing 1-Dodecanol with Paraffin Wax .................................................... 39
5.4 Building Simulation .................................................................................. 44 CHAPTER 6. CONCLUSION AND FUTURE WORK .................................................... 48
6.1 Conclusion ............................................................................................... 48
6.2 Future Work ............................................................................................. 49 APPENDIX A. MEASUREMENTS................................................................................. 52 APPENDIX B. ENERGYPLUS DATA ............................................................................ 55 REFERENCES .............................................................................................................. 61
vi
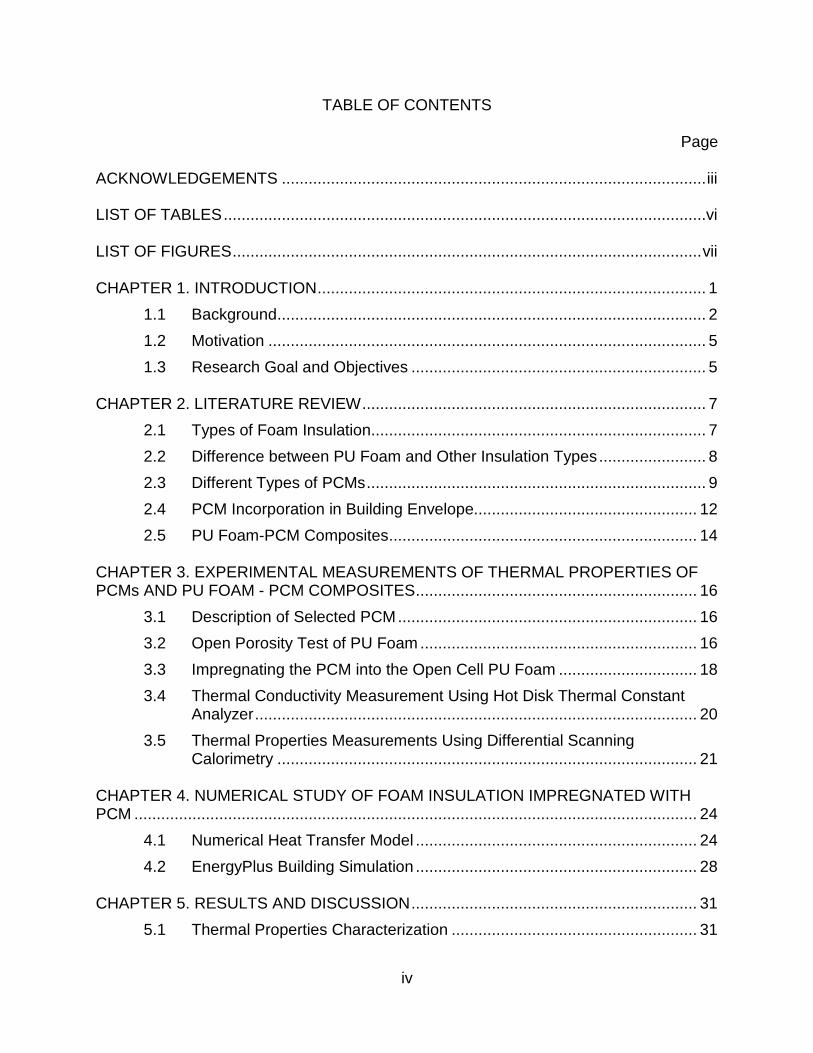
LIST OF TABLES
Page
Table 2.1: Insulation values of different insulation materials per inch. [9] ........................ 8
Table 2.2: Organic compounds that could be used as PCM [12]. ................................. 11
Table 2.3: Inorganic compounds that could be used as PCM [12]. ............................... 11
Table 2.4: Inorganic eutectics that could be used as PCM [12]. .................................... 11
Table 2.5: Fatty acids that could be used as PCM [12]. ................................................ 11
Table 4.1: Exterior Wall layers properties of ZØE lab at UNT ....................................... 29
Table 5.1: Open porosity test results for pure PU foam ................................................. 31
Table 5.2: Measured thermal conductivity for PU foam and PU-PCM composite. ........ 32
Table 5.3: Air Properties to calculate ℎ𝑒𝑒𝑒𝑒𝑒𝑒 and ℎ𝑖𝑖𝑖𝑖 [24]. ............................................... 34
Table 5.4: Heat transfer coefficients and thermophysical properties input in COMSOL simulation. ..................................................................................................................... 35
Table 5.5: Solidus and liquidus temperatures and total latent heat of fusion of each sample measured by DSC. ........................................................................................... 40

vii
LIST OF FIGURES
Page
Figure 1.1: Total energy consumption by different sectors in the United States between 1949 and 2017 [1]. .......................................................................................................... 2
Figure 1.2: Graph showing how thermal energy is stored/released at the phase change step in consideration of temperature over enthalpy [6]. ................................................... 4
Figure 2.1: Graph showing the different types of PCMs and their classes [11] ............... 9
Figure 3.1: (a) Pycnometer (Ultra-Foam 1200e). (b) PU foam piece inside testing chamber of Pycnometer. ............................................................................................... 17
Figure 3.2: Left picture is glass tub with solid paraffin wax. Right picture is Optichem Power controller that heats the glass tub. ..................................................................... 19
Figure 3.3: Left picture is the glass tub with molten paraffin wax PCM and 4 samples held with foil to prevent floating. Right picture is the 4 samples before infiltration. ........ 19
Figure 3.4: (a) Hot Disk Thermal Analyzer. (b) Kapton dynamic sensor (the yellow component). .................................................................................................................. 20
Figure 3.5: (a) Differential Scanning Calorimeter. (b) DSC sample holding chamber. .. 22
Figure 3.6: Graph showing details of DSC machine results for Specific heat of fusion vs Temperature in C̊. ......................................................................................................... 23
Figure 4.1: Heat transfer model for ZOE Lab. ............................................................... 24
Figure 5.1: DSC result of pure paraffin wax. ................................................................. 33
Figure 5.2: COMSOL temperature profiles in pure PU foam insulation (the control group) after 8 hours. ...................................................................................................... 36
Figure 5.3: COMSOL temperature profiles in PU-PCM composite insulation after 4 hours simulation. ........................................................................................................... 36
Figure 5.4: COMSOL temperature profiles in PU-PCM composite insulation after 8 hours simulation. ........................................................................................................... 37
Figure 5.5: Graph showing the fitted curve of effective R-values obtained from COMSOL simulations at 2, 4, 6, and 8 hours. ............................................................................... 38
Figure 5.6: DSC result of Mixture containing 80% wt. paraffin wax and 20% wt. 1-dodecanol (Sample 1). .................................................................................................. 40

viii
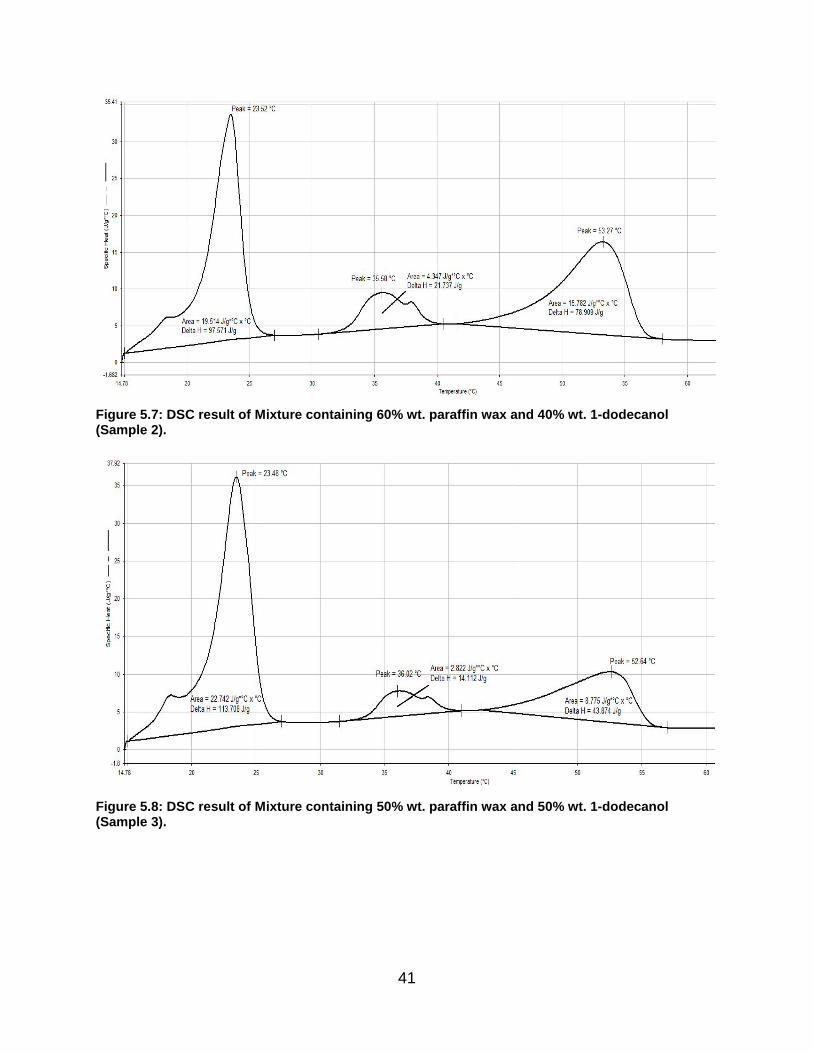
Figure 5.7: DSC result of Mixture containing 60% wt. paraffin wax and 40% wt. 1-dodecanol (Sample 2). .................................................................................................. 41
Figure 5.8: DSC result of Mixture containing 50% wt. paraffin wax and 50% wt. 1-dodecanol (Sample 3). .................................................................................................. 41
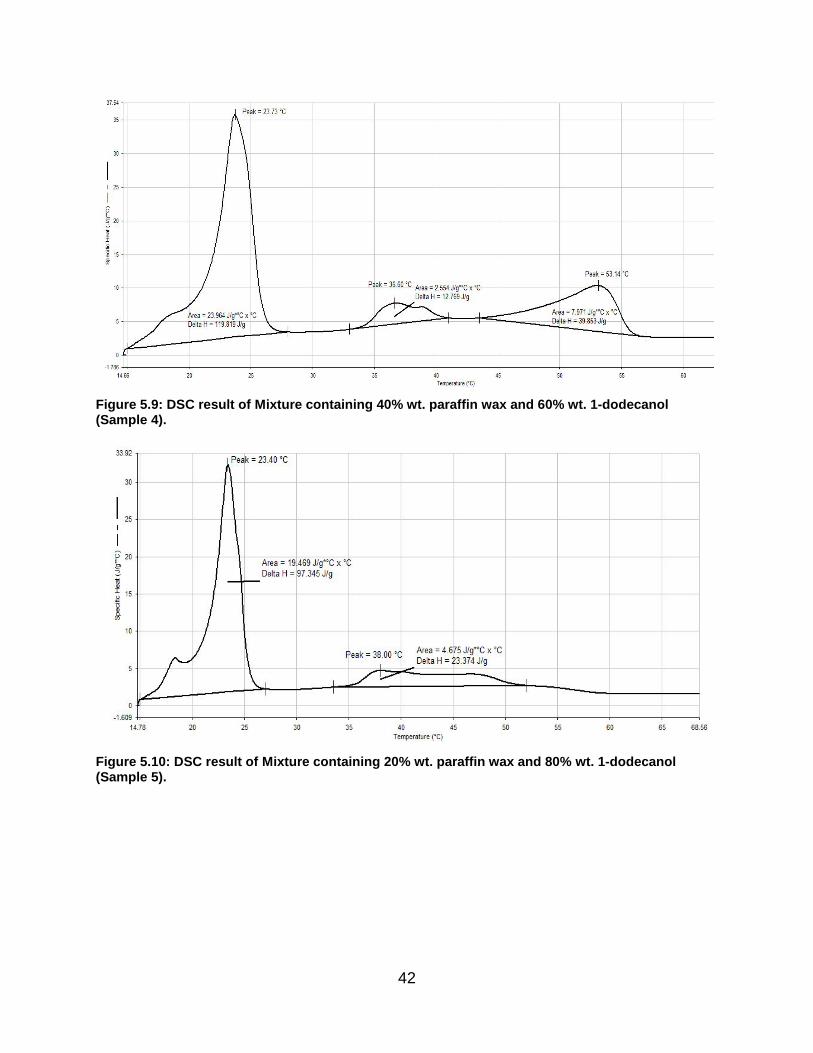
Figure 5.9: DSC result of Mixture containing 40% wt. paraffin wax and 60% wt. 1-dodecanol (Sample 4). .................................................................................................. 42
Figure 5.10: DSC result of Mixture containing 20% wt. paraffin wax and 80% wt. 1-dodecanol (Sample 5). .................................................................................................. 42
Figure 5.11: DSC result of pure 1-dodecanol (Sample 6). ............................................. 43
Figure 5.12: A preliminary “binary” phase change diagram generated using DSC results for paraffin wax and 1-dodecanol mixture. .................................................................... 43
Figure 5.13: Graph shows annually energy consumptions of ZØE lab for different insulation materials........................................................................................................ 44
Figure 5.14: Comparison of annually electricity usage for cooling ZØE lab among the baseline building (use of pure PU foam as insulation), new PU-PCM composite insulation on walls, and using the “effective R-value” for insulation. ............................. 46
Figure 5.15: Comparison of total electricity intensity of ZØE lab for baseline building (use of pure PU foam as insulation), new PU-PCM composite insulation on walls, and using the “effective R-value” for insulation. ................................................................... 47

1
CHAPTER 1
INTRODUCTION
Several factors contribute to the energy consumption caused by residential and
commercial buildings. Buildings convert, store, and transfer energy via heating,
ventilation, and air-conditioning (HVAC). The U.S Energy Information Administration
(EIA) reported that in 2017 the United States energy consumption by residential and
commercial buildings reached 39% which is about 38 quadrillion BTU [1]. The high-
energy consumption due to the ever-increasing demand of comfort desired within a
building envelope. This level of comfort contributes to the continued and increasing
reliance on fossil fuels, which causes harm to the environment with the byproducts
emitted. A way to reduce energy demand in building is to improve the thermal envelope
insulation. Recent advancements in the deployment of insulation has shifted from the
batt or blow in insulation to that of a spray foam variety. Spray foam insulation consists
of two main types that are open cell and closed cell foam insulation. Selection of the
foam depends on the climate zone where the building is located. A more advanced
solution for these building is to implement phase change materials (PCMs) on the
thermal envelope insulation. PCMs would act as a thermal energy storage medium that
helps minimize the amount of heat loss through the exterior walls, ceilings, attics, and
any other wall that separates conditioned spaces from unconditioned spaces. To
advance this field, this study will entail the use of commercially available Polyurethane
(PU) foam insulation with a focus on open cell product. In order to improve thermal
resistance in the building interface, this open cell polyurethane foam product will have
the porous openings impregnated with paraffin wax in order to find an optimized system

2
for improving energy efficiency within an energy efficient building.
1.1 Background
When selecting building materials, variables such as temperature and humidity
are major contributing factors. American Society of Heating, Refrigeration and Air-
conditioning Engineers (ASHRAE) and International Code Council (ICC) considered
standardizing energy codes that require buildings to comply with in order to make them
energy efficient and reduce the greenhouse gas emissions due to their energy
consumption. These organizations constructed a map for the United States to separate
different climate as shown in figure 1.1.
Figure 1.1: Total energy consumption by different sectors in the United States between 1949 and 2017 [1]. Each climate zone has different requirements for building components such as thermal
envelope insulation R-value, glazing U-factor and Solar Heat Gain Coefficient (SHGC),
efficiency of HVAC equipment, and any other system that uses energy within a building
[2]. Resources that are deployed in the modifications of buildings are constructed from
the fossil fuel resources. These resources are diminishing, even as the need for their

3
continued usage approaches critical levels. These trends are seen in the graph in figure
1.1 which shows the growing influence that energy use upon the industrial sector,
transportation, and residential and commercial buildings between 1949 and 2017 in the
United States respectively [1].
Modern buildings rely heavily on the use of electricity and natural gas to heat or
cool buildings using HVAC systems. The growing demand for energy use inside
residential and commercial buildings is leading researchers in engineering to find way to
reduce the energy consumption via the cooling and heating cycles in buildings. Energy
Conservation Measures (ECMs) are techniques that many companies use to help
buildings achieve optimal energy savings. Possible ECMs improvements are making
changes to HVAC systems, upgrading the lighting, implementing of Leadership in
Energy and Environmental Design programs (LEED) or any green building design, or
upgrading the insulation of the building envelope, etc. The focus of this study is
characterizing and optimizing the insulation layer at the thermal envelope of buildings.
Phase change materials (PCMs) are a great addition to the building thermal
envelope to help enhance the thermal insulation. PCMs have been studied and
characterized in the last few decades for their thermal storage capabilities. Researchers
have been interested in the different cases of PCMs soon after World War II where
PCMs were a great heat storage medium for space heating [3]. For thermal envelope
application, PCMs could be a great way to store the latent heat when mixed with various
insulation materials. PCMs provide a large heat capacity over a limited temperature
gradient and they could act like an isothermal reservoir of heat [4]. A simple example of
phase change material would be ice and water, the water solidifies into ice at 0 °C and

4
melts above that temperature. Paraffin wax is the targeted PCM of this research. There
are various types of paraffin with melting range of 4 to 70 °C, which is suitable for
building applications such as thermal envelope insulation. The latent heat thermal
storage (LHTS) method is a great way to store thermal energy because it provides
larger energy storage density with a narrow temperature change [5]. The melting and
solidification properties of the PCMs is a great way to store energy and redistribute it as
required for optimized performance of the material.
Figure 1.2: Graph showing how thermal energy is stored/released at the phase change step in consideration of temperature over enthalpy [6].
Latent heat thermal storage within the PCM occurs in three main stages. The first
stage is the collection of heat inside the PCM. When the temperature around the PCM
reaches its desired melting range, the PCM would store heat as the melting process
takes place. The second stage is the storage of the thermal energy. This step occurs
when the PCM transitions from solid to liquid while conserving energy upon the
transition. The third step is the release of the stored energy that occurs when the
solidification temperature is attained and the excess heat stored now is released to the
Enthalpy
Tem
pera
ture
Thermal energy stored/released by
latent heat of fusion
Phase Change
Solid
Liquid
5
surrounding. The graph in figure 1.2 illustrates these three stages of the latent heat
storage system [6].
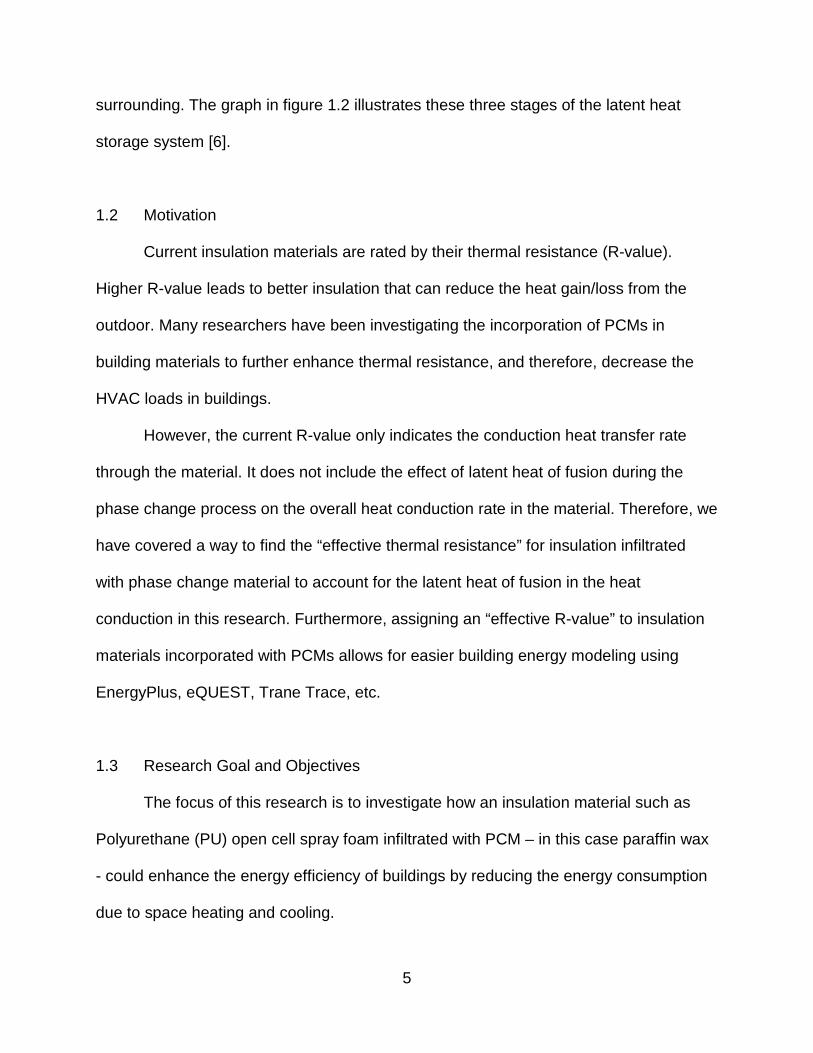
1.2 Motivation
Current insulation materials are rated by their thermal resistance (R-value).
Higher R-value leads to better insulation that can reduce the heat gain/loss from the
outdoor. Many researchers have been investigating the incorporation of PCMs in
building materials to further enhance thermal resistance, and therefore, decrease the
HVAC loads in buildings.
However, the current R-value only indicates the conduction heat transfer rate
through the material. It does not include the effect of latent heat of fusion during the
phase change process on the overall heat conduction rate in the material. Therefore, we
have covered a way to find the “effective thermal resistance” for insulation infiltrated
with phase change material to account for the latent heat of fusion in the heat
conduction in this research. Furthermore, assigning an “effective R-value” to insulation
materials incorporated with PCMs allows for easier building energy modeling using
EnergyPlus, eQUEST, Trane Trace, etc.
1.3 Research Goal and Objectives
The focus of this research is to investigate how an insulation material such as
Polyurethane (PU) open cell spray foam infiltrated with PCM – in this case paraffin wax
- could enhance the energy efficiency of buildings by reducing the energy consumption
due to space heating and cooling.

6
The objectives of this research are as follows:
(1) Study on the heat transfer performance inside the PU-PCM composite.
(2) Develop the “effective R-value” for the PCM-based insulation material according to the thermal performance inside the composite.
(3) conduct the building energy simulations for our unique Zero Energy Lab (ZØE) to investigate the effect of PU-PCM insulation on the HVAC savings though the EnergyPlus software.
7
CHAPTER 2
LITERATURE REVIEW
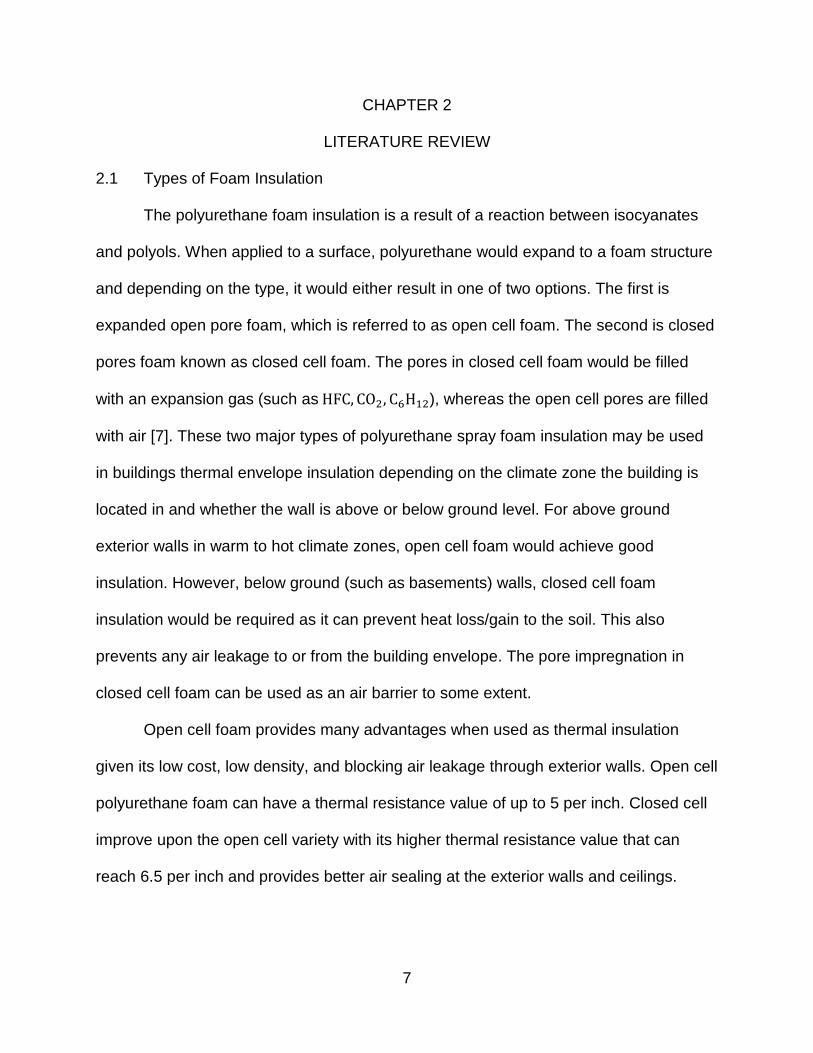
2.1 Types of Foam Insulation
The polyurethane foam insulation is a result of a reaction between isocyanates
and polyols. When applied to a surface, polyurethane would expand to a foam structure
and depending on the type, it would either result in one of two options. The first is
expanded open pore foam, which is referred to as open cell foam. The second is closed
pores foam known as closed cell foam. The pores in closed cell foam would be filled
with an expansion gas (such as HFC, CO2, C6H12), whereas the open cell pores are filled
with air [7]. These two major types of polyurethane spray foam insulation may be used
in buildings thermal envelope insulation depending on the climate zone the building is
located in and whether the wall is above or below ground level. For above ground
exterior walls in warm to hot climate zones, open cell foam would achieve good
insulation. However, below ground (such as basements) walls, closed cell foam
insulation would be required as it can prevent heat loss/gain to the soil. This also
prevents any air leakage to or from the building envelope. The pore impregnation in
closed cell foam can be used as an air barrier to some extent.
Open cell foam provides many advantages when used as thermal insulation
given its low cost, low density, and blocking air leakage through exterior walls. Open cell
polyurethane foam can have a thermal resistance value of up to 5 per inch. Closed cell
improve upon the open cell variety with its higher thermal resistance value that can
reach 6.5 per inch and provides better air sealing at the exterior walls and ceilings.

8
Closed cell PU foam is an excellent insulating material for cold climate zones [8].
However, it is more expensive than open cell PU foam and has more density.
2.2 Difference between PU Foam and Other Insulation Types
Insulation materials are rated by their thermal resistance per inch bases. Open
cell polyurethane foam which is studied in this research has a R-value of 5.6 per inch
and can go up to 6.0 depending on the manufacturer compared to fiberglass batt which
is the most common insulation material currently used has a R-value range of 2.9 – 3.8.
Table 2.1 below gives the rating for different types of insulation that is currently used by
buildings [9].
Table 2.1: Insulation values of different insulation materials per inch. [9]
Aditya et al. [10] gave a thorough review on different insulation materials
currently used in buildings. Insulation materials in buildings are classified depending on
their function and placement. Some insulation materials would serve as conductive heat
reducers such as mass insulation, while others would reduce the amount of radiative
heat through high reflectivity such as radiant barriers. The paper reviews many
insulation materials and their viability in building thermal envelope to reduce heat
Insulation Type: R-Value per Inch:Fiberglass (loose) 2.2 – 2.9Fiberglass (batts) 2.9 – 3.8Cellulose (loose) 3.1 – 3.8Stone Wool (loose) 2.2 – 3.3Stone Wool (batts) 3.3 – 4.2Cotton (batts) 3.0 – 3.7Cementitious (foam) 2.0 – 3.9Polyicynene (foam) 3.6 – 4.3Phenolic (foam) 4.4 – 8.2Polyisocyanurate (foam) 5.6 – 8.0Polyurethane (foam) 5.6 – 8.0

9
losses/gains. The materials that provide adequate insulation for buildings can be in the
form of closed cell foam, vacuum insulation panel, gas filled panel, aerogel, and phase
change material (PCM).
2.3 Different Types of PCMs
Latent heat can occur in materials that have the phase change properties. These
materials can reciprocally transition from gas to liquid, solid to gas, solid to solid, and
solid to liquid. The materials that change from liquid to solid and back to liquid can be
classified as organics, inorganics, or fatty acids, which can be included under organic
mixtures. Figure 2.1 shows the different types of the currently available PCMs [11].
Each of these materials have different thermophysical properties that sets them apart
from each other depending on the application they are used in.
Figure 2.1: Graph showing the different types of PCMs and their classes [11]
Phase Change Materials
Organic Compounds
Paraffin
Fatty Acids
Inorganic Compounds
Salt Hydrates
Metallics
Eutectics
Organic-Organic
Inorganic-Organic
Inorganic-Inorganic

10
Tables 2.2 through 2.5 show thermo-physical properties of different PCMs that
were considered before landing the final choice on paraffin wax [12]. The required
PCMs for applications in thermal insulation in buildings need to have a low temperature
difference between the melting and solidification phases. In addition, the melting
temperature should be in a range from 25 °C to 65 °C in order to get the full benefit of
the latent heat storage process.
Cabeza et al. [12] gave a thorough review on her paper on all types of PCMs that
included thermophysical properties and long term stability of organic, inorganic, fatty
acids, or even eutectics (heterogeneous mixtures of two or more components above)
types. The techniques that are employed to determine thermophysical properties are
differential scanning calorimetry (DSC) and differential thermal analysis (DAT). These
measuring devices provide more accurate data on PCMs structure and functionality
than the manufacturers manual or specification sheets.
Regin et al. [13] mentioned that the latent heat thermal storage system should
have 3 major constituents that are a) the appropriate PCM for the application, b) the
holder of the PCM or “encapsulation of PCM”, and c) heat transfer through the PCM
between two different temperatures. PCMs are organized into 4 different categories that
are organics, inorganics, fatty acids, and commercial PCMs. The focus of the research
paper is primarily on PCMs that have a working temperature range between 25 - 65 ̊C.
An optimized PCM is one that has a high density with a large thermal energy reservoir
that can store latent heat. The values of Volume and energy storage are inversely
proportional when it comes to the overall cost of a project.

11
Table 2.2: Organic compounds that could be used as PCM [12].
Compound Melting temperature (°C) Heat of fusion (kJ/kg) Thermal conductivity
(W/m.K) Density (kg/m3) 1-Dodecanol 26 200 n.a n.a
Paraffins 4.5 - 68 165 - 266 0.148 – 0.167 (liquid) 0.15 – 0.339 (solid)
760 - 830 (liquid) 814 - 930 (solid)
Table 2.3: Inorganic compounds that could be used as PCM [12].
Compound Melting temperature (°C) Heat of fusion (kJ/kg) Thermal conductivity
(W/m.K) Density (kg/m3)
CaCl2 ∙ 6H2O 29 190.8 0.540 (liquid, 38.7 °C) 0.561 (liquid, 61.2 °C) 1.088 (solid, 23 °C)
1562 (liquid, 32 °C) 1802 (solid, 24 °C) 1710 (solid, 25 °C)
Mn(NO3)2 ∙ 6H2O 25.8 125.9 n.a 1795
Table 2.4: Inorganic eutectics that could be used as PCM [12].
Compound Melting temperature (°C) Heat of fusion (kJ/kg) Thermal conductivity
(W/m.K) Density (kg/m3) 66.6% CaCl2 · 6H2O
+33.3% MgCl2 · 6H2O 25 127 n.a 1640
58.7%Mg(NO3) · 6H2O+ 41:3%MgCl2 · 6H2O 59 - 58 132.2 - 132
0.510 (liquid, 65.0 °C) 0.565 (liquid, 85.0 °C) 0.678 (solid, 38.0 °C) 0.678 (solid, 53.0 °C)
1550 (liquid, 50 °C) 1630 (solid, 24 °C)
Table 2.5: Fatty acids that could be used as PCM [12].
Compound Melting temperature (°C) Heat of fusion (kJ/kg) Thermal conductivity
(W/m.K) Density (kg/m3)
Lauric acid 42–44 178 0.147(liquid, 50 °C)
862 (liquid, 60 °C) 870 (liquid, 50 °C) 1007 (solid, 24 °C)
Palmitic acid 64 61 63
185.4 203.4 187
0.162 (liquid, 68.4 °C) 0.159 (liquid, 80.1 °C) 0.165 (liquid, 80 °C)
850 (liquid, 65 °C) 847 (liquid, 80 °C) 989 (solid, 24 °C)

12
Ideally, when the volume of the PCM is lowered and energy storage is increased, the
cost of the design will become cheaper. DSC measurement method was employed to
determine which PCM has the best thermo-physical properties for the desired
application. Regin’s design was a bed that is made of macro-encapsulated PCMs
contained in a vessel and fluid moving through it to provide heat transfer. The increase
of heat transfer in PCM could increase if fins, metal honeycombs, metal fibers, graphite,
etc. are added to the system design.
Ruta Vanaga et al. [14] discussed in a paper the importance of appropriately
selecting the right PCM for each application. There are some physical, chemical,
technical, and economic characteristics to account for when selecting the convenient
PCM. The physical properties mainly deal with temperature range for melting and
solidification and their cycles, the level of latent heat and specific heat (the higher the
better), ideal thermal conductivity that would ensure thermal storage and release, and
insignificant change in volume while changing phases. The chemical properties involves
the stability of the material, PCM should be compatible with other building materials,
and should not deteriorate after numerous melting-solidification cycles. Technical
aspects of the PCM specifically deals with safety such as the PCM should be fire
resistant. Lastly, the PCM should be affordable and recyclable after its end of life.
2.4 PCM Incorporation in Building Envelope
Kosny et al. [15] developed a technical report published by the U.S. department
of Energy at the National Renewable Energy Laboratory that evaluates the
incorporation of PCMs into a wide variety of building thermal insulation materials. The

13
study suggested that the PCM insulation combinations should only be used in southern
U.S. climates or as defined by ASHRAE climate zones 1, 2, and 3. In this paper, the
main insulation materials focused on were fiberglass, cellulose, and polyurethane foam.
The PCM was incorporated in all three types of insulations at about 20% to 25% by
weight. The study used a full-scale laboratory in order to simulate the temperature
profile within a building structure containing PCMs.
According to Soares et al. [16], there are more review articles and research in the
incorporation of PCMs as a solution for buildings to be used as latent heat storage
system. The paper covered many research and publication that deals with the use of
PCMs in buildings. Since buildings are constructed to provide optimum comfort to
occupants all year around, energy usage is mainly due to heating and cooling. Thus,
insulation of these buildings and energy storage can play a major role in reaching
energy savings. The building is described as being a “complex thermodynamic system”
since it is bounded by exterior and interior characteristics which influence the building
thermal envelope.
Ismail et al. [17] ran an experiment on a building’s exterior wall that consisted of
PCM layer embedded between the internal wall layer and the external wall layer. The
PCM used was developed by mixing Peg 1000 and Peg 600 at a 1 to 4 mass ratio. The
results of the study showed that using PCM for exterior walls and roofs as insulation is a
great way to effectively keep indoor temperatures at desired levels while reducing the
use of HVAC systems.
Zhao et al. [18] conducted a research that involve the incorporation of PCMs into
building materials such as wallboards, walls, floors, and ceilings. The direct

14
incorporation methods covered in the research paper included direct incorporation
which is a simple way to apply PCMs on the building materials directly. Another way is
the immersion where the building materials are immersed into the liquid PCM until
absorbed. Micro and Macro encapsulations are also other methods of impregnation of
building materials with PCMs. Through this research paper, it was found that many
techniques could be used to incorporate PCMs into building material while each method
would yield slightly different results. Thus, impregnating building materials with PCMs
results in adding a capacity for latent heat storage that gives building envelopes ability
to store thermal energy through active/passive heating or cooling. The PCMs would
store energy during sunny times of day and release it at night when ambient
temperature is reduced.
2.5 PU Foam-PCM Composites
The application of the PU foam-PCM composite could lead buildings to reduce
their energy demand during peak hours, and therefore, reduce their utility bills and
contribute in energy efficient cities and healthier environment. The composite could
serve as a heat sink or reservoir heat source within the wall cavity in the thermal
envelope by storing or releasing the latent heat as thermal energy, respectively.
Implementation of this composite as insulation would greatly increase the effective
thermal resistance of insulation within exterior walls and roofs and prevent the heat
loss/gain through the building envelope.
Aydin et al. [19] did an experiment on PU-PCM composite where PU was mixed
with PCM using a modified synthesis procedure. The PCM used was Cetiol MM, which

15
has a high latent heat of 201.54 ± 5.46 kJ/Kg and a melting temperature of 40 ̊C. The
mixture was dissolved and added to polyether, polyol, and silicon all mixed with an
overhead stirrer. Once the PU-PCM composite is fabricated, proper measurement on
the sample were performed to provide thermal properties. Several methods of thermal
measurement used included Fourier Transform Infrared Spectroscopy (FT-IR),
Differential Scanning Calorimeter (DSC), and Thermo-Gravimetric Analyzer (TGA),
Optical Microscope Imaging, and Scanning Electron Microscope (SEM). Through these
extensive measurement techniques, it was determined that the PU-PCM composite
sample had increased the thermal energy storage that the PU itself has. The addition of
PCM to PU materials is a great way to increase its capacity as a heat reservoir for
thermal energy storage.
Tinti et al. [20] studied the incorporation of PCM into rigid polyurethane foam for
use in refrigerated transport where it could serve as an enhanced thermal insulation at
the refrigerator thermal envelope. The research helped measure density and thermal
conductivity of the fabricated PU-PCM composite, which was used for comparison
against the theoretical properties. The PCM of choice was n-tetradecane that is a
paraffin-based PCM and has a melting temperature of 6 C̊. The main application for this
product would be to help minimize heat losses/gains when refrigerator is malfunctioning,
incurs frequent door opening/closing, or if it is exposed to the sun for expanded period
of time.

16
CHAPTER 3
EXPERIMENTAL MEASUREMENTS OF THERMAL PROPERTIES OF PCMs AND PU
FOAM - PCM COMPOSITES
3.1 Description of Selected PCM
In this research, we used paraffin wax as PCM provided by Sigma-Aldrich® of
choice to impregnate into PU foam insulation’s open pores. The main reason behind
studying paraffin wax in this research is its wide availability, low cost, suitable thermal
properties, and non-toxicity. Paraffin wax has a perfect temperature range for melting
and solidification, which makes it suitable to be used as insulating material.
Although the PCM of choice for this research was paraffin wax, other PCMs were
considered in order to get a better grasp at what potential different PCMs would have
for improving the thermal resistance in the building envelope insulation.
3.2 Open Porosity Test of PU Foam
During the infiltration of PCM into the rigid PU open cell foam (the density and
specific heat values of PU are obtained from a technical paper [21]), there were some
considerations to start with such as the percent open pores in the foam and the density
of the foam and the PU fibers within the material. Open porosity was performed on 8
samples cut almost equally in shape although they may have insignificant differences in
volume and weight. These samples were measured for density and open porosity using
ULTRAPYC 1200e machine shown in figures 3.1. The machine gives the most accurate
values for density, volume, and open pores in the tested foam sample. It uses helium

17
gas as the testing fluid input through the principle of Archimedes and through gas
displacement under Boyle’s Law.
Figure 3.1: (a) Pycnometer (Ultra-Foam 1200e). (b) PU foam piece inside testing chamber of Pycnometer.
The Ultra Foam feature on the machine was used to measure each of the 8
samples of open cell PU foam that were cut to fit the medium size vessel in the cell
chamber. The theory behind the calculations the machine performs in order to obtain
the desired results and values could be shown through the steps and equations below:
First, the system has to match the ambient pressure by using the ideal gas law
once the helium gas purge occurs through equation 3.1 below (where n is the number of
moles of gas that occupies, 𝑉𝑉𝑐𝑐 which is the volume of sample cell, 𝑃𝑃𝑎𝑎 and 𝑇𝑇𝑎𝑎 is the
ambient pressure and temperature, and 𝑅𝑅 is the gas constant.)
𝑃𝑃𝑎𝑎 𝑉𝑉𝑐𝑐 = 𝑖𝑖 𝑅𝑅 𝑇𝑇𝑎𝑎 (3.1)
(a) (b

18
Then, it uses equation 3.2 to calculate 𝑉𝑉𝑝𝑝 which is the volume of closed pores in the
sample. (𝑃𝑃2 is the pressure above the ambient and 𝑃𝑃3 is the pressure value resulted
when the added volume 𝑉𝑉𝐴𝐴 is connected to the volume of the cell 𝑉𝑉𝑐𝑐.)
𝑉𝑉𝑝𝑝 = 𝑉𝑉𝑐𝑐 + 𝑉𝑉𝐴𝐴1−�𝑃𝑃2𝑃𝑃3
� (3.2)
Equation 3.3 helps calculate the open porosity percentage within the sample. (𝑂𝑂𝑐𝑐 is the
percentage of open pores volume, 𝑉𝑉𝐺𝐺 is the geometric volume of the sample.)
𝑂𝑂𝑐𝑐 = 𝑉𝑉𝐺𝐺−𝑉𝑉𝑝𝑝𝑉𝑉𝐺𝐺
∗ 100 (3.3)
Finally, equation 3.4 is used to calculate the volume of the cell 𝑉𝑉𝑐𝑐 using the calibrated
volume with the appropriate cell size 𝑉𝑉𝑐𝑐𝑎𝑎𝑐𝑐
𝑉𝑉𝑐𝑐 = 𝑉𝑉𝑐𝑐𝑎𝑎𝑐𝑐 + 𝑉𝑉𝐴𝐴�𝑃𝑃2𝑃𝑃1
�−1 (3.4)
3.3 Impregnating the PCM into the Open Cell PU Foam
By using the open porosity test data, we know the potential amount of PCM that
we can infiltrate into a PU foam sample to replace the open pores with the paraffin wax.
A self-diffusion method was used for the infiltration process. First, we heated the
paraffin wax to 100 °C for fast melting in the glass tub. Once it became liquid, we
dropped the samples so they can absorb the melted wax. Paraffin wax in its nature is a
hydrophobic material and due to its low density, the PU samples would tend to flow on
top of the melted paraffin rather than sinking to the bottom of the flask. Therefore, we
gave enough time to make sure the samples were immersed in the molten paraffin wax
in order to have adequate infiltration. The infiltration process was used in a simple way
with no costly tools or material other that the raw materials, the hot bath apparatus, a

19
temperature sensor, and a heating mechanism. Figures 3.2 and 3.3 illustrate the set up
and process used to infiltrate the PU samples with molten paraffin wax PCM. More
efficient infiltration methods, such as pressurizing the molten PCM into porous medium,
etc., will be studied in the future.
Figure 3.2: Left picture is glass tub with solid paraffin wax. Right picture is Optichem Power controller that heats the glass tub.
Figure 3.3: Left picture is the glass tub with molten paraffin wax PCM and 4 samples held with foil to prevent floating. Right picture is the 4 samples before infiltration.

20
3.4 Thermal Conductivity Measurement Using Hot Disk Thermal Constant Analyzer
In order to get accurate thermal conductivity values for the PU foam and the PU
foam – PCM composite, the Hot Disk Thermal Constant Analyzer was used. The setup,
as shown in figure 3.4 (a), is a combination of 3 devices which are the TPS 1500, a
dynamic sensor (Kapton sensor) shown in figure 3.4 (b), and a computer equipped with
the accompanied measurement software. This machine is used to accurately measure
thermal properties of a material such as thermal conductivity and specific heat. The
range of thermal conductivity the machine is able to detect is between 0.01 to 400
W/m·K with a temperature range of -35 ̊C to 200 ̊C. The measurements were achieved
by placing 2 PU-Foam sample in the dynamic sensor in such a way that the yellow
piece is clamped between them. The machine measure thermal conductivity with a
transient plane source technique at different depths between the 2 foams over a period
of time [22]. Through the measurement of the thermal wave that penetrates at different
depths along a transient plane, heat diffusivity and thermal conductivity can be
obtained.
Figure 3.4: (a) Hot Disk Thermal Analyzer. (b) Kapton dynamic sensor (the yellow component).
(a) (b)

21
The calculation of thermal conductivity performed by the Hot Disk Thermal
Constant Analyzer happens through a series of equations that takes in consideration all
thermal properties the sample holds. The following are the governing equations that
helped in measuring the thermal conductivity of the samples:
Equation 3.5 is used to evaluate the thermal conductivity of materials. This heat
diffusion equation includes the internal heat source in the material (where 𝑄𝑄 is the heat
source (provided by the Kapton sensor shown in Figure 3.4), 𝑘𝑘 is the thermal
conductivity, 𝜌𝜌𝑐𝑐𝑝𝑝 is the volumetric heat capacity, 𝑇𝑇 is temperature measured by the
Kapton sensor, and 𝑒𝑒 is time) [22].
𝑘𝑘∇2𝑇𝑇 + 𝑄𝑄 = 𝜌𝜌𝑐𝑐𝑝𝑝𝜕𝜕𝜕𝜕𝜕𝜕𝜕𝜕
(3.5)
Equation 3.6 is used to calculate thermal penetration depth. (Where ∆𝑝𝑝 is the
probing depth, α is the thermal diffusivity (𝛼𝛼 = 𝑘𝑘𝜌𝜌𝑐𝑐𝑝𝑝
), and 𝑒𝑒 is time of the measurement).
Coupling Equations 3.5 and 3.6, it can get the thermal conductivity value, k, of the
measured material.
∆𝑝𝑝= 2 ∙ √𝛼𝛼 ∙ 𝑒𝑒 (3.6)
3.5 Thermal Properties Measurements Using Differential Scanning Calorimetry
In order to get a good understanding of the phase change process that the PU
foam – PCM composite carries, a Differential Scanning Calorimetry (DSC) machine
shown in figure 3.5 was used. DSC works in a way that it puts a sample through
different temperatures so the sample experiences cooling and heating meanwhile data
on the sample’s heat flow, specific heat capacity, and latent heat of fusion is generated
along the set temperature range. The machine requires a 5 mg sample encapsulated in

22
a small metal vessel. The first tests involved an empty vessel and a sapphire sample to
set the heat flow baseline and the heat flow of sapphire. Then, the PCM samples are
tested. The results are retrieved by a combination of the three tests together and the
software calculates automatically the latent heat of fusion and specific heat capacity to
show the melting and solidification exact point of the actual sample. A sample graph
generated by the DSC machine for paraffin wax is shown in figure 3.6 with details. The
machine calculates these values using the following governing equation (where ∆H is
the enthalpy difference, 𝐶𝐶𝑝𝑝 is the specific heat capacity which is the energy required to
change temperature of an object at constant pressure):
∆𝐻𝐻 = ∫𝐶𝐶𝑝𝑝(𝑇𝑇)𝑑𝑑𝑇𝑇 (3.7)
Figure 3.5: (a) Differential Scanning Calorimeter. (b) DSC sample holding chamber.
(a)
(b)

23
Figure 3.6: Graph showing details of DSC machine results for Specific heat of fusion vs Temperature in ̊C.
Peak Melting
Heating
Cooling
Peak

24
CHAPTER 4
NUMERICAL STUDY OF FOAM INSULATION IMPREGNATED WITH PCM
4.1 Numerical Heat Transfer Model
To better understand how the new PU foam-PCM insulation compares to the
regular PU foam insulation, heat transfer problem was analyzed for one of the ZØE lab
building exterior walls as a one-dimensional model, which is 2.44 meters (8 feet) high
and 0.1016 meters (4 inches) thick. We first had to calculate the natural convective heat
transfer coefficient at the exterior and interior surface of the wall. All temperature values
used was based on educated assumptions for a typical warm day in Denton, Texas.
The heat transfer model used is shown below in figure 4.1.
Figure 4.1: Heat transfer model for ZOE Lab.
Numerical simulations using COMSOL Multiphysics heat transfer module were
performed to study the heat transfer performance of the PU-PCM composite insulation.
We assume a 1-dimensional model of the insulation, neglecting the outside construction

25
layers and focusing solely on the insulation material. Furthermore, we also neglect the
natural convection in the molten PCM here because it would be very minor in the
porous medium. The thermal properties of the solid and liquid PCM were considered
the same in the current simulations.
COMSOL uses heat diffusion equations to accurately study the heat distribution
along the 1-dimensional insulation material. The governing equations are expressed in
equations 4.1 and 4.5.
Equation 4.1, which is the heat diffusion equation. (Where, 𝜌𝜌 is the density of PU-
PCM composite, 𝑐𝑐𝑝𝑝 is specific heat capacity of the composite, 𝑘𝑘 is the thermal
conductivity of the composite, 𝑇𝑇 is temperature, and 𝑒𝑒 is the time) [23].
𝜌𝜌𝑐𝑐𝑝𝑝𝜕𝜕𝜕𝜕𝜕𝜕𝜕𝜕
= ∇ ∙ (𝑘𝑘∇𝑇𝑇) (4.1)
For the PU-PCM composite thermal properties, the values required for the
numerical study were calculated based on volume and weight percentages of the
infiltrated sample. The equations used to determine the density, specific heat capacity
and latent heat of fusion of the composite were expressed below:
Here, ρ is the density of the PU-PCM composite, which is expressed in Equation
4.2 below. (Where 𝜌𝜌𝑃𝑃𝑃𝑃 is the density of polyurethane fibers, 𝜌𝜌𝑃𝑃𝑃𝑃𝑃𝑃 is density of PCM, 𝜌𝜌𝑎𝑎𝑎𝑎𝑎𝑎
is density of air, 𝑃𝑃𝑃𝑃𝑃𝑃𝑃𝑃𝑃𝑃% is volume percentage of polyurethane in the sample, 𝐴𝐴𝑖𝑖𝐴𝐴𝑃𝑃𝑃𝑃𝑃𝑃%
is volume of air in the sample, 𝑃𝑃𝐶𝐶𝑃𝑃𝑃𝑃𝑃𝑃𝑃𝑃% is volume of PCM in the sample.)
𝜌𝜌 = 𝜌𝜌𝑃𝑃𝑃𝑃(𝑃𝑃𝑃𝑃𝑃𝑃𝑃𝑃𝑃𝑃%) + 𝜌𝜌𝑃𝑃𝑃𝑃𝑃𝑃(𝐴𝐴𝑖𝑖𝐴𝐴𝑃𝑃𝑃𝑃𝑃𝑃%)(𝑃𝑃𝐶𝐶𝑃𝑃𝑃𝑃𝑃𝑃𝑃𝑃%) +
𝜌𝜌𝑎𝑎𝑎𝑎𝑎𝑎(𝐴𝐴𝑖𝑖𝐴𝐴𝑃𝑃𝑃𝑃𝑃𝑃%)(𝐴𝐴𝑖𝑖𝐴𝐴𝑃𝑃𝑃𝑃𝑃𝑃% − 𝑃𝑃𝐶𝐶𝑃𝑃𝑃𝑃𝑃𝑃𝑃𝑃%) (4.2)
Equation 4.5 was used to get the specific heat capacity of the single phase of the
PU-PCM sample. (Where 𝑐𝑐𝑝𝑝,𝑠𝑠 indicates the specific heat of solid-phase PU-PCM, 𝑐𝑐𝑝𝑝,𝑐𝑐 is

26
the specific heat of liquid phase PU-PCM, 𝑐𝑐𝑝𝑝 𝑃𝑃𝑃𝑃 is the specific heat of polyurethane,
𝑐𝑐𝑝𝑝 𝑃𝑃𝑃𝑃𝑃𝑃 is the specific heat of the PCM, 𝑐𝑐𝑝𝑝 𝐴𝐴𝑎𝑎𝑎𝑎 is the specific heat of air, 𝑃𝑃𝑃𝑃𝑃𝑃𝑒𝑒% is the
weight percentage of polyurethane in the sample, 𝑃𝑃𝐶𝐶𝑃𝑃𝑃𝑃𝑒𝑒% is the weight percentage of
PCM in the sample.)
𝑐𝑐𝑝𝑝 = 𝑐𝑐𝑝𝑝,𝑠𝑠 = 𝑐𝑐𝑝𝑝,𝑐𝑐 = 𝑐𝑐𝑝𝑝 𝑃𝑃𝑃𝑃(𝑃𝑃𝑃𝑃𝑃𝑃𝑒𝑒%) + 𝑐𝑐𝑝𝑝 𝑃𝑃𝑃𝑃𝑃𝑃(𝑃𝑃𝐶𝐶𝑃𝑃𝑃𝑃𝑒𝑒%) +
𝑐𝑐𝑝𝑝 𝐴𝐴𝑎𝑎𝑎𝑎(1− 𝑃𝑃𝑃𝑃𝑃𝑃𝑒𝑒% − 𝑃𝑃𝐶𝐶𝑃𝑃𝑃𝑃𝑒𝑒%) (4.3)
Equation 4.4 was used to determine the latent heat of fusion of PU-PCM sample.
(Where 𝐿𝐿 is the latent heat of fusion of the sample, 𝐿𝐿𝑃𝑃𝑃𝑃𝑃𝑃 is the latent heat of fusion of
the PCM, 𝑃𝑃𝐶𝐶𝑃𝑃𝑃𝑃𝑒𝑒% is the weight percentage of PCM in the material.)
𝐿𝐿 = 𝐿𝐿𝑃𝑃𝑃𝑃𝑃𝑃 ∙ 𝑃𝑃𝐶𝐶𝑃𝑃𝑃𝑃𝑒𝑒% (4.4)
COMSOL uses the equivalent heat capcity method to simulate the phase change
process. It integrates the latent heat of fusion into the overall specific heat of the
material. The software through the following equation 4.5 calculated the effective
specific heat of two-phase material. (Where 𝑐𝑐𝑝𝑝,𝑐𝑐 and 𝑐𝑐𝑝𝑝,𝑠𝑠 are the specific heat capacities
for liquid and solid phase of PU-PCM composite in that order (it is assumed to be the
same in this simulation and calculated by Equation 4.5), 𝐵𝐵(𝑇𝑇) is the liquid fraction, 𝐿𝐿 is
the latent heat of fusion of PU-PCM composite, 𝑑𝑑𝑑𝑑𝑑𝑑𝜕𝜕
is the Gaussian function used to
consider the latent heat) [23].
𝑐𝑐𝑝𝑝 = 𝑐𝑐𝑝𝑝,𝑠𝑠 + �𝑐𝑐𝑝𝑝,𝑐𝑐 − 𝑐𝑐𝑝𝑝,𝑠𝑠�𝐵𝐵(𝑇𝑇) + 𝐿𝐿 𝑑𝑑𝑑𝑑𝑑𝑑𝜕𝜕
(4.5)
The boundary conditions for COMSOL numerical simulation are located at the
internal and external wall surfaces. These conditions are calculated as follow:

27
The interior boundary condition for the interior wall surface is calculated through
equation 4.6 below: (Where 𝑘𝑘 is the thermal conductivity of the composite, 𝜕𝜕𝜕𝜕𝜕𝜕𝜕𝜕
is the
temperature change over thickness, ℎ𝑎𝑎𝑖𝑖 is the convective heat transfer coefficient at the
interior surface of the wall, 𝑇𝑇𝑎𝑎𝑖𝑖𝜕𝜕 is the interior ambient temperature, and 𝑇𝑇 is the wall
surface temperature)
𝑘𝑘 𝜕𝜕𝜕𝜕𝜕𝜕𝜕𝜕
= ℎ𝑎𝑎𝑖𝑖 · (𝑇𝑇𝑎𝑎𝑖𝑖𝜕𝜕 − 𝑇𝑇) (4.6)
Radiation heat transfer coefficient for exterior wall can be calculated in equation
4.7: (where ℎ𝑎𝑎𝑎𝑎𝑑𝑑 is the radiation heat transfer coefficient, 𝜀𝜀 is the emissivity (which is
assumed to be 1 in the simulations), 𝜎𝜎 is the stefan Boltzmann constant (𝜎𝜎 = 5.67 ×
10−8 𝑊𝑊/𝑚𝑚2 ∙ 𝐾𝐾4), 𝑇𝑇𝑠𝑠 is temperature of the surface, 𝑇𝑇𝑠𝑠𝑠𝑠𝑎𝑎 is temperature of the
surrounding) [24].
ℎ𝑎𝑎𝑎𝑎𝑑𝑑 = 𝜀𝜀 ∙ 𝜎𝜎 ∙ (𝑇𝑇𝑠𝑠 + 𝑇𝑇𝑠𝑠𝑠𝑠𝑎𝑎) ∙ (𝑇𝑇𝑠𝑠2 + 𝑇𝑇𝑠𝑠𝑠𝑠𝑎𝑎2 ) (4.7)
Effective convective heat transfer coefficient at exterior wall surface can be
calculated through the following equation 4.8: (where ℎ𝑒𝑒𝑑𝑑𝑑𝑑 is the effective heat transfer
coefficient, ℎ𝑒𝑒𝜕𝜕𝜕𝜕 is the convective heat transfer coefficient at the exterior wall, and ℎ𝑎𝑎𝑎𝑎𝑑𝑑 is
the radiation heat transfer coefficient)
ℎ𝑒𝑒𝑑𝑑𝑑𝑑 = ℎ𝑒𝑒𝜕𝜕𝜕𝜕 + ℎ𝑎𝑎𝑎𝑎𝑑𝑑 (4.8)
The exterior boundary condition for the exterior wall surface is calculated through
equation 4.9 below: (Where 𝑘𝑘 is the thermal conductivity of the composite, ℎ𝑒𝑒𝜕𝜕𝜕𝜕 is the
convective heat transfer coefficient at the exterior surface of the wall, 𝑇𝑇𝑒𝑒𝜕𝜕𝜕𝜕 is the exterior
ambient temperature, and 𝑇𝑇 is the wall surface temperature)
𝑘𝑘 𝜕𝜕𝜕𝜕𝜕𝜕𝜕𝜕
= ℎ𝑒𝑒𝑑𝑑𝑑𝑑 · (𝑇𝑇𝑒𝑒𝜕𝜕𝜕𝜕 − 𝑇𝑇) (4.9)

28
In order to find the convective heat transfer coefficient for exterior and interior
wall surfaces (ℎ𝑎𝑎𝑖𝑖, and ℎ𝑒𝑒𝜕𝜕𝜕𝜕), the following equations (equation 4.10 to 4.12) have been
used.
The Rayleigh number (𝑅𝑅𝑅𝑅𝐿𝐿) is calculated using equation 4.10 (where g is
acceleration due to gravity, 𝛽𝛽 is coefficient of thermal expansion, ∆𝑇𝑇 is the temperature
difference between the surface and ambient, L is the length of the wall, 𝜗𝜗 is kinematic
viscosity, 𝛼𝛼 is thermal diffusivity) [24].
𝑅𝑅𝑅𝑅𝐿𝐿 = 𝑔𝑔 · 𝛽𝛽 · ∆𝜕𝜕 · 𝐿𝐿3
𝜗𝜗·𝛼𝛼 (4.10)
Nusselt number 𝑁𝑁𝑁𝑁����𝐿𝐿 is found through equation 4.11 (where Pr is Prandlt number) [23].
𝑁𝑁𝑁𝑁����𝐿𝐿 = �0.825 + 0.387 · 𝑅𝑅𝑎𝑎𝐿𝐿1/6
�1+(0.492/𝑃𝑃𝑎𝑎)9/16�8/27�2
(4.11)
Then the convective heat transfer coefficient for interior and exterior wall surfaces can
be calculated from equation 4.12 (where k is the thermal conductivity) [24].
ℎ = 𝑁𝑁𝑠𝑠����𝐿𝐿 · 𝑘𝑘𝐿𝐿
(4.12)
The initial condition we assumed for temperature at the insulation was 20 ̊C, which
represents the indoor ambient temperature.
4.2 EnergyPlus Building Simulation
EnergyPlus, an industry recognized energy modeling software, was used in this
research to prove the energy savings potentials of the PU-PCM composite on our
unique ZØE lab. The ZØE lab is a small detached building at the University of North
Texas (UNT) in Denton, Texas, with an area of 1200 square feet with a living space and
work space for research uses. The building has an existing 6 inches of batt insulation at

29
the masonry exterior wall cavities located in the north, east, and west facades; and 4
inches of PU foam insulation located in the structural insulated panels (SIP) at the
exterior walls of the east, north, and west facades and on the roof of the ZØE lab. In this
research, the insulation materials on the walls will be changed from the existing, which
sets the baseline, to the new composite material and run simulations on EnergyPlus to
determine the potential energy savings. The objective of the simulation of the ZØE lab is
to see the effects of the new insulation composite material on the use of HVAC
equipment, specifically cooling and heating equipment, over an entire year and make
conclusion based on the results.
EnergyPlus software was used in this research in order to see the effect the new
insulation that consists of PU foam impregnated with paraffin wax would have. Once
entering all building components and weather data into the software, we generated a
baseline with the ZØE lab that gives detailed results of the energy consumption over a
year period. These results would show energy usage due to cooling, heating, lighting,
pumps, ventilation, and any miscellaneous equipment in place. We narrowed our focus
to cooling, heating, and pumps data since the insulation in the building envelope would
decrease the amount of heat loss/gain through the exterior walls. The properties of the
exterior walls and ceiling used in EnergyPlus illustrated in table 4.2 below that shows
the existing layers for each structure.
Table 4.1: Exterior Wall layers properties of ZØE lab at UNT
SIP Wall Masonry Wall Roof Layer 1 4” SIP 100 mm Brick 4” SIP Layer 2 Air Gap Air Gap Layer 3 5/8” Thick Gypsum Board ½” Thick Sheathing Layer 4 6” Batt Insulation Layer 5 5/8” Thick Gypsum Board

30
EnergyPlus uses the Crank-Nicholson second order scheme to account for
enthalpy-temperature function for the PU-PCM insulation within the walls [25]. The
enthalpy-temperature function accounts for the latent heat of fusion of the material
during the phase change process.

31
CHAPTER 5
RESULTS AND DISCUSSION
5.1 Thermal Properties Characterization
The experimental results were the key component in this research. Through
experiment and measurements, we were able to know the properties of the PU open
cell foam and the potential it holds for being a candidate for impregnation with PCM. It
was found that 99 vol% of PU foam was the open pores occupied by air while only 1
vol% was the polyurethane material based on the measurements by the Ultrapyc
instrument. Table 5.1 shows the measured open porosities of 8 different PU samples.
Moreover, we also used the Ultrapyc to determine the volume percentage of PCM (i.e.,
paraffin wax) in the composite sample, and found that around 19 vol% of the pores was
infiltrated by paraffin wax. Maybe if advanced impregnation methods were used, we
would have achieved a better infiltration rate. We have tried to use needles to infiltrate a
sample from different angles but it was damaging the shape of the sample and it would
require more costly equipment. Although 19% is a humble number, we have decided to
conduct the study with that much infiltration and investigate the results.
Table 5.1: Open porosity test results for pure PU foam
Sample ID Weight (g) Volume(m3) Density (kg/m3) Porosity 1 0.24 14.88 16.13 99.20% 2 0.3 21.39 14.03 99.20% 3 0.26 19.53 13.31 98.90% 4 0.29 19.53 14.85 98.80% 5 0.35 22.6 15.49 98.90% 6 0.32 19.8 16.16 98.70% 7 0.3 19.2 15.63 99.10% 8 0.29 18.2 15.93 98.80%
Average 0.29 19.39 15.19 ± 1.045 99% ± 0.19%

32
In addition to studying paraffin wax another PCM which is 1-dodecanol (provided
by Sigma-Aldrich®) has also been studied. Paraffin wax and 1-Dedocanol were mixed
together to form a compound PCM at different ratios in order to find the best mixture
that could potentially be used to impregnate the PU foam. The two PCMs were first
used as solids, then they were melted and mixed together on a hot plate with a stir bar
for about an hour until the liquid looked homogeneous. The new compounds were left at
the room temperature to solidify.
5.1.1 Thermal Conductivities by Hot Disk Thermal Constant Analyzer
The dimensions of the PU foam and PU-PCM composite samples are:
• Sample # 1 pure PU foam (2.5in x 2.8in x 1in),
• Sample # 2 pure PU foam (2.7in x 2.8in x 0.9in),
• Sample # 3 PU-PCM composite (2.5in x 2.8in x 0.8in).
Hot Disk Thermal Constant Analyzer was used to measure the thermal
conductivity of PU foam samples and PU-PCM composite samples shown in table 5.2
below and an average of each has been used for later calculations.
Table 5.2: Measured thermal conductivity for PU foam and PU-PCM composite.
Sample Type Sample # Probing Depth (mm) Thermal Conductivity (W/m · K)
Pure PU Foam
1
9.20 0.0327 9.24 0.0329 7.10 0.0331 9.17 0.0337 8.78 0.0317 9.07 0.0340
2
9.75 0.0313 10.90 0.0317 10.80 0.0324 10.60 0.0331 10.60 0.0333

33
Sample Type Sample # Probing Depth (mm) Thermal Conductivity (W/m · K) Average Thermal Conductivity 0.0327 ± 0.000864
PU-PCM Composite 3
6.45 0.181 5.14 0.160 3.58 0.126 5.87 0.173 4.52 0.148
Average Thermal Conductivity 0.158 ± 0.0214
5.1.2 Specific Heat and Latent Heat of Fusion by DSC Measurements
Figure 5.1 shows the DSC measurement results for paraffin wax measured
between 15 ̊C and 70 C̊. The first peak represents a phase change from solid to solid.
The second peak is when the PCM is melted at 54.78 ̊C. the melting range is believed
to be between 46 ̊C and 60 C̊.
Figure 5.1: DSC result of pure paraffin wax.
The value of the specific heat can be obtained from the graph when the curve stabilizes
in a horizontal direction and can be approximately between 2.5 to 3.0 J/g∙°C. The

34
specific heat value for solid and liquid states are in same range since after melting the
curve goes back to the same range. The latent heat of the PCM was calculated by the
DSC and displayed on the graph. In this case, the total latent heat value is around
146.87 J/g, the summation of the 2 latent heat values from the 2 transition peaks.
5.2 Heat Transfer Simulation Results
Through the numerical study, convective heat transfer for interior and exterior
wall surfaces were obtained through Equation 4.9 to input in the COMSOL model. We
assumed the exterior ambient temperature to be 35 C̊ (average summer temperature in
the Dallas-Fort Worth area) and indoor ambient temperature 20 ̊C. The heat transfer
coefficients for indoor and exterior ambient are calculated based on the average surface
and ambient temperature values (𝑇𝑇𝑑𝑑 = 𝜕𝜕𝑠𝑠 + 𝜕𝜕∞2
) using Equations 4.6 to 4.9 [24]. Table 5.3
demonstrates the values obtained through the calculations.
Table 5.3: Air Properties to calculate ℎ𝑒𝑒𝜕𝜕𝜕𝜕 and ℎ𝑎𝑎𝑖𝑖 [24].
Interior Exterior Average Temperature: 𝑇𝑇𝑑𝑑 (K) 300 305.65 Thermal Conductivity: k (w/m.K) 26.3 × 10⁻³ 26.7 × 10⁻³ Kinematic Viscosity: 𝜗𝜗 (𝑚𝑚2/𝑠𝑠) 15.89 × 10⁻⁶ 16.41 × 10⁻⁶ Thermal Diffusivity: 𝛼𝛼 (𝑚𝑚2/𝑠𝑠) 22.5 × 10⁻³ 23.3 × 10⁻³ Prandtl Number: 𝑃𝑃𝐴𝐴 0.707 0.706 Coefficient of thermal expansion: 𝛽𝛽 (𝐾𝐾−1) 3.33 × 10⁻³ 3.27 × 10⁻³
Table 5.4 shows the calculated values for the heat transfer coefficients and
thermal properties of the insulation through the Equations explained in Chapter 4. A
baseline was created with the wall structure that has pure open cell PU foam filling the
cavities. Then, the thermal properties data were modified according to the new PU foam
– PCM composite insulation material.

35
Table 5.4: Heat transfer coefficients and thermophysical properties input in COMSOL simulation.
COMSOL Calculated Input Values
Existing Insulation without PCM (pure PU
foam) Insulation of PU-PCM
Composite Convective Heat Transfer Coefficient at Interior Wall 2.36 𝑊𝑊/(𝑚𝑚2 · 𝐾𝐾) 2.36 𝑊𝑊/(𝑚𝑚2 · 𝐾𝐾)
Effective Heat Transfer Coefficient at Exterior Wall 8.84 𝑊𝑊/(𝑚𝑚2 · 𝐾𝐾) 8.84 𝑊𝑊/(𝑚𝑚2 · 𝐾𝐾)
Thermal Conductivity 0.03 𝑊𝑊/(𝑚𝑚 · 𝐾𝐾) 0.16 𝑊𝑊/(𝑚𝑚 · 𝐾𝐾) Density 30 𝐾𝐾𝑔𝑔/𝑚𝑚3 183.9 𝐾𝐾𝑔𝑔/𝑚𝑚3
Specific Heat Capacity 1500 𝑘𝑘𝑘𝑘/(𝐾𝐾𝑔𝑔 · 𝐾𝐾) 2778 𝑘𝑘𝑘𝑘/(𝐾𝐾𝑔𝑔 · 𝐾𝐾) Latent Heat of Fusion --- 138.6 𝑘𝑘𝑘𝑘/𝐾𝐾𝑔𝑔 Melting temperature* --- 25 °C
* Estimated based on the building thermal control application The simulation of heat transfer through the 1-demonsional wall model with pure
PU foam as insulation (the control group) was presented in figure 5.2 for 8 hours of
daytime heat from the exterior ambient. Figures 5.3 and 5.4 are temperature profiles of
PU-PCM insulation after 4 hours and 8 hours of daytime heat from the exterior ambient,
respectively. We observed that the exterior temperature of PU-PCM insulation was
lower than that of the pure PU foam. Nevertheless, we are more interested in the
temperature at the interior wall because it is directly related to the HVAC savings.
Therefore, we are comparing the interior wall temperature between the control group
and the PU-PCM composite wall. It was found that the interior wall temperature reached
21.8 ̊C when it becomes steady state for pure PU foam. After that, we conducted the
simulations for the PU-PCM wall. It was found that the interior wall temperature was
about 21 C̊ after 4 hours daytime heating by the external environment temperature.

36
Figure 5.2: COMSOL temperature profiles in pure PU foam insulation (the control group) after 8 hours.
Figure 5.3: COMSOL temperature profiles in PU-PCM composite insulation after 4 hours simulation.

37
Figure 5.4: COMSOL temperature profiles in PU-PCM composite insulation after 8 hours simulation.
Once the COMSOL simulations were done for the PU-PCM composite, we took
another run for the pure PU foam model and reduced the thermal conductivity gradually
until the interior wall temperature matched that of the PU-PCM composite. Thus, the
new thermal conductivity used in the PU foam was considered as the “effective thermal
conductivity” of the PU-PCM when temperatures of interior wall match. The above
process was repeated at 2 hours, 4 hours, 6 hours, and 8 hours. This was useful in
order to have a better grasp at how the PU-PCM composite handles heat throughout 8
hours of sunny daytime.
Through the “effective thermal conductivity” value, we can calculate the “effective
thermal resistance” (effective R-value per inch) for the new PU-PCM insulation material
to account for the effect of phase change. First, the effective thermal conductivity is
converted to English Units (𝐵𝐵𝑒𝑒𝑁𝑁 ∙ 𝑖𝑖𝑖𝑖/ℎ𝐴𝐴 ∙ 𝑓𝑓𝑒𝑒2 ∙ ℉), and then inversed to yield an R-value
per inch thickness. The control group (i.e., pure PU foam) has the R-value of 4.4. The

38
PU-PCM “effective R-value” cannot be quantified as one value for the entire day.
Through the graph in figure 5.5, a polynomial equation was generated based on the 4
simulations. The effectiveness of the PCM material is rated by its “effective R-value”
under exposure of temperature at 35 Celsius (the same operating condition as the
control group) for a given exposure time. The “effective R-value” of PU-PCM composite
was about 12.88 after two-hour heating, almost 3-fold increase compared to the control
group. The studied PU-PCM composite had an approximate 33% decrease in its R-
value every 2-hour increment (the “effective R-value” drops from 12.88 to 4.80 after
eight-hour heating). After 8 hours of exposure, the impregnated PU was still 9% more
effective than the control group sample (pure PU foam). The overall average of the 8-
hour study yielded an average “effective R-value” of 8.18 for the impregnated PU.
Therefore, it demonstrated that the latent heat could improve the insulation
performance. Nevertheless, several parameters could affect the “effective R-value” of
the PCM-based insulation, such as the percentage of molten PCM in the composite,
thermal properties of the composite, etc.
Figure 5.5: Graph showing the fitted curve of effective R-values obtained from COMSOL simulations at 2, 4, 6, and 8 hours.
12.88
8.85
6.22
4.80
R(t) = 0.1633 t2 - 2.9758 t + 18.167
4.00
5.00
6.00
7.00
8.00
9.00
10.00
11.00
12.00
13.00
2 3 4 5 6 7 8 9
Effe
ctiv
e R-
Valu
e
Time (hours)

39
5.3 Mixing 1-Dodecanol with Paraffin Wax
Hence, we investigated the mixture of two PCMs to make the melting range
larger. Various weight percentage of paraffin wax and 1-dodecanol were mixed to obtain
the PCM composites in order to achieve a wider melting/solidification temperature range
for long-term benefit from the phase change process. Six samples with different weight
percentage of the two PCMs were displayed in Table 5.5.
Table 5.5 Weight percentage of paraffin wax and 1-dodecanol 6 different samples.
Sample No. Paraffin Wax (wt. %) 1-Dodecanol (wt. %)
Sample 1 80 20
Sample 2 60 40
Sample 3 50 50
Sample 4 40 60
Sample 5 20 80
Sample 6 0 100
The DSC measurements of all samples can be seen in the graphs below from
figure 5.6 to figure 5.10 with different ratio of mixtures of paraffin wax and 1-dodecanol.
The sample that has 80% wt. paraffin wax and 20% wt. 1-dodecanol showed a first
peak at 22.61 °C for the melting phase of 1-dodecanol, a second peak of 34.87 °C for
the solid phase transition of paraffin wax, and a third peak of melting the paraffin wax.
The latent heat of this mixture is around 140.16 J/g. Table 5.6 below summarizes the
solidus and liquidus temperatures as well as the latent heat value for each mixture.
Through analyzing these mixtures, we were able to determine the optimal weight ratio of
the 2 PCMs compounded into one composite for our building application. Ideally, we

40
want to get a higher latent heat of fusion with a wider range of temperature at the phase
change process. Thus, it would be possible to use samples 2-4 to get the full benefit of
the larger range of phase change process and high latent heat of fusion values.
Table 5.5: Solidus and liquidus temperatures and total latent heat of fusion of each sample measured by DSC.
Sample No.
Solidus Temperature of Mixtures ( ̊C)
Liquidus Temperature of Mixtures ( ̊C)
Latent Heat of Fusion in the Sample (J/g)
Sample 1 22.61 53.35 140.161 Sample 2 23.52 53.27 198.217 Sample 3 23.48 52.64 171.694 Sample 4 23.73 53.14 172.441 Sample 5 23.40 38.00 120.719 Sample 6 26.00 n.a. 212.106
Figure 5.6: DSC result of Mixture containing 80% wt. paraffin wax and 20% wt. 1-dodecanol (Sample 1).
41
Figure 5.7: DSC result of Mixture containing 60% wt. paraffin wax and 40% wt. 1-dodecanol (Sample 2).
Figure 5.8: DSC result of Mixture containing 50% wt. paraffin wax and 50% wt. 1-dodecanol (Sample 3).
42
Figure 5.9: DSC result of Mixture containing 40% wt. paraffin wax and 60% wt. 1-dodecanol (Sample 4).
Figure 5.10: DSC result of Mixture containing 20% wt. paraffin wax and 80% wt. 1-dodecanol (Sample 5).

43
Figure 5.11: DSC result of pure 1-dodecanol (Sample 6).
A preliminary phase change diagram for the paraffin wax and 1-dodecanol
mixture is developed in figure 5.12 that yields a eutectic point of ~23 °C at approximately
11 wt% paraffin wax mixed with 89 wt% 1-dodecanol. It shows that adding paraffin wax
in 1-Dodeconol gradually increases the melting temperature range up to around 30 °C.
Hence, it can utilize the larger phase change temperature range to store/release the
thermal energy for longer period of time within one day, which benefits the building
insulation behavior.
Figure 5.12: A preliminary “binary” phase change diagram generated using DSC results for paraffin wax and 1-dodecanol mixture.

44
5.4 Building Simulation
First, a baseline of ZØE lab was created using the actual building components
including the actual insulation types that are in place such as the 6-inch-thick batt
insulation on the masonry walls and 4 inches thick PU foam insulation on the SIP wall
and SIP roof. The simulation has led to results which allows for comparing the other
simulation with the new PU foam – PCM insulation material that replaces the existing
insulation on all walls and roof. The values obtained during the measurement, testing,
and calculations are used to run the simulation once again on EnergyPlus software and
determine the potential energy saving that the new insulation material could offer as
seen in figure 5.13 below.
Figure 5.13: Graph shows annually energy consumptions of ZØE lab for different insulation materials.
0
5000
10000
15000
20000
25000
30000
35000
Baseline PU-PCM Using Latent Heat Insulation with "Effective R-value"
Elec
tric
ity U
sage
(kW
h)
Heating Cooling Pumps Total End Uses

45
Through the building simulations, it is found that the potential annual energy
savings of 14.1 % could be attained by only modifying the insulation on the exterior
walls of the ZØE lab building. There is an obvious savings on the electricity
consumption triggered by cooling because PU-PCM insulation material stores the
exterior heat as latent heat. This effect would not be achieved with traditional insulation
material. The ZØE lab building uses heat pumps extensively since most of the cooling
and heating is provided by the geothermal heat pump. This explains the reduction of
electricity use due to pumps. However, a slight increase is observed in the energy use
due to heating, which is normal for PCMs. In the wintertime, the heating inside of the
building would lead the PU-PCM insulation to absorb the heat and store it. Therefore,
more heating would be required inside the building which explains the theory mentioned
by Kosny that PCM based insulation should only be used in southern U.S. climates or
as defined by ASHRAE climate zones 1, 2, and 3 [15]. . The energy consumption for
cooling is reduced by 31% due to PU-PCM insulation on exterior walls as displayed in
Figure 5.14. The simulation shows a decrease of 2108.0 kWh just from reducing the
loads on the cooling aspect of HVAC system. Using the average “effective R-value” of
8.18 of exterior walls insulation yielded similar annual energy saving result (around
17.8% savings) as that when considering the actual PU-PCM composite insulation in
the model. Therefore, the “effective R-value” can provide a reasonable prediction for the
performance of the PCM-based insulation in building. Nevertheless, a small difference
exists when using the “effective R-value” in the building energy modeling. This is mainly
because (1) the average “effective R-value” was not obtained from a linear change of
values over time, and (2) the building energy modeling was performed over one year

46
under actual weather conditions for Denton, TX (there are a lot of temperature
fluctuations during a year, compared to the constant exterior environment temperature
setting in COMSOL).
Figure 5.14: Comparison of annually electricity usage for cooling ZØE lab among the baseline building (use of pure PU foam as insulation), new PU-PCM composite insulation on walls, and using the “effective R-value” for insulation.
Electricity intensity of the building under existing insulation materials and the
suggested PU-PCM composite insulation material are compared in figure 5.15 below.
The wall containing PU-PCM composite insulation provided a reduction of 13% in total
electricity intensity that is the energy consumption of ZØE Lab per unit area in terms of
kWh per square meter.
6755.14
4647.1 4465.81
0
1000
2000
3000
4000
5000
6000
7000
8000
Baseline PU-PCM Using Latent Heat Insulation with "Effective R-value"
Elec
tric
ity u
sed
(kW
h)

47
Figure 5.15: Comparison of total electricity intensity of ZØE lab for baseline building (use of pure PU foam as insulation), new PU-PCM composite insulation on walls, and using the “effective R-value” for insulation.

48
CHAPTER 6
CONCLUSION AND FUTURE WORK
6.1 Conclusion
Through this research, the main goal was to achieve a better insulation profile for
exterior walls to reduce heating and cooling requirements inside buildings. The energy
use due to HVAC systems has led to a dramatic increase of energy demand in
buildings. Researchers have been striving to find ways to make buildings energy
efficient by implementing energy conservation measures. One of the most important
measure is the thermal insulation, which prevents the heat loss/gain through thermal
envelope. This research has led to the finding of a better thermal insulation. It is
developing a composite of polyurethane foam impregnated with paraffin wax PCM. The
PU–PCM composite stores the latent heat through the melting phase and releases the
heat when solidifying temperature is in play. Not only this material is a good thermal
energy storage medium, it also helped increase the thermal resistance value.
The current average “effective R-Value” achieved by this research is in the
average of R-8.2 per inch of thickness. It has been shown that a potential annual
electricity savings of 14 % could be achieved by upgrading the insulation on the thermal
envelope of the ZØE lab building to a PU-PCM composite insulation. Also, the thickness
requirement for the new PU-PCM composite insulation would be lower than that of
fiberglass, cellulose, or even PU foams. The current energy codes in most climate
zones require a minimum insulation value of R-20, which is about 5.5 inches of
thickness for fiberglass and about 4 inches of thickness for PU foam [2]. This will help

49
builders use less building materials and lower the cost of expensive insulation by adding
a more cost effective and readily available commercial grade paraffin wax.
6.2 Future Work
In the continuation of this research, the main focus should be on developing a
heat transfer equation that would help rate the PCM-based insulation material. It was
found through this research that many variables would contribute in the “effective R-
value” of PU-PCM composite insulation such as the percentage of molten PCM in the
composite, thickness of the material, thermal conductivity of the composite, latent heat
of fusion, specific heat capacity, and density. Temperatures should be derived from
current location’s weather file such as TMY3 data. All these variables could be
combined to derive an equation that would properly quantify heat transfer values that
would assign a numerical rating systems for PCM-based insulation material comparable
to the already existing commercial insulation materials. This last will help make the
PCM-based insulation materials become competitive and widely used to help buildings
achieve maximum savings by combining the upgrade of insulation with other energy
conservation measures.
Different infiltration methods (such as pressurizing the molten PCM into the
porous medium combined with a vacuum pump to increase the infiltration rate, etc.) will
also be investigated in order to find the optimal way to efficiently control the amount of
infiltration into PU foam. Furthermore, the change of composite thermal properties with
respect to the amount of infiltration will be studied to determine the optimal infiltration
rate for achieving the best building energy savings. Other key aspects that could be

50
investigated are the moisture diffusion through the composite, fire retardant coating on
the PU-PCM composite surfaces, and the cost analyses of the PU-PCM composite for
material manufacturing and installation as building thermal insulation.
Another important future work is to follow up with this research by conducting a
field experiment on the ZØE lab building. Replacing one exterior wall’s insulation with
PU-PCM composite insulation and attaching thermocouples and sensors that could
generate data of temperature within the new insulation over an extended period. Also,
collect actual data by sub-meters in the building to know what led to the electricity use
during that period. This work will help prove the theoretical work of this research and
bring further ideas to help the buildings industry lower the extensive use of electricity
due to the use of HVAC systems. Moreover, the PU-PCM composite insulation will be
heated-cooled for multiple thermal cycles to investigate the effect of PCM re-locating in
the porous medium on the thermal performance of composite insulation.
PCMs can also be used for HVAC system directly besides in the building
envelope. For instance, ducts and plenums that carry conditioned air could be insulated
with PCMs to prevent the rise of temperature within these mediums from dropping or
increasing when air is not circulating through them. Once the air starts flowing back
through the ducts and plenum the HVAC system will not have to use full capacity in
order to cool or heat the building. This application would be very useful in homes that
have ducts place in the attic space. In hot summer days, temperature in the attics are
usually higher than the exterior. Most ducts currently are insulated with R-6
insulation[2]. If the PCMs are impregnated in that insulation, it could potentially absorb
the heat from the attic space during the hot day and release it back at night when

51
temperature is cooling down. This will help prevent some of the heat from entering ducts
and keep a comfortable temperature indoor throughout the day.
52
APPENDIX A
MEASUREMENTS

53
DSC measurement of paraffin wax with heating/cooling process between 15 °C
and 70 °C uses the following steps:
Temperature Program
1) Hold for 2.0 min at 15.00°C
Data Points: 120
2) Heat from 15.00°C to 70.00°C at 5.00°C/min
Data Points: 660
3) Hold for 2.0 min at 70.00°C
Data Points: 120
4) Cool from 70.00°C to 15.00°C at 5.00°C/min
Data Points: 660
5) Hold for 2.0 min at 15.00°C
Data Points: 120
6) Heat from 15.00°C to 70.00°C at 5.00°C/min
Data Points: 660
7) Hold for 2.0 min at 70.00°C
Data Points: 120
8) Cool from 70.00°C to 15.00°C at 5.00°C/min
Data Points: 660
9) Hold for 2.0 min at 15.00°C
Data Points: 120
10) Heat from 15.00°C to 70.00°C at 5.00°C/min
Data Points: 660

54
11) Hold for 2.0 min at 70.00°C
Data Points: 120
12) Cool from 70.00°C to 15.00°C at 5.00°C/min
Data Points: 660
13) Hold for 2.0 min at 15.00°C
Data Points: 120

55
APPENDIX B
ENERGYPLUS DATA

56
Inputs used in Energy Plus for ZOE Lab are shown in figures B.1 through B.5.
The weather data used by the software is based on the TMY3 weather data collected by
Dallas Fort Worth International Airport which gives an average weather data for the
entire DFW area. The entire year was considered during the simulation which helps
simulate energy consumption on hourly basis for 8760 hours. Winter Design Day and
Summer Design Day are used to stimulate the coolest day in winter and the hottest day
in summer.
Figure B.1: Set up of heat balance algorithm to use Conduction Finite Differential for advanced heat transfer simulations.

57
Figure B.2: Set up of calculations of heat transfer calculation to use Crank Nicholson Second Order.

58
Figure B.3: Different layers of construction of walls.

59
Figure B.4: Properties of materials in each construction layer of walls.

60
Figure B.5: Inputs of phase change material properties.
61
REFERENCES
1. U.S Energy Information Administration (EIA), “How much energy is consumed in U.S. residential and commercial buildings?” 03 May 2018. (URL: https://www.eia.gov/tools/faqs/faq.php?id=86&t=1)
2. 2015 International Energy Conservation Code by International Code Council. ISBN-13: 978-1609834869
3. A.M. Khudhair, M.M. Farid. “A review on energy conservation in building applications with thermal storage by latent heat using phase change materials”, Energy Conversion and Management, Volume 45, Issue 2, January 2004, Pages 263-275. Journal Paper.
4. N. Soares, J.J. Costa, A.R. Gaspar, P. Santos. “Review of passive PCM latent heat thermal energy storage systems towards buildings’ energy efficiency”, Energy and Buildings, Volume 59, April 2013, Pages 82-103. Journal Paper.
5. Farid MM, Khudhair AM, Razack SAK, Al-Hallaj S. “A review on phase change energy storage: materials and applications”. Energy Conversion and Management, Volume 45, Issues 9–10, June 2004, Pages 1597-1615. Journal Paper.
6. H. Akeiber, P. Nejat, M. Z. Abd. Majid, M. A. Wahid, F. Jomehzadeh, I. Z. Famileh, J. K. Calautitf, B. R. Hughes, S. A. Zaki. “A review on phase change material (PCM) for sustainable passive cooling in building envelopes”, Renewable and Sustainable Energy Reviews, Volume 60, July 2016, Pages 1470-149. Journal Paper.
7. Bjørn Petter Jelle. “Traditional, state-of-the-art and future thermal building insulation materials and solutions – Properties, requirements and possibilities”, Energy and Buildings, Volume 43, Issue 10, October 2011, Pages 2549-2563. Journal Paper.
8. Rick Duncan PhD, PE. “Open or Closed Cell Insulation”, September 1, 2017. (URL: https://www.wconline.com/articles/90951-open-or-closed-cell-insulation)
9. Danny Lipford .“Insulation R-Value.” (URL: https://www.todayshomeowner.com/insulation-r-value/)
10. L. Aditya, T.M.I. Mahlia, B. Rismanchi, H.M. Ng, M.H. Hasan, H.S.C. Metselaar, O. Muraza, H.B. Aditiya. “A review on insulation materials for energy conservation in buildings”, Renewable and Sustainable Energy Reviews, Volume 73, June 2017, Pages 1352-1365. Journal Paper.
11. D.Zhou, C.Y.Zhao, Y.Tian. “Review on thermal energy storage with phase change materials (PCMs) in building applications”, Applied Energy, Volume 92, April 2012, Pages 593-605. Journal Paper.

62
12. B.Zalba, J.M. Marin, L.F. Cabeza, H. Mehling. “Review on thermal energy storage with phase change: materials, heat transfer analysis and applications”, Applied Thermal Engineering, Volume 23, Issue 3, February 2003, Pages 251-283. Journal Paper.
13. A. F. Regin, S.C. Solanki, J.S. Saini. “Heat transfer characteristics of thermal energy storage system using PCM capsules: A review”, Renewable and Sustainable Energy Reviews. Volume 12, Issue 9, December 2008, Pages 2438-2458. Review Paper.
14. L. Kancane, R. Vanaga, A.Blumberga. “Modeling of building envelope’s thermal properties by applying phase change materials”. Energy Procedia 95 (2016) 175 – 180.
15. J. Kosny, N. Shukla, A. Fallahi. “Cost Analysis of Simple Phase Change Material-Enhanced Building Envelopes in Southern U.S. Climates”, U.S. Department of Energy’s Building America Program. January 2013. Technical Paper.
16. N. Soares, J.J. Costa, A.R. Gaspar, P.Santos. “Review of passive PCM latent heat thermal energy storage systems towards buildings’ energy efficiency”, Energy and Buildings, Volume 59, April 2013, Pages 82-103. Journal Paper.
17. K. A. R. Ismail, J. N. C. Castro. “PCM Thermal Insulation in Buildings”, International Journal of Energy Research, Volume 21, 1997, Pages 1281-1296. Journal Paper.
18. D.Zhou, C.Y.Zhao, Y.Tian. “Review on thermal energy storage with phase change materials (PCMs) in building applications”, Applied Energy,
Volume 92, April 2012, Pages 593-605. Journal Paper.
19. A.A. Aydin, H. Okutan. “Polyurethane rigid foam composites incorporated with fatty acid ester-based phase change material”, Energy Conversion and Management, Volume 68, April 2013, Pages 74-81. Journal Paper.
20. A. Tinti, A.Tarzia, A. Passaro, R. Angiuli. “Thermographic analysis of polyurethane foams integrated with phase change materials designed for dynamic thermal insulation in refrigerated transport”, Applied Thermal Engineering, Volume 70, Issue 1, 5 September 2014, Pages 201-210. Journal Paper.
21. “Thermal insulation materials Polyurethane (PUR) and Polyisocyanurate (PIR) foam”, react Renewable Energy and Efficiency Action. (http://www.react-ite.eu/uploads/tx_mddownloadbox/PP02_Thermal_insulation_materials_-_PP02_20130715.pdf).

63
22. Y. He. “Rapid thermal conductivity measurement with a hot disk sensor: Part 1. Theoretical considerations”, Thermochimica Acta, Volume 436, Issues 1–2, 1 October 2005, Pages 122-129. Journal Paper.
23. W. Zhao, D. M. France, W. Yu, T. Kim, D. Singh. “Phase change material with graphite foam for applications in high-temperature latent heat storage systems of concentrated solar power plants”, Renewable Energy, Volume 69, September 2014, Pages 134-146. Journal Paper.
24. Theodore L. Bergman, Adrienne S. Lavine, Frank P. Incropera, David P. Dewitt. Introduction to Heat Transfer, 6th edition. 2011. Textbook
25. K. O. Lee, M. A. Medina, X. Sun. “Development and verification of an EnergyPlus-based algorithm to predict heat transfer through building walls integrated with phase change materials”, Journal of Building Physics, Volume 40, 2016, Pages 77-95. Journal Paper.