Embed Size (px)
Citation preview

Dip
ula
iNC
OM
E FuN
D 2
01
3
About this integrAted reportThe company owns a diversified R3,75 billion property portfolio with a retail bias (also incorporating industrial and office properties) across nine provinces in South Africa. The majority of the properties from which rental income streams are derived are located in the Gauteng region.
The asset management function of the group is outsourced to a dedicated external asset manager, DAMT. The property management function of the group is also outsourced, currently to three recognised contractors Broll, JHI and McCormick. The property management companies are individually responsible for reporting on their respective operations as they are not constituted for or dedicated to the service of Dipula.
forwArd-looking stAtementsThis Integrated Annual Report contains forward-looking statements that, unless otherwise indicated, reflect the company’s expectations as at 31 August 2013. Actual results may differ materially from the company’s expectations if known and unknown risks or uncertainties affect its business, or if estimates or assumptions prove inaccurate. The company cannot guarantee that any forward-looking statement will materialise and, accordingly, readers are cautioned not to place undue reliance on these forward-looking statements. The company disclaims any intention and assumes no obligation to update or revise any forward-looking statement even if new information becomes available as a result of future events or for any other reason, save as required to do so by legislation and/or regulation.
key dAtA at 31 August 2013Dipula Income Fund Limited(Registration no.: 2005/013963/06)DIA ISIN for A-linked units: ZAE000158317DIB ISIN for B-linked units: ZAE000158325JSE Main Board sector: Property: Retail EstateShare code: DIA & DIBListing date: 17 August 2011Number of A-units in issue: 143 499 683 linked units (excluding treasury units)Number of B-units in issue: 143 499 683 linked units (excluding treasury units)Number of properties: 176 retail, industrial and office
Dipula’s Integrated Annual Report 2013 is available in hard copy from the company secretary, on request, and is also posted on the group’s website: http://www.dipula.co.za
in the year under review dipula was a
registered pls listed on the main board
Jse in the ‘property: real estate’ sector.
from the start of the 2014 financial year
(1 september 2013) dipula qualifies as
a reit.
www.dipula.co.za
Integrated annual report 2013 for the year ended 31 august

dipulA inCome fund Integrated Annual Report 2013
Corporate InForMatIonInVeStMent CaSe
dipula income fund limitedRegistration number 2005/013963/06Incorporated on 10 May 2005 in the Republic of South Africa
registered office and business addressBlock B Dunkeld Park6 North Road, Dunkeld WestJohannesburg, 2196
independent auditorsGrant Thornton (Jhb) Inc.(Registration number 1994/001166/21)Registered Auditors42 Wierda Road WestWierda Valley, 2196(Private Bag X10046, Sandton, 2146)
transfer secretariesLink Market Services South Africa (Proprietary) Limited(Registration number 2000/007239/07)13th Floor, Rennie House19 Ameshoff StreetBraamfontein, 2001(PO Box 4844, Johannesburg, 2000)
bankersThe Standard Bank of South Africa Limited(Registration number 1962/000738/06)3rd Floor, The FirsCorner Cradock Avenue and Biermann RoadRosebank, 2196(PO Box 8786, Johannesburg, 2000)
Corporate advisorJava Capital Proprietary Limited2 Arnold Road, Rosebank, 2196(PO Box 2087, Parklands, 2121)
Company secretaryProbity Business Services Proprietary Limited(Registration number 2000/002046/07)3rd Floor, The Mall Offi ces11 Cradock AvenueRosebank, 2196(PO Box 85392, Emmarentia, 2029)
trustee for debenture holders and sponsorsJava Capital Trustees and Sponsors Proprietary Limited2 Arnold RoadRosebank, 2196(PO Box 2087, Parklands, 2121)
ContentS
01
02
03
04
05
ABOUT THIS REPORT 1defi nitions 3HIGHLIGHTSfinancial highlights 4sustainability highlights 5
DIPULA AT A GLANCEbackground 6property portfolio 7our listing and milestones 7Achievements since listing 8portfolio snapshot 8leasing profi le 9living our vision and values 10our strategy 12our integrated business model 14key risks 16material issues 19stakeholder engagement 21
LEADERSHIP board of directors 24Chairperson’s report 28Ceo’s report 32financial director’s report 46
TRANSPARENCY AND ACCOUNTABILITYethical leadership 55governance structure 55the board 57Compliance framework 60risk management 64transformation 66environmental conservation 67
PORTFOLIO IN DETAIL 68
ANNUAL FINANCIAL STATEMENTS 83
UNITHOLDER INFORMATIONnotice of annual general meeting 146Analysis of unitholders 150unitholders’ diary 154form of proxy 155Contact details ibc
totAl returns
(seCtor AVerAge: 35,8%)
dipulA b-linked
units in Jse property
seCtor for 2012
CAlendAr yeAr
77,2%
BEST PERFORMER
performAnCe
R3,75 billion property fund
R1,75 billion yield-enhancing acquisitions transferred since listing
Exceptional BEE credentials – black-owned Asset Manager; signifi cant black shareholding
geographically and sectorally diversifi ed portfolio
footprint in nine provinces with majority in gauteng
structured investment – A- and b-linked units with different risk/reward profi les:
preferred growth in distributions for A-linked unitholders (5% until 2017; 2017 – lower of 5% and Cpi)
residual distributions to b-linked unitholders. therefore any growth above the 5% threshold has a positive gearing effect on b-linked unitholders’ income growth
well diversifi ed defensive property portfolio with a retail bias
potential vacancy upside relatively low interest risk in light of fi xes
low asset management fees 0,3%signifi cant growth potential in rentals
Above-infl ation contractual escalations good quality income as evidenced in the 85% A + b tenant profi le
Appropriately outsourced property management – broll, Jhi, mcCormick
signifi cant management stakeholding aligning interests with unitholders stable management team

1DIPULA INCOME FUND Integrated Annual Report 2013
about this report
The company owns a diversified R3,75 billion property portfolio with a retail bias (also incorporating industrial and office properties) across nine provinces in South Africa. The majority of the properties from which rental income streams are derived are located in the Gauteng region.
The asset management function of the group is outsourced to a dedicated external asset manager, DAMT. The property management function of the group is also outsourced, currently to three recognised contractors Broll, JHI, McCormick. The property management companies are individually responsible for reporting on their respective operations as they are not constituted for or dedicated to the service of Dipula.
Corporate informationThe group’s contact people are Izak Petersen (CEO) and Brigitte de Bruyn (Financial Director). They can be contacted at the registered office of the company (see inside back cover).
preparing this reportIn line with the requirements of King III, this Integrated Annual Report provides a consolidated review of the group’s financial, social, economic and environmental performance for the year 1 September 2012 to 31 August 2013. The report is primarily targeted at unitholders, existing and potential institutional investors and funders and potential property vendors.
Dipula has considered and applied many of the recommendations contained in the Discussion
Paper on the Framework for Integrated Reporting and the Integrated Report issued by the Integrated Reporting Committee of South Africa in January 2011, and the Draft International Integrated Reporting Framework. The integrated report was further prepared based on the principles of the GRI.
In compiling this report, Dipula’s EXCO attended a workshop facilitated by an external consultant, at which the group strategy, stakeholder engagement, material issues and business model (as well as other related matters) were interrogated and clarified.
gro
Up o
VerV
ieW

2 dipUla inCome fUnd Integrated Annual Report 2013
In accordance with the stated objectives of integrated reporting, we endeavour to focus in this report on issues that materially impact Dipula’s ability to create and sustain value, now and in the future, and on which the company materially impacts in the course of business, and to outline how these issues have been integrated into our business strategy.
The company has applied the majority of the principles in the King III Report. Explanation is offered where any non-adherence has occurred.
The annual fi nancial statements have been prepared in accordance with IFRS, the requirements of the Companies Act, and the Listings Requirements of the JSE.
signifiCant eVents dUring reporting periodAs communicated to shareholders and published on SENS and in the media, the following signifi cant events occurred during the year:
On 12 November 2012 the company raised R650 million through a private placement of 37 967 290 A-linked and B-linked units. This increased the combined market capitalisation of Dipula to nearly R2,5 billion, with DIAs at R1,5 billion and DIBs at approximately R1 billion at that date. The capital raised was used to fund acquisitions.
In an aggressive growth strategy Dipula has acquired approximately R2,20 billion worth of properties since listing, which have been funded through a combination of debt and equity funding. (See page 34 for details.)
assUranCeThe combined assurance model of the group in its current format is set out below:
business process nature of assurance statusassurance provider
integrated reportdisclosure
annual financial statements Unqualifi ed audit Assured Grant Thornton 87 – 88b-bbee BEE Scorecard Assured Honeycomb 66
about this report(continued)
responsibility statement and reVieWThe Audit and Risk Committee and the board acknowledge their responsibility to ensure the integrity of this Integrated Annual Report. It has been reviewed by the Audit and Risk Committee, the board, company secretary and sponsor. The annual fi nancial statements included in this
integrated annual report have been audited by the external auditors.
is petersenCEO
b de bruynFinancial Director
y WajaChair Audit and Risk Committee
b de bruyn

3DIPULA INCOME FUND Integrated Annual Report 2013
gro
Up o
VerV
ieW
definitions
“Abland portfolio” The portfolio purchased from Abland comprising the Absa Call Centre building in Arcadia, SAPS VIP building in Sunnyside; and SAPS IJS building in Erasmuskloof, which transferred in December 2012
“the board” The board of directors of Dipula Income Fund Limited“the Companies Act” South African Companies Act 71 of 2008, as amended“the current year” The year ending 31 August 2013“Capital Portfolio” Properties acquired from Capital Property Fund, which transferred in
July 2013 and collectively consists of Blackheath Pavilion in Blackheath, Gezina Galleries in Gezina, Shoprite Pretoria North in Pretoria, Woodmead Super Value in Woodmead, Woodmead Square in Woodmead and Ziyabiya in Port Elizabeth
“ Dipula” or “the company” or “the Fund”
Dipula Income Fund Limited and its subsidiaries, listed on the Main Board JSE in Property: Real Estate sector
“DAMT” or “the Asset Manager” Dipula Asset Management Trust, the asset manager of Dipula Income Fund Limited
“EXCO” Executive committee of Dipula Income Fund Limited“GLA” Gross lettable area“GRI” Global Reporting Initiative“the group” Dipula Income Fund Limited and its subsidiaries“IFRS” International Financial Reporting Standards“IoDSA” Institute of Directors South Africa“JSE” JSE Limited incorporating the Johannesburg Securities Exchange,
the main bourse in South Africa“King III Report” King Report on Corporate Governance for South Africa, 2009“Melki Portfolio” Melki Properties, acquired from Melki Group (Pty) Ltd, which
transferred in November 2013, consisting of 50% in Fairways on Main in Howick and the Umgeni Business Park (UBC) in Durban
“Orange Farm Phase 1” Phase 1, a property acquired from S8 (Pty) Ltd, which transferred in December 2012
“Orange Farm Phase 2” 30% of an undivided share in a property currently under development acquired from SLD (Pty) Ltd
“PLS” Property Loan Stock, a former JSE property investment vehicle (replaced by REIT)
“REIT” Real Estate Investment Trust, a JSE property investment vehicle which owns and operates income-producing property
“Smada portfolio” Collectively Byron Place, Pretoria and Sterkolite building,Rosslyn acquired from Smada (Pty) Ltd, which transferred in April 2013
“the previous year” The year ended 31 August 2012“the year” or“the year under review” The year ended 31 August 2013“Tower Mall” Retail mall in Jouberton, North West Province, transferred in
November 2013financial definitions“EBITDA” Earnings before interest, taxation, depreciation and amortisation“HEPS” Headline earnings per share“IFRS” International Financial Reporting Standards
INDUSTRIAL OFFICERETAIL
naViGation
mORE INFO

4 dipUla inCome fUnd Integrated Annual Report 2013
hiGhliGhts for the Year hiGhliGhts for the Year hiGhliGhts for the Year
portfolio GroWth of 53% R1,1bn
83,338 cents5% inCrease in a-linKeddistribution to
neW debt faCilities seCured R410m
66,639 cents9,6% inCrease in b-linKed distribution to
45,5% inCrease in distributable inCoMe
R215m
56% inCrease in MarKet Capitalisation to R2,8bn
13% reduCtion in VaCanCies froM 10,4% to
9,1%
fin
an
Cia
l h
iGh
liGh
ts
suCCessful priVate plaCeMent CoMpleted R650m

5dipUla inCome fUnd Integrated Annual Report 2013
gro
Up o
VerV
ieWg
roU
p oV
erVieW
sust
ain
abi
litY
hiG
hliG
hts
non-Core properties sold
total lonG terM interest bearinG liabilities R1,5bn
deVelopMents in proGress R370m
started MaKinG a differenCe in CoMMunities throuGh fundinG the oranGe farM CoMMunitY trust
13
portfolio Value R3,75bn
ConCluded aCQuisitions sinCe listinG totallinG R2,20bn
ConVerted to REIT
sna
psh
ot
of
fun
d

6 DIPULA INCOME FUND Integrated Annual Report 2013
dipula at a GlanCe
baCkgroUndDriven by a highly acquisitive growth strategy, the Fund has more than doubled in size since listing in August 2011. Management are significant shareholders and the key drivers of portfolio growth, committed to actively increasing the quality, size and value of Dipula’s assets.
Dipula is distinguished in the JSE property sector by its strong B-BBEE platform boasting amongst the
highest black shareholding relative to peers, with its roots in two majority black-owned property funds: Mergence Africa Property Fund and Dipula Property Fund. It is managed by a 100% empowered Asset Manager.
The Manco is 50% owned by Mergence Africa Properties and 50% by Dijalo Property Services both private companies and 100% black-owned and managed.
DIPULA Sustainable income fund
Growing returns for unitholders
a aND b uNits
Dipula is a property income fund which provides sustainable and growing returns for its unitholders, through A and B unit structures.
A-linked units: receive preferred 5% growth in distributions until 31 August 2017; thereafter the lower of 5% and CPI.
B-linked units: entitled to all residual distributions after servicing A-linked units.
A- and B-linked units rank equally for voting purposes and in terms of all other rights and obligations.
a-liNkeD uNits b-liNkeD uNits

7DIPULA INCOME FUND Integrated Annual Report 2013
oUr history and milestones
2005dipula property fund founded
R300 million portfolio
2010Portfolio R750 million
2011merger of dipula property fund with
mergence africa property fund to
form dipula income fund limited
Portfolio R1,4 billion
acquisition of asakhe portfolio for
r314 million and a redefine portfolio
for r395 million
Portfolio R2,1 billion
dipula lists on Jse – market cap
r1,5 billion
2012acquisition of mcCormick
portfolio for r254 million
Portfolio R2,4 billion
market cap r1,8 billion
2013acquisition of abland portfolio for
r431 million
acquisition of orange farm phase 1
for r42 million
acquisition of smada portfolio for
r116 million
acquisition of Capital portfolio for
r559 million
successful r650 million private
placement concluded
new debt facilities of r410 million
property portfolio
Gauteng
limpopo
north West Mpumalanga
Western Cape
northern Cape KwaZulu-natal
eastern Cape
free state
industrial
retail
office
Dipula has a geographically and sectorally diversified property portfolio with a retail bias. The properties are located throughout South Africa’s nine provinces with the majority in the economic hub of Gauteng.
dipU
la a
t a g
lan
Ce

8 dipUla inCome fUnd Integrated Annual Report 2013
dipula at a GlanCe(continued)
portfolio snapshot at 31 august 2013
PORTFOLIO VALUE R3,75bnNUMBER OF PROPERTIES 176550 656m2 GLA
PROVINCES IN SOUTH AFRICA 9
AVERAGE PROPERTY VALUE
AVERAGE PROPERTY SIZE
R21,3m
3 129m2
EXISTING PORTFOLIO ESCALATIONS 7,9% BY INCOME AND
7,5% by GLA
91,9%OCCUPANCY
aChieVements sinCe listing
SUSTAINED BEE ADVANTAGE
PORTFOLIO VALUE DOUBLED IN SIZE TO R3,75bnSIGNIFICANT MANAGEMENT UNIT- HOLDING TO ALIGN INTERESTS
MARKET CAPITALISATION UP FROM R1,5 billioN TO MORE THAN R2,8bn
NON-CORE ASSETS DISPOSED OF
NON-CORE PROPERTIES EARMARKED FOR SALE
14
16ACQUIRED 23 PROPERTIES VALUED AT (r1.7 billion already transferred)
R2,2bnDIPULA B-INKED UNITS BEST PERFORMER IN JSE PROPERTY SECTOR FOR 2012 – TOTAL RETURNS MoRe thaN twiCe SECTOR AVERAGE
AVERAGE VALUE OF PROPERTIES ACQUIRED
R95,8m

9dipUla inCome fUnd Integrated Annual Report 2013
lease expiry profi le by gross rental income (rm)
2 000 000
4 000 000
6 000 000
8 000 000
10 000 000
12 000 000
31-Aug-14 31-Aug-15 31-Aug-16 31-Aug-17 Beyond 31-Aug-17
Retail Industrial Of�ces Total
LEASE EXPIRY PROFILE by Gross rental income (Rm)rand million
dipU
la a
t a g
lan
Ce31-Aug-14 31-Aug-15 31-Aug-16 31-Aug-17 Beyond
31-Aug-17Retail Industrial Of�ces Total
20 00040 00060 00080 000
100 000120 000140 000160 000
Vacancy Unlettable*
LEASE EXPIRY PROFILE by GLA (%)
lease profi le as at 31 august 2013lease expiry profi le by gla
* Unlettable space is space that forms part of the GLA but which management considers to be structurally incapable of being let
leasing profile

10 dipUla inCome fUnd Integrated Annual Report 2013
Vision how we live our visionThrough responsible investing, outstanding tenant and stakeholder focus and hands-on quality management, Dipula aims to be the leading property investment company in South Africa in terms of sustainable property returns, both in respect of quality of income and of providing above-average total returns, including long-term capital growth, to our unitholders.
• Deliver sustainable distributions
• Grow total returns over long term (4 – 6 years)
• Acquire assets with high occupancy by national tenants
• Ensure quality income with A and B graded tenants making up the majority of income
• Conservative interest rate hedging policy in terms of which the majority of risk is fixed, reducing the risk of distribution erosion
• Active, high quality asset management:
o Income enhancing and portfolio strengthening acquisitions
o Strategic well-timed disposals
Values how we live our values
tenant focus • Regular tenant interaction and surveys aimed at tenant retention and recruitment
hands-on management • Ethical behaviour in all dealings
• Regular property visits by asset managers
• Direct relationships with key tenants
• Regular meetings with property managers
entrepreneurial flair and drive • Delegation of authority to asset managers and encouraging staff to take full ownership of actions
• Deal flow demonstrates this vision
true to south africa • Striving for highest B-BBEE rating through compliance with all categories of scorecard
delivery-motivated performance (stakeholder focused)
• Ongoing meetings with stakeholders
• Membership of SAPOA and SAREIT
solution oriented • Every problem has a solution
liVinG our Vision and Values

11dipUla inCome fUnd Integrated Annual Report 2013
dipU
la a
t a g
lan
Ce
12 DIPULA INCOME FUND Integrated Annual Report 2013
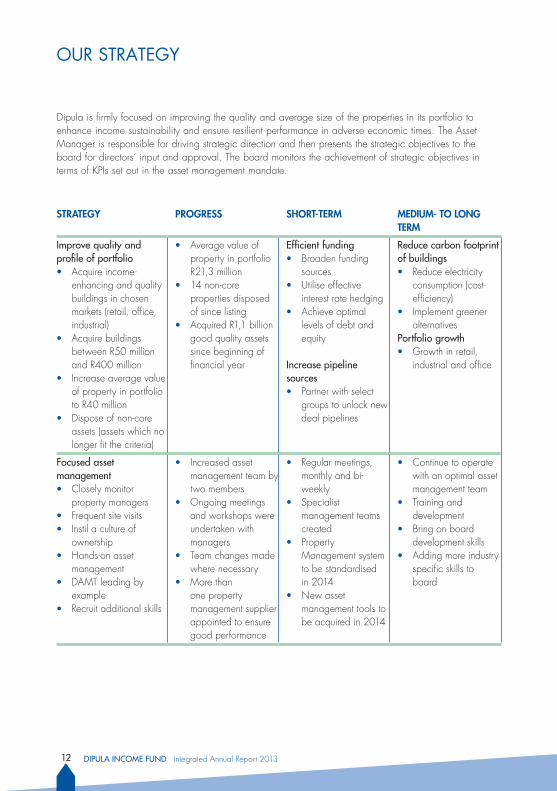
STRATEGY PROGRESS ShORT-TERm mEDIUm- TO LONG TERm
improve quality and profile of portfolio• Acquire income-
enhancing and quality buildings in chosen markets (retail, office, industrial)
• Acquire buildings between R50 million and R400 million
• Increase average value of property in portfolio to R40 million
• Dispose of non-core assets (assets which no longer fit the criteria)
• Average value of property in portfolio R21,3 million
• 14 non-core properties disposed of since listing
• Acquired R1,1 billion good quality assets since beginning of financial year
efficient funding• Broaden funding
sources• Utilise effective
interest rate hedging• Achieve optimal
levels of debt and equity
increase pipeline sources• Partner with select
groups to unlock new deal pipelines
reduce carbon footprint of buildings• Reduce electricity
consumption (cost-efficiency)
• Implement greener alternatives
portfolio growth• Growth in retail,
industrial and office
focused asset management• Closely monitor
property managers• Frequent site visits• Instil a culture of
ownership• Hands-on asset
management • DAMT leading by
example • Recruit additional skills
• Increased asset management team by two members
• Ongoing meetings and workshops were undertaken with managers
• Team changes made where necessary
• More than one property management supplier appointed to ensure good performance
• Regular meetings, monthly and bi-weekly
• Specialist management teams created
• Property Management system to be standardised in 2014
• New asset management tools to be acquired in 2014
• Continue to operate with an optimal asset management team
• Training and development
• Bring on board development skills
• Adding more industry specific skills to board
our strateGY
Dipula is firmly focused on improving the quality and average size of the properties in its portfolio to enhance income sustainability and ensure resilient performance in adverse economic times. The Asset Manager is responsible for driving strategic direction and then presents the strategic objectives to the board for directors’ input and approval. The board monitors the achievement of strategic objectives in terms of KPIs set out in the asset management mandate.

dipU
la a
t a g
lan
Ce
STRATEGY PROGRESS ShORT-TERm mEDIUm- TO LONG TERm
Cost containment• Keep costs low without
compromising assets• Focus on utilities and
property operating costs
• Portfolio Cost to Income contained at 20,7%
• Utility specialists appointed at the property management level
• Objections lodged where municipal valuations were excessive
• To join SAPOA bid to expound to municipalities on the dangers of excessive rates increases
• Modernise portfolio to save on operating expenses
• Acquire more cost efficient buildings and do strategic revamps
tenant retention• Work closely with
property managers and tenants
• 76% retention rate • Tenant incentives for good payment history and remaining in buildings
• Strategic revamps• Improving our direct
relationships with key tenants
• Direct key lease negotiations
• Increase our retention rate and suitability of our buildings to good quality tenants
13dipUla inCome fUnd Integrated Annual Report 2013

14 DIPULA INCOME FUND Integrated Annual Report 2013
our inteGrated business Model
PRoPeRty owNeRshiP
eXteRNal asset
MaNaGeR
iNPuts
Dipula is a property fund that offers investors the opportunity to invest in a diversified property portfolio of retail, industrial and office properties in South Africa.
FiN
aN
Cia
lM
aN
uFa
Ctu
ReD
iNte
lleC
tua
lh
uM
aN
soCia
l a
ND
Rel
ati
oN
shiP
Na
tuRa
l
Debt/gearingR2,8 billion equity
Property assets
Retail, commercial and industrial
Property management expertise
Asset management expertiseIT systems
Board of Directors
Hands-on small asset management
team
External property management
BBBEEEmerging suppliers
Township development
Water and electricity
conservation
Low carbon footprint
Low emission impact
Rural investments
R1,8 billion debt raised
busiNess aCtivities
va
lue
Ch
aiN

15DIPULA INCOME FUND Integrated Annual Report 2013
dipU
la a
t a g
lan
Ce
outCoMes
Stronger listed property sector
Well rated share in terms of liquidity and
capital growth
Well diversified property portfolio
Job creationTownship
development investment
Preferential procurement
Economic growth for
communities
Responsible waste removal
Low-impact industry
Reliable and trustworthy data and good
reputation
Loyalty
eXteRNal PRoPeRty MaNaGeMeNt
(tenant acquisition; retention and optimisation; property
management; rental collections)
bi-aNNual DistRibutioNs
outPuts
Capital investment growth
Regular, growing income distributions
Growing property portfolio
Exposure to a diversified portfolio of properties that is actively managed in a strict governance
framework
Service level agreements with
asset and property managers
Real estate investment in under invested
communities
SMME empowerment through procurement
support and enterprise development
Energy and water efficient buildings
Ma
Nu
FaCt
uRe
DiN
tell
eCtu
al
hu
Ma
Nso
Cia
l a
ND
Rel
ati
oN
shiP
Na
tuRa
lFi
Na
NCi
al

16 DIPULA INCOME FUND Integrated Annual Report 2013
The table below sets out the most material risks identified in our risk management process. These are not the only risks facing the company. Other risks have been identified but may not yet have been designated as material, or are currently unknown. Future events could lead to their escalation and therefore negative impact on Dipula’s operations. Dipula’s full risk management processes are discussed in detail on page 64.
key risks impact mitigation
socio-political risk• Regulatory
• Investment risk (higher than market value with insufficient yields)
• Interest rates
• Local municipalities
Potential fines and censure for non-compliance
Reputational impact
Dilution in distributable income and possible capital erosion
• Ongoing engagement with JSE, sponsor, company secretary
• Compliance process in place including annual checklist
• Investment Committee in place to assess acquisitions for board approval
• Detailed due diligence of all acquisitions
• Interest rate fixes (74% of local borrowings)
• If swaps considered, avoiding concentration of swap maturity
Underperformance of asset manager
Inability to meet our strategic objectives
Underperformance relative to the market
Reduced distributable earnings
Poor returns to unitholders
Inability to compete effectively for capital
• Asset management mandate with KPIs
• Monitoring by board
• Option to terminate in the event of consistent underperformance
•
KeY risKs
GREENLow
•AmBERmedium
•REDhigh
•
risk grading
•

17DIPULA INCOME FUND Integrated Annual Report 2013
key risks impact mitigation
liquidity and refinancingNot being able to meet financial commitments and/or inability to roll over debt at optimal funding rates and/or exposure to single source of funding
Insufficient cash resources to meet interest payments timeously
Inability to pursue acquisitions for growth
Inability to refinance borrowings on expiry
• Cash flow management
• Maintaining conservative loan-to-value ratios
• Ongoing monitoring of environment and engagement with bankers
• Monitoring debt profile (maturity evenly spread)
• Diversifying funding sources
people (the asset manager; property managers)• Skills shortage• Retention
Loss of key people would impact performance and therefore the ability to support the Fund in meeting our strategic objectives
• Strong retention strategies in place at the Asset Manager and property managers including remuneration benchmarking, incentives, performance evaluations, and development plans
increased costs• admin and
operating costs• municipal charges
(increases risk of default as impacts tenants’ ability to service rental)
• electricity
Reduction of margins
Erosion of distributable income growth
• Negotiating medium-term supplier contracts
• Leveraging economies of scale in large property management companies
• Focus on cost efficiencies
• Consumption saving initiatives (and educating tenants thereon for further savings)
• Review of recoveries from tenants
• Investigating alternative power sources, e.g. generators where viable for continuity of supply
•
•
•
dipU
la a
t a g
lan
Ce

18 DIPULA INCOME FUND Integrated Annual Report 2013
key risks impact mitigation
reduced social grants Reduction of marginsErosion of distributable income growth
• Ownership of diversified property portfolio
• Trading out of non-core assets• Strategic revamps• Acquisition of dominant
properties
Changing occupancy trends eg. IT – virtual offices; modernisation of processes such as manufacturing requiring less space
Reduction of marginsErosion of distributable income growth
• Ownership of diversified property portfolio
• Trading out of non-core assets• Strategic revamps
arrears and bad debts Negative impact on cash flow
Large write-offs
Eviction of, eg. anchor tenant impacting negatively on smaller surrounding tenants, increasing risk of default
Vigilant credit control by property managers and oversight by the Asset Manager, including:• Continued engagement with
tenants including iro lease negotiation
• Rigorous tenant credit checks
• Deposits and sureties
over exposure to single tenant
Inability to replace tenant when they vacate
• Ongoing monitoring of single tenant exposures
• Acquiring assets with multiple user profiles
building obsolescencePhysical deterioration of the structures as well as failing locations
Reducing rental income compressing distributable income
• Three year maintenance plan in place and regularly reviewed by property managers and Asset Manager
• Disposing of potentially obsolescent properties
Under-insurance Losses suffered carried by Dipula, impacting negatively on net profit
• Annual review by Asset Manager in consultation with property managers re: accurate replacement values
•
•
•
•
KeY risKs(continued)
•
•

19DIPULA INCOME FUND Integrated Annual Report 2013
Material issues
Dipula has defined a material issue as any core long-term factor impacting on its operations that necessitates a strategic response.
1. In order to identify the material issues, a comprehensive materiality assessment process was conducted which included Exco and representatives of the Asset Manager attending a workshop – facilitated
by external consultant Envisage Investor Relations – to determine the intersection of key risks and strategic objectives, as well as to factor in stakeholder concerns, and determine from these the material issues affecting our operations.
2. The material issues have been reviewed by the board as well as in discussion with the Asset Manager.
material issuestakeholder affected
link to strategic objective What we measure progress fy 2013
income growth UnitholdersFunders
Long-term portfolio growth
Growth in distribution • Income growth in line with management market guidance 6,5% – 7,5%
municipal costs UnitholdersFunders Property managersTenants
Ongoing cost containment
Municipal and utility statements
• Objections lodged for all excessive municipal valuations
• Launched pilot projects for consumption efficiencies across portfolio
occupancy levels
UnitholdersFunders
Ongoing tenant retention strategies
Occupying levels and tenant retention rates
• 76% tenant retention rate achieved
• Reduction in vacancies
lease expiry profile
UnitholdersFunders
Tenant focus Length of leases • Positive rental growth on expiries of 10,1% achieved while renewing expiring leases for 1 – 5 years
dipU
la a
t a g
lan
Ce

20 DIPULA INCOME FUND Integrated Annual Report 2013
Material issues(continued)
material issuestakeholder affected
link to strategic objective What we measure progress fy 2013
management quality
UnitholdersFundersAsset Manager
Focused asset management
Annual growth in distributions vs sector average over three years. In calculating performance, the portfolio quality and events of force majeure are taken into accountkpiDipula’s growth (adjusted for event of force majeure) should not be less than: • 60% of market growth
where market growth is positive
OR• more than 166% of
market growth where market growth is negative
7% on overall distribution in line with sector
asset quality UnitholdersFundersAsset ManagerProperty ManagersTenants
Focused asset managementLong-term portfolio growth
• Occupancy levels• Rental growth• Tenant retention rates
• R1,1 billion worth of good quality assets transferred
• Growth in rentals on renewals 10,1%
• Reduction in vacancies 10,4% to 9,1%
bad debts UnitholdersFundersProperty ManagersAsset Manager
Long-term portfolio growth
• Distribution growth• Level of write-offs
• No growth in y-o-y provisions
access to capital
UnitholdersFunders
Short-term efficient fundingLong-term portfolio growth
• Funding spreads • Reduction in debt net margins
• Over subscription on R650 million capital raised

21DIPULA INCOME FUND Integrated Annual Report 2013
staKeholder enGaGeMent
The Asset Manager is responsible for identifying stakeholders for approval by the board, and for devising an appropriate engagement programme for each group. The implementation of the programmes and the capture of meaningful feedback for Dipula’s strategy are monitored by the board as part of its performance assessment of the Asset Manager.
identified stakeholders
stakeholder What matters to them engagement feedback
Unitholders • Financial performance
• Unit price growth
• Sustainable earnings growth
• Risk and mitigation strategies
• Management stability and competence
• SENS• Website• Results presentations• 1:1 meetings• Road shows• Media• Integrated report
• Feedback from results presentations and 1:1 meetings is relayed to and dealt with at board level
Property managers • Job security
• Good working environment
• Support from Asset Manager
• Flat reporting structure and open door policy
• Annual performance review by the Asset Manager
• Feedback discussed at the Asset Manager level and communicated to board
Asset Manager • Sustainable company
• Fair mandate conditions
• Annual performance review by board relative to mandate terms
• Feedback communicated to board
Funders • Loan covenant compliance
• Solvency
• Quality of assets
• Adequate security
• Tenant quality
• 1:1 meetings
• Property site visits
• Integrated report
• Feedback to board
Tenants
• Rental levels and occupancy costs
• Compliance with building regulations
• Safety• Service (Property
Manager)
• Regular site visits• Email and letters• Management meetings
• Feedback from property managers discussed at the Asset Manager level and communicated to board
dipU
la a
t a g
lan
Ce

staKeholder enGaGeMent(continued)
22 dipUla inCome fUnd Integrated Annual Report 2013
stakeholder What matters to them engagement feedback
Industry bodies • Market trends• BEE• Industry-specific
development
• Membership of SAPOA and SAREIT
• Ongoing relationships and representation
• Speaking and attendance at events
• Feedback to board• Publications in media

dipU
la a
t a g
lan
Ce
23dipUla inCome fUnd Integrated Annual Report 2013

board of direCtorsThe directors of Dipula bring a wide range of experience both in the general business environment as well as in the property sector.
nyangeni saUl gUmede (57)BCom, CPMRExecutive Director
brigitte de brUyn (40)BCom, BAcc, CA (SA)Financial Director
zanele JoyCe matlala (50) BCompt (Hons), CA (SA)Independent Non-executive Chairperson
izak petersen (40)BCom, PGDA, CA (SA)CEO
24 dipUla inCome fUnd Integrated Annual Report 2013

for directors’ full CVs please see next page
brian hilton azizollahoff (52)BA (NY), MBA (Wits)Independent Non-executive Director (British)
elias (‘eltie’) links (66)BCom, MCom (Economics), MA (Economics), PhD (Economics)Independent Non-executive Director
yoUnaid WaJa (61)BCom (Hons), BCompt, CA (SA), HDip Tax LawIndependent Non-executive Director
lead
ership
25dipUla inCome fUnd Integrated Annual Report 2013

26 DIPULA INCOME FUND Integrated Annual Report 2013
board of direCtors(continued)
ExEcutivE izak petersen (40)CEOBCom, PGDA, CA (SA)
Izak originally co-founded the Mergence group of companies a decade ago. Mergence was co-principal in the formation and listing of Dipula through the merger of Mergence Africa Property Fund and Dipula Property Fund. Mergence runs successful and highly ranked financial services businesses in asset management (equity, fixed income, balanced funds, absolute return funds, renewable energy funds and high impact SRI funds), property investment and asset management as well as equity derivative broking and research (JSE member). Mergence is amongst the first and most successful BEE asset management companies in South Africa, consistently achieving top quartile rankings amongst its peers. Mergence achieved a number 3 ranking for derivative research in the prestigious Financial Mail Analyst Rankings in 2013 and is consistently in the top three single stock derivative brokers on the JSE. Izak continues to serve as an executive and shareholder of the Mergence Group. Prior to this he worked for PSG Investment Bank, first as group management accountant and subsequently as a transactor in structured finance and products, and was at Deloitte South Africa before that, where he executed services locally and in the USA. Izak continues to serve as an executive committee member of various industry bodies and hold directorships in a number of Mergence group companies.
brigitte de brUyn (40)Financial DirectorBCom, BAcc, CA (SA)
Brigitte joined Dipula from Grapnel Property Group Proprietary Limited, where she was financial director. She served her articles at Deloitte & Touche Audit Division and in 1999 left to gain experience with Deloitte & Touche Los Angeles. From 1999 to December 2005 she held various positions in Deloitte & Touche Special Services Group, a consulting division
within the firm, including a secondment to Zurich, Switzerland. In 2004 she was promoted to a senior manager role and onto the executive committee of the Special Services Group.
nyangeni saUl gUmede (57)Executive DirectorBCom, CPMR
Saul is a co-founder of Dipula. In 1998 he founded Dijalo Property Services, of which he became CEO. Dijalo provides property management services, facility management, broking and leasing, development facilitation, property consulting and property valuations to the property and financial industries. Prior to this he was assistant general manager at SEBO, a Bophuthatswana government pension property portfolio valued at R800 million. He also formerly worked for Old Mutual Properties in various positions. He began his career at Deloitte & Touche in 1985.
indEpEndEnt non-ExEcutivE zanele JoyCe matlala (50)ChairpersonBCompt (Hons), CA (SA)
Zanele joined the Merafe board in 2005 as an independent non-executive director, and in 2012 was appointed Merafe’s chief executive officer. Prior to this she was financial director of Kagiso Investments Proprietary Limited. Her very first appointment as chief financial officer was at the Development Bank of Southern Africa (DBSA), which she joined from the IDC where she had been head of Wholesale Venture Capital Funds. She is currently a non-executive director of Stefanutti Stocks Holdings Limited and Business Partners Limited.
brian hilton azizollahoff (52)(British)BA (NY), MBA (Wits)
Brian has almost 26 years’ experience in the property industry. He served as chief executive

officer of Redefine from 2003 until its merger with ApexHi Properties Limited and Madison Property Fund Managers Limited in 2009. He resigned from Redefine to form Capstone Property Group. He also sits on the National Council of SAPOA.
elias (‘eltie’) links (66)BCom, MCom (Economics), MA (Economics), PhD (Economics)
Professor Links is a non-executive director of a number of companies including AfriSam Proprietary Limited, Freeworld Coatings Limited, Business Partners Limited, Juta Limited and TerraSan Limited. He is also the chair of Doing Business in Africa at the Stellenbosch Graduate School of Business. He further serves as a member of the B-BBEE Council of the President. Previously, he served as the South African Ambassador to the European Union, Belgium and Luxembourg as well as the Permanent Representative of South Africa at the World Bank and International Monetary Fund, Washington DC.
yoUnaid WaJa (61)BCom (Hons), BCompt, CA (SA), HDip Tax Law
Younaid is a private consultant with extensive experience across a range of business sectors including telecommunications, property, asset management, gaming, motor and transportation, and economic growth facilitation. He currently serves as a director of various public sector and JSE companies. From 1996 to 2007 he was a senior partner and executive chairman of APF Chartered Accountants Inc., a consortium of black auditing and accounting firms. During his career he served as chairman of the Public Accountants and Auditors Board (PAAB, now IRBA); vice president of the Association for the Advancement of Black Accountants of Southern Africa (ABASA); and an executive member of the Black Business Council (BBC).
lead
ership
27dipUla inCome fUnd Integrated Annual Report 2013

Chairperson’s report
Dipula delivered a credible performance for the year with our asset acquisition strategy starting to bear fruit.
zanele Joyce matlala
28 dipUla inCome fUnd Integrated Annual Report 2013

29DIPULA INCOME FUND Integrated Annual Report 2013
The portfolio grew through the careful addition of properties that are quality enhancing and offer good returns. Acquisitions during the year totalled more than R1,1 billion, at an average yield of over 9,9%.
We achieved a satisfactory 7% growth in distributions. This continued our track record of achieving guidance provided to the market.
Since listing in August 2011 we have grown our market capitalisation to R2,8 billion, with more than R1 billion growth realised in the year under review.
Post-year-end, Dipula has successfully converted to a REIT. This move by the group and others will align our local listed property sector with internationally traded real estate investments, facilitating easier inclusion on international indices. This is, in turn, critical for successful capital-raising exercises. The REIT framework has the added advantage of providing tax certainty as REITs are exempt from capital gains tax on disposals of properties and security holdings in fellow REITS.
oUr trading enVironmentThe macroeconomic environment remains tough with low growth expectations worldwide. Locally the economy is expected to grow at less than 2% in the year ahead. The listed property sector is still feeling the effects of a weaker Rand as a result of local labour unrest as well as global factors. With these problems unlikely to abate any time soon, the currency is expected to remain weak in the coming months. Inflation should ease, although given the currency weakness and anticipated electricity cost hikes and wage negotiations, there is a risk of higher than expected inflation. This would have the knock-on effect of escalating rentals to unaffordable levels for tenants, which is a concern going forward.
In addition, the property sector has been negatively impacted by the recent large-scale sell-off of South African bonds by foreign investors.
Inefficient municipalities are impacting returns in the property sector. Municipal rates are determined annually according to two components – the valuation of the property (re-assessed every four years) and the rate in the Rand (provides the inflation factor in the calculation in the years the property is not valued). At present the rate in the Rand is increased annually, with a revaluation every four years resulting in double inflation.
priVate plaCementWith capital-raising a material issue for any growing property fund, we are pleased to have achieved a notable milestone during the year. Our private placement in November 2012 was oversubscribed. The group raised R650 million by issuing 37 967 290 A-linked units at R10,45 each and 37 967 290 B-linked units at R6,67 a unit.
The issue prices included an accrued distribution for the six months to 31 August 2012 of 39,69 cents for the A-linked units and 33,08 cents for the B-linked units, and an accrued distribution for the period 1 September 2012 to 20 November 2012 of 20,83 cents for the A-linked units and 14,90 cents for the B-linked units. (Excluding the accrued distributions, the private placement units were issued at R9,49 per A-linked unit and R6,19 per B-linked unit.)
The purpose of the private placement was to fund acquisitions. As a result of delays in the transfer of certain of the acquired properties, the opportunity cost of holding cash amounted to around 1,5 cents per B-linked unit.
beeDipula is distinguished by one of the highest BEE ratings in the listed property sector. Our commitment to transformation is reflected in our Level 3 BEE rating, which was verified post-year-end. This, coupled with our 100% BEE Manco, is a significant competitive advantage for the group,
lead
ership

Chairperson’s report(continued)
for instance in securing long-term government tenancy of major offi ce buildings in the portfolio. It is further viewed positively by our various tenants as it, in turn, improves their ratings.
goVernanCe and sUstainabilityGood governance is essential for the long-term success of the group. During the year the board implemented a strategy to address compliance with King III. In addition, compliance with all relevant Acts is being reviewed.
The board currently comprises a majority of independent non-executive directors. Our intention to appoint additional independent directors going forward will increase the size of the board with weight further in favour of independent input.
Dipula’s directors continue to drive improvements to integrated reporting as we strive for the highest levels of best practice. We endeavour to provide a true account of the group’s commitment to fi nancial, social and environmental sustainability which permeates the entire business. The Ethics, Sustainability and Social Committee established during the year (chaired by independent non-executive director Eltie Links) will assist in this regard and help to entrench sustainability policy and practices in the group. Greening initiatives are currently being undertaken with regard to existing properties, and we are looking into energy-effi ciency efforts to spur our environmental sustainability.
Giving credence to our commitment to ‘giving back’ we funded the Orange Farm Community Trust to buy a 10% stake in our Eyethu Orange Farm Mall. The centre is poised to act as a major catalyst not only for the Orange Farm and Evaton areas, but for the whole Greater Sebokeng region.
foCUs in fy2014Dipula has fortunately been able to cement a solid platform for long-term growth, as the next 12 months are expected to remain tough. Within the context of challenging macro factors,
management is committed to extracting maximum value from the portfolio. We will also continue to pursue quality and earnings-enhancing acquisitions. In order to fund our growth aspirations we are looking at diversifying our sources of funding and will seek a credit rating to access the debt capital markets.
thanksI would like to thank my fellow board members for their input during the year. I commend the dedication of CEO, Izak Petersen, and the group’s diligent property managers who have helped steer our growth so admirably. Our asset managers are also inherent to our growth and success, and their hard work is greatly appreciated.
Thank you, too, to our shareholders, tenants, all business partners and the industry regulators for your ongoing support of Dipula.
zanele Joyce matlalaChairperson
30 dipUla inCome fUnd Integrated Annual Report 2013

lead
ership
31dipUla inCome fUnd Integrated Annual Report 2013

Ceo’s report
Strategically 2013 was a successful year for the group. We grew our portfolio value by 53% to R3,75 billion from R2,4 billion, of which 46% relates to acquisitions and 8% to capital growth.
izak petersen
redUCed VaCanCies
by
dipUla’s distribUtable
inCome inCreased
by
13%
45,5%
32
group. We grew our group. We grew our portfolio value by 53% portfolio value by 53% group. We grew our group. We grew our portfolio value by 53% group. We grew our group. We grew our
to R3,75 billion from to R3,75 billion from portfolio value by 53% portfolio value by 53% to R3,75 billion from portfolio value by 53% portfolio value by 53%
R2,4 billion, of which R2,4 billion, of which 46% relates to acquisitions 46% relates to acquisitions and 8% to capital growth.and 8% to capital growth.46% relates to acquisitions 46% relates to acquisitions and 8% to capital growth.46% relates to acquisitions 46% relates to acquisitions
redUCed redUCed VaCanCies VaCanCies
13%13%
32

Costs remained well controlled at 20,7% of gross rentals.
We reduced overall portfolio vacancies by 13% to 9,1%, refl ected as a 24% reduction in industrial vacancies; a 15% reduction in retail vacancies while offi ces remained unchanged year-on-year at a 15% vacancy level. Vacancies have in our opinion been well managed, notwithstanding that the offi ce sector remains a concern due to tough market conditions.
Dipula’s distributable income increased by 45,5%, generating a per unit distribution growth of 7% which is in excess of infl ation. This fell squarely within our guideline to the market during interim reporting of 6,5% to 7,5%,
Our balance sheet remains robust with gearing constant year-on-year at roughly 38%, which is within the industry norm of between 30% and 40%.
strategyOur strategy to build a diversifi ed and resilient portfolio, while preserving and delivering sustainable income growth, gained considerable traction in the year with the acquisition of the better quality portfolio refl ected in the table overleaf (see portfolio summary below).
lead
ership
33dipUla inCome fUnd Integrated Annual Report 2013

34 DIPULA INCOME FUND Integrated Annual Report 2013
Ceo’s report (continued)
Table of acquisitions since listing
post-listing acquisitions sector location gla (m2)
announced (r’000)
transferred/transferring
(r’000)
awaiting transfer (r’000)
developments(r’000)
yield%
Bochum and Blouberg Plaza Retail Limpopo 12 529 117 208 117 208 9,5
Nquthu Plaza Retail KZN 14 972 136 701 136 701 9,5
SAPS VIP Office Gauteng 21 478 229 860 229 860 10,0
SAPS IJS Office Gauteng 7 874 118 540 118 540 10,0
Absa Home Loans Office Gauteng 5 048 82 600 82 600 10,0
Orange Farm Phase 1 Retail Gauteng 5 591 42 167 42 167 9,3
Byron Place Office Gauteng 3 271 38 000 38 000 10,0
Sterkolite building Industrial Gauteng 12 782 78 000 78 000 13,0
UBC and Fairways on Main Retail KZN 6 900 57 000 57 000 9,5
Capital Properties Retail Various 54 079 559 030 559 030 9,5
Tower Mall Retail North West 15 283 156 000 156 000 9,9
50 Hamilton Street Offices Gauteng 4 500 52 643 52 643 9,3
Plaza Shopping Centre Retail Free State 25 720 179 500 179 500 9,8
Randfontein Shopping Centre Retail Gauteng 5 935 46 200 46 200 9,8
Bushbuckridge Shopping Centre Retail Mpumalanga 16 203 104 180 104 180 9,8
Orange Farm Phase 2 (30%) Retail Gauteng 26 524 150 000 150 000 9,5
Tsakane Corner Shopping Centre Retail Gauteng 5 941 56 548 56 548 9,3
total 244 630 2 204 177 1 667 749 329 880 206 548 9,8

35DIPULA INCOME FUND Integrated Annual Report 2013
The table overleaf with our acquisitions since listing reflects the fact that we are well on our way of, in the medium- to long-term increasing our portfolio value to R10 billion through acquisitions, unlocking value in existing assets, and disposing of underperforming non-core properties.
Of the R2,2 billion worth of acquisitions concluded since listing, 76% (R1,7 billion) has been successfully transferred or is in the process of transferring.
To kick start enhancement of our own portfolio, the new year will see a strategic programme of refurbishment and development of existing properties being implemented (see the below list of planned refurbishments).
Refurbishments, redevelopments and extensions
property sector location gla (m2)
refurbishment/ redevelopment and extensions
Value(r’000)
yield% status
Kopanong RetailTembisa, Gauteng 4 024
Refurbishment/ Extension 5 000 9,4 WIP
Score Ivory Park RetailIvory Park, Gauteng 1 504
Refurbishment/ extension 4 000 9,5 WIP
6 Old Pretoria Main Road Retail
Midrand, Gauteng 5 760 Redevelopment 23 000 9,0 Conceptual
Belle Ombre RetailPretoria, Gauteng 7 838 Refurbishment 16 000 10,0 Conceptual
Bochum Plaza RetailBochum, Limpopo 11 557 Extension 4 000 10,2 In progress
Range Road Blackheath Industrial
Kuilsriver, Western Cape 10 979
Extension/refurbishment 25 000 9,0 WIP
Crownwood Corner (formerly Metcash) Office
Ormonde, Gauteng 7 273
Redevelopment/ Refurbishment 20 000 9,0 Conceptual
total 97 000 9,26
These are expected to be completed at an overall average yield of 9,26% and will all be tenant driven. We expect to roll them out over approximately 24 months.
The average size of our assets is also increasing in line with our intention to increase our minimum size to R40 million per property. After implementing all transactions which is anticipated over the next 15 months from this financial year, our average value per property will move from R21 million to R23,5 million, from about R12 million at listing (effectively doubling).
The table overleaf also reflects the average size of acquisitions to be around R95 million in comparison to R12 million at listing whilst the average size of acquisitions was in excess of 10 000m2 compared to roughly 2 500m2 at listing.
We believe that this is a clear demonstration of our strategy being implemented successfully.
lead
ership

36 DIPULA INCOME FUND Integrated Annual Report 2013
Demonstration of post implementation Portfolio
per prospectus –august 2011
(actual) acquisitions disposals
postimplementation
of the acquisitions(anticipated)
Number of properties 175 23* 14# 184Total GLA (m2) 436 629 244 630 20 156 661 103Total value (R’000) 2 109 000 2 204 177 29 946 4 283 231Average property size (m2) 2 495 10 636 1 440 3 593Average property value (R’000) 12 051 95 834 2 139 23 278Average value per m2 R4 830 R9 010 R1 486 R6 479
*Blouberg and Bochum accounted for as one property# Excluding non-transferred properties
The portfolio improvement strategy is also clearly evident in the quality of our tenants as reflected in the tables below, which indicate that we earn 85% of our income from A and B graded tenants in GLA terms and 83% in income terms. This quality of income is expected to increase the resilience of the portfolio, especially during challenging economic times.
Tenant grading in GLA terms
tenant profile by gla industrial office retail total gla
% of total gla
% of total
tenants
A Grade 49 868 89 148 181 581 320 597 66 34,7B Grade 52 793 15 092 22 586 90 470 19 20,7C Grade 14 007 5 900 53 106 73 013 15 44,6
484 080* 100 100,0
* Based on occupied space
Tenant grading in income terms
tenant profile by rental income industrial office retail
total income
% of total
income
% of total
tenants
A Grade 2 103 633 7 501 318 12 202 249 21 807 200 69 34,7B Grade 1 567 164 1 085 992 1 866 350 4 519 505 14 20,7C Grade 483 857 364 295 4 355 602 5 203 754 17 44,6
31 530 459# 100 100,0# Based on projected monthly income
Ceo’s report (continued)

37DIPULA INCOME FUND Integrated Annual Report 2013
Our key deliverables from our asset management team cover the major risk areas which include: • Continuing along the acquisition path• Lengthening of the lease expiry profile• Improving and retaining the quality of tenants• Improving property management processes and systems• Enhancing the energy efficiency of buildings• Controlling expenses without compromising the quality of the portfolio.
In FY2014 we will also be looking to diversify our sources of debt finance as we aim to reduce the overall funding rate over the medium term. Further, we intend to improve the tradability and liquidity of our units (or shares since conversion to a REIT) with a view to the inclusion of Dipula in the SA Listed Property Index.
oUr portfolioOur portfolio comprises 176 properties with a total GLA of 550 656m2. (A small adjustment was made to GLA during the year of 1 488m² due to re-measurements.) We are well diversified geographically and sectorally, with a weighting towards Gauteng – 74% of total GLA – and towards the retail sector – 53% of total GLA and 54% of rental income.
lead
ership
SECTORAL PROFILE by rental income (%)
Retail 54% Of�ces 32% Industrial 14%
SECTORAL PROFILE by retable area (%)
Retail 53% Of�ces 24% Industrial 23%
GEOGRAPHIC PROFILE by GLA (%)
Gauteng 73,8% KwaZulu-Natal 5,0% Limpopo 4,6% Free State 4,0% Mpumalanga 2,3% Eastern Cape 4,3%Western Cape 4,2% North West 1,4%Northern Cape 0,4%
GEOGRAPHIC PROFILE by Gross rental income (%)
Gauteng 72,5% KwaZulu-Natal 7,6% Limpopo 5,6% Free State 4,5% Mpumalanga 2,9% Eastern Cape 2,9%Western Cape 2,1% North West 1,6%Northern Cape 0,3%
sectoral profile by:gla (%) gross rental income (%)
geographic profile by:gla (%) gross rental income (%)

38 dipUla inCome fUnd Integrated Annual Report 2013
The portfolio is currently delivering above infl ation escalations of 7,9% by income and 7,5% by rentable space as refl ected in the table below.
Weighted average lease escalations retail industrial offi ces total
By income 7,73% 7,54% 8,35% 7,88%By GLA 7,48% 7,33% 7,57% 7,46%
Our overall average rental by income is at R83,15 and R67,77 by GLA, thus indicating potential for some upside on lease renewals into the future, assuming no serious adverse economic shocks.
Weighted average gross rental m2 retail industrial offi ces total
By income 83,68 39,43 100,84 83,15By GLA 73,97 37,12 85,77 67,77
We are pleased with the work of our leasing team, who managed to reduce vacancies by 13% year-on-year, with sterling work delivered on the industrial portfolio (24% reduction) and retail portfolio (15%). Clearly the concern remains in the offi ce portfolio, which even with some well let acquisitions remained stable year-on-year. Management has implemented some interventions which will hopefully yield positive results in FY2014.
reducing vacancies under controlVacancy august 2013 (%) Vacancy august 2012 (%)
Ceo’s report (continued)
RetailOf�ces
Industrial
VACANCY August 2013 (%)
7%8%
15%
RetailOf�ces
Industrial
VACANCY August 2012 (%)
9%11%
15%

39DIPULA INCOME FUND Integrated Annual Report 2013
lead
ership
Currently our top 20 properties as listed below are 48% of the value of our portfolio and our top 10 tenants contribute towards 43% of our income whilst making up 37% of our let space.
Top 20 properties
building name regionproperty type gla (m2)
Value as at 31 august
2013 (r’000) major tenants
no of tenants
SAPS VIP Gauteng Office 21 478 248 000 Dept Public Works 1
Gezina Galleries Gauteng Retail 16 669 159 330 Shoprite Checkers 42
Nquthu PlazaKwaZulu- Natal Retail 14 912 149 700
Shoprite Checkers, Cashbuild 46
SAPS IJS Gauteng Office 7 874 122 000 Dept Public Works 2
ZiyabuyaEastern Cape Retail 14 584 116 000
Total SA, Shoprite Checkers 38
Bochum Plaza Limpopo Retail 11 558 114 700Pick n Pay Retailers, Cashbuild 33
Woodmead Super Value Centre Gauteng Retail 7 169 104 660 Moresport 16
ABSA Home Loans Gauteng Office 5 048 86 000 ABSA Bank 1
Sterkolite Building Gauteng Industrial 12 782 79 000 Dept Public Works 1
Shoprite Pretoria North Gauteng Retail 6 442 76 640 Shoprite Checkers 1
Belle Ombre Gauteng Retail 7 829 73 200Freedom Supermarkets 34
Blackheath Pavilion Gauteng Retail 6 270 70 500 Moresport 19
274 Beyers Naude Drive Gauteng Retail 3 784 59 800Summit Auto Holdings (VW South Africa) 1
Boardwalk Place Midrand Gauteng Office 6 455 58 900National Youth Development Agency 2
Palm Court Gauteng Retail 6 284 55 500 Spar 32
Welkom High Park Building Free State Retail 7 510 48 300 Dept Public Works 14
Orange Farm Phase 1 Gauteng Retail 5 591 43 300Pick n Pay Retailers, Cashbuild 3
Finance House Gauteng Office 7 631 43 200Victor Air, Keypunch properties 26
Kopanong Gauteng Retail 3 950 40 600 Pick n Pay Retailers 19
Nemisa Gauteng Office 3 600 40 000 Nemisa 1
177 420 1 789 330 332

40 DIPULA INCOME FUND Integrated Annual Report 2013
Top 10 tenants
tenant gla (m2)
Department of Public Works 55 668
Shoprite Checkers 26 785
Pick n Pay Retailers 19 371
Absa Bank 16 215
Standard Bank 14 080
Ellerine Furnishers 12 306
Edcon Group 10 767
Cashbuild South Africa 9 105
JD Group 8 505
Ekurhuleni Metropolitan Municipality 8 273
181 075
tenant gla (m2) %
Top 10 by GLA 181 074 37,4
Top 20 by GLA 245 304 50,7
Top 30 by GLA 283 037 58,5
tenant rental income
(r)
Department of Public Works total 5 106 654
Absa Bank 1 770 560
Shoprite Checkers 1 661 965
Pick n Pay Retailers 1 085 069
Standard Bank 950 967
Edcon Group 678 868
Ellerine Furnishers 632 758
Pepkor Retail Limited 587 196
Cashbuild South Africa 479 359
Summit Auto Holdings (VW South Africa) 468 512
13 421 908
tenantrental income
(r’000) %
Top 10 by rental income 13 422 42,6
Top 20 by rental income 16 932 53,8
Top 30 by rental income 18 651 59,2
Ceo’s report (continued)

41DIPULA INCOME FUND Integrated Annual Report 2013
aCqUisitions and disposals
Year on year change in portfolio
sector
Value of portfolio at 31 august
2012(r’000)
2013 acquisitions
at cost(r’000)
2013 sales(r’000)
Value at 31 august
2013
(r’000)
Change inportfolio
value %
Industrial 364 739 78 000 (11 320) 449 625 23,3Office 631 224 469 000 (2 600) 1 153 905 82,8Retail 1 449 868 601 197 (13 925) 2 149 714 48,3
grand total 2 445 831 1 148 197 (27 845) 3 753 244 53,5
The table above is a reflection of our acquisition and disposal activity in FY2013.
The table below reflects our 10 largest vacancies at year-end. Some of these vacancies were let post year end and strategies are in place to move the space. Any significant movement in major vacancies will result in income growth upside in FY2014.
building name region property type gla (m2) Vacancy (m²)
360 Pretoria Avenue Gauteng Office 4 185 4 185
Finance House Gauteng Office 7 631 4 038
Range Road Blackheath Western Cape Industrial 10 979 3 479
Perm Kempton Park Gauteng Office 3 528 2 771
Cavaleros Malvern Gauteng Industrial 3 750 2 681
Atlas Road Gauteng Retail 3 202 2 677
1 President Street, Germiston Gauteng Retail 2 571 2 571
African Magnet Gauteng Industrial 2 673 2 208
BMW Gauteng Retail 1 847 1 847
Standard Bank Isando Gauteng Retail 1 824 1 824
lead
ership

42 DIPULA INCOME FUND Integrated Annual Report 2013
Ceo’s report (continued)
sector
gla at 31 august
2012
2013 acquisitions
gla adjustments2013
sales gla
gla at 31 august
2013
Change in portfolio
gla%
Industrial 120 077 12 782 11 (4 695) 128 175 7Office 97 524 37 671 200 (2 794) 132 601 36Retail 243 557 59 670 (1 699) (11 648) 289 880 19
grand total 461 158 110 123 (1 488) (19 137) 550 656 19
The properties acquired during the year, valued at R1,1 billion, are fully let. The properties were acquired at an average yield of 9,9% which contributed positively to the increases in revenue and net operating profit.
During the year we disposed of 13 non-core properties for R27,8 million in line with our strategy. Many of these went to small business owners. Specifically the following properties were sold:
building name location regionproperty type
gla (m2)
Vacancy (m2)
Cap rate%
disposal proceeds
(r’000
Attie Fourie Place, Vanderbijlpark
50 Attie Fourie Street, Civic Centre Vanderbijlpark, Gauteng Gauteng Retail 915 915 11,00 1 000
Beares Amanzimtoti
13 Bjorseth Crescent, Amanzimtoti, Kwa-Zulu-Natal
Kwa-Zulu-Natal Retail 1 384 462 12,00 1 900
Metro Koringpunt
Ptn of Farm Zebediela Location, 123 Koringpunt, Limpopo Limpopo Retail 1 200 1 200 11,50 600
Odendaalsrus Centre
47 van der Vyver Street, Odendaalsrus, Free State Free State Retail 1 055 355 12,00 675
Palm Street 1 Phalaborwa
14 Palm Street Phalaborwa, Limpopo Limpopo Retail 935 0 13,00 1 400
Princess Geenrich Benoni
1321 Princess Street, Gauteng Gauteng Retail 1 400 0 11,00 2 100
Princess Jones Benoni
Corner Tom Jones and Princess Avenue, Gauteng Gauteng Retail 1 141 537 11,00 3 650
Standard Bank Amanzimtoti
10 Bjorseth Crescent, Amanzintoti, Kwa-Zulu-Natal
Kwa-Zulu-Natal Office 783 783 12,00 1 600
Perm Springs74, 3rd Street, Springs, Gauteng Gauteng Office 2 011 2 011 12,00 1 000

43DIPULA INCOME FUND Integrated Annual Report 2013
lead
ership
building name location regionproperty type
gla (m2)
Vacancy (m2)
Cap rate%
disposal proceeds
(r’000
Saficon Motor Holdings – Drieh
32 Rose Innes Road, Germiston, Gauteng Gauteng Industrial 1 894 1 894 12,00 5 400
Saficon Motor Holdings – Germiston
54 President Street, Gauteng Gauteng Industrial 1 927 1 440 12,00 1 550
Sandvale Centre3 Sandvale Road, Isando, Gauteng Gauteng Industrial 874 – 11,00 4 370
Victoria & Knox Streets, Germiston
236 Victoria Street, Germiston, Gauteng Gauteng Retail 3 618 936 11,50 2 600
19 137 10 533 27 845
A further 16 properties valued at R112 million have been identified for sale.
The acquisitions and disposals within the portfolio resulted in a net increase of one property to take the total portfolio to 176 properties at year-end with a total GLA in excess of 550 000 m2. Over the medium to long term our portfolio should reduce in number but increase in average value.
letting aCtiVityNew leases worth R86 million were concluded during the year and renewals of R148 million were secured. Tenant retention is at 76% with a high replacement rate for vacating tenants. We have a positive rental income rate on renewals of 10% and an average (weighted) lease escalation of 7,9%, which is ahead of inflation.
Management is closely monitoring the 138 269m² of GLA which expires in the year ahead and are engaging in renewal negotiations accordingly
new deals retail industrial offices total
Number of leases 61 21 20 102Value of leases (R’000) 44 713 35 830 5 474 86 018Weighted average gross rental (Rm²) 64,40 32,61 74,05 45,57Total GLA let (m²) 12 231 23 101 2 416 37 748Weighted average escalation (%) 8,7 8,2 6,4 8,5
renewals retail industrial offices total
Number of leases 73 10 33 116Value of leases (R’000) 89 269 13 053 45 766 148 089Average gross rental expiry (Rm²) 65,79 35,73 65,73 59,38Average gross rental new (Rm²) 72,63 37,75 73,12 65,38Total GLA let (m²) 28 877 13 896 22 546 65 319Weighted average escalation (%) 8,5 9,2 9,3 8,3Average increase in renewal rate (%) 10,4 5,7 11,2 10,1

Our strong balance sheet positions the group to advance on this path and we will focus on maintaining its stability in the year ahead. We intend to further diversify our sources of funding. To this end a credit rating will enable us to launch a debt capital markets programme.
From a portfolio perspective we will concentrate on innovative tenant retention strategies to ameliorate our lease expiry profi le. While aggressive leasing of vacant space will lead to income growth upside potential, tenant retention costs will increase given the need for amongst other factors, broker incentives. We will also investigate non-GLA income opportunities.
Looking beyond our business, a key objective for the year ahead will be to launch new practical and impactful CSI initiatives.
While acquisitions and new tenanting present income growth opportunities, slow economic growth locally, high municipal costs and electricity tariff hikes remain concerning. Taking this into account, and excluding the Ideas portfolio, management expects distribution growth of 7% to 8% for FY2014.
thanksI extend my thanks to our management team and our property managers and all their staff for their hard work and commitment that have seen Dipula continue from strength to strength. I also thank my fellow directors for their support and guidance.
izak petersen CEO
Ceo’s report (continued)
44 dipUla inCome fUnd Integrated Annual Report 2013
debt management and gearingWe signifi cantly strengthened our balance sheet in the year with new debt facilities of R410 million and a successful equity capital raising which grossed R650 million. Gearing remained level year-on-year at 38%. A further R200 million equity investment has been raised post year-end.
Total debt facilities amount to R1,8 billion. Our debt expiry profi le of 3.3 years, with a blended rate of 7,9% at year-end (8,4% post year-end), sees R506 million of external borrowings falling due in the next 20 months. This is the most expensive debt on our balance sheet at 2.38bps margin above Jibar. We believe that given our current size the group will be better positioned to leverage our increased scale and more advanced stage of growth to secure improved rates when refi nancing this component of our debt. Post year-end 74% of debt has been fi xed.
property managementOur property management teams are to be commended that despite diffi cult market conditions during the year there were no material bad debts recorded.
Initiatives were introduced to improve on property management. These include the installation of the MDA property management system to streamline our systems and the acquisition of asset management models to improve effectiveness in the business. The implementation of the systems will be undertaken with effect from January 2014
goals for 2014We will continue with our growth strategy, both through acquisitions and execution of our refurbishment and redevelopment plans. R97 million refurbishments are planned for 2014 to 2015 at an average yield of 9,26%. The majority are tenant-driven and therefore represent limited income dilution risk. Funding will be through a combination of debt and equity fi nance.

45dipUla inCome fUnd Integrated Annual Report 2013
lead
ership

4646
finanCial direCtor’s report
The year ended 31 August 2013 marks Dipula’s third year as a listed entity and the last as a property loan stock company. Dipula has become a REIT with effect from 1 September 2013.
brigitte de bruyn
distribUtable inCome During the 12 months ended 31 August 2013 Dipula achieved total distribution growth per unit of 7,0% over the prior comparable period. This is in line with management’s previous guidance at the interim reporting period of between 6,5% and 7,5%.
The total distribution attributable to the A-linked units of 83,338 cents (2012: 79,37 cents) per unit includes 41,669 cents (2012: 39,685 cents) for the fi nal distribution, which equates to the 5% preferred increase on the prior year.
The total distribution attributable to the B-linked units of 66,639 cents (2012: 60,821 cents) per unit includes 36,835 cents (2012: 33,08 cents) for the fi nal distribution, which equates to an 11,4% increase on the prior year.

47DIPULA INCOME FUND Integrated Annual Report 2013
statement of distribUtable inCome2013
auditedr’000
2012AuditedR’000
Variance
Rental income 338 301 300 731 12Property expenses (70 136) (58 080) (21)
net property income 268 165 242 651 11Other income 13 276 – 100Administration and corporate costs (14 244) (11 757) (21)
Asset management fees (8 763) (7 240) (21) Corporate costs (5 481) (4 517) (21)
net operating income 267 197 230 894 16Net interest paid (61 822) (65 209) 5
profit after interest 205 375 165 685 24Lease cancellation income distributed (not distributed) 9 511 (19 003) 150Debt raising fees 330 – 100Pre-acquisition income – 1 265 (100)distributable income 215 216 147 947 45
A-linked units 119 590 83 761 43 B-linked units 95 626 64 186 49
property expenses as a % of revenue 20,7 19,3
rental inComeRental income includes gross rental revenue and recoveries of rates and operating costs, excluding VAT.
2013audited
r’000
2012AuditedR’000
Variance%
Gross rentals 307 438 252 597 22Turnover rental 2 391 1 657 44Lease cancellation settlement 2 876 22 663 (87)Rates recoveries 18 483 16 833 10Operating cost recoveries 7 113 6 981 2
338 301 300 731 12
During the period under review, R1,1 billion worth of properties were acquired and transferred. These properties were acquired at an aggregate yield of 9,9% which contributed positively to the increases in revenue and net operating profit.
In the prior year Dipula received a R22,5 million lease cancellation settlement from Metcash in respect of the cancellation of a five year lease.
The lease cancellation amount related to 26 months of rental of which R3,5 million was distributed in 2012. In the current year, R9,5 million was distributed as it relates to rentals that would have been earned for 2013, had the lease not been cancelled. The remaining R9,5 million will be distributed in 2014.
lead
ership

48 DIPULA INCOME FUND Integrated Annual Report 2013
net property eXpenses2013r’000 % of total
2012R’000 % of total
recoveries
Municipal recoveries (72 443) (40 494)Other recoveries (3 452) (3 302)total recoveries (75 895) (43 796)expenses
Municipal expenses 99 837 68 63 833 63Property management 10 875 8 8 203 8Security 8 883 6 6 190 6Repairs and maintenance 7 933 5 6 361 6Tenant installations 3 126 2 5 760 6Letting commissions 2 642 2 2 727 3Insurance 2 628 2 2 222 2Cleaning 2 559 2 2 231 2Garden maintenance 1 026 1 812 1Other 6 522 4 3 537 3
total expenses 146 031 100 101 876 100
net property expenses 70 136 14 284
Municipal recoveries and municipal expenses have increased with the enlarged portfolio and the increased electricity recovery and expense resulting from the migration to an internally managed electricity administration function.
The recovery of municipal expenses has increased to 91,1% (2012: 89,8%). The majority of water, sewer and waste expenses were recovered. All other property related expenditure has increased in line with the enlarged property portfolio.
other inCome2013r’000
2012R’000
Net rental guarantee received 9 000 5 000Development project recoveries 3 500 0Suretyship fee 600 0Other 176 0
13 276 5 000
asset management feesAsset management fees were paid to Dipula Asset Management Trust. Fees are charged at 0,3% of enterprise value and the increase is attributable to an increase in the unit prices of both the A-linked and B-linked units and an increase in debt as a result of acquisitions of R1,1 billion. R0,8 million of management fees were capitalised to buildings that were being redeveloped.

49DIPULA INCOME FUND Integrated Annual Report 2013
lead
ership
net interest paidFinance income included R13,6 million of antecedent income relating to the private placement.
The weighted average cost of debt reduced from 8,39% in 2012 to 7,96% in 2013 mainly as a result of the fact that at year-end 50% of the borrowings were not fixed. Subsequent to year-end, 74% of the borrowings have been fixed and the weighted average cost of debt is currently 8,4%.
eXtraCts from the statement of finanCial position2013
auditedr’000
2012AuditedR’000
assetsnon-current assets 3 779 817 2 441 968
Investment property at fair value 3 722 994 2 393 486 Goodwill 48 482 48 482 Other non-current receivables 8 341 –
Current assets 88 071 188 665
Trade and other receivables 33 983 25 310 Loan to related party – 1 202 Cash and cash equivalents 54 088 162 153
non current assets held-for-saleInvestment property held-for-sale 30 250 54 987
total assets 3 898 138 2 685 620
eqUity and liabilitiesequity 753 902 554 630
Stated capital 427 852 427 852 Reserves 326 050 126 778
non-current liabilities 2 974 791 1 848 872
Debentures 1 499 420 900 629 Interest-bearing liabilities 1 475 371 906 562 Deferred taxation – 41 681
Current liabilities 169 445 282 118
Trade and other payables 56 793 46 120 Linked unitholders for distribution 112 652 76 790 Interest-bearing liabilities – 159 208
total equity and liabilities 3 898 138 2 685 620
Number of A-linked units in issue 143 499 683* 105 532 393*Number of B-linked units in issue 143 499 683* 105 532 393*Net asset value per A-linked unit (cents) 785,13 689,48Net asset value per B-linked unit (cents) 785,13 689,48
* Excluding treasury linked units

50 DIPULA INCOME FUND Integrated Annual Report 2013
inVestment propertyr’000
Opening balance 2012 2 393 486 Closing balance 2013 3 722 994
movement for the year 1 329 508
The movement for the year can be detailed as follows:Acquisitions/additions 1 169 182 Transferred to non-current assets held-for-sale (24 000)Transferred from non-current assets held-for-sale 19 300 Change in fair value 126 887 Net movements in tenant installations and lease commissions 1 720 Straight-line rental income accrual 36 419
movement for the year 1 329 508
The group’s property portfolio was valued in terms of its valuation policy as at 31 August 2013. Properties with values greater than R8,0 million were independently valued and properties with values below R8,0 million were valued by the directors and verified by an independent valuer. The net increase in the value of the property portfolio was R126,9 million.
goodWillr’000
Opening balance 2012 –Closing balance 2013 –
movement for the year –
Goodwill relates to the acquisition of Mergence and Asakhe in August 2011. There was no goodwill impairment for the year.
trade and other reCeiVablesr’000
Opening balance 2012 25 310 Closing balance 2013 33 983
movement for the year 8 673
The provision for impairment is R5,9 million (2012: R6,6 million) and represents 25% (2012: 48%) of the arrears at year-end. Included in trade receivables are R6,9 million trade debtors of properties that were transferred shortly before year-end and were still subject to finalisation of the adjustment accounts. In the opinion of management, the current provision is conservative and arises as a result of the tough trading conditions currently being experienced country and world-wide. Refer to note 7 to the annual financial statements for an analysis of amounts included in other receivables.

51DIPULA INCOME FUND Integrated Annual Report 2013
loan to related partyr’000
Opening balance 2012 1 202Closing balance 2013 –
movement for the year (1 202)
The loan advance to Dijalo Property Services (Pty) Ltd was repaid in full in September 2012.
Cash and Cash eqUiValentsr’000
Opening balance 2012 162 153 Closing balance 2013 54 088
movement for the year (108 065)
The movement cash flow can be detailed as follows:Generated by operations 268 549 Net interest paid (59 362)Taxation paid (28)Linked unit distributions paid (179 354)Investments (1 143 180)Funding raised 1 005 310movement for the year (108 065)
non-CUrrent assets held-for-saler’000
Opening balance 2012 54 987 Closing balance 2013 30 250
movement for the year (24 737)
The movement for the year can be detailed as follows:Properties sold and transferred (29 437)Property transferred back to investment property (19 300)Properties transferred from investment property 24 000
(24 737)
lead
ership

52 DIPULA INCOME FUND Integrated Annual Report 2013
property name sectorgla
m2
sale pricer’000
Alcom House Office 1 350 16 500Hazelwood Place Pretoria Office 895 7 500Perm Kempton Park Office 3 528 4 850Virgin Active Portion of land included with Virgin Active Retail 0 1 400
5 773 30 250
Capital strUCtUrer’000
Stated capital 906 562
Debenture capital 1 475 371
movement for the year 2 381 933
Dipula’s equity capital is issued in the form of a linked share and debenture. Debentures are indivisibly linked to ordinary shares so that unitholders are one and the same persons, holding their shares and debentures in the form of linked or combined units that cannot be traded on the JSE other than as linked units. Dipula has A-linked and B-linked units in issue which carry different risk profiles.
The debentures are subordinated to all other claims and liabilities as far as payment of interest or capital is concerned.
Interest payable on the debentures is calculated at a variable rate, relative to profits earned, after payment of all expenses,including interest payable on external borrowings.
Dipula’s management therefore regard the debentures as an integral part of the company’s capital structure, even though under IAS 32 debentures are classified as part of non-current liabilities.
The increase resulted from the issue of linked units during the year.
In line with Dipula conversion to a REIT, the current capital structure will be revised with the debentures being derecognised and forming part of the equity of the Fund.
non-CUrrent interest-bearing borroWingsr’000
Opening balance 2012 906 562 Closing balance 2013 1 475 371
movement for the year 568 809

53DIPULA INCOME FUND Integrated Annual Report 2013
The facilities from Standard Bank and Nedbank have increased in line with the increase in investment properties.
The current facilities at the date of this report are as follows:
provider and type of loan
facilityr’million
Utilisedamount
r’million expiryfixed
rate
marginover
jibar for floating facility
ratebelow
prime forfloatingfacility
Standard Bank – Fixed 506,7 506,7 2015 8,63%Standard Bank – Fixed 100,0 100,0 2016 9,26%Standard Bank – Floating 117,2 117,2 2016 2,38%Standard Bank – Floating 99,4 99,4 2016 0,95%Standard Bank – Floating 23,5 20,9 2018 1,9Standard Bank – Fixed 46,4 46,4 2018 9,16%Standard Bank – Floating 11,6 11,6 2018 2,0Standard Bank – Fixed 89,5 89,5 2016 8,34%Standard Bank – Floating 22,3 22,3 2016 1,7Standard Bank – Fixed 89,5 89,5 2018 9,06%Standard Bank – Floating 22,3 22,3 2018 1,9Nedbank – Fixed 125,0 125,0 2017 8,95%Nedbank – Fixed 108,6 108,6 2018 9,31% 1,45Nedbank – Floating 108,6 108,6 2018Nedbank – Unutilised 182,8 – 5 years from date of first drawdownNedbank – Unutilised 22,8 – 5 years from date of first drawdownNedbank – Unutilised 91,8 – 5 years from date of first drawdownNedbank – Unutilised 27,2 – 5 years from date of first drawdownNedbank – Unutilised 31,7 – 5 years from date of first drawdownOther non-bank 11,1 11,10 2027 6,50%
1 838,0 1 479,1
The average all-in rate for borrowings at 31 August 2013 was 7,96% as 50% of the borrowings were not fixed. Subsequent to year-end the all-in rate has moved to 8,41% and 74% of the facilities have been fixed.
lead
ership

54 DIPULA INCOME FUND Integrated Annual Report 2013
deferred taXation liabilityr’000
Opening balance 2012 41 681 Closing balance 2013 –
movement for the year (41 681)
The Fund’s application to the JSE Limited for REIT status was approved on 24 June 2013. The conversion to a REIT is effective from 1 September 2013. As such, the group will not be liable for capital gains tax in terms of section 25BB of the Income Tax Act. Deferred tax on investment properties and the related straight-line rental adjustment has been reduced to nil as capital gains tax will no longer apply.
CUrrent interest-bearing borroWingsr’000
Opening balance 2012 159 208 Closing balance 2013 –
movement for the year (159 208)
The R42 million bridging facility was settled by the proceeds of the equity raised in November 2012, the loans in respect of the McCormick properties were settled in November 2012 via Dipula drawing down on existing facilities with Standard Bank and Nedbank.
trade and other payablesr’000
Opening balance 2012 46 120Closing balance 2013 56 793
movement for the year 10 673
Refer to note 14 to the annual financial statements for an analysis of amounts included in trade and other payables.
finanCial direCtor’s report(continued)

55DIPULA INCOME FUND Integrated Annual Report 2013
lead
ership
transparenCY and aCCountabilitY
ethiCal leadership Dipula’s board aims to integrate responsible corporate citizenship and ethical values into the company’s growth strategy and daily operations in order to ensure sustainability. The Social and Ethics Committee, which is accountable to the board, is mandated to assist the board in this endeavour.
Dipula is guided by our vision and values (as encapsulated in our newly introduced Code of Ethics/Conduct) and principles outlined in our board and committee charters, all within the regulatory framework of the JSE Listings Requirements and King III. The company is fully committed, where practical and relevant for an organisation of our size and nature, to compliance with the Code of Corporate Practices and Conduct set out in the King III Report. Compliance with King III is detailed in the King III checklist available on Dipula’s website and discussed in brief with regard to exceptions and Chapter 2 on page 60.
goVernanCe strUCtUre the board
responsibility The board remains responsible and accountable for the performance and affairs of the company, assisted by Exco and the Asset Manager.
members and meeting attendance
Executive directors I Peterson (CEO) B de Bruyn (FD) NS Gumede
Independent non-executive directorsZJ Matlala (Chairperson) BH Azizollahoff E Links Y Waja
Number of meetings (attendance)4 (4)4 (4)4 (4)
4 (4)4 (4)4 (4)4 (4)
nUmber of independent non-eXeCUtiVe direCtors
self-eValUation Completed
4/7 YES

56 DIPULA INCOME FUND Integrated Annual Report 2013
Committees
Audit and Risk committee(for the full report see page 85)
investment committee social and ethics Committee
responsibility The committee is responsible for reviewing the interim and annual financial statements, overseeing the compilation of the integrated annual report, the internal control framework and procedures, confirming and reviewing internal, financial and operational controls, reviewing risk management, reporting and compliance and reviewing the integrity of the integrated report. The committee monitors the outsourced internal audit and IT governance functions, and approves the appointment of the auditors for non-audit services.
The committee is responsible for assessing and approving acquisitions, large revamps and disposals within its delegated limits. Acquisitions,disposals and large revamps larger than its delegated limit are presented and recommended to the board by the committee.
The committee is responsible for initiating goals and reporting on safety, health and environment as well as responsible corporate citizenship, social responsibility, ethics, values and transformation.
members and meetings attendance
No. of meetings (attendance)
Y Waja (Chair) 4 (4)BH Azizollahoff 4 (4)E Links 4 (4)
I Petersen 8 (8)BH Azizollahoff (Chair) 8 (8)NS Gumede 8 (8)
No. of meetings (attendance)
E Links (Chair) 2 (2)BH Azizollahoff 2 (2)NS Gumede 2 (2)Y Waja 2 (2)
nUmber of independent non-eXeCUtiVe direCtors
3/3 1/3 3/4
self-eValUation Completed
YES YES YES
(The board and committee charters/Terms of Reference are available on www.dipula.co.za.)
mORE INFO
transparenCY and aCCountabilitY(continued)

57DIPULA INCOME FUND Integrated Annual Report 2013
hoW We operate
board
exco
diversified portfolio
dipula asset Management trust
property Managers
the board role and compositionThe board is the group’s highest decision-making body and is ultimately responsible for governance. The board charter sets out the board’s responsibilities. The board is accountable to unitholders for setting economic, social and environmental direction and the values to which the company adheres. It further determines investment and performance criteria and is responsible for the sustainability, compliance, control and ethical behaviour of the company. Further it is responsible for timely, relevant and meaningful reporting to stakeholders to provide a clear and objective view of the company and its activities.
During the year Dipula’s unitary board comprised seven directors, three of whom are executive and the remaining four of whom are independent non-executive, including board Chairperson ZJ Matlala. The independent non-executive directors are high merit individuals who objectively contribute a wide range of industry skills, knowledge and experience to the board’s decision-making process. These directors are not involved in the daily operations of the company and all
comply with the definition of independent as contained in King III.
The board meets at least four times a year with ad hoc meetings when necessary to review matters including strategy planning, financial performance, risk, capital expenditure, standards of conduct, transformation, diversity and environmental management. Details of attendance are set out on pages 55 and 56.
The group’s memorandum of incorporation provides for one-third of the directors to retire by rotation after a three-year term of office. Accordingly, ZJ Matlala and Y Waja will retire at the upcoming annual general meeting and, being eligible, will stand for re-election.
tran
sparen
Cy a
nd
a
CC
oU
nta
bility

58 dipUla inCome fUnd Integrated Annual Report 2013
Chairperson and Ceo The responsibilities of the Chairperson and CEO, and those of other independent non-executive and executive directors, are clearly separated to ensure a balance of power and prevent any one director from exercising unfettered decision-making. The Chairperson provides leadership to the board in all deliberations ensuring independent input, and oversees its efficient operation. The CEO is responsible for proposing, updating, implementing and maintaining the strategic direction of Dipula as well as ensuring appropriately supervised and controlled daily operations. In this regard, the CEO is assisted by the Financial Director and the Asset Manager.
reviews and evaluation The performance and effectiveness of the Chairperson is evaluated annually by the board, and the CEO’s by the Chairperson or a sub-committee appointed by the board. The board as a whole is self-evaluated and individual directors’ performances are also reviewed periodically.
share dealings and conflicts of interestsDirectors are required to disclose their shareholdings, additional directorships and any potential conflicts of interest as well as any share dealings in the company’s securities to the company secretary who, together with the sponsor and CEO, ensures publication of their dealings in Dipula on SENS.
The company operates a policy (in compliance with JSE Listings Requirements) of prohibiting dealings by directors and certain other managers including prescribed officers in periods immediately preceding the announcement of its interim and year-end financial results, any period while the company is trading under cautionary announcement, and at any other time deemed necessary by the board. The directors and all other relevant persons are informed by email when the company enters a “closed period”.
succession planning In terms of succession, management has followed a strategy of ensuring that there are, where practical, strong support structures in place for key members of the management team, including executive directors being able to deputise for each other (for a limited period) in event of this being necessary.
director’s remuneration A Remuneration Committee is in the process of being established. All board members are members of the committee. The executive directors are employed and remunerated by the Asset Manager and accordingly a nomination committee would have a limited role. Non-executive directors’ fees are approved by the board and Dipula unitholders at the annual general meeting.
appointment, induction and ongoing educationDirectors’ appointments are formal and transparent, and currently undertaken by the board as a whole. At this stage a separate nomination committee is not considered necessary.
A formal orientation induction programme for new directors is in place. All new directors are familiarised with company operations, senior management and its business environment. Those with no or limited board experience will receive additional development training to inform them of their duties, responsibilities, powers, and potential liabilities.
Directors receive further briefings from time to time on relevant new laws and regulations as well as on changing economic risks. Directors are responsible for ensuring that they have a working understanding of applicable laws.
access to information and resourcesDirectors’ access to company records, information, documents and property is unrestricted and information in respect of key performance indicators, variance reports, risks and industry trends is provided prior to board meetings.

tran
sparen
Cy a
nd
a
CC
oU
nta
bility
59dipUla inCome fUnd Integrated Annual Report 2013
Company secretaryThe company secretary, Probity Business Services Proprietary Limited, is an independent company secretarial practice. The company secretary provides the board as a whole and directors individually with detailed guidance as to how their responsibilities should be properly discharged in the best interests of the company. The company secretary provides a central source of guidance and advice to the board, and within the company, on matters of ethics and good corporate governance.
The board considers the appointed representative, Neville Toerien, sufficiently qualified and skilled to act in accordance with, and update directors in terms of, the recommendations of the King III Report and other relevant regulations and legislation. The board is satisfied that an arm’s length relationship is maintained between the company secretary and the board and board sub-committees.
board committees The board has delegated certain functions to the Audit and Risk Committee, the Social and Ethics Committee, the Remuneration Committee and the Investment Committee. There is transparency and full disclosure from board committees to the board. Committee chairmen provide the board with a verbal report on recent committee activities and the minutes of committee meetings are tabled at board meetings (for information purposes). In addition, the chairmen of the committees or a nominated committee member attend the company’s annual general meeting to answer any questions from stakeholders pertaining to the relevant matters handled by their respective committees. The directors are satisfied that all committees have satisfied their responsibilities during the year. (See table on page 58 for further details.)
internal aUdit During the year a dedicated internal auditor (outsource basis) was appointed. The function reports directly to the Audit and Risk Committee and has unhindered access to the board Chairperson.

60 DIPULA INCOME FUND Integrated Annual Report 2013
ComplianCe frameWorkapplication of king iii
areas of non-compliance explanation of non-compliance
IT Governance The internal auditors are undertaking a high level overview of the IT controls in place to ascertain the areas which require redress
Risk-based (internal) audit This was introduced during the year and the first such audit is underway
Shareholders’ approval of the remuneration policy
As the executive directors are remunerated by the Asset Manager and Dipula does not have any direct employees, a policy is not considered necessary
Assurance of sustainability and disclosure This will be considered going forward
The full King III checklist is available on www.dipula.co.za. Compliance with King III Chapter 2 is set out below:
principle number description Compliance
Chapter 2: boards and directors
2.1 The board should act as the focal point for and custodian of corporate governance
The board is the focal point and custodian of corporate governance at Dipula. In accordance with the board charter it is committed to the highest standards of corporate governance.
2.2 The board should appreciate that strategy, risk, performance and sustainability are inseparable.
The board, in accordance with the board charter, and all committee terms of reference reviewed in line with King III, is responsible for aligning the strategic objectives, vision and mission with performance and sustainability considerations. The board is responsible for ensuring the integrity of the group’s risk management policies and procedures and internal controls.
2.3 The board should provide effective leadership based on an ethical foundation.
The board provides effective leadership and is committed to the highest levels of corporate governance as a key driver of sustainability.
2.4 The board should ensure that the company is and is seen to be a responsible corporate citizen.
See 2.1 above.

61DIPULA INCOME FUND Integrated Annual Report 2013
principle number description Compliance
2.5 The board should ensure that the company’s ethics are managed effectively.
The board has established a Social and Ethics Committee, which is tasked with ensuring that the company’s ethics are managed effectively. During the year the board approved and implemented a Code of Conduct/Ethics.
2.6 The board should ensure that the company has an effective and independent Audit Committee.
The board is satisfied that the Audit and Risk Committee is effective. The committee is chaired by an independent non-executive director. It further consists of two independent non-executive directors. All members are suitably qualified chartered accountants and/or experienced business leaders.
2.7 The board should be responsible for the governance of risk.
The board’s Audit and Risk Committee has conducted an evaluation of risk and is satisfied with the effective management of risk.
2.8 The board should be responsible for information technology (IT) governance.
Property management is fully outsourced to JHI and Broll both of which are ISO 9001: 2008 accredited.
2.9 The board should ensure that the company complies with applicable laws and considers adherence to non-binding rules, codes and standards.
The board ensures that the company complies with applicable laws and considers adherence to non-binding rules, codes and standards.
2.10 The board should ensure that there is an effective risk-based internal audit.
Property management is fully outsourced to JHI and Broll. Whilst these companies have their own internal audit divisions, Dipula executives, the Audit and Risk Committee and the Asset Manager are working with them to formalise the work performed and to ensure the risks identified by Dipula are addressed. Reporting of the internal audit division to the board is in addition being formalised.
2.11 The board should appreciate that stakeholders` perceptions affect the company’s reputation.
The board recognises the importance of developing and nurturing positive and stable relationships with key stakeholders as a key driver of business success. (See page 21.)
2.12 The board should ensure the integrity of the company’s integrated report.
The board continues to ensure that the integrated report endeavours to provide a true view of the company’s commitment that financial, social and environmental sustainability permeate the entire business.
tran
sparen
Cy a
nd
a
CC
oU
nta
bility

62 DIPULA INCOME FUND Integrated Annual Report 2013
principle number description Compliance
2.13 The board should report on the effectiveness of the company’s system of internal controls.
The board continuously ensures the soundness of the company’s system of internal controls.
2.14 The board and its directors should act in the best interests of the company.
The board acknowledges its role as a trustee on behalf of the unitholders.
2.15 The board should consider business rescue proceedings or other turnaround mechanisms as soon as the company is financially distressed as defined in the Act.
The board monitors the company’s solvency and liquidity. Business rescue has not been required.
2.16 The board should elect a chairman of the board who is an independent non-executive director. The CEO of the company should not also fulfil the role of chairman of the board.
The Chairperson, ZJ Matlala, is an independent non-executive director and the roles of CEO and Chairperson are clearly defined.
2.17 The board should appoint the CEO and establish a framework for the delegation of authority.
The board has appointed I Petersen as CEO and a delegation of authority framework is in place and reviewed regularly.
2.18 The board should comprise a balance of power, with a majority of non-executive directors. The majority of non-executive directors should be independent.
The board comprises a majority of independent non-executive directors – 4/7. The responsibilities of the Chairperson and CEO, and those of other non-executive and executive directors, are clearly separated to ensure a balance of power and prevent any one director from exercising unfettered powers of decision-making. The Chairperson provides leadership to the board in all deliberations ensuring independent input, and oversees its efficient operation. The CEO is responsible for proposing, updating, implementing and maintaining the strategic direction of Dipula as well as ensuring appropriately supervised and controlled daily operations. In this regard, the CEO is assisted by the Financial Director and one other executive director.
The independent non-executive directors are high merit individuals who objectively contribute a wide range of industry skills, knowledge and experience to the board’s decision-making process. These directors are not involved in the daily operations of the company.

63DIPULA INCOME FUND Integrated Annual Report 2013
principle number description Compliance
2.19 Directors should be appointed through a formal process.
A formal and transparent appointment process is in place. The entire board partakes in a formal and transparent process for the appointment of new board members, including that of the CEO. Dipula currently does not have a nomination committee as it is the board’s view that this is currently unnecessary. The development and implementation of nomination policies that would have been undertaken by a nomination committee will be undertaken by the board as a whole.
2.20 The induction of and ongoing training and development of directors should be conducted through formal processes.
The board has established a formal orientation programme to familiarise incoming directors with company operations, senior management and its business environment, and to induct them in their fiduciary duties and responsibilities.
2.21 The board should be assisted by a competent, suitably qualified and experienced company secretary.
Dipula employs the secretarial services of Probity Business Services Proprietary Limited, an independent company secretarial practice.
2.22 The evaluation of the board, its committees and the individual directors should be performed every year.
The performance and effectiveness of the Chairperson is evaluated annually by the board, and the CEO’s by the Chairperson or a sub-committee appointed by the board. The board as a whole is self-evaluated and individual directors’ performances are also reviewed periodically.
2.23 The board should delegate certain functions to well-structured committees but without abdicating its own responsibilities.
The board delegates certain functions without abdicating its own responsibilities to the following committees: • Audit and Risk Committee• Investment Committee• Social and Ethics Committee
2.24 A governance framework should be agreed between the group and its subsidiary boards.
All subsidiaries are wholly-owned and a governance framework is not necessary.
2.25 Companies should remunerate directors and executives fairly and responsibly.
The executive directors are remunerated by the Asset Manager and Dipula does not have any direct employees. Annual benchmarking of remuneration will be performed by the board.
tran
sparen
Cy a
nd
a
CC
oU
nta
bility

64 dipUla inCome fUnd Integrated Annual Report 2013
principle number description Compliance
2.26 Companies should disclose the remuneration of each individual director and prescribed officers.
The executives are remunerated by the Asset Manager. Non-executive directors’ fees are approved by the board and Dipula unitholders.
2.27 Shareholders should approve the company’s remuneration policy.
As the executive directors are remunerated by the Asset Manager and Dipula does not have any direct employees, a policy is not considered necessary.
risk managementRisk management is considered a key business discipline at Dipula. The main aim is to balance risk and reward and to protect the group against risk that could threaten the achievement of Dipula’s strategic objectives. This is achieved by identifying, assessing, managing and monitoring all practical risks to which the business is exposed. Included in this is continual focus on the level of borrowings and exposure to interest rate volatility.
The board has adopted an enterprise-wide approach to risk management that includes systems of internal control comprising of policies, procedures and information intended to safeguard assets and reduce the risk of fraud, error, loss and other irregularities, ensure the accuracy and completeness of accounting records and reporting, and ensure the timely preparation of financial statements and information in compliance with legislation and generally accepted accounting policies and practices.
responsibility
board audit and risk Committee exco asset manager
Overall responsibility for risk management
Identifies and manages risk on behalf of the board
Identifies risks together with the Audit and Risk Committee
Sets the level of risk toleranceSets the risk appetite
Interrogates ‘softer’ risks Monitors effectiveness of risk policy
Twice yearly reviews the risk matrix
Monitors risk in terms of asset management mandate from Dipula
Delegated identification and management of risk to the Audit and Risk committee
Oversees the monitoring and management of risk (by Asset Manager)
Day-to-day risk management including loss prevention and internal control framework
Measures qualitative risks in terms of year-on-year movement
Dipula’s risk management process is built on the following fundamentals:• Ethical leadership and an ethical business environment• Clear strategic objectives and business principles• Ongoing process of identification and review, including ongoing monitoring of factors that could
impact the risk profile• Processes in place for mitigating key risks to an acceptable level

65dipUla inCome fUnd Integrated Annual Report 2013
The Asset Manager’s performance criteria are outlined in the mandate agreement between Dipula and DAMT. The review of the Asset Manager’s performance relative to these KPIs is undertaken by Dipula’s independent non-executive directors. Risk monitoring is one such KPI.
During the year the annual formal risk assessment confirmed that Dipula is adequately addressing all identified risks.
tran
sparen
Cy a
nd
a
CC
oU
nta
bility

66 DIPULA INCOME FUND Integrated Annual Report 2013
bee sCoreCard
element 2013 score
Ownership 20,00Management control 9,51Employment equity n/aSkills development n/aPreferential procurement 13,08Enterprise development 10,00Socio-economic development 0,00Economic development 8,00
transforMation
Dipula is fully committed to the principles of transformation and continually seeks to ensure compliance. Securing a top ranking in terms of transformation forms part of our strategic focus.
oWnership and managementDipula ranks as one of the highest amongst its peers in terms of ownership. The management team is majority black while the Manco is 100% BEE at Level 1 in terms of the DTI Codes.
preferential proCUrementManagement ensures that goods and services are procured from BEE suppliers wherever practical. Dipula obtained top results in this category during its rating in 2013.
Csi and CommUnity UpliftmentIn the year ahead Dipula will be launching CSI initiatives aimed at benefiting local communities in which it operates as well as the broader society. To date Dipula has funded the Orange Farm Community Trust in order to enable it to acquire a stake in the Orange Farm Phase 2 Project.
bee sCorePost year-end Dipula obtained a level 3 BEE rating for 2013.
employment eqUity and skills deVelopmentThese two areas of the scorecard do not apply to Dipula as there are no direct employees and all management is outsourced to a third party Manco.
enterprise deVelopmentDipula will continue to seek appropriate opportunities in the development of emerging enterprises. During the year Dipula signed surety for SLD (Pty) Ltd, a significantly empowered emerging property developer.

We are committed to environmental safety and sustainability and membership of the Green Building Council will be considered in the future.
67dipUla inCome fUnd Integrated Annual Report 2013
enVironMental ConserVation
Dipula has embarked on a pilot project to assess preserving water and energy in its buildings. In addition the company encourages carbon friendly practices for all its new acquisitions.
tran
sparen
Cy a
nd
a
CC
oU
nta
bility

68 DIPULA INCOME FUND Integrated Annual Report 2013
portfolio in detail
building name location region acquisition dategla(m2)
Vacancy(%)
marketvalue as at31 august
2013(r’000)
averagegross rentals
r/m2
retail
Gezina Galleries Corner Frederick and 12th Streets, Gezina Gauteng 19/07/2013 16 669 – 159 330 100,69Nquthu Plaza Erf 4008 Nquthu, Manzolwande Drive, Nquthu KwaZulu-Natal 01/05/2012 14 912 – 149 700 85,49Ziyabuya Corner Uitenhage and Ralo Street, Kwadwesi Eastern Cape 25/07/2013 14 584 0,3 116 000 72,60Bochum Plaza Corner Dendron and Blouberg Road Limpopo 01/05/2012 11 558 3,1 114 700 84,73Woodmead Super Value Woodmead Drive, Woodmead Gauteng 31/07/2013 7 169 – 104 660 12,69Shoprite Pretoria North 251 Ben Viljoen Street, Pretoroa North Gauteng 15/07/2013 6 442 – 76 640 120,45Belle Ombre Corner Boom and Potgieter Street, Marabstad, Pretoria Gauteng 01/07/2011 7 829 – 73 200 83,16Blackheath Pavilion Pendoring Road, Blackheath Gauteng 15/07/2013 6 270 5,2 70 500 134,20274 Beyers Naude Drive 274 Beyers Naude Drive, Northcliff, Blackheath, Johannesburg Gauteng 01/07/2011 3 784 – 59 800 131,92Palm Court Corner JG Strydom and Fern Road, Weltervreden Park, Johannesburg Gauteng 01/07/2011 6 284 6,0 55 500 103,12Welkom High Park Building Corner Stateway and Bok Street, Sanlam Business Centre, Welkom Free State 25/04/2008 7 510 2,6 48 300 68,90Orange Farm Phase 1 Link Road, Orange Farm CBD Gauteng 20/12/2012 5 591 – 43 300 60,29Kopanong Malatsi Street, Ivory Park, Thembisa Gauteng 01/07/2011 3 950 – 40 600 115,57Woodmead Square Woodmead Drive, Woodmead Gauteng 31/07/2013 2 945 – 31 900 103,24PnP Kroonstad Corner President and Truter Streets, Kroonstad Free State 07/06/2007 4 563 3,6 29 000 45,76Score Vosloorust Sam Sekoti Avenue, Vosloorus Gauteng 31/05/2007 3 600 – 28 300 62,38Blackheath Galleries Corner Beyers Naude Drive and Mountain View Avenue, Blackheath,
JohannesburgGauteng 01/07/2011 3 667 19,9 28 200 95,83
Giyani Magistrate Street, Giyani Limpopo 01/07/2011 4 934 – 26 000 45,94Alberton Crossing Corner Voortrekker Road and Ring Road West, New Redruth Gauteng 07/06/2007 2 185 4,8 25 450 109,31Perm Building East London 42 – 46 Oxford Street, East London Eastern Cape 25/04/2008 3 473 25,6 23 000 113,79Virgin Active Horison View 38 Van Santen Drive, Horizon View, Roodepoort Gauteng 01/07/2011 2 500 – 21 100 70,45233 Bram Fisher Drive 233 Bram Fischer Drive, Randburg, Johannesburg Gauteng 01/07/2011 2 958 – 21 100 74,47Planet Fitness Montana 33 Tibouchina Street, Zambesi Drive, Montana Park, Pretoria Gauteng 01/07/2011 2 472 – 20 400 68,83Checkers Nigel Corner Main and Hendrik Verwoerd Streets Gauteng 25/04/2008 3 443 – 20 100 60,26Atlas Road Corner Atlas and Dunswart Road, Anderbolt, Boksburg Gauteng 01/07/2011 3 202 83,6 19 500 412,98Casey’s Auto Springs 140 – 2nd Street Gauteng 25/04/2008 6 884 – 19 300 26,08Ellerines Newcastle 54 Scott Street KwaZulu-Natal 25/04/2008 2 125 48,2 19 000 174,67Shoprite Westonarea Corner Edwards Avenue and Allen Street, Westonaria District,
RandfonteinGauteng 07/06/2007 2 576 – 19 000 62,35
ABSA Secunda Tropsch Plane Mpumalanga 25/04/2008 2 359 – 18 200 82,62

69DIPULA INCOME FUND Integrated Annual Report 2013
building name location region acquisition dategla(m2)
Vacancy(%)
marketvalue as at31 august
2013(r’000)
averagegross rentals
r/m2
retail
Gezina Galleries Corner Frederick and 12th Streets, Gezina Gauteng 19/07/2013 16 669 – 159 330 100,69Nquthu Plaza Erf 4008 Nquthu, Manzolwande Drive, Nquthu KwaZulu-Natal 01/05/2012 14 912 – 149 700 85,49Ziyabuya Corner Uitenhage and Ralo Street, Kwadwesi Eastern Cape 25/07/2013 14 584 0,3 116 000 72,60Bochum Plaza Corner Dendron and Blouberg Road Limpopo 01/05/2012 11 558 3,1 114 700 84,73Woodmead Super Value Woodmead Drive, Woodmead Gauteng 31/07/2013 7 169 – 104 660 12,69Shoprite Pretoria North 251 Ben Viljoen Street, Pretoroa North Gauteng 15/07/2013 6 442 – 76 640 120,45Belle Ombre Corner Boom and Potgieter Street, Marabstad, Pretoria Gauteng 01/07/2011 7 829 – 73 200 83,16Blackheath Pavilion Pendoring Road, Blackheath Gauteng 15/07/2013 6 270 5,2 70 500 134,20274 Beyers Naude Drive 274 Beyers Naude Drive, Northcliff, Blackheath, Johannesburg Gauteng 01/07/2011 3 784 – 59 800 131,92Palm Court Corner JG Strydom and Fern Road, Weltervreden Park, Johannesburg Gauteng 01/07/2011 6 284 6,0 55 500 103,12Welkom High Park Building Corner Stateway and Bok Street, Sanlam Business Centre, Welkom Free State 25/04/2008 7 510 2,6 48 300 68,90Orange Farm Phase 1 Link Road, Orange Farm CBD Gauteng 20/12/2012 5 591 – 43 300 60,29Kopanong Malatsi Street, Ivory Park, Thembisa Gauteng 01/07/2011 3 950 – 40 600 115,57Woodmead Square Woodmead Drive, Woodmead Gauteng 31/07/2013 2 945 – 31 900 103,24PnP Kroonstad Corner President and Truter Streets, Kroonstad Free State 07/06/2007 4 563 3,6 29 000 45,76Score Vosloorust Sam Sekoti Avenue, Vosloorus Gauteng 31/05/2007 3 600 – 28 300 62,38Blackheath Galleries Corner Beyers Naude Drive and Mountain View Avenue, Blackheath,
JohannesburgGauteng 01/07/2011 3 667 19,9 28 200 95,83
Giyani Magistrate Street, Giyani Limpopo 01/07/2011 4 934 – 26 000 45,94Alberton Crossing Corner Voortrekker Road and Ring Road West, New Redruth Gauteng 07/06/2007 2 185 4,8 25 450 109,31Perm Building East London 42 – 46 Oxford Street, East London Eastern Cape 25/04/2008 3 473 25,6 23 000 113,79Virgin Active Horison View 38 Van Santen Drive, Horizon View, Roodepoort Gauteng 01/07/2011 2 500 – 21 100 70,45233 Bram Fisher Drive 233 Bram Fischer Drive, Randburg, Johannesburg Gauteng 01/07/2011 2 958 – 21 100 74,47Planet Fitness Montana 33 Tibouchina Street, Zambesi Drive, Montana Park, Pretoria Gauteng 01/07/2011 2 472 – 20 400 68,83Checkers Nigel Corner Main and Hendrik Verwoerd Streets Gauteng 25/04/2008 3 443 – 20 100 60,26Atlas Road Corner Atlas and Dunswart Road, Anderbolt, Boksburg Gauteng 01/07/2011 3 202 83,6 19 500 412,98Casey’s Auto Springs 140 – 2nd Street Gauteng 25/04/2008 6 884 – 19 300 26,08Ellerines Newcastle 54 Scott Street KwaZulu-Natal 25/04/2008 2 125 48,2 19 000 174,67Shoprite Westonarea Corner Edwards Avenue and Allen Street, Westonaria District,
RandfonteinGauteng 07/06/2007 2 576 – 19 000 62,35
ABSA Secunda Tropsch Plane Mpumalanga 25/04/2008 2 359 – 18 200 82,62

70 DIPULA INCOME FUND Integrated Annual Report 2013
building name location region acquisition dategla(m2)
Vacancy(%)
marketvalue as at31 august
2013(r’000)
averagegross rentals
r/m2
retail (continued)
40 Scott Street 40/42 Scott Street KwaZulu-Natal 25/04/2008 2 312 22,9 18 000 121,99Standard Bank Doornfontein 49 Beit Street and Siemart Road, Doornfontein, Johannesburg Gauteng 01/07/2011 2 149 46,8 17 500 112,42Bethal Sanlam Corner Eeufees and Mark Street Mpumalanga 25/04/2008 2 424 – 17 000 75,7730 Voortrekker,Edgars Belville 30 Voortrekker Road Western Cape 11/06/2007 2 335 – 16 100 61,48ABSA Krugersdorp Corner Burger and Monument Streets Krugersdorp Gauteng 25/04/2008 3 420 30,1 16 000 63,796 Old Pretoria Road 6 Old Pretoria Road, Richards Drive Halfway House Gauteng 11/01/2008 5 760 25,7 15 800 36,9729 Main Street Mafikeng 29 Main Street Mafikeng North West 25/04/2008 2 600 – 15 700 66,62BMW 146 South Boulevard, East gate Office Park, Bruma, Johannesburg Gauteng 01/07/2011 1 847 100,0 15 400 vacantSales House Corner Fraser and Bree Street, Johannesburg Gauteng 07/06/2007 2 071 – 14 700 68,29ABSA Silverton 177 De Boulevard Street corner Pretoria Road, Silverton, Pretoria Gauteng 25/04/2008 2 023 26,2 14 600 77,60Standard Bank Krugersdorp 39 Human Street Gauteng 25/04/2008 3 128 5,1 14 400 44,72Score Ivory Park 2nd October Avenue Ivory Park Ext 8 Gauteng 31/05/2007 1 500 – 13 850 81,25Perm Plaza Newcastle 58 Scott Street, Newcastle KwaZulu-Natal 25/04/2008 2 501 23,3 13 400 86,22Blouberg Plaza Corner Dendron and Blouberg Road Limpopo 01/05/2012 971 – 13 000 119,32Nedbank Building East London 63 – 71 Oxford Street, East London Eastern Cape 25/04/2008 1 577 – 12 900 99,78Mafikeng Centre Nirelle 20 Shippard Street North West 25/04/2008 1 764 – 12 000 65,00Supermart 27 Allen Street, Newcastle KwaZulu-Natal 25/04/2008 2 489 – 11 900 52,33Metro Giyani Stand BA 43, 44 and 46 Giyani, Giyani Business Districts Limpopo 05/03/2008 1 982 – 10 400 41,15Citizens Springs 4th Avenue Gauteng 25/04/2008 1 155 – 10 350 81,1224A Bok Street 24A Bok Street Free State 25/04/2008 1 997 – 10 200 43,47Score Braamfisherville Corner Freedom Drive and Amanda Boulevard Gauteng 31/05/2007 1 500 – 10 000 65,00Standard Bank Vanderbijlpark 10 Van Rign Street Gauteng 25/04/2008 2 655 32,5 10 000 47,39Score Evaton Chief Bambatha Street, Evaton West Ext 11 Gauteng 31/05/2007 1 500 – 9 850 67,86Norwood Centre Ellerines 74 Grant Avenue, Norwood, Johannesburg Gauteng 01/07/2011 1 102 4,5 9 700 94,53Palm Street Mall Phalaborwa 24 Palm Street, Phalaborwa Limpopo 25/04/2008 2 546 42,3 9 595 54,09ABSA Malvern 585 Jules Street Malvern Gauteng 25/04/2008 774 7,6 9 500 146,56Citizens Vereeniging 28 Voortrekker Street Gauteng 25/04/2008 1 332 – 9 400 71,84Geen and Richards 6 West Street, Kempton Park Gauteng 25/04/2008 1 063 – 9 350 77,81Standard Bank Mafikeng Corner Main and Robinson Street North West 25/04/2008 1 071 – 9 255 75,82Standard Bank Newcastle 96 Scott Street, Newcastle, 2940 KwaZulu-Natal 25/04/2008 1 713 65,0 9 100 108,98
portfolio in detail(continued)

71DIPULA INCOME FUND Integrated Annual Report 2013
building name location region acquisition dategla(m2)
Vacancy(%)
marketvalue as at31 august
2013(r’000)
averagegross rentals
r/m2
retail (continued)
40 Scott Street 40/42 Scott Street KwaZulu-Natal 25/04/2008 2 312 22,9 18 000 121,99Standard Bank Doornfontein 49 Beit Street and Siemart Road, Doornfontein, Johannesburg Gauteng 01/07/2011 2 149 46,8 17 500 112,42Bethal Sanlam Corner Eeufees and Mark Street Mpumalanga 25/04/2008 2 424 – 17 000 75,7730 Voortrekker,Edgars Belville 30 Voortrekker Road Western Cape 11/06/2007 2 335 – 16 100 61,48ABSA Krugersdorp Corner Burger and Monument Streets Krugersdorp Gauteng 25/04/2008 3 420 30,1 16 000 63,796 Old Pretoria Road 6 Old Pretoria Road, Richards Drive Halfway House Gauteng 11/01/2008 5 760 25,7 15 800 36,9729 Main Street Mafikeng 29 Main Street Mafikeng North West 25/04/2008 2 600 – 15 700 66,62BMW 146 South Boulevard, East gate Office Park, Bruma, Johannesburg Gauteng 01/07/2011 1 847 100,0 15 400 vacantSales House Corner Fraser and Bree Street, Johannesburg Gauteng 07/06/2007 2 071 – 14 700 68,29ABSA Silverton 177 De Boulevard Street corner Pretoria Road, Silverton, Pretoria Gauteng 25/04/2008 2 023 26,2 14 600 77,60Standard Bank Krugersdorp 39 Human Street Gauteng 25/04/2008 3 128 5,1 14 400 44,72Score Ivory Park 2nd October Avenue Ivory Park Ext 8 Gauteng 31/05/2007 1 500 – 13 850 81,25Perm Plaza Newcastle 58 Scott Street, Newcastle KwaZulu-Natal 25/04/2008 2 501 23,3 13 400 86,22Blouberg Plaza Corner Dendron and Blouberg Road Limpopo 01/05/2012 971 – 13 000 119,32Nedbank Building East London 63 – 71 Oxford Street, East London Eastern Cape 25/04/2008 1 577 – 12 900 99,78Mafikeng Centre Nirelle 20 Shippard Street North West 25/04/2008 1 764 – 12 000 65,00Supermart 27 Allen Street, Newcastle KwaZulu-Natal 25/04/2008 2 489 – 11 900 52,33Metro Giyani Stand BA 43, 44 and 46 Giyani, Giyani Business Districts Limpopo 05/03/2008 1 982 – 10 400 41,15Citizens Springs 4th Avenue Gauteng 25/04/2008 1 155 – 10 350 81,1224A Bok Street 24A Bok Street Free State 25/04/2008 1 997 – 10 200 43,47Score Braamfisherville Corner Freedom Drive and Amanda Boulevard Gauteng 31/05/2007 1 500 – 10 000 65,00Standard Bank Vanderbijlpark 10 Van Rign Street Gauteng 25/04/2008 2 655 32,5 10 000 47,39Score Evaton Chief Bambatha Street, Evaton West Ext 11 Gauteng 31/05/2007 1 500 – 9 850 67,86Norwood Centre Ellerines 74 Grant Avenue, Norwood, Johannesburg Gauteng 01/07/2011 1 102 4,5 9 700 94,53Palm Street Mall Phalaborwa 24 Palm Street, Phalaborwa Limpopo 25/04/2008 2 546 42,3 9 595 54,09ABSA Malvern 585 Jules Street Malvern Gauteng 25/04/2008 774 7,6 9 500 146,56Citizens Vereeniging 28 Voortrekker Street Gauteng 25/04/2008 1 332 – 9 400 71,84Geen and Richards 6 West Street, Kempton Park Gauteng 25/04/2008 1 063 – 9 350 77,81Standard Bank Mafikeng Corner Main and Robinson Street North West 25/04/2008 1 071 – 9 255 75,82Standard Bank Newcastle 96 Scott Street, Newcastle, 2940 KwaZulu-Natal 25/04/2008 1 713 65,0 9 100 108,98

72 DIPULA INCOME FUND Integrated Annual Report 2013
building name location region acquisition dategla(m2)
Vacancy(%)
marketvalue as at31 august
2013(r’000)
averagegross rentals
r/m2
retail (continued)
Nedbank Centre Vereeniging 12 Merriman Avenue Vereeniging Gauteng 25/04/2008 1 744 57,3 8 800 72,62Voortrekker Street Benoni 21 Voortrekker Street Gauteng 25/04/2008 2 102 24,7 8 700 45,88Alvaro Centre 82 President Kruger Street, Vanderbijlpark Gauteng 25/04/2008 3 858 – 8 315 21,7441 and 43 Pretoria Road 41/43 Pretoria Road Gauteng 30/04/2008 1 532 – 8 286 51,50ABSA Derdepoort 62 Baviaanspoort Road, East Lynne, Pretoria Gauteng 30/04/2008 870 – 8 252 81,65Standard Bank Brakpan 622 Voortrekker Road, Brakpan Gauteng 25/04/2008 1 355 – 7 836 54,19Standard Bank Grahamstown Church Square Eastern Cape 25/04/2008 865 – 7 756 88,52Nedcor Building: Germiston Corner Jack and Victoria Street, Germiston Gauteng 01/07/2011 1 046 16,0 7 752 82,93Beacon Centre Vereeniging 14 Beaconsfield Avenue, Vereeniging Gauteng 25/04/2008 1 595 45,0 7 719 83,6131 and 33 Third Street 31 and 33 Third Street Gauteng 25/04/2008 2 748 4,9 7 654 29,03Pep Nigel 28 Hendrick Verwoerd Street, Nigel Gauteng 25/04/2008 1 027 – 7 521 64,83Kruger Corner Vanderbijlpark 13 President, Kruger Street Gauteng 25/04/2008 1 773 – 7 465 32,93FNB Florida 12 Goldman Road Gauteng 25/04/2008 1 087 – 7 400 86,60Kotze Place, Hillbrow 62 Kotze Street Gauteng 25/04/2008 740 – 7 390 87,45Tzaneen Ellerines Joubert and Agatha Street Limpopo 25/04/2008 913 – 7 091 66,31ABSA Hercules 569 Van Der Hoff Street, Hercules, Pretoria Gauteng 30/04/2008 1 375 44,5 7 079 86,44Pretoria Street Barnetts Kempton Park 33 Pretoria Road, Kempton Park Gauteng 30/04/2008 846 – 6 690 71,39Fastfood Corner Springs Corner 9th Ave 7 2nd Street, Selection Park, Springs Gauteng 25/04/2008 451 – 6 518 134,04OK Express Centre Kempton Park 23 Pretoria Road, Kempton Park Gauteng 30/04/2008 850 – 6 037 66,40Amethyst – Carletonville 4 Amethyst Street Gauteng 12/05/2008 800 – 5 760 82,59Beares Centre 9 Bears Str Kuruman Northern Cape 25/04/2008 1 270 – 5 666 45,48Hobhouse Klerksdorp 19 Emily Hob house North West 25/04/2008 832 – 5 649 56,30Buffalo Corner East London 38 - 40 Buffalo Street Eastern Cape 25/04/2008 1 083 – 5 625 50,43Standard Bank Boksburg 262 Commissioner Street Gauteng 25/04/2008 1 396 34,1 5 506 58,90A and M Wescen Kempton Park Corner West and Central Streets Gauteng 30/04/2008 866 – 5 463 57,851 President Street, Germiston 1 President Street, Germiston 1401 Gauteng 25/04/2008 2 571 100,0 5 430 vacantScore Tsakane Corner Mbazima and Tsakane Street, Tsakane Ext 5, Ekurhuleni Gauteng 31/05/2007 1 050 100,0 5 400 vacantStandard Bank Sasolburg Kirchoffer Boulevard Free State 25/04/2008 885 – 5 376 55,03Town Talk Mkuze Main Street KwaZulu-Natal 25/04/2008 1 050 11,4 4 930 49,93
portfolio in detail(continued)

73DIPULA INCOME FUND Integrated Annual Report 2013
building name location region acquisition dategla(m2)
Vacancy(%)
marketvalue as at31 august
2013(r’000)
averagegross rentals
r/m2
retail (continued)
Nedbank Centre Vereeniging 12 Merriman Avenue Vereeniging Gauteng 25/04/2008 1 744 57,3 8 800 72,62Voortrekker Street Benoni 21 Voortrekker Street Gauteng 25/04/2008 2 102 24,7 8 700 45,88Alvaro Centre 82 President Kruger Street, Vanderbijlpark Gauteng 25/04/2008 3 858 – 8 315 21,7441 and 43 Pretoria Road 41/43 Pretoria Road Gauteng 30/04/2008 1 532 – 8 286 51,50ABSA Derdepoort 62 Baviaanspoort Road, East Lynne, Pretoria Gauteng 30/04/2008 870 – 8 252 81,65Standard Bank Brakpan 622 Voortrekker Road, Brakpan Gauteng 25/04/2008 1 355 – 7 836 54,19Standard Bank Grahamstown Church Square Eastern Cape 25/04/2008 865 – 7 756 88,52Nedcor Building: Germiston Corner Jack and Victoria Street, Germiston Gauteng 01/07/2011 1 046 16,0 7 752 82,93Beacon Centre Vereeniging 14 Beaconsfield Avenue, Vereeniging Gauteng 25/04/2008 1 595 45,0 7 719 83,6131 and 33 Third Street 31 and 33 Third Street Gauteng 25/04/2008 2 748 4,9 7 654 29,03Pep Nigel 28 Hendrick Verwoerd Street, Nigel Gauteng 25/04/2008 1 027 – 7 521 64,83Kruger Corner Vanderbijlpark 13 President, Kruger Street Gauteng 25/04/2008 1 773 – 7 465 32,93FNB Florida 12 Goldman Road Gauteng 25/04/2008 1 087 – 7 400 86,60Kotze Place, Hillbrow 62 Kotze Street Gauteng 25/04/2008 740 – 7 390 87,45Tzaneen Ellerines Joubert and Agatha Street Limpopo 25/04/2008 913 – 7 091 66,31ABSA Hercules 569 Van Der Hoff Street, Hercules, Pretoria Gauteng 30/04/2008 1 375 44,5 7 079 86,44Pretoria Street Barnetts Kempton Park 33 Pretoria Road, Kempton Park Gauteng 30/04/2008 846 – 6 690 71,39Fastfood Corner Springs Corner 9th Ave 7 2nd Street, Selection Park, Springs Gauteng 25/04/2008 451 – 6 518 134,04OK Express Centre Kempton Park 23 Pretoria Road, Kempton Park Gauteng 30/04/2008 850 – 6 037 66,40Amethyst – Carletonville 4 Amethyst Street Gauteng 12/05/2008 800 – 5 760 82,59Beares Centre 9 Bears Str Kuruman Northern Cape 25/04/2008 1 270 – 5 666 45,48Hobhouse Klerksdorp 19 Emily Hob house North West 25/04/2008 832 – 5 649 56,30Buffalo Corner East London 38 - 40 Buffalo Street Eastern Cape 25/04/2008 1 083 – 5 625 50,43Standard Bank Boksburg 262 Commissioner Street Gauteng 25/04/2008 1 396 34,1 5 506 58,90A and M Wescen Kempton Park Corner West and Central Streets Gauteng 30/04/2008 866 – 5 463 57,851 President Street, Germiston 1 President Street, Germiston 1401 Gauteng 25/04/2008 2 571 100,0 5 430 vacantScore Tsakane Corner Mbazima and Tsakane Street, Tsakane Ext 5, Ekurhuleni Gauteng 31/05/2007 1 050 100,0 5 400 vacantStandard Bank Sasolburg Kirchoffer Boulevard Free State 25/04/2008 885 – 5 376 55,03Town Talk Mkuze Main Street KwaZulu-Natal 25/04/2008 1 050 11,4 4 930 49,93

74 DIPULA INCOME FUND Integrated Annual Report 2013
building name location region acquisition dategla(m2)
Vacancy(%)
marketvalue as at31 august
2013(r’000)
averagegross rentals
r/m2
retail (continued)
Goodyear – Kempton Park 79 Pretoria Road, Kempton Gauteng 25/04/2008 900 – 4 891 45,81Standard Bank Humansdorp 612 Main Street Eastern Cape 25/04/2008 548 – 4 739 78,52Church Street West Pretoria 472 Church Street Gauteng 30/04/2008 866 – 4 599 51,71Perm Boksburg 310 Commissioner Street, Boksburg Gauteng 25/04/2008 1 655 70,5 4 588 62,30Standard Bank Meyerton 4A Loch Street Gauteng 25/04/2008 690 – 4 575 57,55CMH Kempton Park 6 – 8 Jubilee Street Gauteng 25/04/2008 1 493 100,0 4 515 vacantStandard Bank Isando Corner Kram and Monteer Roads, Isando Gauteng 25/04/2008 1 824 100,0 4 400 vacantTown Talk Tzaneen Corner Danie Joubert and Agatha Str Limpopo 25/04/2008 653 – 4 276 55,55Aliwal North Edgars 20 Somerset Str, Erf 103 Aliwal North Eastern Cape 25/04/2008 787 – 4 249 47,87Trentyre Alberton 56 – 7th Avenue, Alberton Gauteng 25/04/2008 450 100,0 4 218 vacantBarberton Ellerines 100 De Villiers Street, Barberton Mpumalanga 25/04/2008 883 – 4 206 45,2039 Oxford Street, East London 39 Oxford Street Eastern Cape 25/04/2008 490 – 4 178 79,95Main Reef 69 Randfontein 69 Main Reef Road Gauteng 25/04/2008 1 010 – 4 024 38,24Town Talk Modjadjiskloof Main Road and Botha Street, Modjadjiskloof Limpopo 25/04/2008 1 072 – 3 410 24,78Standard Bank Secunda Etienne Rossouw Street Mpumalanga 30/04/2008 863 42,1 3 283 67,18Metro Malaita B 66/08 Sekhukhuni Streets Malaita Sekhukhuni Mpumalanga 05/03/2008 1 700 – 3 132 22,82Zeolite Park Carletonville 3 Zeolite Street, Carletonville Gauteng 12/05/2008 2 017 – 2 989 11,13Beaconsfield Vereeniging 15 Beaconsfield Avenue Gauteng 25/04/2008 880 – 2 834 35,30Ellerines Kuruman 8 Beare Street NorthenCape 25/04/2008 667 – 2 519 34,91Hartbeesfontein 92 Voortrekker Street North West 25/04/2008 301 – 2 373 68,52Geen and Richards Phalaborwa 22 Palm Street Limpopo 25/04/2008 810 100,0 2 344 vacantTrentyre – Benoni 49 Lake Avenue Gauteng 25/04/2008 595 100,0 2 191 vacantMiladys Brakpan 572 Voortrekker Street, Brakpan Gauteng 25/04/2008 450 – 2 080 44,91Mauriso Court 100 Knox Street, Germiston Gauteng 25/04/2008 1 498 28,8 2 034 26,98Volksrust Ackermans 61 Joubert Street KwaZulu-Natal 25/04/2008 500 – 1 871 39,20total retail 286 352 2 143 464 73,97#
* Total weighted average rental by income# Total weighted average rental by GLA 83,68*
portfolio in detail(continued)

75DIPULA INCOME FUND Integrated Annual Report 2013
building name location region acquisition dategla(m2)
Vacancy(%)
marketvalue as at31 august
2013(r’000)
averagegross rentals
r/m2
retail (continued)
Goodyear – Kempton Park 79 Pretoria Road, Kempton Gauteng 25/04/2008 900 – 4 891 45,81Standard Bank Humansdorp 612 Main Street Eastern Cape 25/04/2008 548 – 4 739 78,52Church Street West Pretoria 472 Church Street Gauteng 30/04/2008 866 – 4 599 51,71Perm Boksburg 310 Commissioner Street, Boksburg Gauteng 25/04/2008 1 655 70,5 4 588 62,30Standard Bank Meyerton 4A Loch Street Gauteng 25/04/2008 690 – 4 575 57,55CMH Kempton Park 6 – 8 Jubilee Street Gauteng 25/04/2008 1 493 100,0 4 515 vacantStandard Bank Isando Corner Kram and Monteer Roads, Isando Gauteng 25/04/2008 1 824 100,0 4 400 vacantTown Talk Tzaneen Corner Danie Joubert and Agatha Str Limpopo 25/04/2008 653 – 4 276 55,55Aliwal North Edgars 20 Somerset Str, Erf 103 Aliwal North Eastern Cape 25/04/2008 787 – 4 249 47,87Trentyre Alberton 56 – 7th Avenue, Alberton Gauteng 25/04/2008 450 100,0 4 218 vacantBarberton Ellerines 100 De Villiers Street, Barberton Mpumalanga 25/04/2008 883 – 4 206 45,2039 Oxford Street, East London 39 Oxford Street Eastern Cape 25/04/2008 490 – 4 178 79,95Main Reef 69 Randfontein 69 Main Reef Road Gauteng 25/04/2008 1 010 – 4 024 38,24Town Talk Modjadjiskloof Main Road and Botha Street, Modjadjiskloof Limpopo 25/04/2008 1 072 – 3 410 24,78Standard Bank Secunda Etienne Rossouw Street Mpumalanga 30/04/2008 863 42,1 3 283 67,18Metro Malaita B 66/08 Sekhukhuni Streets Malaita Sekhukhuni Mpumalanga 05/03/2008 1 700 – 3 132 22,82Zeolite Park Carletonville 3 Zeolite Street, Carletonville Gauteng 12/05/2008 2 017 – 2 989 11,13Beaconsfield Vereeniging 15 Beaconsfield Avenue Gauteng 25/04/2008 880 – 2 834 35,30Ellerines Kuruman 8 Beare Street NorthenCape 25/04/2008 667 – 2 519 34,91Hartbeesfontein 92 Voortrekker Street North West 25/04/2008 301 – 2 373 68,52Geen and Richards Phalaborwa 22 Palm Street Limpopo 25/04/2008 810 100,0 2 344 vacantTrentyre – Benoni 49 Lake Avenue Gauteng 25/04/2008 595 100,0 2 191 vacantMiladys Brakpan 572 Voortrekker Street, Brakpan Gauteng 25/04/2008 450 – 2 080 44,91Mauriso Court 100 Knox Street, Germiston Gauteng 25/04/2008 1 498 28,8 2 034 26,98Volksrust Ackermans 61 Joubert Street KwaZulu-Natal 25/04/2008 500 – 1 871 39,20total retail 286 352 2 143 464 73,97#
* Total weighted average rental by income# Total weighted average rental by GLA 83,68*

76 DIPULA INCOME FUND Integrated Annual Report 2013
building name location region acquisition dategla(m2)
Vacancy(%)
marketvalue as at31 august
2013(r’000)
averagegross rentals
r/m2
offiCe
SAPS VIP Corner Park and Troye Streets, Sunnyside , Pretoria Gauteng 20/12/2012 21 478 – 248 000 96,68SAPS IJS Corner Swartkop and Prieska Roads, Pretoria Gauteng 21/12/2012 7 874 – 122 000 116,11ABSA Home Loans 27 Beatrix Street, Arcadia, Pretoria Gauteng 19/12/2012 5 048 – 86 000 115,48Boardwalk Place Midrand 10 Boardwalk Midrand Halfway House Gauteng 23/02/2007 6 455 – 58 900 92,02Finance House 25 Ernest Oppenheimer Drive, Bruma, Johannesburg Gauteng 01/07/2011 7 631 52,9 43 200 104,94Metcash 49 Crownwood Road, Portion 10 Erf 25 Theta Ext 1 Township,
JohannesburgGauteng 01/11/2007 7 273 – 41 000 n/a
Absa Horizon Park 161 Ontdekkers Road, Horizon Park, Roodepoort Gauteng 01/07/2011 2 427 – 40 000 171,30Nemisa Building 21 Girton Road Parktown Gauteng 12/12/2006 3 600 – 40 000 124,86Byron Place Corner 320 Sophie De Bruyn and Nana Sita Streets, Pretoria Gauteng 18/04/2013 3 271 – 36 000 101,89Bruma Boulevard 20 Zulberg Close, Bruma, Johannesburg Gauteng 01/07/2011 4 623 20,7 32 600 92,04Agency 1 Corner Witkoppen and Leeukop Drives, Sunninghill, Johannesburg Gauteng 01/07/2011 2 596 – 32 500 105,32Sanburn Building 68 Woburn Avenue, Benoni Gauteng 01/07/2011 6 757 – 31 900 54,90295 Kent Avenue 295 Kent Avenue Randburg Gauteng 18/05/2007 3 145 52,6 30 000 82,67Markem Office Kempton Park 21 Margaret Avenue Gauteng 04/12/2006 4 694 17,2 29 000 47,68Old Mutual Secunda Horwood Street Between Lourens Muller and Heunis Str’s Secunda Mpumalanga 08/02/2008 3 704 38,1 25 700 119,99Howick Mews 1342 Howick Close Gauteng 24/04/2007 3 643 39,5 23 400 101,69Montrose Place Waterfall Parkbekker Road, Vorna Valley Ext 21, Midrand Gauteng 19/06/2007 3 942 40,1 23 400 81,77360 Pretoria Avenue 360 Pretoria Avenue, Randburg, Johannesburg Gauteng 01/07/2011 4 185 100,0 21 100 vacantCollege House 26 Peter Place, Lyme Park, Johannesburg Gauteng 01/07/2011 1 850 41,3 18 700 156,65Sloane Park Bryanstan 1 Libertas Road Corner Main Road and AD Sloane Street Bryanston
Ext 16 SandtonGauteng 31/05/2007 1 304 – 17 300 124,52
Sandhaven Office Park Corner Pongola Crescent and Katherine Streets Eastgate Ext 17 Sandton
Gauteng 23/01/2007 1 901 19,9 15 300 70,49
New Road Office 30 New Road Midrand, Randjiespark, Johannesburg Gauteng 07/06/2007 1 798 – 14 700 70,20Waterview Corner 2 Ernst Oppenheimer Drive, Bruma Johannesburg Gauteng 01/07/2011 2 460 26,2 14 000 97,06SARS Building Welkom Graaf Street, Welkom Free State 25/04/2008 2 738 8,0 13 000 47,67Johnson Wax 192 Smit Street, Fairlands, Johannesburg Gauteng 01/07/2011 1 716 – 13 000 66,42Horison Office Park No. 4/ 6 Kingfisher Street, Horizon Park, Roodepoort Gauteng 01/07/2011 3 010 – 12 000 48,06Selbourne House, Bloemfontein Corner First and Selbourne Streets, Bloemfontein Free State 25/04/2008 1 188 – 8 000 138,07
portfolio in detail(continued)

77DIPULA INCOME FUND Integrated Annual Report 2013
building name location region acquisition dategla(m2)
Vacancy(%)
marketvalue as at31 august
2013(r’000)
averagegross rentals
r/m2
offiCe
SAPS VIP Corner Park and Troye Streets, Sunnyside , Pretoria Gauteng 20/12/2012 21 478 – 248 000 96,68SAPS IJS Corner Swartkop and Prieska Roads, Pretoria Gauteng 21/12/2012 7 874 – 122 000 116,11ABSA Home Loans 27 Beatrix Street, Arcadia, Pretoria Gauteng 19/12/2012 5 048 – 86 000 115,48Boardwalk Place Midrand 10 Boardwalk Midrand Halfway House Gauteng 23/02/2007 6 455 – 58 900 92,02Finance House 25 Ernest Oppenheimer Drive, Bruma, Johannesburg Gauteng 01/07/2011 7 631 52,9 43 200 104,94Metcash 49 Crownwood Road, Portion 10 Erf 25 Theta Ext 1 Township,
JohannesburgGauteng 01/11/2007 7 273 – 41 000 n/a
Absa Horizon Park 161 Ontdekkers Road, Horizon Park, Roodepoort Gauteng 01/07/2011 2 427 – 40 000 171,30Nemisa Building 21 Girton Road Parktown Gauteng 12/12/2006 3 600 – 40 000 124,86Byron Place Corner 320 Sophie De Bruyn and Nana Sita Streets, Pretoria Gauteng 18/04/2013 3 271 – 36 000 101,89Bruma Boulevard 20 Zulberg Close, Bruma, Johannesburg Gauteng 01/07/2011 4 623 20,7 32 600 92,04Agency 1 Corner Witkoppen and Leeukop Drives, Sunninghill, Johannesburg Gauteng 01/07/2011 2 596 – 32 500 105,32Sanburn Building 68 Woburn Avenue, Benoni Gauteng 01/07/2011 6 757 – 31 900 54,90295 Kent Avenue 295 Kent Avenue Randburg Gauteng 18/05/2007 3 145 52,6 30 000 82,67Markem Office Kempton Park 21 Margaret Avenue Gauteng 04/12/2006 4 694 17,2 29 000 47,68Old Mutual Secunda Horwood Street Between Lourens Muller and Heunis Str’s Secunda Mpumalanga 08/02/2008 3 704 38,1 25 700 119,99Howick Mews 1342 Howick Close Gauteng 24/04/2007 3 643 39,5 23 400 101,69Montrose Place Waterfall Parkbekker Road, Vorna Valley Ext 21, Midrand Gauteng 19/06/2007 3 942 40,1 23 400 81,77360 Pretoria Avenue 360 Pretoria Avenue, Randburg, Johannesburg Gauteng 01/07/2011 4 185 100,0 21 100 vacantCollege House 26 Peter Place, Lyme Park, Johannesburg Gauteng 01/07/2011 1 850 41,3 18 700 156,65Sloane Park Bryanstan 1 Libertas Road Corner Main Road and AD Sloane Street Bryanston
Ext 16 SandtonGauteng 31/05/2007 1 304 – 17 300 124,52
Sandhaven Office Park Corner Pongola Crescent and Katherine Streets Eastgate Ext 17 Sandton
Gauteng 23/01/2007 1 901 19,9 15 300 70,49
New Road Office 30 New Road Midrand, Randjiespark, Johannesburg Gauteng 07/06/2007 1 798 – 14 700 70,20Waterview Corner 2 Ernst Oppenheimer Drive, Bruma Johannesburg Gauteng 01/07/2011 2 460 26,2 14 000 97,06SARS Building Welkom Graaf Street, Welkom Free State 25/04/2008 2 738 8,0 13 000 47,67Johnson Wax 192 Smit Street, Fairlands, Johannesburg Gauteng 01/07/2011 1 716 – 13 000 66,42Horison Office Park No. 4/ 6 Kingfisher Street, Horizon Park, Roodepoort Gauteng 01/07/2011 3 010 – 12 000 48,06Selbourne House, Bloemfontein Corner First and Selbourne Streets, Bloemfontein Free State 25/04/2008 1 188 – 8 000 138,07

78 DIPULA INCOME FUND Integrated Annual Report 2013
building name location region acquisition dategla(m2)
Vacancy(%)
marketvalue as at31 august
2013(r’000)
averagegross rentals
r/m2
offiCe (continued)
Witbank Hoskins House 6 Neven Street X60, Mpumalanga Mpumalanga 25/04/2008 614 – 7 406 102,80Nedbank Isando Corner Monteer Road and Brewery Street, Isando Ext 1 Gauteng 25/04/2008 1 125 – 7 012 75,70Emsure: Benoni Corner Elston and Rothsay Street Gauteng 01/07/2011 1 383 21,0 5 094 49,4026 and 28 Siddle Street 26 and 28 Siddle Street Klerksdorp North West 25/04/2008 1 317 100,0 4 095 vacantMellis Park Portion 1, 334 Rivonia Rd, Ext 20 Gauteng 31/01/2007 1 268 – 4 063 47,81Enel Somerset Office Park, 5 Liberts Road, Bryanston, Johannesburg Gauteng 01/07/2011 272 – 3 486 100,4096 Cambridge Road 96 Cambridge Road Free State 25/04/2008 539 – 3 199 49,98Total Office 130 356 1 129 905 100,84*
* Total weighted average rental by income# Total weighted average rental by GLA 85,7#
building name location region acquisition dategla(m2)
Vacancy(%)
marketvalue as at31 august
2013(r’000)
averagegross rentals
r/m2
indUstrial
Sterkolite Building Corner Swartkop and Prieska Roads, Pretoria Gauteng 18/04/2013 12 782 – 79 000 66,82Vana Road Corner Vana Drive and Pero Road, Jupiter Ext 3, Germiston Gauteng 07/06/2007 8 195 – 31 450 39,18Range Road Blackheath 5 Range Way, Blackheath, Kuils River Western Cape 07/06/2007 10 979 31,7 26 700 24,95Bernie Street Corner of Bernie Street and Hilston Rd Gauteng 06/02/2007 6 343 – 24 500 30,01Sifon Park 238 Sifon Street, Robertville Ext 10 Gauteng 07/06/2007 9 298 14,9 24 000 35,90Carrier/Metraclark 14 Mandy Road, Reuven, Johannesburg Gauteng 01/07/2011 7 115 – 21 600 20,80Jasco Building 12 Delphi Street, Eastgate Ext 18, Sandton Gauteng 01/07/2011 4 544 – 20 800 46,40Arbeid Street 11 Arbeid Street Gauteng 07/06/2007 5 478 – 19 000 47,13Anderbolt McCarthy 246 Francis Road, Dormehl, Anderbolt, Boksburg Gauteng 01/07/2011 3 026 – 18 100 52,979 Grenville Avenue Epping 9 Grenville Avenue Western Cape 11/06/2007 7 022 0,6 17 400 25,36Alert 26 Western Boulevard, City West, Johannesburg Gauteng 01/07/2011 4 351 – 16 500 39,56139 Sixth Street 139 Sixth Street Gauteng 07/06/2007 4 570 17,3 16 400 44,13Robertville: Anvil Road 1037 – 1041 Anvil Road, Robertville, Roodepoort Gauteng 01/07/2011 4 701 23,0 15 100 47,03African Glass Centurion 13 Park Avenue North Rooihuiskraal Extension 31 Gauteng 30/04/2008 2 216 – 14 000 56,42Seatings 14 Bunsen Street, Industria, Johannesburg Gauteng 01/07/2011 5 332 – 13 200 27,291 Killarney Road No 1 Killarney Avenue Western Cape 11/04/2008 3 073 – 12 300 29,96Wynberg 506 56 6th Street, Wynberg Gauteng 25/04/2008 4 424 – 12 000 22,59
portfolio in detail(continued)
INDUSTRIAL

79DIPULA INCOME FUND Integrated Annual Report 2013
building name location region acquisition dategla(m2)
Vacancy(%)
marketvalue as at31 august
2013(r’000)
averagegross rentals
r/m2
offiCe (continued)
Witbank Hoskins House 6 Neven Street X60, Mpumalanga Mpumalanga 25/04/2008 614 – 7 406 102,80Nedbank Isando Corner Monteer Road and Brewery Street, Isando Ext 1 Gauteng 25/04/2008 1 125 – 7 012 75,70Emsure: Benoni Corner Elston and Rothsay Street Gauteng 01/07/2011 1 383 21,0 5 094 49,4026 and 28 Siddle Street 26 and 28 Siddle Street Klerksdorp North West 25/04/2008 1 317 100,0 4 095 vacantMellis Park Portion 1, 334 Rivonia Rd, Ext 20 Gauteng 31/01/2007 1 268 – 4 063 47,81Enel Somerset Office Park, 5 Liberts Road, Bryanston, Johannesburg Gauteng 01/07/2011 272 – 3 486 100,4096 Cambridge Road 96 Cambridge Road Free State 25/04/2008 539 – 3 199 49,98Total Office 130 356 1 129 905 100,84*
* Total weighted average rental by income# Total weighted average rental by GLA 85,7#
building name location region acquisition dategla(m2)
Vacancy(%)
marketvalue as at31 august
2013(r’000)
averagegross rentals
r/m2
indUstrial
Sterkolite Building Corner Swartkop and Prieska Roads, Pretoria Gauteng 18/04/2013 12 782 – 79 000 66,82Vana Road Corner Vana Drive and Pero Road, Jupiter Ext 3, Germiston Gauteng 07/06/2007 8 195 – 31 450 39,18Range Road Blackheath 5 Range Way, Blackheath, Kuils River Western Cape 07/06/2007 10 979 31,7 26 700 24,95Bernie Street Corner of Bernie Street and Hilston Rd Gauteng 06/02/2007 6 343 – 24 500 30,01Sifon Park 238 Sifon Street, Robertville Ext 10 Gauteng 07/06/2007 9 298 14,9 24 000 35,90Carrier/Metraclark 14 Mandy Road, Reuven, Johannesburg Gauteng 01/07/2011 7 115 – 21 600 20,80Jasco Building 12 Delphi Street, Eastgate Ext 18, Sandton Gauteng 01/07/2011 4 544 – 20 800 46,40Arbeid Street 11 Arbeid Street Gauteng 07/06/2007 5 478 – 19 000 47,13Anderbolt McCarthy 246 Francis Road, Dormehl, Anderbolt, Boksburg Gauteng 01/07/2011 3 026 – 18 100 52,979 Grenville Avenue Epping 9 Grenville Avenue Western Cape 11/06/2007 7 022 0,6 17 400 25,36Alert 26 Western Boulevard, City West, Johannesburg Gauteng 01/07/2011 4 351 – 16 500 39,56139 Sixth Street 139 Sixth Street Gauteng 07/06/2007 4 570 17,3 16 400 44,13Robertville: Anvil Road 1037 – 1041 Anvil Road, Robertville, Roodepoort Gauteng 01/07/2011 4 701 23,0 15 100 47,03African Glass Centurion 13 Park Avenue North Rooihuiskraal Extension 31 Gauteng 30/04/2008 2 216 – 14 000 56,42Seatings 14 Bunsen Street, Industria, Johannesburg Gauteng 01/07/2011 5 332 – 13 200 27,291 Killarney Road No 1 Killarney Avenue Western Cape 11/04/2008 3 073 – 12 300 29,96Wynberg 506 56 6th Street, Wynberg Gauteng 25/04/2008 4 424 – 12 000 22,59
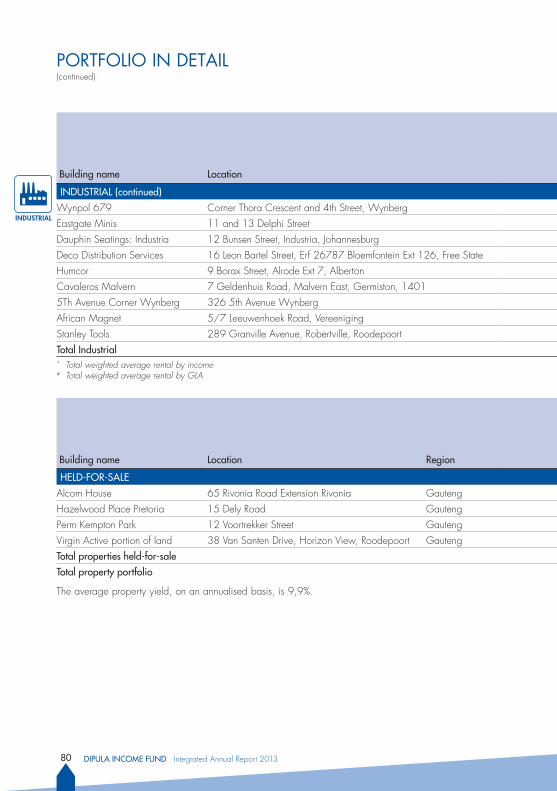
80 DIPULA INCOME FUND Integrated Annual Report 2013
building name location region acquisition dategla(m2)
Vacancy(%)
marketvalue as at31 august
2013(r’000)
averagegross rentals
r/m2
indUstrial (continued)
Wynpol 679 Corner Thora Crescent and 4th Street, Wynberg Gauteng 25/04/2008 3 532 2,8 10 000 26,25Eastgate Minis 11 and 13 Delphi Street Gauteng 07/06/2007 2 600 25,0 9 400 44,77Dauphin Seatings: Industria 12 Bunsen Street, Industria, Johannesburg Gauteng 01/07/2011 3 476 – 8 900 20,36Deco Distribution Services 16 Leon Bartel Street, Erf 26787 Bloemfontein Ext 126, Free State Free State 14/02/2007 2 867 – 8 500 27,39Humcor 9 Borax Street, Alrode Ext 7, Alberton Gauteng 25/04/2008 2 658 – 8 200 37,19Cavaleros Malvern 7 Geldenhuis Road, Malvern East, Germiston, 1401 Gauteng 25/04/2008 3 750 71,5 7 500 40,915Th Avenue Corner Wynberg 326 5th Avenue Wynberg Gauteng 25/04/2008 2 100 – 6 696 16,28African Magnet 5/7 Leeuwenhoek Road, Vereeniging Gauteng 30/04/2008 2 673 82,6 5 134 60,20Stanley Tools 289 Granville Avenue, Robertville, Roodepoort Gauteng 01/07/2011 1 070 – 3 245 33,54total industrial 128 175 449 625 39,43*
* Total weighted average rental by income# Total weighted average rental by GLA 37,12#
building name location region property type acquisition dategla(m2)
Vacancy(%)
marketvalue as at31 august
2013(r’000)
averagegross rentals
r/m2
held-for-sale
Alcom House 65 Rivonia Road Extension Rivonia Gauteng Office 12/02/2007 1 350 – 16 500 60,54Hazelwood Place Pretoria 15 Dely Road Gauteng Office 21/01/2007 895 – 7 500 61,70Perm Kempton Park 12 Voortrekker Street Gauteng Retail 30/04/2008 3 528 78,5 4 850 67,42Virgin Active portion of land 38 Van Santen Drive, Horizon View, Roodepoort Gauteng Retail 01/07/2011 – 0,0 1 400 n/atotal properties held-for-sale 5 773 30 250
total property portfolio 550 656 3 753 244
The average property yield, on an annualised basis, is 9,9%.
portfolio in detail(continued)
INDUSTRIAL

81DIPULA INCOME FUND Integrated Annual Report 2013
building name location region acquisition dategla(m2)
Vacancy(%)
marketvalue as at31 august
2013(r’000)
averagegross rentals
r/m2
indUstrial (continued)
Wynpol 679 Corner Thora Crescent and 4th Street, Wynberg Gauteng 25/04/2008 3 532 2,8 10 000 26,25Eastgate Minis 11 and 13 Delphi Street Gauteng 07/06/2007 2 600 25,0 9 400 44,77Dauphin Seatings: Industria 12 Bunsen Street, Industria, Johannesburg Gauteng 01/07/2011 3 476 – 8 900 20,36Deco Distribution Services 16 Leon Bartel Street, Erf 26787 Bloemfontein Ext 126, Free State Free State 14/02/2007 2 867 – 8 500 27,39Humcor 9 Borax Street, Alrode Ext 7, Alberton Gauteng 25/04/2008 2 658 – 8 200 37,19Cavaleros Malvern 7 Geldenhuis Road, Malvern East, Germiston, 1401 Gauteng 25/04/2008 3 750 71,5 7 500 40,915Th Avenue Corner Wynberg 326 5th Avenue Wynberg Gauteng 25/04/2008 2 100 – 6 696 16,28African Magnet 5/7 Leeuwenhoek Road, Vereeniging Gauteng 30/04/2008 2 673 82,6 5 134 60,20Stanley Tools 289 Granville Avenue, Robertville, Roodepoort Gauteng 01/07/2011 1 070 – 3 245 33,54total industrial 128 175 449 625 39,43*
* Total weighted average rental by income# Total weighted average rental by GLA 37,12#
building name location region property type acquisition dategla(m2)
Vacancy(%)
marketvalue as at31 august
2013(r’000)
averagegross rentals
r/m2
held-for-sale
Alcom House 65 Rivonia Road Extension Rivonia Gauteng Office 12/02/2007 1 350 – 16 500 60,54Hazelwood Place Pretoria 15 Dely Road Gauteng Office 21/01/2007 895 – 7 500 61,70Perm Kempton Park 12 Voortrekker Street Gauteng Retail 30/04/2008 3 528 78,5 4 850 67,42Virgin Active portion of land 38 Van Santen Drive, Horizon View, Roodepoort Gauteng Retail 01/07/2011 – 0,0 1 400 n/atotal properties held-for-sale 5 773 30 250
total property portfolio 550 656 3 753 244
The average property yield, on an annualised basis, is 9,9%.

82 DIPULA INCOME FUND Integrated Annual Report 2013

Directors’ responsibility and approval 84
Certificate of the Company Secretary 84
Report of the Audit and Risk Committee 85
Independent auditor’s report 87
Directors’ report 89
Statements of financial position 93
Statements of comprehensive income 94
Statements of changes in equity 96
Statements of cash flows 97
Notes to the annual financial statements 98
CONTENTS
83DIPULA INCOME FUND Integrated Annual Report 2013
FINA
NC
IAL STA
TEMEN
TS

84 DIPULA INCOME FUND Integrated Annual Report 2013
DIRECTORS’ RESPONSIBILITY AND APPROVALfor the year ended 31 August 2013
CERTIFICATE OF THE COMPANY SECRETARY
The directors are responsible for the preparation and fair presentation of the company and group annual fi nancial statements of Dipula Income Fund Limited, comprising the statements of fi nancial position at 31 August 2013 and statements of comprehensive income, changes in equity and cash fl ows for the year then ended. To achieve the highest standards of fi nancial reporting, these fi nancial statements have been drawn up to comply with International Financial Reporting Standards and the requirements of the South African Companies Act, 2008.
The directors’ responsibility includes the design, implementation and maintenance of internal controls that will ensure the preparation, integrity and fair presentation of the fi nancial statements and other fi nancial information included in this report, selecting and applying appropriate accounting policies and making accounting estimates that are reasonable in the circumstances.
The directors have reviewed the appropriateness of the accounting policies and conclude that estimates and judgements are reasonable. They are of the opinion that the annual fi nancial statements fairly present the fi nancial position of the business at 31 August 2013 and its fi nancial performance and cash fl ows for the year to 31 August 2013. The external auditors, who have unrestricted access to all records and information, as well as to the Audit and Risk Committee, concur with this statement. The directors believe that all representations made to the independent auditors during their audit are valid and appropriate. The unqualifi ed audit report of Grant Thornton (JHB) Inc. is presented on pages 87 to 88.
In addition, the directors have also reviewed the cash fl ow forecast for the year to 31 August 2014 and believe that the company and the group have adequate resources to continue in operation for the foreseeable future. Accordingly, the annual fi nancial statements have been prepared on a going concern basis. These fi nancial statements support the viability of the company and of the group.
The annual fi nancial statements were approved by the board of directors on 14 November 2013 and are signed on its behalf by:
Izak Petersen brigitte de bruynChief Executive Offi cer Financial Director
14 November 2013
In terms of section 88(2)(e) of the Companies Act, 2008, as amended (“the Act”) we declare that to the best of our knowledge, for the year ended 31 August 2013, Dipula Income Fund Limited has lodged with the Companies and Intellectual Property Commission (“CIPC”) all such returns as are required of a public company, and all such returns are true, correct and up to date.
Probity business Services (Pty) LtdCompany Secretary
Johannesburg14 November 2013
85DIPULA INCOME FUND Integrated Annual Report 2013
TErMS OF rEFErENCEThe Audit and Risk Committee has an independent role with accountability to unitholders in respect of its statutory duties, and to the board in respect of duties assigned to it by the board as detailed in its Terms of Reference. The Terms of Reference are reviewed and updated on a regular basis.
The committee has performed its duties during the past financial year in accordance with the Terms of Reference.
COMPOSITION AND MEETINgSThe committee comprises three independent non-executive directors and meets at least twice per year. Members of the committee are all financially literate with the requisite levels of financial expertise. The members of the committee are as follows:Y Waja CA(SA), HDip Tax Law – ChairmanBH Azizollahoff BA (NY), MBA (Wits)Professor E Links MCom (Economics), PhD (Economics)
Details of the meetings and attendance have been included in the corporate governance report on pages 55 and 56.
The CEO, the Financial Director, the executive director and external auditor attend meetings of the committee by invitation. The external auditor meets with the committee without any of the executives on an annual basis and has unrestricted access to the committee. The Audit and Risk Committee has a good working relationship with the CEO.
STATUTOry DUTIESThe committee performed the following activities during the year under review:• Consideredtheindependenceandobjectivityoftheexternalauditorsandensuredthatthescopeof
additional services provided did not impair their independence;• Reviewedtheexternalauditplanandapprovedtheexternalauditors’feeproposalforthe2013
financial year;• Approvedthenon-audit-relatedservicesperformedbytheexternalauditorsintheyearinaccordance
with the policy established and approved by the board;• Consideredaccountingtreatments,significantfinancialtransactionsandotherfinancialinformation;• IncompliancewiththeJSEListingsRequirements3.84(h),thecommitteereviewedtheperformance,
appropriateness and expertise of the Financial Director, B de Bruyn and is satisfied therewith; and• Consideredtheappropriatenessoftheaccountingpolicies.
After assessing the requirements set out in section 94(7)(a–e) of the Companies Act, the committee is satisfied with the independence and objectivity of the external auditors, and recommends the re-appointment of the external auditors Grant Thornton (Jhb) Inc. at the next annual general meeting.
INTErNAL FINANCIAL CONTrOLSThe internal audit function is outsourced to an independent service provider and is an integral part of the enterprise-wide risk management framework.
REPORT OF THE AUDIT AND RISK COMMITTEE
FINA
NC
IAL STA
TEMEN
TS

86 DIPULA INCOME FUND Integrated Annual Report 2013
Internal audit reports directly to the audit committee and operates in terms of an internal audit charter approved by the Audit and Risk Committee.
The internal audit plan is approved by the Audit and Risk Committee. There is an informal information exchange process in place with the external auditors to ensure the effi cient coverage of internal controls.
Based on control processes in place, assurances obtained from management and the issues raised by the external auditors in their various management reports, the committee is of the opinion that the signifi cant internal fi nancial controls are effective.
FINANCE FUNCTION AND FINANCIAL DIrECTOrThe committee has considered and has satisfi ed itself on the appropriateness of the expertise and adequacy of resources of the fi nance function of the company. The committee also confi rms that the company’s Financial Director, Brigitte de Bruyn, has the necessary expertise and experience to carry out her duties.
ANNUAL FINANCIAL STATEMENTSBased on processes and assurances obtained, the committee recommended the annual fi nancial statements to the board for approval.
gOINg CONCErNThe committee, through its review of the 2014 budget and discussions with management, reported to the board that it supported management’s view that the company will continue to be a going concern in the foreseeable future.
rISk MANAgEMENTThe committee reviews the analysis of the critical risks facing the company on an annual basis. The risk analysis and the company’s response to these risks is detailed on pages 16 and 18 of this report. The committee is satisfi ed, to the extent possible given the wide range of known and unknown risks facing the company and all businesses in general, that the compensating controls in place to mitigate the identifi ed key risks are adequate.
y wajaChairman
14 November 2013
REPORT OF THE AUDIT AND RISK COMMITTEE(continued)

87DIPULA INCOME FUND Integrated Annual Report 2013
TO THE UNITHOLDErS OF DIPULA INCOME FUND LIMITED
We have audited the consolidated and separate financial statements of Dipula Income Fund Limited set out on pages 93 to 142, which comprise the statements of financial position as at 31 August 2013, and the statements of comprehensive income, statements of changes in equity and statements of cash flows for the year then ended, and the notes, comprising a summary of significant accounting policies and other explanatory information.
DIrECTOrS’ rESPONSIbILITy FOr THE CONSOLIDATED FINANCIAL STATEMENTS The company’s directors are responsible for the preparation and fair presentation of these consolidated and separate financial statements in accordance with International Financial Reporting Standards, and the requirements of the Companies Act of South Africa, and for such internal control as the directors determine is necessary to enable the preparation of consolidated and separate financial statements that are free from material misstatements, whether due to fraud or error.
AUDITOrS’ rESPONSIbILITy Our responsibility is to express an opinion on these consolidated and separate financial statements based on our audit. We conducted our audit in accordance with International Standards on Auditing. Those standards require that we comply with ethical requirements and plan and perform the audit to obtain reasonable assurance whether the consolidated and separate financial statements are free from material misstatement.
An audit involves performing procedures to obtain audit evidence about the amounts and disclosures in the financial statements. The procedures selected depend on the auditors’ judgement, including the assessment of the risks of material misstatement of the financial statements, whether due to fraud or error. In making those risk assessments, the auditors consider internal control relevant to the entity’s preparation and fair presentation of the financial statements in order to design audit procedures that are appropriate in the circumstances, but not for the purpose of expressing an opinion on the effectiveness of the entity’s internal control. An audit also includes evaluating the appropriateness of accounting policies used and the reasonableness of accounting estimates made by directors, as well as evaluating the overall presentation of the financial statements.
We believe that the audit evidence we have obtained is sufficient and appropriate to provide a basis for our audit opinion.
OPINION In our opinion, the consolidated and separate financial statements present fairly, in all material respects, the consolidated and separate financial position of Dipula Income Fund Limited as at 31 August 2013, and its consolidated and separate financial performance and consolidated and separate cash flows for the year then ended in accordance with International Financial Reporting Standards, and the requirements of the Companies Act of South Africa.
INDEPENDENT AUDITORS’ REPORT
FINA
NC
IAL STA
TEMEN
TS

88 DIPULA INCOME FUND Integrated Annual Report 2013
OTHEr rEPOrTS rEqUIrED by THE COMPANIES ACTAs part of our audit of the consolidated and separate financial statements for the year ended 31 August 2013, we have read the Directors’ Report, the Audit and Risk Committee’s Report and the declaration by the Company Secretary for the purpose of identifying whether there are material inconsistencies between these reports and the audited consolidated and separate financial statements. These reports are the responsibility of the respective preparers. Based on reading these reports we have not identified material inconsistencies between these reports and the audited consolidated and separate financial statements. However, we have not audited these reports and accordingly do not express an opinion on these reports.
grant Thornton (Jhb) Inc.Registered AuditorsChartered Accountants (SA) Registration number 1994/001166/21
Director: rudi Huiskamp
Sandton14 November 2013
INDEPENDENT AUDITORS’ REPORT(continued)

89DIPULA INCOME FUND Integrated Annual Report 2013
TO THE UNITHOLDErS OF DIPULA INCOME FUND LIMITEDWe have pleasure in presenting the annual financial statements of Dipula Income Fund Limited for the year ended 31 August 2013.
UNIT STrUCTUrEThe Dipula A-linked and B-linked unit structure offers investors two different risk and reward propositions. The distribution of the A-linked units escalates at 5% per annum until August 2017 and thereafter at the lower of CPI and 5%. These units have preferential entitlements to income distributions.
The remaining distributable income accrues to the B-linked units.
NATUrE OF bUSINESSDipula Income Fund Limited (“the Fund”) is a variable property loan stock company (“PLS”) listed on the JSE Limited (“JSE”). Post year-end it converted to a Real Estate Investment Trust, effective 1 September 2013.
Dipula’s subsidiaries own a diversified property portfolio of 176 retail, industrial and office properties from which rental income streams are derived.
rEvIEw OF OPErATIONS AND ACqUISITIONSThe results of the group and the company are set out in the attached financial statements and notes.
During the year under review, the group acquired and transferred 12 new properties:
Post listing acquisitions Sector Location gLA(m2)
Transferred/Transferring
(r’000)yield
%
weightedaverage
gross rental
SAPS VIP Office Gauteng 21 478 229 860 10,0 91,23 SAPS IJS Office Gauteng 7 874 118 540 10,0 116,40 Absa Home Loans Office Gauteng 5 048 82 600 10,0 121,50 Orange Farm phase 1 Retail Gauteng 5 591 42 167 9,3 63,51 Byron Place Office Gauteng 3 271 38 000 10,0 84,94 Sterkolite building Industrial Gauteng 12 782 78 000 13,0 73,49 Gezina Galleries Retail Gauteng 16 669 159 330 9,8 98,41
Ziyabuya RetailEastern Cape 14 584 116 000 9,5 75,52
Shoprite Pretoria North Retail Gauteng 6 442 76 640 9,4 83,40 Blackheath Pavillion Retail Gauteng 6 270 70 500 9,3 92,93 Woodmead Super Value Retail Gauteng 7 169 104 660 9,5 160,10 Woodmead Square Retail Gauteng 2 945 31 900 9,0 144,86
Total 110 123 1 148 197 9,9
DISTrIbUTIONSDipula achieved total distributions for the year ended 31 August 2013 of 83,338 cents (2012: 79,370 cents) per A-linked unit and 66,639 cents (2012: 60,821 cents) per B-linked unit.
DIRECTORS’ REPORTfor the year ended 31 August 2013
FINA
NC
IAL STA
TEMEN
TS

90 DIPULA INCOME FUND Integrated Annual Report 2013
In the prior year, a lease cancellation amount of R22,5 million was received in July 2013 from a tenant which related to a 24-month cancellation period. The rentals and related recoveries, totalling R9,5 million for the twelve months ended 31 August 2013, have been distributed.
The final balance of R9,5 million will be distributed in 2014.
STATED CAPITAL AND DEbENTUrESThe authorised share capital of the company consists of 200 million shares of no par value. Each ordinary share is linked to a debenture of R4,41 and may only be traded on the JSE as a linked unit. Further details of the share capital and debentures are set out in notes 10 and 11 to the annual financial statements. There were no changes to the authorised share capital of the company during the year.
During the year, Dipula raised R650 million in a private placement by issuing 37 967 290 A-linked units at R10,45 per unit and 37 967 290 B-linked units at R6,67 per unit.
PrOPErTy vALUATIONSThe portfolio was valued at 31 August 2013 as per the Investment Property accounting policy (note 1.2) at R3,7 billion (2012: R2,4 billion) and the net asset value per linked unit was R7,86 (2012: R7,08) at year-end.
bOrrOwINgSThe average cost of borrowings for the group was 7,96% (2011: 8,39%) at 31 August 2013 due to only 50% of the total borrowings being subject to fixed interest rates. However post-year, a further 24% of the facilities were fixed resulting in a current average cost of borrowings of 8,4%. The group’s facilities with financial institutions as at 31 August 2013 were R1,8 billion with R1,4 billion being utilised at year-end. The group’s gearing ratio at 31 August 2013 was 37,9% (2012: 38,1%).
DIrECTOrATEThe directors of the company as at the date of this report were:BH Azizollahoff#
B de Bruyn (Financial Director)*NS Gumede*E LinksZJ Matlala (Chairperson)IS Petersen (CEO)*Y Waja# British* Executive
Z Matlala and Y Waja retire at the forthcoming annual general meeting and are both eligible for re-election.
There were no changes to the directorate during the year.
DIRECTORS’ REPORTfor the year ended 31 August 2013 (continued)

91DIPULA INCOME FUND Integrated Annual Report 2013
DIrECTOrS’ rEMUNErATIONFees earned for services as non-executive directors of the company were as follows:
2013r
2012R
BH Azizollahoff § 208 300 192 500 E Links 176 200 162 500 ZJ Matlala (Chairperson) 192 600 180 000 Y Waja 176 200 162 500
753 300 697 500
§ R100 000 (2012: R100 000) was also paid to BH Azizollahoff for acting as a trustee for various trusts within the group
The executive directors are remunerated from the management fee payable to the asset management company.• NoremunerationwaspaidtoeitherISPetersenorNSGumedebytheassetmanagementcompany
during the year as they are paid out of the management fees paid by the asset management company to the companies they are employed by, namely Mergence Africa Properties (Pty) Ltd and Dijalo Property Services (Pty) Ltd.
• TheremunerationoftheFinancialDirector,MsBdeBruyn,aspaidbytheassetmanagementcompanyamounted to R1 764 000 (R1 284 000 basic salary, R480 000 bonus) (2012: R1 330 000).
DIrECTOrS’ INTErESTSThe interest of the directors in the linked units of Dipula Income Fund at 31 August 2013 were as follows:
A-linked units (number of units)2013 2012
Direct beneficial
Indirect beneficial Total
Direct beneficial
Indirect beneficial Total
NS Gumede – 610 380 610 380 – 1 476 139 1 476 139 IS Petersen – 1 064 662 1 675 042 – 1 320 823 1 320 823 Y Waja 20 000 – 20 000 – – –
20 000 1 675 042 2 305 422 – 2 796 962 2 796 962
b-linked units (number of units) 2013 2012
Direct beneficial
Indirect beneficial Total
Direct beneficial
Indirect beneficial Total
NS Gumede – 8 435 361 8 435 361 – 1 476 139 1 476 139 IS Petersen – 8 522 723 8 522 723 – 1 319 823 1 320 823 Y Waja 22 500 – 22 500 – – –
22 500 16 958 084 16 980 584 – 2 795 962 2 796 962
There have been no significant changes to these holdings between the year-end and the date of this report.
FINA
NC
IAL STA
TEMEN
TS

92 DIPULA INCOME FUND Integrated Annual Report 2013
DISTrIbUTION TO UNITHOLDErSDistributions to unitholders are disclosed in note 19 to the annual financial statements.
COrPOrATE gOvErNANCE AND INTErNAL CONTrOLSThe company’s status with regard to corporate governance and internal controls is set out in a separate statement in the integrated report.
AUDIT AND rISk COMMITTEE AND INDEPENDENCE OF AUDITOrThe Audit and Risk Committee consists only of independent non-executive directors and has reviewed these financial statements prior to their submission to the board for approval. The Audit and Risk Committee has also assessed the independence of the external auditors and is satisfied with their independence. Further detail regarding the scope and mandate of the Audit and Risk Committee is detailed on page 85 of this integrated report.
SUbSIDIAry COMPANIESInformation relating to the company’s interest in its subsidiaries is detailed in note 6 to the annual financial statements. There were no special resolutions taken during the year under review.
gOINg CONCErNThe directors are of the opinion that the group has adequate resources to continue operating for the foreseeable future and that it is appropriate to adopt the going concern basis in preparing the group’s financial statements. The directors have satisfied themselves that the group is in a sound financial position and that it has access to sufficient borrowing facilities to meet its foreseeable cash requirements.
SUbSEqUENT EvENTSOn 6 September 2013, Dipula successfully raised R200 million by issuing 10 441 378 A-linked units at R10,16 and 12 522 080 B-linked units at R7,50.
The proceeds were utilised to fund the equity portion of acquisitions.
The directors are not aware of any other matter or circumstances arising since the end of the financial year to the date of this report, not otherwise dealt with in this report or in the group and company financial statements that would significantly affect the operations, the results and the financial position of the group and company.
rEAL ESTATE INvESTMENT TrUSTThe company was granted Real Estate Investment Trust (“REIT”) status, effective 1 September 2013.
COMPANy SECrETAryThe Company Secretary is Probity Business Services (Pty) Ltd.
bUSINESS ADDrESSBlock B, Dunkeld Park, 6 North Road, Dunkeld West, 2196
POSTAL ADDrESSPO Box 875, Parklands, 2121
DIRECTORS’ REPORTfor the year ended 31 August 2013 (continued)

93DIPULA INCOME FUND Integrated Annual Report 2013
grOUP COMPANy2013 2012 2013 2012
Audited Audited Audited AuditedNote r’000 R’000 r’000 R’000
ASSETSNon-current assets 3 779 817 2 441 968 3 556 335 2 281 366Investment property 3 722 994 2 393 486 – – Fair value of property portfolio for accounting purposes 2 3 653 308 2 360 219 – –
Straight-line rental income accrual 3 69 686 33 267 – –Goodwill 4 48 482 48 482 – –Other non-current receivables 5 8 341 – – –Interest in subsidiaries 6 – – 3 556 335 2 281 366 Current assets 88 071 188 665 32 368 148 256 Trade and other receivables 7 33 983 25 310 – 17 Loan to related party 29 – 1 202 – 1 202 Cash and cash equivalents 8 54 088 162 153 32 368 147 037 Non-current assets held-for-saleInvestment property held-for-sale 9 30 250 54 987 – –Total assets 3 898 138 2 685 620 3 588 703 2 429 622 EqUITy AND LIAbILITIESEquity 753 902 554 630 475 525 468 940 Stated capital 10 427 852 427 852 468 940 468 940 Fair value reserve 400 024 175 562 – –Accumulated (loss)/profit (73 974) (48 784) 6 585 –
Non-current liabilities 2 974 791 1 848 872 2 996 720 1 837 574 Debenture capital 11 1 499 420 900 629 1 532 449 931 012 Interest-bearing liabilities 12 1 475 371 906 562 1 464 271 906 562 Deferred taxation 13 – 41 681 – –Current liabilities 169 445 282 118 116 458 123 108 Interest-bearing liabilities 12 – 159 208 – 42 000 Trade and other payables 14 56 793 46 120 3 806 4 318 Linked unitholders for distribution 112 652 76 790 112 652 76 790 Total equity and liabilities 3 898 138 2 685 620 3 588 703 2 429 622 Number of A-linked units in issue 143 499 683* 105 532 393*Number of B-linked units in issue 143 499 683* 105 532 393*Net asset value per A-linked unit (cents) ¤ 785,13 689,48Net asset value per B-linked unit (cents) ¤ 785,13 689,48Net asset value per A-linked unit (cents) ¥ 785,13 707,98Net asset value per B-linked unit (cents) ¥ 785,13 707,98* Excluding treasury linked units¤ Including deferred taxation¥ Excluding deferred taxation
STATEMENTS OF FINANCIAL POSITIONas at 31 August 2013
FINA
NC
IAL STA
TEMEN
TS

94 DIPULA INCOME FUND Integrated Annual Report 2013
grOUP COMPANy 2013 2012 2013 2012
Audited Audited Audited AuditedNote r’000 R’000 r’000 R’000
revenueProperty portfolio 374 720 299 583 – 5 000 Rental income 338 301 300 731 – 5 000 Straight-line rental income accrual 36 419 (1 148) – –
Total revenue 374 720 299 583 – 5 000 Other income 13 276 – – –Property expenses (70 136) (58 080) – –Administration and corporate costs (14 244) (11 757) (1 187) (1 160)Net operating profit/(loss) 15 303 616 229 746 (1 187) 3 840 Changes in fair values of investment properties 126 537 85 072 – –
Profit/(loss) from operations 430 153 314 818 (1 187) 3 840 Interest paid 16 (80 863) (67 305) (78 556) (62 544)Interest received 17 19 041 2 096 294 426 206 651 Amortisation of debenture premium 7 146 – 7 146 –Profit before debenture interest and taxation 375 477 249 609 221 829 147 947 Debenture interest (215 216) (147 947) (215 216) (147 947)Profit before taxation 160 261 101 662 6 613 –Taxation 18 39 011 (20 843) (28) –Profit for the year after taxation 199 272 80 819 6 585 –Other comprehensive income – – – –Total comprehensive income for the year attributable to equity holders 199 272 80 819 6 585 –
STATEMENTS OF COMPREHENSIVE INCOMEfor the year ended 31 August 2013

95DIPULA INCOME FUND Integrated Annual Report 2013
grOUP COMPANy 2013 2012 2013 2012
Audited Audited Audited AuditedNote r’000 R’000 r’000 R’000
Total number of units in issue* 286 999 366 211 064 786 Number of A-linked units in issue 143 499 683 105 532 393 Number of B-linked units in issue 143 499 683 105 532 393 Weighted average number of A-linked units in issue* 135 074 065 105 532 393 Weighted average number of B-linked units in issue* 135 074 065 105 532 393 Basic earnings per share (cents) 19 73,76 38,29 Headline earnings per share (cents) 19 7,55 9,71 Basic earnings per A-linked unit (cents) 19 162,30 117,66 Basic earnings per B-linked unit (cents) 19 144,56 99,11 Headline earnings per A-linked unit (cents) 19 96,09 89,08 Headline earnings per B-linked unit (cents) 19 78,35 70,53 Distributable earnings per A-linked unit 83,338 79,37 Distributable earnings per B-linked unit 66,639 60,821 * Net of treasury linked units
The company does not have any dilutionary instruments in issue.
FINA
NC
IAL STA
TEMEN
TS

96 DIPULA INCOME FUND Integrated Annual Report 2013
Stated capital
Fair value reserve
Accumulated Loss
Total equity
R’000 R’000 R’000 r’000
grOUP
balance at 31 August 2011 427 852 116 895 (70 936) 473 811
Total comprehensive income for the year – – 80 819 80 819
Transfer of capital items to fair value reserve – 58 667 (58 667) –
balance at 31 August 2012 427 852 175 562 (48 784) 554 630
Issue of linked units – – – –
Share issue expenses – – – –
Total comprehensive income for the year – – 199 272 199 272
Transfer of capital items to fair value reserve – 224 462 (224 462) –
balance at 31 August 2013 427 852 400 024 (73 974) 753 902
COMPANy
balance at 31 August 2011 468 940 – – 468 940
Issue of linked units – – – –
Total comprehensive income for the year – – – –
balance at 31 August 2012 468 940 – – 468 940
Issue of linked units – – – –
Total comprehensive income for the year – – 6 585 6 585
balance at 31 August 2013 468 940 – 6 585 475 525
STATEMENT OF CHANGES IN EQUITYfor the year ended 31 August 2013

97DIPULA INCOME FUND Integrated Annual Report 2013
grOUP COMPANy
2013 2012 2013 2012 Note r’000 R’000 r’000 R’000
Cash flows from operating activities
Cash generated from/(utilised in) operations 20 268 549 232 637 (3 812) (2 745)Interest received 19 041 2 096 294 426 206 651 Interest paid (78 403) (67 205) (76 096) (62 444)Distribution paid 21 (179 354) (76 253) (179 354) (76 253)Taxation paid 22 (28) – (28) –
Net cash generated from operating activities 29 805 91 275 35 136 65 209
Cash flows from investing activities
Acquisition of investment properties (1 165 384) (142 144) – –Loans advanced and prepayments (4 241) – – –Loans advanced to subsidiaries – – (1 274 969) (116 660)Proceeds on disposal of investment properties 26 445 – – –
Net cash utilised in investing activities (1 143 180) (142 144) (1 274 969) (116 660)
Cash flows from financing activities
Linked units issued – debentures 608 806 – 608 806 –Linked unit issue expenses (2 869) – (223) –Interest-bearing liabilities raised 398 171 188 964 515 379 188 962 Decrease/(increase) in related party loans 1 202 (1 202) 1 202 (1 202)
Net cash generated from financing activities 1 005 310 187 762 1 125 164 187 760
Net (decrease)/increase in cash and cash equivalents (108 065) 136 893 (114 669) 136 309 Cash and cash equivalents at beginning of year 162 153 25 260 147 037 10 728
Cash and cash equivalents at end of year 8 54 088 162 153 32 368 147 037
STATEMENTS OF CASH FLOWSfor the year ended 31 August 2013
FINA
NC
IAL STA
TEMEN
TS

98 DIPULA INCOME FUND Integrated Annual Report 2013
rEPOrTINg ENTITyDipula Income Fund Limited (“Dipula” or “the company”) is a company domiciled in South Africa.
The consolidated financial statements of the company for the year ended 31 August 2013 comprise the company and its subsidiaries (together referred to as the “group”). The financial statements were authorised for issue by the directors on 14 November 2013.
bASIS OF PrEPArATIONbasis of measurementThe consolidated and separate financial statements (“financial statements”) are prepared on the historical cost basis, except for investment property which is measured at fair value.
Statement of complianceThe annual financial statements have been consistently prepared in accordance with the requirements of International Financial Reporting Standards (“IFRS”), the SAICA Financial Reporting Guides, as issued by the Accounting Practice Committee, the JSE Limited (“JSE”) Listings Requirements and requirements of the South African Companies Act, 2008.
The accounting policies are consistent with those applied in the prior period.
FUNCTIONAL AND PrESENTATION CUrrENCyThe financial statements are presented in South African rand, which is also the functional currency of the group, rounded to its nearest thousand (R’000) unless otherwise indicated.
USE OF ESTIMATES AND JUDgEMENTSThe preparation of financial statements in conformity with IFRS requires management to make judgements, estimates and assumptions that affect the application of policies and reported amounts of assets and liabilities, income and expenses. The estimates and associated assumptions are based on historical experience and various other factors that are believed to be reasonable under the circumstances, the results of which form the basis of making judgements about carrying amounts of assets and liabilities that are not readily apparent from other sources. Actual results may differ from these estimates.
The estimates and underlying assumptions are reviewed on an ongoing basis. Revisions to accounting estimates are recognised in the period in which the estimate is revised if the revision affects only that period, or the period of the revision and future periods if the revision affects both current and future periods.
Judgements made by management in the application of IFRS that have a significant effect on the financial statements, and estimates with a significant risk of material adjustment in the next year are set out in note 28.
NOTES TO THE ANNUAL FINANCIAL STATEMENTSfor the year ended 31 August 2013

99DIPULA INCOME FUND Integrated Annual Report 2013
1 ACCOUNTINg POLICIES The accounting policies set out below have been applied in preparing the financial statements for the
year ended 31 August 2013 and the comparative information presented in these financial statements for the year ended 31 August 2012:
1.1 basis of consolidation Subsidiaries Subsidiaries are those entities over which the group has the ability, either directly or indirectly,
to govern the financial and operating policies so as to obtain benefits from their activities.
In assessing control, potential voting rights that are presently exercisable are taken into account.
The group financial statements incorporate the assets, liabilities, operating results and cash flows of the company and its subsidiaries.
The results of subsidiaries acquired or disposed of during the period are included from the effective dates of acquisition and up to the effective dates of disposal.
The accounting policies of the subsidiaries are consistent with those of the holding company.
In the company’s separate financial statements, investments in subsidiaries are stated at cost less accumulated impairment losses.
Transactions eliminated on consolidation Intra-group balances and any unrealised gains and losses arising from intra-group transactions
are eliminated in preparing the consolidated financial statements.
1.2 Investment property Investment property Investment properties are those held either to earn rental income or for capital appreciation or
both but not for sale in the ordinary course of business or for administration purposes.
The cost of investment property comprises the purchase price and directly attributable expenditure. Subsequent expenditure relating to investment property is capitalised when it is probable that there will be future economic benefits from the use of the asset. All other subsequent expenditure is recognised as an expense in the period in which it is incurred.
After initial recognition, investment properties are measured at fair value. These fair values are determined on an annual basis, however if acquisitions occur within the last six months of the year, the properties are valued at their acquisition price, as this is considered to be the fair value.
FINA
NC
IAL STA
TEMEN
TS

100 DIPULA INCOME FUND Integrated Annual Report 2013
1 ACCOUNTINg POLICIES (continued) 1.2 Investment property (continued) Investment property (continued) Investment properties above R8 million in value at the last valuation date are valued by
external independent registered valuers with appropriate and recognised professional qualifications and recent experience in the location and category of property being valued.
Investment properties below R8 million in value at the last valuation date are valued internally by the directors on an annual basis.
Valuations are done on the open market value basis and the valuers use either the discounted
cash flow method or the capitalisation of net income method or a combination of the methods. Gains or losses arising from changes in the fair values are included in profit or loss in the period in which they arise. Unrealised gains are transferred to a non-distributable fair value reserve in the statement of changes in equity. Unrealised losses are transferred to the fair value reserve to the extent that the decrease does not exceed the amount held in the fair value reserve.
Immediately prior to disposal of investment property the investment property is revalued to the net sales proceeds and such revaluation is recognised in profit or loss during the period in which it occurs.
Borrowing costs are capitalised to the extent that they are directly attributable to the acquisition, construction or production of a qualifying asset. Capitalisation of borrowing costs commences when the activities to prepare the asset are in progress and expenditures and borrowing costs are being incurred. Capitalisation of borrowing costs may continue until the assets are substantially ready for their intended use.
If the resulting carrying amount of the asset exceeds its recoverable amount, an impairment loss is recognised. The capitalisation rate is arrived at by reference to the actual rate payable on borrowings for redevelopment purposes or, with regard to that part of redevelopment cost financed out of general funds, the weighted average cost of borrowings.
Investment property held-for-sale Investment property classified as held-for-sale is carried at fair value. 1.3 Financial instruments Financial instruments include cash and cash equivalents, trade and other receivables,loans to
related parties, trade and other payables, interest-bearing borrowings and debentures. recognition Financial instruments are initially measured at fair value which, except for financial instruments
measured at fair value through profit and loss, include directly attributable transaction costs.
NOTES TO THE ANNUAL FINANCIAL STATEMENTSfor the year ended 31 August 2013 (continued)

101DIPULA INCOME FUND Integrated Annual Report 2013
1 ACCOUNTINg POLICIES (continued) 1.3 Financial instruments (continued) recognition (continued) Subsequent to initial recognition, financial instruments are measured as follows: Cash and cash equivalents – Carried at amortised cost. Loans – Stated at amortised cost using the effective interest method
net of impairment losses. Trade and other receivables – Stated at amortised cost using the effective interest method
net of impairment losses. Trade and other payables – Carried at amortised cost using the effective interest method. Interest-bearing borrowings – Carried at amortised cost using the effective interest method. Debentures – Considered to be held-to-maturity and is amortised using the
effective interest rate method.
Derecognition A financial asset (or, where applicable, a part of a financial asset or part of a group of
similar financial assets) is derecognised where: • thecontractualrightstoreceivecashflowsfromtheassethaveexpired;and • thegrouporcompanyhastransferreditsrightstoreceivecashflowsfromtheassetand
either has transferred substantially all the risks and rewards of the asset, or has neither transferred nor retained substantially all the risks and rewards of the asset, but has transferred control of the asset.
A financial liability is derecognised when the obligation under the liability is discharged or cancelled or expires. Where an existing liability is replaced by another from the same lender on substantially different terms, or the terms of an existing liability are substantially modified, such an exchange or modification is treated as a derecognition of the original liability and the recognition of a new liability, and the difference in the respective carrying amounts is recognised in profit or loss.
Offset Financial assets and financial liabilities are offset and the net amount reported in the statement
of financial position when the group and/or company has a legally enforceable right to set off the recognised amounts, and intends either to settle on a net basis or to realise the asset and settle the liability simultaneously.
1.4 Intangible assets Intangible assets with finite useful lives are stated at cost less accumulated amortisation and
accumulated impairment losses. Amortisation is recognised in profit and loss on a straight-line basis over the estimated useful lives from the date they are available for use.
Intangible assets with an indefinite useful life are stated at cost less accumulated impairment losses and are tested for impairment annually.
FINA
NC
IAL STA
TEMEN
TS

102 DIPULA INCOME FUND Integrated Annual Report 2013
1 ACCOUNTINg POLICIES (continued) 1.5 Derivative financial instruments The group currently has no derivative financial instruments, but should it enter into these in the
future, it would only do so in order to hedge its exposure to interest rate risks arising from financing activities. In accordance with its treasury policy, the group does not hold or issue derivative financial instruments for trading purposes. Derivatives used as hedges which do not qualify as such in terms of hedge accounting rules, are accounted for as trading instruments.
Derivative financial instruments are recognised initially at fair value. Subsequent to initial recognition, derivative financial instruments are measured at fair value, and changes therein are accounted for through profit or loss. Directly attributable transaction costs are recognised in profit and loss when incurred.
The fair value of interest rate swaps is the estimated amount that the group would receive or pay to terminate the swap at the statement of financial position date, taking into account current interest rates and the current creditworthiness of the counterparties.
1.6 goodwill All business combinations are accounted for by applying the purchase method. Goodwill
represents amounts arising on acquisition of subsidiaries or businesses and comprises the difference between the cost of the acquisition and the fair value of the net identifiable assets, liabilities and contingent liabilities acquired.
Goodwill is stated at cost less any accumulated impairment losses. Goodwill is allocated to cash-generating units and is tested annually for impairment. A cash-generating unit is the smallest identifiable asset group that generates cash flows that are largely independent from other assets and groups. Negative goodwill arising on acquisition is recognised directly in profit or loss.
Expenditure on internally generated goodwill and brands is recognised in profit or loss as incurred.
1.7 Impairment Non-financial assets The carrying amounts of the group’s non-financial assets, other than investment property and
deferred tax assets, are reviewed at each reporting date to determine whether there is any indication of impairment. If any such indication exists, the asset’s recoverable amount is estimated.
The recoverable amount is estimated at each reporting date for goodwill and intangible assets that have an indefinite useful life and intangible assets that are not yet available for use.
An impairment loss is recognised whenever the carrying amount of an asset or its cash-generating unit exceeds its recoverable amount and is recognised in profit or loss.
NOTES TO THE ANNUAL FINANCIAL STATEMENTSfor the year ended 31 August 2013 (continued)

103DIPULA INCOME FUND Integrated Annual Report 2013
1 ACCOUNTINg POLICIES (continued) 1.7 Impairment (continued) Non-financial assets (continued) Impairment losses recognised are allocated first to reduce the carrying amount of any
goodwill allocated to the cash-generating unit and then to reduce the carrying amounts of the other assets in the unit on a pro rata basis.
The recoverable amount of an asset or a cash-generating unit is the greater of their fair value less cost to sell and their value in use.
In assessing value in use, the estimated future cash flows are discounted to their present value using the original effective pre-tax discount rate. For any asset that does not generate largely independent cash flows, the recoverable amount is determined for the cash-generating unit to which the asset belongs.
An impairment loss in respect of goodwill is not reversed. In respect of other assets, an impairment loss is reversed if there has been a change in the estimates used to determine the recoverable amount and there is an indication that the impairment loss no longer exists.
An impairment loss is reversed only to the extent that the carrying amount of the asset does not exceed the carrying amount that would have been determined, net of depreciation or amortisation, if no impairment loss had been recognised.
Financial assets A financial asset is considered to be impaired if objective evidence indicates that one or
more events have had a negative effect on the estimated future cash flows of that asset.
An impairment loss in respect of a financial asset measured at amortised cost is calculated as the difference between its carrying amount and the present value of the estimated future cash flows discounted at the pre-tax discount rate that reflects current market assessments of the time value of money and the risks specific to the asset. An impairment loss in respect of an available-for-sale financial asset is calculated by reference to its current fair value.
Individually significant financial assets are tested for impairment on an individual basis. The remaining financial assets are assessed collectively in groups that share similar credit characteristics.
All impairment losses are recognised in profit and loss.
An impairment loss is reversed if the subsequent increase in recoverable amount can be related objectively to an event occurring after the impairment loss was recognised.
FINA
NC
IAL STA
TEMEN
TS

104 DIPULA INCOME FUND Integrated Annual Report 2013
1 ACCOUNTINg POLICIES (continued) 1.8 Cash and cash equivalents Cash and cash equivalents include cash balances, call deposits, accessable funds invested
against borrowings and short-term, highly liquid investments that are readily convertible to known amounts of cash and which are subject to an insignificant risk of changes in value. Bank overdrafts that are repayable on demand and form an integral part of the group’s cash management, are included as a component of cash and cash equivalents for the purpose of the cash flow statement.
1.9 Stated capital Ordinary shares are classified as equity. External costs directly attributable to the issue of new
shares are shown as a deduction in equity from the proceeds.
When share capital recognised as equity is repurchased, the amount of the consideration paid, including directly attributable costs, is recognised as a change in equity. Repurchased shares are classified as treasury shares and presented as a deduction from total equity.
1.10 Provisions Provisions are recognised when the group has legal or constructive obligations arising from
past events, from which outflows of economic benefits are probable, and where reliable estimates can be made of the amounts of the obligations. Where the effect of discounting is material, provisions are discounted. The discount rate is a pre-tax rate that reflects current market assessments of the time value of money and, where appropriate, the risks specific to the liability.
1.11 revenue Revenue comprises gross rental revenue and recoveries of rates and operating costs,
excluding VAT. Rental revenue from investment property is recognised in profit or loss on a straight-line basis over the term of the lease. Lease incentives granted are recognised as an integral part of the total rental revenue over the lease period.
1.12 Expenses Service costs and property operating expenses Service costs for service contracts entered into and property operating expenses are expensed
as incurred.
1.13 Finance costs and finance income Finance costs comprise interest payable on borrowings calculated using the effective
interest method.
Finance income comprises interest received on funds invested and is recognised in profit or loss as it accrues, taking into account the effective yield on the asset.
NOTES TO THE ANNUAL FINANCIAL STATEMENTSfor the year ended 31 August 2013 (continued)

105DIPULA INCOME FUND Integrated Annual Report 2013
1 ACCOUNTINg POLICIES (continued) 1.14 Income tax Income tax on the profit or loss for the period comprises current and deferred tax. Income tax
is recognised in profit or loss, except to the extent that it relates to items recognised directly in equity, in which case it is recognised in equity.
Current tax is the expected tax payable on the taxable income for the year, using tax rates enacted or substantively enacted at the reporting date, and any adjustment to tax payable in respect of previous years.
Deferred tax is provided using the statement of financial position method, based on temporary differences between the carrying amounts of assets and liabilities for financial reporting purposes and their tax bases. The amount of deferred tax provided is based on the expected manner of realisation or settlement of the carrying amount of assets and liabilities, using tax rates enacted or substantively enacted at the reporting date.
The following temporary differences are not provided for: goodwill not deductible for tax purposes, the initial recognition of assets or liabilities that affect neither accounting nor taxable profit, and differences relating to investments in subsidiaries to the extent that they will probably not reverse in the foreseeable future.
A deferred tax asset is recognised only to the extent that it is probable that future taxable profits will be available against which the asset can be utilised. Deferred tax assets are reduced to the extent that it is no longer probable that the related tax benefit will be realised.
1.15 Segmental reporting A segment is a distinguishable component of the group that is engaged either in providing
services (business segment) or in providing services within a particular economic environment (geographical segment), which is subject to risks and returns that are different from those of other segments. The group’s primary segment is based on business segments. There are no secondary segments. The business segments are determined based on the group’s management and internal reporting structure.
On a primary basis, the group operates in the following segments: • Retail • Industrial • Commercial
The group will from time to time invest in/divest from certain primary segments, in which case segmental reporting will be adjusted to reflect only the relevant operating segments.
Segment results include revenue and expenses directly attributable to a segment and the relevant portion of group revenue and expenses that can be allocated on a reasonable basis to a segment. Segmental assets comprise those assets that are directly attributable to the segment or can be allocated to the segment on a reasonable basis.
FINA
NC
IAL STA
TEMEN
TS

106 DIPULA INCOME FUND Integrated Annual Report 2013
1 ACCOUNTINg POLICIES (continued) 1.16 related parties Related parties in the case of the group include any shareholder who is able to exert a
significant influence on the operating policies of the group. Directors, their close family members and any employee who is able to exert significant influence on the operating policies of the group are also considered to be related parties. In the case of the company, related parties would also include subsidiaries.
1.17 Earnings per share and per linked unit The group presents basic earnings per share and per linked unit. It also presents headline
earnings per linked unit.
Basic earnings per share is calculated by dividing profit for the year attributable to equity holders by the weighted average number of shares in issue during the year.
Basic earnings per linked unit is calculated by dividing profit for the year attributable to equity holders plus interest paid to linked debenture holders by the weighted average number of linked units in issue during the year.
Headline earnings per linked unit is calculated by dividing headline earnings (being the headline earnings attributable to linked unitholders less debenture interest) by the weighted average number of linked units in issue during the year.
Statement of compliance with International Financial reporting Standards (“IFrS”) The group applies all applicable IFRS as issued by the International Accounting Standards
Board (“IASB”) in preparation of the financial statements.
Consequently, all IFRS statements that were effective at the date of issuing this report and are relevant to Dipula’s operations have been applied.
NOTES TO THE ANNUAL FINANCIAL STATEMENTSfor the year ended 31 August 2013 (continued)

107DIPULA INCOME FUND Integrated Annual Report 2013
At the date of authorisation of these financial statements, the following standards and interpretations were in issue but not effective:
Standards not yet adopted
Statement
Effect for accounting periods beginning on or after Summary of key points
Impact on the group
IFrS 9 Financial instruments
1 January 2015 • IFRS9Financialinstruments,wasissuedinNovember2009 and amended in October 2010. The standard introduces new requirements for the classification and measurement of financial assets and financial liabilities.
• IFRS9requiredallrecognisedfinancialassetsthatarewithin the scope of IAS 39 Financial instruments. Recognition and measurement to be subsequently measured at amortised cost or for value.
• ThemostsignificanteffectofIFRS9regardingtheclassification and measurement of financial liabilities relates to the accounting for changes in fair value of a financial liability, designated as at fair value through profit or loss, attributable to changes in the credit risk of that liability.
• TherequirementsinIAS39relatingtoderecognitionoffinancial assets and financial liabilities have been incorporated unchanged into the new version of IFRS 9.
The impact on the group has not yet been estimated.
The standard has not yet been completed and the mandatory effective date may be changed.
IFrS 7 Amendment disclosures – offsetting financial assets and financial liabilities
1 January 2013 The amendments contain new disclosure requirements for financial assets and financial liabilities that are offset in the statement of financial position, or are subject to enforceable master netting arrangements or similar agreements.
No material impact is expected for the group.
IFrS 10 Consolidated financial statements
1 January 2013 IFRS 10 supersedes IAS 27 Annual and separate financial statements, and SIC 12 Consolidation – special purpose entities. It introduces a new, principle-based definition of control which will apply to all investees to determine the scope of consolidation.
No material impact is expected for the group.
IFrS 12 Disclosure of interests in other entities
1 January 2013 • IFRS12combinesthedisclosurerequirementsforsubsidiaries, joint arrangements, associates and structured entities within a comprehensive disclosure standard.
• Itaimstoprovidemoretransparencyon‘borderline’consolidation decisions and enhance disclosures about unconsolidated structured entities in which on investor or sponsor has involvement.
No material impact is expected for the group.
FINA
NC
IAL STA
TEMEN
TS

108 DIPULA INCOME FUND Integrated Annual Report 2013
NOTES TO THE ANNUAL FINANCIAL STATEMENTSfor the year ended 31 August 2013 (continued)
Statement
Effect for accounting periods beginning on or after Summary of key points
Impact on the group
IFrS 13 Fair value measurement
1 January 2013 • ThenewIFRSspecifieshowanentityshouldmeasurefairvalue and disclose fair value information.
• IFRS12hasbeendevelopto: – establish a single source of guidance for all fair value
measurements; – clarify the definition of fair value and related
guidance; and – enhance disclosures about fair value measurements
(the new disclosures increase transparency about fair value measurements, including the valuation techniques and inputs used to measure fair value).
No material impact is expected for the group.
IAS 32 Offsetting financial assets and financial liabilities
1 July 2014 The amendments clarify that an entity currently has a legally enforceable right to set-off if that night is:• notcontingentonafutureevent;and• enforceablebothinthenormalcourseofbusinessandin
the event of default, insolvency or bankruptcy of the entity and all counterparties.
No material impact is expected for the group.
IAS 1 1 January 2013 Annual Improvements 2009 – 2011 Cycle:Amendments clarifying the requirements for comparative information including minimum and additional comparative information required.
No material impact is expected for the group
IAS 27 1 January 2013 Consequential amendments resulting from the issue of IFRS 10, 11 and 12.
The impact on the group has not yet been estimated
1 January 2014 Requirementtoaccountforinterestsin‘InvestmentEntities’atfair value under IFRS 9, Financial Instruments, or IAS 39, Financial Instruments: Recognition and Measurement, in the separate financial statements of a parent.
The impact on the group has not yet been estimated
1 ACCOUNTINg POLICIES (continued)

109DIPULA INCOME FUND Integrated Annual Report 2013
grOUP COMPANy
2013 2012 2013 2012
r’000 R’000 r’000 R’000
2. INvESTMENT PrOPErTy 2.1 Net carrying value
Cost 3 324 931 2 158 729 – –
Fair value surplus 328 377 201 490 – –
3 653 308 2 360 219 – –
2.2 Movement for the year Investment properties at beginning of year 2 360 219 2 072 684 – –
Acquisitions/additions 1 169 182 256 227 – –
Transferred from non-current assets held-for-sale (note 9) 19 300 – – –
Transferred to non-current assets held-for-sale (note 9) (24 000) (50 945) – –
Disposals – (3 583) – –
Change in fair value 126 887 85 072 – –
Tenant installations (334) (301)
Capitalised 2 806 2 983 – –
Amortised (3 140) (3 284) – –
Lease commissions (and marketing commission) 2 054 1 065 –
Capitalised 4 497 3 726 – –
Amortised (2 443) (2 661) – –
Investment properties at end of year 3 653 308 2 360 219 – –
2.3 reconciliation to independent and directors valuations Investment properties at valuation at end of year per 2.2 above 3 653 308 2 360 219 – –
Straight-line rental income accrual – per the statement of financial position 69 686 33 267 – –
Independent and directors’ valuations 3 722 994 2 393 486 – –
Total valuations 3 722 994 2 393 486
Per independent valuations 2 823 618 1 948 447
Acquired in last six months at fair value 559 030 –
Per directors’ valuations 340 346 445 039
FINA
NC
IAL STA
TEMEN
TS

110 DIPULA INCOME FUND Integrated Annual Report 2013
2. INvESTMENT PrOPErTy (continued) A register of investment properties is available for inspection at the registered office of the company.
Refer also to the Property portfolio section on page 7 of the integrated report.
In terms of the accounting policy, the portfolio is valued annually, with properties above R8 million being valued by independent registered valuers and properties below R8 million being valued by the directors.
Properties acquired in the last six months of the year are not revalued, as the acquisition prices are considered to be the fair value.
All other properties above R8 million were valued by independent registered valuers on 31 August 2013. The valuations were performed by:
• AlternativeRealEstate • AssetValuationServicesCC • JonesLangLaSalleSouthAfrica
These valuators are all registered valuers in terms of section 19 of the Property Valuers Professional Act, No 47 of 2000.
The properties were valued using discounted cash flow methodology for both internal and external valuations. The valuations were done on an open market basis with consideration given to the future earnings potential and applying an appropriate discount rate to a property. Investment properties held-for-sale were valued at the net sale price, which is considered to be the fair value.
Investment properties are encumbered as set out in note 12.
grOUP COMPANy
2013r’000
2012R’000
2013r’000
2012R’000
3. STrAIgHT-LINE rENTAL INCOME ACCrUALBalance at beginning of year 33 267 34 415 – –Current year movement 36 419 (1 148) – –
Balance at end of year 69 686 33 267 – –
NOTES TO THE ANNUAL FINANCIAL STATEMENTSfor the year ended 31 August 2013 (continued)

111DIPULA INCOME FUND Integrated Annual Report 2013
grOUP COMPANy2013 2012 2013 2012r’000 R’000 r’000 R’000
4. gOODwILLreconciliation of goodwillBalance at beginning of year 48 482 48 482 – –Balance at end of year 48 482 48 482 – –
Goodwill acquired in a business combination is allocated, at acquisition, to the cash-generating units that are expected to benefit from that business combination. For the purpose of annual impairment testing goodwill is allocated to the following cash-generating units expected to benefit for the synergies of the business combination in which the goodwill arises.
Mergence Africa Property Fund (Pty) Ltd 35 155 35 155 – –
Askahe Realty Investment Fund (Pty) Ltd 13 327 13 327 – –
48 482 48 482 – –
The group tests goodwill annually for impairment, or more frequently if there are any indications that goodwill might be impaired.
The recoverable amount of each cash-generating unit was based on its value in use. The carrying amount of each cash-generating unit was compared to the recoverable amount.
The value in use of each cash-generating unit was determined by using the discounted cash flow valuation methodology.
Discounted cash flow valuations were based on cash flow forecasts in respect of the continuing use of the cash-generating unit.
For the year ended 31 August 2013 the value in use calculations were based on the following key assumptions:
• discountratesofbetween15,0%and16,5%,whicharebasedontheriskprofilesandexpected yields of the relevant property portfolios; and
• growthratesofbetween5,75%and7,00%whichdonotexceedforecastaveragelong-termgrowth rates relative to the markets in which the cash-generating units operate.
For the year ended 31 August 2012 the value in use calculations were based on the following key assumptions:
• discountratesofbetween15,0%and16,5%,whicharebasedontheriskprofilesandexpected yields of the relevant property portfolios; and
• growthratesofbetween5,75%and7,00%whichdonotexceedforecastaveragelong-termgrowth rates relative to the markets in which the cash-generating units operate.
No goodwill was impaired in either 2013 or 2012.
FINA
NC
IAL STA
TEMEN
TS

112 DIPULA INCOME FUND Integrated Annual Report 2013
grOUP COMPANy
2013 2012 2013 2012r’000 R’000 r’000 R’000
5. OTHEr NON-CUrrENT rECEIvAbLES Loan receivable from Stretford Land Developments (Pty) Ltd* 4 100 – – –Prepayment on property acquisition 1 500 – – –Loan receivable from Orange Farm Community Trust # 2 741 – – –
8 341 – – –
* The unsecured loan receivable from Stretford Land Developments is receivable on transfer of Orange Farm Phase 2 which is estimated to be in the last quarter of 2014
# Loan secured receivable from Orange Farm Community Trust relates to an economic development initiative. The loan bears interest at prime + 2% and is repayable on 15 December 2017. The loan is secured by a bond over the property
grOUP COMPANy
2013 2012 2013 2012r’000 R’000 r’000 R’000
6. INTErEST IN SUbSIDIArIESShares at cost – – 204 751 204 751 Loans to subsidiaries – – 3 351 584 2 076 615
– – 3 556 335 2 281 366
6.1 Shares at costEffective interest Investment
The company has interests in the following subsidiaries:
2013 2012 2013 2012% % r’000 R’000
Dipula Property Investment Trust 100 100 # #
Mergence Africa Property Fund (Pty) Ltd 100 100 41 856 41 856 Asakhe Realty Investment Fund (Pty) Ltd 100 100 162 895 162 895 Mergence Africa Property Investment Trust* 100 100 # #
Emerald Fire Investments (Pty) Ltd§ 100 100 # #
204 751 204 751
* Held through 100% interest in Mergence Africa Property Fund (Pty) Ltd.
§ Held through 100% interest in Asakhe Realty Investment Fund (Pty) Ltd.
# Less than R1 000
NOTES TO THE ANNUAL FINANCIAL STATEMENTSfor the year ended 31 August 2013 (continued)

113DIPULA INCOME FUND Integrated Annual Report 2013
grOUP COMPANy2013 2012 2013 2012r’000 R’000 r’000 R’000
6. INTErEST IN SUbSIDIArIES (continued)
6.2 Loans to subsidiariesMergence Africa Property Investment Trust 2 147 613 918 972 Dipula Property Investment Trust 744 016 739 328 Mergence Africa Property Fund (Pty) Ltd 298 841 258 806 Emerald Fire Investments (Pty) Ltd 136 804 147 996 Asakhe Realty Investment Fund (Pty) Ltd 24 310 11 513
The above loans are all unsecured and carry a variable rate of interest.Interest charged during the financial year ended 31 August 2013 was charged at an average rate of 8,8% (2012: 9,9%).
No fixed terms of repayment have been determined.Repayment is not expected within the next 12 months.
3 351 584 2 076 615
The carrying amounts of the loans approximate their fair value.
7. TrADE AND OTHEr rECEIvAbLES Trade receivables 23 316 13 851 – –Less: Impairment (5 933) (6 604) – –
17 383 7 247 – –Deposits 4 195 2 522 – –Pre-payments 198 2 544 – –VAT receivable – 113 – –Other receivables 2 348 1 205 – 17 Municpal credits 2 887 3 522 – –Loan receivable on sale of property# – 3 500 – –Loan receivable on purchase of McCormick Properties* – 2 288 – –
Tenant recovery accruals 6 972 2 369 – –
33 983 25 310 – 17 * The loan receivable was owing by McCormick Property Developers CC for rent collected on Dipula’s behalf as a
result of properties acquired from McCormick. The loan was repaid in September 2012# The loan receivable on sale of property was repaid in September 2012
FINA
NC
IAL STA
TEMEN
TS

114 DIPULA INCOME FUND Integrated Annual Report 2013
grOUP COMPANy2013 2012 2013 2012r’000 R’000 r’000 R’000
8. CASH AND CASH EqUIvALENTSFor the purpose of the cash flow statement, cash and cash equivalents comprise:Bank balances held at Standard Bank 21 771 15 116 51 –Cash deposited against Standard Bank access facility 31 512 90 200 31 512 90 200 Nedbank call account to be utilised on transfer of property 805 56 837 805 56 837
54 088 162 153 32 368 147 037
Material bank balances are with The Standard Bank of South Africa Limited who have a Fitch Rating of BBB+ and Nedbank Limited who have a rating of BBB+.
9. INvESTMENT PrOPErTy HELD-FOr-SALEAt beginning of year 54 987 21 400 – –Deferred taxation (2 642) 2 642 – –Disposals (26 445) (20 000) – –Transferred back to investment properties (note 2)* (19 300) – –
Remaining held-for-sale from prior year 6 600 4 042 Revaluation of prior year non-current assets held-for-sale (350) – – –
6 250 4 042 Transferred from investment property (note 2) 24 000 50 945 – –
At end of year 30 250 54 987 – –
* The purchaser for a property that was held-for-sale in the prior period reneged on the agreement and the property was thus transferred back to investment property. Management have subsequently suspended plans to sell the property
Sale agreements have been concluded prior to year-end for all of the properties held in non-current assets held-for-sale.
The risks and rewards of ownership pass on transfer which is expected to take place in the next financial year.
NOTES TO THE ANNUAL FINANCIAL STATEMENTSfor the year ended 31 August 2013 (continued)

115DIPULA INCOME FUND Integrated Annual Report 2013
grOUP COMPANy
2013 2012 2013 2012r’000 R’000 r’000 R’000
10. STATED CAPITAL Authorised
2 000 000 000 (2012: 2 000 000 000) ordinary shares of no par value – – – –
Issued
287 048 366 (2012: 211 113 786) ordinary shares of no par value 287 048 211 114 287 048 211 114 Less: 49 000 (2012: 49 000) ordinary
treasury shares (50) (50) – –
286 998 211 064 287 048 211 114
reconciliation of movement in issued shares (A and b shares)
Balance at beginning of year 427 852 427 852 468 940 468 940 Issue for cash (allocated to debenture premium) – – – –
Balance at end of year 427 852 427 852 468 940 468 940
The capital structure comprises an equal number of A and B ordinary shares.
An ordinary share is linked an A debenture which together comprises an A-linked unit (see note 11).
An ordinary share is linked a B debenture which together comprises a B-linked unit (see note 11).
The unissued shares are under the control of the directors. This authority remains in force until the next annual general meeting.
FINA
NC
IAL STA
TEMEN
TS

116 DIPULA INCOME FUND Integrated Annual Report 2013
grOUP COMPANy
2013 2012 2013 2012r’000 R’000 r’000 R’000
11. DEbENTUrE CAPITAL AND DEbENTUrE PrEMIUM Authorised
2 000 000 000 ordinary A debentures of 441 cents 8 820 000 8 820 000 8 820 000 8 820 000 2 000 000 000 ordinary B debentures of 441 cents 8 820 000 8 820 000 8 820 000 8 820 000 Issued
143 524 183 (2012: 105 556 893) A-debentures 143 524 105 557 143 524 105 557 143 524 183 (2012: 105 556 893) B-debentures 143 524 105 557 143 524 105 557 Less: Treasury units 24 500 A debentures
(2012: 24 500) (25) (25) – – Treasury units 24 500 B debentures
(2012: 24 500) (25) (25) – – 286 998 211 064 287 048 211 114
Movement for year
Balance at beginning of year 900 629 900 629 931 012 931 012 37 967 290 A debentures issued during year at 441 cents 167 436 – 167 436 –37 967 290 B debentures issued during year at 441 cents 167 436 – 167 436 –Debenture premium 273 934 – 273 934 –Amortisation of debenture premium (7 146) – (7 146) –Issue expenses (2 869) – (223) –
1 499 420 900 629 1 532 449 931 012
Each A debenture is indivisibly linked to one A ordinary share in the share capital of the company and each B debenture is indivisibly linked to one B ordinary share in the share capital of the company.
The debentures bear interest at a rate of not less than 99% of the distributable earnings as defined in the debenture trust deed.
Intially an A debenture bore interest at a rate of 9,25% based on the initial listing price. Subsequently the interest payable escalates by 5% per annum until 31 August 2017 and at the lower of 5% or CPI thereafter.
NOTES TO THE ANNUAL FINANCIAL STATEMENTSfor the year ended 31 August 2013 (continued)

117DIPULA INCOME FUND Integrated Annual Report 2013
11. DEbENTUrE CAPITAL AND DEbENTUrE PrEMIUM (continued) A B debenture is entitled to the balance of the distributable income as defined in the debenture
trust deed, after servicing the interest on the A debentures, divided by the number of B debentures in issue.
Interest on A debentures and B debentures (“debentures”) are payable on a six-monthly basis.
The rights of the A debenture holders and the B debenture holders to repayment are subordinated in favour of the claims of other creditors.
The debentures are redeemable:
• At the option of the debenture holders by a debenture special resolution on or within 90 days after: (1) 31 August 2041 (the “election” date); or (2) the 10th anniversary of the election date; or (3) every 10th anniversary of the election date thereafter subject to compliance with statutes
and the requirements of the JSE, as applicable; • At the option of the company subject to compliance with statutes and the requirements of the
JSE, as applicable; and • Immediately at the option of the trustee if the company fails to adhere to the terms of the trust
deed including monies owed in terms of the trust deed, commits an act of insolvency or disposes of, or attempts to dispose of the whole or substantially the whole of its undertaking.
Full details and the terms and conditions of the debentures are set out in the trust deed which is available for inspection.
12. INTErEST-bEArINg LIAbILITIES The group has entered into the following loan agreements, which together with the linked
unitholder capital are used to fund its investment activities:
The directors are not restricted by the Memorandum of Incorporation of the company as to the percentage of debt to net asset value that may be incurred.
Interest-bearing loans and borrowings are measured at amortised cost. The group’s exposure to interest rate and liquidity risk are discussed in note 26.2.
FINA
NC
IAL STA
TEMEN
TS

118 DIPULA INCOME FUND Integrated Annual Report 2013
NOTES TO THE ANNUAL FINANCIAL STATEMENTSfor the year ended 31 August 2013 (continued)
12. INTErEST-bEArINg LIAbILITIES (continued)12.1 bank loans12.1.1 The Standard bank of South Africa Limited (“Standard bank”)
grOUP COMPANy
2013 2012 2013 2012r’000 R’000 r’000 R’000
The company has secured a facility totalling R1,1 billion from Standard Bank. The facility is secured by mortgage bonds of R2 billion over investment property.with a carrying value of R3,072 billion 1 124 627 823 562 1 124 627 823 562
Amount Type of rate31 August 2013
rate Maturity
R117,2 million (2012: R75,9 million) Floating, based on 3-month jibar plus 2,38%* 7,41% 17 August 2016 117 246 75 867 117 246 75 867 R99,4 million (2012: R99,4 million) Floating, based on prime less 0,95%* 7,55% 17 August 2016 99 428 99 428 99 428 99 428 R506,7 million (2012: R506,7 million) Fixed 8,63% 17 August 2015 506 667 506 667 506 667 506 667 R100 million (2012: R100 million) Fixed 9,26% 17 August 2016 100 000 100 000 100 000 100 000 R20,9 million (2012: R0 million) Floating, based on 3-month jibar plus 1,9% 6,90% 31 July 2018 20 874 – 20 874 –R58 million (2012: R0 million) Floating, based on 3-month jibar plus 2,0% 7,14% 31 July 2018 58 000 – 58 000 –R111,8 million (2012: R0 million) Floating, based on 3-month jibar plus 1,7% 6,84% 31 July 2016 111 806 – 111 806 –R111,8 million (2012: R0 million) Floating, based on 3-month jibar plus 1,9% 7,14% 31 July 2018 111 806 – 111 806 –R0 million (2012: R42 million) Floating, based on prime less 1,25% 7,25% 11 June 2013 – 42 000* – 42 000 (R1,2) million (2012: R0,4 million raising fees (1 200) (400) (1 200) (400)R1,128 billion (2012: R823,6 million)* Should the loan to value of the loans increase from 40% to 45%, the liquidity margin would increase
by 10 bps
12.1.2 Nedbank Limited (“Nedbank”)
The company has a utilised facility totalling R342,1 million and an unutilised R182,9 million facility for future acquisitions from Nedbank.
The utilised facility is secured by mortgage bonds of R433 million over investment propertywith a carrying value of R720 million 339 644 125 000 339 644 125 000
Amount Type of rate31 August 2013
rate Maturity
R125 million (2012: R125 million) Fixed 8,95% 3 July 2017 125 000 125 000 125 000 125 000 R217,1 million (R0 million) Floating, based on prime less 1,45% 7,05% 2 July 2018 217 100 – 217 100 –(R2,5) million (2012: R0 million) raising fees (2 456) – (2 456) –
Total bank loans 1 464 271 948 562 1 464 271 948 562

119DIPULA INCOME FUND Integrated Annual Report 2013
12. INTErEST-bEArINg LIAbILITIES (continued)12.1 bank loans12.1.1 The Standard bank of South Africa Limited (“Standard bank”)
grOUP COMPANy
2013 2012 2013 2012r’000 R’000 r’000 R’000
The company has secured a facility totalling R1,1 billion from Standard Bank. The facility is secured by mortgage bonds of R2 billion over investment property.with a carrying value of R3,072 billion 1 124 627 823 562 1 124 627 823 562
Amount Type of rate31 August 2013
rate Maturity
R117,2 million (2012: R75,9 million) Floating, based on 3-month jibar plus 2,38%* 7,41% 17 August 2016 117 246 75 867 117 246 75 867 R99,4 million (2012: R99,4 million) Floating, based on prime less 0,95%* 7,55% 17 August 2016 99 428 99 428 99 428 99 428 R506,7 million (2012: R506,7 million) Fixed 8,63% 17 August 2015 506 667 506 667 506 667 506 667 R100 million (2012: R100 million) Fixed 9,26% 17 August 2016 100 000 100 000 100 000 100 000 R20,9 million (2012: R0 million) Floating, based on 3-month jibar plus 1,9% 6,90% 31 July 2018 20 874 – 20 874 –R58 million (2012: R0 million) Floating, based on 3-month jibar plus 2,0% 7,14% 31 July 2018 58 000 – 58 000 –R111,8 million (2012: R0 million) Floating, based on 3-month jibar plus 1,7% 6,84% 31 July 2016 111 806 – 111 806 –R111,8 million (2012: R0 million) Floating, based on 3-month jibar plus 1,9% 7,14% 31 July 2018 111 806 – 111 806 –R0 million (2012: R42 million) Floating, based on prime less 1,25% 7,25% 11 June 2013 – 42 000* – 42 000 (R1,2) million (2012: R0,4 million raising fees (1 200) (400) (1 200) (400)R1,128 billion (2012: R823,6 million)* Should the loan to value of the loans increase from 40% to 45%, the liquidity margin would increase
by 10 bps
12.1.2 Nedbank Limited (“Nedbank”)
The company has a utilised facility totalling R342,1 million and an unutilised R182,9 million facility for future acquisitions from Nedbank.
The utilised facility is secured by mortgage bonds of R433 million over investment propertywith a carrying value of R720 million 339 644 125 000 339 644 125 000
Amount Type of rate31 August 2013
rate Maturity
R125 million (2012: R125 million) Fixed 8,95% 3 July 2017 125 000 125 000 125 000 125 000 R217,1 million (R0 million) Floating, based on prime less 1,45% 7,05% 2 July 2018 217 100 – 217 100 –(R2,5) million (2012: R0 million) raising fees (2 456) – (2 456) –
Total bank loans 1 464 271 948 562 1 464 271 948 562
FINA
NC
IAL STA
TEMEN
TS

120 DIPULA INCOME FUND Integrated Annual Report 2013
NOTES TO THE ANNUAL FINANCIAL STATEMENTSfor the year ended 31 August 2013 (continued)
grOUP COMPANy
2013 2012 2013 2012r’000 R’000 r’000 R’000
12. INTErEST-bEArINg LIAbILITIES (continued)12.2 Non-bank loans12.2.1 Cashbuild South Africa (Pty) Ltd
On acquisition of Orange farm Phase 1, the group took over a loan to the vendor by Cashbuild. 11 100 – – –
Amount Type of rate Current rate Maturity
R11,1 million Fixed 6,50% 30 September 2027 11 100 – – –
12.2.2 blouberg Plaza (Pty) Ltd
The group had a loan from the vendors of Blouberg Plaza which was repaid upon transfer of the property which occurred in November 2012 – 10 826 – –
Amount Type of rate Current rate Maturity
R10,8 million Fixed 7,60% On transfer of property – 10 826* – –
12.2.3 bochum Plaza(Pty) Ltd
The group had a loan from the vendors of Bochum Plaza which was repaid upon transfer of the property which occurred in November 2012 – 95 833 – –
Amount Type of rate Current rate Maturity
R95,8 million Fixed 7,60% On transfer of property – 95 833* – –
12.2.4 McCormick Property Development CC
The group had a loan from the vendors of Bochum Plaza which was repaid upon transfer of the property which occurred in November 2012 – 10 549 – –
Amount Type of rate Current rate Maturity
R10,5 million Fixed 7,60% On transfer of property – 10 549* – –
Total non-bank loans 11 100 117 208 – –
Total interest-bearing loans 1 475 371 1 065 770 1 464 271 948 562 Less: Current portion – (159 208) – (42 000)
Non-current interest-bearing liabilities 1 475 371 906 562 1 464 271 906 562
* Current portion/repayable within 12 months

121DIPULA INCOME FUND Integrated Annual Report 2013
grOUP COMPANy
2013 2012 2013 2012r’000 R’000 r’000 R’000
12. INTErEST-bEArINg LIAbILITIES (continued)12.2 Non-bank loans12.2.1 Cashbuild South Africa (Pty) Ltd
On acquisition of Orange farm Phase 1, the group took over a loan to the vendor by Cashbuild. 11 100 – – –
Amount Type of rate Current rate Maturity
R11,1 million Fixed 6,50% 30 September 2027 11 100 – – –
12.2.2 blouberg Plaza (Pty) Ltd
The group had a loan from the vendors of Blouberg Plaza which was repaid upon transfer of the property which occurred in November 2012 – 10 826 – –
Amount Type of rate Current rate Maturity
R10,8 million Fixed 7,60% On transfer of property – 10 826* – –
12.2.3 bochum Plaza(Pty) Ltd
The group had a loan from the vendors of Bochum Plaza which was repaid upon transfer of the property which occurred in November 2012 – 95 833 – –
Amount Type of rate Current rate Maturity
R95,8 million Fixed 7,60% On transfer of property – 95 833* – –
12.2.4 McCormick Property Development CC
The group had a loan from the vendors of Bochum Plaza which was repaid upon transfer of the property which occurred in November 2012 – 10 549 – –
Amount Type of rate Current rate Maturity
R10,5 million Fixed 7,60% On transfer of property – 10 549* – –
Total non-bank loans 11 100 117 208 – –
Total interest-bearing loans 1 475 371 1 065 770 1 464 271 948 562 Less: Current portion – (159 208) – (42 000)
Non-current interest-bearing liabilities 1 475 371 906 562 1 464 271 906 562
* Current portion/repayable within 12 months FINA
NC
IAL STA
TEMEN
TS

122 DIPULA INCOME FUND Integrated Annual Report 2013
grOUP COMPANy
2013 2012 2013 2012r’000 R’000 r’000 R’000
13. DEFErrED TAXATION Arising on revaluation of property – 52 335 – –Arising on straight-lining adjustment – 9 171 – –Arising on provision for doubtful debts – (1 388) – –Arising on recognition of tax loss – (21 079) – –
– 39 039 – –
Movement for year
Balance at beginning of year 39 039 18 197 – –Change in Capital Gains Tax rate – 9 113 –
Arising on revaluation of property (52 335) 15 641 – –Arising on straight-lining adjustment (9 171) (321) – –Arising on provision for doubtful debts 1 388 650 – –Arising on recognition of assessed loss 21 079 (4 241) – –
Balance at end of year – 39 039 – –
Deferred tax balance split as follows:– deferred tax asset arising on held-for-sale
properties – 2 642 – –– deferred tax liability – (41 681) – –
– (39 039) – –
The Fund’s application to the JSE Limited for REIT status was approved on 24 June 2013.
The conversion to a REIT is effective from 1 September 2013. As such, the group will not be liable for Capital Gains Tax in terms of section 25BB of the Income Tax Act.
Deferred tax on investment properties and the related straight-line rental adjustment has been reduced to nil as Capital Gains Tax will no longer apply.
NOTES TO THE ANNUAL FINANCIAL STATEMENTSfor the year ended 31 August 2013 (continued)

123DIPULA INCOME FUND Integrated Annual Report 2013
grOUP COMPANy
2013 2012 2013 2012r’000 R’000 r’000 R’000
14. TrADE AND OTHEr PAyAbLES Trade payables 2 161 436 – –Accrued expenses 13 691 8 114 327 –Tenant deposits 17 955 15 057 – –Municipal expenses 5 913 3 807 – –Tenant receipts paid in advance 9 682 6 644 – –Interest due on interest-bearing liabilities 2 130 2 130
Payable to vendors 1 208 3 695 1 208 3 661 VAT payable 2 863 6 003 – –Other payables 1 190 2 364 141 657
56 793 46 120 3 806 4 318
15. NET OPErATINg PrOFIT/(LOSS) Net operating profit/(loss) includes the following income:Contingent turnover rental 3 658 522 – –Other income: – Net rental guarantee received 9 000 5 000 – 5 000 – Development project recoveries 3 500 – – –– Suretyshipship fee 610 – – –
Net operating profit/(loss) includes the following charges:Amortisation 5 913 3 002 330 100 Auditor’s remuneration 883 904 106 228 Audit fee: Current year 685 634 106 228 Audit fee: Prior year under provision 143 215 – – Other services 55 55 – –Asset management fees 8 763 7 240 – –Directors’ fees 761 698 – –Property management fees 10 875 8 586 –
Repairs and maintenance 6 231 6 763 – –Trustees remuneration 100 100 – –
FINA
NC
IAL STA
TEMEN
TS

124 DIPULA INCOME FUND Integrated Annual Report 2013
grOUP COMPANy2013 2012 2013 2012r’000 R’000 r’000 R’000
16. INTErEST PAIDInterest paid on interest-bearing liabilities 80 533 67 119 78 226 62 444 Amortisation of debt raising fees 330 100 330 100 Interest other – 86 – –
80 863 67 305 78 556 62 544
17. INTErEST rECEIvEDInterest received from financial institutions 4 563 1 174 4 159 24 Antecedent income 13 572 – 13 567 –Interest received from related parties – 100 276 700 206 627 Interest on overdue accounts 906 822 – –
19 041 2 096 294 426 206 651
18. TAXATIONNormal taxationCurrent 28 – 28 – Current year – – – – Adjustment to prior year 28 – 28 –Deferred (39 039) 20 843 – – Current year (39 039) 11 730 – – Change in Capital Gains Tax rate – 9 113 – –
(39 011) 20 843 28 –
reconciliation between applicable taxation rate and effective taxation rateSouth African normal taxation rate applied to income/(loss) before taxation 44 873 28 466 1 852 –Taxation effect of:– Rate change – 9 113 – –– Fair value adjustments and straight-lining
of leases (45 217) (7 887) – –– Capital loss – 955 – Permanent differences: Disallowable
expenditure (2 590) – (1 850) –– Deferred tax asset (recognised)/not
recognised in respect of tax losses 3 197 (10 167) –– Derecognition of prior year deferred
taxation balance on conversion to REIT (39 039) – –– Other (235) 363 26 –
Effective taxation (39 011) 20 843 28 –
No provision for normal taxation has been made as the group has an estimated tax loss of R102,5 million.
NOTES TO THE ANNUAL FINANCIAL STATEMENTSfor the year ended 31 August 2013 (continued)

125DIPULA INCOME FUND Integrated Annual Report 2013
grOUP
2013 2012r’000 R’000
19 EArNINgS, HEADLINE EArNINgS AND DISTrIbUTAbLE EArNINgSEarnings per linked unit are calculated on the weighted average number of units of 135 074 065 (2012: 105 532 393) and net earnings after taxation and interest distributions to linked unitholders of R199,3 million (2012: R80,8 million).
reconciliation between earnings, headline earnings and distributable earnings:
Profit for year attributable to equity holders 199 272 80 819 Debenture interest 215 216 147 947
Earnings attributable to linked unitholders 414 488 228 766 Changes in fair value of properties (net of deferred taxation) (178 872) (60 318) Changes in fair value of properties (126 537) (85 072) Deferred taxation on properties (52 335) 24 754
Headline earnings attributable to linked unitholders 235 616 168 448 Straight-line rental income accrual (net of deferred taxation) (45 590) 827 Straight-line rental income accrual (36 419) 1 148 Deferred taxation (9 171) (321)Lease cancellation income distributed/(not distributed) 9 511 (19 003)Deferred taxation reversed/(raised) on tax losses and doubtful debts provision 22 467 (3 591)Taxation paid 28 –Amortisation of debenture premium (7 146) –Amortisation of debt raising fees 330 –Pre-acquisition profits of Asakhe Realty acquired in 2011 – 1 266
Distributable earnings attributable to linked unitholders 215 216 147 947
Included in earnings is R9 million received in respect of a rental guarantee.
FINA
NC
IAL STA
TEMEN
TS

126 DIPULA INCOME FUND Integrated Annual Report 2013
grOUP COMPANy
2013 2012 2013 2012r’000 R’000 r’000 R’000
20. CASH gENErATED FrOM/(UTILISED IN) OPErATIONSProfit before taxation 160 261 101 662 6 613 –Adjusted for:Interest paid 80 863 67 305 78 556 62 544 Interest received (19 041) (2 096) (294 426) (206 652)Debenture interest 215 216 147 947 215 216 147 947 Other income (4 100) – – –Amortisation of debenture premium (7 146) – (7 146) –Fair value gain on investment property (126 537) (85 072) – –Guaranteed income recognised – (5 000) – (5 000)Straight-lining income accrual (36 419) 1 148 – –Amortisation of tenant installations 3 140 3 283 – –Amortisation of leasing commissions 2 443 2 661 – –
Operating income/(loss) before working capital changes 268 680 231 838 (1 187) (1 161)Working capital changes (131) 799 (2 625) (1 584) Increase in trade and other receivables (8 674) (4 233) 17 1 Increase in trade and other payables 8 543 5 032 (2 642) (1 585)
268 549 232 637 (3 812) (2 745)
21. DISTrIbUTIONS PAIDDistributions payable at beginning of year (76 790) (5 096) (76 790) (5 096)Distributions declared (215 216) (147 947) (215 216) (147 947)Distributions payable at end of year 112 652 76 790 112 652 76 790
(179 354) (76 253) (179 354) (76 253)
22. TAXATION PAIDTaxation payable at beginning of year – – – –Charge per the income statement (28) – (28) –Taxation payable at end of year – – – –
(28) – (28) –
NOTES TO THE ANNUAL FINANCIAL STATEMENTSfor the year ended 31 August 2013 (continued)

127DIPULA INCOME FUND Integrated Annual Report 2013
grOUP COMPANy
2013 2012 2013 2012r’000 R’000 r’000 R’000
23. COMMITMENTS 23.1 Capital commitments
Property acquisitions 775 568 1 298 593 Capital improvements on investment properties 97 000 13 900 – – Approved and committed – 13 900 Approved not yet committed 97 000 –
872 568 1 312 493 – –
* Dipula has signed agreements to acquire various properties:
Plaza Shopping Centre 179 500
Randfontein Shopping Centre 46 200
Bushbuckridge Shopping Centre 104 180
Orange Farm Phase 2 120 000
Tower Mall 154 500
UBC 26 000
Fairways on Main 31 000
Tsakane Corner 56 548
50 Hamilton 52 640
Fairlands 5 000
775 568
Dipula has committed to fund 33% of the Orange Farm Community Trust’s (“OFCT”) 10% investment in Orange Farm Phase 2.
This will take the form of a maximum loan to OFCT of R20,0 million (Dipulas’s portion being R6,6 million) and standing surety for OFCT’s loan from Standard Bank for R8,25 million (contingent liability).
The commitments will be funded using a combination of bank funding and capital.
FINA
NC
IAL STA
TEMEN
TS

128 DIPULA INCOME FUND Integrated Annual Report 2013
grOUP COMPANy
2013 2012 2013 2012r’000 R’000 r’000 R’000
24. MINIMUM LEASE PAyMENTS rECEIvAbLE Minimum lease payments comprise contractual rental income, excluding the straight-line lease adjustment, and operating expense recoveries due in terms of signed lease agreements on investment properties: – Receivable within one year 284 241 216 576 – –– Receivable within two to five years 436 630 387 868 – –– Receivable beyond five years 114 610 169 560 – –
835 481 774 004 – –
25. CONTINgENT LIAbILITIES AND gUArANTEES Guarantees totaling R3 428 957 (2012: R1 256 417) have been issued on the group’s behalf by
Standard Bank to various municipal councils in lieu of deposits for services.
Dipula has signed a limited suretyship of R12 million on behalf of Stredford Land Development (Pty) Ltd. The suretyship expires on practical completion of the Orange Farm Phase 2 development.
Per SENS release dated 28 June 2013, Rural Maintenance (Pty) Ltd (“Rural”), which previously supplied electricity management services to the Dipula Trust, has launched arbitration proceedings against Dipula and is claiming an amount of approximately R50 million. Having obtained legal advice, Dipula is satisfied that the claims are unfounded and without merit.
Refer to note 23 for surety of R8,25 million relating to Dipula standing surety for the Orange Farm Community Trust’s obligation to Standard Bank for its 10% investment in the Orange Farm Phase 2 development that will be completed in November 2014.
26. FINANCIAL rISk MANAgEMENT The group’s financial instruments consist mainly of deposits with banks, long-term liabilities, amounts
due from subsidiaries, and third parties, trade and other receivables, trade and other payables, debentures and linked unitholders for distribution. In respect of the aforementioned financial instruments, carrying value approximates fair value. Exposure to market, credit and liquidity risk arises in the normal course of business.
The group has exposure to the following risks from its use of financial instruments: • Credit risk • Liquidity risk • Market risk
NOTES TO THE ANNUAL FINANCIAL STATEMENTSfor the year ended 31 August 2013 (continued)

129DIPULA INCOME FUND Integrated Annual Report 2013
26. FINANCIAL rISk MANAgEMENT (continued) The board of directors has overall responsibility for the establishment and oversight of the group’s
risk management framework.
The board has delegated the responsibility for developing and monitoring the group’s risk management policies to the Audit and Risk Committee.
The committee reports to the board of directors on its activities. The group Audit and Risk Committee oversees how management monitors compliance with the group’s risk management policies and procedures and reviews the adequacy of the risk management framework in relation to the risks faced by the group.
The group’s risk management policies are established to ensure: • improved risk management and control; • the efficient allocation of funds to maximise returns; • the maintenance of acceptable levels of risk within the group as a whole; • efficient liquidity management and control of funding costs.
26.1 Credit risk management Credit risk Credit risk is the risk of financial loss to the group if a tenant or counterparty to a financial
instrument fails to meet its contractual obligations, and arises principally from the group’s receivables from tenants, cash and cash equivalents and other non-current loans.
Trade and other receivables The group’s exposure to credit risk is influenced mainly by the individual characteristics of
each tenant.
The group’s wide-spread customer base reduces credit risk.
The majority of rental revenue is derived from properties situated in Gauteng, and thus most of the credit risk is concentrated within this province. Management has established a credit policy under which each new customer is analysed individually for credit worthiness before the group’s standard payment terms and conditions are offered. When available, the the group’s review includes external ratings.
Trade and other receivables relate mainly to the group’s tenants and deposits with municipalities. In monitoring customer credit risk, customers are grouped according to their credit characteristics, including whether they are an individual or legal entity, industry, size of business and existence of previous financial difficulties.
All specific doubtful debts have been impaired and at year-end, management did not consider there to be any material credit risk exposure that was not already covered by an impairment adjustment.
FINA
NC
IAL STA
TEMEN
TS

130 DIPULA INCOME FUND Integrated Annual Report 2013
26. FINANCIAL rISk MANAgEMENT (continued)26.1 Credit risk management (continued) Trade and other receivables (continued) The quality of the remaining trade receivables is considered by management to be good and likely
to be recovered.
A large portion of trade receivables are in 90+ days but management have performed detailed risk assessments on each of the tenants comprising this balance. Tenants that have payment plans in place are abiding by these terms.
The impairment adjustment at 31 August 2013 was R5,9 million (2012: R6,6 million) net of tenant deposits or guarantees held as security. The company held tenant cash deposits and guarantees
with a fair value of R18,0 million at 31 August 2013 (2012: R15,7 million).
An individual account by account assessment was done based on past credit history, any prior knowledge of the debtor, insolvency or any other risks.
The specifically impaired receivables relate to tenants who have either been summonsed for non-payment, vacated the premises or who have a history of payment default.
It is expected that a portion of the specifically impaired receivables will be recovered.
grOUP
2013 2012r’000 R’000
Ageing of impaired trade receivables
Not more than 30 days 399 658 More than 30 days but not more than 60 days 492 432 More than 60 days but not more than 90 days 483 470 More than 90 days but not more than 120 days 481 356 More than 120 days 4 078 4 687
Total 5 933 6 603
Movements on the allowance for the impairment of trade receivables are as follows:
Opening balance 6 603 9 707 Subsidiaries acquired – –Impairment losses recognised on receivables 5 394 3 448 Impairment losses reversed on receivables (694) (2 738)Provision utilised during year (5 370) (3 814)
Closing balance 5 933 6 603
NOTES TO THE ANNUAL FINANCIAL STATEMENTSfor the year ended 31 August 2013 (continued)

131DIPULA INCOME FUND Integrated Annual Report 2013
26. FINANCIAL rISk MANAgEMENT (continued)26.1 Credit risk management (continued)
Trade and other receivables (continued)
The allowance for impaired receivables and receivables written off are included in property expenses.
Amounts charged to the allowance will be written off when all avenues for recovery have been exhausted and there is no expectation that any further cash will be received.
At reporting date no geographic area, rental sector or size of tenant had been identified as a specific credit risk.
grOUP
2013 2012r’000 R’000
receivables past due but not impaired
Receivables are considered to be “past due” when they are uncollected one day or more beyond their contractual due date.
Total trade receivables (note 7) net of impairments 17 383 7 247 Trade receivables neither past due nor impaired (5 316) –
Trade receivables past due but not impaired 12 067 7 247
As at 31 August 2012, trade receivables of R12,0 million (2012: R7,2 million) were considered past due but not impaired. These include varied customers with no recent history of payment default.
The ageing of these trade receivables is as follows:
Ageing of trade receivables past due but not impaired
Not more than 30 days 6 172 2 754 More than 30 days but not more than 60 days 2 119 1 228 More than 60 days but not more than 90 days 999 832 More than 90 days 2 777 2 433
Maximum exposure to credit losses from receivables, after impairment 12 067 7 247 Less: VAT (1 482) (890)
Credit risk exposure 10 585 6 357 Credit risk exposure mitigated through:Deposits and guarantees held (7 168) (4 254)
Residual exposure 3 417 2 103 FINA
NC
IAL STA
TEMEN
TS

132 DIPULA INCOME FUND Integrated Annual Report 2013
26. FINANCIAL rISk MANAgEMENT (continued)26.1 Credit risk management (continued) Cash and cash equivalents The group’s exposure to credit risk is limited through the use of financial institutions of good
standing for investment and cash-handling purposes.
Sureties The group’s policy is to provide sureties with regards to subsidiaries to the extent required in the
normal course of business.
Such sureties are provided to enable the subsidiaries to obtain the funding necessary to enable them to acquire investment property or investments.
Certain sureties have been given relating to the development of Orange Farm Phase 2. The sureties are backed by second bonds on the property.
Loan to related party Loans are only made to entities known to the directors where their recoverability is assured beyond
any reasonable doubt.
Other short-term loans Loans are only made to entities known to the directors where their recoverability is assured beyond
any reasonable doubt.
26.2 Liquidity risk Liquidity risk is the risk that the group will not be able to meet its financial obligations relating to
linked unit interest, interest-bearing liabilities and trade and other payables as they fall due. The group ensures that it always has adequate funds available and seeks to borrow for as long as possible at the lowest possible cost. Liquidity requirements are managed by monitoring forecasted cash flows and the maturity profile of financial liabilities.
The group receives rental on a monthly basis and deposits this into the access facilities of the bank loans until the cash is required to pay distributions. Typically the group ensures that it has sufficient cash on demand to meet expected operational expenses, including the servicing of financial obligations. This excludes the potential impact of extreme circumstances that cannot reasonably be predicted, such as natural disasters.
NOTES TO THE ANNUAL FINANCIAL STATEMENTSfor the year ended 31 August 2013 (continued)

133DIPULA INCOME FUND Integrated Annual Report 2013
26. FINANCIAL rISk MANAgEMENT (continued)26.2 Liquidity risk (continued) A maturity analysis of financial assets and liabilities is set out in the table below. This analysis
excludes interest payments on debentures as the amounts involved are dependent on future changes in interest rates.
Less than 1 year
1 to 5 years
More than 5 years Total
grOUP r’000 r’000 r’000 r’000
year ended 31 August 2013
Financial assets
Trade and other receivables 33 786 – – 33 786
Other non-current receveiables – 4 100 2 741 6 841
Cash and cash equivalents 54 088 – – 54 088
Total financial assets 87 874 4 100 2 741 94 715
Financial liabilities
Debenture capital – – 1 225 486 1 225 486
Interest-bearing liabilities 117 611 1 475 371 – 1 592 982
Trade and other payables 42 119 – – 42 119
Linked unitholders for distribution 112 652 – – 112 652
Total financial liabilities 272 382 1 475 371 1 225 486 2 973 239
Year ended 31 August 2012Financial assets
Trade and other receivables 22 653 – – 22 653 Loan to related party 1 202 – – 1 202 Cash and cash equivalents 162 153 – – 162 153
Total financial assets 186 008 – – 186 008
Financial liabilities
Debenture capital – – 930 796 930 796 Interest-bearing liabilities 241 724 906 562 – 1 148 286 Trade and other payables 33 473 – – 33 473 Linked unitholders for distribution 76 790 – 76 790
Total financial liabilities 351 987 906 562 930 796 2 189 345
FINA
NC
IAL STA
TEMEN
TS

134 DIPULA INCOME FUND Integrated Annual Report 2013
26. FINANCIAL rISk MANAgEMENT (continued)26.2 Liquidity risk (continued)
Less than 1 year
1 to 5 years
More than 5 years Total
COMPANy r’000 r’000 r’000 r’000
year ended 31 August 2013
Financial assets Trade and other receivables – – – –
Related party loan – – – –
Cash and cash equivalents 32 368 – – 32 368
Total financial assets 32 368 – – 32 368
Financial liabilities
Debenture capital – – 1 532 449 1 532 449
Interest-bearing liabilities 116 889 1 464 271 – 1 581 160
Trade and other payables 3 806 – – 3 806
Linked unitholders for distribution 112 652 – – 112 652
Total financial liabilities 233 347 1 464 271 1 532 449 3 230 067
Year ended 31 August 2012Financial assets
Trade and other receivables 17 – – 17 Related party loan 1 202 – – 1 202 Cash and cash equivalents 147 037 – – 147 037
Total financial assets 148 256 – – 148 256
Financial liabilities
Debenture capital – – 931 012 931 012 Interest-bearing liabilities 122 289 906 562 – 1 028 851 Trade and other payables 4 318 – – 4 318 Linked unitholders for distribution 76 790 – – 76 790
Total financial liabilities 203 397 906 562 931 012 2 040 971
26.3 Market risk Interest rate risk Market risk is the risk that changes in interest rate will affect the group’s income or the value of its
holdings of financial instruments. The objective of market risk management is to manage and control market risk exposure within acceptable parameters, while optimising the return.
The group is exposed to interest rate risk through its variable rate cash balances and long-term balances (refer to managing debt section).
NOTES TO THE ANNUAL FINANCIAL STATEMENTSfor the year ended 31 August 2013 (continued)

135DIPULA INCOME FUND Integrated Annual Report 2013
26. FINANCIAL rISk MANAgEMENT (continued)26.3 Market risk (continued) Interest rate risk (continued) The group reduces its exposure to changes in interest rates by fixing interest rates in respect of at
least 75% of its borrowings. This is achieved by entering into fixed rate loans. At year-end the level of fixed rate loans was 50%, but by the time of issuing of this report the level had increased to 74%.
An increase/(decrease) of 1% in interest rates for the year ended 31 August 2013 would have decreased/(increased) distributions to unitholders by approximately R7,4 million (2012: R2,2 million).
Currency risk The group has no exposure to currency risk.
Equity price risk The group is not exposed to equity price risk.
26.4 Fair values A number of the group’s accounting policies and disclosures require the determination of fair value,
for both financial and non- financial assets and liabilities. Fair values have been determined for measurement and/or disclosure purposes based on the methods below. When applicable further information about the assumption made in determining fair values is disclosed in the notes specific to that asset or liability.
IFRS 7 requires that an entity disclose for each class of financial instruments measured at fair value, the level in the fair value hierarchy into which the fair value measurements are categorised in their entirety.
The different levels have been defined as: Level 1 – fair value is determined from quoted prices (unadjusted) in active markets for identical
asset or liabilities; Level 2 – fair value is determined through the use of valuation techniques based on observable
inputs, either directly or indirectly; Level 3 – fair value is determined through the use of valuation techniques using significant inputs.
The debenture capital liability is a level 2 in the hierarchy.
FINA
NC
IAL STA
TEMEN
TS

136 DIPULA INCOME FUND Integrated Annual Report 2013
26. FINANCIAL rISk MANAgEMENT (continued)26.5 Analysis of financial instruments by category
Financial assets
Financial liabilities Non-
financial assets/
liabilitiesLoans and
receivables
At amortised
cost Total
grOUP r’000 r’000 r’000 r’000
year ended 31 August 2013
Financial assets
Trade and other receivables 33 785 – 198 33 983
Other non-current receivables 6 841 – 1 500 8 341
Cash and cash equivalents 54 088 – – 54 088
Total financial assets 94 714 – 1 698 96 412
Financial liabilities
Debenture capital – 1 225 486 273 934 1 499 420
Interest-bearing liabilities – 1 475 371 – 1 475 371
Trade and other payables – 42 119 14 674 56 793
Linked unitholders for distribution – 112 652 – 112 652
Total financial liabilities – 2 855 628 288 608 3 144 236
Year ended 31 August 2012Financial assets
Trade and other receivables 22 653 – 2 657 25 310 Loan to related party 1 202 – – 1 202 Cash and cash equivalents 162 153 – – 162 153
Total financial assets 186 008 – 2 657 188 665
Financial liabilities
Debenture capital – 900 629 – 900 629 Interest-bearing liabilities – 1 065 770 – 1 065 770 Trade and other payables – 33 473 12 647 46 120 Linked unitholders for distribution – 76 790 – 76 790
Total financial liabilities – 2 076 662 12 647 2 089 309
NOTES TO THE ANNUAL FINANCIAL STATEMENTSfor the year ended 31 August 2013 (continued)

137DIPULA INCOME FUND Integrated Annual Report 2013
26. FINANCIAL rISk MANAgEMENT (continued)26.5 Analysis of financial instruments by category (continued)
Financial assets
Financial liabilities
Non-financial
assets/liabilities
Loans and receivables
At amortised
cost Total
COMPANy r‘000 r‘000 r’000 r‘000
year ended 31 August 2013
Financial assets
Trade and other receivables – – – –
Loan to related party – – – –
Cash and cash equivalents 32 368 – – 32 368
Total financial assets 32 368 – – 32 368
Financial liabilities
Debenture capital – 1 258 515 273 934 1 532 449
Interest-bearing liabilities – 1 464 271 – 1 464 271
Trade and other payables – 3 806 – 3 806
Linked unitholders for distribution – 112 652 – 112 652
Total financial liabilities – 2 839 244 273 934 3 113 178
Year ended 31 August 2012Financial assets
Trade and other receivables 17 – – 17 Loan to related party 1 202 – – 1 202 Cash and cash equivalents 147 037 – – 147 037
Total financial assets 148 256 – – 148 256
Financial liabilities
Debenture capital – 931 012 – 931 012 Interest-bearing liabilities – 948 562 – 948 562 Trade and other payables – 4 318 – 4 318 Linked unitholders for distribution – 76 790 – 76 790
Total financial liabilities – 1 960 682 – 1 960 682
FINA
NC
IAL STA
TEMEN
TS

138 DIPULA INCOME FUND Integrated Annual Report 2013
27. CAPITAL MANAgEMENT The group considers both the equity attributable to equity holders and linked debentures as the
permanent capital of the group.
The board’s policy is to maintain a strong capital base so as to maintain investor, creditor and market confidence and to sustain future development of the business. The board of directors also monitors the level of distribution to unitholders. The board seeks to maintain a balance between the higher returns that might be possible with higher levels of borrowings and the advantages and security afforded by a sound capital position. The were no changes in the group’s approach to capital management during the year.
In terms of the Dipula’s Memorandum of Incorporation and the trust deed, there are no restrictions on borrowings. However, to protect Dipula’s exposure, the board has imposed a limit on borrowings to 45% of total assets.
In terms of Dipula’s Memorandum of Incorporation and trust deed, there are no restrictions on borrowings. However, to protect Dipula’s exposure, the board has imposed a limit on borrowings to 45% of the total property portfolio. In practice, Dipula aims to limit borrowings to 45% of the total property portfolio.
2013 2012r’000 R’000
Value of the property portfolio 3 753 244 2 445 831 45% thereof 1 688 960 1 100 624 Long-term borrowings utilised (1 475 371) (1 008 933) Total interest-bearing liabilities (1 475 371) (1 065 770) Add back: Draw down on facility granted invested in call
account (note 7) – 56 837
Unutilised borrowings capacity 213 589 91 691
28. ACCOUNTINg ESTIMATES AND JUDgEMENTS Management discusses with the Audit and Risk Committee the development, selection and
disclosure of the group’s critical accounting policies and estimates and the application of these policies and estimates.
Investment property The revaluation of investment property requires judgement in the determination of future cash flows
from leases and an appropriate capitalisation rate which vary between 9,0% and 13,0% (2012: 9,0% and 14,0%). Changes in the capitalisation rate attributable to changes in market conditions can have a significant impact on property valuations.
The directors have assessed the properties acquired and have concluded that in their view these acquisitions are property acquisition in terms of IAS 40 and are therefore accounted for in terms of that standard.
NOTES TO THE ANNUAL FINANCIAL STATEMENTSfor the year ended 31 August 2013 (continued)

139DIPULA INCOME FUND Integrated Annual Report 2013
28. ACCOUNTINg ESTIMATES AND JUDgEMENTS (continued) Investment property (continued) In the opinion of the directors these properties did not constitute a business as defined in terms
of IFRS 3, as there were not adequate processes identified within these properties to warrant classification as businesses.
Impairment of assets The group tests whether assets have suffered any impairment in accordance with the accounting
policy stated in note 1. The recoverable amounts of cash-generating units and intangible assets have been determined based on future cash flows discounted to their present value using appropriate rates. Estimates are based on interpretation of generally accepted industry-based market forecasts (refer to note 4).
Trade and other receivables Management identifies impairment of trade and other receivables on an ongoing basis. Impairment
adjustments are raised against trade receivables when the collectability is considered to be doubtful. Management believes that the impairment write off is conservative and there are no significant trade and other receivables that are doubtful and have not been written off. In determining whether a particular receivable could be doubtful, the following factors are taken into consideration:
• age; • customer current financial status; and • security held.
Debentures and equity At the date of listing the directors considered the fair value of the debentures to be 441 cents.
This value was based on the shareholder loans in Dipula that were converted to the debentures before listing and this established the issue price/fair value of the debenture portion of the linked unit. The debentures are recognised as liabilities as there is a contractual obligation on Dipula to deliver cash to the holders in the form of distributions. The units issued subsequently were issued on the same basis with the understanding that the debenture portion is 441 cents and that the return on this was linked to the risk profile of the debentures – being subordinated debt.
During the year the company issued new units. The directors considered the fair value of these debentures and concluded that the full issue price of the units should be allocated to the debenture capital. This value was based on the future expected distributions discounted using a market related yield.
A debenture premium arose as the difference between the issue price and the face value of the debentures of 441 cents.
FINA
NC
IAL STA
TEMEN
TS

140 DIPULA INCOME FUND Integrated Annual Report 2013
grOUP COMPANy2013 2012 2013 2012r’000 R’000 r’000 R’000
29. rELATED PArTy TrANSACTIONSParties are considered to be related if one party has the ability to control the other party or exercise significant influence over the other party in making financial or operational decisions.
Related parties with whom Dipula transacted during the year were:
Dipula Asset Mangement Trust – Asset management fee paid 8 763 7 240 – –– Management fees capitalised to
redeveloped buildings 844 – – –Relationship: Asset manager, board representation
Dipula Property Investment Trust – Interest received – – 72 313 74 915 – Loan receivable from related party – – 744 016 739 328 Relationship: Subsidiary
Mergence Africa Property Investment Trust – Interest received – – 130 741 77 497 – Loan receivable from related party – – 2 147 613 918 972 Relationship: Subsidiary
Asakhe realty Investment Fund (Pty) Ltd – Interest received – – 12 929 10 025 – Loan receivable from related party – – 24 310 11 519 Relationship: Subsidiary
Emerald Fire Investments (Pty) Ltd – Interest received – – 20 682 24 323 – Loan receivable from related party – – 136 804 147 996 Relationship: Subsidiary
Mergence Africa Property Fund (Pty) Ltd – Interest received – – 40 036 19 767 – Loan receivable from related party – – 298 841 258 806 Relationship: Subsidiary
Dijalo Property Services (Pty) Ltd – Interest received – 101 – 101 – Interest paid – – – –– Asset management fee paid – – – –– Loan receivable from related party – 1 202 – 1 202 Relationship: Director The loan to Dijalo Property Services was unsecured, bore interest at a fixed interest rate of 8,59% compounded monthly and was repaid in September 2012.
NOTES TO THE ANNUAL FINANCIAL STATEMENTSfor the year ended 31 August 2013 (continued)

141DIPULA INCOME FUND Integrated Annual Report 2013
30. SEgMENTAL INFOrMATION The entity has three reportable segments based on the sectoral nature – these are the entity’s
strategic business segments. For each strategic business segments, the entity’s executive directors review internal management reports on a monthly basis. All segments are located in South Africa. There are no single major customers.
The segmental information is limited: On the statement of comprehensive income to: – contractual rental income – property expenses On the statement of financial position to: – investment properties excluding developments – non-current assets held-for-sale – additions and disposals
All debt is negotiated at a group level and none of the subsidiaries carry any long-term debt, other than inter-company loans.
All other line items are allocated to corporate as they are not split between the sub-sectors above for management purposes.
retail Industrial Offices Corporate Total
r’000 r’000 r’000 r’000 r’000
2013
Extracts from the statement of comprehensive income
Rental income 182 963 45 893 109 445 – 338 301
Property expenses (34 567) (10 888) (24 681) – (70 136)
Net property income 148 396 35 005 84 764 – 268 165
Straight-line rental income accrual 19 697 4 940 11 782 – 36 419
Other income 4 276 – 9 000 – 13 276
Administration and corporate costs – – – (14 244) (14 244)
Net operating profit 172 369 39 945 105 546 (14 244) 303 616
Extracts from the statement of financial position
Investment property at year-end 2 148 314 449 625 1 125 055 – 3 722 994
Non-current assets held-for-sale (excluding deferred taxation) 1 400 – 28 850 – 30 250
Additions 604 383 86 257 478 542 – 1 169 182
Disposals (15 462) (9 727) (1 256) – (26 445)
FINA
NC
IAL STA
TEMEN
TS

142 DIPULA INCOME FUND Integrated Annual Report 2013
30. SEgMENTAL INFOrMATION (continued)Retail Industrial Offices Corporate Total
R’000 R’000 R’000 R’000 R’000
2012Extracts from the statement of comprehensive income
Rental income 148 530 42 286 109 915 – 300 731 Property expenses (28 105) (9 933) (20 042) – (58 080)
Net property income 120 425 32 353 89 873 – 242 651 Straight-line rental income accrual – – – (1 148) (1 148)Administration and corporate costs – – – (11 757) (11 757)
Net operating profit 120 425 32 353 89 873 (12 905) 229 746
Extracts from the statement of financial position
Investment property at year-end 1 443 149 353 419 596 918 – 2 393 486
Non-current assets held-for-sale (excluding deferred taxation) 17 075 9 770 25 500 – 52 345
Additions 255 622 – 605 256 227 Disposals 3 583 – – 3 583
NOTES TO THE ANNUAL FINANCIAL STATEMENTSfor the year ended 31 August 2013 (continued)

143DIPULA INCOME FUND Integrated Annual Report 2013
Dipula Income Fund Limited(Incorporated in the Republic of South Africa)(Registration number 2005/013963/06)JSE share code: DIA (A-linked units); DIB (B-linked units)ISIN: ZAE000158317 (A-linked units); ZAE000158325 (B-linked units)(Approved as a REIT by the JSE)(“Dipula” or “the company”)
Notice is hereby given that the annual general meeting of shareholders and debenture holders (“unitholders”) of Dipula will be held at the offices of Dipula at Block B Dunkeld Park, 6 North Road, Dunkeld West on Thursday, 13 February 2014 at 10:00 for the purposes of:
A. receiving and adopting the audited consolidated annual financial statements of the company and the group for the year ended 31 August 2013 and incorporating the Directors’ report, the Audit and risk Committee report and Social and Ethics Committee report. A copy of the complete consolidated annual financial statements of the company for the preceding financial year may be obtained from the company’s registered office at block b Dunkeld Park, 6 North road, Dunkeld west, 2196;
b. Transacting any other business as may be transacted at an annual general meeting of unitholders of a company.
C. Considering and, if deemed fit, adopting, with or without modification, the special and ordinary resolutions set out below:
IMPOrTANT DATES
Record date for purposes of receiving this notice: Friday, 3 January 2014.
Last day to trade in order to be eligible to participate in and vote at the annual general meeting: Friday, 31 January 2014.
Record date for purposes of voting at the meeting (“voting record date”): Friday, 7 February 2014.
Last day to lodge forms of proxy by 10:00 on: Tuesday, 11 February 2014.
Annual general meeting held at 10:00 on: Thursday, 13 February 2014.
Results of annual general meeting released on SENS on: Thursday, 13 February 2014.
Kindly note that in terms of section 62(3)(e) of the Companies Act 71 of 2008 (“the Act”):• aunitholderentitledtoattendandvoteattheannualgeneralmeetingisentitledtoappointaproxyto
attend, participate in and vote at the meeting in the place of the unitholder;• aproxyneednotalsobeaunitholderofthecompany;• meetingparticipants(includingproxies)arerequiredtoprovidereasonablysatisfactoryidentification
before being entitled to attend or participate in the annual general meeting; and• theChairmanmustbereasonablysatisfiedthattherightofanypersontoparticipateinandvote
(whether as a unitholder or as a proxy for a unitholder) has been reasonably verified.
Forms of identification include valid identity documents, drivers’ licences and passports.
NOTICE OF ANNUAL GENERAL MEETING OF SHAREHOLDERS AND DEBENTURE HOLDERS/UNITHOLDERS
FINA
NC
IAL STA
TEMEN
TS

144 DIPULA INCOME FUND Integrated Annual Report 2013
1.1 Special resolution number 1: Financial assistance to related or inter-related company “Resolved that, to the extent required by the Companies Act, 71 of 2008 (“Companies Act”), the
board of directors of the company may, subject to compliance with the requirements of the company’s Memorandum of Incorporation, the Companies Act and the JSE Listings Requirements, each as presently constituted and as amended from time to time, authorise the company to provide direct or indirect financial assistance in terms of section 45 of the Companies Act by way of loans, guarantees, the provision of security or otherwise, to any of its present or future subsidiaries and/or any other company or corporation that is or becomes related or inter-related (as defined in the Companies Act) to the company for any purpose or in connection with any matter, such authority to endure until the next annual general meeting of the company.”
reason for and effect of special resolution number 1 The company would like the ability to provide financial assistance, if necessary, in accordance with
section 45 of the Companies Act. This authority is necessary for the company to provide financial assistance in appropriate circumstances. Under the Companies Act, the company will, however, require the special resolution referred to above to be adopted, provided that the board of directors of the company is satisfied that the terms under which the financial assistance is proposed to be given are fair and reasonable to the company and, immediately after providing the financial assistance, the company would satisfy the solvency and liquidity test contemplated in the Companies Act. In the circumstances and in order to ensure, inter alia, that the company’s subsidiaries and other related and inter-related companies and corporations have access to financing and/or financial backing from the company (as opposed to banks), it is necessary to obtain the approval of unitholders, as set out in special resolution number 1. Therefore, the reason for, and effect of, special resolution number 1 is to permit the company to provide direct or indirect financial assistance (within the meaning attributed to that term in section 45 of the Companies Act) to the entities referred to in special resolution number 1 above.
This resolution will require the support of at least 75% of the voting rights exercised on it in order for it to be adopted.
1.2 Special resolution number 2: Approval of non-executive directors fees: 1.2.1 “Resolved, as a special resolution, that the fees payable by the company to non-executive
directors for their services as directors (in terms of section 66 of the Companies Act) be and are hereby approved for a period of two years from the passing of this resolution or until its renewal, whichever is the earliest, as follows:
Board chairperson R245 500 per annum Non-executive director R175 000 per annum Audit and Risk Committee chairperson R60 000 per annum Audit and Risk Committee member R44 000 per annum Investment Committee chairperson R60 000 per annum Investment Committee member R44 000 per annum Social, Ethics and Sustainability Committee chairperson R60 000 per annum Social, Ethics and Sustainability Committee member R44 000 per annum
NOTICE OF ANNUAL GENERAL MEETING OF SHAREHOLDERS AND DEBENTURE HOLDERS/UNITHOLDERS

145DIPULA INCOME FUND Integrated Annual Report 2013
1.2.2 “Resolved, as a special resolution, that an annual increase not exceeding 10% of the fees payable by the company to the non-executive directors for their services as non-executive directors be and is hereby approved for a period of two years from the passing of this resolution or until its renewal, whichever is the earliest.”
In order for special resolutions numbers 1.2.1 and 1.2.2 to be adopted the support of at least 75% of the total number of votes exercisable by shareholders, present in person or by proxy, is required to pass those resolutions.
1.3 Ordinary resolution number 1: re-election of director “Resolved that ZJ Matlala who retires as a director in terms of the company’s Memorandum of
Incorporation and who, being eligible, offers herself for re-election, be re-elected as a director of the company.”
An abridged curriculum vitae is included in the integrated annual report of which this notice forms part.
This resolution will require the support of more than 50% of the voting rights exercised on it in order for it to be adopted.
1.4 Ordinary resolution number 2: re-election of director “Resolved that Y Waja who retires as a director in terms of the company’s Memorandum of
Incorporation and who, being eligible, offers himself for re-election, be re-elected as a director of the company.”
An abridged curriculum vitae is included in the integrated annual report of which this notice forms part.
This resolution will require the support of more than 50% of the voting rights exercised on it in order for it to be adopted.
1.5 Ordinary resolution number 3: re-appointment of members of the Audit and risk Committee 1.5.1 Ordinary resolution number 3.1: re-appointment of y waja as a member of the Audit and
risk Committee “Resolved that Y Waja be re-appointed as a member and chairman of the Audit and Risk
Committee.”
This resolution will require the support of more than 50% of the voting rights exercised on it in order for it to be adopted.
1.5.2 Ordinary resolution number 3.2: re-appointment of bH Azizollahoff as a member of the Audit and risk Committee
“Resolved that BH Azizollahoff be re-appointed as a member of the Audit and Risk Committee.”
FINA
NC
IAL STA
TEMEN
TS

146 DIPULA INCOME FUND Integrated Annual Report 2013
This resolution will require the support of more than 50% of the voting rights exercised on it in order for it to be adopted.
1.5.3 Ordinary resolution number 3.3: re-appointment of E Links as a member of the Audit and risk Committee
“Resolved that E Links be re-appointed as a member of the Audit and Risk Committee.”
This resolution will require the support of more than 50% of the voting rights exercised on it in order for it to be adopted.
1.6 Ordinary resolution number 4: re-appointment of auditors “Resolved that Grant Thornton (Jhb) Inc. together with Rudi Huiskemp be re-appointed as the auditors
of the company.”
The Audit and Risk Committee has nominated for appointment as auditors of the company under section 90 of the Companies Act, Grant Thornton (Jhb) Inc..
This resolution will require the support of more than 50% of the voting rights exercised on it in order for it to be adopted.
1.7 Ordinary resolution number 5: Unissued linked units “Resolved that up to a maximum of 5% of the authorised but unissued linked units of the company be
and are placed under the control of the directors of the company which directors are hereby authorised and empowered to allot, issue and otherwise dispose of such linked units to such person or persons on such terms and conditions and at such times as the directors of the company may from time to time and in their discretion deem fit subject to the provisions of the Companies Act, 2008, any debenture trust deed entered into by the company, the Memorandum of Incorporation of the company and the JSE Listings Requirements.”
This resolution will require the support of more than 50% of the voting rights exercised on it in order for it to be adopted.
1.8 Ordinary resolution number 6: Issue of linked units for cash “Resolved that, pursuant to the Memorandum of Incorporation of the company, the directors of the
company be and are hereby authorised until this authority lapses at the next annual general meeting of the company, provided that this authority shall not extend beyond 15 months, to allot and issue linked units for cash subject to the JSE Listings Requirements and the Companies Act, 2008, on the following basis:
(a) the allotment and issue of linked units for cash shall be made only to persons qualifying as public shareholders and not to related parties, as defined in the JSE Listings Requirements;
NOTICE OF ANNUAL GENERAL MEETING OF SHAREHOLDERS AND DEBENTURE HOLDERS/UNITHOLDERS

147DIPULA INCOME FUND Integrated Annual Report 2013
(b) the number of linked units issued for cash shall not exceed 7,7 million A-linked units and 7,8 million B-linked units, being 5% of the company’s issued linked units as at the close of this notice of annual general meeting, provided that:
(i) any linked units issued under this authority, prior to this authority lapsing shall be deducted from the 7,7 million A-linked and 7,8 million B-linked units the company is authorised to issue in terms of this authority;
(ii) in the event of a sub-division or consolidation of linked units prior to this authority lapsing, the existing authority shall be adjusted accordingly to represent the same allocation ratio;
(c) the maximum discount at which linked units may be issued for cash is 5% of the weighted average price on the JSE of those linked units over 30 days prior to the date that the price of the issue is agreed between the company and the party subscribing for the linked units;
(d) after the company has issued linked units for cash which represent, on a cumulative basis within a financial year 5% or more of the number of linked units in issue prior to that issue, the company shall publish an announcement containing full details of the issue, including the effect of the issue on the net asset value, net tangible asset value, earnings, headline earnings and, if applicable, diluted earnings and diluted headline earnings per linked unit of the company; and
(e) the linked units which are the subject of the issue for cash must be of a class already in issue or where this is not the case, must be limited to such linked units or rights as are convertible into a class already in issue.”
In terms of the JSE Listings Requirements this resolution will require the support of 75% of the voting rights exercised on it in order for it to be adopted.
1.9 Ordinary resolution number 7: Signature of documentation “Resolved that a director of the company or the company secretary be and is hereby authorised to
sign all such documentation and do all such things as may be necessary for or incidental to the implementation of ordinary resolutions numbers 1, 2, 3, 4, 5 and 6 and special resolutions numbers 1 and 2 which are passed by the linked unitholders with and subject to the terms thereof.”
This resolution will require the support of more than 50% of the voting rights exercised on it in order for it to be adopted.
vOTINg AND PrOXIESAny person attending or participating in the annual general meeting must present reasonably satisfactory identification and the person presiding at the annual general meeting must be reasonably satisfied that the right of any person to participate in and vote (whether as a unitholder/as a proxy for a unitholder) has been reasonably verified.
A unitholder of the company entitled to attend, speak and vote at the annual general meeting is entitled to appoint a proxy or proxies to attend, speak and to vote in his stead. The proxy need not be a unitholder of the company.
FINA
NC
IAL STA
TEMEN
TS

148 DIPULA INCOME FUND Integrated Annual Report 2013
On a show of hands, every unitholder of the company present in person or represented by proxy shall have one vote only. On a poll, every unitholder of the company present in person or represented by proxy shall have one vote for every linked unit in the company held by such unitholder.
A form of proxy is enclosed for the convenience of certificated and own-name dematerialised unitholders holding linked units in the company who cannot attend the annual general meeting but wish to be represented thereat.
Such unitholders must complete and return the attached form of proxy and lodge it with the transfer secretaries of the company, Link Market Services South Africa Proprietary Limited at 13th floor, Rennie House, 19 Ameshoff Street, Braamfontein, 2001 (PO Box 4844, Johannesburg 2000) to be received by not later than 10:00 on Tuesday, 11 February 2014. Any shareholder who completes and lodges a form of proxy will nevertheless be entitled to attend and vote in person at the annual general meeting should the unitholder subsequently decide to do so.
Dematerialised unitholders who have not elected own-name registration in the sub-register of the company through a Central Securities Depository Participant (“CSDP”) and who wish to attend the annual general meeting, must instruct the CSDP or broker to provide them with the necessary authority to attend.
Dematerialised unitholders who have not elected own-name registration in the sub-register of the company through a CSDP and who are unable to attend, but wish to vote at the annual general meeting, must timeously provide their CSDP or broker with their voting instructions in terms of the custody agreement entered into between that unitholder and the CSDP or broker. Such unitholders are advised that they must provide their CSDP or broker with separate voting instructions in respect of the shares and the debentures in terms of their linked units.
ELECTrONIC PArTICIPATIONThe company has made provision for shareholders or their proxies to participate electronically in the annual general meeting by way of telephone conferencing. Should you wish to participate in the annual general meeting by telephone conference call as aforesaid, you, or your proxy, will be required to advise the company thereof by no later than 10:00 on Tuesday, 11 February 2014 by submitting by e-mail to the company secretary at [email protected] or by fax to be faxed to +27 11 327 7149, for the attention of Neville Toerien, relevant contact details, including:• an e-mail address;• cellular number and landline; and• full details of the shareholder’s title to securities issued by the company and proof of identity; – for certificated ordinary shares – copies of identity documents and share certificates; and – for dematerialised ordinary shares – written confirmation from the shareholder’s CSDP confirming
the shareholder’s title to the dematerialised ordinary shares.
Upon receipt of the required information the shareholder concerned will be provided with a secure code and instructions to access the electronic communication during the annual general meeting. Shareholders
NOTICE OF ANNUAL GENERAL MEETING OF SHAREHOLDERS AND DEBENTURE HOLDERS/UNITHOLDERS

149DIPULA INCOME FUND Integrated Annual Report 2013
FINA
NC
IAL STA
TEMEN
TS
must note that access to the electronic communication will be at the expense of the shareholders who wish to utilise the facility. Shareholders and their appointed proxies attending by conference call will not be able to cast their votes at the annual general meeting through this medium.
Forms of proxy may also be obtained on request from the company’s registered offi ce. The completed forms of proxy must be deposited at, or posted or faxed to the transfer secretaries Link Market Services South Africa (Proprietary) Limited, to be received at least 48 hours prior to the annual general meeting. Any unitholder who completes and lodges a form of proxy will nevertheless be entitled to attend and vote in person at the annual general meeting should the unitholder subsequently decide to do so.
By order of the board
Probity business Services Proprietary LimitedCompany Secretary
registered offi ce and business addressBlock B, Dunkeld Park6 North Road, Dunkeld West, 2196PO Box 875, Parklands, 2121
Transfer SecretariesLink Market Services South Africa Proprietary Limited13th Floor, Rennie House, 19 Ameshoff Street, Braamfontein, 2001PO Box 4844, Johannesburg, 2000

150 DIPULA INCOME FUND Integrated Annual Report 2013
Company: Dipula Income Fund Limited – A-Linked unitsregister date: 30 August 2013Issued unit capital: 143 524 183
Unitholder spreadNumber of
unitholdings %Numberof units %
1 – 1 000 units 32 11,72 11 889 0,011 001 – 10 000 units 29 10,62 125 664 0,0910 001 – 100 000 units 84 30,77 3 874 168 2,70100 001 – 1 000 000 units 90 32,97 28 826 505 20,081 000 001 units and over 38 13,92 110 685 957 77,12
Totals 273 100,00 143 524 183 100,00
Distribution of unitholdersBanks 1 0,37 105 889 0,07Close Corporations 1 0,37 500 0,00Endowment Funds 11 4,03 1 750 019 1,22Individuals 50 18,32 199 364 0,14Insurance Companies 19 6,96 12 494 641 8,71Investment Companies 2 0,73 1 110 850 0,77Medical Schemes 10 3,66 2 793 029 1,95Mutual Funds 70 25,64 82 918 077 57,77Nominees and Trusts 6 2,20 906 793 0,63Private Companies 10 3,66 5 199 345 3,62Retirement Funds 92 33,70 36 021 176 25,10Treasury Shares 1 0,37 24 500 0,02
Totals 273 100,00 143 524 183 100,00
Public/non-public unitholdersNon-public unitholders 6 2,20 4 371 193 3,05Directors and Associates of the Company holdings 2 0,73 21 000 0,01Strategic holdings 3 1,10 4 325 693 3,01Treasury units 1 0,37 24 500 0,02Public unitholders 267 97,80 139 152 990 96,95
Totals 273 100,00 143 524 183 100,00
beneficial unitholders holding 3% or moreCoronation Fund Managers 41 047 584 28,60Old Mutual 19 569 033 13,63Government Employees Pension Fund 11 324 215 7,89STANLIB 9 683 160 6,75Investment Solutions 9 556 018 6,66Nedbank Group 6 095 513 4,25Municipal Employees Retirement Funds 4 738 943 3,30
Totals 102 014 466 71,08
ANALYSIS OF UNITHOLDERS – A-LINKED UNITS

151DIPULA INCOME FUND Integrated Annual Report 2013
Company: Dipula Income Fund – B-Linked unitsregister date: 30 August 2013Issued share capital: 143 524 183
Shareholder spreadNumber of
shareholdings %Number of
shares %
1 – 1 000 shares 42 7,45 22 443 0,021 001 – 10 000 shares 248 43,97 1 170 813 0,8210 001 – 100 000 shares 200 35,46 6 327 632 4,41100 001 – 1 000 000 shares 55 9,75 19 159 397 13,351 000 001 shares and over 19 3,37 116 843 898 81,41
Totals 564 100,00 143 524 183 100,00
Distribution of shareholdersBanks 1 0,18 12 515 0,01Close Corporations 11 1,95 185 081 0,13Empowerment 1 0,18 50 000 000 34,84Endowment Funds 8 1,42 102 607 0,07Individuals 253 44,86 3 381 488 2,36Insurance Companies 14 2,48 2 294 393 1,60Investment Companies 3 0,53 744 148 0,52Medical Schemes 7 1,24 402 790 0,28Mutual Funds 54 9,57 48 101 715 33,51Nominees and Trusts 85 15,07 2 276 758 1,59Private Companies 41 7,27 6 761 253 4,71Retirement Funds 85 15,07 29 236 935 20,37Treasury Stock 1 0,18 24 500 0,02
Totals 564 100,00 143 524 183 100,00
Public/non-public shareholdersNon-public shareholders 5 0,89 54 353 146 37,87Strategic holdings 4 0,71 54 328 646 37,85Treasury units 1 0,18 24 500 0,02Public shareholders 559 99,11 89 171 037 62,13
Totals 564 100,00 143 524 183 100,00
beneficial shareholders holding 3% or moreDipula Trust 50 000 000 34,84Investec 19 690 925 13,72Government Employees Pension Fund 12 566 667 8,76STANLIB 6 977 689 4,86Nedbank Group 6 640 047 4,63Discovery 6 119 998 4,26Transnet Pension Fund 5 553 227 3,87
Totals 107 548 553 74,93
ANALYSIS OF UNITHOLDERS – B-LINKED UNITS

152 DIPULA INCOME FUND Integrated Annual Report 2013
year Month High sale Low saleNumberof deals volume value
2012 September 1090 1003 132 1 056 890 11 102 641 2012 October 1061 1050 89 1 055 099 11 115 242 2012 November 1081 1050 17 182 483 1 920 494 2012 December 1200 1000 13 60 171 652 156 2013 January 1250 1060 16 48 111 530 330 2013 February 1100 890 73 1 821 566 19 408 417 2013 March 1060 1058 201 441 797 4 682 918 2013 April 1125 1000 74 996 837 11 042 725 2013 May 1201 1120 181 1 436 560 16 516 577 2013 June 1136 1124 96 1 239 809 14 011 462 2013 July 1118 1075 81 4 778 596 52 043 716 2013 August 1090 1069 29 281 628 3 053 569
JSE STATISTICS
12 months to 31 August 2013
Traded price (cents per share) Close 1069High 1250Low 890
Market capitalisation 1 534 273 516Value of shares traded 146 080 247Value traded as percentage of market capitalisation 10%Volume of shares traded 13 399 547Volume traded as percentage of number in issue 9%PE ratio 10,61Dividend yield 7,61Earnings yield 9,43Shares issued 143 524 183
DIPULA A INCOME FUND LIMITED A CLASS

153DIPULA INCOME FUND Integrated Annual Report 2013
year Month High sale Low saleNumber of deals volume value
2012 September 750 650 48 381 557 2 571 7092012 October 685 670 51 445 015 3 009 0362012 November 780 710 53 517 762 3 867 6102012 December 850 745 136 1 380 374 10 723 5012013 January 1 030 875 80 4 616 080 43 116 2832013 February 983 931 54 1 277 566 12 213 9112013 March 1 025 950 50 863 514 8 637 4322013 April 1 055 1 025 67 1 360 206 14 282 5562013 May 1 100 950 181 2 378 279 25 924 3362013 June 1 000 950 80 564 425 5 552 9862013 July 970 890 46 161 109 1 552 4912013 August 955 700 57 1 528 322 12 009 910
JSE STATISTICS
12 months to August 2013
Traded price (cents per share) Close 750High 1 100Low 650
Market capitalisation 1 076 431 373Value of shares traded 143 461 761Value traded as percentage of market capitalisation 13%Volume of shares traded 15 474 209Volume traded as percentage of number in issue 11%PE ratio 9,29Dividend yield 8,38Earnings yield 10,76Shares issued 143 524 183
DIPULA INCOME FUND LIMITED B CLASS

154 DIPULA INCOME FUND Integrated Annual Report 2013
UNITHOLDERS’ DIARY
Financial year-end August
Preliminary annual results announcement 14 November 2013
Annual report posted 30 December 2013
Annual general meeting 13 February 2014
Interim results announcement May

DIPULA INCOME FUND Integrated Annual Report 2013
FORM OF PROXY OF SHAREHOLDERS/UNITHOLDERS
Dipula Income Fund Limited(Incorporated in the Republic of South Africa)(Registration number 2005/013963/06)JSE share code: DIA (A-linked units); DIB (B-linked units)ISIN: ZAE000158317 (A-linked units); ZAE000158325 (B-linked units)(Approved as a REIT by the JSE)(“Dipula” or “the company”)
Each of the linked units comprises one ordinary share and one debenture. Certificated and own-name dematerialized shareholders/unitholders are therefore advised that they must complete a form of proxy for certificated and own-name dematerialised shareholders/unitholders in order for their vote/s to be valid.
This form of proxy is for use by the holders of the company’s certificated linked units (“certificated unitholders”) and/or dematerialised linked units held through a Central Securities Depository Participant (“CSDP”) or broker who have selected own name registration and who cannot attend but wish to be represented at the annual general meeting of the company at the offices of Dipula at Block B Dunkeld Park, 6 North Road, Dunkeld West on Thursday, 13 February 2014 at 10:00 or any adjournment, if required. Additional forms of proxy are available at the company’s registered office.
Not for the use by holders of the company’s dematerialised linked units who have not selected own-name registration. Such unitholders must contact their CSDP or broker timeously if they wish to attend and vote at the annual general meeting and request that they be issued with the necessary authorisation to do so, or provide the CSDP or broker timeously with their voting instructions should they not wish to attend the annual general meeting but wish to be represented thereat, in order for the CSDP or broker to vote in accordance with their instructions.
I/We (Name in BLOCK LETTERS)
of (Address)
being the registered holder/s of A-linked units and/or B-linked units in Dipula,
hereby appoint: of or failing him,
the Chairman of the annual general meeting, as my/our proxy to vote for me/us on my/our behalf at the annual general meeting of the company to and at any adjournment thereof.
Please indicate with an “X” in the appropriate spaces how you wish your votes to be cast. Unless this is done, the proxy will vote as he thinks fit.
In favour of Against Abstain
1.1 Special resolution number 1: General authority for the company to grant financial assistance to related or inter-related companies
1.2 Special resolution number 2: Approval of non-executive directors’ fees
1.3 Ordinary resolution number 1: To re-elect ZJ Matlala as a director of the company
1.4 Ordinary resolution number 2: To re-elect Y Waja as a director of the company
1.5.1 Ordinary resolution number 3.1: To re-appoint Y Waja as a member and chairman of the Audit and Risk Committee
1.5.2 Ordinary resolution number 3.2: To re-appoint BH Azizollahoff as a member of the Audit and Risk Committee
1.5.3 Ordinary resolution number 3.3: To re-appoint E Links as a member of the Audit and Risk Committee
1.6 Ordinary resolution number 4: To re-appoint Grant (Jhb) Inc. as auditors of the company
1.7 Ordinary resolution number 5: Authority to place up to 5% of the unissued linked units under the control of the directors
1.8 Ordinary resolution number 6: General authority to enable the company to issue for cash up to 5% of the authorised but unissued linked units
1.9 Ordinary resolution number 7: To authorise the signature of documentation
Signed this day of 2014
Signature
Assisted by (if applicable)
Please read the notes on the reverse.

DIPULA INCOME FUND Integrated Annual Report 2013
1. Each of the linked units comprises one ordinary share and one debenture. Certificated and own-name dematerialised shareholders/unitholders are therefore advised that they must complete a form of proxy for certificated and own-name dematerialised shareholders/unitholders in order for their vote/s to be valid.
2. This form of proxy is to be completed only by those members who are holding linked units in certificated form or recorded in the sub-register in electronic form in their “own name”.
3. Each unitholder is entitled to appoint one or more proxies (none of whom need to be a unitholder of the company) to attend, speak and vote in place of that shareholder at the annual general meeting.
4. Unitholders who are certificated or own-name dematerialised unitholders may insert the name of a proxyor the names of two alternate proxies of the unitholder’s choice in the space/s provided, with or without deleting “the Chairman of the annual general meeting”, but any such deletion must be initialled by the shareholders. The person whose name stands first on this form of proxy and who is present at the annual general meeting will be entitled to act as proxy to the exclusion of those whose names follow. If no proxy is named on a lodged form of proxy, the Chairman shall be deemed to be appointed as the proxy.
5. A unitholder’s instructions to the proxy must be indicated by the insertion of the relevant number of votes exercisable by the unitholder in the appropriate box provided. Failure to comply with the above will be deemed to authorise the proxy, in the case of any proxy other than the Chairman, to vote or abstain from voting as deemed fit and in the case of the Chairman to vote in favour of any resolution.
6. A unitholder or his proxy is not obliged to use all the votes exercisable by the unitholder, but the total of the votes cast or abstained from may not exceed the total of the votes exercisable in respect of the linked units held by the unitholder.
7. Forms of proxy must be lodged at, or posted to the transfer secretaries, Link Market Services South Africa Proprietary Limited, 13th Floor, Rennie House, 19 Ameshoff Street, Braamfontein, 2001 (PO Box 4844, Johannesburg, 2000) to be received at least 48 hours prior to the annual general meeting.
8. The completion and lodging of this form of proxy will not preclude the relevant unitholder from attending the annual general meeting and speaking and voting in person thereat to the exclusion of any proxy appointed in terms hereof, should such unitholder wish to do so. Where there are joint holders of linked units, the vote of the first joint holder who tenders a vote as determined by the order in which the names stand in the register of unitholders, will be accepted. In addition to the aforegoing, a unitholder may revoke the proxy appointment by: (i) cancelling it in writing, or making a later inconsistent appointment of a proxy and (ii) delivering a copy of the revocation instrument to the proxy, and to the company. The revocation of a proxy appointment constitutes a complete and final cancellation of the proxy’s authority to act on behalf of the unitholder as at the later of the date stated in the revocation instrument, if any; or the date on which the revocation instrument was delivered in the required manner.
9. Where there are joint holders of any linked units, only that holder whose name appears first in the register in respect of such linked units needs to sign this form of proxy.
10. The Chairman of the annual general meeting may reject or accept any form of proxy which is completed and/or received, otherwise than in accordance with these notes, provided that, in respect of acceptances, the Chairman is satisfied as to the manner in which the unitholder concerned wishes to vote
11. Documentary evidence establishing the authority of a person signing this form of proxy in a representative capacity must be attached to this form of proxy unless previously recorded by the company or Link Market Services South Africa (Proprietary) Limited or waived by the Chairman of the annual general meeting.
12. Any alteration or correction made to this form of proxy must be initialled by the signatory/ies.
13. A minor must be assisted by his/her parent/guardian unless the relevant documents establishing his/her legal capacity are produced or have been registered by the transfer secretaries.
14. The aforegoing notes contain a summary of the relevant provisions of section 58 of the Companies Act, No. 71 of 2008, as amended.
NOTES TO FORM OF PROXY OF SHAREHOLDERS/UNITHOLDERS