Embed Size (px)
Citation preview


STATE OF RHODE ISLAND AND PROVIDENCE PLANTATIONS
ENERGY FACILITY SITING BOARD
IN RE: Application of Invenergy Thermal Docket No. SB-2015-06
Development LLC’s Proposal for
Clear River Energy Center
CLEAR RIVER ENERGY LLC’s RESPONSES TO
THE RHODE ISLAND DEPARTMENT OF HEALTH’S FIRST
SET OF DATA REQUESTS
Page 1 of 4 405180\003\863208.v2
REQUEST 1: The Clear River Energy Center (CREC) application included an analysis of
projected increases in electric and magnetic field impacts associated with the
addition of a third set of transmission lines. That analysis showed that the
proposed new lines would not significantly increase the strength of the electric
fields, but, under peak load conditions, would increase magnetic fields within
100 feet of the Right of Way.
Please supply an update to that analysis, which includes the magnitude and
location of electric and magnetic field impacts associated with the most
current proposed configuration.
RESPONSE 1: An update to that analysis is included in an EMF Report, entitled “Clear River
Energy Center Project – Exponent Project No. 1507086.000,” dated December
28, 2016, prepared by Exponent, attached as Exhibit A.
RESPONDENT:
William Baily, Exponent
DATE: June 22, 2017

STATE OF RHODE ISLAND AND PROVIDENCE PLANTATIONS
ENERGY FACILITY SITING BOARD
IN RE: Application of Invenergy Thermal Docket No. SB-2015-06
Development LLC’s Proposal for
Clear River Energy Center
CLEAR RIVER ENERGY LLC’s RESPONSES TO
THE RHODE ISLAND DEPARTMENT OF HEALTH’S FIRST
SET OF DATA REQUESTS
Page 2 of 4 405180\003\863208.v2
REQUEST 2: The noise analysis submitted as part of the CREC application reported modeled
noise impacts associated with construction and operation of the proposed facility
at five neighboring locations.
Please provide an update of that analysis which shows the magnitude of the
noise impact at each of those locations, as well as maximum offsite impacts.
RESPONSE 2: A memorandum entitled “Supplemental Information Regarding Noise
Questions Raised by RIDOH,” prepared by Michael Hankard, dated June 21,
2017 is attached as Exhibit B. This memorandum provides an update of the
analysis showing the magnitude of the noise impact at each of those locations,
as well as maximum offsite impacts. Additionally, this memorandum addresses
additional noise questions raised in the Rhode Island Department of Health’s
(“RIDOH”) original advisory opinion, dated September 12, 2016.
RESPONDENT:
Michael Hankard, Hankard Environmental
DATE: June 22, 2017

STATE OF RHODE ISLAND AND PROVIDENCE PLANTATIONS
ENERGY FACILITY SITING BOARD
IN RE: Application of Invenergy Thermal Docket No. SB-2015-06
Development LLC’s Proposal for
Clear River Energy Center
CLEAR RIVER ENERGY LLC’s RESPONSES TO
THE RHODE ISLAND DEPARTMENT OF HEALTH’S FIRST
SET OF DATA REQUESTS
Page 3 of 4 405180\003\863208.v2
REQUEST 3: In the CREC application and subsequent documentation, the applicant stated
that the facility will store 40,000 gallons of 19% aqueous ammonia and listed
several measures that would be implemented to minimize the potential for and
to mitigate the consequences of an accidental ammonia release, including a
concrete containment area, passive controls to reduce surface area, and ammonia
sensors. The applicant also provided documentation of inputs to a toxic-endpoint
analysis using the ALOHA model.
Please provide information about any changes in the facility proposal that
affect the amount or concentration of ammonia that will be stored, the
number or location of storage tanks, delivery methods or the planned safety
measures. In addition, if the ALOHA model has been run again, please supply
RIDOH with the documentation of the inputs for that model run.
Please also provide the information listed above concerning any changes to
plans for delivery and storage of compressed hydrogen, fuel oil, and other
hazardous or flammable substances at the facility.
RESPONSE 3: For information regarding any changes in the facility proposal that may affect
the ammonia analysis, please see a memorandum, entitled “Clear River Energy
Center RIDOH EFSB Advisory Opinion Responses,” prepared by ESS Group,
Inc., dated April 20, 2017, attached as Exhibit C. (This memorandum also
addresses additional environmental questions raised in the RIDOH’s original
advisory opinion, dated September 12, 2016.) Additionally, a revised ALOHA
analysis, prepared by ESS Group, Inc., is attached as Exhibit D.
There has been only one change for the plans for the delivery and storage of
compressed hydrogen, fuel oil and other hazardous or flammable substances at
the facility. The fuel oil storage tank design has been modified from two one
million gallon storage tanks to a single two million gallon tank and the tank
location has changed which relocated the tank to an area closer to the Clear River
Energy Center facility and further away from wetlands.
RESPONDENT:
Michael Feinblatt, ESS Group, Inc.
DATE: June 22, 2017

Page 4 of 4 405180\003\863208.v2
CLEAR RIVER ENERGY LLC
By its Attorneys,
/s/ Alan M. Shoer
Alan M. Shoer, Esq. (#3248)
Richard R. Beretta, Jr. Esq. (#4313)
Nicole M. Verdi, Esq. (#9370)
ADLER POLLOCK & SHEEHAN, P.C.
One Citizens Plaza, 8th Floor
Providence, RI 02903-1345
Tel: 401-274-7200
Fax: 401-751-0604
Dated: June 22, 2017
CERTIFICATE OF SERVICE
I hereby certify that on June 22, 2017, I delivered a true copy of the foregoing responses to the
Rhode Island Department of Health’s 1st Set of Data Requests via electronic mail to the parties on the
attached service list.
/s/ Alan M. Shoer

SB-2015-06 Invenergy CREC Service List as of 06/19/2017
Name/Address E-mail Phone/FAX
File an original and 10 copies with EFSB:
Todd Bianco, Coordinator
Energy Facility Siting Board
89 Jefferson Boulevard
Warwick, RI 02888
Margaret Curran, Chairperson
Janet Coit, Board Member
Assoc. Dir., Div. of Planning Parag Agrawal
Patti Lucarelli Esq., Board Counsel
Susan Forcier Esq., Counsel
Rayna Maguire, Asst. to the Director DEM
Catherine Pitassi, Asst. to. Assoc. Dir. Plann.
Margaret Hogan, Sr. Legal Counsel
[email protected]; 401-780-2106
Parties (Electronic Service Only, Unless by
Request)
Invenergy Thermal Development LLC
Alan Shoer, Esq.
Richard Beretta, Esq.
Elizabeth Noonan, Esq.
Nicole Verdi, Esq.
Adler, Pollock & Sheehan
One Citizens Plaza, 8th Floor
Providence, RI 02903
John Niland, Dir. Of Business Development
Tyrone Thomas, Esq., Asst. General Counsel
Mike Blazer, Esq., Chief Legal Officer
Invenergy Thermal Development LLC
One South Wacker Drive, Suite 1900
Chicago, IL 60600
[email protected]; 401-274-7200
[email protected]; 312-224-1400
Town of Burrillville
Michael McElroy, Esq., Special Counsel
Leah Donaldson, Esq., Special Counsel
Schacht & McElroy
PO Box 6721
Providence, RI 02940-6721
William Dimitri, Esq., Acting Town Solicitor
[email protected]; 401-351-4100
[email protected]; 401-273-9092
Conservation Law Foundation
Jerry Elmer, Esq.
Max Greene, Esq.
55 Dorrance Street
Providence RI, 02903
[email protected]; 401-351-1102
Ms. Bess B. Gorman, Esq.
Assistant General Counsel and Director
Legal Department, National Grid
[email protected]; 781-907-1834

40 Sylvan Road
Waltham, MA 02451
Mark Rielly, Esq.
Senior Counsel
Office of Energy Resources
Andrew Marcaccio, Esq.
Nick Ucci, Chief of Staff
Chris Kearns, Chief Program Development
One Capitol Hill
Providence, RI 02908
Ellen Cool
Levitan & Associates
[email protected]; 401-222-3417
[email protected]; 401-574-9100
Rhode Island Building and Construction Trades
Council
Gregory Mancini, Esq.
Sinapi Law Associates, Ltd.
2374 Post Road, Suite 201
Warwick, RI 02886
[email protected]; 401-739-9690
Residents of Wallum Lake Road, Pascoag, RI
Dennis Sherman and Kathryn Sherman
Christian Capizzo, Esq.
Shechtman Halperin Savage, LLP
1080 Main Street
Pawtucket, RI 02869
[email protected]; 401-272-1400
Residents of Wallum Lake Road, Pascoag, RI
Paul Bolduc and Mary Bolduc
Joseph Keough Jr., Esq.
41 Mendon Avenue
Pawtucket, RI 02861
Paul and Mary Bolduc
915 Wallum Lake Road
Pascoag, RI 02859
[email protected]; 401-724-3600
[email protected]; 401-529-0367
Abutter David B. Harris
Michael Sendley, Esq.
600 Putnam Pike, St. 13
Greenville, RI 02828
[email protected]; 401-349-4405
Interested Persons (Electronic Service Only)
Harrisville Fire District
Richard Sinapi, Esq.
Joshua Xavier, Esq.
2347 Post Road, Suite 201
Warwick, RI 02886
[email protected]; 401-739-9690
Residents of 945 Wallum Lake Road, Pascoag,
RI (Walkers)
Nicholas Gorham, Esq.
P.O. Box 46
North Scituate, RI 02857
[email protected]; 401-647-1400

Peter Nightingale, member
Fossil Free Rhode Island
52 Nichols Road
Kingston, RI 02881
[email protected]; 401-789-7649
Sister Mary Pendergast, RSM
99 Fillmore Street
Pawtucket, RI 02860
[email protected]; 401-724-2237
Patricia J. Fontes, member
Occupy Providence
57 Lawton Foster Road South
Hopkinton, RI 02833
[email protected]; 401-516-7678
Burrillville Land Trust
Marc Gertsacov, Esq.
Law Offices of Ronald C. Markoff
144 Medway Street
Providence, RI 02906
Paul Roselli, President
Burrillville Land Trust
PO Box 506
Harrisville, RI 02830
[email protected]; 401-272-9330
[email protected]; 401-447-1560
Rhode Island Progressive Democrats of America
Andrew Aleman, Esq.
168 Elmgrove Avenue
Providence, RI 02906
[email protected]; 401-429-6779
Fighting Against Natural Gas and Burrillville
Against Spectra Expansion
Jillian Dubois, Esq.
The Law Office of Jillian Dubois
91 Friendship Street, 4th Floor
Providence, RI 02903
[email protected]; 401-274-4591
Burrillville Town Council
c/o Louise Phaneuf, Town Clerk
105 Harrisville Main Street
Harrisville, RI 02830
[email protected]; 401-568-4300
Christine Langlois, Deputy Planner
Town of Burrillville
144 Harrisville Main Street
Harrisville, RI 02830
Joseph Raymond, Building Official
[email protected]; 401-568-4300
Michael C. Wood, Town Manager
Town of Burrillville
105 Harrisville Main Street
Harrisville, RI 02830
[email protected]; 401-568-4300
ext. 115

Mr. Leo Wold, Esq.
Department of Attorney General
150 South Main Street
Providence, RI 02903
[email protected]; 401-274-4400
Public Utilities Commission
Cynthia Wilson Frias, Esq., Dep. Chief of Legal
Alan Nault, Rate Analyst
[email protected]; 401-941-4500
Division of Public Utilities and Carriers
John J. Spirito, Esq., Chief of Legal
Steve Scialabba, Chief Accountant
Tom Kogut, Chief of Information
[email protected]; 401-941-4500
Matthew Jerzyk, Deputy Legal Counsel
Office of the Speaker of the House
State House, Room 302
Providence RI, 02903
[email protected]; 401-222-2466
Hon. Cale Keable, Esq.,
Representative of Burrillville and Glocester
[email protected]; 401-222-2258
Nick Katkevich [email protected];
Avory Brookins [email protected];
Joseph Bucci, Acting Administrator
Highway and Bridge Maintenance Operations
RI Department of Transportation
Jared Rhodes, Chief
Statewide Planning Program
Jennifer Sternick
Chief of Legal Services
RI Department of Administration
Doug Gablinske, Executive Director
TEC-RI
Tim Faulkner
ecoRI News
111 Hope Street
Providence, RI 02906
[email protected]; 401-330-6276
Sally Mendzela [email protected];
Keep Burrillville Beautiful
Paul LeFebvre
[email protected]; 401-714-4493
Mark Baumer [email protected];
Nisha Swinton
Food & Water Watch New England
Kaitlin Kelliher [email protected];
Joe Piconi, Jr. [email protected];
Hon. Aaron Regunberg
Representative of Providence, District 4
Paul Ernest [email protected];
Skip Carlson [email protected];
Kathryn Scaramella [email protected];
Diana Razzano [email protected];
David Goldstein [email protected];
Douglas Jobling [email protected];
Claudia Gorman [email protected];
Curt Nordgaard [email protected];
Colleen Joubert [email protected];
Matt Smith
Food & Water Watch
Christina Hoefsmit, Esq.
Senior Legal Counsel
RI Department of Environmental Management
Steven Ahlquist, RIFuture [email protected];
Pascoag Utility District
William Bernstein, Esq.
Michael Kirkwood, General Manager
Robert Ferrari, Northeast Water Solutions, Inc.
Ben Weilerstein
Toxics Action Center
Russ Olivo
Woonsocket Call
Suzanne Enser [email protected];
Rhode Island Student Climate Coalition [email protected];

EXHIBIT A

1507086.000 - 0442
Exponent
17000 Science Drive
Suite 200
Bowie, MD 20715
telephone 301-291-2500
facsimile 301-291-2599
www.exponent.com
15375 SE 30th Place
December 28, 2016
George Bacon
ESS Group, Inc.
100 Fifth Avenue, 5th
Floor
Waltham, MA 02451
Subject: Clear River Energy Center Report
Exponent Project No. 1507086.000
Dear Mr. Bacon:
At the request of ESS Group, Inc. (ESS), Exponent has evaluated the electric and magnetic field
(EMF) levels associated with the operation of the Clear River Energy Center (CREC) transmission
line. It is Exponent’s understanding that the transmission line is to connect the CREC gas-fired
combined-cycle electric generating facility proposed to be located in the Town of Burrillville, Rhode
Island, within the property of an existing gas compressor, to National Grid’s Sherman Road
Substation.
To deliver the electricity generated by the CREC project to the nearby substation, a 0.8 mile 345-kV
interconnection transmission line will be constructed on a new ROW between the switchyard within
the CREC facility and the existing 345kV ROW owned by The Narragansett Electric Company
(TNEC), located west of the CREC facility. This new ROW will be contained wholly within 67
acres of land area that will be purchased from the Spectra Energy Algonquin Compressor Station site
(Spectra) and is a subset of a 730-acre Spectra-owned site that currently contains the Burrillville
Compressor Station.
From the point of connection with the TNEC ROW to the Sherman Road Substation about 6 miles to
the northeast, the new 345-kV 3052 transmission line will be constructed adjacent to two existing
345-kV National Grid transmission lines. The location of the new transmission interconnection of
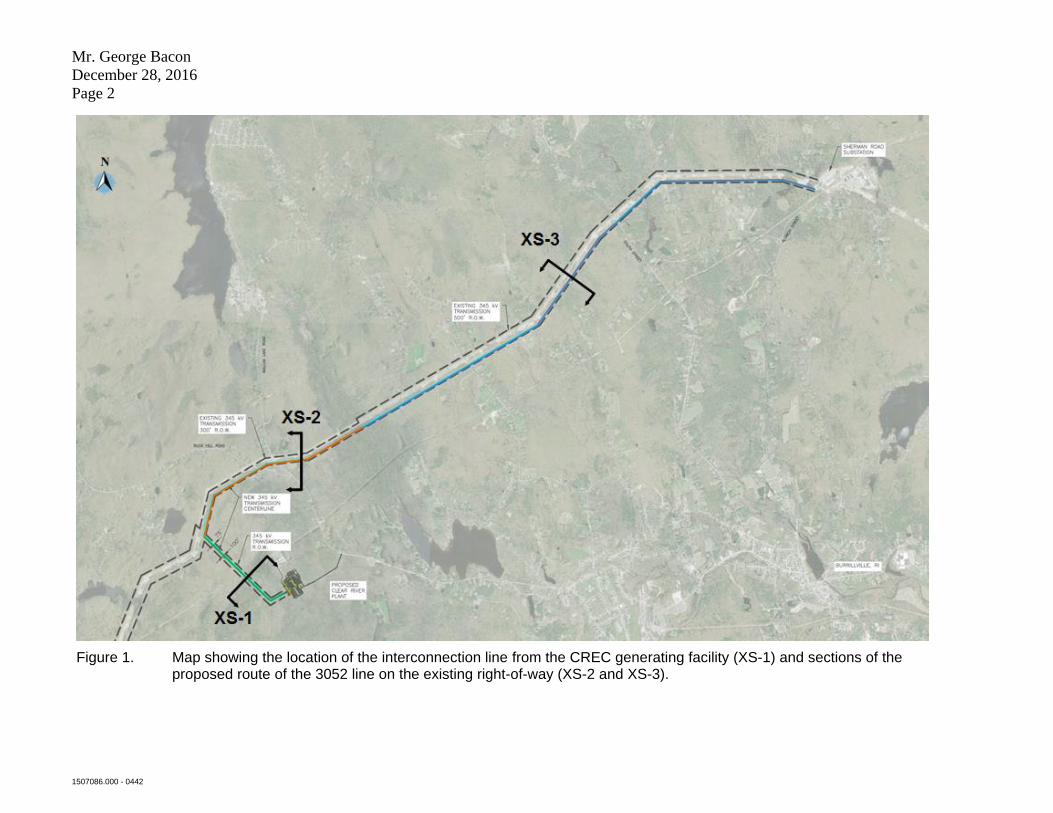
the 3052 Line (XS-1, green line), as well as the locations of the 3052 Line in existing cross sections
XS-2 (orange line) and XS-3 (blue line) are shown in Figure 1.
Mr. George Bacon
December 28, 2016
Page 2
1507086.000 - 0442
Figure 1. Map showing the location of the interconnection line from the CREC generating facility (XS-1) and sections of the proposed route of the 3052 line on the existing right-of-way (XS-2 and XS-3).
Mr. George Bacon
December 28, 2016
Page 3
1507086.000 - 0442
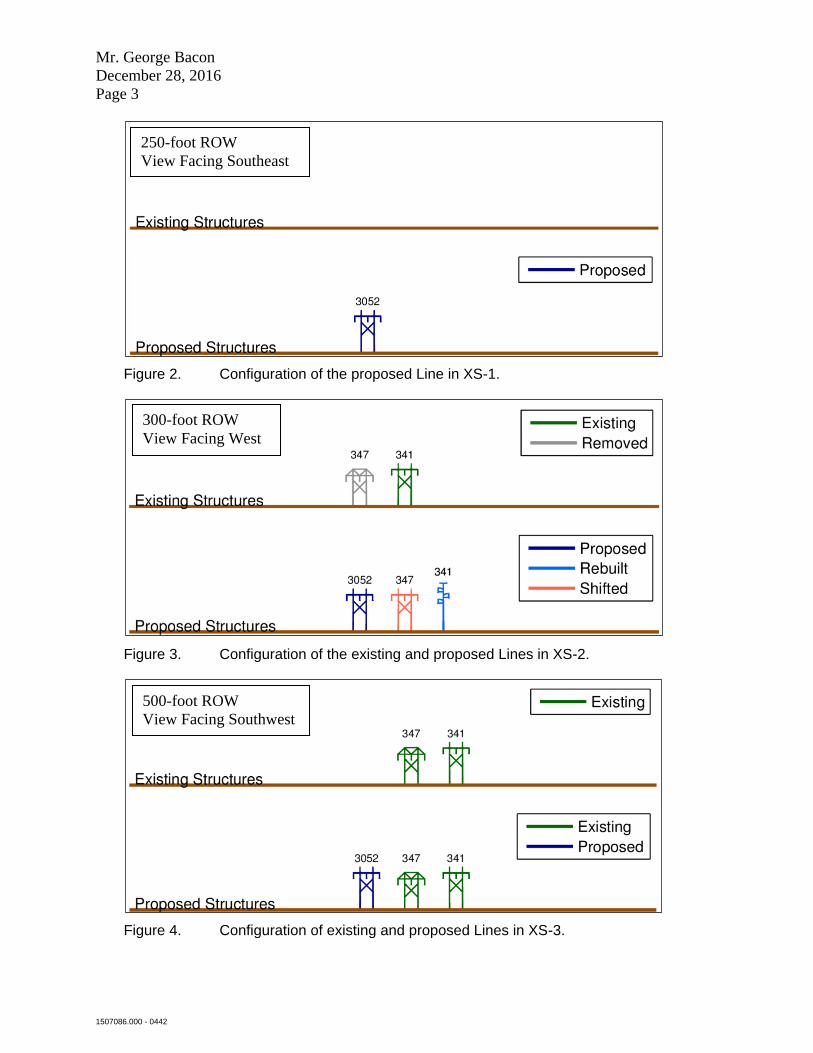
Figure 2. Configuration of the proposed Line in XS-1.
Figure 3. Configuration of the existing and proposed Lines in XS-2.
Figure 4. Configuration of existing and proposed Lines in XS-3.
300-foot ROW
View Facing West
250-foot ROW
View Facing Southeast
500-foot ROW
View Facing Southwest

Mr. George Bacon
December 28, 2016
Page 4
1507086.000 – 0442
In the first section (XS-1, approximately 0.8 miles long), the 3052 interconnection transmission line
will be constructed on H-frame structures on a new 250-foot wide ROW, approximately 75 feet from
the northern ROW edge, as shown in Figure 2. In the second section of the route (XS-2,
approximately 1.6 miles long), the ROW is 300 feet wide and existing 341 Line will be rebuilt on a
new set of vertical delta monopoles 73 feet west of the existing centerline and 57 feet from the west
ROW edge. The existing 347 Line will be shifted west and will be installed on the existing (to be
vacated) H-frame towers currently supporting the 341 Line. Finally, the 3052 Line will be
constructed on a new set of H-frame structures, placed at the same centerline as the existing 347
Line as shown in Figure 3. In the third route section (XS-3, approximately 4.4 miles long) two
existing 345-kV National Grid transmission lines (Lines 341 and 347) are situated on a 500-foot
wide ROW. The 345-kV 3052 Line is proposed to be constructed on H-frame structures
approximately 200 feet from the eastern ROW edge and 85 feet east of the existing centerline of the
347 Line as shown in Figure 4.
The following sections provide background information on EMF; a description of the methodology
used to calculate EMF levels; and a discussion of the relevant guidelines and standards for EMF
levels. Finally, the calculated EMF values are summarized and compared to relevant guidelines and
standards.
Electric and Magnetic Fields
Transmission lines, distribution lines, household appliances and equipment in our homes,
workplaces, and other locations (i.e., any source of electricity) produce both electric fields and
magnetic fields. Most electricity in North America is transmitted as alternating current (AC) at a
frequency of 60 Hertz (Hz), i.e., it changes direction and magnitude in a continuous cycle that
repeats 60 times per second. The fields from these AC sources are commonly referred to as power-
frequency or extremely low frequency (ELF) EMF.1
Electric Fields
Electric fields are created by the voltage on the conductors of transmission lines. The strength of
project-related electric fields in this report is expressed in units of kilovolts per meter (kV/m), which
is equal to 1,000 volts per meter (V/m). Virtually all objects are conductive—including fences,
shrubbery, and buildings—and thus can block electric fields. In general, the intensity of an electric
field diminishes with increasing distance from the source and in the case of transmission lines that
decrease is typically in proportion to the square of the distance from the conductors, so the electric-
field level decreases rapidly with distance. As the voltage increases, the electric-field level
increases; and is independent of the current flow on the line.
1 The EMF described in this report are quasi-static (non-propagating) fields, not to be confused with higher frequency
electromagnetic fields (e.g., fields produced by mobile phones).

Mr. George Bacon
December 28, 2016
Page 5
1507086.000 – 0442
Magnetic Fields
Magnetic fields are created by current that flows in transmission line conductors. The strength of
magnetic fields in this report is expressed as magnetic flux density in units of milligauss (mG),
where 1 Gauss (G) = 1,000 mG. Magnetic fields are not blocked by conductive objects as are
electric fields; however, similar to electric fields, the intensity of magnetic fields diminishes with
increasing distance from the source. In the case of transmission lines, magnetic fields also generally
decrease with distance from the conductors in proportion to the square of the distance.
Magnetic fields depend on the current flowing in transmission line conductor, whereas electric fields
depend on the voltage on the conductors. Since the current flow varies depending upon the patterns
of power demand on the bulk transmission system, the current, expressed in units of amperes (A),
and the magnetic field it generates, also varies. As the demand for electricity varies on a given day,
throughout a week, or over the course of months and even years the magnetic field varies.
Therefore, current flow is often described as annual peak load (producing the highest magnetic-field
level that might occur for a few hours or days during the year) and annual average load (a good
prediction of the magnetic field on any randomly selected day of the year).
Transmission Line Loading
Modeling calculations are provided for both average and peak loading for both pre- and post-CREC
configurations. According to ESS, the new 3052 Line will be among the most efficient gas-fired
generation plants in New England and therefore is expected to be dispatched at near full capacity the
majority of the time. The 3052 Line has therefore been modeled at full capacity (approximately
1046 Megavolt-amperes [MVA]) for both average and peak modeling cases.
Average loading for this report is defined as the loading level which is most likely to occur on the
347 and 341 Lines on a randomly-selected day of the year when the overall New England electrical
transmission system is operating at a typical or average operating condition. The peak loading level
represents the level of loading that will occur on the 347 and 341 Lines when the overall New
England electrical transmission system is generating and using the peak amount of electricity such as
on a hot summer day or an especially cold winter day. Due to the complex system dynamics of the
New England transmission system the load carried by the existing 347 and 341 Lines is expected to
be greater when the New England transmission system is at an average operating condition than
when the New England transmission system is at a peak operating condition.
Both 347 and 341 Lines are included in the group of transmission lines that comprise the New
England East-West Solution Interface which is one of the key interfaces in New England.2 The 347
and 341 Lines are therefore different from many transmission lines in that they are as likely to be
2 http://www.ct.gov/csc/lib/csc/pendingproceeds/docket_424/424_application/v5_ex4_interstate_csc_application-
_component_updated_needs_assessment.pdf

Mr. George Bacon
December 28, 2016
Page 6
1507086.000 – 0442
carrying electricity from east to west as they are from west to east. Therefore, in order to
characterize the magnetic field levels on the ROW, both lines are modeled for two separate cases:
the “east-to-west transfer” case and the “west-to-east transfer” case. For each of these transfer cases,
and for both pre-CREC and post-CREC configurations, National Grid provided Exponent with the
loading levels expected for the 341 and 347 Lines for the New England electrical transmission
system operating both at average and peak operating condition. The loading for all lines is shown in
Table 1 for the pre-CREC configuration and Table 2 for the post-CREC configuration in which
CREC is operating at full generating capacity and the New England electrical transmission system
operating under an average and a peak operating conditions.3
Table 1. Pre-CREC transmission line loadings.
Line Voltage
East-to-West Transfer
West-to-East Transfer
Average Peak
Average Peak
MW MVAR MW MVAR
MW MVAR MW MVAR
347 345 597.3 -74.3 368.7 -64 -343.4 -8.2 -274 -15.1
341 345 306.8 -25 77.5 -40.7 -399.4 20.6 -389.6 5.4
Table 2. Post-CREC transmission line loadings.
Line Voltage
East-to-West Transfer
West-to-East Transfer
Average Peak
Average Peak
MW MVAR MW MVAR
MW MVAR MW MVAR
347 345 742.6 -69.7 553.1 -64.4 -202.6 -23.1 -151.9 -27.3
341 345 236.5 -19.7 54.7 -30.8 -449.9 19.8 -424.8 5.1
3052 345 -1024.1 213.5 -1024.1 213.5 -1024.1 213.5 -1024.1 213.5
* The 3052 Line was modeled at 1046 MVA for both average and peak loading cases.
Table 1 and Table 2 indicate that the loadings of both the 347 and 341 Lines are expected to be
greater during periods when the New England electrical transmission system is operating at an
average operating condition than when the New England electrical transmission system is operating
at a peak operating condition. This is because the loadings on the 347 and 341 Lines are strongly
influenced by the amount of excess power available to be transferred from west-to-east or east-to-
west within the New England electrical transmission system. When the New England electrical grid
is operating under a peak operating condition, the majority of power generated is used locally and
there is less excess power available for transfer on the East-West Interface, than when the New
England electrical transmission system is operating at a typical or average operating condition.
3 Average loading levels were calculated from ISO 2019 90/10 Shoulder Peak loading levels by National Grid for a
transfer of 2600 MW for east-to-west transfer and 1600 MW for west-to-east transfer. Peak loading levels were
calculated from ISO 2019 90/10 Summer Peak loading levels for a transfer of 1750 MW for east-to-west transfer and
1100 MW for west-to-east transfer.

Mr. George Bacon
December 28, 2016
Page 7
1507086.000 – 0442
Therefore, the power carried by the existing 347 and 341 transmission Lines expected to be lower
during periods when the New England electrical transmission system is operating under a peak
operating condition than it is during average operating condition.
Phase optimization
Where two or more transmission lines share a ROW, the level of EMF will depend on the specific
arrangement of the conductors of each circuit. In many circumstances the field levels at the ROW
edge (or elsewhere) can be minimized by a careful selection of these phases in a phase-optimization
analysis.4 In the present case, XS-1 contains only a single circuit, so choice of phasing has no effect
on the calculated magnetic fields for that cross section and the choice of optimal phasing depends
only on analysis of XS-2 and XS-3. Following analysis of the calculated magnetic-field levels in
XS-2 and XS-3 at the edges of each ROW for average loading, considering both the east-to-west and
west-to-east transfer cases, the optimal phasing for the 3052 Line was determined to be A-B-C (from
south to north). This phasing minimizes the maximum magnetic-field level at ROW edge for the
east-to-west transfer case, and results in a magnetic-field level at ROW edge that is within 3 mG of
the minimum possible value for the west-to-east transfer case.5 This A-B-C phasing (from south to
north) was applied when computing the EMF levels for all post-CREC calculations.
Methodology
To characterize the potential effect of the proposed operation of the new 3052 Line on the existing
EMF levels, Exponent modeled the levels of these parameters under pre-CREC and post-CREC
configurations. EMF levels associated with line operations under various projected loading cases
discussed above were calculated using computer algorithms developed by the Bonneville Power
Administration, an agency of the U.S. Department of Energy, which have been shown to accurately
predict field levels near transmission lines.6 The inputs to the program for the existing and proposed
transmission lines were provided by National Grid, and include the voltage, current flow, phasing,
and conductor geometries of the lines, as well as their configurations and locations.
Based on these data, Exponent calculated magnetic-field levels at 1 meter (3.28 feet) above ground
as the root-mean-square value of the field at each location along a transect perpendicular to the
4 Phase optimization is one of the ways to minimize EMF levels consistent with recommendations to apply low cost
measures to minimize magnetic fields (see e.g., World Health Organization. Environmental Health Criteria 238:
Extremely Low Frequency (ELF) Fields. Geneva, Switzerland: World Health Organization, 2007). 5 For XS-2 and XS-3, for the selected optimal phasing, the highest edge of ROW magnetic field level is calculated to
occur on the southern ROW edge in XS-2 for the west-to-east transfer case. Relative to the selected optimal phasing,
a phasing of B-A-C from south to north would reduce the magnetic field level on the southern ROW edge in XS-2 by
approximately 3 mG for the west-to-east transfer case, but would increase the magnetic field level at this ROW edge
by approximately 9 mG for the east-to-west transfer case. 6 Bonneville Power Administration (BPA). Corona and Field Effects Computer Program. Portland, OR: Bonneville
Power Administration, 1991.

Mr. George Bacon
December 28, 2016
Page 8
1507086.000 – 0442
ROW in accordance with IEEE Std. C95.3.1-2010 and IEEE Std. 644-1994.7 All transmission and
distribution line voltages were assumed to be in phase; both electric fields and magnetic fields were
calculated as the resultant of x, y, and z field vectors; EMF levels were calculated along profiles
perpendicular to lines at the mid-span point of lowest conductor sag (i.e., closest to the ground); and
the conductors were assumed to be located on flat terrain and at maximum sag for the entire distance
between structures.
For electric fields, the same line configurations used to calculate magnetic fields were included in
the models and a 5% overvoltage condition was assumed for all lines to ensure that the calculated
values represent the maximum expected electric field for each of the route sections analyzed.
Standards and Guidelines
Neither the federal government nor the state of Rhode Island has enacted standards for EMF from
transmission lines or other sources.
Some other states have statutes or guidelines that apply to fields produced by new transmission lines,
but these are not health-based guidelines. New York and Florida, for example, have limits on EMF
that were designed to limit fields from new transmission lines to levels produced by existing
transmission lines (i.e., to maintain the status quo).8
More relevant than the various state-enacted guidelines are exposure limits recommended by
scientific organizations that were developed to protect health and safety based on scientific reviews
and risk assessments. These exposure limits are based on extensive weight-of-evidence reviews and
evaluations of relevant health research and are designed to prevent acute, short-term biological
responses such as perception, annoyance, and the stimulation of nerves and tissue that can occur at
very high EMF exposure levels to which the general public would not be exposed.
The International Committee on Electromagnetic Safety (ICES) and the International Commission
on Non-Ionizing Radiation Protection (ICNIRP) have developed standards and guidelines to assess
levels of EMF acceptable for safe public exposure. The EMF Reference Levels set by these
7 Institute of Electrical and Electronics Engineers (IEEE). IEEE Standard Procedures for Measurement of Power
Frequency Electric and Magnetic Fields from AC Power Lines (ANSI/IEEE Std. 644-1994, R2008). New York:
IEEE, 1994; Institute of Electrical and Electronics Engineers (IEEE). IEEE Recommended Practice for
Measurements and Computations of Electric, Magnetic, and Electromagnetic Fields with Respect to Human
Exposure to Such Fields, 0 Hz to 100 kHz (IEEE Std. C95.3.1-2010). New York: IEEE, 2010. 8 Florida Department of Environmental Regulation (FDER). Electric and Magnetic Fields. Chapter 17-274: FDER,
1989; Florida Department of Environmental Protection (FDEP). Electric and Magnetic Fields. Chapter 62-814:
FDEP, 1996; New York Public Service Commission (NYPSC). Opinion No. 78-13. Opinion and Order Determining
Health and Safety Issues, Imposing Operating Conditions, and Authorizing, in Case 26529, Operation Pursuant to
those Conditions: NYPSC, 1978; New York Public Service Commission (NYPSC). Statement of Interim Policy on
Magnetic Fields of Major Transmission Facilities. Cases 26529 and 26559 Proceeding on Motion of the
Commission: NYPSC, 1990.

Mr. George Bacon
December 28, 2016
Page 9
1507086.000 – 0442
organizations at a frequency of 60 Hz to ensure compliance with Basic Restrictions are summarized
in Table 3 below.9
Table 3. Reference Levels for whole body exposure to 60-Hz fields: general public.
Organization
Magnetic
Fields
Electric
Fields
ICNIRP 2,000 mG 4.2 kV/m
ICES 9,040 mG 5 kV/m
10 kV/m*
* This is an exception within transmission line ROWs because people do not spend
a substantial amount of time in ROWs, 9
Results
Magnetic Fields
Calculations at various locations on and beyond the ROW are summarized in Table 4 and Table 5
for all modeled sections. Graphical results of magnetic field calculations are shown in Figure 5
through Figure 7. As expected, the addition of the heavily-loaded 3052 Line to the ROW increases
the maximum magnetic-field level on the ROW as well as at the ROW edges. The edge of ROW
magnetic-field level in XS-3 where the ROW is very wide, however, remains 12 mG or less under
average loading cases. The maximum magnetic-field level under average loading on the XS-2 ROW
is similar to that of XS-3, but the narrower ROW width in XS-2 results in higher magnetic-field
levels near the ROW edge, primarily on the southern side of the ROW (69 mG) when the 3052 Line
is operating. Similarly, in XS-1, the shorter distance from the structures to the ROW edge results in
a higher magnetic field level (84 mG) at one ROW edge. It is important to note, however, that even
operating CREC at 1046 MVA the magnetic-field levels are all well below the Reference Levels
recommended by ICES and ICNIRP.
9 International Committee on Electromagnetic Safety (ICES). IEEE Standard for Safety Levels with Respect to Human
Exposure to Electromagnetic Fields 0 to 3 kHz. Piscataway, NJ: IEEE, 2002, reaffirmed 2007; International
Commission on Non-ionizing Radiation Protection (ICNIRP). Guidelines for limiting exposure to time-varying
electric and magnetic fields (1 Hz to 100 kHz). Health Phys 99: 818-836, 2010.

Mr. George Bacon
December 28, 2016
Page 10
1507086.000 – 0442
Table 4. Magnetic-field levels (mG) calculated at full capacity of the 3052 Line and average loading of the 341 and 347 Lines for both west-to-east and east-to-west Transfer cases.
Section Condition Loading
Case
Distance from Centerline of ROW
- ROW Edge -100 ft.
- ROW Edge
Max on ROW
+ ROW Edge
+ ROW Edge +100 ft.
XS-1
Pre-CREC East-to-West N/A N/A N/A N/A N/A
West-to-East N/A N/A N/A N/A N/A
Post-CREC East-to-West 17 84 329 17 6.8
West-to-East 17 84 329 17 6.8
XS-2
Pre-CREC East-to-West 6.6 34 204 3.3 0.5
West-to-East 2.4 17 146 8.0 2.0
Post-CREC East-to-West 10 57 372 11 2.2
West-to-East 16 69 320 22 5.1
XS-3
Pre-CREC East-to-West 1.3 2.5 204 3.3 0.5
West-to-East 0.3 0.7 146 8.0 2.0
Post-CREC East-to-West 3.8 9.2 369 4.5 1.7
West-to-East 5.4 12 326 6.2 0.9
Table 5. Magnetic-field levels (mG) calculated at full capacity of the 3052 Line and peak loading of the 341 and 347 Lines for both east-to-west and west-to-east Transfer cases.
Section Condition Loading
Case
Distance from Centerline of ROW
- ROW Edge -100 ft.
- ROW Edge
Max on ROW
+ ROW Edge
+ ROW Edge +100 ft.
XS-1
Pre-CREC East-to-West N/A N/A N/A N/A N/A
West-to-East N/A N/A N/A N/A N/A
Post-CREC East-to-West 17 84 329 17 6.8
West-to-East 17 84 329 17 6.8
XS-2
Pre-CREC East-to-West 4.8 23 121 1.7 1.1
West-to-East 1.5 12 138 8.4 2.3
Post-CREC East-to-West 11 59 360 4.2 0.9
West-to-East 15 68 322 21 4.9
XS-3
Pre-CREC East-to-West 1.1 2.0 121 1.7 1.1
West-to-East 0.1 0.4 138 8.4 2.3
Post-CREC East-to-West 4.0 9.7 359 1.7 1.1
West-to-East 5.3 12 328 6.0 1.0

Mr. George Bacon
December 28, 2016
Page 11
1507086.000 – 0442
Figure 5. Calculated magnetic-field level at average loading for proposed conditions in XS-1. Note that the east-to-west or west-to-east transfer case will not affect the modeled levels of the magnetic field from the 3052 on the CREC ROW

Mr. George Bacon
December 28, 2016
Page 12
1507086.000 – 0442
Figure 6. Calculated magnetic-field level at average loading for both pre-CREC and post-CREC conditions and both east-to-west and west-to-east transfer cases in XS-2.

Mr. George Bacon
December 28, 2016
Page 13
1507086.000 – 0442
Figure 7. Calculated magnetic-field level at average loading for both pre-CREC and post-CREC conditions and both east-to-west and west-to-east transfer cases in XS-3.

Mr. George Bacon
December 28, 2016
Page 14
1507086.000 – 0442
Electric Fields
Calculations of the electric field at various locations on and beyond the ROW are summarized in
Table 6 for all modeled sections. Graphical results of electric-field calculations for the three sections
are shown in Figure 8 to Figure 10. As can be seen in Table 6, both the maximum electric-field level
on the TNEC ROW as well as the edge of ROW electric-field level stays largely unchanged as a
result of this project. The exception to this is the increase in the electric-field level on the western
ROW edge in XS-2 where the 341 Line is rebuilt closer to the ROW edge and the field level is
calculated to be 1.3 kV/m). Similarly, in XS-1, the shorter distance from the structures to the ROW
edge results in a higher electric field level (1.7 kV/m) at one ROW edge. At the edge of the ROW,
all electric field levels are well below the Reference Levels recommended by ICES and ICNIRP.10
Table 6. Electric field levels (kV/m) with all lines operating at maximum voltage.
Section Condition
Distance from Centerline of ROW
- ROW Edge -100 ft. -ROW Edge
Max on ROW +ROW Edge
+ROW Edge +100 ft.
XS-1 Pre-CREC N/A N/A N/A N/A N/A
Post-CREC 0.2 1.7 5.0 0.2 <0.1
XS-2 Pre-CREC 0.1 1.2 7.5 0.4 0.1
Post-CREC 0.2 1.3 5.2 1.3 0.2
XS-3 Pre-CREC <0.1 <0.1 7.5 0.4 0.1
Post-CREC <0.1 0.1 7.6 0.4 0.1
10 The maximum electric-field level on the ROW is higher than the specified Reference Level for ICNIRP, but is lower
than or relatively unchanged from existing conditions. Additionally, with further analysis these field levels are
clearly below the ICNIRP Basic Restriction levels in tissue (the actual exposure limits) calculated by methods such
as described by Kavet et al., in: “The relationship between anatomically correct electric and magnetic field dosimetry
and published electric and magnetic field exposure limits.” Radiate Prot Dosimetry 152: 279-295, 2012.

Mr. George Bacon
December 28, 2016
Page 15
1507086.000 – 0442
Figure 8. Calculated electric-field level for post-CREC conditions in XS-1.

Mr. George Bacon
December 28, 2016
Page 16
1507086.000 – 0442
Figure 9. Calculated electric-field level for both pre- and post-CREC conditions in XS-2.

Mr. George Bacon
December 28, 2016
Page 17
1507086.000 – 0442
Figure 10. Calculated electric-field level for both pre- and post-CREC conditions in XS-3.
Mr. George Bacon
December 28, 2016
Page 18
1507086.000 – 0442
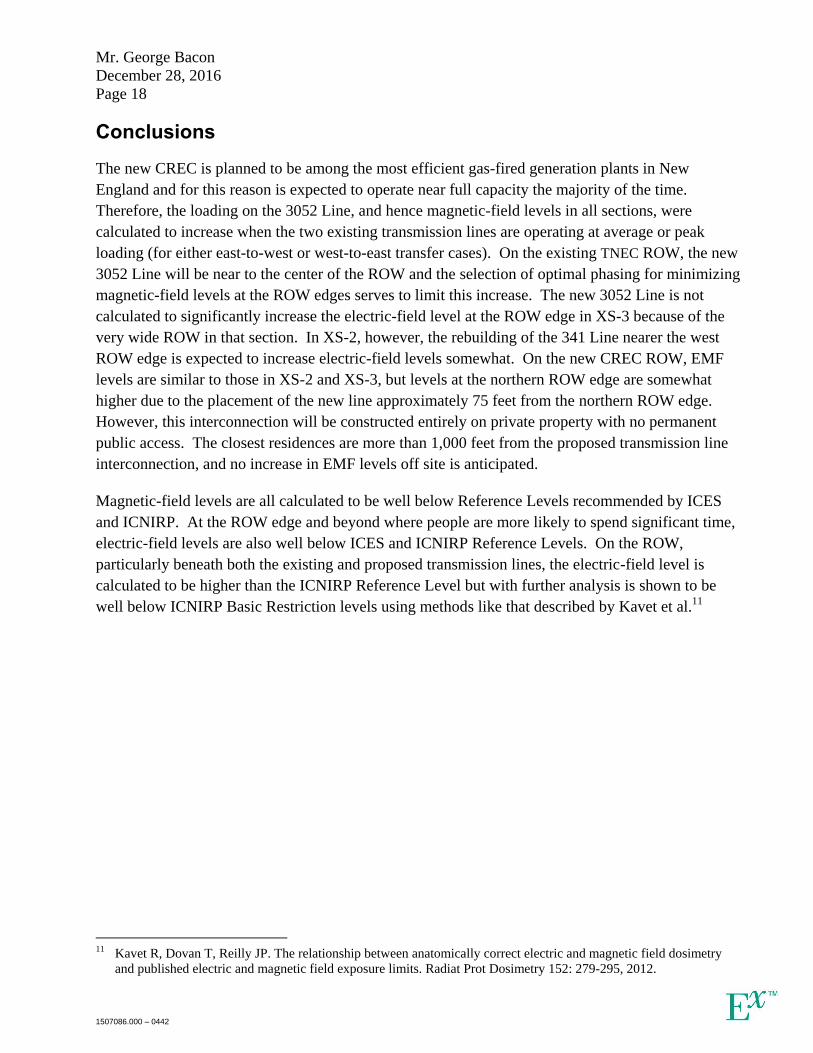
Conclusions
The new CREC is planned to be among the most efficient gas-fired generation plants in New
England and for this reason is expected to operate near full capacity the majority of the time.
Therefore, the loading on the 3052 Line, and hence magnetic-field levels in all sections, were
calculated to increase when the two existing transmission lines are operating at average or peak
loading (for either east-to-west or west-to-east transfer cases). On the existing TNEC ROW, the new
3052 Line will be near to the center of the ROW and the selection of optimal phasing for minimizing
magnetic-field levels at the ROW edges serves to limit this increase. The new 3052 Line is not
calculated to significantly increase the electric-field level at the ROW edge in XS-3 because of the
very wide ROW in that section. In XS-2, however, the rebuilding of the 341 Line nearer the west
ROW edge is expected to increase electric-field levels somewhat. On the new CREC ROW, EMF
levels are similar to those in XS-2 and XS-3, but levels at the northern ROW edge are somewhat
higher due to the placement of the new line approximately 75 feet from the northern ROW edge.
However, this interconnection will be constructed entirely on private property with no permanent
public access. The closest residences are more than 1,000 feet from the proposed transmission line
interconnection, and no increase in EMF levels off site is anticipated.
Magnetic-field levels are all calculated to be well below Reference Levels recommended by ICES
and ICNIRP. At the ROW edge and beyond where people are more likely to spend significant time,
electric-field levels are also well below ICES and ICNIRP Reference Levels. On the ROW,
particularly beneath both the existing and proposed transmission lines, the electric-field level is
calculated to be higher than the ICNIRP Reference Level but with further analysis is shown to be
well below ICNIRP Basic Restriction levels using methods like that described by Kavet et al.11
11 Kavet R, Dovan T, Reilly JP. The relationship between anatomically correct electric and magnetic field dosimetry
and published electric and magnetic field exposure limits. Radiat Prot Dosimetry 152: 279-295, 2012.

Mr. George Bacon
December 28, 2016
Page 19
1507086.000 – 0442
Limitations
At the request of ESS, Exponent modeled the levels of EMF associated with the proposed 3052 Line.
This report summarizes work performed to date and presents the findings resulting from that work.
In the analysis, we have relied on geometry, material data, usage conditions, specifications, and
various other types of information provided by the client. ESS has confirmed to Exponent that the
data provided to Exponent are not subject to Critical Energy Infrastructure Information restrictions.
We cannot verify the correctness of this input data, and rely on ESS for the data’s accuracy.
Although Exponent has exercised usual and customary care in the conduct of this analysis, the
responsibility for the design and operation of the project remains fully with the client.
The findings presented herein are made to a reasonable degree of engineering and scientific
certainty. Exponent reserves the right to supplement this report and to expand or modify opinions
based on review of additional material as it becomes available, through any additional work, or
review of additional work performed by others.
The scope of services performed during this investigation may not adequately address the needs of
other users of this report for purposes unrelated to project permitting, and any re-use of this report or
its findings, conclusions, or recommendations presented herein are at the sole risk of the user. The
opinions and comments formulated during this assessment are based on observations and
information available at the time of the investigation. No guarantee or warranty as to future life or
performance of any reviewed condition is expressed or implied.
If you have any questions or require additional information, please do not hesitate to contact me at
301-291-2519 or [email protected].
Sincerely,
Benjamin Cotts, Ph.D.
Managing Engineer

EXHIBIT B

C O L O R A D O W I S C O N S I N CO phone (303) 666-0617 www.hankardinc.com WI phone (608) 345-1445
CREC NOISE: SUPPLEMENTAL INFORMATION FOR RIDOH
TO: John Niland – Invenergy DATE: June 21, 2017
FROM: Mike Hankard – Hankard Environmental PROJECT: Clear River Energy Center
SUBJECT: Supplemental Information Regarding Noise Questions Raised by RIDOH
The following provides supplemental information regarding questions raised by the Rhode Island Department of Health (RIDOH) concerning noise emissions from the proposed Clear River Energy Center (CREC). The questions listed below were raised by RIDOH as part of the Energy Facilities Siting Board (EFSB) process, including the Department’s Advisory Opinion dated 9/12/2016 and recent data request dated June 8, 2017. Some of the response information provided below was submitted previously to the EFSB, and some of the information is new or revised.
RIDOH Opinion: “As shown in Table 2, the existing nighttime noise levels measured at all receptors except for M3, as reported in the CREC application, were above the 40 dBA LOAEL. Note that those levels were short-terms measurements and may not accurately represent average nighttime levels measured over a longer period.” (Page 10) and “RIDOH does not have sufficient information to support or refute [the assertion that CREC would comply with the WHO standard].” (Page 10, Footnote 9)
CREC Response: A 2009 World Health Organization study of noise in Europe did find 40 dBA as the lowest noise level where any human health effect was noticed in their review of numerous studies. This level is defined as the annual average of each day’s 8-hour nighttime average. The maximum noise level expected from the CREC, based on the most recent (February 2017) design of the facility, is 42 dBA. But this is not an annual average. This represents the very loudest condition expected to occur, and assumes, conservatively, that (1) the facility is either starting up or running at full baseload operation 100% of the time, (2) atmospheric conditions are conducive to sound propagation at all times, and (3) and all residences are always downwind of the CREC.
With regard to the operation of the CREC, there will be many nights over the course of the year when the facility will remain at idle from approximately 10:00 p.m. to 4:00 a.m., then go through 30 minutes of start-up, and then operate at full baseload for the remainder of the night (6:00 a.m.) There could also be nights of full baseload operation for 8 hours. If one makes the assumption that 50% of the time the facility will operate at baseload all night, and 50% of the time the facility will be off until 4:00 a.m. and at baseload the remainder of the night (and assumes that ambient noise levels will be approximately 35 dBA when the facility is off), the CREC annual average noise level would be less than 40 dBA.

CLEAR RIVER ENERGY CENTER SUPPLEMENTAL INFORMATION FOR RIDOH
JUNE 21, 2017 PAGE 2 OF 5
Regarding atmospheric conditions, some nights will consist of rather calm, stable atmospheric conditions. On these nights, noise travels well, and this is what the predicted noise levels represent. On other nights, the atmosphere will be unstable and noise from the CREC will be barely audible or not audible at all. Most important is wind direction, and the predictions assume that all residences are downwind of the facility. Again, if one makes the conservative assumption that good atmospheric conditions or downwind conditions will occur 50% of the nights, and that on nights of poor propagation conditions the ambient noise level is 35 dBA, the annual average noise level would be less than 40 dBA.
Finally, these conditions have to occur together. On those nights when the CREC is operating 100% of the time, some nights will not have favorable propagation conditions. Thus, CREC noise emissions are expected to be below the WHO guideline when assessed on an annual average basis.
RIDOH Opinion: “Note also that the noise survey conducted for the CREC EFSB application did not consider noise that will be generated by an additional turbine at the Algonquin compressor station that has been approved by the Federal Energy Resource Commission (FERC) and permitted by the Rhode Island Department of Environmental Management (RIDEM), but is not yet operating.” (Page 10)
CREC Response: In April 2015 the Algonquin Gas Compressor Station was operating in its pre-additional turbine condition. This is when the CREC project conducted ambient noise measurements in the Project area. The results of these measurements are described in the Project’s October 2015 noise level evaluation report. As described therein, the measured ambient noise levels were compared to predicted CREC noise levels, including the calculation of total noise levels and noise level differences. Therefore, noise from the pre-modified Algonquin Station was considered in the noise survey, and in the analysis of CREC noise impacts. With regard to the approved additional turbine at the Algonquin Station, the report from Algonquin’s acoustical consultant states that noise from the station with the proposed modifications will be no louder than the existing station (Hoover and Keith Report 2976, February 2014). Thus, noise from the modified Algonquin Station was effectively taken into account in both the ambient noise measurements and the analysis of CREC noise impacts.
RIDOH Opinion: “The analysis presented in the Environmental Impact Statement for the Algonquin project does not identify the nighttime or daytime average noise levels associated with operation of that [Algonquin] turbine.” (Page 10)
CREC Response: Noise levels from the existing Algonquin gas compressor station were measured by that facility’s acoustical consultant (Hoover and Keith Report 2976, February 2014). The measured noise level at a distance of approximately 2,000 feet was 50 dBA. This is an equivalent level (Leq), not a weighted 24-hour level (Ldn), and was measured with the compressor

CLEAR RIVER ENERGY CENTER SUPPLEMENTAL INFORMATION FOR RIDOH
JUNE 21, 2017 PAGE 3 OF 5
station operating near full load. This would also be the noise level of the modified Algonquin Station, given that this same report concluded that the modified station would be no louder than the existing station. If one assumes the Algonquin Station operates 24 hours per day the way it did during the measurements, then the average daytime and nighttime levels would each be 50 dBA. Again, these are noise levels at the residence nearest the station (2,000 feet). Noise levels at more distant locations would be lower.
RIDOH Opinion: “RIDOH stands behind its statement that the CREC noise analysis did not consider the increased noise levels associated with the Algonquin equipment that has already been permitted and installed but was not operational at the time that the CREC noise study took place. That upgrade did not replace existing equipment and thus will be associated with additional noise producing equipment. Since permits for future Algonquin upgrades have not yet been filed or reviewed, it is not possible to evaluate the effects that such additional future upgrades would have on noise levels in the area.”
CREC Response: As noted above, the report from Algonquin’s acoustical consultant’s analysis of noise from the proposed station modifications shows that the new station would be no louder than the existing one (Hoover and Keith Report 2976, February 2014).
RIDOH Data Request: The noise analysis submitted as part of the CREC application reported modeled noise impacts associated with construction and operation of the proposed facility at five neighboring locations. Please provide an update of that analysis which shows the magnitude of the noise impact at each of those locations, as well as maximum offsite impacts.
CREC Response: The noise level analysis of both baseload and start-up operations has been updated to reflect the most current design of the CREC (February 2017). The results of this analysis are shown as noise level contours in the figures below. The results at each of the five analysis points are listed in the table below. These levels are approximately 1 dBA lower than those reported in the CREC permit application for baseload operations, due to additional noise mitigation measures being added to the design of the CREC since the application. Refer to the Noise Level Evaluation Report (October 2015) for more information on noise modeling methodology, analysis locations, and input data.
Location Baseload Operation
(dBA) Start-Up Operation
(dBA) M1 41 42 M2 39 40 M3 38 40 M4 38 40 M5 32 34

CLEAR RIVER ENERGY CENTER SUPPLEMENTAL INFORMATION FOR RIDOH
JUNE 21, 2017 PAGE 4 OF 5
Figure 1 – Noise Level Contours for Baseload CREC Operation

CLEAR RIVER ENERGY CENTER SUPPLEMENTAL INFORMATION FOR RIDOH
JUNE 21, 2017 PAGE 5 OF 5
Figure 2 – Noise Level Contours for Start-Up CREC Operation

EXHIBIT C

M E M O R A N D U M
1 © 2017 ESS Group, Inc.
100 Fifth Avenue, 5th Floor
Waltham, Massachusetts 02451
p 781.419.7696 f 781.622.2612 www.essgroup.com
TO: Rhode Island Department of Health DATE: April 20, 2017
FROM: Michael Feinblatt, ESS Group, Inc. ESS PROJECT NO.: I108-013.04
SUBJECT: Clear River Energy Center RIDOH EFSB Advisory Opinion Responses
COPY TO: Invenergy, APS
The following are responses to specific issues raised by the Rhode Island Department of Health (RIDOH) in its Final Energy Facility Siting Board Advisory Opinion for the Clear River Energy Center project dated September 12, 2016. ISSUE 3: Drinking Water Quality Drinking Water Quality The following comment was made by the RIDOH regarding drinking water quality and Invenergy’s response follows:
No source for process water is currently under consideration; however, regardless of the source of water for the plaint, maintaining the quality of existing drinking water supplies, both public and private, remains a priority. To this end, RIDOH asks to assess the impact of any future proposal on drinking water quality.
The CREC Water Plan, dated January 11, 2017, detailed the proposed source of process water for
the facility. Process water will be supplied from the Town of Johnston, Rhode Island under a long
term water supply agreement and delivered to the facility via public roads by trucks owned and/or
leased by the facility. Because the process water will be provided from a municipal water supply
system with its own water treatment facility, the CREC process water use will have no impact on
the quality of existing public or private drinking water supplies.
A RIPDES Construction General Permit Application has been filed with RIDEM for the project,
which includes a Soil Erosion and Sediment Control Plan which details how the discharge of
pollutants to waters of the State will be prevented during project construction, in accordance with
the RI Soil Erosion and Sediment Control Handbook.
A Stormwater Management Plan has been submitted to RIDEM for the project, which details how
stormwater will be managed during CREC operation to prevent the discharge of pollutants to waters
of the State, in accordance with the RI Stormwater Design and Installation Standards Manual.
A Water Quality Certification Application has been submitted to RIDEM for the project. The issuance of the Water Quality Certification for the project by RIDEM will ensure compliance with the State Water Quality Regulations and that the project will not impact the quality of existing public or private drinking water supplies.

CREC EFSB - RIDOH Advisory Opinion Responses April 20, 2017
2 © 2017 ESS Group, Inc.
ISSUE 5: Emergency Response and Prevention Ammonia Storage The following are comments and recommendations made by the RIDOH regarding storage of ammonia at the facility and Invenergy’s response to each:
No documentation was provided to support the statement that the 20% concentration criterion was set by the EPA “because it does not consider aqueous ammonia stored at a concentration less than 20% to pose a public health risk upon release”.
40 CFR 68 sets forth the list of regulated substances and thresholds for which the chemical accident prevention provision apply. It applies to an owner or operator of a stationary source that has more than a threshold quantity of a regulated substance in a process. According to Table 1 to §68.130, “List of Regulated Toxic Substances and Threshold Quantities for Accidental Release Prevention”, the threshold quantity of ammonia at a concentration of 20% or greater is 20,000 pounds. §68.120 establishes the requirements for a substance to be added to the list of regulated substances identified in Table 1. According to §68.120, a substance may be added to the list if, in the case of an accidental release, it is known to cause or may be reasonably anticipated to cause death, injury, or serious adverse effects to human health or the environment. According to Table 1 to §68.130, ammonia at a concentration of less than 20% is not a regulated toxic substance which requires accidental release prevention planning in accordance with 40 CFR 68 when stored or used in any quantity. Its omission from Table 1 indicates that there is insufficient health and environmental effects or exposure data available to conclude that ammonia at a concentration of less than 20% is known to cause or may be reasonably anticipated to cause death, injury, or serious adverse effects to human health or the environment.
Invenergy should establish clear, written procedures for the periodic inspection, testing and maintenance of the integrity of the containment area and the functionality of passive controls, sensors, etc.
Invenergy will develop and implement an Operations and Maintenance (O&M) plan for the facility ammonia containment and control systems following their final design and prior to storing any ammonia on-site to ensure that these systems function as designed should an accidental ammonia release occur.
Invenergy should establish clear, written emergency procedures.
Invenergy will develop and implement an Emergency Response Plan (ERP) for the facility following its final design and prior to storing any ammonia on-site that identifies the staff who will be responsible for implementing emergency response should an accidental ammonia release occur and the appropriate training to be provided for those staff.
Invenergy should conduct a worst-case off-site consequence analysis for ammonia storage using more conservative assumptions.

CREC EFSB - RIDOH Advisory Opinion Responses April 20, 2017
3 © 2017 ESS Group, Inc.
Although CREC is not subject the Risk Management Program, a worst-case accidental release scenario was previously completed to assess the potential consequences in the extremely unlikely event of a release of the 19% aqueous ammonia into the containment area. The results of that analysis showed that all of the areas in which the in-air ammonia concentration would exceed the AEGL-1 level are within the Project and/or Spectra site, which is private property not accessible to the general public. The ALOHA model was previously run using Stability Class A and an ambient temperature of 104°F, which was the highest daily maximum temperature for the site during the past three years, which is the ambient temperature required by the “Risk Management Program Guidance for Offsite Consequence Analysis” for the worst-case release modeling. In its Advisory Opinion, the RIDOH recommended that the ALOHA model be run using Stability Class F and at an ambient temperature of 85°F to be more conservative. Subsequent to the issuance of the RIDOH Final Advisory Opinion, the storage volume of the CREC ammonia storage tank has been reduced from 40,000 to 27,000 gallons. CREC has proposed to employ passive evaporative controls to mitigate the consequences of an accidental release of ammonia from its on-site storage tank. The passive control system will consist of industrial-grade plastic balls placed in the bottom of the containment area surrounding the storage tank. In the event of an accidental release of aqueous ammonia into the containment area, the liquid would pass between the balls and spread out on the concrete base. The floating balls will reduce the area available for volatilization to approximately one-tenth of the total surface area of the liquid. The balls will also block the wind, greatly reducing the wind speed at the surface of the liquid, further reducing the rate of volatilization. CREC is also now proposing to utilize a misting system within the ammonia storage tank containment area to reduce the concentration of any aqueous ammonia within the containment area by 33% in the event of a release. The results of the revised ALOHA modeling analysis, based on the reduced storage volume and the proposed control systems and using the modeling inputs recommended by the RIDOH, are shown graphically on the attached figure. As shown on the attached figure, even under the most stable wind conditions (Stability Class F), the impact areas are all within the CREC and Spectra property lines, within areas not accessible to the public.
Appropriate planning should be implemented for a release with off-site consequences.
Invenergy will develop and implement a Risk Management Plan (RMP) equivalent plan for the facility following its final design and prior to storing any ammonia on-site that includes safety procedures for potentially impacted sensitive receptors, such as residences, schools, and health care facilities should an accidental ammonia release occur.
Planning activities should include an evaluation of impacts of a fire involving the ammonia tank.
The ERP and RMP for the facility which will be developed and implemented following its final design and prior to storing any ammonia on-site will include an evaluation of impacts of a fire involving the ammonia tank, including the emergency response procedures to be implemented should such an event occur.
Invenergy should coordinate with local emergency responders.

CREC EFSB - RIDOH Advisory Opinion Responses April 20, 2017
4 © 2017 ESS Group, Inc.
The ERP and RMP for the facility which will be developed and implemented following its final design and prior to storing any ammonia on-site will include a plan for coordination with local emergency responders, including the nearest hazardous materials response team. This coordination will include providing local emergency responders with the quantities and locations of all chemicals stored on-site, transport routes and procedures, and the results of the worst-case off-site consequence analyses completed for the facility.
Compressed Hydrogen Storage, Use, and Transport The following are comments and recommendations made by the RIDOH regarding facility storage, use and transport of hydrogen and Invenergy’s response to each:
Invenergy should establish clear, written procedures for the periodic inspection, testing and maintenance of all equipment, controls, sensors, etc. related to the storage and use of hydrogen at the facility.
Invenergy will develop and implement an O&M plan for the facility hydrogen storage and handling systems following their final design and prior to storing any hydrogen on-site to ensure that these systems function appropriately and as designed.
All staff that are involved with the storage, transfer and use of hydrogen should be provided with appropriate training.
Invenergy will develop and implement an ERP for the facility following its final design and prior to storing any hydrogen on-site that identifies the staff who will be involved with the storage, transfer, and use of hydrogen and the appropriate training to be provided for those staff. The training, which will include emergency response training and periodic refresher training, will be designed ensure the safe operation and maintenance of the hydrogen storage and handling systems.
Invenergy should coordinate with local emergency responders.
The ERP for the facility which will be developed and implemented following its final design and prior to storing any hydrogen on-site will include a plan for coordination with local emergency responders, including the nearest hazardous materials response team. This coordination will include providing local emergency responders with the quantities and locations of the hydrogen to be stored on-site, transport routes and procedures, with a focus on planning for any potential impacts on sensitive receptors that could occur in the unlikely event of an incident involving hydrogen on-site or during transport.
Additional Considerations and Conclusions The following are additional comments and recommendations provided by the RIDOH regarding facility emergency response and prevention and Invenergy’s response to each:
All potential hazards should be evaluated in a facility-wide RMP-like hazard analysis.
Invenergy will develop and implement an RMP equivalent plan for the facility following its final design and prior to storing any hazardous materials on-site that includes an evaluation of all potential hazards, including any potential hazards associated with the use, storage and transport of ammonia, hydrogen, fuel oil, natural gas, and any hazardous waste that may be generated at the facility.

CREC EFSB - RIDOH Advisory Opinion Responses April 20, 2017
5 © 2017 ESS Group, Inc.
All staff that to be involved with emergency response should be identified and provided with appropriate training.
Invenergy will develop and implement an ERP for the facility following its final design and prior to storing any hazardous materials on-site that identifies the staff who will be involved with emergency response and the appropriate training to be provided for those staff, including all planned emergency response drills.
Invenergy should coordinate with local emergency responders.
The ERP and RMP for the facility which will be developed and implemented following its final design and prior to storing any hazardous materials on-site will include a plan for coordination with local emergency responders, including the nearest hazardous materials response team. This coordination will include providing local emergency responders with the quantities and locations of all hazardous materials stored on-site, transport routes and procedures, and the results of any hazard analyses completed for the facility. The ERP and RMP will include special consideration to potential impacts on sensitive receptors, including residences, schools, workplaces, medical facilities, and other places people congregate. Invenergy will provide emergency responders in any towns which could be impacted in the unlikely event of an incident at or during transport to the facility with any additional equipment that they may need to respond to such an event, upon request.

CREC EFSB - RIDOH Advisory Opinion Responses April 20, 2017
6 © 2017 ESS Group, Inc.

EXHIBIT D

Source: 1) HDR, Site Layout, 4/18/2017
2) ESRI, Imagery and Transportation, 2016
Clear River Energy CenterBurrillville, Rhode Island
0 300 600150Feet
Path: \\DC1\Jobs\I108-000 Invenergy Combined Cycle - RI\04 Graphics\GIS\MXD\Air Modeling\CREC Ammonia Release Threat Zone- 27k Diluted Controlled.mxd
Ammonia Off-Site Consequences Analysiswith Passive Evaporative Controls
(27,000gal Tank w/33% Containment Area Dilution, Stability Class F)1 inch = 500 feet
Drawing Date: 4/19/2017
!°© 2017 ESS Group, Inc.
ALOHA (Area Locations of Hazardous Atmospheres) Model Parameters:
SITE DATA: Location: BURRILLVILLE, RHODE ISLAND
Building Air Exchanges Per Hour: 0.34 (unsheltered single storied) Time: September 19, 2016 2000 hours EDT (user specified)
CHEMICAL DATA: Chemical Name: AQUEOUS AMMONIA
Solution Strength: 12.73% (by weight) Ambient Boiling Point: 145.7° F Partial Pressure at Ambient Temperature: 0.22 atm
Ambient Saturation Concentration: 220,991 ppm or 22.1% Hazardous Component: AMMONIA CAS Number: 7664-41-7 Molecular Weight: 17.03 g/mol
AEGL-1 (60 min): 30 ppm AEGL-2 (60 min): 160 ppm AEGL-3 (60 min): 1100 ppm
IDLH: 300 ppm LEL: 150000 ppm UEL: 280000 ppm
ATMOSPHERIC DATA: (MANUAL INPUT OF DATA)
Wind: 0.63 meters/second from s at 3 meters Ground Roughness: urban or forest Cloud Cover: 5 tenths Air Temperature: 85° F Stability Class: F
No Inversion Height Relative Humidity: 50%
SOURCE STRENGTH:
Evaporating Puddle (Note: chemical is flammable) Puddle Area: 180 square feet Puddle Volume: 35910 gallons Ground Type: Default soil Ground Temperature: 85° F
Initial Puddle Temperature: Ground temperature Release Duration: ALOHA limited the duration to 1 hour Max Average Sustained Release Rate: 1.03 pounds/min
(averaged over a minute or more) Total Amount Hazardous Component Released: 62.0 pounds
THREAT ZONE: Model Run: Gaussian Red : 32 yards --- (1100 ppm = AEGL-3 [60 min])
Orange: 116 yards --- (160 ppm = AEGL-2 [60 min]) Yellow: 291 yards --- (30 ppm = AEGL-1 [60 min])
Legend
AEGL-1 (>30 ppm, 291 yards)
AEGL-2 (>160 ppm, 116 yards)
AEGL-3 (>1100 ppm, 32 yards)