Embed Size (px)
Citation preview
Improving the Research Request Process In the Division of University advancement
At the University of Miami
Rick Melnyck

Introduction The Division of University Advancement at the University of Miami is charged with the responsibility and authority to coordinate all fund-raising activities of the university. President Shalala and other central, medical and school-based development officers are responsible for qualifying, cultivating, soliciting and stewarding donors for the University of Miami. The Advancement Research Department identifies, analyzes, tracks and compiles biographical and financial information on potential donors for President Shalala and central, medical and school-based development officers.
Define Phase – Research Requests
(1) Business Case
What is the name of the process? The name of the process is Research Report Requests. What is the aim of the process? The aim of the process is to get the Development Officers, VP’s, AVP’s and President Shalala the right amount of information on a particular prospect at the right time while making more efficient use of the Research Department’s time.
Why do the project at all? The Research Requests project should be conducted to satisfy the needs of the Development Officers, VP’s, AVP’s and President Shalala in regards to information they need on potential donors.
Why do the highest priority project now? There seems to be a crisis in the Research office as the Researchers feel that they are overworked and understaffed. Many of the Development Officers do not use the Research Department and a lot of their time that should be spent cultivating and soliciting donors is spent doing research. Also, the Research staff is spending 100% of their time doing research reports and do not have time to identify new donor prospects for the University.
What are the consequences of not doing the highest priority project? The consequences of not doing the Research Requests project would be twofold. Firstly, the Researchers would continue to feel overwhelmed with the amount of work they receive which could lead to frustration and possibly turnover. The Development Officers will continue to spend part of their time doing research when their time could be better spent with donors. Finally, if the researchers do not have time to identify new prospects the donor pool may start to ‘dry up’ for the Development Officers.

What business objectives are supported by the highest priority project? The Prospect Management Project is strongly related to the “Increase the endowment”, “Improve the national ranking of the University”, “Improve student experiences” and “Improve interdisciplinary research” presidential objectives.
Problem Statement According to the Research staff, they are overworked and understaffed due to the fact that the report requestors are asking for types of profiles that are more than the requestor needs and are an inefficient use of the researcher’s time and energy. The Development Officers (DO’s) feel that their needs are not being met and that the process is reactive. This means that many of them do their own research and completely bypass the Research department. The DO’s are spending a lot of their time doing research when they should be out cultivating and soliciting potential prospects. In addition, the Research staff is spending all of their time doing research reports and does not have time to identify new prospects for the Development Officers.
Goal Statement The goal for the Research Request project is to improve the process of efficiently delivering the right type of research request to the customer for what they need it for. Also the time of the researchers must not only be spent on doing research reports but more importantly on identifying new donor prospects. Project Objective To transform the current Research Request process into a proactive and efficient process.
What are the process boundaries?
The starting point for the project is when the Research Requestor makes an online Report Request. The stopping point for the project is when the Research profile is delivered to the Research Requestor.
What are the benefits of the project? The soft benefits include eliminating complaints from the Research Department for being overworked. It will also include making more use of the researchers time so they can spend time in other areas such as prospect identification. There will also be soft benefits to the requestors of the research as they will receive better quality reports due to researchers not having to rush to meet deadlines. Another benefit will DO’s spending less time doing research and more time cultivating and soliciting prospects.

Hard benefits Research department 40% misclassified research requests X 520 requests per year = 208 misclassified reports/year X 10 hrs average extra time spent due to misclassification of report = 2080 extra hours spent on misclassified reports X $25/hr researcher salary (including benefits) = $52,000 saved per year New prospects identified per month The researchers will have over 2000 more hours to work on prospect identification. Since the researchers will have more time they will be able to identify prospects for the DO’s to cultivate and solicit, those fundraising dollars would be added to the hard benefits of this project.
Development Officers The hard benefits for the Development Officers are a little tougher to calculate. However having a couple more hours per day to meet with prospects could result in many more donations than would have resulted had they been doing their own research.
(2) SIPOC Analysis
Suppliers Inputs Process Output Customers
• Development Officers
• Vice-President for University Advancement
• President Shalala • Associate Vice-
Presidents • Other
Development Staff
• Name of Prospect
• Name of Report Requestor
• Type of Report Needed
• Date Report Requested
• Date Report Required
See flowchart below
• Research Profile • Type of Report • Total Number of
Pages • Number of Reports
Requested
• Development Officers
• Vice-President for University Advancement
• President Shalala • Associate Vice-
Presidents • Other
Development Staff

Report requestor fills outonline report request
Form
Start
Request is assigned toresearcher
Researcher completesreport
End
Research Directorreceives request
Researcher sends profileto requestor
Research DirectorReviews report
Does report meetstandards?
Yes
No

(3) Analysis Data for Voice of the Customer Data
Raw VoC Data Affinity Diagram Theme (Focus Point)
Driving Issue CTQ
“Not an efficient process” “Not a proactive process at all, it is completely reactive” “Not a good system” “I am on my own” “My assistant and I do all of our own research” “Research cannot manage the flow, they start doing a profile for her then get pulled away to do a profile for Sergio or President Shalala” “I do my own research”
DO’s end up doing their own prospect research when there is a Research Department to do it. (Product related)
Reactive process
Cycle time to complete report (number of days until report completed)
“I identify my own prospects, I might get one from research once in a blue moon” “I do research to find my prospects which takes away from the time I could be out there raising money” “I do most of my own prospect identification and it is labor intensive”
Ability to identify new prospects
# of new prospects identified by research per month
Project Objectives: To decrease cycle time to complete reports by 30% and to also increase the number of new prospects identified by the Research department from the current level of zero, both of these objectives should be realized by December 31, 2006.
Measure Phase – Research Requests
Introduction The measure phase contains three steps: operationally defining each CTQ, conducting Gage Reproducibility and Repeatability (R&R) studies on each CTQ, and developing a baseline for each CTQ. (1) Operational Definitions From the define phase, it has been determined there is one CTQ, cycle time to complete the research report (the number of days it takes to take the request and deliver the completed report to the requestor). The CTQ will be operationally defined in terms of the following three parameters:
1. Criteria 2. Test 3. Decision

Operational Definition for CTQ: Cycle time to complete report (number of days until report finished) Criteria for the cycle time to complete report: Open the database and accumulate all of the different reports for each requestor for each year. Test: Find the date the report was completed and the date the report was requested Decision: Subtract the requested date from the completed date, determine the number of days. (2) Establishing the Validity of the Measurement System for Each CTQ CTQ: Cycle time to complete report (number of days until report finished) There is no measurement error to speak of. For each report requested we simply look at the date completed and subtract the date requested from it to get the cycle time to complete the report. (3) Establishing the Baseline Capabilities for CTQ A dot plot and descriptive statistics were completed to show the cycle times to complete all the requests from 2004 and 2005. On average it took 10.271 days to complete a report in 2004 and 2005. Variable N N* Mean SE Mean StDev Minimum Q1 Median Q3 C2 962 0 10.271 0.386 11.961 0.000000000 4.000 7.000 14.000 Variable Maximum C2 168.000
CTQ1751501251007550250
Dotplot of Cycle Time to Complete Report (in days)
Each symbol represents up to 9 observations.

An Individuals-Moving Range chart was completed to show a baseline for cycle time to complete the 962 research requests in 2004 and 2005. The y-x axis represents the length of time (in days) it took to turnaround a research request, each value on the x-y axis represents each of the 962 requests made in the two year span. The chart shows a wildly out of control process.
Observation
Indiv
idual
Value
86768672576480384288192961
160
120
80
40
0
Observation
Movin
g Ran
ge
86768672576480384288192961
160
120
80
40
0
222226666
51
6666888
88
2222222222222226666666222222222222222222266666666666666666
1
1
2226666
11
1
11
111
666
6
8
1
6
11
2666
11
44
1
5
1
62266666
66666
8
6688
6
8
2226666
1
222222222222222
6
2266
6
26
551
1
22226622222222222222222222226662222222222222
25511
6
5
666
22222
5661
222266666
51
22222666666662226666
1
2222226888
222666666
2666
1
22222222222222
11111111
1
555
11
22222
1
22222222222222222222222222222222
1111
2
1111
11
11
1111
11
3
11
111
11
11
222
11
22222222222222222
1
222
1
222222222222222222222222222222222
1111
222
1
2222
1
22
1
22222222
1
2222222
11
22222222222
1
2
11111
11
11
1111
I-MR for Days to Complete
Process capability cannot be calculated for this process as it is out of control. Further, cycle time and priority are correlated.

Analyze Phase – Research Requests
Process map identifying and linking the X’s and Y’s:
Report requestor requests specific report from online
report request Form
Start
Request is assigned to researcher
Researcher completes report
End
Research Director receives request
X2 = Type of report ordered (L1, L2, B, T) X3 = Priority (Due Date - Date Requested)X4 = Inappropriate profile requested
Researcher sends profile to requestor
Y1 = Cycle time to complete research report
X1 = Number of reports requested from each requestor per year
Research Director Reviews report
Does report meet standards?
Yes
No
The sources of the X’s came from process knowledge gathered by interviewing the Research Director, the Research Analysts as well as the Development Officers (DOs).

Operational definitions of X’s Operational Definition for X1: Number of reports requested from each requestor per year Criteria for the number of research requests per year per requestor: Open the database and look at the table containing research requests for each year. Test: Check to see if each request has the following criteria:
1. The name of the requestor 2. The area of the requestor 3. The name of the prospect being profiled 4. The type of report requested 5. The data the report was requested 6. The requested completion date
Decision: If all six criteria have been met then a research request has been submitted, if not all six criteria have been met then a research request has not been submitted. Add up the total number of research requests per year per requestor. Operational Definition for X2: Type of report ordered (L1, L2, B, T) Criteria for type of report requested: Open the database and pick a report request. Test: Check to see the type of report in each report request. Decision: The report will be one of the following: Level 1, Level 2, Blurb, Trustee or Special. Operational Definition for X3: Priority Criteria for priority of the report request: Open the database and pick a report request. Test: Find the value for the date the report request was submitted and the date the requestor wants the report completed by. Decision: Subtract the date the report request was submitted from the date the requestor wants the report completed by to get the priority for the report request in days, for example, a report is submitted on the 14th and is needed on the 17th, so, the priority is 3 days Operational Definition for X4: Inappropriate report requested Criteria for priority of the report request: Open the database and pick a report request. Test: Find the value for the type of report requested and the step in the prospect management process. Decision: If the report is a Level 1 and the step in the prospect management process is either ‘Cultivate’ or ‘Solicit’ then the request is appropriate, if the report is a Level 1 and the step in the prospect management process is ‘Qualify’ then the request is inappropriate. If the report is a Level 2 and the step in the prospect management process is ‘Solicit’ then the request is appropriate, if the report is a Level 2 and the step in the prospect management process is ‘Qualify’ or ‘Cultivate’ then the request is inappropriate. Gage R&R Studies of Each X Gage R&R studies were not conducted on the X’s because their values come from a database and are inherently obvious. Therefore, the assumption is that all of the measurements for the Xs are acceptable.
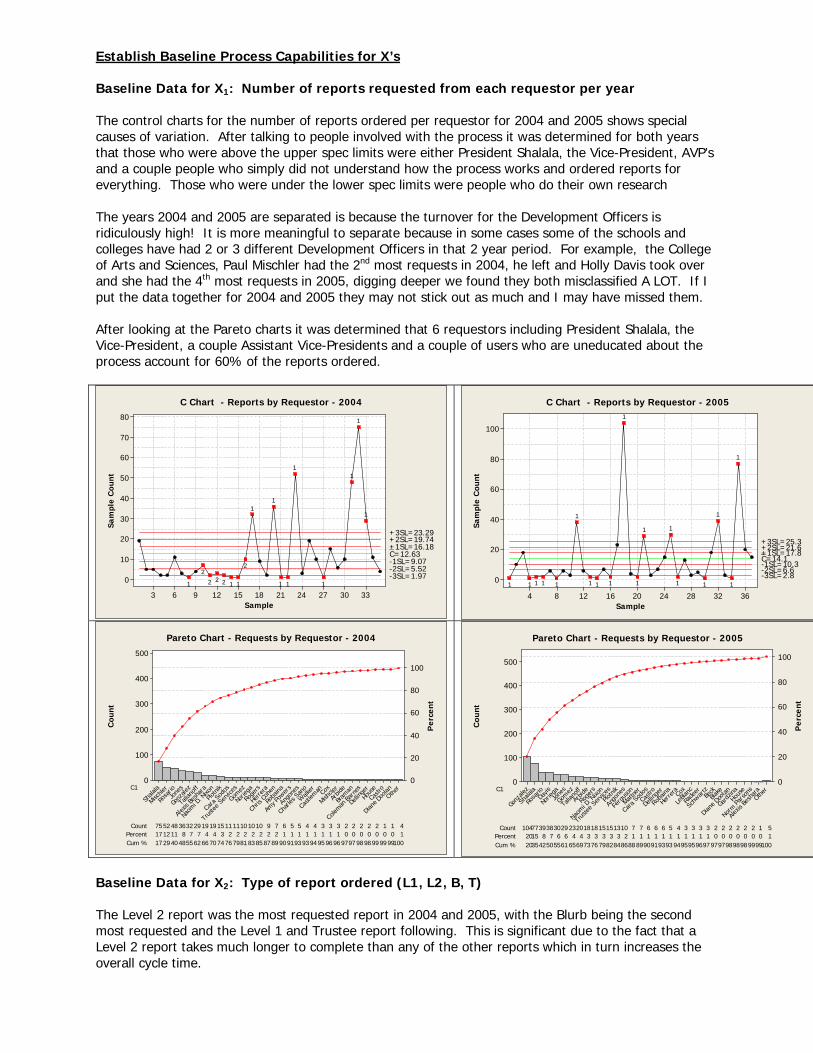
Establish Baseline Process Capabilities for X’s Baseline Data for X1: Number of reports requested from each requestor per year The control charts for the number of reports ordered per requestor for 2004 and 2005 shows special causes of variation. After talking to people involved with the process it was determined for both years that those who were above the upper spec limits were either President Shalala, the Vice-President, AVP’s and a couple people who simply did not understand how the process works and ordered reports for everything. Those who were under the lower spec limits were people who do their own research The years 2004 and 2005 are separated is because the turnover for the Development Officers is ridiculously high! It is more meaningful to separate because in some cases some of the schools and colleges have had 2 or 3 different Development Officers in that 2 year period. For example, the College of Arts and Sciences, Paul Mischler had the 2nd most requests in 2004, he left and Holly Davis took over and she had the 4th most requests in 2005, digging deeper we found they both misclassified A LOT. If I put the data together for 2004 and 2005 they may not stick out as much and I may have missed them. After looking at the Pareto charts it was determined that 6 requestors including President Shalala, the Vice-President, a couple Assistant Vice-Presidents and a couple of users who are uneducated about the process account for 60% of the reports ordered.
Sample
Sam
ple
Cou
nt
3330272421181512963
80
70
60
50
40
30
20
10
0
_C=12.63
+3SL=23.29
-3SL=1.97
+2SL=19.74
-2SL=5.52
+1SL=16.18
-1SL=9.07
1
1
1
1
1
11
11
2
11222
2
1
C Chart - Reports by Requestor - 2004
Sample
Sam
ple
Cou
nt
3632282420161284
100
80
60
40
20
0
_C=14.1
+3SL=25.3
-3SL=2.8
+2SL=21.6
-2SL=6.6
+1SL=17.8-1SL=10.3
1
1
1
11
11
1
1
111
1
11111
C Chart - Reports by Requestor - 2005
Cou
nt
Per
cent
C1
Count 15111110 1010 9 7 6 575 5 4 4 3 3 3 2 2 2 252 2 1 1 4Percent 171211 8 7
487 4 4 3 2 2 2 2 2 2
362 1 1 1 1 1 1 1 1 0
320 0 0 0 0 0 1
Cum % 1729
29
40485562667074767981
19
83858789909193939495
19
969697979898999999100
Other
Diane
Doo
lan
Castr
oHo
use
Dellin
ger
Colem
an Ba
rnes
Braman
Arbid
e
Mishcle
rCo
x
Castl
eman
Walker
Charl
es Sa
no
Ango
nes
Amy P
ower
s
Roba
ina
Chris
Cohe
n
Herre
ra
Roge
rs
Norie
ga
Gomez
Trus
tee S
ervice
s
Cara
Sodo
s
Plotni
k
Naom
i D. N
ixon
Alexis
Besh
ara
Talia
noff
Gonz
alez
Jone
s
Rosa
rio
Mischle
r
Shala
la
500
400
300
200
100
0
100
80
60
40
20
0
Pareto Chart - Requests by Requestor - 2004
Cou
nt
Per
cent
C1
Count 18
9999100
1815151310 7 7 6 6104 6 5 4 3 3 3 3 2 2 277 2 2 2 1 5Percent 2015 8 7
396 6 4 4 3 3 3 3 3 2
381 1 1 1 1 1 1 1 1 1
301 0 0 0 0 0 0 0 1
Cum %
29
20354250556165697376
23
79828486888990919393
20
94959596979797989898
Othe
r
Alexis
Besh
ara
Norm
Parso
ns
Hous
e
Gardzin
a
Diane
Doo
lanBla
keBe
ck
Schw
artz
Rade
er
LeBla
ncCox
Herre
ra
Roba
ina
Dellin
ger
Castr
o
Cara
Sod
os
Mattne
r
Ferg
uson
Ango
nes
Plotni
k
Trus
tee S
ervice
s
Naom
i D. N
ixon
Roge
rs
Arbid
e
Talia
noff
Gomez
Jone
s
Norie
gaDa
vis
Rosa
rio
Shala
la
Gonz
alez
500
400
300
200
100
0
100
80
60
40
20
0
Pareto Chart - Requests by Requestor - 2005
Baseline Data for X2: Type of report ordered (L1, L2, B, T) The Level 2 report was the most requested report in 2004 and 2005, with the Blurb being the second most requested and the Level 1 and Trustee report following. This is significant due to the fact that a Level 2 report takes much longer to complete than any of the other reports which in turn increases the overall cycle time.
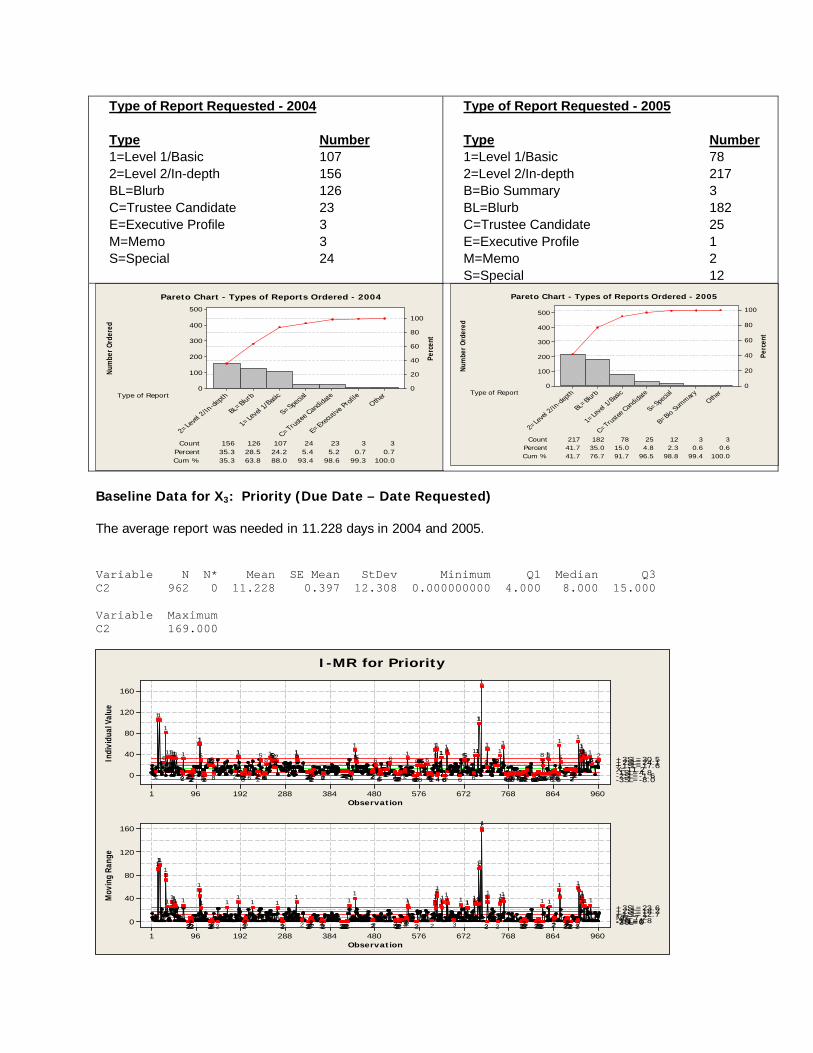
Type of Report Requested - 2004 Type Number 1=Level 1/Basic 107 2=Level 2/In-depth 156 BL=Blurb 126 C=Trustee Candidate 23 E=Executive Profile 3 M=Memo 3 S=Special 24
Type of Report Requested - 2005 Type Number 1=Level 1/Basic 78 2=Level 2/In-depth 217 B=Bio Summary 3 BL=Blurb 182 C=Trustee Candidate 25 E=Executive Profile 1 M=Memo 2 S=Special 12
Num
ber O
rder
ed
Perc
ent
Type of Report
Count35.3 28.5 24.2 5.4 5.2 0.7 0.7
Cum % 35.3 63.8
156
88.0 93.4 98.6 99.3 100.0
126 107 24 23 3 3Percent
Other
E=Ex
ecutiv
e Prof
ile
C=Trustee
Candida
te
S=Specia
l
1=Lev
el 1/B
asic
BL=Blu
rb
2=Lev
el 2/In
-depth
500
400
300
200
100
0
100
80
60
40
20
0
Pareto Chart - Types of Reports Ordered - 2004
Num
ber O
rder
ed
Perc
ent
Type of Report
Count41.7 35.0 15.0 4.8 2.3 0.6 0.6
Cum % 41.7 76.7
217
91.7 96.5 98.8 99.4 100.0
182 78 25 12 3 3Percent
Other
B=Bio
Summary
S=Specia
l
C=Trustee
Candida
te
1=Lev
el 1/B
asic
BL=Blu
rb
2=Lev
el 2/In
-depth
500
400
300
200
100
0
100
80
60
40
20
0
Pareto Chart - Types of Reports Ordered - 2005
Baseline Data for X3: Priority (Due Date – Date Requested) The average report was needed in 11.228 days in 2004 and 2005. Variable N N* Mean SE Mean StDev Minimum Q1 Median Q3 C2 962 0 11.228 0.397 12.308 0.000000000 4.000 8.000 15.000 Variable Maximum C2 169.000
Observation
Indi
vidu
al V
alue
960864768672576480384288192961
160
120
80
40
0
_X=11.2+3SL=30.5
-3SL=-8.0
+2SL=24.1
-2SL=-1.6+1SL=17.6-1SL=4.8
Observation
Mov
ing
Rang
e
960864768672576480384288192961
160
120
80
40
0
__MR=7.2+3SL=23.6
-3SL=0+2SL=18.2-2SL=0+1SL=12.7-1SL=1.8
2666111111
11
51
1
2222222222222222
5
1
6666622222666
51
6666888
88
2222222222222226666666222222222222226666666666666666
11
2266666
1
22
1
11
111
6
555
6
11
2666
11
44
1
5
1
22666668
666666
8
6688
6
8
2226666
1
222222222222222
6
222222666
6
2222
5511
66222222222222226222222
22222222
511
222222
2255518
66666
5
2222262222666
11
28
2222222226
2666
5
11
22222222222222
1
222
1111111
1
6
11
2
1111111
11
22222222222222222
11
222
11
22222222222222222222222222
1111
2
11
22
11
11
1111111
3
111
11
11
111
222
11
22222222222222222222
11
222222222222222222222222222222222
1
2222
11
22222
11
222222222
1
11
22222222222
111111
1
11
1111
I-MR for Priority

Baseline Data for X4: Inappropriate report requested After speaking with some of the Research staff it was realized that some of the reports may have been misclassified, meaning that the report requested was not the report that was actually needed (see operational definition). After taking a stratified random sample of the 6 people who made the most requests (in both 2004 and 2005) it was found that there was a misclassification rate of 40% in each year. Misclassification of Report requests - 2004
Name # % N=100 Number Misclassified Number ok
Donna Shalala 75 27 N1=27 6 21 Mischler 52 20 N2=20 13 7 Rosario 48 17 N3=17 5 12 Jones 36 13 N4=13 4 9 Gonzalez 32 12 N5=12 3 9 Talianoff 29 11 N6=11 9 2 Total 272 100% 40 60
Misclassification of Report requests - 2005
Name # % N=100 Number Misclassified Number ok
Gonzalez 104 33 N1=33 4 29 Shalala 77 24 N2=24 5 19 Rosario 39 12 N3=12 11 1 Davis 38 12 N4=12 12 0 Noriega 30 10 N5=10 3 7 Jones 29 9 N6=9 5 4 Total 317 100% 40 60
Develop Hypotheses about the Relationships Between the High Risk X’s and the CTQs X1: Number of reports requested from each requestor per year The number of reports requested from each requestor per year seems to be a large contributing factor to cycle time to turnaround reports. Upon further investigation it seems that only 1 researcher is assigned to President Shalala, the VP and AVP’s even though they account for 60% of the research requests. When a large amount of requests from them comes in all of the other researchers put their own projects on hold to work on these projects.
Cou
nt
Per
cent
C1
Count 15111110 1010 9 7 6 575 5 4 4 3 3 3 2 2 2 252 2 1 1 4Percent 171211 8 7
487 4 4 3 2 2 2 2 2 2
362 1 1 1 1 1 1 1 1 0
320 0 0 0 0 0 1
Cum % 1729
29
40485562667074767981
19
83858789909193939495
19
969697979898999999100
Other
Diane
Doo
lan
Castr
oHo
use
Dellin
ger
Colem
an Ba
rnes
Braman
Arbid
e
Mishcle
rCo
x
Castl
eman
Walker
Charl
es Sa
no
Ango
nes
Amy P
ower
s
Roba
ina
Chris
Cohe
n
Herre
ra
Roge
rs
Norie
ga
Gomez
Trus
tee S
ervice
s
Cara
Sodo
s
Plotni
k
Naom
i D. N
ixon
Alexis
Besh
ara
Talia
noff
Gonz
alez
Jone
s
Rosa
rio
Mischle
r
Shala
la
500
400
300
200
100
0
100
80
60
40
20
0
Pareto Chart - Requests by Requestor - 2004
Cou
nt
Per
cent
C1
Count 18
9999100
1815151310 7 7 6 6104 6 5 4 3 3 3 3 2 2 277 2 2 2 1 5Percent 2015 8 7
396 6 4 4 3 3 3 3 3 2
381 1 1 1 1 1 1 1 1 1
301 0 0 0 0 0 0 0 1
Cum %
29
20354250556165697376
23
79828486888990919393
20
94959596979797989898
Othe
r
Alexis
Besh
ara
Norm
Parso
ns
Hous
e
Gardzin
a
Diane
Doo
lanBla
keBe
ck
Schw
artz
Rade
er
LeBla
ncCox
Herre
ra
Roba
ina
Dellin
ger
Castr
o
Cara
Sod
os
Mattne
r
Ferg
uson
Ango
nes
Plotni
k
Trus
tee S
ervice
s
Naom
i D. N
ixon
Roge
rs
Arbid
e
Talia
noff
Gomez
Jone
s
Norie
gaDa
vis
Rosa
rio
Shala
la
Gonz
alez
500
400
300
200
100
0
100
80
60
40
20
0
Pareto Chart - Requests by Requestor - 2005

X2: Type of report ordered (L1, L2, B, T) The dot plot for Cycle Time to Turnaround Reports (CTQ) by Types of Report Ordered indicates:
1. The cycle time for Blurb reports has the lowest variation which makes sense as they are the shortest and quickest report.
2. The cycle time to complete Level 2 reports has the largest variation as they involve much more work than the others.
This means that more Level 1 and Level 2 reports that are ordered will drastically affect the cycle time to turnaround reports.
CTQ1751501251007550250
Dotplot for Cycle Time to Turnaround Reports
Each symbol represents up to 9 observations.
CTQ1501251007550250
Level 1
Level 2
BlurbTrustee
Other
Dotplot for CTQ by Types of Report Ordered
Each symbol represents up to 12 observations.
The reason for the outliers in the dotplots above is due to the reports requested not being needed right at the moment. The reports were requested well in advance of them being needed meaning the researcher worked on other reports that were a higher priority (needed sooner) and worked on the outlier reports right before their due date. X3: Priority (Due Date – Date Requested) The dot plots for Cycle Time to Turnaround Reports (CTQ) and Priority to Receive Reports indicate: 1. The values of Cycle Time to Turnaround Reports seem to be close to those of Priority to Receive
Reports, meaning that the priority to receive the reports is a contributing factor to cycle time to turnaround reports (CTQ)
CTQ1751501251007550250
Dotplot for Cycle Time to Turnaround Reports
Each symbol represents up to 9 observations.
CTQ1751501251007550250
Dotplot for Priority to Receive Reports
Each symbol represents up to 8 observations.

X4: Inappropriate report requested The dot plot and descriptive statistics for Cycle Time to Turnaround Reports (CTQ) by Misclassified Reports indicates:
1. The dotplot shows that misclassification of reports increases the time it takes to complete reports. The average of 11.48 days for misclassified reports in 2004 and 12.8 days in 2005 are both higher than for all of the requests (10.22)
2004 Variable N N* Mean SE Mean StDev Minimum Q1 Median Q3 C1 40 0 11.48 2.62 16.55 0.000000000 5.00 7.00 13.75
CTQ988470564228140
Dotplot for Misclassifed Reports 2004 vs CTQ
2005 Variable N N* Mean SE Mean StDev Minimum Q1 Median Q3 Maximum C1 40 0 12.80 1.63 10.32 1.00 5.00 10.00 15.75 44.00
CTQ42363024181260
Dotplot for Misclassifed Reports 2005 vs CTQ
Hypotheses Regarding Relationships Among the X’s and CTQ The analyze phase resulted in the following hypothesis: Cycle time to turnaround report = f (X1: Number of reports ordered per requestor/year, X2: Type of report ordered, X3: Priority, X4: Inappropriate report requested) The reason for the extreme points in the CTQs and their relationships to the extreme points in the Xs is due to the correlation between cycle time and how quickly the report is needed (priority). If a report is not needed for 90 days, the researcher won’t work on it until close to the date it is needed instead focusing on reports that are needed sooner, hence, the outliers in the CTQs.

X1: Number of reports requested from each requestor per year There is no optimum number of reports requested per year. It all depends on the number of prospects they are going to qualify, cultivate or solicit, which depends on a bunch of factors that are not measurable. X2: Type of report ordered (L1, L2, B, T) There is no optimum type of report ordered. Blurbs are the easiest and least time consuming then come Level 1 reports and finally Level 2’s are the most time consuming. As you will see in my improve phase it all depends where the prospect is in the cultivation cycle as to the type of report ordered. X3: Priority (Due Date – Date Requested) There is no optimum level for priority. If the DO needs the report in 2 weeks because they are meeting with a prospect then the priority is 14 days. X4: Inappropriate report requested The optimum level for inappropriate report requested is zero. The more misclassified reports you have the more time your researchers are wasting doing research that most likely will not be used. This is a pretty easy fix in the improve phase. A Design of Experiments is not needed in the Analyze phase due to the fact that we know the optimum level of factor levels due to process knowledge (see above). The problems with the X’s can be solved by modifying the procedures in the Advancement Research Office which will be detailed in the Improve phase.
Improve Phase – Research Requests
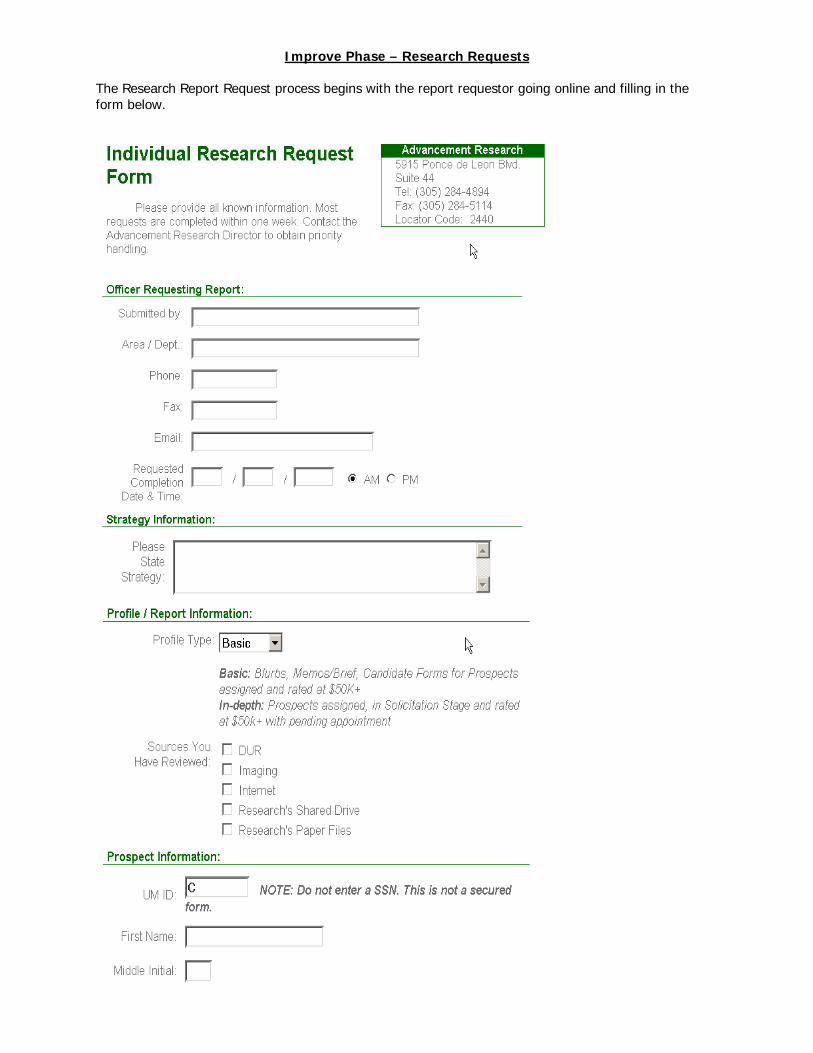
The Research Report Request process begins with the report requestor going online and filling in the form below.


Misclassification of Reports After speaking with some of the Research staff as well as some of the Directors of Development it was indicated that some of the reports may have been misclassified, meaning that the report requested was not the report that was actually needed. In the Analyze phase we took a stratified random sample of the 6 people who made the most requests (in both 2004 and 2005) it was found that there was a misclassification rate of 40% in each year. After some investigation it is clear that this problem is caused by the requestor filling out the online report request form above and asking for a report that they do not need. The requestor ends up getting more information than they will use and the research department spends valuable time doing research for nothing as well as many hours of overtime. The prospect management cycle consists of the following stages and the type of report needed at each stage in the process is indicated in parenthesis:
1. Identify the prospect – no report is needed 2. Qualify the prospect – blurb report is needed (can often be provided by DOD’s assistant) 3. Cultivate the prospect – Level 1 report is needed 4. Solicit the prospect – Level 2 report is needed 5. Steward the prospect – no report is needed
In order to solve this problem the online report request form above will be modified so that the report requestor does not ask for a specific report but instead states the stage of the prospect management cycle that they are in. The Director of Research will then determine upon receiving the request which report will be completed depending on the stage in the prospect management cycle the prospect is in. Reports do not meet standards Another problem with the process is the fact that the Research Director must send many reports back to the researchers before sending them to the requestors because the report does not meet quality standards. Many of the same mistakes are made over and over again and waste not only the Research Director’s time but also the individual researcher’s time as well. To solve this problem we will create a quality checklist for the researchers to go over before they submit the report to the Research Director for review. In addition, they will submit their report to their peers for a peer review before sending it to the Research Director.

Research Report Quality Checklist Prior to beginning any research report, remember to always do the following: Check Assignment of Prospect Check Prospect Management Status/Cultivations Contact Requesting Officer to Discuss Specific Needs Type of Report PM Status Components of Research Prospecting Blurb Qualify Job Title
Brief Business Description (Include spousal occupation only if relevant. i.e. Education Prospects)
Home Market Value Estimated Gift Capacity UM Affiliations Current Contact Information Note: A Prospecting Blurb should not exceed 3-4 sentences. Customize, within reason, for your particular DOD. While some prefer simple one liners, stating only Estimated Gift Capacity and Affiliation, others prefer all info. available for such a request. Event Blurb Miscellaneous Job Title * Usually reserved for Presidential Brief Business Description and Provost related events. Significant Directorships Significant Charitable/Civic Affiliations Spousal Information, if Attending UM Affiliations Summarized UM Giving Basic - Level 1 Cultivate Confirmation of Home Address/Contact Personal Information (Spouse, children, birthdate) Confirmation of Business Address/Contact Current Business Dealings/News Significant Directorships Significant Charitable/Civic Affiliations Basic On-Line News Search (up to 3 years)
Basic Wealth Indicators (i.e. Home Value, Stockholdings, Salary, Business Revenue - if owner of company)
UM Affiliations (if not previously delivered) UM Giving History (if any) In-depth - Level 2 Ready to Solicit Indepth Online News Search Extensive Wealth Profile (including family relations if applicable) Indepth Business Information/Career History Indepth Analysis of Past Charitable Giving Philanthropic Affiliations Updated UM Giving History NOTE: By this point, the DOD should be very familiar with prospect. A level 1 profile is already on file and does not need to be repeated. If on a rare occasion they have no prior research, you would have to inlcude Level 1 information as well. Depending on the DOD and their preferences, you may also combine/update your Level 1 with the Level 2 for a final product. Some may prefer simply the taregted info. Memo Report Miscellaneous Targeted to a specific question that a DOD may need for a

cultivation meeting
(i.e. Recent sale of a company, pending lawsuit, or simply a current address and phone number)
Also remember to check the following: Spelling Grammar Style (AP) Peer Review NOTE: During a Peer Review, the reviewer should always write their name at the top of the draft reviewed. Apart from the elements listed above, remember to look out for information that does not add up, or seems off the mark... This document is for internal use within the Research Department only.
Reports requested by requestor The final problem with the Research Report Request process has to do with the fact that only 1 out of 6 researchers is assigned to the President's Office, Vice-President's Office and Trustee Services even though over 60% of the research report requests come from those 3 areas. In order to solve this problem a computer based simulation of the process was created to optimize the workload of the Research Analysts. The ARENA Input Analyzer was used and it was determined that an Exponential distribution fit the inter-arrival time data the best. See below.
Inter-arrival Rate of Report Requests Distribution Summary Distribution: Exponential Expression: -0.5 + EXPO(1.23) Square Error: 0.021524 The 4 different types of reports each have their own processing times. I used Input Analyzer to fit the processing times and they were as follows (in hours):
• Blurb Report POIS(4.81) • Level 1 Report TRIA(16,30,42) • Level 2 Report TRIA(36,48,60) • Trustee Candidate Report TRIA(4,5.95,8.95)
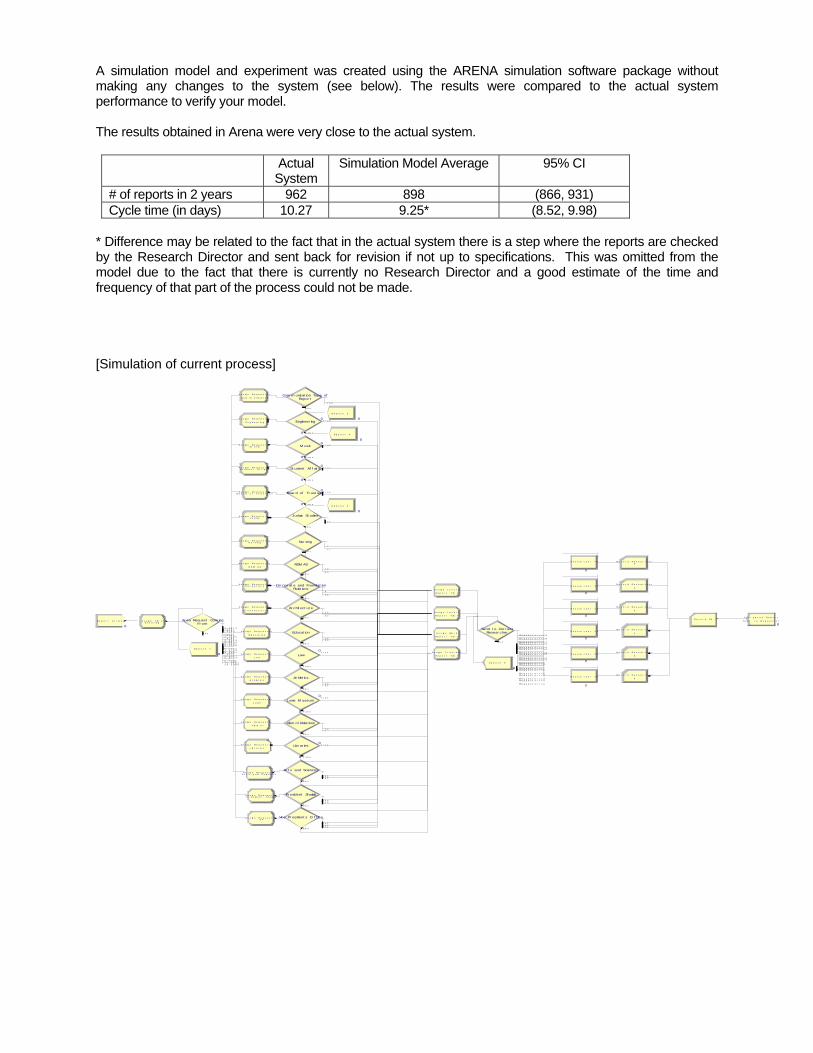
A simulation model and experiment was created using the ARENA simulation software package without making any changes to the system (see below). The results were compared to the actual system performance to verify your model. The results obtained in Arena were very close to the actual system.
Actual System
Simulation Model Average 95% CI
# of reports in 2 years 962 898 (866, 931) Cycle time (in days) 10.27 9.25* (8.52, 9.98)
* Difference may be related to the fact that in the actual system there is a step where the reports are checked by the Research Director and sent back for revision if not up to specifications. This was omitted from the model due to the fact that there is currently no Research Director and a good estimate of the time and frequency of that part of the process could not be made. [Simulation of current process]
R e p o r t A r r iv e s
Fr omAr ea Request Com ing
1 . 3 6 1 3. 3 1 4 1. 4 1 8 8
. 3 1 4 13 . 7 6 9 6. 3 1 4 12 . 9 3 1 92 . 0 9 4 25 . 0 2 6 23 . 3 5 0 8
5 . 1 3 0 91 . 6 7 5 43 . 2 4 6 1. 8 3 7 73 . 1 4 1 43 . 8 7 4 3
9 . 7 3 8 21 5 . 9 1 6 23 6 . 5 4 4 5
E ls e
Repor tCom m unicat ion Type of
1 0 0
E ls e
T r u e
F a ls e
Engineer ing
T r u e
F a ls e
M usic
T r u e
F a ls e
St udent Af f air s
Boar d of Tr ust eesT r u e
F a ls e
Judaic St udies
6 7
E ls e
Nur sing7
1 1E ls e
Relat ionsCor por at e and Foundat ion
6
3 8
E ls e
Ar chit ect ur e1 2
5 0E ls e
Educat ion
1 02 9
E ls e
LawT r u e
F a ls e
At hlet ics
2 33 2
E ls e
Lowe M useumT r u e
F a ls e
Alum ni Relat ions
7 07
E ls e
Libr ar ies T r u e
F a ls e
Ar t s and Sciences
3 54 5
E ls e
Pr esident Shalala
4 91 3
E ls e
Vice Pr esident s O f f ice
4 21 24 2
E ls e
C o m m u n ic a t io n
A s s ig n R e q u e s t o r
R e p o r t T im e
A s s ig n L e v e l 2
R e p o r t T im e
A s s ig n L e v e l 1
R e p o r t T im e
A s s ig n B lu r b
R e p o r t T im e
A s s ig n T r u s t e e s
E n g in e e r in g
A s s ig n R e q u e s t o r
M u s icA s s ig n R e q u e s t o r
S t u d e n t A f f a ir sA s s ig n R e q u e s t o r
B o a r d o f T r u s t e e sA s s ig n R e q u e s t o r
J u d a icA s s ig n R e q u e s t o r
R e s e a r c h e r # 1
Resear cherSend t o Cor r ect
R e q u e s t o r = = 1 9
R e q u e s t o r = = 1 8
R e q u e s t o r = = 1 7R e q u e s t o r = = 1 6
R e q u e s t o r = = 1 5R e q u e s t o r = = 1 4
R e q u e s t o r = = 1 3R e q u e s t o r = = 1 2
R e q u e s t o r = = 1 1R e q u e s t o r = = 1 0
R e q u e s t o r = = 9R e q u e s t o r = = 8
R e q u e s t o r = = 7R e q u e s t o r = = 6
R e q u e s t o r = = 5R e q u e s t o r = = 4
R e q u e s t o r = = 3R e q u e s t o r = = 2
R e q u e s t o r = = 1
E ls e
N u r s in gA s s ig n R e q u e s t o r
R S M A S
A s s ig n R e q u e s t o r
C o r p o r a t eA s s ig n R e q u e s t o r
A r c h it e c t u r e
A s s ig n R e q u e s t o r
RSM AS1 0
5 0E ls e
E d u c a t io n
A s s ig n R e q u e s t o r
L a w
A s s ig n R e q u e s t o r
A t h le t ic s
A s s ig n R e q u e s t o r
L o w e
A s s ig n R e q u e s t o r
A lu m n i
A s s ig n R e q u e s t o r
L ib r a r ie s
A s s ig n R e q u e s t o r
A r t s a n d S c ie n c e sA s s ig n R e q u e s t o r
P r e s id e n t S h a la laA s s ig n R e q u e s t o r
V PA s s ig n R e q u e s t o r
R e s e a r c h e r # 2
R e s e a r c h e r # 3
R e s e a r c h e r # 4
R e s e a r c h e r # 5
R e s e a r c h e r # 6
S e n t t o R e q u e s t o r
C o m p le t e d R e p o r t
D is p o s e 3
D is p o s e 4
D is p o s e 5
D is p o s e 6
E n t e r in gA s s ig n T im e
1R e c o r d R e s e a r c h e r
2
R e c o r d R e s e a r c h e r
3
R e c o r d R e s e a r c h e r
4
R e c o r d R e s e a r c h e r
5
R e c o r d R e s e a r c h e r
6
R e c o r d R e s e a r c h e r
D is p o s e 7
R e c o r d A ll
0
0
0
0
0
0
0
0
0
0
0
0
0
0
0
0
0
0
0
0
0
0
0
0
0
0
0

The different scenarios and modifications of the system that were experimented with were the following: 1. Alternative #1 – One additional Research Analyst was hired @ $40,000 per year and assigned to
help Research Analyst #1 with the reports for President Shalala, VPs and the Board of Trustees. This was due to the fact that the queue and cycle times were the highest for that area.
2. Alternative #2 – In this scenario Research Analyst #5 (the least busy) was re-assigned to help Research Analyst #1 with the reports for President Shalala, VPs and the Board of Trustees while his reports were re-assigned to Research Analyst #2 (he had the 2nd lowest utilization)
3. Alternative #3 – All Research Analysts work from a single queue and the first available Research Analyst works on the next report in the queue.
See the charts below for the results of the 95% confidence intervals of the following three performance measures after 15 replications of each alternative were run for 24 hours a day for 730 days (2 years):
1. Cycle time (in hours) 2. Average time report is in queue (in hours) 3. Utilization of Research Analysts.
Cycle Time (in hours) Comparison Between Current System and 3 Alternatives Current System Alternative #1 Alternative #2 Alternative #3 Avg Half
width 95% CI Avg Half
width 95% CI Avg Half
width 95% CI Avg Half
width 95% CI
Avg of all 65.99 5.81 (60.18,71.8) 32.96 .49 (32.47,33.45) 33.31 .53 (32.78,33.84) 27.12 .30 (26.82,27.42)Researcher 1 89.44 10.04 (79.4,99.48) - - - - - - - - Researcher 2 24.32 2.37 (21.95,26.69) 24.32 2.37 (21.95,26.69) 36.26 1.89 (34.37,38.15) - - - Researcher 3 42.15 1.24 (40.91,43.39) 42.15 1.24 (40.91,43.39) 42.15 1.24 (40.91,43.39) - - - Researcher 4 27.87 1.01 (26.86,28.88) 27.87 1.01 (26.86,28.88) 27.87 1.01 (26.86,28.88) - - - Researcher 5 41.57 1.73 (39.84,43.3) 41.57 1.73 (39.84,43.3) - - - - - - Researcher 6 37.56 2.06 (35.5,39.62) 37.56 2.06 (35.5,39.62) 37.57 2.06 (35.5,39.62) - - - Researcher 1&7 - - - 30.98 .86 (30.12,31.85) - - - - - - Only 1 queue - - - - - - - - - 27.12 .30 (26.82,27.42)Researcher 1&5 - - - - - - 30.98 .86 (30.12,31.85) - - -
Average Time in Queue/Report (in Hours) Comparison Between Current System and 3 Alternatives
Current System Alternative #1 Alternative #2 Alternative #3 Avg Half
width 95% CI Avg Half
width 95% CI Avg Half
width 95% CI Avg Half
width 95% CI
Researcher 1 65.43 10.15 (55.28, 75.58) - - - - - - - - - Researcher 2 1.80 1.05 (.75, 2.85) 1.80 1.05 (.75, 2.85) 5.96 1.62 (4.34,7.58) - - - Researcher 3 6.62 .65 (5.97, 7.27) 6.62 .65 (5.97, 7.27) 6.62 .65 (5.97, 7.27) - - - Researcher 4 3.99 .75 (3.24, 4.74) 3.99 .75 (3.24, 4.74) 3.99 .75 (3.24, 4.74) - - - Researcher 5 3.42 1.29 (2.13, 4.71) 3.42 1.29 (2.13, 4.71) - - - - - - Researcher 6 6.49 1.62 (4.87, 8.11) 6.49 1.62 (4.87, 8.11) 6.49 1.62 (4.87, 8.11) - - - Researcher 1&7 - - - 6.97 .83 (6.14,7.8) - - - - - - Only 1 queue - - - - - - - - - .32 .1 (.22,.42) Researcher 1&5 - - - - - - 6.97 .83 (6.14,7.8) - - -
Utilization of Research Analysts Time Comparison Between Current System and 3 Alternatives
Current System Alternative #1 Alternative #2 Alternative #3 Avg Half
width 95% CI Avg Half
width 95% CI Avg Half
width 95% CI Avg Half
width 95% CI
Researcher 1 .6938 .02 (.6738, .7138) - - - - - - - - - Researcher 2 .06 .01 (.05, .07) .06 .01 (.05, .07) .1631 .01 (.1531,.1731) - - - Researcher 3 .21 .02 (.19, .23) .21 .02 (.19, .23) .21 .02 (.19, .23) - - - Researcher 4 .12 .01 (.11, .13) .12 .01 (.11, .13) .12 .01 (.11, .13) - - - Researcher 5 .10 .01 (.09, .11) .10 .01 (.09, .11) - - - - - - Researcher 6 .19 .01 (.18, .20) .19 .01 (.18, .20) .19 .01 (.18, .20) - - - Researcher 1&7 - - - .35 .01 (.34,.36) - - - - - - Only 1 queue - - - - - - - - - .23 .01 (.22,.24) Researcher 1&5 - - - - - - .35 .01 (.34,.36) - - -
The different performance measures for all three alternatives in relation to the current system came out statistically significant, as none of the 95% confidence intervals of their means overlapped with the 95% confidence interval of the mean of the current system.

In regards to cycle time (in hours), the most important metric the results can be summarized as follows:
Current System (68.16, 79.84) 95% C.I.
Alternative #1 (32.47,33.45) 95% C.I.
Alternative #2 (32.78,33.84) 95% C.I.
Alternative #3 (26.82,27.42) 95% C.I.
Average time in queue for Shalala/VP reports can be summarized as follows: (note: all of the average times in queue can be found in the 2nd table above)
Current System
(55.28, 75.58) 95% C.I. Alternative #1
(6.14,7.8) 95% C.I. Alternative #2
(6.14,7.8) 95% C.I. Alternative #3
All in 1 queue (.22,.42) 95% C.I.
Clearly the 3rd Alternative appears to be the best as the 95% C.I. for its mean is the lowest and does not overlap any of the others. However this alternative would require all Research Analysts to work on all of the reports and use 1 queue. This would not be feasible due to the fact that Development Officers are used to working with their own Research Analysts and have developed strong working relationships with them. The results from Alternatives 1 and 2 appear to be fairly close and there is no statistical significance between them as the 95% C.I.s of their means overlap. Alternative #1 would require the Division of University Advancement to hire an additional Research Analyst at an annual salary of $40,000. The increase in performance does not appear to be enough to justify this expenditure. Therefore amongst Alternatives explored in this study Alternative #2 is the preferred solution.
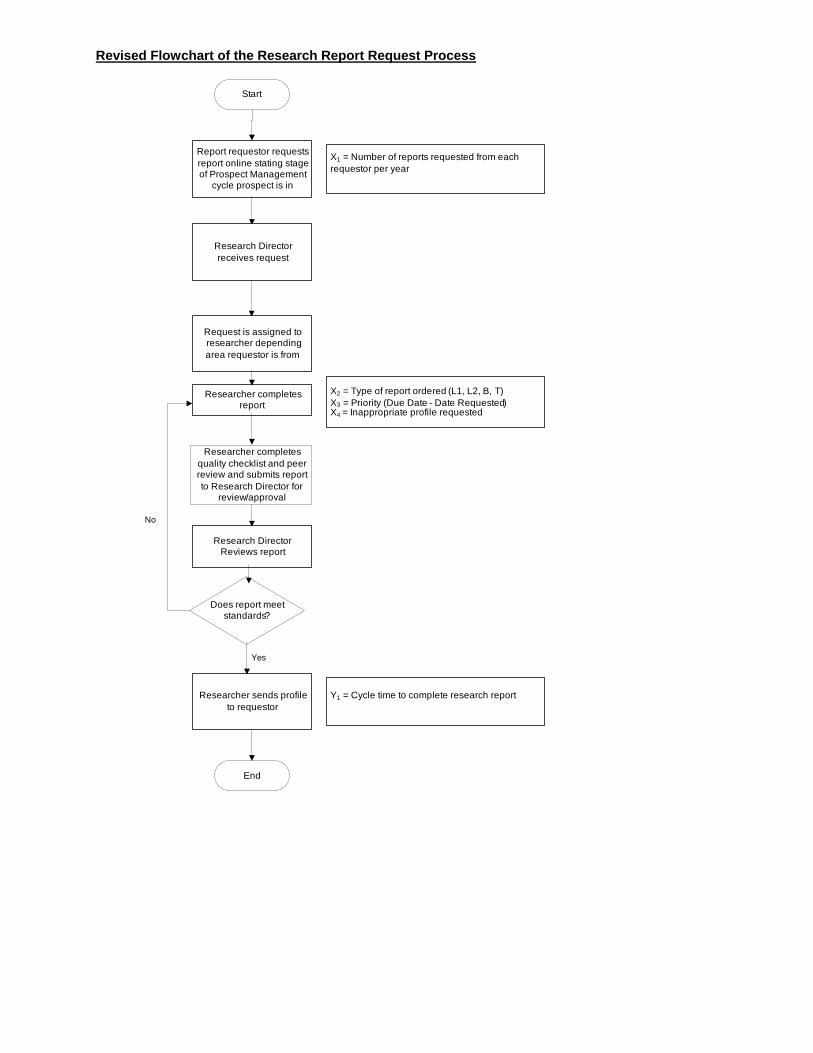
Revised Flowchart of the Research Report Request Process
Report requestor requests report online stating stage of Prospect Management
cycle prospect is in
Start
Request is assigned to researcher depending area requestor is from
Researcher completes report
End
Research Director receives request
X2 = Type of report ordered (L1, L2, B, T) X3 = Priority (Due Date - Date Requested)X4 = Inappropriate profile requested
Researcher sends profile to requestor
Y1 = Cycle time to complete research report
X1 = Number of reports requested from each requestor per year
Research Director Reviews report
Does report meet standards?
Yes
No
Researcher completes quality checklist and peer review and submits report to Research Director for
review/approval
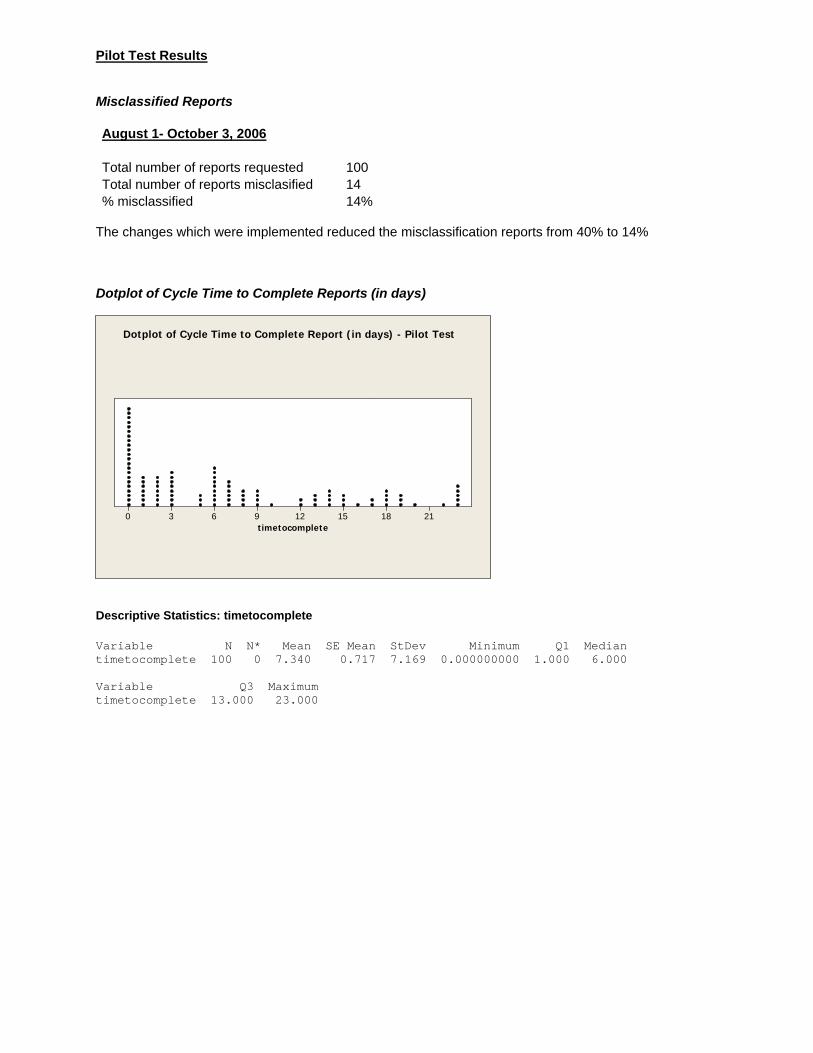
Pilot Test Results Misclassified Reports August 1- October 3, 2006 Total number of reports requested 100 Total number of reports misclasified 14 % misclassified 14%
The changes which were implemented reduced the misclassification reports from 40% to 14% Dotplot of Cycle Time to Complete Reports (in days)
timetocomplete211815129630
Dotplot of Cycle Time to Complete Report (in days) - Pilot Test
Descriptive Statistics: timetocomplete Variable N N* Mean SE Mean StDev Minimum Q1 Median timetocomplete 100 0 7.340 0.717 7.169 0.000000000 1.000 6.000 Variable Q3 Maximum timetocomplete 13.000 23.000
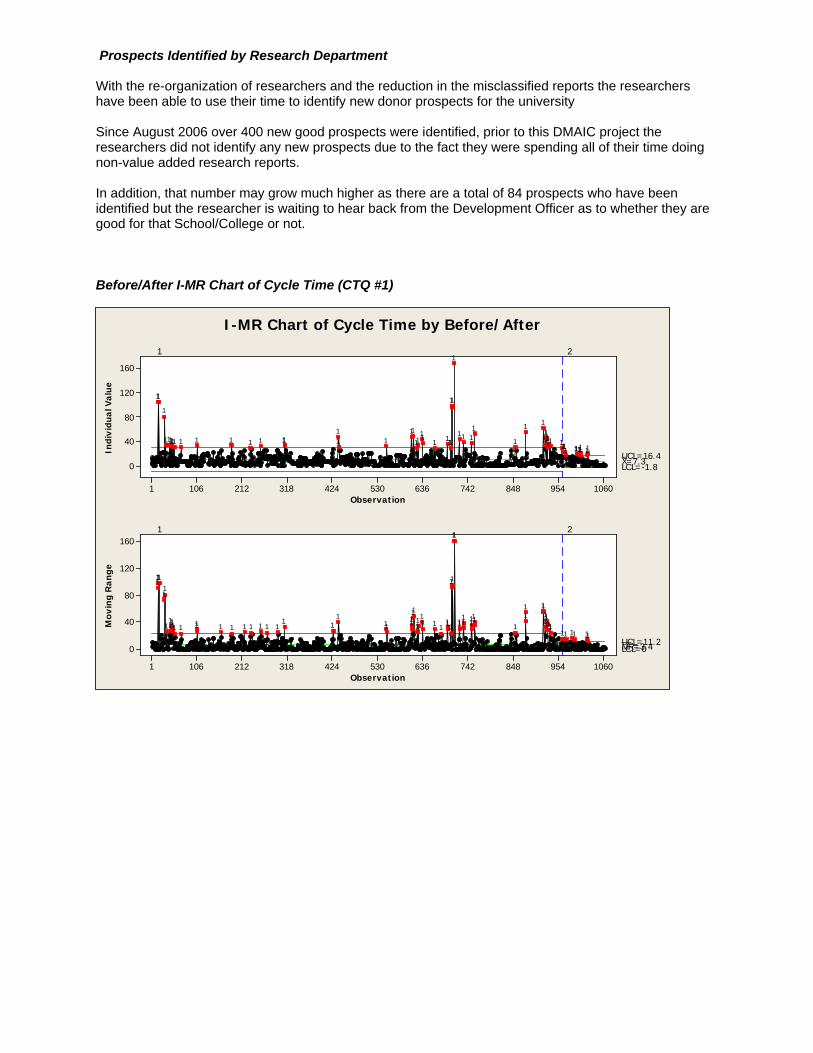
Prospects Identified by Research Department With the re-organization of researchers and the reduction in the misclassified reports the researchers have been able to use their time to identify new donor prospects for the university Since August 2006 over 400 new good prospects were identified, prior to this DMAIC project the researchers did not identify any new prospects due to the fact they were spending all of their time doing non-value added research reports. In addition, that number may grow much higher as there are a total of 84 prospects who have been identified but the researcher is waiting to hear back from the Development Officer as to whether they are good for that School/College or not. Before/After I-MR Chart of Cycle Time (CTQ #1)
Observation
Indi
vid
ual V
alu
e
10609548487426365304243182121061
160
120
80
40
0_X=7.3UCL=16.4LCL=-1.8
1 2
Observation
Mov
ing
Ra
nge
10609548487426365304243182121061
160
120
80
40
0__MR=3.4UCL=11.2LCL=0
1 2
1111111111111111111111
111
11
1
1111
1
11
11111111
1111
111111111111111
1
11
1111111111
1111
1111
11111
1111
11
11
1111
11111
11
111111
111
1111111111111111
1
11
1111
I-MR Chart of Cycle Time by Before/After
Observation
Indi
vid
ua
l Va
lue
1009080706050403020101
20
15
10
5
0
_X=7.34
UCL=16.45
LCL=-1.77
Observation
Mov
ing
Ra
nge
1009080706050403020101
16
12
8
4
0
__MR=3.42
UCL=11.19
LCL=0
1
1
1
1111111
1
11111
1
11
1
11
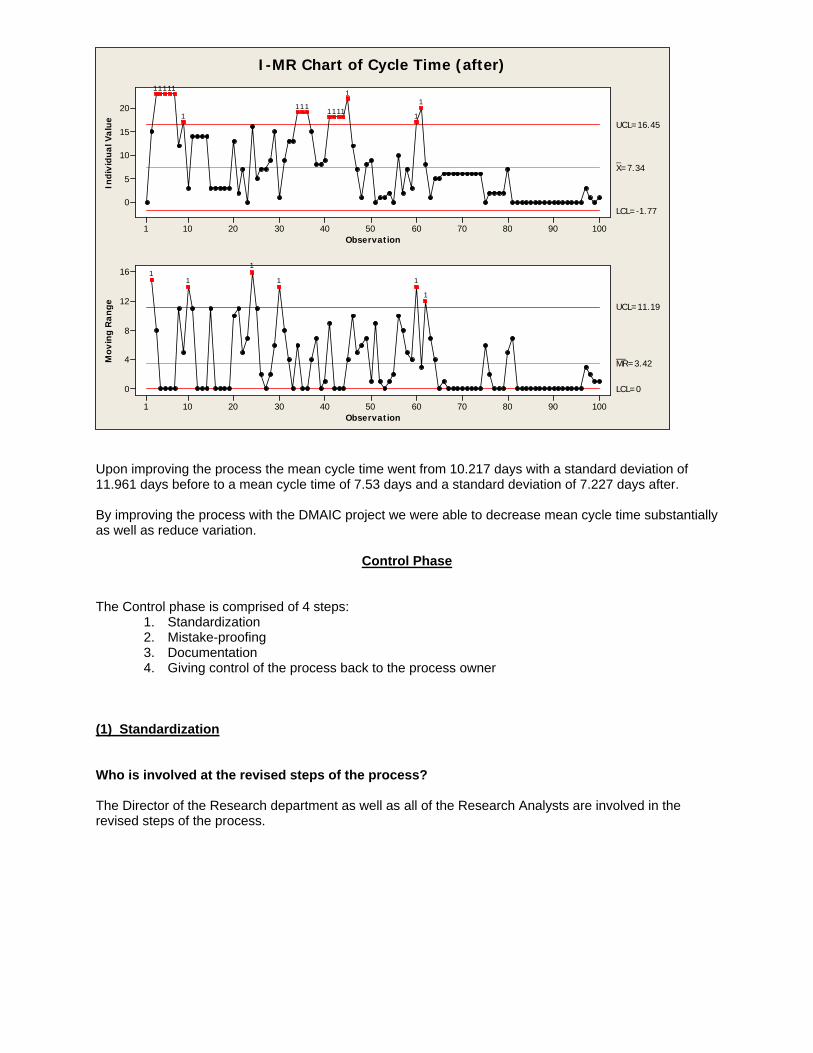
I-MR Chart of Cycle Time (after)
Upon improving the process the mean cycle time went from 10.217 days with a standard deviation of 11.961 days before to a mean cycle time of 7.53 days and a standard deviation of 7.227 days after. By improving the process with the DMAIC project we were able to decrease mean cycle time substantially as well as reduce variation.
Control Phase
The Control phase is comprised of 4 steps: 1. Standardization 2. Mistake-proofing 3. Documentation 4. Giving control of the process back to the process owner
(1) Standardization Who is involved at the revised steps of the process? The Director of the Research department as well as all of the Research Analysts are involved in the revised steps of the process.
What should they be doing after standardization of the revised standard operating procedures? Upon receiving a research request they should do the following:
1. Look up the prospect in the system to make sure the report requestor specified the correct prospect management status on the online report request form.
2. If the prospect management status on the request form does NOT match the prospect management status in the system the research analyst should call the requestor and get them to update it in the system.
3. If there is anything on the request that is unclear the research analyst should call the requestor for clarification.
4. The Research Analyst should log the report request in the Project Log database and make sure to enter all of the normal information as well as the new fields which were added (prospect management cycle stage)
5. After completing the report the researcher should complete the Research Report Quality Checklist and have another Research Analyst perform a peer review to ensure quality.
6. After sending the report to the requestor the Research Analyst should close out the project in the Project Log database and make sure to enter in the completed date as well as the new fields which were added in this project (peer review completed (Y/N), checklist completed (Y/N)
With the time saved from this project Research Analysts will have more time to identify new prospects for the Development Officers. It is important that these new prospects are tracked in order to:
(a) give the Research Analysts the credit they deserve in regards to helping bring in new donations
(b) help keep track of the hard benefits of this DMAIC project In order to be able to track these new prospects, Research Analysts will be asked to do the following:
1. Go into the new Prospect Identification database and set the Research Status on prospects they are researching as potential donors to the letter ‘R’, also enter the date, the research analysts name and the area the prospect is being identified for (School/College). 2. After identifying that prospect as a possible good donor their name is sent to their respective
Development Officer. If the Development Officer confirms the prospect is a good one change the Research Status to ‘I’, if the prospect is not good for that School/College set the Research Status to ‘NR’, if the prospect is not a good prospect for UM at all set the Research Status to ‘N’.
Why should they follow the revised standard operating procedures? There are a few reasons they should follow the revised standard operating procedures: 1. To prevent misclassifications of report requests. 2. To ensure reports are sent out with the highest quality. 3. To allow proper tracking of newly identified prospects. 4. To ensure Development Officers are entering prospect management information into the system. 5. To ensure the Report Requestor gets exactly what they need. 6. To be able to ensure the Research Department gets the credit they deserve for helping bring in donations. Where/when should they be doing the revised process procedures? The revised process procedures should be done throughout the Research Report Request Process. Documentation will be given to the Research staff to tell them exactly where/when they should be doing the revised process procedures. How much will it cost to do the revised process procedures? There will be no cost to do the revised process, everything is being done in-house.

Is additional training needed to perform the revised process procedures? Yes, additional training will be conducted for the Research staff as well as those who submit Research Report Requests. How often should the revised process procedures be monitored? The revised process procedures will be monitored monthly. Who will monitor the revised process procedures? The Research Director as well all Research Analysts will be trained on monitoring the revised process procedures. The Research Analysts will be trained in order to help foster intrinsic motivation on their part so that they feel like they are part of the improvements that are taking place. Who will make decisions on the future outputs of the revised process procedures? The Research Director will make decisions on the future outputs of the revised process procedures.
(2) Mistake-proofing Potential risk elements were identified that could be carried through the process by using failure mode effects analysis (FMEA). These risk elements are: 1. Requestor enters wrong Prospect Management status on Report Request form. 2. Research Analyst neglects to conduct peer review/use quality checklist. 3. Researcher neglects to change Research Status for newly identified prospects. Failure Mode Effects Analysis (FMEA) Risk Elements
Failure Mode
Likelihood of Occurrence
Severity Likelihood of Detection
RPN Action Likelihood of Occurrence
Severity Likelihood of detection
RPN
Requestor enters wrong PM status on request
Possible misclass. of report
9 7 7 441 Look up prospect in system. Call requestor for clarification
7 4 7 196
Researcher neglects to conduct peer review/use checklist
Lower quality reports. More time by Director proofing reports
8 7 6 252 Create weekly exceptions reports for Director for monitoring purposes
6 2 6 72
Researcher neglects to change Research Status for newly identified prospects
Research does not get the credit it deserves for Prospect Ids
9 2 7 126 Create weekly exception reports for Director for monitoring purposes
5 2 7 70

Requestor enters wrong Prospect Management status on Report Request form. Upon receiving online report requests the Research Analyst will look up the prospect in the database to ensure that the correct Prospect Management status was entered. If they do not match the Research Analyst will call the Research Requestor for clarification. Research Analyst neglects to conduct peer review/use quality checklist. Weekly exceptions reports will be created for the Director to monitor peer reviews and use of the quality checklist for reports rendered that week. Researcher neglects to change Research Status for newly identified prospects. Weekly exception reports will be created for newly identified prospects whose status is ‘R’ (being reviewed) to remind them to call their Development Officers to see if the prospects they have identified are good or not.
(3) Documentation
Training Documentation for Researchers and Requestors of Research
The revised Research Request process is as follows: The report requestor will specify the current prospect management status (amongst other information) on the online report request in order to receive the correct report.
Prospect Management Status Type of Report Given Qualify Blurb
Cultivate Level 1 Solicit Level 2
It is very important that the Requestors of Research realize the importance of specifying the correct prospect management status on the online report request form in order that the Research Analyst performs the correct research. The Research Director or Senior Research Analyst will assign the incoming research requests to Research Analysts depending on who the requestor is. With the revised process there are currently 2 Research Analysts assigned to President Shalala and the Office of the Vice-President for University Development and 4 Research Analysts distributed evenly among the Schools and Colleges.
Research Requests Procedures Upon receiving the Research Request the Research Analyst should do the following:
7. Look up the prospect in the system to make sure the report requestor specified the correct prospect management status on the online report request form.
8. If the prospect management status on the request form does NOT match the prospect management status in the system the research analyst should call the requestor and get them to update it in the system.
9. If there is anything on the request that is unclear the research analyst should call the requestor for clarification.
10. The Research Analyst should log the report request in the Project Log database and make sure to enter all of the normal information as well as the new fields which were added (prospect management cycle stage)
11. After completing the report the researcher should complete the Research Report Quality Checklist and have another Research Analyst perform a peer review to ensure quality.
12. After sending the report to the requestor the Research Analyst should close out the project in the Project Log database and make sure to enter in the completed date as well as the new fields which were added in this project (peer review completed (Y/N), checklist completed (Y/N).
Prospect Identification Procedures When working on prospect identification Research Analysts should do the following:
1. Go into the new Prospect Identification database and set the Research Status on prospects they are researching as potential donors to the letter ‘R’, also enter the date, the research analysts name and the area the prospect is being identified for (School/College).
2. After identifying that prospect as a possible good donor their name is sent to their respective
Development Officer. If the Development Officer confirms the prospect is a good one change the Research Status to ‘I’, if the prospect is not good for that School/College set the Research Status to ‘NR’, if the prospect is not a good prospect for UM at all set the Research Status to ‘N’.
(4) Giving control of the process back to the process owner This concludes the project. This process will now be turned over to the process owner with control plans for future PDSA cycles.