Embed Size (px)
Citation preview

1 | WWW.BENTLEY.COM | © 2016 Bentley Systems, Incorporated © 2016 Bentley Systems, Incorporated
© 2016 Bentley Systems, Incorporated
Improving efficiency of water utilities: practical examples
Slavco Velickov, PhD - Water Industry Director EMEA
Geospatial Forum, Rotterdam, 23-26 May 2016

2 | WWW.BENTLEY.COM | © 2016 Bentley Systems, Incorporated
Agenda
1.Bentley at a glance
2.Business drivers (trends) in the Water Industry
3.Water solutions overview
4.Improving efficiency, examples: 1. Active Leakage Management
(finding leakage hot-spots)
2. Geospatially enabled Asset Management (leakage and break records analysis)
3. Pumping scheduling and pressure optimization (saving water and energy)
5.Take away message
6.Contact information

3 | WWW.BENTLEY.COM | © 2016 Bentley Systems, Incorporated
3
Improving Quality of Life

4 | WWW.BENTLEY.COM | © 2016 Bentley Systems, Incorporated © 2016 Bentley Systems, Incorporated
Water and Wastewater Business Drivers

5 | WWW.BENTLEY.COM | © 2016 Bentley Systems, Incorporated
Water Utilities Drivers
• Leakage Reductions
• Energy Efficiency
• Pressure Control
• Water Safety (Quality)
• Pipe Renewal Planning
• Master Planning
• Real-time Operations
• Emergency Response
• Staff Capacity Development and Resources

6 | WWW.BENTLEY.COM | © 2016 Bentley Systems, Incorporated
Wastewater / Stormwater
• Similar Drivers as for Clean Water
– Prevent CSO / SSO with Models
– Master Planning
– Water Quality Analysis
– Efficiency & Skills
• Inspection/Condition Assessment
• Implement BIM / ISO 55000
• WWT Plant Operation and Efficiency

7 | WWW.BENTLEY.COM | © 2016 Bentley Systems, Incorporated
Everyone’s Drivers
Save Water, Money, Time, Energy, Environment

8 | WWW.BENTLEY.COM | © 2016 Bentley Systems, Incorporated © 2016 Bentley Systems, Incorporated
Bentley Water Solutions: Addressing the Life Cycle of the Infrastructure
Design and
Estimate
Information Management
Asset Recording
Scheduled and
Unscheduled Maintenance
Operations and
Emergency Response
Planning and
Analysis
Water &
Wastewater
Construction
Engineering Approval
Identify Repair, Replace, Expansion

9 | WWW.BENTLEY.COM | © 2016 Bentley Systems, Incorporated
Water Industry Solutions Offerings
Bentley
Map / Mobile
Bentley Open
Utilities
MicroStation
GeoSpatial Server, ProjectWise & eB
Interoperability
Connectors Enterprise
Connectors
Web Publishing
Spatial
Documents
Spatial
Databases
Business
Documents
Proprietary
GIS Databases
Enterprise
Data Stores
Ancillary Files
w/ RDBWS
Bentley
AssetWise
(Amulet) sisHyd
(GasAnalysis
)
Hammer StormCAD /
HEC-Pack
Web
Services Data Files
Data Files
w/ Database Linkages
SewerGEMS/ CAD
WaterGEMS /
CAD
CivilStorm /
PondPack
Industry Framework Modeling & Analysis Framework
AutoCAD ArcGIS
SCADA &
Loggers
Modelling / analytical products
Web
clients
Water / WW GIS & AM

10 | WWW.BENTLEY.COM | © 2016 Bentley Systems, Incorporated
WaterGEMS. Water distribution modeling with geospatial integration
WaterCAD. Water distribution modeling and design
Darwin Designer. Network design automation
Darwin Calibrator. Model calibration optimization
Darwin Scheduler. Energy efficiency optimizer
Pipe Renewal Planner. Asset investment planning tool
HAMMER. Transient flow analysis and modeling
SCADAConnect. Supervisory and control data integration
SewerGEMS. Urban sewer modeling with GIS integration
SewerCAD. Sanitary sewer design and modeling
CivilStorm. Stormwater management and dynamic modeling
StormCAD. Storm sewer design and modeling
PondPack. Detention pond design and analysis
HEC-Pack. River basin modeling, reservoir optimization
CulvertMaster. Culvert design and analysis
FlowMaster. Hydraulics calculator
WATER
SEWER
STORM (flood)
Amulet. Real-time forecasts and dashboards platform
WaterObjects. .Net development environment
Mohid. 2D / 3D Catchment and costal modelling solution
Other…
30 years
130,000 users
170 countries
Acquired by Bentley in 2004
Bentley Haestad Product Line

11 | WWW.BENTLEY.COM | © 2016 Bentley Systems, Incorporated 11 | WWW.BENTLEY.COM | © 2016 Bentley Systems, Incorporated
Bentley Reality Modelling for Water Industry
ContexCapture Photos to 3D models | Buildings, Plants Ground Infrastructure (asset conditions)
LumenRT Visualize and Communicate | Infrastructure Models, Designs, Model Results

12 | WWW.BENTLEY.COM | © 2016 Bentley Systems, Incorporated
Example: Paris 500 km of sewers mains
Model and refresh a sewer
infrastructure (500km long)
including pipes, cables and other
equipment
REQUIREMENT
Multi-directional camera system
(like Trimble v10) + specific
lighting system +
Smart3DCapture Ultimate
SOLUTION
Photorealistic 3D model, helping
users to detect and extract structure
components from the mesh and
point cloud
RESULT

13 | WWW.BENTLEY.COM | © 2016 Bentley Systems, Incorporated
1) Water Loss
Leakage Reduction by pressure management,
hydraulic modelling, measured data and
optimization techniques

14 | WWW.BENTLEY.COM | © 2016 Bentley Systems, Incorporated
Remediating Water Loss is Complex
• It’s impossible to find and fix all leaks (economic level of leakage)
• Partial implementation of a water loss plan is highly likely to fail
• Coordination between all components of a water loss program is required
14
(Courtesy Dr. Thomas Walski)
“ Many practitioners make common
mistakes- they may have the false impression that each time a leak is repaired, physical loss is reduced by the volume saved…”
Vermersch and Rizzo
Source: IWA’s Water21 Magazine, April 2014

15 | WWW.BENTLEY.COM | © 2016 Bentley Systems, Incorporated
Strategy: A Long-term Approach with Immediate [short-term] Benefits
Implement IWA best / good practices
15
Current Annual
Real Loss Volume
Economic
Level Real Loss
Unavoidable
Real Loss
Replacing pipes with
least impact on
customers
Speed and Quality
of Repairs
Detecting and fixing leaks
Replacing/installing meters
(DMAs)
Active
Leakage Control
Pre
ssu
re
Ma
na
ge
me
nt
Risk-based asset management for
maximum return Infr
astr
uctu
re
Ma
na
ge
me
nt

16 | WWW.BENTLEY.COM | © 2016 Bentley Systems, Incorporated
Current Practice
1. Assessment water balance or water auditing based upon water
infrastructures’ physical data and some statistics
2. Pressure Management Divide the network in Pressure Zones and DMAs
(how detailed)
Use hydraulic model for PRVs including pumps optimisation
Install PRVs to manage MNF
3. Active Leakage Detection Sounding for leaks
Step-testing
Acoustic loggers (noise correlators)
Smart balls
Use hydraulic model and measured (Scada) data
17 | WWW.BENTLEY.COM | © 2016 Bentley Systems, Incorporated
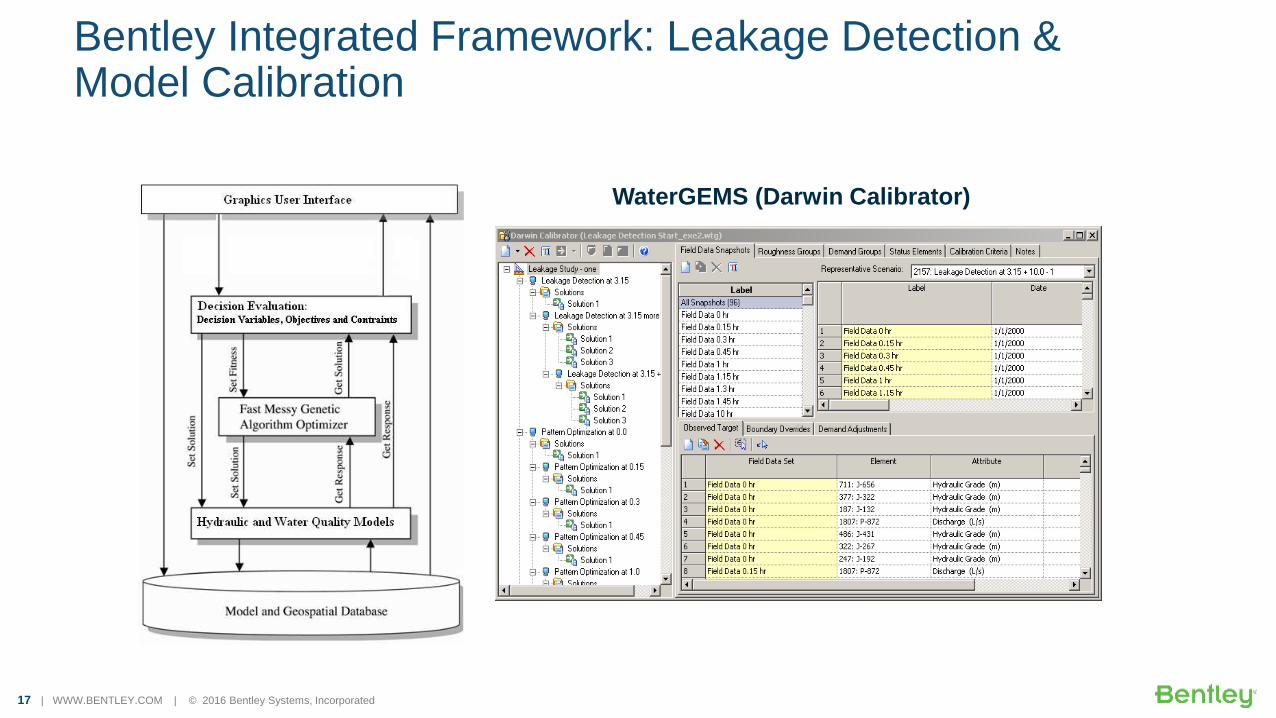
Bentley Integrated Framework: Leakage Detection & Model Calibration
WaterGEMS (Darwin Calibrator)
17

18 | WWW.BENTLEY.COM | © 2016 Bentley Systems, Incorporated
Example Case: system conditions
• DMA system model owned by UUW
• 20 km pipelines
• 400 properties
• 5 pressure loggers and one flow meter
18

19 | WWW.BENTLEY.COM | © 2016 Bentley Systems, Incorporated
Example: previously detected pipe bursts
Burst A
aA Burst B
aA
KEY
DMA Boundary
Leak located
Posi-tect
prediction <50m Distance
from
prediction
150mm
Ductile
Iron
Mains
Material
BURST A
150m Distance
from
prediction
8” Cast
Iron
Mains
Material
BURST B
19 | WWW.BENTLEY.COM
19

20 | WWW.BENTLEY.COM | © 2016 Bentley Systems, Incorporated
Example Case: results comparison (sensitivity)
Burst A & B
20 | WWW.BENTLEY.COM
20

21 | WWW.BENTLEY.COM | © 2016 Bentley Systems, Incorporated
Example Case : ROI savings
30m3/hr reduction
Burst A
Burst B Saving > 210,000 Euro / year
21 | WWW.BENTLEY.COM
21
22 | WWW.BENTLEY.COM | © 2016 Bentley Systems, Incorporated
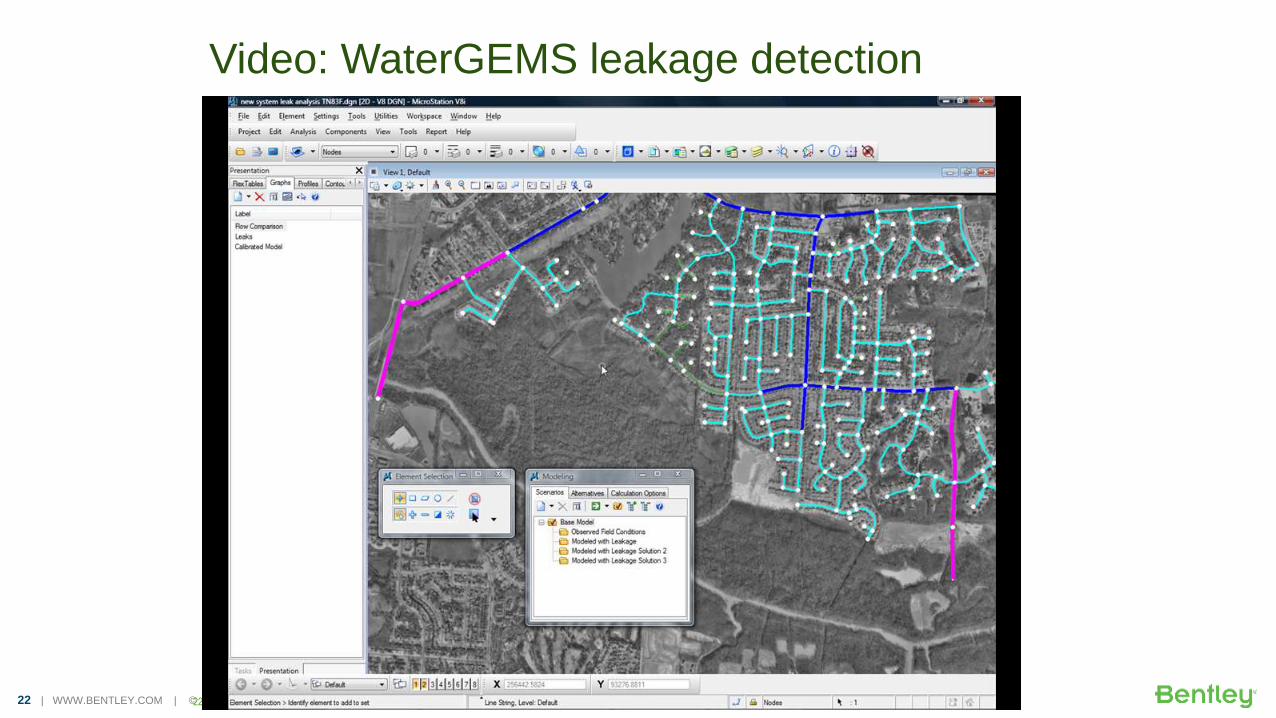
Video: WaterGEMS leakage detection
22 | WWW.BENTLEY.COM

23 | WWW.BENTLEY.COM | © 2016 Bentley Systems, Incorporated
2) Capital Investment Planning (pipe renewals)
Water Mains Asset Management -
leakage and break records geospatial risk analysis

24 | WWW.BENTLEY.COM | © 2016 Bentley Systems, Incorporated
Manage records, Report, Visualize,
Schedule
AssetWise (eB) /
GWP
Asset Inventory/Leak
History
Bentley Open Utilties
Prioritize
Bentley WaterGEMS
Cost Estimate
Bentley OU Expert Designer
Example: Pipe Assets Renewal Planning
1
2
3
4
25 | WWW.BENTLEY.COM | © 2016 Bentley Systems, Incorporated
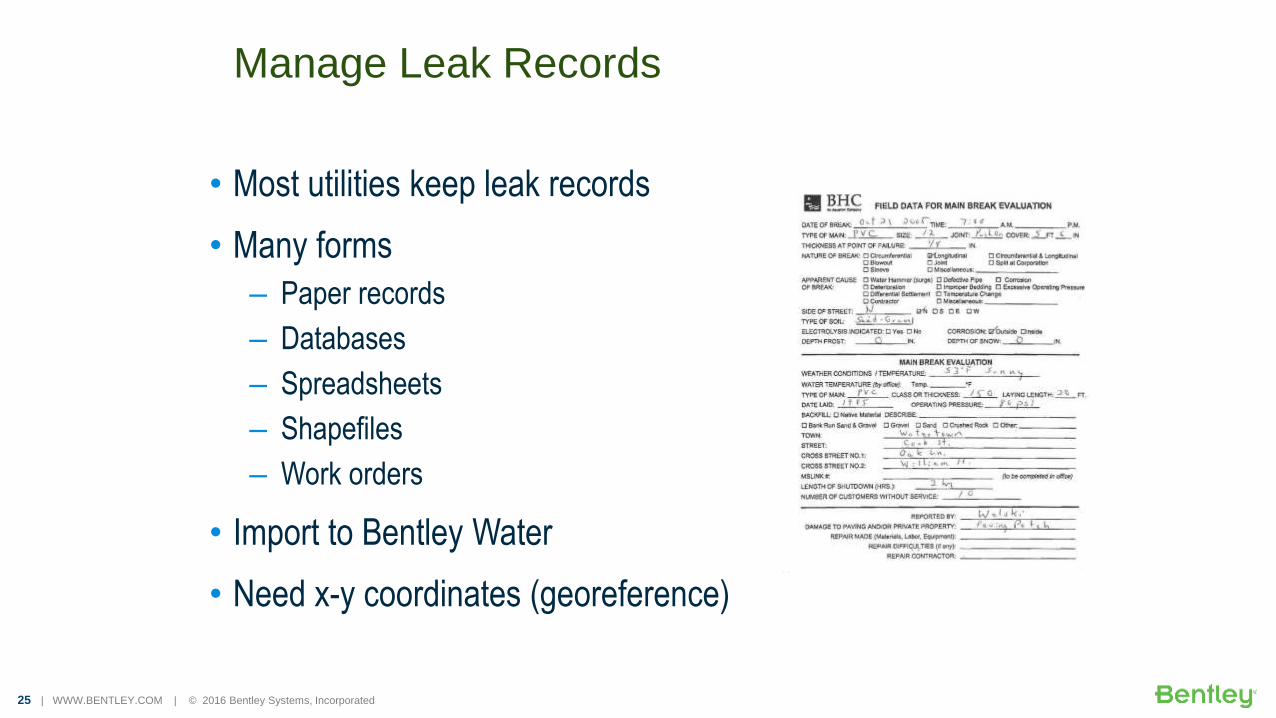
Manage Leak Records
• Most utilities keep leak records
• Many forms
– Paper records
– Databases
– Spreadsheets
– Shapefiles
– Work orders
• Import to Bentley Water
• Need x-y coordinates (georeference)
25

26 | WWW.BENTLEY.COM | © 2016 Bentley Systems, Incorporated
Spatially View Leak Locations 26

27 | WWW.BENTLEY.COM | © 2016 Bentley Systems, Incorporated
Cluster Thematically Bad Pipes 27

28 | WWW.BENTLEY.COM | © 2016 Bentley Systems, Incorporated
Analyze Patterns
Diameter,
in.
Breaks Break Rate,
break/yr/km
6 25 0.105
8 15 0.082
12 8 0.062
16 2 0.041
24 3 0.056

29 | WWW.BENTLEY.COM | © 2016 Bentley Systems, Incorporated
Look for Relationships
Circumferential
breaks
Longitudinal
breaks
Corrosion
holes
Cast Iron 73 7 4
Ductile
iron
12 2 5
PVC 23 17 0
Steel 2 1 12

30 | WWW.BENTLEY.COM | © 2016 Bentley Systems, Incorporated
Thematic Maps & Reports

31 | WWW.BENTLEY.COM | © 2016 Bentley Systems, Incorporated
WaterGEMS: Pipe Renewal Planner Tool workflow

32 | WWW.BENTLEY.COM | © 2016 Bentley Systems, Incorporated
Pipe Renewal Planner Results 32

33 | WWW.BENTLEY.COM | © 2016 Bentley Systems, Incorporated
Risk Map: Prioritization of Pipe Replacements

34 | WWW.BENTLEY.COM | © 2016 Bentley Systems, Incorporated 34 | WWW.BENTLEY.COM | © 2016 Bentley Systems, Incorporated
eB – Report, Visualize, Schedule Renewals
• Customizable Dashboard
• None Technical Presentation
• Easy to read, easy to use
• Integrated Spatial Map
• Integrate with Enterprise Workflows
• Visualize and Approve

35 | WWW.BENTLEY.COM | © 2016 Bentley Systems, Incorporated
Or Publish with Geo Web Publisher (mobile as well)
36 | WWW.BENTLEY.COM | © 2016 Bentley Systems, Incorporated
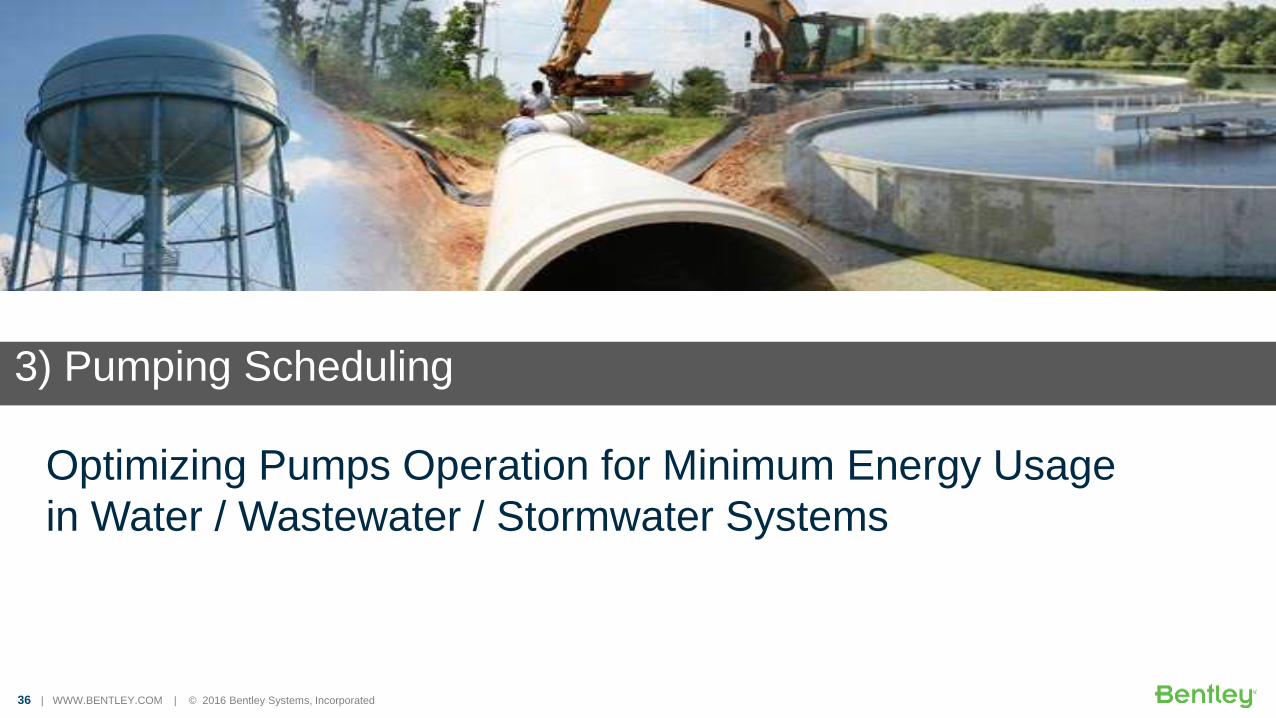
3) Pumping Scheduling
Optimizing Pumps Operation for Minimum Energy Usage
in Water / Wastewater / Stormwater Systems
37 | WWW.BENTLEY.COM | © 2016 Bentley Systems, Incorporated
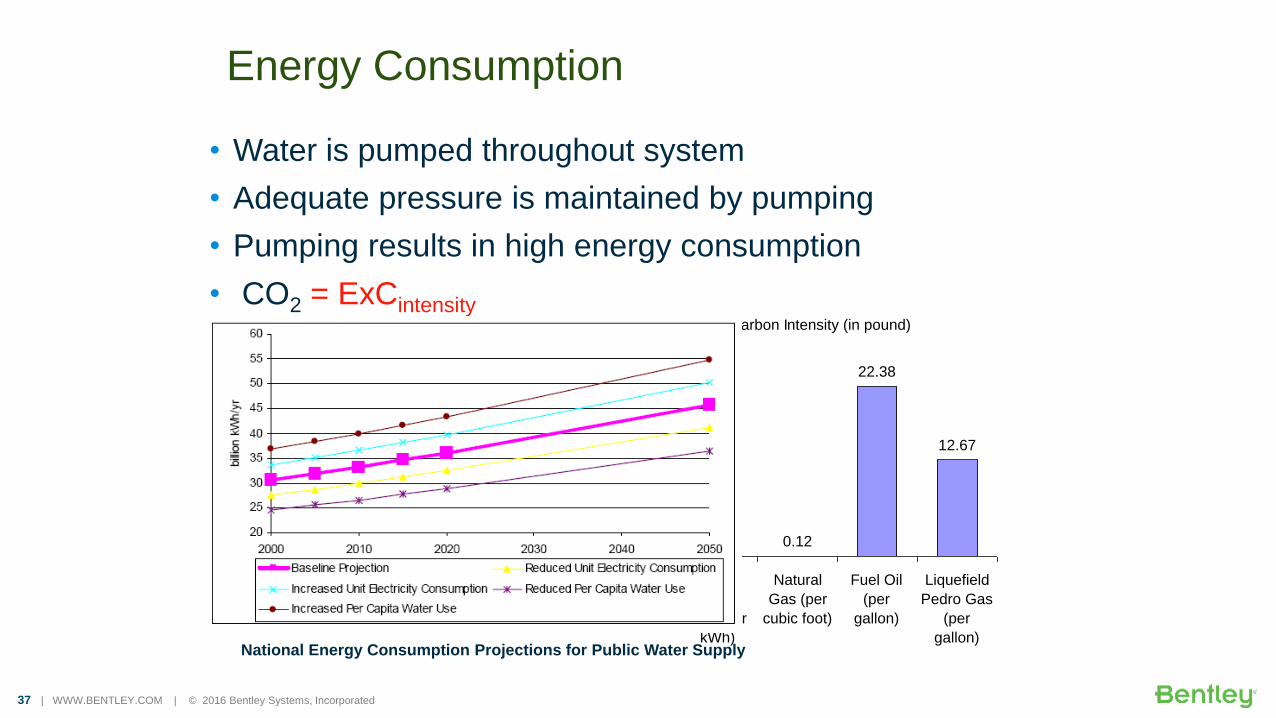
Energy Consumption
• Water is pumped throughout system
• Adequate pressure is maintained by pumping
• Pumping results in high energy consumption
• CO2 = ExCintensity Carbon Intensity (in pound)
1.360.12
22.38
12.67
0
5
10
15
20
25
U.S.
Electric
Grid (per
kWh)
Natural
Gas (per
cubic foot)
Fuel Oil
(per
gallon)
Liquefield
Pedro Gas
(per
gallon)National Energy Consumption Projections for Public Water Supply

38 | WWW.BENTLEY.COM | © 2016 Bentley Systems, Incorporated
Which pump is wasting energy?

39 | WWW.BENTLEY.COM | © 2016 Bentley Systems, Incorporated
39
Wire Power In Brake (Motor) Power
Water
Power
Added
Pump Efficiency = Water Power/Motor Power
Overall (wire-to-water) Efficiency = Water Power/Input Power

40 | WWW.BENTLEY.COM | © 2016 Bentley Systems, Incorporated
40
Water Power (hp) = Q * h * S / efficiency
Wire-to-Water Efficiency = Pump x Motor x Drive Efficiency
Pump Power and Efficiency

41 | WWW.BENTLEY.COM | © 2016 Bentley Systems, Incorporated
Reduce Energy by Optimal Pump Scheduling
• What to schedule Which pump is on duty
When pump is on duty
What speed is on duty
Which Tanks to utilise
• Goal Minimize energy consumption
Minimize total energy cost
• Supply requirements Water demand and hydraulics
Manage pressure constrains (water loss)
Deliver water quality

42 | WWW.BENTLEY.COM | © 2016 Bentley Systems, Incorporated
Formulation (mathematical optimization)
• Search for:
• Minimize:
• Subject to:
Where hi,t is the target hydraulic head of pump station i at time t vj,t is the flow veolcity of pipe j at time t ωp is the relative speed factor for pump p, Nps is the number of pump stations, Cp is the energy cost of pump p, Np is the number of pumps, C is the total energy cost of the pumps, hmin and hmax are the minimum required and maximum allowed hydraulic head, vmin and vmax are the minimum required and maximum allowed flow velocities
TtNihH psti ,...,1,,...,2,1,
pN
p
pCC1
max,min hhh ti
max,min vvv tj
maxmin p

43 | WWW.BENTLEY.COM | © 2016 Bentley Systems, Incorporated
Energy Cost Analysis Tool

44 | WWW.BENTLEY.COM | © 2016 Bentley Systems, Incorporated
Darwin Scheduler

45 | WWW.BENTLEY.COM | © 2016 Bentley Systems, Incorporated
Case Study (Water Utility in UK)
• DMZ system
• 57 Ml/day
• 11 pump stations and 9 tanks
• Energy cost: £330K/year
• Recorded daily energy cost: £912
• Modeled daily energy cost: £923

46 | WWW.BENTLEY.COM | © 2016 Bentley Systems, Incorporated
Electricity Tariff Pattern
0
0.2
0.4
0.6
0.8
1
1.2
0:0
0
1:0
0
2:0
0
3:0
0
4:0
0
5:0
0
6:0
0
7:0
0
8:0
0
9:0
0
10
:00
11
:00
12
:00
13
:00
14
:00
15
:00
16
:00
17
:00
18
:00
19
:00
20
:00
21
:00
22
:00
23
:00
0:0
0
Time
Pric
e P
att
ern
Fa
cto
r

47 | WWW.BENTLEY.COM | © 2016 Bentley Systems, Incorporated
Pump Scheduling Optimization
Rule 100
IF SYSTEM CLOCKTIME <= 8:00 AM
OR SYSTEM CLOCKTIME >= 10:00 PM
AND TANK BUTa2 LEVEL BELOW 5.73
THEN PUMP PILWTH STATUS IS OPEN
ELSE PUMP PILWTH STATUS IS CLOSED
• Optimization criteria – One hour control interval
– Tank minimum level is set to 20% of depth
– Tank maximum level is set to 90% of depth
– Meet minimum pressure requirements at PRVs and critical points
• Results converted to control rules, e.g.

48 | WWW.BENTLEY.COM | © 2016 Bentley Systems, Incorporated
Energy Cost Comparison
Pump Existing controls Optimized controls
ID
Pump utilization
(%) Daily cost (£) Pump utilization (%) Daily cost (£)
X2420052_ 100 181.99 100 181.73
X2420014_ 40 142.11 41 120.51
X2420075_ 42 201.95 37 141.19
X2410361_ 50 31.99 42 22.65
X2419963_ 50 31.99 42 22.65
X241998C_ 26 7.92 31 5.18
X2450024_ 40 37.35 21 13.87
PILWTH 82 236.19 40 98.33
NEWMRKT 23 111.63 22 88.98
Total cost(£) 983.12 695.10
• Immediate saving is 100,000 £ (29% of original energy cost)
• By optimizing pumping hours and better supply
from storage sources

49 | WWW.BENTLEY.COM | © 2016 Bentley Systems, Incorporated
Optimized Pump Controls
Pressure points and Tank levels
Pump flows
and controls
50 | WWW.BENTLEY.COM | © 2016 Bentley Systems, Incorporated
Take Away Message
o Improving Efficiency is a part of a lifecycle asset management practice in Water Utilities and Consulting Ecosystem
o Integrated Geospatial, Hydraulic Modeling and Optimization technology can help: o Detecting leakage hotspots
o Pipe renewal planning process
o Pumping scheduling and optimal pressure and energy management (including CO2 footprint)
o From ‘dull pipes’ towards Smart Water Networks for real-time modelling, decision making and emergency response
51 | WWW.BENTLEY.COM | © 2016 Bentley Systems, Incorporated
Contact Information and Resources
www.bentley.com/water
www.bentley.com/waterstories
www.bentley.com/systemefficiency
communities.bentley.com
Email: [email protected]