Embed Size (px)
Citation preview

UNIVERSITY OF KWAZULU-NATAL
IMPROVING CUSTOMER SERVICES AT THE DEPARTMENT OF HOME
AFFAIRS
By
Simphiwe Emmanuel Ndlovu
205524775
A dissertation submitted in partial fulfillment of the requirements for the degree of
Master of Business Administration
Graduate School of Business
Faculty of Management Studies
Supervisor: Prof. A.M. Singh
2009

ii
Supervisor permission to submit for examination
Date : 18 February 2010
Student Name: Simphiwe Emmanuel Ndlovu
Student no : 205524776
Dissertation Title: Improving Customer Service at the Department of Home Affairs
As the candidate’s supervisor I agree/ do not agree to the submission of this dissertation
for examination.
Name of Supervisor: Professor A.M Singh
Signature:

iii
DECLARATION
I ………………………………………………………………declare that
(i) The research reported in this dissertation/thesis, except where otherwise
indicated, is my original research.
(ii) This dissertation/thesis has not been submitted for any degree or examination
at any other university.
(iii) This dissertation/thesis does not contain other persons’ data, pictures, graphs
or other information, unless specifically acknowledged as being sourced from
other persons.
(iv) This dissertation/thesis does not contain other persons’ writing, unless
specifically acknowledged as being sourced from other researchers. Where
other written sources have been quoted, then:
a) their words have been re-written but the general information
attributed to them has been referenced:
b) where their exact words have been used, their writing has been
placed inside quotation marks, and referenced.
(v) This dissertation/thesis does not contain text, graphics or tables copied and
pasted from the Internet, unless specifically acknowledged, and the source
being detailed in the dissertation/thesis and in the References sections.
Signature:

iv
ACKNOWLEDGEMENTS
During a very difficult time in my life, there are a number of people who supported me. It
would be impossible to mention all of them. Firstly, I thank God for giving me the
strength to go on (Isaiah 40:29-31). This dissertation is a testimony of the love of God
that I received through the times of trials and tribulation.
I would like to thank Professor Singh (Head of Business School- GSB) and the GSB staff
who provided me with guidance and support throughout this work. I thank God for your
patience, motivation and inspiration which gave me the strength to keep my focus on
achieving this goal.
Lastly this work is a dedication to my family in recognition of the support they gave me. I
am humbled by their sacrifices. To all of those who I have not mentioned, God Bless You
Always, THANK YOU.
v
ABSTRACT
The purpose of this study was to design and implement a customer service model that
will assist the Department of Home Affairs (DHA) to improve their levels of service
delivery by providing world class customer services. A sample population of 51
managers or senior managers who are students at the University of Kwazulu Natal,
Graduate School of Business were interviewed. The respondents were from different
companies in both the private and public sectors. The results indicated that there is a
strong correlation between client satisfaction and the quality of service provided by
DHA.
Data was gathered by means of interviews. This made it possible to address specific areas
of interest for the study. The interview questions consisted of three areas of focus, namely
demographical information, customer service-related issues and DHA service-related
issues. The research questions were original as there were no pre-exiting interview
questions that met the research criteria. The questions were based on a theoretical
foundation. Interviews were conducted on a sample group of 51 respondents and
consisted of open-ended questions in order that the respondents were able to fully express
themselves when answering the questions. The non-probability sampling technique was
used. SPSS was used to analyse the data.
The study revealed that DHA has a serious problem with staff inefficiency and many
members of staff lacked customer service skills that could help the Department to
improve their service quality. The study also revealed that most of the clients had visited
the DHA offices to apply for Identity Documents. It is was not clear if those were new
documents or first applications, but the study can assume that since these people were
adults, the possibility existed that most of them were applying for lost ID documents. The
study highlighted the need to improve the levels of service by training staff members, but
there is also a need to increase human capacity on counters especially in the sections
dealing with ID collection, ID applications and Passports.

vi
The main recommendations were as follows:
In Durban there are only two DHA offices to serve a population of about 8million. This
lack of offices creates a problem for the DHA in terms of the sheer numbers of people
needing their services. The respondents suggested that the DHA should establish another
Exclusive Department of Home Affairs (EDHA) office that would target people who
could afford to pay more for the services that they needed.
Many people would make use of the EDHA because, for an added fee, they would be
spared the inconvenience of the long queues and spending valuable time waiting to be
served. There has been a call for a better solution that will improve service delivery in the
DHA. In 2007 the DHA requested the turn around team to assist in creating a turn around
strategy. That exercise wasted almost R 1 billion of taxpayers’ money in just 18 months.
The DHA has been mentioned in a number of negative newspaper reports which claimed
that DHA staff members were inefficient and that there was a lack of leadership amongst
managers a high level of incompetence.
The training of all levels of staff is recommended. The implementation of systems,
especially IT systems, is critical to ensure that the quality of service is improved. It is
also important to create a good working environment for employees and to motivate
those employees who are demotivated. A study that was conducted by independent
consultants concluded that more than 75% of DHA employees are demotivated. Another
issue that had a huge impact on service delivery, is high number of corrupt employees in
the Department (DHA).The Department should have a proper structure and strategies
that will assist in fighting corruption. They must establish an anti-corruption directorate
that works together with SAP, NIB and NPA to effectively fight and combat corruption
in its ranks.

vii
TABLE OF CONTENTS
Page
Acknowledgements ii
Declaration iii
Acknowledgements iv
Abstract v
Table of Contents vii
List of Figures xii
List of Tables xiv
CHAPTER ONE STATEMENT of PROBLEM and RESEARCH DESIGN
1.1 Introduction 1
1.2 Motivation for research 1
1.3 Focus of the study 2
1.4 Problem statement 2
1.5 Objectives of the study 3
1.5.1 The Objective of this research 3
1.6 Limitations of the study 3
1.6.1 Other limitations considered 4
1.7 Literature survey 4
1.8 Conclusion 5
CHAPTER TWO LITERATURE REVIEW
2.1 Introduction 6
2.2 What is service delivery? 6
2.3 Service delivery in the public sector 7
2.3.1 Delivering services with excellence 8
2.3.2 Government service delivery in the SA public sector 9
2.4 Importance of service delivery in the public sector 11

viii
2.4.1 Service delivery interventions 11
2.4.2 Provision of basic services 12
2.4.3 Service delivery can mitigate social exclusion 12
2.4.4 Service delivery as an entry point for governance 12
2.4.5 Service delivery as a tangible peace dividend 13
2.4.6 Horizontal inequalities 13
2.5 Measuring public sector service delivery 14
2.6 Challenges associated with public sector service delivery 15
2.6.1 Lack of leadership competencies & strengthening human resources 16
2.6.2 Lack of co-ordination 17
2.6.3 Poor communication strategy 17
2.6.4 Enhancing ethics and values 18
2.6.5 Poor policy implementation 18
2.6.6 The Challenges in monitoring and evaluation mechanisms 18
2.6.7 The Need for responsibility and accountability 19
2.6.8 Service delivery as a relationship of accountability 19
2.6.9 Shortage of human resources capabilities 20
2.6.10 Building capacity for providers 20
2.7 Can delivery be improved? 20
2.7.1 Transformative African leadership and governance framework 21
2.7.2 Strengthening networks and partnerships 22
2.7.3 Conclusion 24
CHAPTER TWO (PART II) THE DEPARTMENT OF HOME AFFAIRS (DHA)
2.8 Background 25
2.8.1 Services offered by Department of Home Affairs 26
2.8.2 The Department of Home Affairs core 26
2.9 What is Batho Pele? 28
2.9.1 Revitalization of Batho Pele 28
2.9.2 Batho Pele service strategy 30

ix
2.9.3 Summary of Batho Pele 31
2.10 DHA: The implementation of services and Batho Pele 32
2.10.1. Output performance of measuring Batho Pele in DHA 33
2.10.2 Civic Services 33
2.10.3 Migration 34
2.10.4 Strategic challenges faced by the Department 34
2.10.5 Utilization of staff 34
2.10.6 DHA Implementation of the Batho Pele White Paper 35
2.10.6.1 DHA Implementation of the Batho Pele White paper 35
2.10.7 Challenges encountered in service delivery at DHA 36
2.10.8 Illegal foreigners and refugees 37
2.10.9 Refugees Affairs 37
2.10.10 Xenophobia 37
2.10.11 Other challenges 38
2.11 Conclusions 38
CHAPTER THREE RESEARCH METHODOLOGY
3.1 Introduction 39
3.2 Objective of the study 39
3.3 Sampling technique and description of the sample 40
3.4 Research instrument 42
3.4.1 Administration of questionnaire 43
3.4.1.1 Advantages of using such method to administer questionnaires 43
3.4.1.2 Disadvantages of using this method 44
3.4.2 There are two types of research instruments: Qualitative and
Quantitative research 44
3.4.3 Qualitative research 44
3.4.3.1 This study used questionnaires (quantitative research instrument) as
a method of collecting data, for the following reasons: Advantages 45
3.4.3.2 Questionnaires may also have drawbacks (Disadvantages) 45

x
3.5 Statistical analysis of the data 45
3.6 Statistical analysis of the questionnaire 46
3.7 Conclusion 46
CHAPTER FOUR PRESENTATION OF RESULTS
4.1 Introduction 47
4.2 Demographic characteristics 47
4.2.1 Gender and age composition of the sample 48
4.2.2 Race and age composition of the sample 49
4.2.3 Job composition of the sample 50
4.2.4 Language composition of the sample 51
4.2.5 Composition of the sample according to distance travelled 52
4.2.6 Composition of the sample according to time travelled 53
4.3. Services at the Department of Home Affairs (DHA) 54
4.3.1 Services utilized at DHA 54
4.3.2 Rating of overall service 57
4.3.3 Composition of the sample according to waiting time in queue 58
4.4 Attitude towards physical facilities 59
4.4.1 Seating facilities 60
4.4.2 Toilet facilities 61
4.4.3 Soap and water to wash ink 62
4.4.4 Parking facilities 63
4.4.5 Air conditioning 64
4.4.6 Signage 65
4.4.7 Wheelchair access 66
4.4.8 Information desk 67
4.5 Attitude towards staff 68
4.5.1 Adequate provision of staff 68

xi
4.5.2 Staff attitudes 69
4.5.3 Staff is available and helpful 70
4.5.4 Satisfaction with information received at DHA 71
4.5.5 Customers interaction with senior staff 72
4.5.6 Fraud and corruption 73
4.6 Overall attitude towards facilities and staff at Home Affairs 74
4.6.1 Inferential statistics 75
4.6.2 Analysis of variance: Age 76
4.6.3 Analysis of variance: Qualification level 77
4.6.4 Analysis of variance: Race 78
4.7 Reliability 79
4.8 How services could be improved at DHA: Responses from customers 79
4.9 Conclusion 80
CHAPTER FIVE DISCUSSION OF RESULTS
5.1 Introduction 81
5.2 Demographics 81
5.3 Customer satisfaction with service provided by DHA to the clients 83
5.4 Services used by DHA customers 85
5.5 The average time customers spend on travel and waiting for services 87
5.6 Availability of DHA staff to assist clients 88
5.7 Accessible parking facilities 89
5.8 How service could be improved 89
5.9 Conclusion 90
CHAPTER SIX RECOMMENDATIONS AND CONCLUSION
6.1 Introduction 91
6.2 Recommendations for Future Research 91
6.3 Recommendations to improve customer satisfaction 92

xii
6.3.1 Establishment of exclusive Home Affairs Offices 93
6.3.2 Inefficiency and Leadership 93
6.3.3 Training of officials to work better, faster and
differently to improve service delivery 93
6.3.4 Fighting corruption among official 94
6.4 Conclusion 95 - 96
BIBLIOGRAPHY 97-104
APPENDIX 1 Survey/ Clients questionnaire 105
APPENDIX 2 Survey consent form 111
xiii
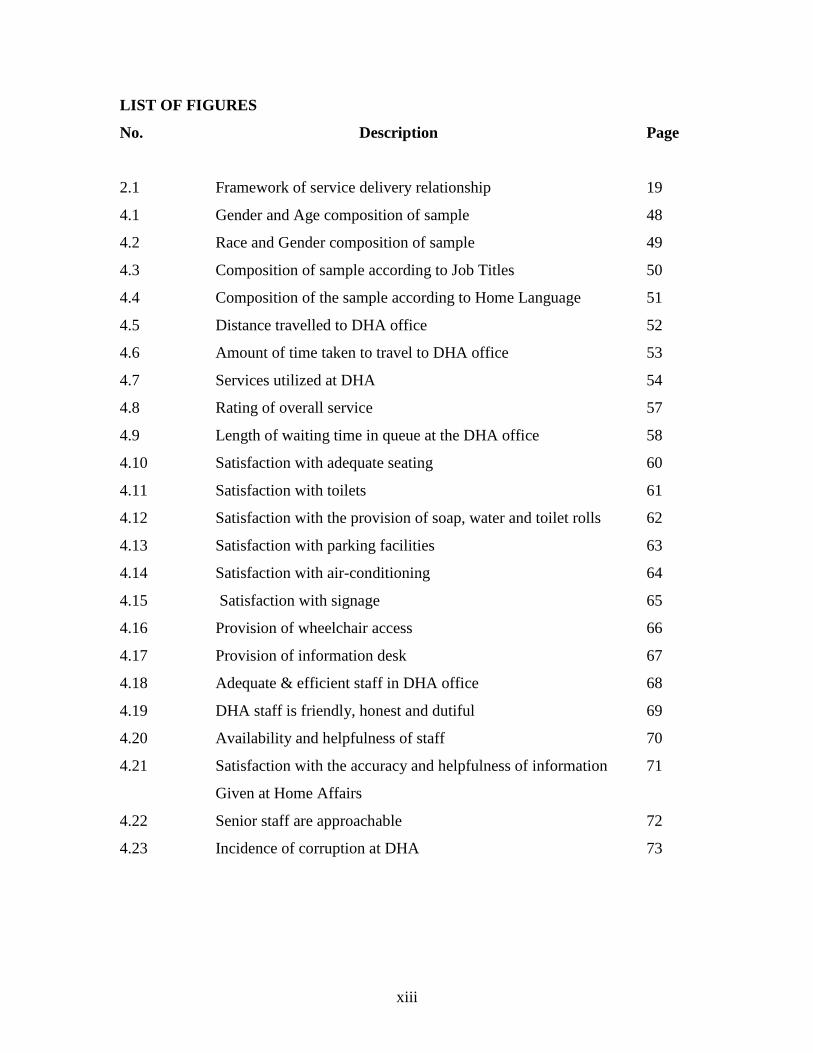
LIST OF FIGURES
No. Description Page
2.1 Framework of service delivery relationship 19
4.1 Gender and Age composition of sample 48
4.2 Race and Gender composition of sample 49
4.3 Composition of sample according to Job Titles 50
4.4 Composition of the sample according to Home Language 51
4.5 Distance travelled to DHA office 52
4.6 Amount of time taken to travel to DHA office 53
4.7 Services utilized at DHA 54
4.8 Rating of overall service 57
4.9 Length of waiting time in queue at the DHA office 58
4.10 Satisfaction with adequate seating 60
4.11 Satisfaction with toilets 61
4.12 Satisfaction with the provision of soap, water and toilet rolls 62
4.13 Satisfaction with parking facilities 63
4.14 Satisfaction with air-conditioning 64
4.15 Satisfaction with signage 65
4.16 Provision of wheelchair access 66
4.17 Provision of information desk 67
4.18 Adequate & efficient staff in DHA office 68
4.19 DHA staff is friendly, honest and dutiful 69
4.20 Availability and helpfulness of staff 70
4.21 Satisfaction with the accuracy and helpfulness of information 71
Given at Home Affairs
4.22 Senior staff are approachable 72
4.23 Incidence of corruption at DHA 73

xiv
LIST OF TABLES
Table No. Description Page
3.1 Composition of a sample according to Age, Gender & Race 42
4.1 Composition of sample 47
4.2 Services utilized at DHA according to gender 55
4.3 Services utilized at DHA according to race group 56
4.4 Service utilized at DHA according to age category 56
4.5 Mean analysis of overall attitude 74
4.6 Comparison of attitudes between Gender 75
4.7 Comparison of attitudes between Age categories 76
4.8 Comparison of attitudes between Qualification levels 77
4.9 Comparison of attitudes between Race groups 78
4.10 Comparisons of attitude towards physical facilities and staff 79
xv
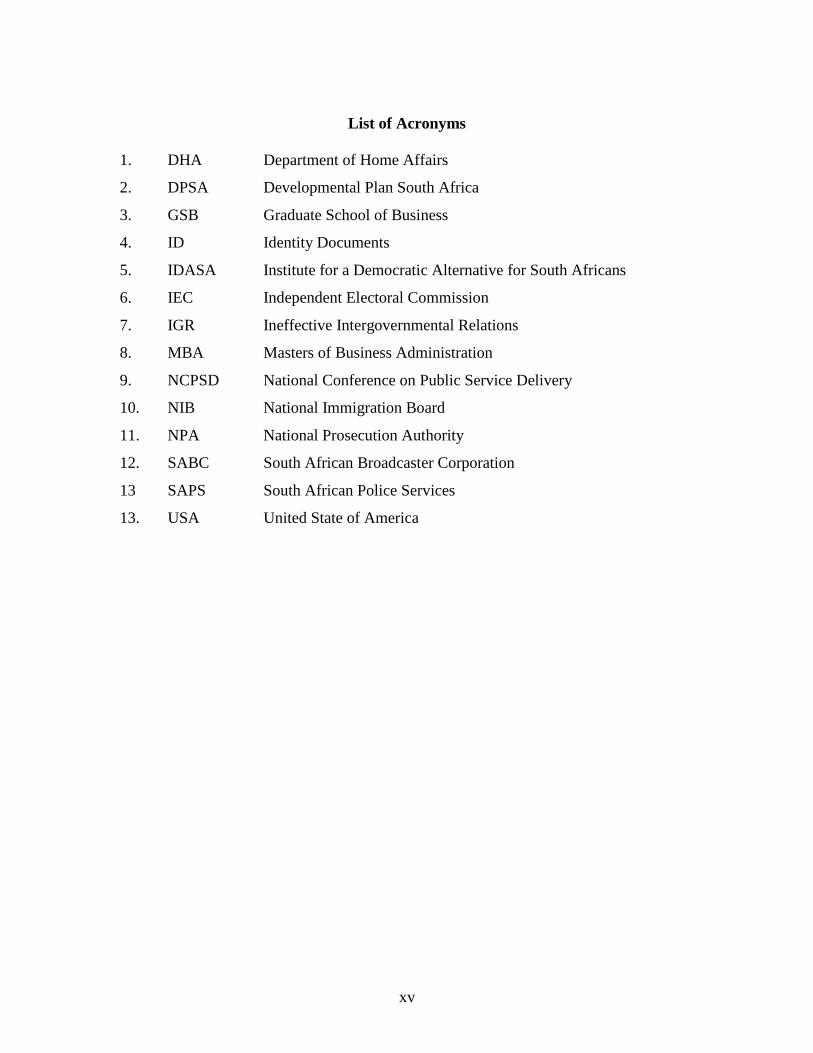
List of Acronyms
1. DHA Department of Home Affairs
2. DPSA Developmental Plan South Africa
3. GSB Graduate School of Business
4. ID Identity Documents
5. IDASA Institute for a Democratic Alternative for South Africans
6. IEC Independent Electoral Commission
7. IGR Ineffective Intergovernmental Relations
8. MBA Masters of Business Administration
9. NCPSD National Conference on Public Service Delivery
10. NIB National Immigration Board
11. NPA National Prosecution Authority
12. SABC South African Broadcaster Corporation
13 SAPS South African Police Services
13. USA United State of America

1
CHAPTER 1
STATEMENT OF PROBLEMS AND RESEARCH DESIGN
1.1 INTRODUCTION
In 2004 a review was conducted by the South African government which showed that,
although the South African public service had been successful in meeting its immediate
service delivery objectives, the interventions, strategies and approaches being used at the time
were not effective in rapidly improving and redressing service delivery to the extent and at the
pace that was necessary in South Africa (Towards a Ten Year Review, 2003).
According to Naidoo (2004), there are a number of interrelated variables, which are
hampering the effectiveness of the public service delivery. The most important of these
variables were identified as human resources and financial constraints, lack of technical skills,
the lack of co-ordination, ineffective intergovernmental relations (IGR) among the three
spheres of government, ineffective policy implementation and lack of effective monitoring and
evaluating systems.
1.2 MOTIVATION FOR RESEARCH
Public servants are social beings whose needs should be recognized and fulfilled. This
recognition of needs will instil a sense of belonging to the public service family. They belong
because they are recognized and rewarded for living Batho Pele. Citizens who feel satisfied,
will certainly develop a spirit of patriotism towards the country and will also feel a sense of
belonging (Mbeki, 2003 State of the Nation Address).
The recent underperformance of the public service and a poor service delivery record as well
as poor customer service, calls for more intervention from the government to improve the lives
of people of South Africa (Cloete and Wissink, 2000). According to Rugumamu (1998), the
central factors in effective governance are the allocation of responsibility for service delivery
performance and holding leadership accountable for their achievements or lack thereof.
2
“Public servants are meant to serve society in a positive way. The basic principle of
government is to provide optimum service delivery in order to create a good quality of
life for every citizen. Attempts should thus be made to improve the public service‟s
performance and to minimize the negative consequences of action. This implies that
the public service‟s activities should be directed to satisfy the public‟s needs and to
resolve the public‟s legitimate concerns” (Naidoo, 2004:4).
1.3 FOCUS OF THE STUDY
This study will focus on attempting to design a new model for customer service satisfaction at
the Department of Home Affairs. Overall service delivery and the current levels of customer
service will be examined with the aim of making recommendations on how to improve service
delivery at the Department of Home Affairs.
1.4 PROBLEM STATEMENT
In an interview with SABC2 in 2003, President Thabo Mbeki stated that there was a need for
government departments to accelerate their service delivery. Fraser-Moleketi Minister of
Public Administration (2005:3) stated that inefficiency was having an impact on public service
delivery. She also said that service delivery must be accelerated to communities, service
delivery mechanisms must comply with Batho Pele principles.
According to Ngema (2003), government wants to improve people‟s experience of
government and governance by accelerating and integrating the delivery of public service.
Over the past ten years, government has made considerable strides in pursuing its priority to
restore human dignity to many people through access to more vital services (Ngema, 2003).
Patel (2005) stated that one of the biggest problems in the public service today is that there are
no clear standards of the quality of service that is required, and there are no consequences for
the failure to achieve that minimum standard. According to Dr Tshabala-Msimang Minister of
Health (2003) (Budget speech), there are weaknesses in the current monitoring and evaluation
system in the South African public service. The monitoring and evaluation of programmes in
the South African public service departments ought to be improved because that will enable
the public service to determine whether service delivery objectives are being achieved or not.

3
In order to address the issues of service delivery and customer satisfaction, the following
research questions have been formulated.
How DHA can improve service delivery;
Does DHA abide by the principle of Batho Pele;
Why is there poor service delivery in DHA, and what are the causes of poor service;
What measures must be put into place in order to achieve customer satisfaction
objectives in DHA?
1.5 OBJECTIVES OF THE STUDY
The above problem statement highlights the failure by the government departments to provide
good customer service and a better service delivery. The full extent of the situation will be
analyzed by conducting a survey to facilitate the formulation of a new model of customer
service satisfaction at the Department of Home Affairs (DHA).
1.5.1 THE OBJECTIVE OF THIS RESEARCH:
The main objectives of this research are to:
Determine current levels of customer satisfaction with the service provided by DHA;
Determine the services used by DHA customers;
Differentiate the similarities and variances in service experienced by different age,
gender and race groups;
Determine the average time customers spend on travelling to and waiting for services
at the DHA offices;
Determine how service could be improved at DHA
1.6 LIMITATIONS OF THE STUDY
This study has been conducted for academic purposes. Due to the adherence to a deadline, the
time within which the study was completed, was limited.
1.6.1 OTHER LIMITATIONS CONSIDERED:
The sample size of 51 respondents may not be large enough to reach a generalized
conclusion;

4
The questionnaires were administered through Question Pro.com on the guidance of
the supervisor, MBA students were chosen as they have the potential to afford a “paid
for” service;
The Department of Home Affairs did not cooperate with the University and with the
researcher regarding the administering of the questionnaire;
Permission to conduct the survey at the DHA office was not granted by the DHA;
The demographic composition of the population sample may not necessarily represent
the South African population proportionally.
1.7 LITERATURE SURVEY
The literature chapter will review the available literature on measuring service delivery and
customer satisfaction in the public sector. The increased importance of service delivery in
government departments has seen the emergence of comprehensive programmes to research
customer satisfaction. This chapter will review service delivery in South Africa government
departments. A clear definition of service delivery will be discussed in terms of what it means
to all South Africans, including a clear definition of the principle of Batho Pele (People First),
its characteristics and the background to the Batho Pele principle. This chapter will also give a
brief review of the Department of Home Affairs (DHA) as the study is based on the service
delivery in this department.
Chapter Three, the research methodology chapter, which follows, will address the research
questions. It includes the research design, construction of the questionnaire and as well as the
process used to collect data.
Chapter Four is the analysis section of the dissertation and reports the collected data in a
manner, which is suitable for interpretation.
Chapter Five follows on from the results presented in Chapter Four. These results are then
interpreted according to the research objectives as stated in Chapter One. It is in this chapter
where the results are given meaning and the patterns identified in the results are discussed.

5
The question on customer satisfaction with the services received from the DHA will be
answered here.
Chapter Six provides an opportunity to give recommendations on how to deal with the
findings in the previous chapter. These recommendations will be based on the findings in all
the preceding chapters.
1.8 CONCLUSION
This chapter serves as the groundwork for this study. It has given an extensive overview of the
purpose of the study and what it hopes to accomplish.
The study is also expected to acknowledge the levels of services that the South African public
expects from government departments, especially people who are disadvantaged or poor
people.
Chapter Two is an attempt to understand the concept of service delivery in government
departments. This chapter briefly defines service delivery, Batho Pele and the DHA with its
characteristics and how these have affected the lives of South Africans over the years.

6
CHAPTER TWO
LITERATURE REVIEW
2.1 INTRODUCTION
The new South Africa came into existence in 1994. The incoming government faced a massive
task of fiscal, political and economical transformation, all of which would require an effective
public service capability (Russel and Bvuma, 2001). According to Russel and Bvuma the
public service itself had, during the Apartheid era, been subject to the same limitations as
other key South Africa institutions. These included substantial isolation from contemporary
influences elsewhere, the impact of excluding the majority of the population of the country
from the opportunity to exercise power and influence public service, and the inability to
overcome certain social and economic problems such as HIV/AIDS, unemployment, poverty
and crime.
This frustration has, in turn, resulted in a wide range of initiatives and programmes, all aimed
at addressing the question of “service delivery”. All are based on the premise that government
should be able to do its job better and in so doing, make a greater impact on the quality of life
for South Africans. Therefore, one could equate the term “service delivery” with
“organizational performance” on the assumption that the better the performance of
government, the more likely it is that actual service delivery will match. Literally hundreds of
interventions and initiatives to improve service delivery have been undertaken in South Africa
since 1994 (Department of Public Administration progress report of 2002).
2.2 WHAT IS SERVICE DELIVERY?
According to Mti (2003:11), service delivery is conceptualized as the relationship between
policymakers, service providers, and poor people. It encompasses services and their
supporting systems that are typically regarded as a state responsibility. These include social
services (primary education and basic health services), infrastructure (water and sanitation,
road and bridges) and services that promote personal security (justice, police). Pro-poor
service delivery refers to interventions that maximize the access and participation of the poor

7
by strengthening the relationships between policymakers, service providers and service users
(Narayan et al., 2000). According to Mti (2003) service delivery in general means to deliver
one‟s intended objectives to a customer. It is frequently asked whether service delivery has
any place in government, and the answer is indeed it does have a place and has a very specific
meaning in the context of a democratic government (Mti, 2003).
According to Narayan et al. (2000) in the public sector, service delivery means being in a
position to deliver on the expectations of all citizens, but most especially to deliver good
service to the most vulnerable in society. To do this, the Batho Pele (People First) principle
requires that all government departments ensure that the eight service delivery principles be
implemented. These principles highlight the need to:
Regularly consult with customers;
Set service levels ;
Increase access to service;
Ensure higher levels of courtesy;
Provide more and better information about service;
Increase openness and transparency about service;
Remedy failure and
Give the best possible value for money.
What then does service delivery mean for government departments? Ngema (2004) argued
that it is the Batho Pele service principle that defines the core business for each department
because it defines the key clients as well as the services provided. These must inform the
objective of each department, which are then translated into programmes of the department,
based on the budgeting and resources of the department (Ngema, 2004).
2.3 SERVICE DELIVERY IN THE PUBLIC SECTOR
According to Ngema (2004), the public sector (which at present is legally defined to include
national and provincial administrations) is an institutional system comprising large and
complex organizations across virtually every sector of society and the economy.

8
Ngema (2004) argued that in the vast majority of what could be termed “typical” cases or
situations, the system of rules and procedures works with some effectiveness, if perhaps not
always efficiently. It also tends to work with some effectiveness in circumstances that are
familiar, and which have been encountered before, more or less. The issue of inefficiencies
should not be understated, whether these are a result of regulations, procedures, structure,
infrastructure or capacity. Inefficiencies in key back-office processes such as procurement;
recruitment and selection or facilities management and so on, are responsible for a sizeable
proportion of poor service delivery performance in the public sector (Jones, 2004).
According to Jones (2004), it does not help that, in many instances public sector organizations
attempt to manage massive volumes of transactions through manual processes or outdated
technologies without business intelligence capabilities. This aspect of service delivery,
unfortunately requires vast financial resources to upgrade.
2.3.1 DELIVERING SERVICES WITH EXCELLENCE
According to Ngema (2004), the state, in its role as the machinery of service delivery, must do
its job with excellence. It must deliver quality services, in a manner that affirms and is
convenient to the citizens so that each state organization that is entrusted to deliver defined
package of products and services will do its job with excellence (Ngema, 2004). This is the
starting point of any turn-around strategy in the service delivery performance of the state.
Klugman (1999) stated that each silo must perform effectively, only then does integration add
value to the service delivery process. Naidoo (2004) stated that integrating moribund
organizations can make service delivery performance worse. The regulatory departments must
ensure that this happens, must close any gaps that may exist, and must simplify and co-
ordinate associated processes where necessary. It also requires that known blockages in the
service delivery chain be unlocked, e.g. procurement, facilities management, fleet
management, recruit and selection (Ngema, 2004).

9
2.3.2 GOVERNMENT SERVICE DELIVERY IN THE SOUTH AFRICAN PUBLIC
SECTOR
According to the Institute for a Democratic Alternative for South Africa (IDASA) report of
2006, the provincial sphere of government is responsible for several functions that affect the
country as a whole and that require uniformity. National government‟s responsibilities
include, among other things, Safety and Security (the policing function), Foreign Affairs,
Defence and Home Affairs. The national sphere also develops policies that guide service
delivery in the other two spheres. For example, broad education policies such as the school
curriculum and school admission age are developed at national level for implementation at
provincial level. National government monitors and supports the implementation of these
policies. It also has the duty to deal with issues arising between provinces (IDASA, 2006).
In this regard “public sector” or “public service” is perceived by citizens as more than just
national departments and provincial administration as defined in the Public Service Act, 1994.
Generally people do not see any distinction between local government, central government
and provincial government. Any failing in one area of government is seen as a falling of the
public service as a whole.
Although much has been done in terms of service delivery levels in the public sector, there is
still much to do, specifically in relation to everyday aspects. These include having
inappropriate office hours, untidy waiting areas, and long queues at lunch times caused by
staff being on lunch breaks. The Constitution of South Africa, 1996 sets out the basic values
and principles which should govern public administration and states that these must not
remain words on paper but must be a reality (Mbeki, 2003 State of the Nation Address)
According to the National Conference on Public Service Delivery held at the University of
Fort Hare in 1997, Batho Pele cannot be delivered overnight as there are many systems and
attitudes that have to change. The process is now underway. Unless the public service
transforms its delivery, it cannot claim to have achieved the democratic goals that the country
fought so hard for. Whilst the public service has an advantage over the private sector where
customers can choose to use another supplier, this must not be abused. The „customer‟ concept
10
is still valid for the public service because it engenders a „people must come first‟ attitude
which not only benefits the recipients of services but also results in better managed, more
productive and a more cost effective government service. The Green Paper on Transforming
Public Service Delivery explains how the public service should approach the task of
transforming the delivery of public services. In the Green Paper a fresh approach is advocated,
which puts pressure on systems, procedures, attitudes and behaviour within the public sector
and reorients them in the citizen‟s favour (Green Paper Conference Report, 1997).
The Green Paper contains a flexible framework for service delivery within public services. It
puts citizens/customers first and enables them to hold public servants accountable for the
services they receive. It also aims to free up the energy and commitment of public servants to
introduce more customer-focused ways of working. The framework consists of seven simple
national principles, derived from the policy goals set out in the White Paper on the
Transformation of the Public Service. These are: consultation, services standard, courtesy,
information, openness and transparency, responsiveness, and value for money. The principles
are broad enough to cover every public service institution, yet specific enough to ensure that
tangible benefits will result from their application (Green Paper Conference Report, 1997).
The improvement of service delivery cannot be achieved in isolation from other fundamental
management changes within the public service. New management tools will be needed,
including:
increased responsibility of individual managers for delivering specific results,
being matched against increased authority for taking management decisions,
the delegation of managerial responsibility and authority to the lowest possible level,
and
transparency about the results achieved and the resources consumed (NCPSD:
Conference Report, 1997).
11
2.4 IMPORTANCE OF SERVICE DELIVERY IN THE PUBLIC SECTOR
Service delivery in the public sector is central to poverty reduction and improving the lives of
the poor. Poor people say that water; education, healthcare and personal security are among
their highest priorities. Therefore, expanding inclusive service delivery is critical to achieving
the Millennium Goals (Narayan et al., 2000). Strategies to improve service delivery typically
emphasize the central role of the state in financing, providing and regulating services.
According to Narayan et al. (2000), the state bears the legal responsibility to ensure that the
fundamental human rights to security, education and healthcare are realized. The state is also
well placed to respond to the challenge of scale and market failure in ensuring access for
services to all groups. For these reasons, many development analysts have emphasized the
central role that governments play in regulating, overseeing and monitoring the delivery of
services (Narayan et al., 2000).
The World Bank Report (2003) stated that weakness or fragility can occur in many ways such
as:
When the state lacks effective territorial jurisdiction;
When it is preoccupied by conflict;
When its administrative capacity has effectively collapsed; and
When the challenge of service delivery takes on a different shape.
Sophisticated strategies to improve the relationship between the state regulators and private
providers have little relevance where the government is repressive or lacks commitment to
poverty reduction goals.
2.4.1 SERVICE DELIVERY INTERVENTIONS
According to Black (2003), service delivery interventions can provide an entry point and a
trigger for longer-term pro-poor social, political and economic changes in difficult
environments. A pro-poor social, political and economic environment is one in which poor
people are empowered to demand their rights to services, livelihood opportunities and social
protection and one in which the state is responsive to the voices of the poor. Clearly, many of
these conditions do not exist in difficult environments. Changing the situation is likely to

12
require sustained engagement over time and it is hypothesized that service delivery provides
one possible entry point (Black, 2003).
2.4.2 PROVISION OF BASIC SERVICES
According to Thompson (2004), the provision of basic service has the potential to break the
intergenerational cycle of poverty and increase economic opportunity for the people. Agencies
may have to work for change in the medium to long-term. Fiedrich and Jellema (2003) stated
that education, for example, could be a powerful intergenerational change agent, by giving
those who are exposed to it, a greater understanding of issues, as well as the confidence to
participate in political discussions and in policy formulation and implementation. Hobley
(2004) argued that such participation could change the nature of politics. Women‟s literacy
has the potential to be a particularly powerful tool for social and political change if
approached in the right way, because healthier and better-educated individuals are more likely
to be able to build their livelihood opportunities, contribute to long-term economic growth,
and protect themselves from economic shocks (Fiedrich and Jellema, 2003).
2.4.3 SERVICE DELIVERY CAN MITIGATE SOCIAL EXCLUSION
According to Hobley (2004), service delivery can mitigate social exclusion (enforced
officially or unofficially), particularly in marginalized areas such as slums and poorly
communicated territories by the introduction of mechanisms that reach down to community
level and give the poor a voice and the opportunity to participate politically. The Char‟s
Livelihood programmes in Bangladesh have developed a useful conceptual model of how
service delivery interventions can incorporate opportunities for the poor to exercise their
voices, create political space, and in the long-term, fundamentally alter their relationship with
elite groups.
.
2.4.4 SERVICE DELIVERY AS AN ENTRY POINT FOR GOVERNANCE
It is interesting to note that Thompson (2004) argued that service delivery interventions can
offer an entry-point for broader governance reforms. Where upstream governance weaknesses
or lack of capacity are a contributory factor, the governance reforms that are necessary to
promote longer-term social and political change have a better chance of success if they are
13
linked to reforms in service delivery, which have tangible results and benefit the public in a
noticeable way. Chalmers (2004) argued that service delivery reforms could offer a more
promising entry-point for broader governance reforms if they are visible to the public as this
can then lead to pressure for wider more systemic reforms. A recent report on service delivery
in Nigeria, for example, suggested that targeted improvements in policing would send a
powerful message to inspire others and potentially create the political space to conduct more
comprehensive reform (Chalmers, 2004).
2.4.5 SERVICE DELIVERY AS A TANGIBLE PEACE DIVIDEND
Stewart (1999), Klugman (1999) and Ostby (2003) argued that service delivery is an important
intervention in the public sector, which may act as a tangible peace dividend in countries
emerging from conflict. A number of service delivery interventions have been designed and
implemented to reach down to the grassroots level, helping to stabilize the situation in the
immediate aftermath of conflict in certain countries.
2.4.6 HORIZONTAL INEQUALITIES
The available literature on the role of „horizontal inequalities‟ highlights the importance of
considerations of equality in the provision of services. Horizontal inequalities can be defined
as inequality between groups in society (often-based on ethnicity or other group
characteristics) rather than between individuals (for example between the rich and the poor
that is known as vertical inequality (Black, 2003).
Klugman (1999) argued that group exclusion along social, economic, and /or political lines is
a source of differentiation and is one of the potential triggers of conflict. Access to service is
one factor contributing to such differentiation and exclusion from services, in particular
education, has been highlighted as a factor of conflict in countries as diverse as Burundi, Sri
Lanka, Nepal and Kovos (Black, 2003). Efforts to reduce inequalities in access to service may
therefore help to reduce poverty and conflicts (Ostby, 2003).

14
2.5 MEASURING PUBLIC SECTOR SERVICE DELIVERY
According to Thompson (2004), in difficult environments, scaling up the delivery of services
and reaching the poor is problematic because the relationships between the policymakers and
the service provider break down. Thompson (2004) further stated that pressures exerted by
constantly changing economic and social factors have increased the demands on government‟s
capacity to deliver value-added services to its clients.
Tshikwatamba (2003) argued that accenture could help the federal and provincial governments
in South Africa enhance their performance in delivering public sector value by providing
innovative and more efficient public services. The Accenture Public Sector Value Model
represents one of the main concerns of South Africans towards their government and enables
the authorities to measure performance from the citizen‟s point of view (Tshikwatamba,
2003).
According to the Public Service Commission Report of 2001, the Model is unique in its
approach to programme performance measurement. Until now, no equivalent measure has
existed in the public sector. When the aim is to improve service delivery, it is not enough to
simply use performance measurement approaches that only focus on measuring inputs (e.g.,
the number of police officers employed) and outputs (e.g. the number of people arrested for
committing a crime) against many targets from varied levels of government. A better indicator
would be outcomes (e.g., the results of policing policies on crime level), which would give a
clearer indication of success levels. Performance targets fail to take a holistic view of an
agency‟s performance and instead encourage a silo approach that often puts objectives at odds
with each other.
Chandu (2003) argued that the fundamental misalignment between current targets and what
constitutes real value creation for the general public means that federal and provincial
governments struggle to identify their true value drivers. This makes it difficult to develop
focused processes aimed at delivering a more effective and efficient service. The Accenture
Public Sector Value Model aims to address this fundamental challenge. It adapts the principle

15
of Shareholder Value Analysis and is based on identifying a set of citizen-focused outcomes
against which cost-effective delivery is measured (Chandu, 2003).
According to Russell and Bvuma (2001), The Accenture Public Sector Value Model is not
intended to replace other performance measures such as Public Service Agreements, Service
Delivery Agreements, or the Balanced Scorecard approach. Rather, it complements these other
approaches. For example, while the Accenture Public Sector Value model answers the
question, “Is this organization achieving its fundamental objectives?” other performance
measures are still required to determine whether the organization is being well run. It does not
set the standards of public service delivery, nor dictate the outcomes. Rather, it fills the long-
standing gap of a standardized framework for assessing value creation in the public sector for
the key stakeholders.
2.6 CHALLENGES ASSOCIATED WITH PUBLIC SECTOR SERVICE
DELIVERY
In a ten year review which was conducted by the Minister of Safety and Security Mr Charles
Nqakula 2003, it is very clear that this review shows a positive light in service delivery. This
review indicates that leadership and governance challenges have the impact on the ability of
the government to offer the public a good service delivery that would have a positive impact
on the ordinary citizens of South Africa and as a result this is becoming one of major
challenges in the public sector as most people believe leadership and governance issues must
be addressed sooner that late
According to Naidoo (2004), there are also a number of interrelated variables, which hamper
the effectiveness of the public sector to deliver services. The most important of these variables
were identified as:
Human resources and financial constraints;
The lack of technical skills;
The lack of co-ordination;
Ineffective inter-governmental relations (IGR) among the three spheres of
government;

16
Ineffective policy implementation; and
Lack of effective monitoring and evaluation of systems.
The real challenge in the South African public service lies in its inability to mobilize and focus
its efforts to achieve its goals (Naidoo, 2004). In 2003, the Minister of Health stated that slow
policy implementation is critically effected by leadership decision-making and leadership
commitment.
According to Muthien, Khoza and Magubane (2000) the lack of effective leadership poses a
serious challenge in the South African public service, and this impacts negatively on service
delivery. President Thabo Mbeki (2003 State of the Nation Address Part 2) argued that an
essential element for improving the situation is to improve the quality of leadership in the
South African public service. Fraser-Moleketi (2005a) argued that the South African public
service needs faster responses to meet the needs and demands of the South African society, to
facilitate better utilization of available resources, to improve policy implementation, to
monitor and encourage a positive working culture, and to maximize efforts by departments.
Fraser-Moleketi (2005b) emphasized the need for effective leadership and governance for
improving service delivery.
2.6.1 LACK OF LEADERSHIP COMPETENCIES AND STRENGTHENING HUMAN
RESOURCES
The slow pace of policy implementation by some departments in the South African public
service can be attributed to the deficiency in leadership competencies amongst public servants
(Naidoo, 2004). In this respect Mbeki (2003) in his state of the Nation Address stated that the
South African public service needs strong leadership competencies in all spheres and at all
levels. The challenge for the South African public service, therefore, is to develop appropriate
profiles of leadership competencies and design the necessary interventions to ensure
appropriate leadership development.
Soobrayan (2004) argued that the South African public service organizations ought to seek,
train and develop public servants to become effective leaders. In examining the specific traits

17
required of a leader, Setsabi (2001) argued that it is important for South African public service
to deepen its understanding of the cultural, spiritual, social and personal dimension of
leadership. Mokgoro (2000) stated that the South African public service should strengthen its
efforts towards professionalizing the capabilities of public servants.
2.6.2 LACK OF CO-ORDINATION
Fraser-Moleketi (2005b) stated that policy implementation lacked co-ordination among
different departments, in that there was a lack of clarity of the roles and functions of each
sphere of government in South Africa, although these are clearly spelt out in the Constitution
(1996).
Schacter (2000) also argued that there is intransigence in the relations between the different
spheres of government. To facilitate and improve service delivery, there should be a
coordinated effort from all spheres of government in South Africa. The South African public
service ought to focus on clearly defining the roles of all spheres of government. It is also
necessary to avoid duplicating issues between spheres of government (Freidman, 2003). Each
structure should be vested with the appropriate powers in order to effectively meet the
challenges of service delivery (Naidoo, 2004).
2.6.3 POOR COMMUNICATION STRATEGY
Friedman (2003), Kuye (2003) and Soobrayan (2004) indicated that ineffective
communication is a critical challenge, which is impacting on effective service delivery.
Naidoo (2004) argued that the public service‟s vision and strategies should be continually
communicated to public servants to reinforce in them the need to improve service delivery in
South Africa. Freidman (2003) suggested that communication should be improved between
different sphere of government and with external stakeholders. Soobrayan (2004) argued that
appropriate internal and external communication is integral to promoting effective public
service delivery.
18
2.6.4 ENHANCING ETHICS AND VALUES
Lungu and Esau (1999) suggested that sound public service ethics are essential in the South
African public service. The South African public service therefore needs to re-evaluate its
ethics regime. Fanaroff (2002) argued that, in moving towards a professional ethos, it is
necessary to eliminate elements of corruption and fraud, which unfortunately are widely
present in the South African public service. Van Wyk et al., (2002) indicated that unethical
behaviour makes it difficult to promote an effective public service because free-flowing
information, trust and voluntary business transactions are impaired by it.
2.6.5 POOR POLICY IMPLEMETATION
There is growing concern about the ability of leaders to implement policy in the South African
public service (Dr Tshabala-Msimang Budget Speech, 2003). This was re-iterated by President
Thabo Mbeki (2003), who stated that the critical challenge facing the South African public
service was its capacity to implement policy. According to Naidoo (2004) the ability to
understand policy and translate it into an effective strategy for implementation, requires a
certain level of intelligence, competence and commitment on the part of public servants.
Theron (2000) was of the opinion that the implementation of policy also required enabling,
coherent and integrated systems, processes and procedures within the public service, between
different spheres of government and among various stakeholders involved in the delivery of
public service. There is an urgent need to strengthen and integrate the systems, processes and
strategies in the South Africa public service departments (Chandu, 2003). The lack of effective
processes and management systems is a recipe for disaster (Gildenhuys and Knipe, 2000).
More importantly, the local spheres of government could provide valuable input, about the
needs and demands of the citizens.
2.6.6 THE CHALLENGE IN MONITORING AND EVALUATION MECHANISMS
Cloete and Wissink (2000) remarked that the challenge of policy implementation can only be
successful if effective monitoring and evolution mechanisms are provided for institutions. Effective
mechanisms are essential to review and evaluate policy to ensure achievements of service delivery
outcomes. In a Budget Speech delivered by Dr Tshabala-Msimang in 2003, she stated that there were
weaknesses in the current monitoring and evaluation system in the South African public service.

19
2.6.7 THE NEED FOR RESPONSIBILITY AND ACCOUNTABILITY
According to Rugumamu (1998:250), the central factors in effective governance are the allocation of
responsibility for service delivery performance and the need to hold leadership accountable for their
achievements or lack thereof. There is also a need for increased responsibility and accountability of
individual managers for delivering specific results in the South Africa public service (Kuye, 2004).
2.6.8 SERVICE DELIVERY AS A RELATIONSHIP OF ACCOUNTABILITY
Nicolai and Triplehorn, 2003 argued that service delivery is a relationship of accountability
between users, providers and policymakers. The World Development Report of 2003 proposed
a possible framework for conceptualizing poor service delivery that examined the
accountability relationship between the policymakers, the provider and the citizens (Figure
2.1). This relationship highlights the central role of the state in guaranteeing the provision of
good levels of service and the role of politics in this process.
Figure 2.1 Framework of a service delivery relationship
(World Development Report 2004)
Source: Nicolai and Triplehorn (2003)
The above diagram illustrates the importance of a good policy environment, where the
international community seeks to partner predominantly with policymakers at the state level to
strengthen the state‟s ability to monitor and build the capacity of providers, and to work with
poor citizens to give them more rights to health, education, and other services from the state
through voice initiatives. It also seeks to build the responsiveness of providers to citizens by
Policy maker
Voice
Citizens
Citizen power
Providers
Compact
20
funding mechanisms for citizens to directly hold providers to account (Nicolai and Triplehorn,
2003).
2.6.9 SHORTAGE OF HUMAN RESOURCE CAPABILITIES
Obura (2003) and Rutayisire, Kanabano and Rubagiza (2004) stated that other important
challenges associated with public sector service delivery include a shortage of human resource
capabilities, the role of civil society organizations in advocating for the rights of the poor to
basic services, and the role of trade unions and other professional organizations in working
with their members to improve the quality of service provision. While recognizing these
weaknesses, the WDR (World Development Report) framework is one of the useful tools for
examining service delivery interventions as it draws attention to the need to consider the three
groups, which are necessary to improve service delivery.
2.6.10 BUILDING CAPACITY FOR PROVIDERS
In a good policy environment, the international community seeks to partner predominately
with policymakers at the state level to strengthen the state‟s ability to monitor and build the
capacity of providers (through the compact), to work with poor citizens to give them more
voice to demand their right to health, education and other services from the state through voice
initiatives, and to build the responsiveness of providers to account (Klugman, 1999).
2.7 CAN SERVICE DELIVERY BE IMPROVED?
According to Sommers (2004:31), a uniquely South African leadership and governance
framework will shape the public administration positively within the context of South African
public service. Naidoo (2004) argued that the purpose of developing a hybrid leadership and
governance framework is not to replace the current framework adopted by the South African
public service, but to improve on and strengthen it to meet the needs and demands of the South
African public service.
“Public servants are meant to serve society in a positive way. The basic principle of
government is to provide optimum service delivery in order to create a good quality of
life for every citizen. Attempts should thus be made to improve the public service‟s
performance and to minimize the negative consequences of actions. This implies that

21
the public service activities should be directed to satisfy the public‟s needs and to
resolve the public‟s legitimate concerns” (Naidoo, 2004).
2.7.1 TRANSFORMATIVE AFRICAN LEADERSHIP AND GOVERNANCE
FRAMEWORK
It is necessary to improve the leadership and governance framework in South Africa and to
accelerate service delivery at the pace that is needed to address service delivery backlogs,
especially in previously disadvantaged communities. The complexity of service delivery in the
South African public service cannot simply rely on a particular approach or strategy to meet
its objectives, but rather must adopt several parallel approaches and strategies, which should
be adaptable to each situation in South Africa (Kuye, 2004).
In this regard, appropriate attributes of Western and traditional African leadership and
governance approaches ought to be integrated within the public administration framework to
promote an ethos of service delivery in the South Africa public service. Naidoo (2004:13)
suggested that a unique South African leadership and governance framework had not yet been
explored for possible adoption in the South African public service. In this regard, Setsabi
(2001:2) argued that traditional African leadership and governance were values not yet
integrated within the current framework of the South African public service.
According to Kuye (2004:9), a shift is necessary to ensure that improved service delivery is a
dynamic social activity in which socio-economic, culture and political imperatives are
integrated within the leadership and governance framework in the South African public
service. It is important for the South African public service to take cognisance of socio-
economic, cultural and political perspective of both their employees and the recipients of these
services. Setsabi (2001:11) pointed out that a leadership and governance framework that is
not focused on a society‟s political, social and cultural imperatives, is doomed to fail. Van
Niekerk et al., (2001:115), argued that the public service cannot be value-free.
The consideration of these imperatives is important, to create a conducive environment for the
improvement of public service delivery.

22
2.7.2 STRENGTHENING NETWORKS AND PARTNERSHIPS
According to Fraser-Moleketi (2005a) no single actor has all the knowledge and information
required to solve the complexities of service delivery in South Africa. In this regard, Hackman
(1986:104) indicated that leaders ought to maintain and increase successful partnerships inside
their organizations and increasingly beyond them to promote service delivery. The South
African public service already uses networks to a limited degree to deliver services to South
African society, including to service recipients from previously disadvantaged communities.
However, more needs to be done to improve service delivery in South Africa (Chandu, 2004).
According to Naidoo (2004: 309), the South African public service should, therefore
encourage interactions and varied strategies for the improvement of service delivery. In this
way, governance in the South African public service can become a more encompassing
phenomenon because it will embrace not only the public service but also informal and non-
governmental mechanisms. This should result in co-operation between multiplicities of actors
towards service goals.
There are several types of partnerships that can be entered into for the purpose of improving
service delivery by the South African public service (Van Niekerk, van der Waldt and Jonker,
2002: 252). Naidoo (2004:311) argued that policy outcomes should not only be the product of
actions by the national government in South Africa. National government should actively
interact with provincial and local government, the voluntary sector, the private sector and the
citizens of the country, and in turn these sectors should interact with one another. The
involvement and inclusion of all spheres of the South African public service should be
improved and strengthened, to facilitate ownership of processes, which will heighten the
chance of success (Naidoo, 2004).
According to Miller (2005) stakeholder participation and involvement in improving public
service delivery in South Africa, is crucial. The South African public service should be
designed to facilitate active involvement and participation at all levels. The foundations of
democracy are based on the ability of political leadership to deliberate and consult with the
electorate on issues that affect them. Ozaralli (2003) argued that the public service should

23
develop action strategies in collaboration with those who either have a direct stake in the
policy outcomes or who play pivotal roles in the policy implementation process. All
stakeholders in the South African public service should have a say in the way in which
departments develop and implement policies. According to Cloete and Wissink (2000), in
order to increase the confidence in the policy itself, it is also important for the South African
public service to create a sense of ownership for that policy for those who are to lead the
delivery process. Within the departmental context, however, the junior public-masking process
is characterized by a top down approach (Naidoo, 2004).
In the process of providing a service, all public servants and communities in South Africa
should be simultaneously empowered to develop their own solutions to their specific local
challenges (Fraser-Moleketi, 2005b). All stakeholders, including the general public and
communities should participate in defining the content and quality of public services. The
need exists to continuously review the manner in which government executes its activities in
the interest of the community it serves. Deliberation and consultation can assist in ensuring
that the true needs, wants and desires of people are identified and correctly prioritized (Fraser-
Moleketi, 2005a).
According to Koopman (1993) this suggests the importance of a mindset that values diversity,
and the need for departmental frameworks that facilitate the full involvement and participation
of the diversity of stakeholders. It is important that innovations are contextually relevant, and
that they address real service delivery issues and challenges (Fraser-Moleketi, 2005a). These
issue and challenges ought to include finding more cost-effective ways of delivering service to
all citizens, at acceptable levels of quality. The public service should ensure that accessing
service is both easy and convenient, especially in previously disadvantaged communities
(Batho Pele- „People First‟ White Paper on Transforming Public Service Delivery, 1997). The
users of any form of public service should not merely be passive recipients of goods and
services, but rather ought to be the key active engineers, authors and implementers of service
delivery improvement (Niekerk, van der Waldt and Jonker, 2002). Naidoo (2004) suggested
that excellent service delivery by government ought to foster a spirit and sense of
responsibility, ownership and accountability for service recipients and users.
24
2.7.3 CONCLUSION
Service delivery performance in the South Africa public sector is either constrained or
enhanced by how well its leadership and governance framework is geared to its policy
objectives. The clearer and more appropriate the leadership and governance framework is, the
more likely it is that the South African public service departments will achieve their expected
service delivery outcomes. An integrated framework consisting of the relevant attributes of
leadership and governance could be developed for possible adoption by the South African
public service. The transformative African leadership and governance framework proposed in
this literature review serves as a vehicle to improve service delivery by the South African
public service. However, numerous weaknesses and challenges exist that must be addressed to
improve service delivery in the South African public service. This framework should take
cognizance of the unique political, social, economic and cultural diversity in the South African
context. The ultimate objective is to transform the South African public service into an
innovative, flexible and responsive organization that has solutions and continually seeks to
enhance service delivery.
25
CHAPTER 2 (Part II)
DEPARTMENT OF HOME AFFAIRS
2.8 BACKGROUND
The Ministry of Home Affairs was established according to the prescripts of Chapter Three of
the Constitution of the Republic of South Africa. The Ministry was given national competency
on all matters that relate to the identification of persons as citizens of or non-citizens who
reside in or visit the Republic. The Ministry has executive authority over the Department of
Home Affairs (DHA), the Independent Electoral Commission (IEC), the Government Printing
Works (GPW), the Film and Publication Board (FPB), the Immigration Advisory Board and
Refugee Affairs Appeal Board (Annual Report 2005/06).
During 2005/06, the Ministry committed itself to dedicating its time and resources to ensuring
that the Department of Home Affairs improved its service to the millions of South Africans
and foreigners that interacted with the Department. Change in the Department of Home
Affairs is irreversible. The turn-around strategy that was devised in September 2003 planned
to transform the Department of Home Affairs into an effective 21st Century provider of service
to South African citizens and clients.
The turn-around strategy was ambitious and aimed to create decisive interventions in all areas
of work and at all levels of the organization. It focused on service delivery that is effective,
efficient and convenient to clients. This mindset is embedded in the functioning of the
Department and fully incorporated in all aspects of strategy and operations. The turn-around
strategy resulted in a wide range of projects designed to address specific weaknesses, but was
hampered by a lack of integrated planning, delivery and coordination. The need was also
identified to strengthen management systems and capacitate managers to ensure effective
planning, resource allocation, monitoring and evaluation and accountability (DHA Annual
Report 2005/06).

26
According to the Strategic Plan (2007/08), The Department of Home Affairs is, in essence, a
service delivery department. The delivery of outputs relating to the core business of the
Department is critical for the fundamental transformation of the Department. The impact of
core business therefore, has a direct influence on the quality of service delivery to customers.
The National Immigration Branch was established in 2005 to improve the quality of services
rendered in the sphere of immigration. The overall transformation of Civic Services in the
ensuing years had been identified as the next critical intervention required by the Department
(Department of Home Affairs Strategic Plan 2007/08/09/10)
The Department has, over recent years, been severely hampered in its quest to deliver world
class service to its entire customer base due to its lack of capacity. The 2005/6 financial year
has proven to be no exception. A concerted effort will therefore be made in the 2006/07/08
financial year to address this critical issue. The focus will be on capacitating especially
regional and district offices in terms of number of competencies (Department of Home Affairs
Strategic Plan 2007/08/09/10.)
2.8.1 SERVICES OFFERED BY DEPARTMENT OF HOME AFFAIRS
According to the Strategic Plan 2007/08- 2008/09, and in accordance with its mandate, the
Department of Home Affairs is empowered to execute the core functions of Civic Services and
Immigration. The DHA aims for excellence in serving its customers so that these core
functions will be delivered in accordance with the Department‟s Statement of Standards. The
set service standards of the Department will be reviewed following the business process re-
engineering initiatives, which form part of the fundamental transformation of the Department.
2.8.2 THE DEPARTMENT OF HOME AFFAIRS CORE FUNCTIONS
The core functions of the Department of Home Affairs include the following:
the National Population Register (NPR);
Management of records of citizenship;
Travel documents such as passports and identity documents;
Admission;
Inspectorate;

27
Refugee affairs;
Information co-ordination;
Policy directives, and
Counter -xenophobia.
According to the Strategic Plan 2007/08- 2008/09, the mandates of the Department are
embedded in legislation, as well as other policy documents. In order to fulfils its mission, the
Department executes or participates in the execution of this following mandate (services):
Births and Deaths Registration Act, 1992 (Act No. 51 of 1992), as amended;
Regulations made in terms of the Births and Deaths Registration Act;
Transfer of powers and duties by the Director-General in terms of the Birth and Deaths
Registration Ac, 1992; Marriage Act, 1961 (Act No. 25 of 1961), as amended;
Regulations made in terms of the Marriage Act, 1961;Civil Union Act, 2006 (Act no.
17 of 2006); and Regulations made in terms of the Civil Union Act, 2006.
Identification Act, 1997 (Act No. 68 of 1997), as amended ; Regulations made in terms
of the Identification Act, 1997.South African Citizenship Act, 1995 (Act No.88 of
1995), as amended; Regulations made in terms of the South Africa Citizenship Act,
1995; and Delegations in terms of Section 22 of the South African Citizenship Act,
1995,
South Africa Passport and Travel Documents Act, 1994 (Act no. 4 of 1994), as
amended; and Regulations made in terms of the South African Passport and Travel
documents Act, 1994,
Refugees Act, 1998 (Act No.130 of 1998);
Immigration Act, 2002 (Act no. 13 of 20023), as amended; and Regulations made in
terms of the Immigration Act, 2002,
Promotion of Access to Information Act, 2000 (Act no. 2 of 2000), as amended;
Regulations made in terms of the Promotion of Access to Information Act 2000,
Public Holidays Act, 1994 (Act no. 36 of 1994), as amended Imprint Act, 1993 (Act
No 43 of 1993), as amended,

28
Films and Publication Act, 1996 (Act No,65 of 1996), as amended; and Regulations
made in terms of the Film and publication Act, 1996 (Strategic Plan 2007/08-
2008/09).
2.9 WHAT IS BATHO PELE?
According to the Batho Pele Handbook-(DPSA Batho Pele Handbook: 2002-2004), Batho
Pele is a Sotho translation for “People First”. It is an initiative to encourage public servants to
be service-orientated, to strive for excellence in service delivery and to commit to continuous
service delivery improvement. It is a simple and transparent mechanism, which allows citizens
to hold public servants accountable for the level of service they deliver (Department of Public
Service and Administration, 2002).
Batho Pele is not an “add-on” activity. It is a way of delivering service by putting citizens at
the centre of public service planning and operations. It is a major departure from a
dispensation, which excluded the majority of South Africans from „a better life for all‟ through
service, products and programmes of a democratic dispensation. The vision and mission exist
to instil a sense of common purpose and energize members of an organization towards action.
The Batho Pele vision and mission emanated from the realization that government should
transform service delivery mechanisms to meet the needs of citizens. In this context, the
following vision and mission statements were developed to energize the transformation efforts
of public servants
“To continually improve the lives of the People of South Africa by a transformed
public service, this is representative, coherent, transparent, efficient, effective,
accountable and responsive to the needs of all”
“The creation of a people-centred and a people-driven public service that is
characterized by equity, quality, timeouseness and a strong code of ethics” (Public
Service Commission, 2001)
2.9.1 REVITILIZATION OF BATHO PELE
In order for Batho Pele to succeed, the organizational culture has to be changed to
accommodate Batho Pele as a way of life. According to Ngema (2004: 204), Batho Pele

29
should be thought of as a set of mutually reinforced interventions to transform all levels of the
organization, with a view to becoming a public service that puts people first. Ngema (2004:
205) suggests that South Africa cannot become that which it needs to become unless it does
that which needs to be done.
According to Fraser-Moleketi (2005b), no businesses can operate without customers and there
cannot be government, if there are no people. The Batho Pele strategy is aimed at transforming
the culture and ethos of the public service to improve service delivery. The focus areas of the
campaign included “taking service to the people”, “knowing your service rights” and setting of
management systems to monitor performance. The eight Batho Pele principles of consultation,
service standards, access, courtesy, information, openness and transparency, redress and value
for money, are aimed at delivering a strong message of government‟s commitment to citizen-
centred approach to service delivery (Department of Public Service and Administration,
2003). It is clear that the absence of high level policy skills and middle management
governance and management skills have been key factors that have resulted in the lack of
implementation of “Batho Pele”. In addition the representation of women in middle
management must be improved (Fraser-Moleketi, 2005b).
A service delivery conference held in Stellenbosch during 2003 reflected on the frustration
caused by poor delivery to victims of crime by service providers. These problems were largely
due to process problems within the criminal justice system and inefficient investigations. The
problem with the criminal justice system‟s service delivery is not about a lack of willingness
to render service to the victim of crime, but more about rendering effective and efficient
service to the victim per se. The criminal justice system‟s methods and levels of delivery have
yet to align themselves with the spirit of the “Batho Pele” principles (Van Wyk, 2002).
According to Mbeki (State of the Nation address Part 1 of 2003), in his second term of office,
service delivery was to be the focus of his attention. One lesson learned by the first democratic
government was that structures, while important, do not guarantee successful integration.
Good integration requires well-functioning processes and the effectiveness of processes
depends less on structure than on the commitment of decision-makers and managers to the

30
goals of co-ordination. Despite significant achievements in policy development, growing
unemployment, income poverty and inequality and shortcomings in service delivery have
fuelled criticism about the effectiveness of government policies to transform the conditions of
the poor citizens of South Africa (Mbeki, 2004).
The success of the new reforms depends both on the substance of the policies and the ability
of the government to implement them efficiently. A significant gap between the adopted
policies and their successful implementation can potentially explain some of the problems
experienced with the delivery of the government‟s main transformation objectives. A survey
conducted by Johannesburg Business Day in 2003 revealed that a third of the respondents felt
that Government was not delivering on its promises. In the run-up to the 2004 elections the
ANC declared that “crack teams” whose main responsibility was to monitor the
implementation of government policy and service delivery would be set up. Money was not
the problem, the capacity to implement policy was.
Fraser-Moleketi (2005b) stated that key elements of bureaucracy were not helping to deliver
more and better services to citizens. In too many areas, Batho Pele was not working. Specific
problems areas identified included:
Staff members‟ attitude when dealing with people
Training specific staff on human relations, making everyone accountable for their
behaviour.
The Department was beset by attitudes like “Buya ngenyanga elandelayo mama”
(come back next month mama) (Natal Witness, 2004 p.5).
It was necessary to create an environment that was user- friendly, accessible and
efficient. The one-stop shop for community services (multi purpose centre) as part of
the integrated service delivery aimed at providing a wide range of government service.
Success depends on staff co-operation; hard work and basic care management.
2.9.2 BATHO PELE SERVICE STRATEGY
Batho Pele strategy on service delivery was developed to meet the following strategic
objectives (http://www.dpsa.gov.za/batho-pele/beliefset.asp, accesses 2008/07/16).

31
To introduce a new approach to service delivery which puts people at the centre of
planning and delivering services
To improve the face of service delivery by fostering new attitudes such as increased
commitment, personal sacrifice and dedication;
To improve the image of the public service.
It has been noted that many public servants have not yet internalized Batho Pele as part of
their day-to-day operations when providing service to members of the public. In order to deal
with this, the Department of public service and Administration has developed a “Batho Pele
Revitalization Strategy” the aim of which it is to inculcate the Batho Pele culture among
public servants and to improve service delivery within the public service.
(http://www.dpsa.gov.za/batho-pele/beliefset.asp).
2.9.3 SUMMARY OF BATHO PELE
The Batho Pele principle and ethos enables the public service to serve its citizens efficiently
and effectively. Public service reforms have improved accountability and service delivery on a
national and provincial level. The single biggest impediment to service delivery appears to be
an absence of policy and management skills (Public Service Commission, 2000:2).
The success of the new reform depends both on the substance of the policies and the ability of
the government to implement them efficiently. On the one hand, the significant gap that exists
between the adopted policies and their successful implementation can potentially explain some
of the problems experienced with the delivery of government‟s main transformation
objectives. The drive to identify scarce/ critical skills and recruit and retain staff with the skills
that are needed, is a major stumbling block to be overcome within the public service.
However, it can be overcome with effective input from private/public partnership and SETA‟s,
and great progress would then be made in addressing service delivery backlogs within a
changing service delivery system (Public Service Commission, 2000:3).
The public service should constantly change and be amenable to change, to manage and
implement Batho Pele. Only when the legitimate objectives and goals have been identified,

32
will service delivery be affected in South Africa. The focus on service delivery needs to be
more widely published and conveyed at grassroots level in simple and understandable terms.
The challenge is to ensure that the under-educated and the poor know where to get access to
the relevant services and when the system fails, where they can find a remedy to deal with
ineffective or bad service (http://www.dpsa.gov.za/batho-pele/beliefset.asp).
Batho Pele, if implemented and managed properly, enables an effective public servant to
provide a world-class service. The Batho Pele policy can only enable the public service within
an environment that is constantly aware of its challenge and keeps abreast of technological
changes and modernization. (http://www.dpsa.gov.za/batho-pele/beliefset.asp, accesses
2008/07/16).
2.10 DHA: THE IMPLEMENTATION OF SERVICE AND BATHO PELE
According to its Annual Report 2005/06, the Department of Home Affairs implemented a
number of initiatives during 2005 to ensure adherence to the Batho Pele principles. The
challenge for the future is to strengthen and sustain adherence to Batho Pele in the future. The
initiatives referred to are:
The rollout of the “Client is Always Right” campaign;
The introduction of flexible working hours and internal and external signage for all
DHA offices;
The launch of 67 state of the art mobile units to improve access to services. Sixty-four
units were deployed in 2005/06. The deployment of an additional 42 mobile units will
commence in the 2006/07/08 financial year.
The training of officials to take place in line with the ten-year rollout plan of the
Department;
A Pilot Client Service centre (CSC) is in place. The process of converting the pilot
CSC into a 24-hour operation is planned and will be looked into in earnest in the
2006/07 financial year.
The availability of the DHA services in 58 of the 66 Multi-Purpose Community Centre
(MPCCs) in the country. This is critical in making the DHA service more accessible to
citizens.
33
The implementation of these service delivery issues has unfortunately only led to very slight
improvements in service delivery thus far. The need, which has been identified as the most
pressing, was the front-desk service where improvements will mean lower return rates and a
more positive perception of the Department by clients. To this end, the identification of
suitable front-desk staff and an associated training programme is critical (Strategic Plan
2007/2-2008/9).
According to the Strategic Plan 2007/2-2008/9, one of the main DHA strategic objectives is to
establish a culture of Batho Pele and appropriate service delivery standards and service
delivery plan with effective structures and measures in place to manage, co-ordinate and
monitor service delivery and combat corruption. An additional aim is to address blockages and
shortcomings systematically.
According to the report on the Department of Home Affairs Batho Pele and Management
(2008), the Department‟s practices were evaluated by comparing them with best practice
standards. Comparing its service delivery improvement practice with the principles and
requirements laid down in the White Paper assessed the Department‟s compliance with Batho
Pele policy.
2.10.1. OUTPUT PERFORMANCE OF THE DEPARTMENT (MEASURING BATHO
PELE IN DHA) (http://www.dpsa.gov.za/batho-pele/beliefset.asp, accesses 2008/07/16).
The performance of the Department‟s various service departments will be outlined in the
sections below.
2.10.2 CIVIC SERVICES
The Department performed below standards when measured against its own published service
standards.

34
2.10.3 MIGRATION
The Department experienced serious difficulties in delivering products within the time frames
announced by the Minister. The Department, moreover, did not rigorously measure its
performance against published service standards.
2.10.4 STRATEGIC CHALLENGES FACED BY THE DEPARTMENT
According to the Strategic Plan (2007/2-2008/9), the Department was faced with the
intractable problem that the demand for its services was continually increasing while its
budget remained unchanged in real terms. The setting up of service delivery points across the
country is a very costly exercise, so the Department will have to carefully plan the setting up
and distribution of these services delivery points, the work processes carried out at these
points and its strategies for the tracing and removal of illegal aliens. Migration work processes
are largely determined by migration policies. It is the policy that determines the number of
checks to be done and the factors to consider before a permit can be issued. The Department
lacks the capacity to apply the policy effectively. Capacity is used here to describe the ability
of the administrative processes and the staff involved in the processes to take complex
decisions (DHA Strategic Plan, 2007/2-2008/9).
2.10.5 UTILIZATION OF STAFF
According to Department of Home Affairs Ikhaya News Letter (2007:1-7), it is imperative that
each staff member is utilized optimally and that the workload should be spread evenly
amongst the available staff. The highest area of wastage in the Department occurs with the
waste of staff time or the inefficient utilization of staff time. The Strategic Plan 2007/2-2008/9
stated that these inefficiencies are caused partly by fluctuations in volumes of different types
of applications for official documents and partly by the Department‟s inability to move
resources to offices or sections where volumes are the highest. According the report published
in the Ikhaya (2008), work arrangements should be as flexible as possible and the capacity
should be created to move staff to components where inflow of work is the highest or where
backlogs are building up (or alternatively, to re-assign work to under-utilized components).
The Department has already recognized that the multipurpose deployment of staff should be
considered (Ikhaya 2007).

35
2.10.6 DHA IMPLEMENTATION OF THE BATHO PELE WHITE PAPER
According to the Report on Home Affairs Batho Pele and Management Audit Investigation
(2000:2), the aim of the White Paper was to establish the nature and extent of irregularities
and inefficiencies in management and the causes thereof and to come up with
recommendations that would assist the Department of Home Affairs to perform its functions
in a more efficient and effective way.
2.10.6.1 DHA IMPLEMENTATION OF THE BATHO PELE WHITE PAPER
The Department does not consult with customers about service and service
standards;
Standards are set, but actual performance is not rigorously measured against these;
The Department needs to increase access to its service;
Specified courtesy performance standards need to be measured;
Information needs to be provided about the service of the Department;
The Department has failed to have a formal mechanism for dealing with
complaints;
Unable to report citizens registered with their ID books, except through its annual
report;
The Department does not comply with the productivity improvement programme
and does not measure its productivity (DHA Strategic Plan 2007/2-2008/9)
The Department will need to embark on the re-engineering of all its business processes to
enable it to deliver an acceptable level of service within a limited budget. The required
efficiency improvements will not be achieved by incrementally improving existing processes
without fundamentally rethinking the way the Department carries out its business. For
example, any fundamental re-engineering of the business processes of the migration
component will probably also requires adjustments to the migration policy. Without such
adjustments, only small incremental improvements in processes and cost savings will be
possible (DHA Strategic Plan 2007/2-2008/9).

36
2.10.7 CHALLENGES ENCOUNTERED IN SERVICE DELIVERY AT DHA
According to the DHA Annual Report (2005-2006), the following are the main challenges
faced by the Department of Home Affairs:
Inadequate capacity to deliver satisfactory services
The failure to identify the right type of frontline staff and
The turnaround times for filling of posts due to natural attrition and corruption-related
dismissals are too long.
It is critical for the Department to replace outdated systems while taking interim measures to
improve delivery in the short-term. According to the DHA Annual Report (2005-2006), to
effectively combat corruption, the Department needs to build corruption-recognition measures
into major strategies. From a managerial perspective, it is important to improve the
management structure and processes, including processes such as monitoring and evaluation.
Also, the lack of pro-active media interaction and inadequate and untimely responses to
incorrect media reporting or coverage, are damaging to the Department‟s public image.
The Department acknowledges that there are unregistered citizens, especially in the rural areas
of the Republic of South Africa. A large number of citizens have complained about incorrect
personal particulars, which have been recorded on the official documents provided by the
Department (Ikhaya, 2008 2-5).
In August 2004 the Department of Home Affairs, the South African Police Services and
National Intelligent Unit launched the Fraudulent Marriages and Registration of Customary
Marriages campaigns jointly. In the Strategic Plan (2007/2-2008/9) it is reported that the
Department received 212 399 marriage enquiries of which a total of 4 455 were identified as
allegedly fraudulent marriages. Further investigations into these suspected fraudulent
marriages revealed that 2972 were indeed fraudulent marriages, which had been conducted
without the consent of the complainant. These marriages were subsequently expunged from
the national population register. The alleged fraudulent marriages of 442 citizens could not be
expunged from the national population register as investigations revealed that the
complainants had indeed signed the marriage register, thereby consenting to marriage (DHA
Annual Report, 2005-2006: 2-4).

37
2.10.8 ILLEGAL FOREIGNERS AND REFUGEES
An estimated 167 137 illegal foreigners cross South Africa‟s borders every month, and due to
logistical or legal hindrance to deportation, only a very small percentage of these illegal
foreigners are deported,. Although bilateral talks on the issue have taken place between RSA,
three SADC countries namely Zimbabwe, Mozambique and Lesotho, these are not bearing any
fruit thus far (DHA Annual Report, 2005-2006: 3).
2.10.9 REFUGEE AFFAIRS
A both a lack of leadership and a lack of capacity at management level and a lack of integrated
systems characterize the Refugees Affairs section. These challenges have played a significant
role in the backlogs that have now resulted in many asylum applications being overly delayed
(DHA Annual Report, 2007-2008:5).
2.10.10 XENOPHOBIA
The Department has failed to come up with a counter-xenophobia strategy that will also focus
on awareness programmes. During the months of April and May 2007 the country was awash
with Xenophobia and the department was hard-pressed to find solutions. Foreigners are still
scattered all over the cities and the issue of the reintegration of foreigners is failing (DHA
Annual Report, 2007-2008: 6).
2.10.11 OTHER CHALLENGES
According to the Ikhaya (2008), at the portfolio committee meeting that was held in
parliament in March 2008, the members raised the following as other major challenges in the
DHA:
South Africa‟s borders are too porous and the management of refugees had become an
impossible task;
There is widespread corruption involving the ID documents of deceased persons;
There is widespread recording of false marriages of South African citizens to
foreigners who were complete strangers;
The impact of the transformation plan on the 2010 Soccer World Cup events;
38
There is a high number of learners at high schools without ID documents and the
effectiveness of the mobile offices needs to be improved;
The processing systems are inefficient and the turnaround time for document
applications is slow;
The long queues at offices continue to be a major problem at the DHA; and
Frontline staff is not properly trained and are largely responsible for poor customer
service delivery.
2.11 CONCLUSIONS
The Department of Home Affairs implemented a number of initiatives during the 2006/07
financial year to improve services. There is a definite need to pursue even more efficient ways
of providing improved front desk services at Home Affairs offices. The years 2008-2015 will
be spent on the roll out of a „track and trace‟ system to the rest of the offices throughout the
country for all applications. This should begin to alleviate the interminably long queues,
clarify the status of ID applications and generally allow for better accountability to the client
by the front desk staff. It remains critical that the Department of Home Affairs focus on
making improvements that continue to put the client at the centre of service delivery
The assistance of the Support Intervention Team in this regard has been acknowledged and
their recommendations are being taken into account as explained in the introduction to this
document. The current Strategic Plan has been structured according to business units and
linked to both performance agreements and the budgets that are allocated to senior managers.
However, accountability will be further strengthened when the budget is restructured in line
with the recommendations of the Support Intervention Team so that each element of the core
business has its own programme: Civic Services NIB and Service delivery.
The objectives in the current Strategic Plan are now more clear and the timeframes more
realistic, which enables more effective accountability through performance management and
monitoring and evaluation.

39
CHAPTER THREE
RESEARCH METHODOLOGY
3.1 INTRODUCTION
The purpose of this chapter is to discuss the research methods employed in obtaining the
results for the study. This includes a discussion of the objectives of the study, the research
instruments, the sampling technique and the data collection as well as the statistical technique
used to analyze the results. The research design was chosen because it acknowledges that
research into the subject of customer service is relatively unresearched in the context of the
South African consumers of public services. It is well known that customer satisfaction has a
positive impact on a firm‟s profitability for a number of reasons such as loyalty, future
purchases and behaviours. This, however, is not exhaustive, hence the continued need for
studies such as this one. A number of research questions are posed in this study and it requires
that an exploratory study be conducted in order to understand consumer behavioural trends
followed by the perception of consumer to customer service.
3.2 OBJECTIVE OF THE STUDY
This is a causal study as the main reason for conducting the study is to determine the variables
that are responsible for the poor service delivered and to understand if people who can afford
to pay for a better services are willing to pay for such service if DHA would offer an exclusive
better and faster service for those individuals who can afford to pay extra costs for normal
service offered at DHA such as ID, Passport, Birth certificates etc.
By answering the questions below, this study aims to contribute towards an understanding of
the organization‟s (the Department of Home Affairs) lack of customer service.
The objectives of this research are to:
Determine customer satisfaction levels with the service provided by the DHA;
Determine which services are commonly used by the DHA customers;

40
Differentiate the similarities and variances in service offered to different age, gender
and race groups;
Determine the average time customers spend on travel and waiting for services; and
Determine how service at the DHA could be improved;
The study is important for the public sector, especially those departments who are striving to
be more customer-orientated and deliver better and faster services to all the citizens of this
country. This study is meant to benefit the consumer and the organizations because a better
understanding can lead to better communication, thereby bringing about a change in the
customer satisfaction and customer service levels.
3.3 SAMPLING TECHNIQUE AND DESCRIPTION OF THE SAMPLE
According to Ngcobo (2006: 38), sampling is the process of selecting a sufficient number of
elements from the population, so that a study of the sample and an understanding of its
properties or characteristics would make it possible to generalize such properties or
characteristics to the population elements. Ngcobo (2006:40) explains that the theory behind
sampling is: “If you can select a sample that is as close as possible to being representative of
the population, then any observation you can make regarding that sample should also be true
for the population.”
The two basic types of sampling design that exist are: probability and non-probability
sampling. Ngcobo (2006: 40) explains that: In nonprobability sampling, the researcher has no
way of forecasting or guarantee that each element of the population will be represented in a
sample (Leedy and Ormarod (2005:206).
With probability sampling Cooper and Schindler (2001), indicated that simple random
sampling is often impractical due to the difficulty or impossibility of obtaining a full
population list (sample frame), among other things. A more efficient sample in a statistical
sense is one that gives precision (standard error of the mean or proportion) with a smaller
sample size. Cooper and Schindler (2001) also described four alternative probability sampling
approaches, namely systematic, stratified, cluster and double sampling.

41
It is important that the sample that is selected should be representative of the population.
When this is the case, then the result can be generalized to the larger population through
inferential statistics. Therefore, the ideal selection for this research should be conducted in
such a way that every person in the population has an equal chance of being selected. In this
method, participants of the entire population of elements are divided into sub-population or
strata and the elements are then selected separately from each stratum. According to Cooper
and Schindler (2001) there are three reasons why a researcher chooses a stratified random
sample.
To increase a sample‟s statistical efficiency;
To provide adequate data for analyzing the various populations;
To enable different research methods and procedures to be used in different strata; and
Stratifying customers on the basis of life stage, income levels, buying patterns and stratifying
companies or organization according to size, industry, profits and so forth is a sampling design
technique. Stratification is an efficient research sampling design as it provides more
information with a given sample size. With the ideal stratification, each stratum is internally
homogeneous and externally heterogeneous with other strata. The sample that is to be used in
this study, are the clients of the Department of Home Affairs. This sample includes members
of all race groups, a representative of the population as illustrated in example below.

42
Percentage
Gender Male 69%
Female 31%
Race African 69%
Coloured 2%
Indian 18%
White 12%
Age 26-35 years 51%
36-45 years 33%
46 years and above 16%
Table 3.1 Composition of Sample according to Age, Gender and Race
3.4 RESEARCH INSTRUMENT
Personally administered questionnaires will be distributed via Questionpro.com and the GSB
MBA students will receive an email that will have a link address to the questionnaires office in
Durban. There will be a brief explanation to clients outlining the objectives of the study and
also informing the respondents that they are under no obligation to fill in the questionnaire.
Anonymity will be assured to respondents and those who are unhappy to divulge their
personal details will be allowed not to do so, even though each questionnaire will have the
section that requires personal information.
The purpose of conducting this type of survey is that it costs less in terms of both time and
money. Clients will have the freedom to fill in the questionnaire while standing in queues,
which allows them to relax, take their time and think properly before the answering the
questions and there will be no pressure to complete the form in few minutes. Customer
services influence the behaviour and satisfaction of the clients, therefore a good measure of
customer satisfaction with service at Home Affairs would be the total number of clients who

43
say they are happy with the quality of service they received at Home Affairs. The questions
were planned to enable the study to achieve the objectives outlined earlier.
The questions were divided into the following dimensions:
Demographic questions- to profile the respondents according to age, gender and
race;
DHA offices- to determine which office they were visiting;
Income – to determine their income and their willingness to pay extra for better, faster
and different service compared with the current service;
Occupation- to determine a better service for professionals who would be willing to
pay more because they had to get back to work or would be travelling away from
home;
Distance travelled – to determine the distance that clients travelled so that more
service points could be opened e.g. open an office in Umlazi so that people from
Umlazi would not have to travel to Durban for an ID application;
The question types that were used varied from multiple-choice (both single and multiple
responses) to Likert-type questions with one open-ended question.
3.4.1 ADMINISTRATION OF QUESTIONNAIRE
The department of Home Affairs refused me permission to conduct the research at DHA
offices due to a personal dispute between the candidate and DHA which the supervisor and
research co-ordinator were aware of. On the guidance of the supervisor MBA students were
chosen as they have the potential to afford a “paid for” service. Personally administered
questionnaires will be distributed to Questionpro.com. MBA students from UKZN will receive
the questionnaire through the links on the GSB website.
3.4.1.1 Advantages of using such method to administer questionnaires
This method is voluntary; the response rate when one has such a captive audience is
typically high, and often 100%.

44
The researcher can always answer questions during the filling of questionnaires to his
or her classmates.
3.4.1.2 Disadvantages of using this method
Mailing questionnaires to people one doesn‟t know is quite another matter. Potential
respondents have little or nothing to gain by answering the returning the questionnaire
and so many of them do not.
As a result the typical return rate for mailed questionnaire is 50% or less and in recent
years it has steadily declined (Leddy & Ormorod, 2005).
3.4.2 There are two types of research instruments: Qualitative and Quantitative research
The qualitative research approach serves one or more of the following purposes (Peshkin,
1993):
Descriptive. They can reveal the nature of a certain situation, setting, processes,
relationships, systems, or people.
Interpretation. They enable a researcher to (a) gain new insight about a particular
phenomenon, (b) develop new concept or theoretical perspectives about the
phenomenon, and/or discover the problem that exist within the phenomenon
Verification. They allow a researcher to test the validity of certain assumption, claims,
theories, or generalizations within real-world contexts.
Evaluation. They provide a means through which researcher can judge the
effectiveness of particular policies, practices or innovations
3.4.3 Qualitative research
This study used a quantitative research. Quantitative research identifies the characteristics of
an observed phenomenon or exploring possible correlations among two or more phenomena
(Leddy & Ormorod, 2005). In every case, descriptive research examines a situation as it is. It
does not involve changing or modifying the situation under investigation, nor it is intended to
determine cause and affect relationships. Qualitative research method is effective when using
face to face and Telephone interviews or Questionnaires.

45
3.4.3.1 This study used questionnaires (quantitative research instrument) as a method of
collecting data, for the following reasons: Advantages
This study was conducted in UKZN to the (Graduate School of Business) GSB
students;
Questionnaires are most easily to distribute by emails as they were sent via email to all
GSB students current and former students to target the an acceptable number of
responses and can be sent a thousand miles away;
Participating MBA students can respond to questionnaires with assurance that their
responses will be anonymous and so they may be more truthful than they would be in a
personal interview, particularly when they are talking about controversial or sensitive
issues; and
Questionnaires may save researchers travel expenses and email is typically cheaper
than a lengthy long-distance telephone call, hence this study was not sponsored.
3.4.3.2 Questionnaires may also have drawbacks (Disadvantages)
Typically the majority of people who receive questionnaires do not return them;
They may be a low return rate and people who do return them are not necessarily
representative of the original selected sample;
People who are willing participants in a questionnaire study, their response will reflect
their reading and writing skills and, perhaps, their misinterpretation of one or more
questions; and
Thereby eliminating other questions that could be asked about the issue or
phenomenon in question, the researcher is apt to gain only limited, and possible
distorted, information (Dowson & McInerney, 2001).
3.5 STATISTICAL ANALYSIS OF THE DATA
The data will be analyzed by using the SPSS statistical software package. Responses will be
converted from categorical data to nominal data, to enable the data collection to be partitioned
into mutually exclusive and collectively exhaustive categories. This data will then be captured
into the SPSS data editor window to enable an analysis to be performed.

46
3.6 STATISTICAL ANALYSIS OF THE QUESTIONNAIRE
An analysis of the questionnaire commenced with the demographics section, where the data
will be analyzed using the frequency percentage. This will be done to determine the pattern of
distribution of the respondents into the five strata listed in Section 3.4. This process
transformed the data into information that could be used throughout the other variables,
especially to cross-tabulate between other variables.
3.7 CONCLUSION
In this chapter the research method to be employed in obtaining the results of the study has
been discussed. This included a discussion of the basic research design, the sampling
technique and the data collection method as well as the statistical techniques used to analyze
the results. The degree with which the research question will be crystallized required an
exploratory study design to glean a comprehensive understanding of customer service and
consumer satisfaction especially in government departments. This is a qualitative study that
attempts to describe the likely characteristics of the population by making inferences from the
sample characteristics.
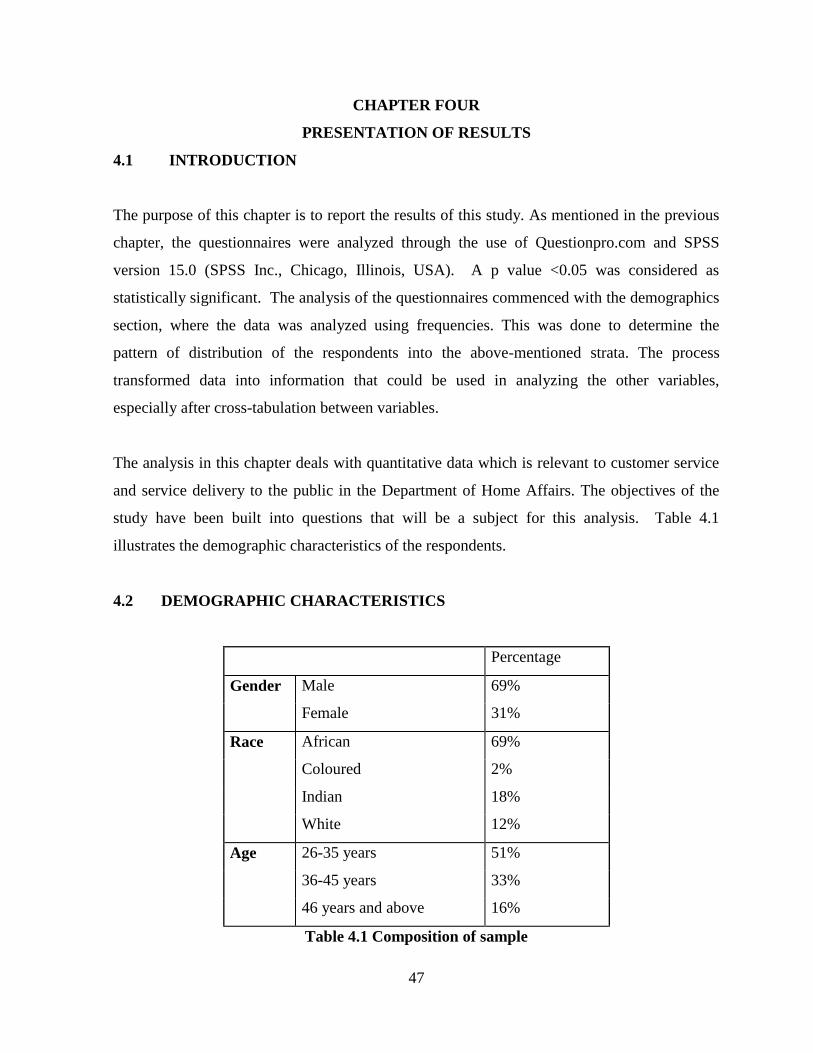
47
CHAPTER FOUR
PRESENTATION OF RESULTS
4.1 INTRODUCTION
The purpose of this chapter is to report the results of this study. As mentioned in the previous
chapter, the questionnaires were analyzed through the use of Questionpro.com and SPSS
version 15.0 (SPSS Inc., Chicago, Illinois, USA). A p value <0.05 was considered as
statistically significant. The analysis of the questionnaires commenced with the demographics
section, where the data was analyzed using frequencies. This was done to determine the
pattern of distribution of the respondents into the above-mentioned strata. The process
transformed data into information that could be used in analyzing the other variables,
especially after cross-tabulation between variables.
The analysis in this chapter deals with quantitative data which is relevant to customer service
and service delivery to the public in the Department of Home Affairs. The objectives of the
study have been built into questions that will be a subject for this analysis. Table 4.1
illustrates the demographic characteristics of the respondents.
4.2 DEMOGRAPHIC CHARACTERISTICS
Percentage
Gender Male 69%
Female 31%
Race African 69%
Coloured 2%
Indian 18%
White 12%
Age 26-35 years 51%
36-45 years 33%
46 years and above 16%
Table 4.1 Composition of sample

48
Table 4.1 illustrates that 69% males and 31% females participated in the study. A total of
69% participants were African, while 18% were Indian, 12% were White and only 2% were
Coloured. The age distribution reflects that 51% were between 26 and 35 years while 33%
were between 36 and 45 years and 16% were 46 years or older.
4.2.1 GENDER AND AGE COMPOSITION OF THE SAMPLE
27% 27%
14%
24%
6%
2%
0%
5%
10%
15%
20%
25%
30%
35%
40%
26-35 years 36-45 years 46 years and above
Age Category
Male
Female
Figure 4.1 Gender and Age composition of sample
Figure 4.1 reflects that males were in the majority in each age category. In particular, in the
age group 26-35, 27% of the sample was male compared to 24% female. In the 36-45 age
group, 27% were male and 6% were female. A total of 14% of respondents who were 46
years and older were male as compared to 2% female.

49
4.2.2 RACE AND AGE COMPOSITION OF THE SAMPLE
51%
0%
14%
4%
18%
2%4%
8%
0%
10%
20%
30%
40%
50%
60%
African Coloured Indian White
Race Category
Male
Female
Figure 4.2 Race and Gender composition of sample
Figure 4.2 indicates the race and gender composition of the sample. The African sample
comprised 51% males and 18% African females. The Indian respondents comprised 14%
male and 4% female. The White respondents comprised 4% male and 8% female while there
were only 2% Coloured female respondents and no males in this race group. This distribution
pattern may have a significant effect on the result of the study. The result could be skewed in
the direction of these two race groups, which have more representation especially if the
responses are similar. Care needs to be taken not to generalize these outcomes to the entire
population.

50
4.2.3 JOB COMPOSITION OF THE SAMPLE
14%
4% 4%
39%
10%
29%
0%
10%
20%
30%
40%
50%
Director Deputy
Director
Executive
Manager
Manager Assistant
Manager
Other
Job Title
Figure 4.3 Composition of sample according to Job Titles
Figure 4.3 reflects that majority (39%) of respondents were managers as the sample was
drawn from the Graduate School of Business at the University of Kwa-Zulu Natal. A total of
14% were at the level of Director while 4% were Deputy Directors and 4% were Executive
Managers. A total of 10% were Assistant Managers and 29% of respondents did not give their
job titles.

51
4.2.4 LANGUAGE COMPOSITION OF THE SAMPLE
25%
6%
47%
10%12%
0%
10%
20%
30%
40%
50%
60%
English Afrikaans Zulu Xhosa OtherHome Language
Figure 4.4 Composition of the sample according to Home Language
Figure 4.4 shows that 47% of the respondents were Zulu speaking people. A total of 25% of
the respondents were English speaking while 6% were Afrikaans speaking and 10% were
Xhosa. A total of 12% of respondents indicated that they speak other languages.
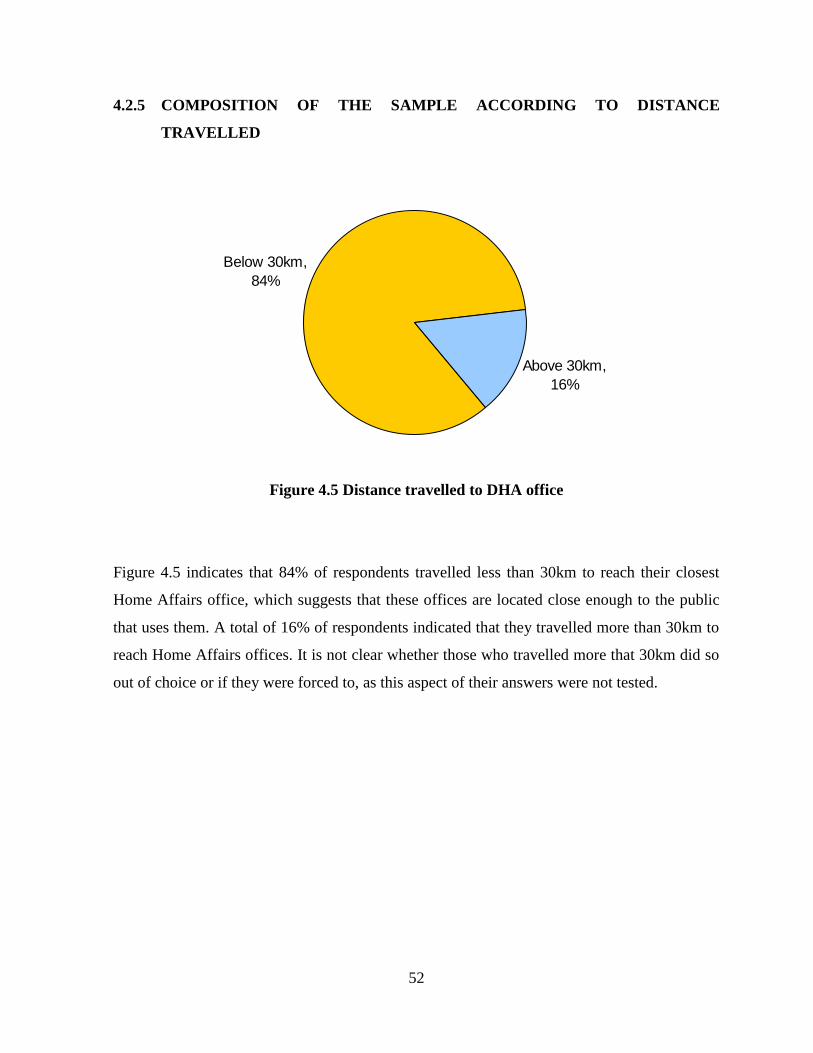
52
4.2.5 COMPOSITION OF THE SAMPLE ACCORDING TO DISTANCE
TRAVELLED
Distance travelled
Above 30km,
16%
Below 30km,
84%
Figure 4.5 Distance travelled to DHA office
Figure 4.5 indicates that 84% of respondents travelled less than 30km to reach their closest
Home Affairs office, which suggests that these offices are located close enough to the public
that uses them. A total of 16% of respondents indicated that they travelled more than 30km to
reach Home Affairs offices. It is not clear whether those who travelled more that 30km did so
out of choice or if they were forced to, as this aspect of their answers were not tested.

53
4.2.6 COMPOSITION OF THE SAMPLE ACCORDING TO TIME TRAVELLED
31%
51%
8%6%
4%
0%
10%
20%
30%
40%
50%
60%
10 min 20 min 30 min 1 hour 2 hrs or more
Amount of time taken to travel
Figure 4.6 Amount of time taken to travel to DHA office
Figure 4.6 reflects that 31% of the respondents travelled just 10 minutes to get to the nearest
DHA office while 51% had spent 20 minutes travelling to the DHA office. A total of 8% of
the respondents had to travel 30 minutes to reach Home Affairs whilst 6% of the respondents
travel for 1 hour and 4% of the respondents travelled 2 hours or more to reach Home Affairs
offices.
There is no clear indication why would it take people more than 30 minutes to get to the DHA
as this was not tested. However, one can assume that it may be related to the types of transport
used and the distances travelled by respondents.
The clients who used their own personal transport (a car) would have an advantage and would
then only have to travel 10-30 minutes. However, clients who used public transport, could take
an hour or more to reach the Home Affairs offices. This indicates the importance of bringing

54
the service closer to the people, so that no citizen is disadvantaged by the location of the DHA
offices
.
4.3. SERVICES AT THE DEPARTMENT OF HOME AFFAIRS (DHA)
4.3.1 SERVICES UTILIZED AT DHA
6%
2%
4%
16%
22%
27%
43%
51%
0% 10% 20% 30% 40% 50% 60%
Other
Death Certificate
Work Permit
Marriage Certificate
Birth Certificate
ID Book Collection
Passports
ID Book Application
Serv
ices R
en
dere
d
Figure 4.7 Services utilized at DHA
Figure 4.7 reflects that 51% of the respondents were at the DHA offices to apply for their
Identity Documents (ID Book) while 43% of respondents were there to apply for a Passport.
A total of 27% of respondents went to Home Affairs to collect their ID books, while 22% went
to apply for Birth certificates and 16% went for Marriage certificates. A small proportion
(4%) of respondents went to apply for a work permit and 2% went to apply for a Death
certificate. A total of 6% went to the DHA for other services such as verification and applying

55
for lost ID books and the general information of services (Reporting and replacing of ID books
and general enquiries for other services).
This indicates that the DHA services such as ID book applications and collection and passport
applications account for a larger percentage than any other services. This shows that the DHA
customer service must focus mainly on the efficient delivery of these services.
Services Male Female
ID Book Application 69% 31%
Birth Certificate 55% 45%
Death Certificate 0% 100%
Marriage Certificate 63% 38%
Passports 73% 27%
Work Permit 100% 0%
ID Collection 57% 43%
Other 67% 33%
Table 4.2 Services utilized at DHA according to Gender
The data in Table 4.2 shows the different services used by males and females. Identity books
are the most common service that both male and female utilize at the DHA. A total of 69%
males and 31% females applied for ID books. It is interesting to note that a larger proportion
of males visited the DHA offices to apply for an ID Book, a Marriage certificate or a Passport
than their female counterparts. However, the proportion of males who applied for a Birth
certificate differed marginally from the proportion of females who applied. Similarly, the
proportion of males who visited the DHA to collect their ID differed marginally from the
proportion of females.
The sample comprises more males and clearly more male‟s clients were interested in filling
out the questionnaire on the Internet as shown in Table 4.1. This means this study cannot come
to a definite conclusion that more males visit the DHA offices than females. It may be that it is
more convenient for females to visit the DHA offices. However, the question to the researcher
could be why there were more males applying for ID, Passports and Marriage certificate than
females? This could be the subject of a future study that other researchers can conduct.

56
Services African Coloured Indian White
ID Book Application 77% 4% 4% 15%
Birth Certificate 73% 9% 9% 9%
Death Certificate 100% 0% 0% 0%
Marriage Certificate 88% 13% 0% 0%
Passports 59% 5% 18% 18%
Work Permit 0% 0% 100% 0%
ID Collection 79% 0% 7% 14%
Other 33% 0% 67% 0%
Table 4.3: Services utilized at DHA according to Race Group
The data in Table 4.3 indicates African clients comprised the majority of those who utilized
the services at DHA. These proportions follow the proportions reflected in Table 4.1.
It is alarming to note that 100% of African respondents were applying for Death certificates
and none of other race respondents required this service.
There were 59% Africans who applied for passports as compared to 18% Indians, 18% Whites
and 5% Coloureds. This could indicate that more Africans are travelling or immigrating to
other countries for better opportunities.
It is also interesting to note that none of the Indian and White respondents visited the DHA for
a Marriage certificate.
Age category
26-35 years 36-45 years 46 years and above
ID Book Application 62% 23% 15%
Birth Certificate 55% 18% 27%
Death Certificate 100% 0% 0%
Marriage Certificate 75% 25% 0%
Passports 45% 41% 14%
Work Permit 0% 100% 0%
ID Collection 64% 21% 14%
Other 33% 67% 0%
Table 4.4 : Service utilized at DHA according to Age category
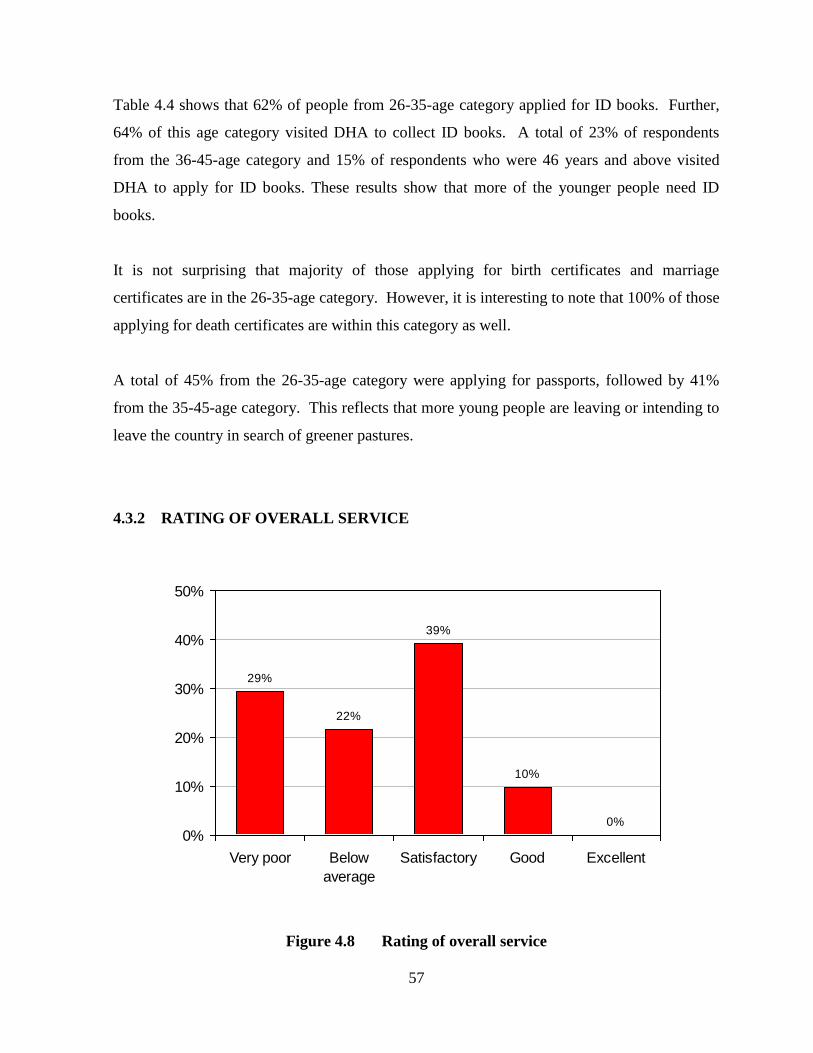
57
Table 4.4 shows that 62% of people from 26-35-age category applied for ID books. Further,
64% of this age category visited DHA to collect ID books. A total of 23% of respondents
from the 36-45-age category and 15% of respondents who were 46 years and above visited
DHA to apply for ID books. These results show that more of the younger people need ID
books.
It is not surprising that majority of those applying for birth certificates and marriage
certificates are in the 26-35-age category. However, it is interesting to note that 100% of those
applying for death certificates are within this category as well.
A total of 45% from the 26-35-age category were applying for passports, followed by 41%
from the 35-45-age category. This reflects that more young people are leaving or intending to
leave the country in search of greener pastures.
4.3.2 RATING OF OVERALL SERVICE
29%
22%
39%
10%
0%
0%
10%
20%
30%
40%
50%
Very poor Below
average
Satisfactory Good Excellent
Rating of overall service
Figure 4.8 Rating of overall service

58
Figure 4.8 shows that none of the respondents rated the service as Excellent when they visited
Home Affairs offices. Only 10% rated the service as Good while 39% of the respondents felt
that that the service level at DHA was Satisfactory.
A total of 22% rated the service as Below Average and 29% indicated that the service was
Very Poor. This reflects that DHA needs to improve their service delivery and a turn-around
strategy would probably be a solution in future.
The rating of the overall service is not significantly different between males and females at the
95% level (Pearson Chi-Square=0.472, df=3,p=0.925). There is no difference between race
groups at the 95% level (Pearson Chi-Square=14.448, df=9,p=0.107) ore between age
categories at the 95% level (Pearson Chi-Square=4.017,df=6,p=0.674).
4.3.3 COMPOSITION OF THE SAMPLE ACCORDING TO LENGTH OF
WAITING TIME IN QUEUE
18%
37%
18%
27%
0%
10%
20%
30%
40%
50%
60%
Under 30
minutes
31-45 minutes 45-59 minutes Above 1 hour
Length of waiting time in queue
Figure 4.9 Length of waiting time in queue at the DHA office

59
Figure 4.9 indicates the length of time that respondents had to wait in queues at the DHA
office. Clients still face the challenge of waiting in queues for a long time after some have
travelled many kilometres and taken hours to reach the DHA offices.
Only 18% of respondents indicated that they had waited for just under 30 minutes in the
queue, which suggests that their experience was rather acceptable. The majority of
respondents (37%) indicated that they had spent between 31 and 45 minutes in the queue
before they received services at DHA offices. This may suggest that this is a slight
improvement in service delivery at DHA. A total of 18% of respondents waited between 45
and 59 minutes and 27% of respondents waited in the queues for more than one hour.
The importance of this result is that the majority of the people wait very long in queues before
being rendered a service.
4.4 ATTITUDE TOWARDS PHYSICAL FACILITIES
The sections below will outline the answers give in terms of the physical facilities provided
for customers at the Home Affairs office. Each aspect of the physical setting will be examined
separately.

60
4.4.1 SEATING FACILITIES This home affairs has adequate seating
33%
37%
4%
24%
2%
0%
10%
20%
30%
40%
50%
Strongly
disagree
Disagree Neither
agree nor
disagree
Agree Strongly
agree
Figure 4.10 Satisfaction with adequate seating
Figure 4.10 indicates that 33% strongly disagreed and 37% of respondents disagreed that there
is adequate seating at the DHA offices. Figure 4.9 indicated that most people waited more that
45 minutes in the queue. This suggests that more clients are frustrated by the fact that while
waiting on the queue there is insufficient seating in Home Affairs offices.
Only 2% strongly agreed and 24% agreed that there is adequate seating at Home Affairs
offices while 4% neither agreed nor disagreed with the statement. The challenge remains to
provide more seats in all Home Affairs office so that while clients are waiting to be served,
they can be seated. Further, pensioners cannot stand for long hours, therefore an improvement
in this area must be considered.

61
4.4.2 TOILET FACILITIES Home affairs toilets are clean and working
37%
16%
39%
8%
0%0%
10%
20%
30%
40%
50%
Strongly
disagree
Disagree Neither
agree nor
disagree
Agree Strongly
agree
Figure 4.11 Satisfaction with toilets
From Figure 4.11 it is clear that 37% strongly disagree and 16% disagree on the availability of
toilets and cleanliness thereof. Not surprising is that 39% of the respondents neither agree nor
disagree on the availability and cleanliness of the toilets at Home Affairs. This may be due to
the fact that some of the clients did not have the need to use the toilet facilities during the time
that they were at Home Affairs and could not comment on the status of the toilets facilities in
the particular office they visited. However 8% of the respondents felt that the toilets were
clean and working on the day they visited these offices.
This indicates that a government institution, which is used mostly by members of the public,
should be responsible for being clean. This includes having clean toilets, clean floors and
clean offices.

62
4.4.3 SOAP AND WATER TO WASH INK
Water and soap to wash off ink and toilet rolls are provided
35%
18%
29%
18%
0%0%
10%
20%
30%
40%
50%
Strongly
disagree
Disagree Neither
agree nor
disagree
Agree Strongly
agree
Figure 4.12 Satisfaction with the provision of soap, water and toilet rolls
It is very important that proper services are provided to clients when they visit service points.
Figure 4.12 indicates that that 35% of the respondents strongly disagree that soap, water and
toilet paper were provided at Home Affairs office to wash their hands after having their
fingerprints taken while 18% disagree.
A total of 27% of the respondents neither agree nor disagree that they were satisfied with the
soap and water. However, 18% of the respondents agree that this service was provided. None
of respondents strongly agreed on finding soap and water to wash off ink after having their
fingerprints taken. This could mean that one has to go home stained with ink or clients are to
bring their own soap and water and toilet rolls when visiting the DHA. This implies that the
DHA must investigate this issue and ensure that they provide soap and other materials. This
will lead to an improvement in the service of taking fingerprints.

63
4.4.4 PARKING FACILITIES There is enough parking facilities
47%
20%
6%
24%
4%
0%
10%
20%
30%
40%
50%
60%
Strongly
disagree
Disagree Neither
agree nor
disagree
Agree Strongly
agree
Figure 4.13 Satisfaction with parking facilities
Figure 4.13 indicates that 47% of the respondents effectively disagree with the fact that Home
Affairs offices have enough parking facilities while 20% disagree. This is a critical issue
because the DHA should not just provide adequate parking but also safe parking facilities so
that clients' cars are not stolen or broken into while they are attending to their business at the
offices.
However, 24% responded positively, indicating that they agree that there are enough parking
facilities when they visit Home Affairs offices. A total of 4% strongly agree with this. This
indicates that some offices do provide parking facilities for clients.
A total of 4% of the respondents neither agree nor disagree on this issue. These could be
respondents who used the public transport when they visited Home Affairs or they were
dropped by other people when they visited Home Affairs.

64
The challenge still remains that Home Affairs offices should be built in areas where there is
enough space to provide adequate and safe parking for clients when they visit Home Affairs
offices.
4.4.5 AIR-CONDITIONED OFFICES
There is enough air-conditioning in this office
41%
33%
12% 12%
2%
0%
10%
20%
30%
40%
50%
Strongly
disagree
Disagree Neither
agree nor
disagree
Agree Strongly
agree
Figure 4.14 Satisfaction with air-conditioning
Figure 4.14 shows that 41% of the respondents strongly disagreed that there is enough air-
conditioning while 33% disagree. However these conditions have no impact on 12% of
respondents who neither agreed nor disagreed with this statement. It is not clear whether they
were happy or not regarding air-conditioning facilities.
Only 12% of the respondents agreed and 2% strongly agreed that air-conditioning was
adequate. It is essential that adequate air-conditioning be provided at Home Affairs offices so
that there is a comfortable working environment all year round.

65
4.4.6 SIGNAGE Signage is clear and provides good information
33%
27%
20%
10% 10%
0%
10%
20%
30%
40%
50%
Strongly
disagree
Disagree Neither
agree nor
disagree
Agree Strongly
agree
Figure 4.15 Satisfactions with signage
Figure 4.15 reflects that 33% of respondents strongly disagree and 27% disagree that Home
Affairs had provided clear signage in all their offices. This indicates that clients did not have
clear information on different services. As a result most people could spend hours standing in
the wrong queue. This is time consuming and indicates a poor service.
However, 20% of the respondents neither agree nor disagree with the statement. This could
indicate they did not that pay any attention to the signage when they were at the Home Affairs
office.
A total of 10% agreed while 10% strongly agreed that there is clear signage that provides good
information at Home Affairs offices.

66
4.4.7 WHEELCHAIR ACCESS There is access for wheel chairs in this office
20% 20%
29%
25%
6%
0%
10%
20%
30%
40%
50%
Strongly
disagree
Disagree Neither
agree nor
disagree
Agree Strongly
agree
Figure 4.16 Provision of wheelchair access
As a government regulation every public service or government building must be wheelchair
friendly. Figure 4.16 indicates that a total of 40% of the respondents strongly disagreed or
disagreed to the statement that there is access for wheelchairs.
A total of 25% neither agreed nor disagreed that could suggest that they did not notice
wheelchair access to DHA.
However, 25% agreed and 6% of the respondents strongly agreed that DHA had provided
wheelchair access in some of their offices.
It is important that Home Affairs follow the procedure and regulations of the public service,
which indicates that offices have to be user friendly for the differently-abled people.
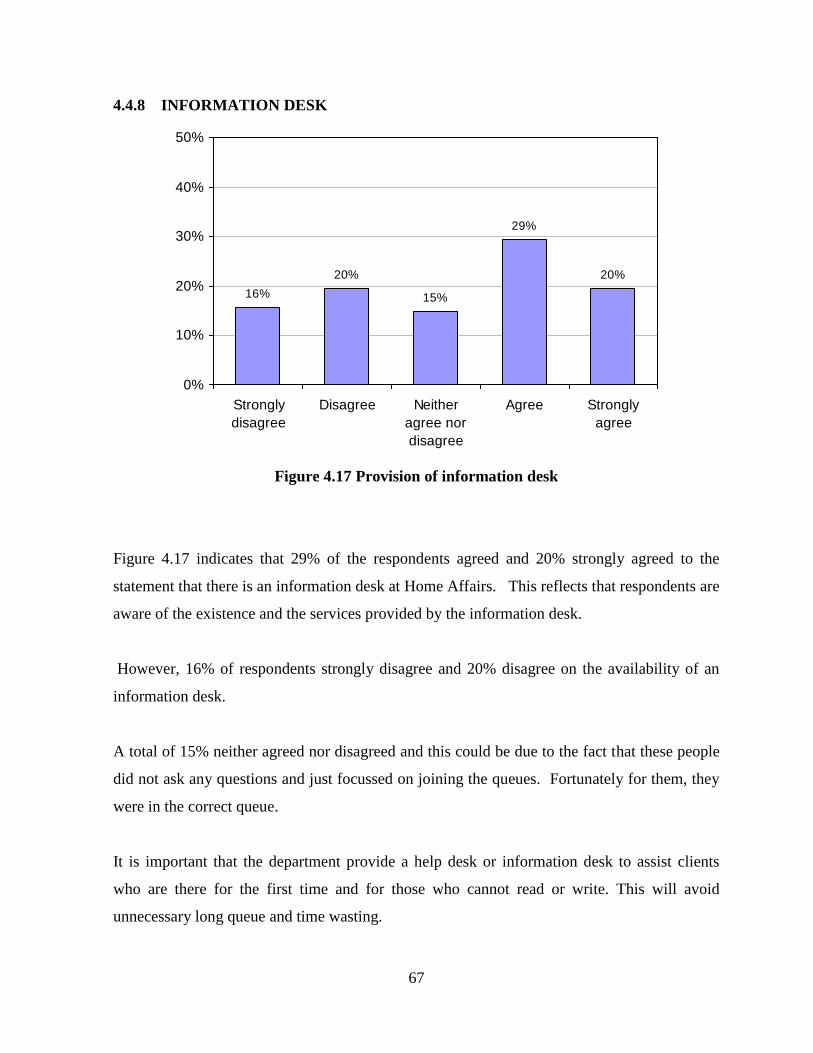
67
4.4.8 INFORMATION DESK There is an information desk to help customers
16%
20%
15%
29%
20%
0%
10%
20%
30%
40%
50%
Strongly
disagree
Disagree Neither
agree nor
disagree
Agree Strongly
agree
Figure 4.17 Provision of information desk
Figure 4.17 indicates that 29% of the respondents agreed and 20% strongly agreed to the
statement that there is an information desk at Home Affairs. This reflects that respondents are
aware of the existence and the services provided by the information desk.
However, 16% of respondents strongly disagree and 20% disagree on the availability of an
information desk.
A total of 15% neither agreed nor disagreed and this could be due to the fact that these people
did not ask any questions and just focussed on joining the queues. Fortunately for them, they
were in the correct queue.
It is important that the department provide a help desk or information desk to assist clients
who are there for the first time and for those who cannot read or write. This will avoid
unnecessary long queue and time wasting.

68
4.5 RESPONDENTS’ ATTITUDE TOWARDS STAFF
4.5.1 ADEQUATE PROVISION OF STAFF
There are adequate staff in this office
29%
25%
10%
31%
4%
0%
10%
20%
30%
40%
50%
Strongly
disagree
Disagree Neither
agree nor
disagree
Agree Strongly
agree
Figure 4.18 Adequate staff in DHA office
Figure 4.18 reflects that over half the respondents felt that was inadequate staff at the DHA
offices. In particular, 29% strongly disagree and 25% disagreed that there was adequate staff
at the DHA office while 10% neither agreed nor disagreed. However, some respondents felt
that they there are enough staff members or officials that are serving the public in Home
Affairs. In particular, 31% agreed and 4% strongly agreed that staff was adequate.
Included in the questionnaire was and open-ended question that allowed respondents to
indicate their concerns. The majority of the respondents had a problem with availability of
staff in Home Affairs. Respondents indicated that most of the time, staff members could not
be found or were out for lunch. Another reason that contributes to the unavailability of staff is
the huge increase in absenteeism. This seems to be a common problem in government or
public service offices.

69
4.5.2 STAFF ATTITUDES
Home affairs staff members are friendly, honest and dutiful
37%
29%
14%
20%
0%0%
10%
20%
30%
40%
50%
Strongly
disagree
Disagree Neither
agree nor
disagree
Agree Strongly
agree
Figure 4.19 DHA staff is friendly, honest and dutiful
Figure 4.19 indicates that 37% of respondents strongly disagree and 29% disagree that Home
Affairs have friendly staff members. The assumption can be made that these respondents were
badly treated by Home Affairs official on the day they visited their respective office.
A total of 14% respondents were undecided regarding friendliness of the staff.
A total of 20% of respondents agreed that Home Affairs staff members and senior officials
were friendly. The low percentage of respondents who are positive about Home Affairs staff
members indicates that these staff members need to be motivated to perform their duties
effectively and efficiently and ultimately provide a friendly service.

70
4.5.3 STAFF IS AVAILABLE AND HELPFUL
Staff in offices are always available and ready to help
33%
39%
10%
18%
0%0%
10%
20%
30%
40%
50%
Strongly
disagree
Disagree Neither
agree nor
disagree
Agree Strongly
agree
Figure 4.20 Availability and helpfulness of staff
Figure 4.20 reflects that 33% strongly agreed and 39% agreed to the statement that staffs in
offices are always available and ready to help. However, 10% could not agree or disagree. A
total of 18% agreed and none strongly agreed.

71
4.5.4 SATISFACTION WITH INFORMATION RECEIVED The information given in home affairs offices was accurate and
helpful
16%
27%26%
29%
2%
0%
10%
20%
30%
40%
50%
Strongly
disagree
Disagree Neither
agree nor
disagree
Agree Strongly
agree
Figure 4.21 Satisfaction with the accuracy and helpfulness of information given at Home
Affairs
Figure 4.21 reflects that 16% strongly agreed and 27% agreed to the statement that staffs in
offices are always available and ready to help. However, 26% could not agree or disagree. A
total of 29% agreed and 2% strongly agreed.

72
4.5.5 CUSTOMERS’ INTERACTION WITH SENIOR STAFF Senior staff of Home Affairs are approachable
27%
24%
37%
10%
2%
0%
10%
20%
30%
40%
50%
Strongly
disagree
Disagree Neither
agree nor
disagree
Agree Strongly
agree
Figure 4.22 Senior staff are approachable
Figure 4.22 reflects that 27% strongly agreed and 24% agreed to the statement that senior staff
of Home Affairs is approachable. However, 37% could not agree or disagree. A total of 10%
agreed and 2% strongly agreed.

73
4.5.6 FRAUD AND CORRUPTION Officials sometimes request money before they discharge their
duties
33%
27% 27%
6% 6%
0%
10%
20%
30%
40%
50%
Strongly
disagree
Disagree Neither
agree nor
disagree
Agree Strongly
agree
Figure 4.23 Incidence of corruption at DHA
The public service has been hampered by fraud and corruption in the recent years.
Interestingly, Figure 4.23 indicates that 33% strongly disagree and 27% disagree that DHA
officials were asking the clients for money before they discharge their duties. These
respondents indicate that DHA official did not ask for bribery before giving assistance to
clients.
Figure 4.23 also shows that 27% of respondents neither agreed nor disagreed that at times
Home Affairs officials do ask for money in exchange for assistance and illegal documents,
fake identity documents, marriages etc. Only 6% of the respondents agreed and 6% strongly
agreed that they were asked to pay bribery fees when they were at Home Affairs.
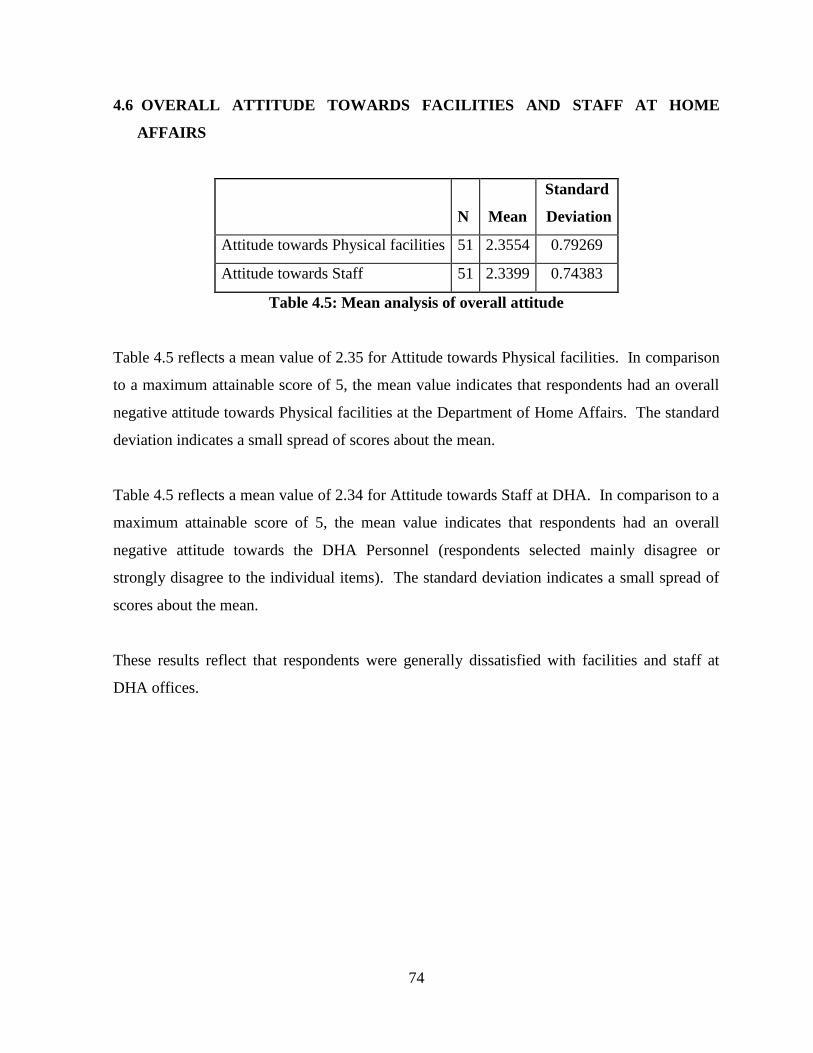
74
4.6 OVERALL ATTITUDE TOWARDS FACILITIES AND STAFF AT HOME
AFFAIRS
N Mean
Standard
Deviation
Attitude towards Physical facilities 51 2.3554 0.79269
Attitude towards Staff 51 2.3399 0.74383
Table 4.5: Mean analysis of overall attitude
Table 4.5 reflects a mean value of 2.35 for Attitude towards Physical facilities. In comparison
to a maximum attainable score of 5, the mean value indicates that respondents had an overall
negative attitude towards Physical facilities at the Department of Home Affairs. The standard
deviation indicates a small spread of scores about the mean.
Table 4.5 reflects a mean value of 2.34 for Attitude towards Staff at DHA. In comparison to a
maximum attainable score of 5, the mean value indicates that respondents had an overall
negative attitude towards the DHA Personnel (respondents selected mainly disagree or
strongly disagree to the individual items). The standard deviation indicates a small spread of
scores about the mean.
These results reflect that respondents were generally dissatisfied with facilities and staff at
DHA offices.

75
4.6.1 INFERENTIAL STATISTICS
Independent Samples T Test
Gender N Mean Std. Deviation T df P
Attitude towards Physical facilities
Male 35 2.4393 0.71253 1.121 49 0.268
Female 16 2.1719 0.94414
Attitude towards Staff
Male 35 2.3619 0.73818 .310 49 0.758
Female 16 2.2917 0.77817
Table 4.6 Comparison of attitudes between Gender
Table 4.6 reflects that the overall Attitudes towards the DHA Physical facilities and Personnel
is not significantly different between males and females at the 95% level (p>0.05). This
shows that males and females can be considered as equally dissatisfied with regards to the
services and staff at DHA.

76
4.6.2 ANALYSIS OF VARIANCE: AGE
Analysis of variance
Age Category N Mean Std.
Deviation F p
Attitude towards Physical
facilities
26-35 years 26 2.2404 0.74408
0.753 0.477 36-45 years 17 2.5441 0.90132
46 years and
above 8 2.3281 0.71943
Attitude towards Staff
26-35 years 26 2.3397 0.79928
0.024 0.976 36-45 years 17 2.3627 0.61304
46 years and
above 8 2.2917 0.89863
Table 4.7 Comparison of attitudes between Age categories
Table 4.7 reflects that the overall Attitudes towards the Physical facilities and Personnel is not
significantly different between age categories at the 95% level (p>0.05). The mean values in
each age category are only marginally different. This indicates that the feeling of
dissatisfaction with regards to Physical facilities and staff is similar across age groups.

77
4.6.3 ANALYSIS OF VARIANCE: QUALIFICATION LEVEL
Analysis of variance
Qualifications N Mean Std. Deviation F p
Attitude towards
Physical facilities
Grade 12 / Matric 4 2.2188 0.41300
2.701 0.056 Diploma 12 2.7500 0.79950
Degree 30 2.3667 0.72511
Other 4 1.5625 0.88093
Attitude towards
Staff
Grade 12 / Matric 4 2.3750 0.79786
0.935 0.431 Diploma 12 2.6528 0.75698
Degree 30 2.2889 0.67797
Other 4 2.0833 0.96705
Table 4.8 Comparison of attitudes between Qualification levels
Table 4.8 reflects that the overall Attitudes towards the DHA overall Physical facilities and
Personnel is not significantly different between qualification levels at the 95% level (p>0.05).
There is no evidence that the population means are significantly different by qualifications.
Therefore the “qualifications” group as defined by the measuring instrument does not seem to
be a factor in the population attitudes to physical facilities and attitudes towards personnel.
Respondents of all qualification levels are dissatisfied with the facilities and staff.
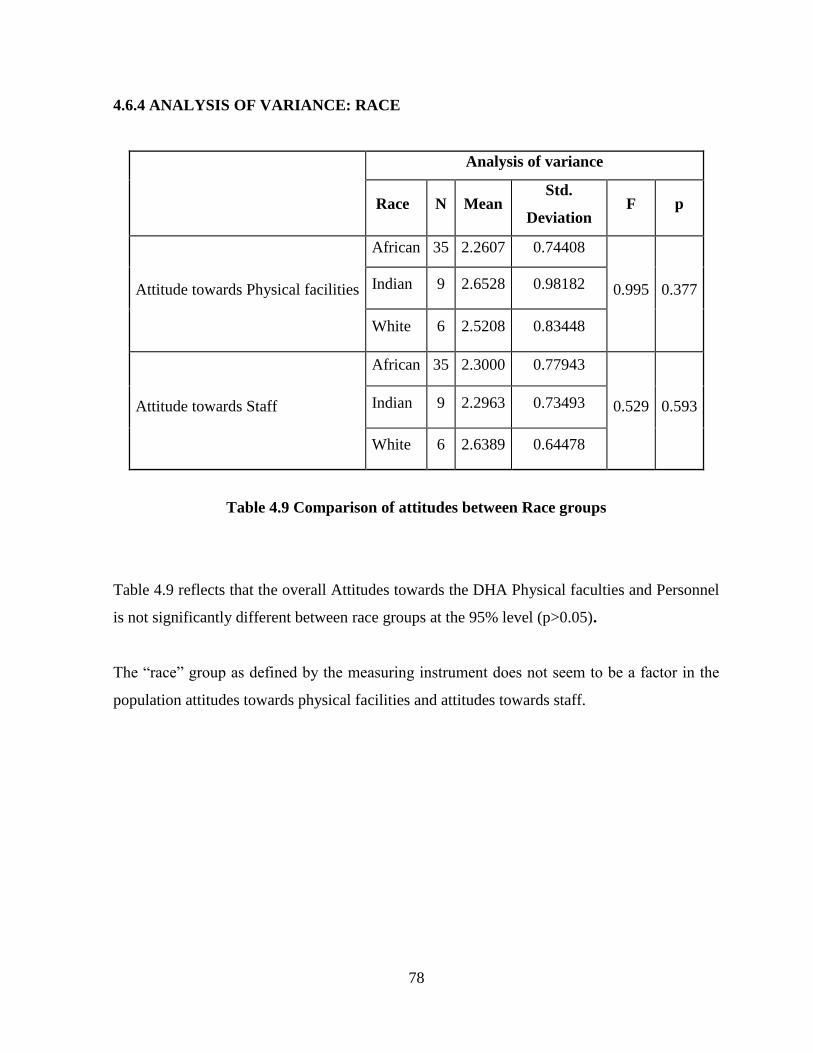
78
4.6.4 ANALYSIS OF VARIANCE: RACE
Analysis of variance
Race N Mean Std.
Deviation F p
Attitude towards Physical facilities
African 35 2.2607 0.74408
0.995 0.377 Indian 9 2.6528 0.98182
White 6 2.5208 0.83448
Attitude towards Staff
African 35 2.3000 0.77943
0.529 0.593 Indian 9 2.2963 0.73493
White 6 2.6389 0.64478
Table 4.9 Comparison of attitudes between Race groups
Table 4.9 reflects that the overall Attitudes towards the DHA Physical faculties and Personnel
is not significantly different between race groups at the 95% level (p>0.05).
The “race” group as defined by the measuring instrument does not seem to be a factor in the
population attitudes towards physical facilities and attitudes towards staff.

79
4.7 RELIABILITY
Cronbach‟s alpha was computed to test the reliability of the items relating to each dimension.
The Cronbach‟s alpha score for the items relating to physical facilities is 0.783 and the value
for items‟ relating to Staff is 0.712. The alpha values indicate a high degree of internal
consistency and correlation amongst the items and confirm that the items together relate to a
common construct.
Dimension Number of items Cronbach’s alpha
Attitude towards Physical
facilities
8 0.783
Attitude towards Staff 6 0.712
Table 4.10 Comparisons of attitude towards physical facilities and staff
4.8 HOW SERVICES COULD BE IMPROVED AT DHA: RESPONSES FROM
CUSTOMERS
The following list indicates the suggestions provided by respondents in terms of improving
services at the DHA.
The various counters address specific items such as passport applications, ID applications,
and Birth certificate collection. These were not clearly pointed out. Even the ushering staff
could not help. Staff appeared demotivated and not very helpful;
It is frustrating when one has stood for ages, only to get to the counter and discover that
one has been in the wrong queue;
There is no sense of urgency, responsibility or accountability amongst the staff;
There should be chairs (benches) inside and outside for people to be seated while waiting
for services especially for the disabled and elderly; and
The length of time one waited to be attended to, was too long.

80
4.9 CONCLUSION
This chapter summarizes the findings of the study.
The data was presented through the use of tables and graphs. Inferential statistics including t
Test, Analysis of variance and Chi-square were included to indicate differences between
variables. The results indicate that respondents are generally dissatisfied with services
provided by the DHA.
Chapter Five will discuss the results in detail and research objectives as stated in Chapter One
will be answered.

81
CHAPTER FIVE
DISCUSSION OF RESULTS
5.1 INTRODUCTION
The research grew out of an interest of service delivery in the Department of Home Affairs, as
a result there was a growing demand to develop or design a customer service model that will
assist in the improvement of service delivery in the Department of Home Affairs. There is a
growing demand for a better service in the public sector, and a number of DHA clients have
launched many complaints regarding the poor level of service quality received at the
Department of Home Affairs. This study aims to contribute to the improvement of service
delivery by attempting to understand the public members (DHA clients), their concerns, and
wants in order to effectively develop a customer service model for the DHA client‟s
satisfaction. Chapter One has the size of the sample as one of the limitations as the sample of
51 respondents cannot be said to be representative of the population of country. This does not,
however, prevent this study from drawing certain conclusion from the results as the person
surveyed does not only form part of one area.
This chapter answers the research objectives of the study as put in chapter one. It first seeks to
distinguish the service delivered according to demographics, so as to determine the segment to
which Home Affairs service appeals to mostly. On discovering this, the objective then is to
explore the service quality received by respondents. This exploration is done to determine
whether service offered by Home Affairs has an impact on the service delivery to the public at
large and on the Department it self.
5.2 DEMOGRAPHICS
The sample was composed of 69% of male respondents, which is an indication that the MBA
class is dominated by males and were interested to respond on the research were males;
however the researcher can also assume that the Graduate School of Business in UKZN has
more males in general. This study cannot make claims of being proportionally accurate as this
is not the aim. Nevertheless, the issue at hand is that South Africa has been a patriarchal
society and therefore males have tended to dominate in terms of decision making as women

82
normally stayed at home to look after the children. There were number of woman who also
participated in the study who were part of GSB, MBA class, which is normally perceived as a
degree that is done by managers. This means that the empowerment of women has
necessitated a mind shift as women also acquire senior position in the private sector as well as
in the public sector. This has been a significant shift from traditional norms of males
dominating at home and in the working environment. The other assumption is that the
participation of women shows that women also participate in decision making to improve the
quality of life and have a huge influence and a buying power.
South Africa has its uniqueness when it comes to racial diversity. There are four main racial
groups that are externally and internally heterogeneous. What this means is that the groups are
distinguishable by race groups, and that within these race groups there are groups
distinguishable by tribe, cultural practices and religion. This study is limited to profiling the
behaviour based on racial groups only and the results are indicated in (Figure 4.2) of the
sample. This clearly indicated that on the day when the questionnaires were distributed most
of the respondents who participated were Blacks followed by Indians and Whites with a very
small percentage of Coloureds who also responded to the questions. The sample is not a
proportional representation of the country; since this was a self-administered survey there was
no control over the respondents to ensure all races represented responds to the survey.
Age group is another variable that had to be included, as different age groups have been
socialized differently. This has had an impact on the service that they received at the
Department of Home Affairs and their expectations to better services. As indicated in (figure
4.1) most of the respondents were young and middle aged males who participated in the
survey and responded mostly to the questionnaires. This could be caused by the fact that more
males are studying in UKZN towards MBA and they responded to the questions more than
females in the GSB.

83
Chapter Two discusses drivers of service delivery and one of these leadership quality and
management experience that the Department of Home Affairs has. The composition of the
sample according to job title (Figure 4.3) is that
Only professionals who are executives or managers responded to the survey. This is because
when the questionnaire were distributed for the targets professionals who are studying MBA,
blue colours whom the researcher wanted to study their behaviour towards satisfaction with
regards to customer services and satisfaction with DHA service delivery.
This market is very important as these people are potential high income earners, whose level
of income is such that they would be able to pay for faster, better service at Home Affairs at an
extra cost if they were afforded such service.
5.3 CUSTOMER SATISFACTION WITH SERVICE PROVIDED BY DHA TO
THE CLIENTS
In an effort to determine the composition of the sample population according to the ratings of
customer satisfaction with service provided by DHA to its clients, (Figure 4.8 ) indicates that
generally most of the respondents found the services at DHA satisfactory. This shows that the
services according to the respondents was not too good or too bad, however more than half of
the participants in the survey suggested that the service was below average to very poor. This
will conclude that generally most people who visited DHA feels that customer service is poor
at the Department of Home Affairs and needs improvement.
Another variable to determine whether the respondents were satisfied with service provided at
DHA was to find out if the customers were happy with the DHA officials and helpful towards
their clients. As indicated in figure 4.19 most of the respondents indicated that DHA staff is
unfriendly and not helpful at most times. There were few respondents who felt that when they
visited Home Affairs offices, they found Home Affairs officials to be friendly and treated
them with dignity and respect. The Department senior manager‟s needs to pay a careful
attentions as to how customers are treated by their own officials and how can customer
services be improved, for example training of front desk officials on how to handle customer
complaints and serve customers better would be the first start to follow the principles of Batho
Pele.

84
Figure 4.5 indicates that most of the DHA offices are closer to the public roads where it is
easy for people who do not have private transport to take public transport to reach DHA
offices. As most of the respondents are managers it was expected that the question of location
of offices will have a positive response. There were other respondents who felt that the offices
were not closer enough for clients to get in DHA offices easily at all times, this indicate that
not all the DHA offices are properly located, other areas for example such as Umlazi township
are far from Durban City (Umgeni office), therefore these areas must have their own regional
office to avoid such problems which has a huge impact on people who are pensioners and
disadvantaged because the distance they have to travel to get to DHA offices.
It is indicated in Figure 4.20, that respondents who need assistance from the DHA staff did
find an official available to provide assistance during the time when they visited DHA offices.
As indicated in these questionnaires DHA need to employ more staff members to improve
service delivery. They were other respondents who felt that DHA had enough staff members
to provide a good level of customer service to its clients. There were, however, other
respondents who were undecided This could have been caused by the fact that when they were
at Home Affairs they just decided to join the queue and ask for any assistance because DHA
officials are generally perceived as being very unhelpful. It‟s a fact that when people visit a
busy customer service environment like DHA, they may have a different experience: some
may enjoy the attention given by the officials whilst others will receive no attention at all.
There is normally a feeling of inconvenience and time wasting when clients feel that officials
are not executing their duties as expected in the public sector. Unfortunately government
departments are perceived to provide poor service delivery and a lack of customer service.
When respondents were asked if there was adequate seating, it is clear from the information in
Figure 4.10 that there was not enough seating in DHA offices that they visited. A small
percentage said that they were comfortable with the availability of seating that DHA provided
in their office. A public service department is used by older and younger people as well as
people who may not be physically well, needs to have adequate seating. This is especially
important in a situation where the public has to wait in queues to be served.

85
5.4 SERVICES USED BY DHA CUSTOMERS
The attempt to explore the respondents‟ experiences with the services, used was aimed at
determining which services were most commonly used by DHA customers. When questioned
about which services they used, Figure 4.7 shows that most of the male respondents had
visited Home Affairs to apply for Identity Documents or Passports or were there to collect ID
books. Table 4.3 indicates that most of these males were Blacks who were either young or
middle–aged. This is also reflected in Figure 4.4. Other services such as Births, Marriage,
Deaths and Work permits are not in as high demand as ID applications. This indicates that
DHA focus on customer service should be more on the ID application, ID collection and
Passport departments as these are the areas that need improvement. This is a clear indication
that more officials must be deployed at the ID applications counters, and it is necessary to
have more people to serve clients applying for passports. ID collection counters must also
have more officials or more than one counter for ID collection as part of the solution to
improve service delivery in DHA. One thing worth noting is that the respondents who did not
specify which service they had used at DHA, means that it is not clear what was the reason
that they had to go to DHA and spend their time and money when they do not know what
made then to go to DHA.
Respondents were also asked to comment on the levels of cleanliness of the environment at
DHA. According to Thompson (2004), social responsibility includes corporate philanthropy
and action to earn the trust and respect of stakeholders and also to improve the general well-
being of customers, employees, local communities at large and the environment. Figure 4.11
shows that most people were unhappy with the poor condition of toilets in DHA. However,
other respondents said that the toilets were clean and smaller percentage of the respondents
was not sure about the condition of the toilets at DHA. The researcher can conclude that those
respondents, who were undecided, did not go to these toilets and it is therefore not appropriate
to draw a conclusion about these respondents.
An effort was made to determine if DHA provides an information help desk for their clients in
order to provide better customer service in terms of saving time and being more efficient. The

86
help desk would enable clients to be better informed before joining the queues, saving them
the time and bother of finding themselves in the wrong queue. The majority of the respondents
said that there were information desks in offices they visited. There were, nonetheless another
small percentage of respondents who said that there were no information desks in offices that
they visited, while only14% were undecided if there was an information desk in DHA offices
or not (see Figure 4.17). This shows that DHA is not making enough of an effort to provide
good customer service in their offices. The question would be how effective is the help desk in
DHA? And does this desk provide adequate and clear information to clients?
Respondents were also asked if DHA provided a clear signage in their offices in order to give
clear information on where to find which service. Figure 4.15 shows that there was no clear
signage in DHA. However, there were other respondents who felt that there was signage
which was clear enough for clients to get clear information during the time they visited DHA.
Some respondents did not answer this question. This means that more signage is needed to
provide better information. This is another area of improvement that managers must pay
attention to in order to provide a better service for all DHA clients.
Respondents were asked whether DHA provided clients with soap to wash their hands after
taking fingerprints. A reasonable number of respondents (as indicated in Figure 4.12) said that
DHA did not provide soap to wash their hands after having their fingerprints taken. Only a
very small percentage of respondents said DHA provided soap to wash their hands. Some
respondents to this question were not sure if there was a soap to wash hands, in other words
they were undecided regarding this question. These results shows the importance of good
service required by clients in the public sector, therefore DHA must take responsibility for
providing a better service to clients at all times. Its is very important for DHA to provide
clients with water and soap to wash their hands after having their fingerprints taken because
the ink used to take fingerprints can only be removed with soap. This may seem like a small
aspect of customer service, but it is an important one.

87
5.5 THE AVERAGE TIME CUSTOMERS SPEND ON TRAVEL AND WAITING
FOR SERVICES
When respondents were asked how much time they had spent on travelling to DHA office the
majority, Figure 4.6 indicates that more than half of the respondents had travelled 20 minutes
to get to DHA while just below half of the respondents said they had travelled only 10 minutes
to get to DHA offices. Figure 4.6 also shows that respondents said that they had travelled for
between 30 mins and 2 hours to get to DHA. It is clear when looking at these results that the
allocation of DHA offices was evenly spread. DHA offices are properly located
geographically, but perhaps more can be done to improve on the distance that clients should
travel when they want to go to DHA.
According to Naidoo (2005), when people are forced to wait in long queues in a shopping
mall, they become tired of the wait and naturally some of them put down their groceries and
leave. This behaviour is the same in any business that serves people, therefore a question
asking respondents to comment about their experience in waiting in queues at DHA was
included in the questionnaire. The responses indicated (see Figure 4.9) that some clients
waited for 31 to 45 minutes before receiving assistance while other respondents said that their
experience in waiting in the queue in DHA was 1 hour. The rest of the respondents said that
they were waiting in the queue for approximately 46 minutes to an hour. Only a few
respondents said they spent less than 30 minutes in the queue.
Although there were people who said that they were in the queues for a short period of time,
the researcher cannot ignore the fact that most of the respondents were very unhappy with the
time they had spent waiting in the queues. If DHA can improve their queue management
system, this will have a positive impact on their service and more people would be assisted in
a shorter time on a daily basis.
When respondents were asked if DHA provided enough air-conditioning, the results as shown
in Figure 4.14, indicate that many respondents said that DHA does not have enough air-
conditioning in their offices. Other respondents said that they thought there was adequate air-
conditioning in the DHA offices, while some said that they were not sure if there was air-

88
conditioning or not. This could be caused by the fact that when they visited DHA office, it
may have been a cold or a rainy day, so the existence of an air-conditioned environment was
not an important factor.
5.6 AVAILABILITY OF DHA STAFF TO ASSIST CLIENTS
Respondents were also asked to share their experiences with regards to staff availability.
Responses received (see Figure 4.18) shows that most of the respondents felt that DHA was
short-staffed and staff members were not available to assist clients Other respondents had a
different view regarding staff members‟ availability and helpfulness when clients needed
assistance. A few respondents did not answer this question. The attempt to explore the
respondents‟ experiences with the availability of senior staff of DHA (Figure 4.22) indicates
the shortage of senior staff (Regional Managers) in DHA. These staff members were not
always available to help the clients. A small percentage of respondents believed that senior
officials at DHA at some point had assisted them and therefore these respondents were quite
happy with senior officials‟ availability. Only 34% did not answer this question (see Figure
4.22).
In an attempt to explore the behaviour of DHA officials in terms of committing fraudulent
activities, respondents were asked to comment on the question of DHA officials requesting
extra money from clients in order to give them certain documentation and extra service. The
replies from the sample indicated (see Figure 4.23) that certain respondents said they were not
asked for bribery money by officials to get better treatment or service while other respondents
indicated that the DHA officials had asked them for a bribe. This is an area where the DHA
needs to put tighter measures in place to eradicate corruption amongst DHA officials.
Using another variable to determine whether officials in the DHA would give clients enough
information, it is indicated in Figure 4.21 that respondents said that DHA officials always give
enough and accurate information when asked by the clients. Other respondents said that the
information given at DHA by the official, who dealt with them, was not accurate. This is
another critical area that DHA needs to improve because some clients complained that they

89
always received poor information from DHA. A good level of customer service could be
achieved through effective information and communication.
5.7 ACCESSIBLE PARKING FACILITIES
To determine the composition of the sample population according to access to a DHA parking
facilities, the results indicate (see Figure 4.13) that some respondents said that insufficient
parking is provided at DHA while other respondents said there was enough parking. A few
were not sure of the availability of parking. Another attempt to determine whether access to
DHA offices was adequate for wheelchair-bound customers, there was a general feeling of
dissatisfaction amongst the respondents. Some respondents did say, however, that DHA did
provide wheelchair access at their offices for the paralyzed or disadvantaged clients while
most people felt that DHA did not comply with the public service regulations to provide
access to their offices for the physically disadvantaged people. Only a few people did not
answer this question.
5.8 HOW SERVICE COULD BE IMPROVED
According to respondents the following will improve DHA customer services:
The time that customers spend in queues is far too long and needs to be shortened by
introducing better trained staff and more efficient systems
The overall signage in DHA offices needs to be improved so that customers know
exactly which queue to join for the services they need
The staff need to be trained extensively on Customer Service techniques
Systems must be introduced to track document processing so that staff is able to keep
their customer fully informed of the progress of their query or application.
The physical environment such as the toilets, wheelchairs access, air-conditioning etc.
needs to be improved and standardized in all offices to ensure the comfort of the
customers.

90
5.9 CONCLUSION
The results of this study show that the DHA needs to improve their levels of customer service
in the near future because many people are not happy with the treatment they receive from the
Department. Careful thought should be given to customer services and customer satisfaction
and the same customer service standards should apply to all customers and at all times in DHA
offices. Further research on DHA customer service levels should be conducted across the
country. A customer service model needs to be developed and implemented nationally to
improve customer service levels in all offices. Chapter Six will summarize this study and give
recommendations that could assist in tackling the challenges that have been discussed.

91
CHAPTER SIX
RECOMMENDATIONS AND CONCLUSION
6.1 INTRODUCTION
This chapter will make recommendations on the above findings as a means of addressing the
challenges investigated by this study. The study of customer service in general, is not new and
there are several research papers published on this topic. All of these studies are very broad
and do not take into account factors such as the diversity of the South African population. The
findings of this research have managed to make a contribution to the existing body of
knowledge on the complexity of the demographic challenges within the South African
population. The transformation in our society has meant that, due to the dynamic nature of the
challenges that face the people of South Africa, research needs to be a continuous process.
Any study of customer service levels and expectations needs to take into account and
understand the different expectations of customer service in order to maximize its potential in
the public sector. Once this is understood then marketers and service providers will be in a
better position to target the relevant marketing strategy to the relevant segment in order to
increase satisfaction and market share in a profit-making organization.
6.2 RECOMMENDATIONS FOR FUTURE RESEARCH
The study has posed many questions that need to be answered in future and what follows is a
short list of possible areas for future research:
The current study looked at a heterogeneous population with a sample that was
externally heterogeneous and internally homogenous. The sample size of 51 was too
small to reach any conclusions that could be applied to a population of approximately
47 million people. A bigger and more representative sample would be better able to
address the challenges in the DHA customer service and service delivery in a more
accurate manner and also focus in-depth on determining the causes of the lack of
service delivery in all the government departments.

92
A study that is conducted amongst people in the queues at a Home Affairs office could
highlight trends within this department and enable a comparative analysis (especially
on gender, age and racial ground).
A study of people in the high-income bracket may generate more ideas of how to go
about establishing an Exclusive Home Affairs office that operates like a bank. This
exclusive service will charge more for the same service that ordinary people pay a
minimal amount at DHA, but it will save time for an Identity document they will pay R
150.00 instead of R15.00 but the service will be faster, better and more efficient (or
self service if possible).
There are number of focus areas that this study was unable to examine. There are other
studies that might have touched on the below-mentioned topics. However, future
studies could consider the following topics that arises from this study:
Effectiveness of service delivery in public sector;
Customer perceptions of service delivery;
The impact of a turn-around strategy in the DHA;
Government strategies on service delivery;
The impact of training officials to provide better customer service;
How leadership affects customer service; and
The effectiveness of a customer-focused organization.
6.3 RECOMMENDATIONS TO IMPROVE CUSTOMER SATISFACTION
Customer satisfaction is not just a dream but it is a practice that every customer service
business needs to constantly be aware of and striving for. In a competitive environment, the
ultimate measure of satisfaction is whether or not the customer returns to buy a product a
second, third or fourth time (Etzel, Walker and Stanton, 1997: 34). This statement highlights
the importance of the need to provide proper customer service to avoid the situation of
dissatisfied clients. One of the challenges is that, for instance, in the Durban Metropolitan area
has a population of 3.2 Million people with several DHA offices. This creates a problem for
93
DHA in terms of the workload and customer expectations. Whilst this recommendation may
occur to be elitism in nature it must be emphasised that current practice of agencies who
provide a fast track service outside DHA offices is fraught with problems which include
corruption, disrupting current services being offered and is an area of conflict between
customers standing in queues and agents who cut the lines. It is therefore recommended that
an elite service which more affluent people can afford will ensure proper service delivery and
form a new stream of income for DHA.
6.3.1 Establishment of Exclusive Home Affairs offices
This would be relieved if the DHA were to establish another Exclusive Department of Home
Affairs (EDHA) office that was geared to serve people who could afford to pay extra for the
service that they required. This alternative was suggested by some of the respondents. Many
people would support the establishment of EDHA, especially those busy executives who do
not have time to spend in a queue at a Home Affairs office waiting to be served. There has
been a call for a better solution that will improve service delivery in DHA. In 2007 DHA had a
turn-around team to assist in a turn-around strategy. That exercise cost the DHA almost R 1
billion in just 18 months and it did not make any huge difference to improve service delivery.
6.3.2 Inefficiency and Leadership
The DHA has been quoted in a number of newspapers when analysts and journalists were
criticizing the Department, claiming that DHA staff members were inefficient and that there
was a lack of leadership amongst managers and high levels of incompetence.
6.3.3 Training of official to work better, faster and differently to improve service
The re-training of staff members from the lowest levels right up to senior members is
recommended. The implementation of better systems, especially IT systems are critical to
make sure that the quality of service is improved. It is also important to create a good working
environment for employees at DHA and to motivate those employees who are currently
demotivated. In a study that was conducted by independent consultants, they found that more
that 75% of DHA employees were demotivated and not well trained to give a better service to
clients.

94
6.3.4 Fighting corruption among officials
The Department should have a proper structure and systems in place as well as strategies that
will assist in fighting corruption. They must establish an anticorruption directorate that works
together with SAP, NIB and NPA to effectively fight and combat corruption.

95
6.4 CONCLUSION
This study has been able to answer the research question as stated in Chapter One. The
research was the result of a personal interest in why DHA clients were not satisfied with
service delivery. The answer to this question is that there is a lack of customer service within
the Department of Home Affairs. It is also important to understand the behaviour of people
within the customer satisfaction environment in the public sector. This would be very helpful
in the light of the fact that in South Africa there is a diverse environment with a young
democracy that is 15 years old and also as a country that is developing at a very fast rate.
This would also enable such efforts to be customized towards a specific audience thereby
increasing its success rate. When people were asked about changes that they would like to see
in improving service in Home Affairs, it was apparent that it was not just the attitude of the
officials, but the entire customer service principle and trust that the clients did not have and
not received when they were at DHA. Corruption has been cited as a disease that is crippling
the systems in DHA and is weakening any attempts at service delivery in this department.
Stronger measures needed to be taken to eliminate corruption, which has a huge impact on
service delivery.
On a final note, DHA can improve its customer service levels by:
Staff need to be extensively trained in customer service and their performance in this
area needs to be constantly monitored ;
The physical environment of each and every DHA office needs to be refurbished to
high standards of cleanliness and efficiency;
Strategic appointments need to be made to management positions where people with
the right qualifications and personalities are tasked with implementing wide-ranging
changes;
Better systems need to be introduced, for example, when registering births (which
could be done at the hospital or clinic at the time of the baby‟s birth) and controlling
immigrants (by tightening up border controls and closing loopholes which allow for
fraudulent IDs to be issued) ;

96
Align the DHA systems with banks, SARS, SA Police Services, schools etc to verify
information and root out and eliminate corruption and fraud;
Partner with travel agents to provide off-site offices to deal with travel-specific
documentation quickly and efficiently;
Establish an Exclusive DHA which fast tracks the process in a better environment, but
at a premium fee for those who are willing to pay for the service and
Improve the call centre by employing more staff and increasing working hours.
97
Bibliography
Berry, C., Forder, A., Sultan, S. and Torres, M.M. (2004) The approaches to improving
the delivery of social service in difficult environments PRDE Working Paper, UK
Department for International Development.
Black, R.E (2003) „Where and why are 10 million children dying every year?‟ Lancet,
361: 226-34.
Chalmers, M. (2004) Spending to save? The analysis of the cost effectiveness of conflict
prevention versus intervention the onset of violent conflict: Phase 2 Synthesis Report.
Centre for International Cooperation Security, Department of Peace Studies, University of
Bradford.
Chandu, T. (2003) Leadership and governance in the South African public service. Public
Service Commission (PSC). South Africa. 30th
June 2003.
Cloete, F. and Wissink, H. (2000) Improving public policy. Pretoria:.van Schaik Publishers.
Cooper, D. and Schindler,P. (2001) Business research methods. New York: Mc Graw-Hill Irwin.
Department of Finance. (2000) Guidelines for Public Private Partnerships. Pretoria, April,p.6.
Department of Home Affairs. (2008) Annual Report, 2007/08.
Department of Home Affairs. (2009) Ikhaya News Letter. 2007/10-2009/03.
Department of Home Affairs. (2009) Strategic Plan. 2007/08-2009/10. Strategic plan volume 1. (Caring,
Compassionate and Responsive).

98
Department of Public Service and Administration, Learning and Knowledge Management Unit. (2004)
The Eastern Cape IMT Intervention. A synthesis of lesson learned.
Department of public service and Administration. (2002). Batho Pele Handbook: Service Delivery
Improvement Guide
Department of public service and Administration. (2003) Towards a ten year review. Pretoria:
Government Printers.
Department of Public Service and Administration. Service Delivery Review 2002-2004.
Dowson, M., and McInerney, D. (2001). Psychological parameters of students‟ social and work
avoidance goals: A qualitative investigation. Journal of Educational Psychology, 93,35-42.
Etzel, M.J., Walker, B.J. and Stanton, W.J. (1997) Marketing. 11th
edition. London: McGraw-Hill..
Fanaroff, R.M. (2002) The First South African public management conversation.
Stonehenge Conference Centre, Parys, Free State, South Africa. 01-04th
December.
Fraser-Moleketi, G. (2005a) Africa Public Day 2005. The role of the state in the
reconstruction of Africa. Televised panel debate of policy actors at Parliament
in Cape Town, Universities of Pretoria, Stellenbosch, Fort Hare, Kwazulu
Natal, Limpopo and in Bloemfontein, were linked via DSTV-channel 58.23rd May
2005.
Fraser-Moleketi, G. (2005b) Research for knowledge creation in Public Management. ASSADPAM
Conference, 2-3rd
June 2005, North West University (Porchefstroom Campus), North-West Province.
South Africa.
Freedman, M. and Tregoe, B.B. 2003. The Art and discipline of strategic leadership.
New York: McGraw-Hill.

99
Friedman, R. M. 2002. The First South African Public Management Conversation. Stonehenge
Conference Centre, Parys, Free State, South Africa. 01-04th
December.
Grant, B.G., Kinghorn, A. and Gorgens, M. 2004. Mitigating the impact of HIV
on service providers. Mobile Task Team on the Impact of Public Education.
Gildenhuys, J.S.H. and Knipe, A .(2000) The organization of government. Pretoria: van Schaik
Publishers.
Hackman, J.R. (1986) Leading teams. Boston: Harvard Business School Press.
Heijden, T. and Mladi, M. (2005). Organisational performance, success and
failures in the public sector. Journal of Public Administration. Vol.2 Issue No5
Jones, B. (2004) „The changing role of UN policies and the developmental factors
in situations of protracted crisis‟ in Harmer and Macrae(eds) Public Research
Report No. 18, Overseas Developmental Institute, London
Koopman, A. (1993) Transcultural management in African management . In Christie,
P. (ed.) Randburg: Knowledge Resources.
Kuye, J.O. (2003). Leadership and governance. University of Pretoria. School of Public
Management and Administration (SPMA). Pretoria. South Africa. 28th
November
2003.
Leedy, P.D. and Ormrod, J.E. (2005) Practical research. Planning and design. International Edition.
Lungu, G.F. and Esau, M. (1999) New Mandarins in old seats: some critical reflection on
the post of Director-General in the post-apartheid South African Public Service.
Administratio Publica. Vol 9. No. 1. June.

100
Miller, K. 2005. Public sector reform: governance in South Africa. Surrey:
Ashgate Publishing Company.
Mokgoro, J.(2001). Provincial experience in managing national policies on the
transformation of the Public Service. Public Administration and Development. Vol. 20.
Mti, L. (2003) Service delivery change management and accountability: service delivery
Learning Academy of Correctional Services. Journal of Public Administration, Vol.2, No.2,
pgs. 21-25
Muthien, Y.G., Khosa, M.M. and Magubane, B.M. (eds) (2000) Democracy and governance
review: Mandela’s legacy 1994-1999. Pretoria: Human Science Research Council.
Naidoo, G. (2004) Leadership and governance for a sustainable public service. The case for selected
South African public service organization. October 2004.University of Pretoria, South Africa.
Naidoo, G. (2005) A Transformative African leadership and governance framework
to improve service delivery in South Africa. Journal of Public Administration, Vol 2,
No2 pg 102.
Narrayan, D., Chambers, R., Singh, M.K. and Pelesch, P. (2000) Voice of
the poor: crying out for change. Washington DC: World Bank.
Ngema, K. (2004) Revitalising public service delivery: Gauteng dialogue on service
delivery. Journal of Public Administration, Vol.3, No.3, pgs. 64-67
Ngema, K. (2003) The Challenge of making service delivery happen: Gauteng dialogue
on service delivery. Journal of Public Administration, Vol.2, No.2, pgs 42-77
Ngcobo, S.E.C. (2006) Consumer perceptions of e-Commerce. Masters in Business Administartion
dissertation. Graduate School of Business. University of Kwazulu Natal,
101
Obura, A. (2003) Never again: educational reaction in Rhuwanda. Paris: International Institute
for Educational Planning.
Ozaralli, N. (2003) Effects of transformational leadership on empowerment and
team effectiveness. Leadership and Organization Development Journal, June p32.
Patel, I. (2005) Deeping service delivery through innovation: integrated service delivery.
Journal of Public Administration, Vol. 4, No.2, pgs. 72-73
Public Service Commission. (2001) A Report on the State of the Public Service. (South Africa).
November 2001.
Public Service Commission. (2000) Batho Pele Survey Executive Summary, Pretoria, June.
Rugumamu, S.(1998) Reflective account of the Working Group3: assessing good
governance. Developmental policy management Forum (DPMF). Proceedings of the
second DPMF Annual Conference on Democracy, Civil Society and Governance in
Africa, 7-10th
December 1998, Addis Ababa, Ethiopia.
Russell, E.W. and Bvuma, D.G. (2001). Alternative service delivery and public service
transformatiom in South Africa. The International Journal of Public Sector Management, Vol.14.No.3,
pp.241-264.
Rutayisire, J., Kanabano, J. and Rubagiza, J.(2004). Facing Rwanda’s future: the role of
curriculum reform in social reconstruction. Geneva: UNESCO International Bureau of Education,
Schacter, M. (2000) Public sector reform in developing countries: issues, lessons
and future directions. A paper prepared for the Policy Branch of the Canadian
International Development Agency.

102
Setsabi, A.M. (2001) African value and the leadership partnership project: What some
African scholars say. Maseru: IEMS/CCL Leadership Partnership Programme.
Sewell, B. (2003) What can we do more, better or differently to improve our services.
Journal of Public Management. Vol. 2, No. 1
Smith, A. and Vaux, T. (2003) Educational conflict and international development.
DFID, UK.
Sommers, M. (2004). Co-ordinating educational emergencies and reconstruction;
challenges and responsibilities. International Educational Planning, UNESCO. Paris.
Soobrayan, B. (2004). Education, training and development. South African Management
and Development Institute (SAMDI). Pretoria. South Africa. 9th
February 2004.
South Africa (Republic). (1997) Batho Pele- ‘People First’ White Paper on transforming
public service delivery. Pretoria: Government Printers.
Stewart, G. (1999) Crisis preventing: tackling the inequalities. Working Paper n 33, QEH,
University of Oxford.
Theron, F. (ed). (2000) Good governance for people: policy and management. School of Public
Management and Planning. University of Stellensbosch, Cape Town. South Africa.
Thompson, W. (2004) Delivering services in Nigeria: a roadmap. London: Office of Public
Services Reform.
Tshikwatamba, N.E. (2003) Editorial. Journal of Public Administration. Vol.38, No.3.
Van Niekerk, D., Van der Waldt, G. and Jonker, A. (2002) Governance, politics and
policy in South Africa. Cape Town: Oxford University Press Southern Africa.

103
Van Wyk, B., van der Molen, K. and van Rooyen, A. (eds). (2002) Outcomes-based governance:
assessing the result. Cape Town: Heinemann Publishers.
World Bank (2003a) Low Income countries under stress implementation trust fund.
Operations Policy and Country Offices, Washington: World Bank.
Internet References
Department of Home Affairs 2008/09 Annual Report [available at www.home-affairs.gov.za]
[Accessed on 15 June 2008]
www.info.gov.za/greenpapers/1996/transformingpublic.htm [Accessed on 23 May 2008]
www.dpsa.gov.za/documents/acts.../green-papers/pubservice.[Accessed on 23 May 2008]
http://www.idasa.org.za/index.asp?page=progemme_details.asp [Accessed 19 July 2008].
http://www.idasa.org.za/index.asp?page=output_details.asp [Accessed 27 July 2008].
http:/www.info.gov.za/otherdocs/1997/conrep.htm [Accessed: 20 July 200/8]).
http:/www.info.gov.za/otherdocs/1997/conrep.htm [Accessed on 25 July 2008].
http://penggerak.blogspot.com/2007/07/public-sector-performance-measurement.html
[Accessed on 23 July 2008].
http://www.dpsa.gov.za/batho-pele/beliefset.asp [Accessed 16 July 2008].
http://www.psc.gov.za/docs/report/2000/batho/summery.html [Accessed
17 July 2008] www.southafrica.ifo/essinfo/saglance/government
Internet 1 Author: Unknown (2008) „How are government services delivered in South Africa?‟
Available online: http://www.idasa-
.org.za/index.asp?page=output_details.asp%3FRID%3D849%26OTID%3D4%26PID%3D25
[Accessed on: 15 May 2008]
Internet 2 Author: Unknown (2008) „Service Delivery.‟
Available online: http://www.info.gov.za/whitepaper/1994/housing.htm
[Accessed on 15 July 2008]

104
Fiedrich, M. and Jellema, A. (2003) Legacy, gender and social agency: adventure in
empowerment . Action Aid UK/DFI. Available at: http//www2.dfid.gov.uk/pubs
/files/litgenempedpaper59.pdf [Accessed 15 May 2008]
Hobley, M. (2004) Chars organizational working paper 3: The voice-responsiveness
framework: creating political space. Available at: http://www.livelihoods.org/lessons
Asia/Chars. [Accessed 19 July 2008].
Klugman, J. (1999) Social and economic policies prevent complex humanitarian
Emergencies: lesson from experience. Policies UNU/WIBER, Helsinki. Available at:
http://www.wider.unu.edu/publications/publicans.pdf [Accessed 19 July 2008].
Nicolai, S. and Triplehorn, C. (2003) The role of education in protecting children in conflict.
Network Paper 42, Humanitarian Practice Network, and Available at:
http://www.odihpn.org/documents/networkpaper.pdf [Accessed 15 May 2008]
Mbeki, T. (2003) Interview with President Thabo Mbeki, SABC 2 TV2, 16 February 2003.
Access<http://www.gov.za/search97/cgi/97 Retrived: May 2008. [Accessed 15 May 2008]
Ostby, G. (2003) Horizontal inequality and civilization. Oslo: World Health Organisation. Available at:
http://www. Prio.no/page/preview/9429/html [Accessed 02 November 2008]
World Bank (2002) World Bank government low-income countries under stress: a task
force report. Washington: The World Bank Washington.
Available at: http://www1worldbank.org/operation/ licus/document/variouse.pdf
[Accessed 09 September 2008]
World Bank (2003b) World Development Report: Making service delivery work for poor
people. Washington: World Bank. Available at http://worldbank.org/edr/
wdr2004/text-30023/opendoc.pdf [Accessed 09 September 2008]

105
APPENDIX 1 SURVEY/ CLIENTS’ QUESTIONNAIRE
UNIVERSITY OF KWAZULU-NATAL
GRADUATE SCHOOL OF BUSINESS
MBA Research Project
Researcher: Simphiwe Ndlovu (073 536 8999)
Supervisor :Professor Anesh Singh (031 260 7564
Title of Survey
The purpose of this survey is to solicit information from you/ customer regarding Home Affairs
customer services. The information and ratings you provide us will go a long way in helping us
identifying problems. The questionnaire should only take 15-20 minutes to complete. In this
questionnaire, you are asked to indicate what is true for you, so there are no “right” or “wrong”
answers to any question. Work as rapidly as you can. If you wish to make a comment please write it
directly on the booklet itself. Make sure not to skip any questions. Thank you for participating!
QUESTIONNARE
DEMOGRAPHIC INFORMATION
1. GENDER
MALE FEMALE
2. RACE:
AFRICAN
COLOURED
INDIAN
WHITE
OTHER ……….
3. AGE:
16-25
26-35
36-45
46 and above
4. HOME LANGUAGE
SOUTH SOTHO
ENGLISH
AFRIKAANS
XHOSA
ZULU
OTHER, PLEASE SPECIFY………………………………………………..
5. MARITAL STATUS
MARRIED SINGLE DIVORCED/ SEPARATED
WIDOWED

106
6. JOB TITLE
PLEASE SPECIFY………………………………….
7. QUALIFICATIONS
BELOW GRADE 12
GRADE 12/ MATRIC
DIPLOMA
DEGREE
OTHER………………….
8. HOW FAR DID YOU TRAVEL TO GET TO THIS BRANCH?
LESS THAN 30 KM MORE THAN 30 KM
9. HOW LONG DID IT TAKE YOU TO GET TO THIS OFFICE?
10. WHAT SERVICE OR SERVICES HAVE YOU USED TODAY? ID Book Application
Birth Certificate
Death Certificate
Marriage Certificate
Passport Work Permit ID Collection
Other : Please Specify…………
10 MIN 20MIN 30MIN 1 HOUR 2HRS
&
MORE

107
SECTION B: CUSTOMER SERVICE RELATED ISSUES
PART1: CUSTOMER SERVICE IN DEPARTMENT OF HOME AFFAIRS QUESTIONS ITEMS: ‘PERMOT’ (PECEIVED EXTENT OF CUSTOMER SERVICE/SATISFACTION AND SERVICE IMPROVEMENT IN THE DEPARTMENT OF HOME AFFAIRS)
THE FOLLOWING QUESTIONS ASK ABOUT YOUR OWN EXPERIENCE AND FEELINGS REGARDING THE QUALITY OF CUSTOMER SERVICE YOU HAVE RECEIVED IN HOME AFFAIRS OFFICES. PLEASE RATE YOUR OWN CURRENT EXPERIENCE IN CUSTOMER SERVICE IN EACH OF THE FOLLOWING AREAS: DO SO BY CIRCLING THE NUMBER THAT BEST REPRESENT YOUR OPINION, FOR
EXAMPLE 3 5 =`STRONGLY AGREE’; 4 =`AGREE’; 3 =`EITHER AGREE NOR DISAGREE’; 2 = `DISAGREE’; DHA = DEPT OF HOME AFFAIRS 1=`STRONGLY DISAGREE’
PLEASE CIRCLE THE NUMBER THAT BEST
DESCRIBES YOUR OPINION REGARDING THE
FOLLOWING : TANGIBLES –PHYSICAL FACILITIES
STRONGLY AGREE
AGREE NEITHER AGREE NOR DISAGREE
DISAGREE STRONGLY DISAGREE
1.THIS HOME AFFAIRS OFFICE HAS ADEQUATE
SEATING 5 4 3 2 1
2.HOME AFFAIRS TOILETS ARE CLEAN AND
AVAILABLE 5 4 3 2 1
3.WATER AND SOAP TO WASH OFF INK AND
TOILET ROLLS ARE PROVIDED 5 4 3 2 1
4.THERE IS ENOUGH PARKING FACILITIES 5 4 3 2 1
5.THERE ARE ENOUGH AIR-CONDITIONING IN THIS
OFFICE 5 4 3 2 1
6.SIGNAGE ARE CLEAR AND PROVIDES GOOD
INFORMATION 5 4 3 2 1
7.THERE IS ACCESS FOR WHEEL CHAIRS IN THIS
OFFICE 5 4 3 2 1
8.THIS SERVICE POINT IS CLOSE TO BUS & TAXIS
ROUTE 5 4 3 2 1
9.THERE IS AN INFORMATION DESK TO HELP
CUSTOMERS 5 4 3 2 1

108
PLEASE CIRCLE THE NUMBER REGARDING THE
PERSONNEL/ STAFF IN HOME AFFAIRS STRONGLY
AGREE AGREE NEITHER
AGREE NOR DISAGREE DISAGREE STRONGLY
DISAGREE
1.THERE ARE ADEQUATE STAFF IN THIS OFFICE 5 4 3 2 1
2.STAFF ARE FREINDLY, HONEST AND DUTIFUL 5 4 3 2 1
3.STAFF IN THIS OFFICE ARE ALLWAYS AVAILABLE
AND READY TO HELP 5 4 3 2 1
4.THE INFORMATION GIVEN IN THIS OFFICE IS
ACCURATE AND HELPFUL 5 4 3 2 1
5. SENIOR STAFF OF DHA ARE APPROACHABLE 5 4 3 2 1
6. OFFICIALS SOMETIMES REQUEST MONEY
BEFORE THEY DISCHARGE THEIR DUTIES 5 4 3 2 1

109
PLEASE CIRCLE THE NUMBER THAT BEST DESCRIBE
YOUR OPINION REGARDING SYSTEMS IN HOME
AFFAIRS RECENTLY
STRONGLY AGREE
AGREE NEITHER AGREE NOR DISAGREE
DISAGREE STRONGLY DISAGREE
1.I AM HAPPY WITH THE COMMUNICATION WE RECEIVE
THROUGH SMS, TELEPHONES, MAIL AND IZIMBIZOS 5 4 3 2 1
2.THE QUEUING SYSTEM IN DHA IS GOOD 5 4 3 2 1
3. COMPUTERS ARE ALWAYS OUT OF ORDER IN THIS
OFFICE 5 4 3 2 1
4.CELL PHONE MESSAGES , INTERNET & POST ARE
MEANS OF COMMUNICATION TOOLS BETWEEN DHA &
ITS CUSTOMERS
5 4 3 2 1
5.MY PERSONAL INFORMATION IS SAFE AT DHA 5 4 3 2 1
6.I AM HAPPY WITH OPENING & CLOSING HOURS OF
DHA 5 4 3 2 1
7.DHA SHOULD OFFER ADDITIONAL SERVICES E.G. TAKING ID PHOTOS, SCANNING & PHOTOCOPY
5 4 3 2 1
8. ADDITIONAL SERVICES IN HOME AFFAIRS SHOULD
COME WITH EXTRA COSTS/CHARGES
9. BROCHURES & POSTERS PROVIDED IN THIS
OFFICE ARE INFORMATIVE 5 4 3 2 1

110
SECTION C: HOME AFFAIRS SERVICE RATING RELATED ISSUES PART 2: CUSTOMER SERVICE IN DEPARTMENT OF HOME AFFAIRS
1. How long have you been waiting in the queue today? (please circle your queuing time)
Under 30 minutes 31-45Minutes 46-59Minutes Above 1hour
2. Think of the service you received here. If you could change any thing what would you
change?
……………………………………………………………………………………………………
……………………………………………………………………………………………………
……………………………………………………………………………………………………
……………………………………………………………………………………………………
…………………………………………………………………………
3. How would you rate the overall service at Home Affairs? (Please tick below).
Very poor Below average Satisfactory Good Excellent
ADDITIONAL COMMENTS
THANK YOU FOR YOUR PARTICIPATION.

111
APPENDIX 2 CONSENT FORM
UNIVERSITY OF KWAZULU-NATAL
GRADUATE SCHOOL OF BUSINESS
Dear Respondent,
MBA Research Project
Researcher: Simphiwe Ndlovu (073 536 8999)
Supervisor: Prof A Singh (031 260 7564)
I am Simphiwe Emmanuel Ndlovu an MBA student, at the Graduate School of Business at
the University of Kwazulu Natal. You are invited to participate in a research project entitled
Designing a Customer Service Model to Improve Service Delivery at the Department of
Home Affairs The aim of this study is to create a customer satisfaction model that will improve service delivery in
DHA.
Through your participation I hope to understand you opinion. The results of the survey are intended
to contribute to better service delivery.
Your participation in this project is voluntary. You may refuse to participate or withdraw from the
project at any time with no negative consequences. Confidentiality and anonymity of records
identifying you as a participant will be maintained by the Graduate School of Business, UKZN.
If you have any questions or concerns about completing the questionnaire or about participating in this
study, you may contact me or my supervisor at the numbers listed above.
The survey should take you about 10 minutes to complete. I hope you will take the time to complete
this survey.
Sincerely
Investigator‟s signature____________________________________ Date_________________
______________________________________________________________________________
CONSENT
I _________________________________ the undersigned have read and understand the above
information. I hereby consent to participate in the study outlined in this document. I understand that
participation is voluntary and that I may withdraw at any stage of the process.
Participant‟s signature____________________________________ Date________________