Embed Size (px)
Citation preview
1
Measuring Customer Satisfaction and Loyalty:
Improving the ‘Net-Promoter’ Score
Daniel Schneider
Stanford University
Matt Berent
Intuit Corp.
Randall Thomas
Harris Interactive
Jon Krosnick
Stanford University
June, 2008
-- DRAFT --
2
Measuring Customer Satisfaction and Loyalty:
Improving the ‘Net-Promoter’ Score
Faced with competitive markets, companies are eager to focus their efforts on the
wishes and needs of the customers to retain old customers and to attract new ones. While
corporate communication directed at the customer is conducted by advertisement, in-
store promotion, public relation efforts and a range of other means, the flow of
information and feedback from the customer to the company is much more limited: for
example, companies track customers’ behavior while shopping or implement voluntary
feedback system.
Representative information from a large number of customers as well as non-
customers can be collected by using structured surveys. Surveys allow companies to ask
questions focused on specific topics of interest rather than relying on voluntary comments.
They allow customers to communicate their attitudes about and experiences with the
company back to the company. Surveys have become a common tool for many
companies to learn more about their customers and ultimately improve their satisfaction
with the company and its products. The rise of customer satisfaction as an important
concern for business leaders is not over yet: the National Retail Federation (NRF)
recently released survey findings indicating that among 418 executives across 137
companies in the retail industry customer satisfaction currently has the top priority
(Geller, 2008).
Business consultant Fred Reichheld (2003, 2006) proposed a single question as
the best and sufficient measure of customer satisfaction. Customers are asked, ‘How
3
likely is it that you would recommend [brand or company X] to a friend or colleague?’,
and they can respond by choosing a number between 0 to 10, with 0 labeled ‘not at all
likely’, 5 labeled ‘neutral’, and 10 labeled ‘extremely likely’. The responses to are then
aggregated and transformed into a single summary statistic, the Net-Promoter Score
(NPS). A company’s Net-Promoter Score is the difference between the proportion of
customers placing themselves at points 9 or 10 (called ‘promoters’) and the proportion of
customers placing themselves between 0 and 6 (called ‘detractors’). Respondents on scale
point 7 and 8 are called ‘neutrals’.
According to Reichheld and his collaborators the Net-Promoter question is all a
company needs to ask in their customer satisfaction surveys. At most a follow-up
question should be used to elicit reasons for the selected response option (Reichheld,
2003). Their conviction that likelihood to recommend is the best measurement for
businesses to understand the state of their customer relations is quite strong: “an
individual’s propensity for recommending a company to friends or colleagues may be the
most direct gauge of customer loyalty and ultimately, financial success” (Satmetrix, 2004:
7). The Net-Promoter question is the “ultimate question” (Reichheld, 2006), “[t] he one
number you need to grow” (Reichheld, 2003) and “the single most reliable indicator of a
company’s ability to grow” (netpromoter.com, 2008).
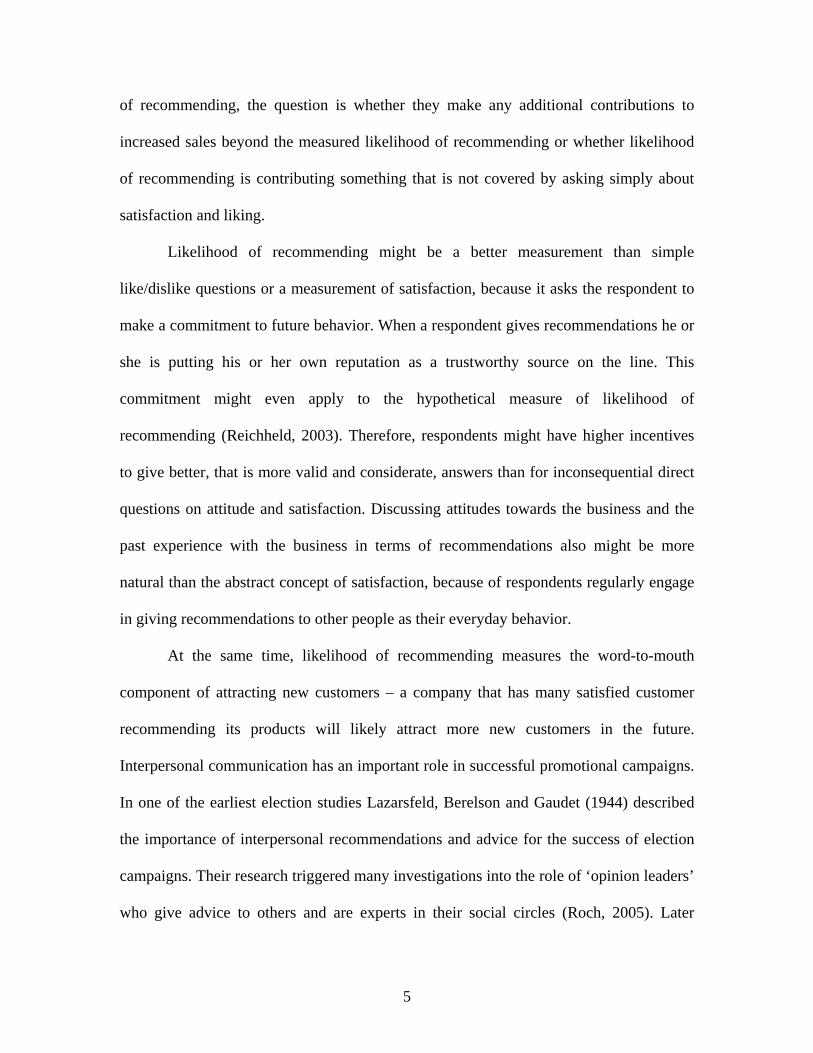
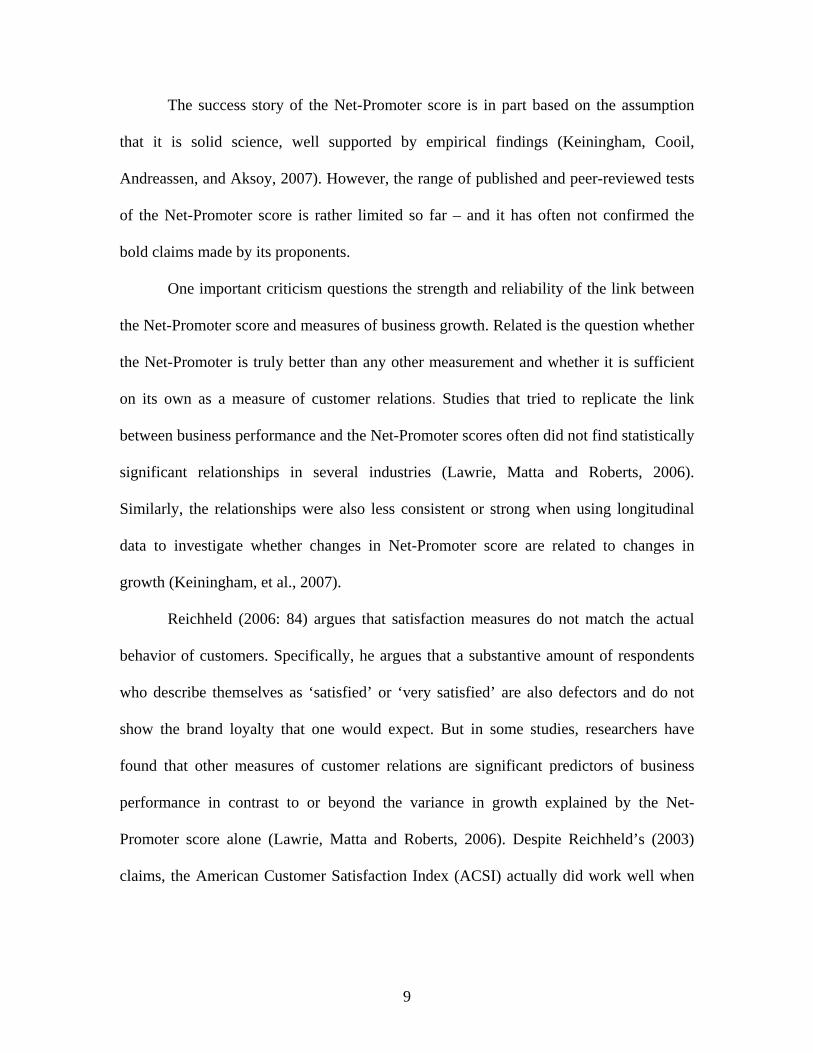
Likelihood of recommending does fit well with concepts of custom satisfaction
and purchase behavior. Put simply, likelihood of recommendations leads to actual
recommendations, which leads to positive impressions in other potential customers and
ultimately to new purchases and growth in sales (figure 1).
[INSERT FIGURE 1 HERE]
4
The likelihood to recommend itself should be based on a positive attitude towards
the company. This attitude could be measured, for example, with a question on how
much the customer likes or dislikes the company and its products. The customer’s past
experiences with the company, exposure to communication in mass media such as
reviews and advertisement, and communication with other customers about the company
will primarily contribute to the construction of that attitude. Past experience is reflected
in the satisfaction a customer feels in his or her interactions with the company. The word-
of-mouth communication is reflected by how many recommendations are given about a
company and therefore is influenced by how many people report the intention or
likelihood of recommending the company and its products. To increase sales, companies
want to increase customer satisfaction, how much respondents like their company, and
how many people are giving positive recommendations about their company when
talking to potential customers.
The customer-company interactions influence satisfaction, liking and the
propensity to give future recommendations. These three concepts are connected: if a
customer is satisfied he or she is more likely to give recommendations and probably
increases his or her liking of the company. Higher liking leads to more recommendations
as well. Higher liking and higher satisfaction turns directly into higher retention rates for
the company, but higher likelihood of recommendations would also measure the amount
of word-of-mouth promotion that might occur.
Reichheld (2006: 28) describes the Net-Promoter score as a measure that both
reflects “the emotional and the rational dimensions” of the relationship between the
customer and the company. If liking and both satisfaction are precursors of the likelihood
5
of recommending, the question is whether they make any additional contributions to
increased sales beyond the measured likelihood of recommending or whether likelihood
of recommending is contributing something that is not covered by asking simply about
satisfaction and liking.
Likelihood of recommending might be a better measurement than simple
like/dislike questions or a measurement of satisfaction, because it asks the respondent to
make a commitment to future behavior. When a respondent gives recommendations he or
she is putting his or her own reputation as a trustworthy source on the line. This
commitment might even apply to the hypothetical measure of likelihood of
recommending (Reichheld, 2003). Therefore, respondents might have higher incentives
to give better, that is more valid and considerate, answers than for inconsequential direct
questions on attitude and satisfaction. Discussing attitudes towards the business and the
past experience with the business in terms of recommendations also might be more
natural than the abstract concept of satisfaction, because of respondents regularly engage
in giving recommendations to other people as their everyday behavior.
At the same time, likelihood of recommending measures the word-to-mouth
component of attracting new customers – a company that has many satisfied customer
recommending its products will likely attract more new customers in the future.
Interpersonal communication has an important role in successful promotional campaigns.
In one of the earliest election studies Lazarsfeld, Berelson and Gaudet (1944) described
the importance of interpersonal recommendations and advice for the success of election
campaigns. Their research triggered many investigations into the role of ‘opinion leaders’
who give advice to others and are experts in their social circles (Roch, 2005). Later
6
research has further extended these concepts into theories of diffusion of innovation
(Rogers, 1995). The importance of interpersonal communication for successful
dissemination of innovations supports the notion that recommendations might be
important to facilitate business growth. In a recent study, Watts and Dodds (2007), for
example, investigated the role of networks of interpersonal communication in forming
public opinion independently from specific influentials or opinion leaders. However,
other research has shown that word-of-mouth communication might only be a small
component to promote business success (Godes and Mayzlin, 2004).
Many businesses have adopted the Net-Promoter technique and it has changed
how many executive managers make decisions. Some companies have decided to tie the
bonuses of their managers to performance on the Net-Promoter score (BusinessWeek,
2006). Many business leaders believe that they can trust the Net-Promoter score and its
properties and that it is a useful tool to guide business decisions. They talk confidently
about their experiences when using it as a management tool:
“I have little doubt that this will be as big and long-lasting for GE
as Six Sigma was.” – Peter McCabe, Chief Quality Officer, GE Healthcare
(BusinessWeek, 2006).
“Net Promoter gave us a tool to really focus organizational energy
around building a better customer experience. It provided actionable
insights. Every business line [now] addresses this as part of their strategic
plan; it's a component of every operating budget; it's part of every
7
executive's bonus. We talk about progress on Net Promoter at every
monthly operating review.” – Steve Bennett, President & CEO, Intuit Inc.1
“Responses are gathered immediately following the rentals
enabling local field management to follow up quickly on problems and
target areas for improvements. We're using the survey globally in our
worldwide car rental and Hertz network and even our licensees are
participating.” – Michel Taride, President, Hertz Europe Ltd.2
“But it's also how you measure the overall experience of your
customers. We use the measurement that's called NPS. It's the net
promoter score. It's very simple actually.” – Vicente Trius, President, Wal-
Mart Brazil. 3
“And increasingly, as are many progressive service organizations,
we're looking at this notion of net promoters […]; and what that gets us
more specifically is this question will you be a reference for Express
Scripts? Will you recommend this? You can ask a lot of questions, but at
the end of the day we think that that's the most important thing. And we
think that by holding ourselves to this score and planting that in our
organization, we're holding ourselves to a higher standard.” – Ed Ignaczak,
Senior Vice President Sales & Account management, Express Scripts,
Inc.4
1 http://www.netpromoter.com/success-stories/intuit.php, last accessed: 05/07/2008. 2 Q3 2007, Hertz Corp, Earnings Conference Call – transcript by Fair Disclosure Wire. 3 Fall Analyst Meeting, 2007, Wal-Mart Store Inc. – transcript by Fair Disclosure Wire. 4 Investor Meeting, 2007, Express Scripts, Inc. – transcript by Fair Disclosure Wire.
8
“[T]his is out of this book […], The Ultimate Question, by Fred
Reichheld, which we have found to be very valuable. And a couple of
years ago we started really organizing a lot of things around the net
promoters score. I won't walk through the calculation again, but it is
basically an all-in score of customer satisfaction.” – Patrick Bynre,
Chairman and CEO, Overstock.com Inc.5
This success shows how much a good measurement for customer satisfaction and
better understanding of customer loyalty was needed. Fred Reichheld was known as an
expert and prolific writer on customer loyalty before publishing on the Net-Promoter
scores (Reichheld, 1996; Reichheld, 2001), and the first article on the Net-Promoter score
was published in the prestigious Harvard Business Review (Reichheld, 2003), helping
him to reach a large audience in the business community. His arguments and evidence
convinced them to follow his recommendation and implement the Net-Promoter score.
Reichheld (2003) based his claims on initial research with data collected on
customers of 14 different companies across six industries. In 11 of those 14 companies he
found that the Net-Promoter score performed better than other measures of customers
satisfaction in predicting actual purchase behavior on the level of individual customers.
Next, he and his collaborators conducted a large data collection and investigated the
relationship between growth indicators (growth in revenue, growth in shipment, etc.) and
aggregated Net-Promoter scores for different companies. They found, across a variety of
industries, that the Net-Promoter score was a strong correlate with indicators of growth
(Satmetrix, 2004). They reported R2s range from .68 to .93 (for the 6 industries reported
in Reichheld (2006)). 5 Q2 2007, Overstock.com Inc, Earnings Conference Call, transcript by Fair Disclosure Wire.
9
The success story of the Net-Promoter score is in part based on the assumption
that it is solid science, well supported by empirical findings (Keiningham, Cooil,
Andreassen, and Aksoy, 2007). However, the range of published and peer-reviewed tests
of the Net-Promoter score is rather limited so far – and it has often not confirmed the
bold claims made by its proponents.
One important criticism questions the strength and reliability of the link between
the Net-Promoter score and measures of business growth. Related is the question whether
the Net-Promoter is truly better than any other measurement and whether it is sufficient
on its own as a measure of customer relations. Studies that tried to replicate the link
between business performance and the Net-Promoter scores often did not find statistically
significant relationships in several industries (Lawrie, Matta and Roberts, 2006).
Similarly, the relationships were also less consistent or strong when using longitudinal
data to investigate whether changes in Net-Promoter score are related to changes in
growth (Keiningham, et al., 2007).
Reichheld (2006: 84) argues that satisfaction measures do not match the actual
behavior of customers. Specifically, he argues that a substantive amount of respondents
who describe themselves as ‘satisfied’ or ‘very satisfied’ are also defectors and do not
show the brand loyalty that one would expect. But in some studies, researchers have
found that other measures of customer relations are significant predictors of business
performance in contrast to or beyond the variance in growth explained by the Net-
Promoter score alone (Lawrie, Matta and Roberts, 2006). Despite Reichheld’s (2003)
claims, the American Customer Satisfaction Index (ACSI) actually did work well when
10
used as a predictor of growth compared to the Net-Promoter score – even when applied to
data used by Reichheld himself (Keiningham, et al., 2007).
Most studies investigated the relationship between Net-Promoter score and
business performance at the macro-level of companies. However, the initial studies by
Reichheld (2003, 2006) were at the level of individual behavior. When investigating the
relationship between individual intentions to recommend and variables such as purchases
or recommendations, his findings have replicated well and the Net-Promoter score did
emerge as a good measurement for customer loyalty. However, other measures make
their own contribution to understand future behavior of customers and it is probably not
sufficient to only measure the likelihood of recommending to reflect the multi-
dimensional structure of loyalty-based behavior (Keiningham, Cooil, Aksoy, Andreassen
and Weiner, 2007).
In addition to doubts on the sufficiency of the Net-Promoter score, universality
across different industries has been disputed as well. Reichheld (2003: 48) does admit
that the universality of the Net-Promoter score might be limited: “Although the ‘would
recommend’ question generally proved to be the most effective in determining loyalty
and predicting growth, that wasn’t the case in every single industry”. Nonetheless, he
recommends using the same question and the same cut-off values for all industries and
companies.
Fixed cut-off points make the Net-Promoter score simple and universal. However,
it is claimed they apply universally to all industries and that their implied meaning (where
promoters start and where detractors end) is constant across industries and companies
(Lawrie, Matta and Roberts, 2006). Using the cut-off points to calculate the Net-Promoter

11
score also introduces another problem: an identical change in the overall score can result
from different underlying changes in the proportions of detractors and promoters, a result
of the ecological fallacy problem.
There also have been further conceptual critiques of treating likelihood of
recommendation as a possible cause of growth in businesses. Reichheld (2006: 43+44)
does admit that the Net-Promoter score itself is not “the engine of growth”, but rather an
indication of the state of relationships between a company and its customers – it is not
alone sufficient for growth. But recommendations are not exogenous to growth or sales
either. The more people purchase a product, the more customers are available for giving
recommendations and the more people might purchase them same product again (e.g.,
Gladwell, 2000). Research on cognitive dissonance suggests that people would like to see
their own past behavior (i.e., buying a product) in a positive light and therefore adjust
their evaluation of the company positively if they have decided to buy their product
(Cummings & Venkatesan, 1976; Feistinger, 1957). Therefore, a higher number of sales
by itself might increase the number of people who are willing to recommend a product
and increase the Net-Promoter score without any actual change in the business behavior
shown by the company.
A correlational relationship between variables such as likelihood of
recommending and business growth does not prove a cause-and-effect relationship
(Grisaffe, 2004). The assumption of a causational relationship is the foundation for many
of Reichheld’s claims, but it might be a mistaken, rather both likelihood of
recommending as well as business growth could be the results of other factors and
12
therefore show a spurious relationship. For example, both might be driven by satisfaction
with the company’s products and services.
A good measurement of customer satisfaction should also provide enough
information so that it can be used to make decisions and change the business conduct.
The information provided by the Net-Promoter score might be to simplistic to be
sufficient for real effective adjustments (Lawrie, Matta and Roberts, 2006). It lacks
information, for example why people are feeling compelled to give other people
recommendations, how strongly they would give recommendations (the likelihood scale
only measures the likelihood of a recommendation occurring not specifically how
strongly that recommendation would advocate the products of the company), or what
reasons are driving a specific likelihood to give recommendations. The use of the Net-
Promoter score as a summary statistic also hides underlying attitudes and perceptions in
specific groups of customers and how they affect the business. The score is reminiscent
of old ‘top-two-box’-approaches that have been abandoned in modern customer
satisfaction surveys (Ruf, 2007).
Two further issues that have been raised are the lack of scientific rigor and
potential research bias in how the success of the Net-Promoter score is portrayed.
Reichheld’s methods and results are not well documented and have not been subject to
peer-review. The data used by Reichheld (2003, 2006) and Satmetrix (2004) are not
publicly available for replication – the only attempt at direct replication of the analyses
used graphical software to infer the data set from the published graphs (Keiningham, et
al., 2007). It is especially ironic that Reichheld (2006) provides a list of different
recommendations for conducting Net-Promoter surveys and what information should be
13
reported with them (such as response rates or what provisions were taken when collect
the data), but at the same time does not hold his own reports to those same standards.
Reichheld and his collaborators claim that they investigated both correlations as
well as statistical significance, but statistical significance is not reported in any of their
studies. The few number of companies in each individual regression dramatically reduces
their statistical validity: each of the analyses only used three (Internet Service Provider
(ISP) industry) to ten different companies (airlines) (Reichheld, 2006). The opt-in
surveys used in Reichheld (2003, 2006) analyses are not a random draw of customers or
all possible customers including non-customers. At the same time, companies are not
randomly selected from the universe of possible companies, but more often are either
reflecting the entire universe of companies in an industry or are an arbitrary selection of
companies. The report by Satmetrix (2004) mentions that data was collected for over 400
companies, but data only from 50 of those companies was included in their analyses. The
results reported in Reichheld’s article and book are limited to those where the Net-
Promoter score was successful, leaving readers to doubt how those were chosen for
publication and introducing the very real problem of bias by the researchers (Keiningham,
et al., 2007).
While past studies have focused on the overall performance of the Net-Promoter
score from the perspective of consumer behavior and marketing research, we bring a new
perspective to the discussion, using the rich research tradition on questionnaire design to
improve the Net-Promoter score and evaluate its measurement properties. We ask three
primary questions: Can the Net-Promoter score be improved by applying rules of sound
questionnaire design? How good are the principles used by Reichheld (2003, 2006) in
14
constructing the scale and building the summary statistics? And how well does the Net-
Promoter score compare to well-designed measures of liking and satisfaction?
In this paper we present the results of two studies, both investigating
improvements and alternatives to the Net-Promoter scale. Our goal is to develop an
effective measurement that researcher as well as business professionals can use to gauge
the performance of companies in their business transaction with customers. Before we
present the results of our investigation, we will outline some possible problems with the
existing Net-Promoter Score scale from the perspective of survey researchers and
formulate general hypotheses that were guidelines for the design of the two empirical
studies presented afterwards.
The Net-Promoter Measurement: A Critique
A great deal of previous research on questionnaire design suggests that the
measurement used for the Net-Promoter Score might not be optimal (Krosnick &
Fabrigar, 1997; Krosnick & Fabrigar, forthcoming).
First, the scale presumably seeks to measure a unipolar construct (likelihood of
recommending the company, ranging from 0% to 100% probability). Past work suggests
that unipolar constructs are measured most reliably and validly by offering five scale
points, however the scale recommended by Reichheld (2003, 2006) has 11 scale points.
Reichheld makes some arguments in favor of the 11-point scale (Reichheld, 2006: 84 +
85), but all his evidence is argumentative and anecdotal. Our hypothesis is that reducing
the number of scale points will increase the performance of the scale.
Second, placing the label ‘neutral’ on the midpoint is problematic, because
‘neutral’ represents a lack of evaluation, rather than a 50% chance of recommending a
15
company, which is presumably the intended meaning of the midpoint for a likelihood
scale. At the same time it suggests the measurement of a bipolar construct, potentially
leading some respondents to indicate whether they would give positive or negative
recommendations on the overall scale. Reichheld’s (2006: 88) argument for the ‘neutral’
scale point seems to be based on the notion that it allows respondents to be neither
positive nor negative towards the company, although this distinction does not apply to the
unipolar construct reflected in likelihoods. Surprisingly, the group of respondents on
scale points 7 and 8 called ‘neutrals’ do not overlap with the actual ‘neutral’ point of the
scale – it seems as if the survey practitioner would intentionally interpret the scale
differently than a respondent.
Third, past work indicates that rating scales yield the most reliable and valid
measurements when all scale points are fully labeled with descriptions, instead of
labeling only a few of them. Therefore, we also hypothesize that adding meaning labels
to each scale point as well as removing the confusing ‘neutral’ label for the mid-point
will improve the validity of the Net-Promoter scale.
Fourth, the unipolar scale used by Reichheld (2003, 2006) might by insufficient to
measure the complexity of recommendations. It does not differentiate between positive
and negative recommendations nor does it incorporate the strength of a recommendation.
Research in social psychology has shown that attitudes can have both positive and
negative dimensions (Cacioppo and Berntson, 1994). We therefore extended our
investigation by developing a bipolar scale of positive and negative recommendations as
well as using a design with two separate questions for positive and negative
recommendations.
16
Finally, Reichheld’s (2003, 2006) most important argument for using the Net-
Promoter scale is that it is the single best question to measure a businesses performance
in customer interactions and that it is sufficient for that purpose. However, likelihood of
recommending should be linked to the general attitude toward the company as
represented by satisfaction and liking. In addition, these constructs are all linked to the
outcome variables of interest such as the actual number of recommendations (attracting
new customers) or future purchase behavior (customer retention). Liking, as the affective
disposition towards the company, brand or product should be predecessor to any purchase.
It could also be affected by the business interaction and therefore could be a mediator
between the experience during a business interaction and the likelihood to recommend.
Satisfaction is the outcome of the business interaction and might affect both liking and
likelihood to recommend (or in a longer causal chain affect liking which in turn affects
likelihood to recommend). If satisfaction is linked to the likelihood of recommending it
could still be a useful, perhaps even a better predictor of business performance. We
decided to include well-designed measurements of both in our study and test how they
performed compared to the likelihood of recommending score in predicting actual
recommendations and other outcome variables of interest.
Study 1: Data and Methods
In the first study we focused on applying guidelines of good questionnaire design
to the response scale used in the Net-Promoter question. We also compared the question
to alternative measurements of liking and satisfaction.
Data and Measurements. We collected data on customer satisfaction, frequency
of recommending, and frequency of purchasing goods and services from 32 companies
17
via an Internet survey of 2,227 volunteer American adults conducted by Lightspeed
Research in 2007. Lightspeed’s respondent pool is recruited through several methods
including co-registration (the practice of referring leads concurrent with another
registration process), traditional banner placements, and affiliate networks (value-added
online media intermediaries that perform marking services for websites in the
consortium). Recruited participants are then sent e-mails and electronic newsletters
soliciting participation in online surveys. Lightspeed Research advertises with both
general topic websites with broad appeal as well as special interest sites, which creates a
diversity of profiles and provides the ability to target-recruit certain demographics when
required. Based on data from the U.S. Census Bureau’s Current Population Survey,
Lightspeed Research quota sampled its panel members in numbers such that the final
respondent pool would be reflective of the U.S. population as a whole in terms of
characteristics such as age, gender, and region.
The 32 companies used come from seven industries: drug stores (5 companies),
supermarket chains (4 companies), home improvement and hardware stores (3
companies), pet supply stores (3 companies), electronics stores (3 companies), car rental
companies (5 companies), and airlines (9 companies).
Respondents were randomly assigned to four different response scales for the
Net-Promoter question: the original 11-point Net-Promoter scale (‘not at all likely’ at the
lowest value, ‘neutral’ at the middle point, ‘extremely likely’ at the highest value), a 7-
point scale with labels identical to the original 11-point scale, a 7-point scale with full-
labels (‘not at all likely’, ‘slightly likely’, ‘somewhat likely’, ‘likely’, ‘very likely’,
‘remarkably likely’, ‘extremely likely’), and a 5-point scale with full-labels on all scale
18
points (‘not at all likely’, ‘slightly likely’, ‘moderately likely’, ‘very likely’, ‘extremely
likely’). The question wording matched the recommended wording for the Net-Promoter
score: ‘How likely is it that you would recommend each of the following companies to a
friend or colleague?’ Each scale was standardized to range from 0 to 1, to allow
comparability.
In addition, we asked the respondents several other questions. First of all, we
asked how often they actually had been customers of the companies in the past. For both
rental car companies and airlines this question was referring to the past two years, for all
other companies to the past six months. Afterwards, each respondent was asked ‘During
the last 6 months, how many times did you recommend each of the following companies
to a friend or colleague?’ We discovered that a few of the respondents indicated a very
high number of past recommendations. To avoid potential problems with outliers and
their potential strong influence on the overall outcome of our analyses, we excluded the
top .10% of the number of past recommendations, limiting the analyses to any responses
with less than 20 recommendations.
We measured satisfaction by asking ‘Overall, how satisfied are you with the each
of the following companies?’ (11-point scale, ‘extremely dissatisfied’ at the lowest value,
‘neutral’ at the mid-point, ‘extremely satisfied’ at the highest value). Respondents were
also asked to indicate how much they like the companies: ‘How much do you like or
dislike each of the following companies?’ (7-point scale; ‘dislike a great deal’, ‘dislike a
moderate amount’, ‘dislike a little’, ‘neither like or dislike’, ‘like a little’, ‘like a
moderate amount’, ‘like a great deal’). Both scales were recoded to range from 0 to 1.
19
Analyses. We investigated the validity of each of the four scales by predicting the
self-reported number of times the respondent had recommended the company to friends
or colleagues at the level of individual respondents. We set up a regression model to test
the difference in the strength of the relationship by statistically comparing coefficients
using interactions. Because the dependent variable is a count of recommendations, we
used a negative binomial regression estimator (Long, 1995). We pooled the responses of
all respondents for all companies and then added a series of dummies for the companies
as fixed effects and modeled the respondents as random effects – because all coefficients
were estimated within one regression, the impact of fixed effects as well as random
effects is constant between scales.
We also investigated non-linear relationships between the response to Net-
Promoter questions and the number of past recommendations. First, we included non-
linear representations of the independent variables into the regressions (squared and cubic
transformations of the independent variable) and checked whether they were significant.
If the cubic term was not significant, we removed it and re-ran the regression without the
cubic term. If the squared term was not significant at this point, no non-linear relationship
was found. Secondly, we used dummies to represent each scale point (excluded the first
scale point as contrast), completely freeing the model to represent the non-linearities.
Non-linear representations were estimated in individual regressions rather than a
simultaneous regression across all scales.
To compare the strength of non-linear relationships between the different scales,
we calculated a simple statistic of model fit. After running the regression, we generated
predicted values based on the model estimated. To match the predicted values against the
20
measured number of past recommendations, we rounded the predicted values to the
nearest whole number. We then calculated the proportion of observations where the
predicted value matched the observed value – the higher that proportion, the better the
model fit the data.
Finally, we compared how well stated likelihood of recommending, satisfaction,
and liking predict actual recommendation frequency, using the same set of models as
before, with interactions in a negative binomial regression to compare the strength of the
different relationships to the dependent variable. We re-ran the regression restricting the
analysis to those respondents who used the best scale according to the tests conducted
before. We then combined all three scales into a single regression to investigate how they
perform when controlling for each other’s effects and to learn something about possible
relationships between the three constructs of recommendations, liking, and satisfaction.
All analyses were run both for all respondents and only for those respondents who
had actually been customers of the company they are evaluating.
Study 1: Results
First we will conduct a brief graphical analysis of the data collected. While figure
2 is showing the distribution of responses by all respondents, figure 3 is restricted to
those respondents who actually had been customers.
Both scales using ‘neutral’ as the middle scale point attract many responses to this
scale point, while the two scales with full labels for all scale points and a meaningful
middle point exhibit a higher number of responses on the ‘not likely at all’ scale point
and a fairly normal distribution across all other scale points (figure 2).
[INSERT FIGURE 2 HERE]
21
There is further evidence that the ‘neutral’ scale point distorts the distribution of
answers over the scale, because response interpret it as the zero-point of the scale.
Including the ‘neutral’ option provides the respondents with a contradicting signal to the
‘not likely at all’-point and even though especially non-customers were affected, it cannot
be ruled out that this confusion also affected the results among the customers. From the
differences between figure 2 and figure 3 we can infer that respondents who did not have
any business relations with the companies picked either ‘Not at all likely’ as their answer
or were often drawn to ‘neutral’, when this option was presented. More specifically, we
found that of non-customers 78.96 % chose the ‘neutral’ mid-point of the scale.
Both scales that used a ‘neutral’ mid-point have very few respondents left of the
mid-point, also pointing to some ambiguities between the neutral mid-point and the ‘not
likely at all’ start of the scale. In contrast, both fully labeled scales exhibit a broader
dispersion across all scale points.
[INSERT FIGURE 3 HERE]
However, we are primarily interested in the relationship between the number of
past recommendations and the response option selected on the Net-Promoter questions.
Figure 4 shows the mean number of past recommendations for each response option for
each of the four scales used. Figure 5 shows the same results restricted to answers for
respondent who had been using the services and goods of the companies at least ones.
[INSERT FIGURE 4 HERE]
[INSERT FIGURE 5 HERE]
The relationship between the response chosen and the mean number of
recommendations is non-linear. However, the non-linear increase on both fully labeled
22
scales appears to be smoother than on the scales without full labels. The impact of the
‘neutral’ point on the first two scales is again showing an effect as a potential confusing
factor.
The stronger the relationship between the scale and the number of
recommendations, the more valid is the measurement of recommendation-likelihood. The
results of regressions statistically estimating the strength of the relationship between the
two variables are shown in table 1.
[INSERT TABLE 1 HERE]
The 7-point, partially labeled scale is the strongest predictor of the number of
recommendations (all respondents: b=6.49; customers only: b=3.95), followed by the
original ‘Net-Promoter’-scale (all respondents: b=5.76; customers only: b=3.45). The
pattern of results is almost identical for all respondents or for customers only. The
difference between the two partially-labeled scale is statistically significant (all
respondents: p<.001; customers only: p=.02). Both are also significantly larger than the
7-point fully-labeled scale and the 5-point fully-labeled scale (p<.001 in all comparisons).
The difference between the two fully-labeled scales is not significant for all respondents
(p=.83), but it is significant for the customers-only sub-group (p=.03).
To account for the possible non-linear relationship between the scales and the
validity criterion, as seen in figures 4 and 5, we decided to investigate non-linear
relationships between the scales and the number of recommendations, and therefore
added a squared and a cubic term. When the cubic term was non-significant we removed
it and re-ran the regression. Results are shown in table 2.
[INSERT TABLE 2 HERE]
23
The non-linearity of the relationship is confirmed by the regression results. For
the original NPS scale with 11-scale points, the linear term turns out to be insignificant
(b=1.03; p=.39), and both the quadratic and the cubic term are significant (quadratic:
b=10.67; p<.001; cubic: b=-6.43; p<.001).6 Similarly, both the quadratic and cubic terms
were significant in almost all other regressions.
However, the overall result with respect to the validity of the scales remains
unchanged, the percentage of correct predictions is highest for the 7-point scale with
partial labeling. The two fully labeled scales and the original Net-Promoter-scale are
almost identical in their predictive capacity.
We further relaxed the linearity assumption by setting up negative binomial
regressions with dummies for each response scale position (omitting the lowest value on
each response scale). These dummies grant the regression the highest degree of freedom
in reflecting the shape of the relationships. The results, expressed in correct predictions
based on the models, are shown in table 3.
[INSERT TABLE 3 HERE]
Once again, the 7-point partially labeled scale emerges with the best model fit of
83.73 % for all respondents or 39.41 % for customers only.
We were also interested in comparing the likelihood of recommendations to other
possible measures of customer loyalty such as satisfaction and liking. We investigated the
power of all three measurements with all respondents, but also restricted the analyses to
those respondents who were answering on the 7-point partially-labeled likelihood of
recommending scale, because we found it to be the most valid scale, as described in the
6 When we re-ran the regression excluding the linear term entirely, the results remained substantively unchanged.

24
previous paragraphs. The results for all four sets of respondents (all respondents,
customers only, all respondents in the 7-point partially-labeled group, all customers in the
7-point partially-labeled group) are shown in table 4.
[INSERT TABLE 4 HERE]
In all results the measurement of likelihood of recommendations does have a
weaker relationship to the number of recommendations than both the questions
measuring liking and satisfaction (p<.001 for all regressions). Liking is also significantly
stronger than satisfaction in all but one of the regressions (all respondents: p=.15;
customers only: p=.006; all respondents with 7-point, partially-labeled scale: p=.006;
customers only with 7-point, partially-labeled scale: p=.003).
[INSERT TABLE 5 HERE]
In table 5 the three different constructs are included in one simultaneous
regression, controlling for each other (again the regressions were run for all respondents,
customers only, all respondents that were assigned to the second recommendation scale
with 7-point partial-labeling and customers assigned to that condition).
The results confirm the strong predictive quality of asking people whether they
like or dislike a company (in addition, the liking scale also follows the recommendations
for scales mentioned earlier, such as having 7-points for bipolar scale, full labels and no
neutral label). For all respondents liking is stronger than both satisfaction (p=.007) and
recommending (p<.001). Satisfaction is also a stronger predictor than the likelihood of
recommending (p=.004). Among customers, the difference between satisfaction and
liking is not significant (p=.23). However, liking and satisfaction are both significantly
stronger predictors than the likelihood of recommending for customers (p=<.001 in both
25
cases). To improve the results for the scale measuring the likelihood of recommendation,
we re-ran the models with only those respondents that answered the 7-point scale with
partial labels. The results (in the two right columns of table 5) confirm that liking is the
best predictor of the number of recommendations (all respondents, both likelihood of
recommending and liking: p<.001; customers only; compared to satisfaction: p=.31;
compared to likelihood of recommending: p=.004), but likelihood of recommending and
satisfaction were not significantly different from each other (all respondents: p=.37;
customers only: p=.11).
Study 2: Data and Methods
In the second study we intended to replicate and confirm the results of the first
study as well as extend our investigation. We added a number of dependent variables,
new scales measuring likelihood of recommending as a two-dimensional construct
describing both positive and negative recommendations and manipulations of the liking
measurement. We also carefully selected the companies for our studies to compare the
measurements to actual business performance by selecting those companies for which we
could obtain accurate measures of business performance. At the same time, we picked
companies that are well known enough that we would get a wide range of responses from
a general population sample.
Data and Measurements. From January 23, 2008 to February 8, 2008,
respondents who were 18 years or older from the U.S. were randomly selected (using a
quota sampling strategy based on age, sex, region of country, income, education, and
ethnicity) from the Harris Poll Online panel. The Harris Interactive panel has over 6
million members who have been recruited through various websites and online panel
26
enrollment campaigns. We selected 28,089 respondents and sent an email invitation to a
password-protected web-based survey on political and consumer issues. Respondents
were sent one reminder inviting them to complete the survey. We had 4,883 respondents
who entered the survey, 4,326 completed the survey.
As part of a larger survey, the experimental section was presented an average of
11 minutes after the beginning of the survey. Respondents first answered some basic
questions concerning age, sex, and country of residence, a series of questions designed to
assess need for cognition and susceptibility to social pressures, and then a section on
politically-related attitudes and behaviors. For the Net-Promoter section, we first asked
how familiar respondents were with a series of automotive manufacturers and airlines.
Eight brands were presented for both automotive manufacturers and airlines. The order of
target type (automotive or airline) was randomized and the order of brands within a list
was also randomized. Respondents who indicated that they were at least ‘only slightly
familiar’ with a brand were then asked if they had ever owned a car made by the auto
brand or flown on a flight with the airline, using a Yes-No Grid. If a respondent indicated
‘ever owned’ or ‘ever flown’ they were then asked if they had owned an auto made by
the brand in the past 5 years or if they had flown on the airline in the past 2 years, also
using a Yes-No Grid. This later variable was used to distinguish customers from non-
customers in our analyses.
Respondents who indicated at least slight familiarity with a brand were eligible
for assignment to the track containing the brand (automotive or airline). If a respondent
was eligible for both tracks, they were randomly assigned to either the auto or airline
track (with a 60 to 40 automotive to airline ratio to ensure approximately equal numbers
27
for the ‘ever owned’ or ‘ever flown’ behaviors). Once assigned to a track, respondents
were assigned to one brand with which they were at least ‘slightly familiar’ for the first
brand to evaluate (randomly chosen if more than one brand could be assigned). If they
were at least slightly familiar with at least one other brand, they were assigned to evaluate
a second brand (again, randomly choosing among those ‘slightly familiar’ or higher).
Respondents were randomly assigned to one of six response scales measuring
likelihood of recommendation. We first used the same scales that we used in the first
study to further validate our results (for a description, see above). The question wording
was slightly adjusted to better fit to the corresponding product. When the question was
regarding car manufacturers, we asked ‘How likely is it that you would recommend
buying a car made by [COMPANY] to a friend or colleague?’ and for airlines we asked
‘How likely is it that you would recommend flying on [COMPANY] to a friend or
colleague?’
In addition to the previously used four rating scales we included two new versions,
which added the dimension of ‘recommending against’ a specific brand or product. In the
first condition, we used a unipolar, 5-rating scale to measure likelihood of recommending
a car company or airline (the same measurement as used in the fourth condition of the
four previous scales) and then added a second, independent question regarding the
likelihood of ‘recommending against’ also with 5 fully labeled scale points. The second
new scale combined both ‘recommending’ and ‘recommending against’ in one single,
bipolar scale with 7 fully labeled scale points (‘extremely likely to recommend against’,
‘moderately likely to recommend against’, ‘slightly likely to recommend against’,
‘neither likely to recommend nor recommend against’, ‘slightly likely to recommend’,
28
‘moderately likely to recommend’, ‘extremely likely to recommend’). For this scale we
adjusted the question wording and it now read: ‘How likely is it that you would
recommend buying a car by [COMPANY] or recommend against buying a car made by
[COMPANY] to a friend colleague?’ (adjustments to airlines as above). The two new
scales have in common that they extend the likelihood of recommending into a two-
component construct of positive and negative recommendations, but the two separate
questions treat these dimensions as independent, while the 7-point bipolar scale restricts
them to opposite ends of the same dimension.
Satisfaction was measured with a 7-point, bipolar scale similar to the one in the
study 1, but improved according to previous findings in the literature on questionnaire
design. However, to experience satisfaction the respondent should have been engaged in
a business transaction with the company. We therefore improved the question by asking
those respondents who had not been customers were to hypothetically state how satisfied
they might be when purchasing a car or flying on one of the airlines.
We tested three different measurement scales for overall liking of the brand. First,
we used the same bipolar scale used in study 1 ranging from ‘dislike a great deal’ to ‘like
a great deal’ with 7-fully-labeled scale points. Second, we used a five-point, unipolar
scale (‘do not like at all’, ‘like a little’, ‘like a moderate amount’, ‘like a lot’, ‘like a great
deal’). Third, we used the same two-question approach to measuring liking and disliking
as two separate dimensions, offering the respondents both the 5-point, unipolar scale for
liking as well as an identical scale for disliking. We included these manipulations to test
whether changes to these scales similar to the two-dimensional structure in the likelihood
of recommending scales would improve their predictive power.
29
We included the same question as in the previous studies on the number of
recommendations the respondent has given in the past 2 years. To complement the newly
designed scales measuring likelihood of recommending against a product, we also asked
the respondents to indicate how often they have recommended against a company and its
products in the past 2 years. The number of positive and negative recommendations are
positively correlated for all respondents (b=.08, p<.001, N=8,531) but not for customers
only (b=-.04; p=.11; N=1,315).7
In addition to asking for the number of recommendations, respondents were also
asked to indicate to how many different people they gave a positive or negative
recommendation in the past 2 years. The number of people and the number of
recommendations are correlated (all respondents: b=.08; p<.001; N=8,533; customers
only: b=-.06; p=.06; N=1,322).8
As discussed in the introduction another integral component to a successful
business is the retention of customers. We therefore added another question asking
respondents to reflect on their own future business relation with the company: ‘During
the next 5 years, how likely are you to buy a car made by [COMPANY]?’ (adjusted
7 These correlations are estimated by using negative binomial regressions with fixed effects for the industry and random effects for respondents. We used the number of positive recommendations as the dependent variable and the number of negative recommendations as the independent variables, excluding any observations that had more than 19 positive or negative recommendations. We re-ran the regressions with reversed roles for the two variables, the result replicated well for the regression with all customers, but not as well for the regression that was restricted to customers only. In the later case, the p-values was much higher when the number of negative recommendation was used as the dependent variable (p=.88). 8 These correlations are estimated by using negative binomial regressions with fixed effects for the industry and random effects for respondents. We used the number of people given positive recommendations as the dependent variable and the number of people given negative recommendations as the independent variables, excluding any observations that had more than 19 people given positive or negative recommendations. We re-ran the regressions with reversed roles for the two variables, the result replicated well for all customers. As before, the level of significance dropped for the customers-only regressions when the dependent variable was the number of people given negative recommendations (p=.17).
30
accordingly for airlines). The response scale offered the options `not likely at all’,
‘slightly likely’, ‘moderately likely’, ‘very likely’, and ‘extremely likely’.
Finally, we asked respondents to indicate what they had heard about the company
in conversations rather than asking what they had said themselves or intended to say in
the future: ‘Next, we'd like to ask about whether you have ever talked with people
personally about their opinions regarding cars made by [COMPANY]. What have you
heard about [COMPANY]?’ The question on airlines was phrased accordingly. Response
options offered ranged from ‘all good things’, over ‘mostly good things, a few bad
things’, ‘about equal numbers of good and bad things’, ‘mostly bad things, a few good
things’ to ‘all bad things’. At the end of the scale respondents were given the option to
say ‘I have not heard anything’ – this response was recoded to the name scale point as
‘about equal numbers of good and bad things’ (any analyses run where unaffected by this
recoding and remained consistent when respondents who had not heard anything about
the company were simply dropped).
All scales were standardized to range from 0 to 1, to allow comparability. For the
scale using two independent questions we also calculated a difference score first ranging
from –1 (e.g., for respondent who selected both ‘extremely likely to recommend against’
and ‘not at all likely to recommend’) to 1 (e.g., for respondent who selected both
‘extremely likely to recommend’ and ‘not at all likely to recommend against’) which was
then also standardized to range from 0 to 1.
The indicators we picked to investigate the performance of the scales with real-
world business performance of the companies both are closely related to actual purchase
behavior. For airline companies we chose the number of passenger transported by each
31
airline and for car companies we chose the number of car sold for each brand. Both these
variables are directly related to customer behavior, probably more so than revenue or
profit, which are also depending on other factors (although Reichheld’s (2003, 2006)
claims are extending to very general business indicators as well).
Data on the number of passengers traveling with the different airlines is collected
by the ‘Bureau of Transportation Statistics’ at the U.S. Department of Transportation.9
We calculated the percentage change of passengers transported by each airline between
January 2008 and January 2007 as the business indicator for airlines. The average
percentage change for the time period between January 2008 and January 2007 was –2.82
%, with a range from –12.58 % to +5.07 %.
The number of cars sold in the U.S. is published monthly by the industry
magazine ‘Auto News’.10 We calculated the percentage change of cars sold for each
brand between March 2008 and March 2007. The average percentage change for the time
period between March 2008 and March 2007 was –9.67 %, with a range from –22.79 %
to +12.86 %.
The time period used to measure business performance did overlap with our field
period and most of it was prior to the field period. Although this means that it is possible
that the effects of the measurements taken in January have not yet manifested in business
performance, we are confident that our results still hold: first, we assume that for most of
the companies investigated here Net-Promoter scores and other measures of satisfaction
are rather stable and slow changing. Second, if there is a reduced relationship between the
measures and business performance because of the time period chosen for the business
9 Available for download at http://www.bts.gov/press_releases/airline_traffic_data.html. 10 Available for download at http://www.autonews.com/section/DATACENTER.
32
data, it seems probable that such an effect would equally apply to all different measures
taken in the survey.
Analyses. First, we replicated the analyses of study 1, using the same statistical
approach (negative binomial regressions with random and fixed effects) predicting the
self-reported number of (positive) recommendations with the different scales, using
interactions to test for differences in their relationship. In all regressions of the second
study we only included a dummy variable identifying the industry (either car
manufacturers or airlines) as the fixed effect, primarily because the number of
observations was fairly low when the sample was restricted to customers only and the
estimations were then less robust with too many fixed effects.11 We again excluded any
observations with more than 19 recommendations from any analyses.
All six scales were used at once; for the fifth scale, where we asked both for
positive and negative recommendations in two different questions, we only used the
negative scale as a predictor (the positive scale is by itself identical to the fourth scale) –
the scale was reversed so the direction of the effect would be identical to the other scales.
We then re-ran the regression replacing the likelihood of negative recommendations
measured in the two-question scale with the difference score between that scale and the
scale of negative recommendations.
Next, we repeated the same analysis using the number of negative
recommendations, the difference between the number of positive and negative
recommendations, the number of different people that were given positive
recommendations by the respondent, the number of different people given negative
11 15.75 % of the responses indicated that the respondent has been a customer with the company he or she was assigned to (N=8,617). Respondents were slightly more likely to be a customer of one of the airlines (16.66 %) than one of the car manufacturers (14.44%).
33
recommendations by the respondent, the difference between the last two scales and the
likelihood of future purchase at the company as dependent variables. All models using
number of recommendations or number of people used negative binomial regressions, for
the differences and the likelihood of future purchases we used ordinary least square. We
excluded respondents who had given more than 19 recommendations or given
recommendations to more than 19 other people.
Next, we evaluated the three different versions of the liking scale using the same
approach, set of dependent variables, and regression models. For the last condition, in
which respondents were asked both about liking and disliking on independent questions,
we analyzed both the predictive power of the unipolar dislike-scale (reversed) as well as
the difference between the unipolar like and unipolar dislike scale (recoded to range from
0 to1).
After evaluating the different scales for liking we compared the measurements of
liking, satisfaction and likelihood of recommendations in their relationship to the number
of positive recommendations, the number of negative recommendations, the difference
between the two numbers, the number of people given positive recommendations by the
respondent, the number of people given negative recommendations, and the difference
between these two numbers as well as the likelihood of future purchases. For these
analyses we again first used all respondents (and the sub-set of customers only) and then
restricted the analyses to the best scales for likelihood of recommending and liking (again
for all respondent and customers only). When we had asked the respondents to evaluate
the likelihood of a positive as well as a negative recommendation, we calculated the
difference between the two scales and used it as the independent variable. Similarly we
34
calculated the difference between scales measuring liking and disliking when respondents
were asked these in two separate questions. We ran regressions models with the
constructs separately and combined them in simultaneous regressions, controlling for
each other.
Finally, we also explored the meaning of a different measure we gauged in the
survey, the climate of opinions on the companies as perceived by the respondent in his or
her daily interactions. This measure of word-of-mouth communication was correlated
with future purchase intentions in ordinary least square regressions (adding random
effects for respondents and fixed effects for the industry) to investigate how strongly the
perception of other peoples opinions was related to future buying behavior. Then we re-
ran the analyses including likelihood of recommending, satisfaction and liking measures
to investigate if and how the impact of word-of-mouth communication is mediated by
other variables (or whether it is a mediator itself).
We designed the second study specifically with the goal to compare the different
scales to real indicators of business performance. For this purpose the Net-Promoter score
is usually reported and used as a summary statistic across all respondents, a single
number that reflects the performance of each company (or product or branch or service
and so forth). According to Reichheld (2003, 2006) the score based on the original scale
is calculated as the difference between the percentage of promoters (the top two scale
points) and the percentage of detractors (respondents on scale points 0 to 6).
We used this approach as the initial starting point for our investigation in how the
different scales relate to the business performance of the companies in our study. We
assumed that we needed to find three different groups of scale points on each scale to
35
calculate a Net-Promoter-like summary statistic. However, there are many different
combinations, depending on which two scale points define the cut-off points between the
three sections of the scale used to calculate the percentage for the lower and upper end of
the scale, and then the difference between the two for the Net-Promoter score.
We evaluated all possible different combinations of cut points assuming that the
scale should be cut into three groups and then calculated a summary statistics like the
Net-Promoter score based on the three groups. For example, for the 5-point scale, we
calculated a Net-Promoter score for each company based on grouping respondents on the
scale points 0-2 as detractors, respondents on scale point 3 as neutrals and respondents on
scale point 4 as promoters. We then used this score to predict indicators of business
performance across the companies and saved coefficients, p-values and R2 for the
regression. Then we calculated another Net-Promoter score but using the scale points 0-1,
2-3, and 4 as cut-off points and re-run the analysis. We continued until all possible
combinations were used. When creating a summary statistic for the fifth scale, asking
respondents in two independent questions about the likelihood to give positive and
negative recommendations, we calculated individual scores for both scale and then the
difference between the two scores as the overall score – all combinations for both scales
were combined with each other.
To compare the strength of the relationship of measurements of likelihood of
recommending to the other measures such as satisfaction and liking, we had to create
summary statistics for both satisfaction and liking as well. We used the same approach as
described before to find the best possible cut-off points to create a summary score for
each company on the liking and satisfaction dimension. In case of the questions asking
36
about liking, we also generated different summary statistics for all three versions of the
response scale.
We used ordinary least square regressions with weights reflecting the number of
respondents who were used to calculate the Net-Promoter score to relate the summary
statistics to measures of business performance.
We are interested in using these summary statistics for three comparisons: first we
will compare the different scales within a measurement, that is the six different
measurements for likelihood of recommendation and the three different measurements of
liking. For this purpose we will pick the best combination of cut-off points for each scale
for each dependent variable. The best cut-off point is the cut-off point that has the highest
R2. We can then compare the R2s with one another. Secondly, we are interested to
compare the different measures of liking, satisfaction and likelihood of recommendation
against each other across the different dependent variables. For this purpose we will also
use the best combinations of cut-off points (for each scale of each measurement) for
comparisons.
Reichheld (2006) suggests that using the natural logarithm of the Net-Promoter
score produces stronger relationships to the business indicators. We therefore also log-
transformed the summary statistics for the different cut-off points and again compared all
the scales with different cut-off points after applying log-transformations in their
relationship to the business indicators as described in the previous paragraph. We also
added ‘1’ to the score (originally with a theoretical range from -1 to 1) before taking the
natural logarithm. It is not further documented if Reichheld used a similar approach or
not. The transformation after adding +1 means that a company who has a Net-Promoter
37
score of 0 would still have a Net-Promoter score of 0 after the transformation. The farther
away a company is away from that score of 0 before the transformation (either in the
positive or the negative), the transformation would enhance that distance compared to the
untransformed version.12
Study 2: Results
Overall the results replicated the first study, the brief discussion here will focus on
the two new scales that were not included in study 1.
The 7-point, fully labeled, bipolar scale measuring both positive and negative
recommendations, at the bottom of figure 6, draws many respondents to the ‘neither /
nor’ mid-point, when all respondents are considered. However, it is important to stress
that this is the scale point for everyone who does not have a strong enough opinion about
the company or feels too ambivalent to give a recommendation, it is not the same as the
‘neutral’ point on the other scales which would rather be a 50% likelihood of
recommending the company.
[INSERT FIGURE 6 HERE]
The 5-point scale measuring the likelihood of giving a recommendation against
the company (lower right corner of the figures) shows that people are much less likely to
give negative recommendations than they are likely to give positive recommendations.
The average score for the likelihood of positive recommendations is 2.50 compared to an
average score of 1.67 for giving negative recommendations for all respondents and the
difference between the two is significant (t=18.97; p<.001; N=1,497). The results are
12 Reichheld (2006: ) further described the transformation as “ln(Delta NPS)”. The only explanation of ‘Delta NPS’ is given on page 56 of Reichhelds book as the difference between one company’s NPS and another company’s NPS. How these are used in a correlation-based context is not further explained and further documentation by Satmetrix does not mention the concept of ‘Delta NPS’.
38
similar for actual customers with an average score of 3.45 on the positive
recommendation scale and an average score of 1.77 on the negative recommendation
scale (t=12.40; p<.001; N=222). Customers are more likely to give positive
recommendations (t=18.97; p<.001; N=1,497), but also slightly more likely to give
negative recommendations (t=1.69, p=.09; N=1,497). The result is – at least for the
companies in this study – that a company will get a higher Net-Promoter score if it has
more customers (in a sample of both customers and non-customers).13
[INSERT FIGURE 7 HERE]
In figure 7 we are only showing the distributions across responses for companies
at which the respondents actually had been customers. As before, the distributions are
much smoother, especially among the fully-labeled scales.
The relationships between the number of past recommendations and the response
option selected on the Net-Promoter questions are shown in Figure 8 and Figure 9.
[INSERT FIGURE 8 HERE]
[INSERT FIGURE 9 HERE]
The fully labeled scales again have a smoother relationship with the mean number
of recommendations, and that pattern is replicated in the relationship between positive
recommendations and the likelihood of negative recommendations. In the 7-point bipolar
scale the mid-point draws the lowest average number of positive recommendations, as it
should, because it reflects the absence of positive recommendations. Giving negative
recommendations does slightly increase the average number of negative
13 In this study we did not randomize the order of the two questions regarding the likelihood for recommendations and recommendations against, therefore respondents did not know that a second question on recommendations against would follow. Hence, the answers to the first question are equivalent to the answers given to the response scale in the fourth condition with 5 scale points and full labels.
39
recommendations – perhaps the likelihood of giving recommendations in general is both
a function of the experience with the company, but also the personality of the respondent.
[INSERT FIGURE 10 HERE]
[INSERT FIGURE 11 HERE]
Figures 10 and 11 show the relationships between the likelihood of
recommending the company as measured by the different scales and the number of
negative recommendations. The two scales with only partial labels and the neutral mid-
point show a pattern that fits the ‘detractors’ vs. ‘promoters’ framework that is used by
Reichheld to describe the Net-Promoter score: respondents below the neutral point are
more likely to give negative recommendations. However, their seems to be no
differentiation among the unlabeled scale points to both sides of the neutral scale point.
The fully labeled scales somewhat reduce this problem and the relationship is
slightly more linear, especially for the 5-point scales. The 5-point scale asking about
recommendations against the product shows a pattern that is similar to the relationship of
the other scales to the number of positive recommendations. Finally, the last scale
combines both positive and negative recommendations in one 7-point scale, this scale
also clearly separates between detractors and promoters, but does so with less noise
because the labels reflect this relationship – the average number of negative
recommendations is very low for respondents who are to the right side of the mid-point,
and the scale points to its left are better differentiated (although the pattern of
differentiation is slightly different when only customers are investigated).
[INSERT FIGURE 12 HERE]
[INSERT FIGURE 13 HERE]
40
The final graphical representation in figures 12 and 13 shows the relationship
between the scales measuring likelihood of positive and negative recommendations and
the question asking respondents to indicate how likely they are to buy a car or fly a plane
within the next five years. All scales have a smooth relationship to the likelihood of
future purchases, however, again the fully labeled scales manage to reduce the random
noise and create smoother relationships – especially when only considering past
customers, the partially-labeled scales show some small idiosyncraticies. A possible
interpretation is that respondents are taping into similar or identical concepts when they
formulate the response to questions about the likelihood to recommend and the likelihood
to buy a product in the future. To some extent this is a good sign, because it implies that
likelihood to recommend might measure both the ability to attract new customers through
word-to-mouth promotion and to retain existing customers. At the same time, it raises the
questions whether the underlying concept, the attitude towards the company, can be
measured more accurately with a direct approach rather than the indirect approach of
measuring likelihood to recommend a product.
When we used regression analyses to estimate the relationship between the
likelihood of recommending scales and the number of positive recommendations (see
table 6), we found that our findings from the first study were also generally confirmed.
The 11-point scale with three labels and the partially-labeled 7-point scale produce
almost identical results (all respondents: p=.90; customers only: p=.17). Both partially
labeled scales are better predictors than the fully-labeled 7-point scale and the fully-
labeled 5-point scale (p<.01 in all cases for both respondents and customers only).
Likelihood of negative recommendations is a much weaker predictor than any other of
41
the variables, while the difference between the likelihood of negative and positive
recommendations is slightly better than the fully labeled scales in rows 3 and 4 of table 6
(all respondents: p<.05; customers only: p<.19), but still less powerful than the original
Net-Promoter score or the 7-point partially labeled scale, although the differences are not
significant. Surprisingly, the last scale we investigated with 7-fully-labeled scale points
and a bipolar dimension is quite good as a predictor of the number of positive
recommendations: the strength of relationship for all respondents is not significantly
different from strength of the relationship of both partially-labeled scales, for customers
the bipolar scale is not significantly different from the 11-point scale (p=.48), but slightly
weaker than the 7-point scale (p=.05).
[INSERT TABLE 6 HERE]
In the tables following table 6 we are investigating the same question with
different dependent variables. In table 7 are the results with the number of negative
recommendations and table 8 shows the results of regressions with the difference
between positive and negative numbers of recommendations as the dependent variables.
Table 9 uses the number of people that were given a positive recommendation by the
respondent, table 10 uses the number of people that were given a negative
recommendation and table 11 again uses the difference between the number of people
that were given positive and negative recommendations. Finally, in table 12 the
dependent variable is a response on a 5-point scale, measuring the likelihood of a future
purchase at the company.
[INSERT TABLES 7 TO 12 HERE]
42
While the original Net-Promoter scale and the 7-point scale with partial labels are
still better predictors of negative recommendations, the 7-point bipolar scale also does
fairly well across the different tests: it is the strongest predictor for negative
recommendations, the number of people that were given a negative recommendation, and
for the difference between positive and negative recommendations as well as the
difference between the number of people given positive and the number of people given
negative recommendations among all respondents. The scale is the second best predictor
of the difference between the number of people given positive and negative
recommendations among customers, only the 7-point partially labeled scale is a stronger
predictor, but the difference is not significant (p=.15). Similarly, it is the second best
predictor of the number of people given positive recommendations among all respondents,
again only the 7-point partially-labeled scale is better but not significantly so (p=.61).
The bipolar scale also does well in predicting the likelihood of future purchases, but not
better than the 7-point partially-labeled scale (which is best for all respondents and the
customers only subgroup).
The 5-point scale measuring the likelihood of negative predictions unsurprisingly
does well when the dependent variable is also about negative recommendations. The
difference between the likelihood of positive and negative recommendations generally
performs good as well, although it rarely is better than the simple bipolar scale measuring
the same two dimensions of likelihood of recommendations. It does better than any other
scale except the 7-point partially-labeled scale (and that difference is not statistically
significant (p=.30)) when predicting the likelihood of future purchases among customers.
Overall, it often performs better among customers, perhaps because these have a more
43
differentiated picture of the company, brand or product and the two-dimensional
measurement with independent dimensions allows them to express this complex attitude
better.
[INSERT TABLE 13 HERE]
In this study we also manipulated the scale measuring how much the respondents
liked the company and its products. The results of the regressions evaluating the different
scales can be found in table 13. Both the bipolar scale and the difference score are the
two dominant scales across all the different models. If anything, they are equally
powerful predictors, indicating that perhaps the bipolar concept of liking and disliking
can be measured both ways effectively – although using only one question would be
more efficient for most applications.
As in study 1, we compared the measurements of likelihood of recommending to
both how much the respondents like the company and how satisfied they were with those
companies. First we compared the predictive the ability of these measures in separate
regressions – the results are in table 14. In the first column are the coefficients for all
respondents and the third column contains the coefficients for only those respondents
who are also customers. In columns two and four the analyses were restricted to
respondents who were assigned to either the 7-point, partially labeled or 7-point, fully
labeled, bipolar scale measuring likelihood of recommending and to either the 7-point
bipolar scale measuring liking or the difference score between liking and disliking
measured with two questions (these were the scales that previously were shown to be
most effective in the within-scale comparisons).
44
Across all analyses, the results were quiet consistent and confirming the results
found in study 1: liking emerged as the strongest predictor in most of the analyses.
Satisfaction was only a good predictor for the number of negative recommendations, but
none of the differences in those regressions were statistically significant. In three cases
likelihood of recommendations were better predictors among customers when all scales
for liking and recommendations were used (predicting positive recommendations, people
given positive recommendations, and the difference between the number of people given
positive and negative recommendations), but none of the differences were statistically
significant (the difference in coefficients for the difference between the number of people
given positive and negative recommendations as dependent variable was marginally
significant at p=.09). When predicting the number of people given negative
recommendations, the likelihood of recommendations was a slightly better predictor for
all respondents and customers even when the best liking and best likelihood of
recommending scales were used – but the difference again was not significant (all
respondents: p=.18; customers only: p=.37).
[INSERT TABLE 14 HERE]
In table 15 we re-analyzed the impact of the different measures of liking,
satisfaction and likelihood of recommending, but combined them in one regression for
each dependent variable. When coefficients are drastically reduced in the results in table
15 compared to the results in table 14, it suggests that the impact of the associated
variable is mediated by one of the other variables in the regression (Baron and Kenny,
1986).
45
When predicting the number of positive recommendations, the coefficient
indicating the impact for satisfaction measures drops and is rather small while controlling
for both likelihood of recommendations and liking, and it is only significant among all
respondents (p<.001), in all other sub-sets in columns two, three and four it is not
significant anymore. In these regressions predicting the number of positive
recommendations, the likelihood of recommending emerges as the strongest predictors,
stronger than both liking and satisfaction, all differences are significant (p<.05) except for
the difference among respondents who were exposed to the best liking and best
likelihood of recommendation scales (last column). This suggests that the impact of
satisfaction on the number of positive recommendations is mediated by likelihood of
recommending, possibly even by a causal chain from satisfaction to liking to likelihood
of recommending to actual number of positive recommendations.
[INSERT TABLE 15 HERE]
However, when we turned to results in predicting the number of negative
recommendations, the picture was quite different: here it was the measurement of
likelihood of recommending that was drastically reduced in its relationship to the number
of negative recommendations, it was now not statistically significant in all four
regressions. The impact of liking was still significant across all four regressions (p<.02),
but it was only the strongest predictor when we restricted the analyses to customers who
had been assigned to the most valid liking and likelihood of recommendation scales (in
the last column; the difference between liking and satisfaction was not significant in that
regression, p=.38). These results are supportive of an earlier observation that most of the
likelihood of recommendation scales did poorly in predicting the number of negative
46
recommendations, except for the two new scales introduced in study 2 that explicitly
mentioned negative recommendations (see table 7).
The results for both the number of people given positive and the number of people
given negative recommendations are very similar to the results for the simple number of
recommendations.
When predicting the difference between positive and negative recommendations
or the difference for people given positive and negative recommendations, the scales do
not show big differences in predictive strength. The difference between the coefficients
for liking and likelihood of recommendations are never significant, but satisfaction is
significantly lower than the likelihood of recommendations in all cases (p<.003) except
when the regression is run across all respondents. Liking is also significantly stronger
than satisfaction when only respondents assigned to the best liking and likelihood of
recommendation scales are used.
Finally, future purchase is most strongly predicted by likelihood of
recommendations when all three measures are combined in one regression. However,
among customers, the difference between liking and likelihood of recommendations is
not statistically significant. Once again satisfaction seems to be mediated by liking and/or
likelihood of recommendations.
Part of the extended design used in study 2 was a measurement of perceptions of
the word-of-mouth communication about the company, asking respondents to report what
they had heard about the company in conversations. The perception of word-of-mouth
communication strongly predicts the likelihood of a future purchase, across customers
and even when the sample is limited to respondents who were exposed to the best
47
likelihood of recommending and liking scales (see table 16). It is stronger than any of the
other three variables (satisfaction, liking, recommending) when entered into the
regressions individually (compare to the last block of table 14). It is also less affected by
the difference between customers and non-customers.
[INSERT TABLE 16 HERE]
However, when word-of-mouth communication is combined with the other
measures into a simultaneous regression (lower block of Table 16), its impact is
drastically reduced and not significant among customers (all customers: p=.18; customers
with best liking and likelihood of recommending scales: p=.14). Similarly to the
satisfaction measure the impact of word-of-mouth communication seems to be mediated
by the measures of liking and / or likelihood of recommendations – these two measures
remain as relatively strong predictors and likelihood of recommending is also slightly
stronger in the simultaneous regressions.
In the final part of study 2 we built summary statistics for the different scales and
then related those summary statistics to real-world indicators of business performance.
Table 17 shows some of the results, focusing on the combinations of cut-off points that
resulted in the strongest relationships between the summary statistics and the growth in
passengers (for airlines) or car sales (for companies).
[INSERT TABLE 17 HERE]
The first six rows in table 17 are the results for the different likelihood of
recommending scales in predicting the change in the number of cars sold by each
manufacturer between March 2007 and March 2008. The left column shows results for all
respondents, the right column calculates the results based only on customers. The results
48
show coefficients, p-values and R2s on the right side and the used cut-off points on the
left side (the lower cut-off point on top, the upper cut-off point on the bottom).
For the 7-point fully labeled scale, the 5-point fully labeled scale and the 7-point
fully labeled bipolar scale no good summary statistic could be found at all when the data
from all respondents were used: for the 7-point fully labeled scales all but one
combination of cut-off points yielded negative coefficients with high p-values (p>.48),
the only positive coefficient was small and by far not significant (b=.90; p=.97; R2=.00;
N=8). Not one of the combinations for the 5-point fully -labeled scale had a positive
coefficient; the same applies to the two separate questions measuring both positive and
negative recommendations. Finally, the 7-point scale with a bipolar, full labeling also
produced many negative coefficients and the few positive coefficients are never remotely
close to statistical significance (p>.66). We are left with results for the two partially
labeled scales with 11 or 7 scale points: the original Net-Promoter scale with 11-points
works best when the ‘detractors’ are group on the lowest two scale points and the
promoters are on scale points 5 through 10. The R2 for this regressions was fairly good
at .39 and the coefficient just missed statistical significance (p=.12). It turns out that the
cut-off points suggested by Reichheld (2003, 2006) at 6 and 9 produce a much weaker
and negative relationship (b=-.25; p=.38; R2=.13; N=8). The 7-point, partially labeled
scale did produce the best result by grouping respondents on the lowest scale point and
grouping another group from point 3 and upward – however, the R2 was lower for this
scale than the 11-point scale (R2=.13 vs. R2=.39).
The next three rows in table 17 compare the three different liking scales when
transformed to summary statistics in the same way as the Net-Promoter scale. For the 5-
49
point unipolar scale we again experienced the problem of finding a suitable result at all:
only one of the combinations produced a positive, but weak relationship to the increase in
cars sold (cut-off points: 0 / 2; b=.06; p=.84; R2=.01; N=8). However, the 7-point bipolar
scale produced quite impressive results: with cut-off points on scale points 0 and 2, the R2
of .61 was quite high and much bigger than for the any of the likelihood of
recommending scales (and much bigger than for the two-question measurement of liking).
Finally, the 7-point, bipolar satisfaction scale, when measured across all respondents, also
only produced a weak relationship to the change in the number of cars sold (cut-off
points: 1 / 3; b=.39; p=.39; R2=.12; N=8).
The likelihood of recommending measures do much better when we restrict our
analysis to only respondents who were also customers of the companies. Only the 5-point
measurement with the difference between two questions measuring the likelihood of
positive and negative recommendations did not produce a convincing result – not one of
the results had a positive coefficient. The strongest relationship was found for the original
Net-Promoter score with 11 scale points (b=.38; p=.06; R2=.53; N=8), however the cut-
off points at scale points 3 and 8 again deviate from the recommendation made by
Reichheld. However, the result for the recommended combination of cut-off points still
produced a positive relationship with a fairly convincing R2 of .39 (b=.24; p=.13; N=8). It
seems that likelihood of recommending works much better for customers of car
companies than for non-customers.
Measuring liking with a 7-point, bipolar scale works best, but produces a slightly
weaker relationship (with cut-off points at 0 and 5) compared to the full sample of
respondents (b=.50, p=.10, R2=.45; N=8). Satisfaction, not surprisingly, does work better
50
for customers (cut-off points: 4 / 6; b=.24; p=.20; R2=.25; N=8), but still is less effective
than the best likelihood of recommending scale.
The next section of table 17 is structured identically, but investigated the same
relationships for airlines and the dependent variable was the growth in the number of
passengers from January 2007 to January 2008. The results overall implicate stronger
relationships for all measurements, potentially because traveling with an airline is more
prone to repetition than the purchase of a car. The 7-point, fully labeled scale measuring
likelihood of recommending does fairly well, better than the 11-point original Net-
Promoter scale when analyzed across all respondents. However, the best result – an
impressive R2 of .95 – is found when the original Net-Promoter scale is used with cut-off
points at 1 and 7 for customers only (the recommended cut-off points only yield an R2
of .72). Again, the likelihood of recommending overall works better when only responses
from customers are analyzed.
This difference is much smaller for the liking scale, here the R2s are between .32
and .67 depending on the scale used and are only slightly stronger for customers. For the
satisfaction measurement the difference between all respondents and customers seems to
be non-existent (R2=.61 vs R2=.67).
The results in table 18 are analogous to the results in Table 17, only the log-
transformation has now been applied, as recommended by Reichheld (2006).
[INSERT TABLE 18 HERE]
The results after using the log-transformations are more or less identical to the
results without the log-transformations. Some of the R2s are improved, but if so, not very
strongly. We still find that relationships in the airline industry are generally stronger than
51
for car manufacturers and that overall the measures of likelihood of recommending do
work quite well.
Discussion and Conclusions
Both studies yielded similar results. We did find that reducing the number of scale
points to 7-points generally improved the validity of the measurement. However, contrary
to our expectations, assigning full-labels did not improve the validity, it rather produced
weaker relationships between the scales and the validity criteria.
This was especially surprising because the graphical inspection did indicate some
support for smoother and generally less noisy relationships between the fully labeled
scales and the validity criteria. The graphical representations also supported our suspicion
that the mid-point of the partially-labeled scales, ‘neutral’, attracts many customers who
have no or only a weak attitude about the company – while this might be intended in a
bipolar measurement, it seems odd for a likelihood measurement.
The fact that Reichheld (2003, 2005) labels any respondents below scale point 7
‘detractors’ only increases this confusion because those respondents might have picked
said ‘neutral’-point and are not necessarily detractors in the sense that they might
recommend against the company, rather they abstain from making any recommendation.
Therefore, the description of the scale confuses both the respondents and those who
interpret it. A scale such as the bipolar scale for both positive and negative
recommendations on the hand is meaningfully linked to terms such as ‘detractors’ and
‘promoters’ (and it predicts well for several of the dependent variables used in our
investigation).
52
Measuring simply the likelihood of recommending might not capture the
complexity of positive and negative recommendations. When we introduced either two
independent questions or one bipolar question reflecting that complexity, the measures
did fairly well. They were especially able to better relate to measures of negative
recommendations and future purchase behavior.
Across all tests on the individual level, it seems that either a partially labeled 7-
point scale or the fully labeled bipolar scale would be efficient and effective measures of
likelihood of recommending.
However, our results do not support the notion that likelihood of recommending is
the best and sufficient measurement to evaluate business performance. Other indicators
do well or even better than the Net-Promoter scales. Especially ‘liking’ seems to be a
particularly strong and consistent measurement, while satisfaction might be mediated by
the likelihood of recommending. Therefore, we agree with those researchers who have
suggested to rather using a variety of measures rather than just simply one measure would
better capture the complexity underlying customer satisfaction and customer behaviors.
We do find some early evidence that factors such as cognitive dissonance might
increase Net-Promoter scores only because companies attract more customers (by
whatever means) and the customers form more positive evaluations after the decision to
purchase a product from the company. This could introduce the problem of a reversed
causality, in addition to the already existing problem of spuriousness between the
different measures of customer satisfaction.
For the industries we investigated, we successfully related the scales to indicators
of business performance, particularly when the data was restricted to customers only.
53
However, we did not find that the Net-Promoter score as described by Reichheld is
necessarily the best measurement for all industries. First of all, our analyses always
suggested other cut-off points than the one recommended by Reichheld (see Lawrie,
Matta and Roberts, 2006). Secondly, liking and satisfaction do not fail to connect to
business performance, sometimes they do just fine. Measures of satisfaction seem to
work well even when customers are not included, but the question is phrased as a
hypothetical, asking for an expectation, as we did in the second study.
Because of its simplicity and the suggested scientific rigor with which the Net-
Promoter score is presented, it has had remarkable success in many companies. Many
business leaders believe that they can trust the measurement and its property and that it is
a useful tool to guide business decisions. However, to make good decisions based on the
Net-Promoter score, business leaders need to understand the underlying processes
measured by questions in customer surveys. To achieve the right improvements, they
need to understand causal relationships. For example, they need to understand whether
more recommendations directly drive the growth of their business (in which case they
would want to focus their efforts on directly increasing recommendations) or whether
measures of likelihood of recommending are tapping into a general attitude toward the
company (which might require other efforts). In that context, it is also important to
understand whether more recommendations are more important than preventing the loss
of already attracted customers (Grisaffe, 2004).
Our results show that different measures such as likelihood of recommendation,
satisfaction and liking are interrelated and might be acting within causal chains.
Investigations into these causal chains would be very useful for business leaders to go
54
beyond merely reporting a simple statistic but rather understanding where they have to
make improvements to their business conduct. It seems that the attractiveness of a simple
statistic is a big drawback at the same time – it does not allow for fine tuned
understanding and often might hide difference between specific sub-groups of customers.
In addition to investigating causal links between the different variables, there are
other directions for future research. Especially the idea of positive and negative
recommendations seems to be a useful extension to understand word-of-mouth
communication. However, other factors should be investigated as well: the strength of
recommendations might be an important factor in addition to simply measuring
frequency or likelihood. Also, opinion leader research has often contended that
personality characteristics make some people opinion leaders and more convincing –
therefore, it might not just matter how many people are promoting a new product or
service, but also who is promoting. For example, Ruf (2007) distinguishes between
committed and uncommitted detractors / promoters, but other distinctions could be useful
as well.
Our results have some caveats. First of all, we had to restrict our analyses to
specific industries and companies and generalizability of our findings might be limited by
that. In addition, we used non-random samples, but randomly assigned the response
scales to participants to assignment to evaluate their performance. We only used one
measure of business performance, although we believe it should be closely linked to how
the companies performance in their customer interactions – other indicators might be
related stronger or weaker with the scales shown here.
55
Reichheld (2006) makes many other comments on the proper conduct of surveys,
often with a lack of knowledge and understanding of the broad research that is already
available on survey methodology. It seems necessary to give practitioners in market
research a better understanding of what survey methodologists already know about good
implementation in surveys rather than leaving it simple, often mistaken, intuitions.
Survey methodologists have to improve their communication to business executives and
be more concise and clear in what qualifies as excellent survey research.
The overall contribution of our paper is to add a survey methodological
perspective to the discussion about the usefulness of the Net-Promoter concept. Where
others have criticized it because of simplistic assumptions about how customers behave
and the logical links between different constructs of consumer research, we focus on the
measurement issues directly attached to customer surveys. There is nothing inherently
wrong with simple models, but they have to be grounded in solid theory and empirical
evidence, otherwise businesses might be misled in their decisions.
56
References
Baron, Reuben M. and Kenny, David A. (1986). The Moderator-Mediator
Variable Distinction in Social Psychological Research: Conceptual, Strategic and
Statistical Considerations, in: Journal of Personality and Social Psychology, 51(6), 1173-
1182.
BusinessWeek (2006). Would you recommend us? That simple query to customers
is shaking up planning and executive pay;
http://www.businessweek.com/magazine/content/06_05/b3969090.htm, , last accessed:
05/07/2008.
Cacioppo, John T. and Berntson, Gary G. (1994). Relationship between Attitudes
and Evaluative Space: A Critical Review, With Emphasis on the Separability of Positive
and Negative Substrates, in: Psychological Bulletin, 115(3), 401-423.
Cummings, William H. and Venkatesan, M. (1976). Cognitive Dissonance and
Consumer Behavior: A Review of Evidence. Journal of Marketing Research, 13, 303-308.
Feistinger, Leon (1957). A theory of cognitive dissonance. Stanford: Stanford
University Press.
Geller, Martinne (2008). Customer satisfaction top U.S. issue in 2008: survey,
http://www.reuters.com/article/businessNews/idUSN1555013620080116?pageNumber=1
&virtualBrandChannel=10003&sp=true; last accessed: 05/07/2008.
Gladwell, Malcom (2000). The tipping point – how little things can make a big
difference. Boston: Little, Brown.
Godes, David and Mayzlin, Dina (2004). Using Online Conversations to Study
Word-of-Mouth Communication, in: Marketing Science, 23(4), 545-560.
57
Grisaffe, Doug (2004). Gurus misses the mark with one number fallacy.
http://www.creatingloyalty.com/story.cfm?article_id=656; last accessed: 02/05/2008.
Keiningham, Timothy L., Aksoy, Lerzan, Cooil, Bruce, Andreassen, Tor Wallin
(2008). Net Promoter, Recommendations, and Business Performance: A Clarification on
Morgan and Rego, in: Marketing Science,
Keiningham, Timothy L., Cooil, Bruce, Andreassen, Tor Wallin, Aksoz, Lerzan
(2007). A Longitudinal Examination of Net Promoter and Firm Revenue Growth. Journal
of Marketing, 71, 39-51.
Keiningham, Timothy L., Cooil, Bruce, Aksoz, Lerzan, Andreassen, Tor Wallin,
Weiner, Jay (2007). The value of different customer satisfaction and loyalty metrics in
predicting customer retention, recommendation and share-of-wallet, in: Managing
Service Quality, 17(4), 361-384.
Krosnick, Jon A. and Fabrigar, Leandre R. (1997). Designing rating scales for
effective measurement in surveys, in: Lyberg, Lars E., Biemer, Paul P., Collins, Linda M.,
Decker, E., de Leeuw, Edith D., Dippo, C., Schwarz, Norbert, Trewin, Dennis (1997):
Survey Measurement and Process Quality, New York: Wiley-Interscience.
Krosnick, Jon A. and Fabrigar, Leandre R. (forthcoming). Designing great
questionnaires: insights from psychology. New York: Oxford University Press.
Lazarsfeld, Paul F., Berelson, Bernard; Gaudet, Hazel; (1944). The People’s
Choice; how the voter makes up his mind in a presidential campaign. New York: Duell,
Sloan and Pearce.
Long, J. Scott (1995). Regression Models for Categorical and Limited Dependent
Variables. Thousand Oaks: Sage Publications.
58
Morgan, Neil E. and Rego, Lopo Leotte (2006). The Value of Different Customer
Satisfaction and Loyalty Metrics in Predicting Business Performance, in: Marketing
Science, 25(5), 426-439.
netpromoter.com (2008), “What is the Net Promoter?”,
http://www.netpromoter.com/netpromoter/index.php , last accessed: 02/05/2008.
Reichheld, Frederick F. (1996). The Loyalty Effect. The Hidden Force Behind
Growth, Profits and Lasting Value. Boston: Harvard Business School Press.
Reichheld, Frederick F. (2001). Loyalty Rules! How Leaders Build Lasting
Relationships. Boston: Harvard Business School Press.
Reichheld, Fred (2003). The One Number You Need. In: Harvard Business
Review, 81(12), 46-54.
Reichheld, Fred (2006). The Ultimate Question. Driving Good Profits and True
Growth. Boston: Harvard Business School Press.
Lawrie, Jock, Matta, Alsono, Roberts, Ken (2006). Value speaks louder than
words. The management folly of adopting the Net Promoter Score as the ‘one measure’
and why value-for-money provides greater insight;
http://www.forethought.com.au/docs/thinktank/FORETHOUGHT-
ValueSpeaksLouderThanWords.pdf; last accessed: 02/05/2008.
Reichheld, Fred (2006). The Ultimate Question. Driving Good Profits and True
Growth. Boston: Harvard Business School Press
Roch, Christine H. (2005). The Dual Roots of Opinion Leadership, in: Journal of
Politics, 67(1), 110-131.
Rogers, Everett M. (1995). Diffusion of Innovations. New York: Free Press.
59
Ruf, Stefan (2007). Wuerden Sie diese Methode einem Freund empfehlen?, in:
Jahrbuch Verband Schweizer Markt- und Sozialforscher.
Satmetrix (2004). The Power Behind a Single Number. Growing Your Business
with Net Promoter; Satmetrix Systems white paper;
http://www.satmetrix.com/pdfs/netpromoterWPfinal.pdf; last accessed: 02/05/2008.
Watts, Duncan J. and Dodds, Peter (2007). Influentials, Networks, and Public
Opinion Formation, in: Journal of Consumer Research, 34:4, 441-458.
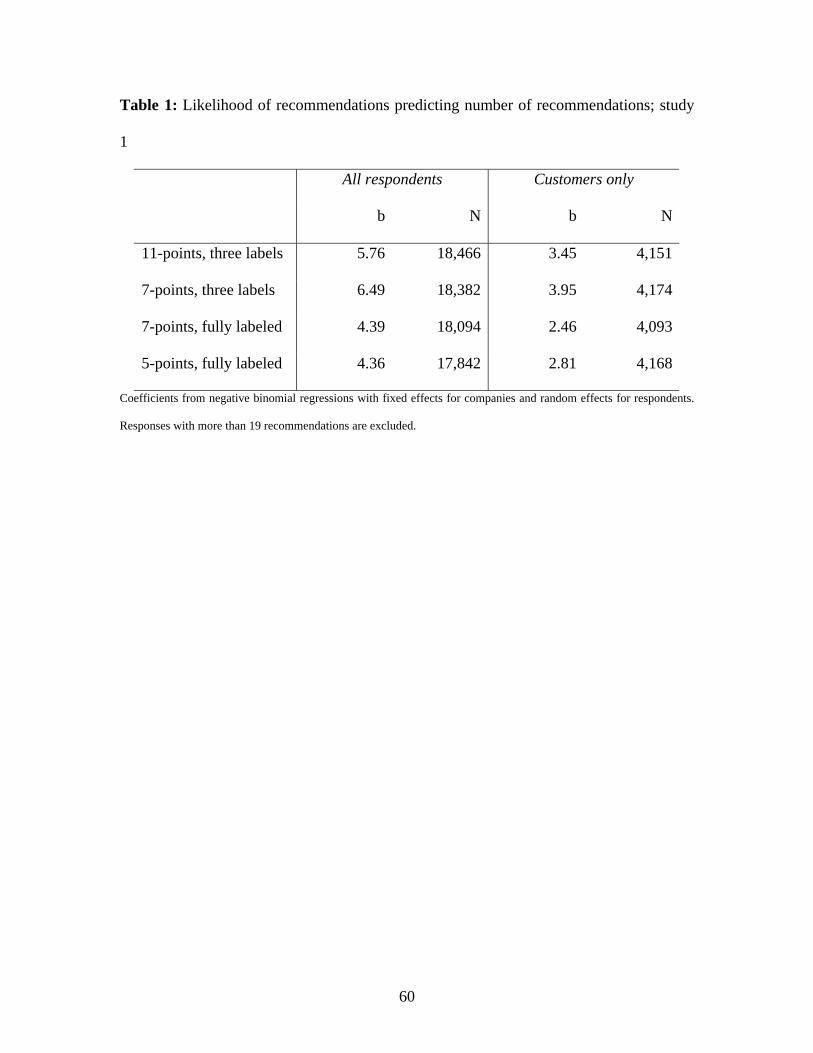
60
Table 1: Likelihood of recommendations predicting number of recommendations; study
1
All respondents Customers only
b N b N
11-points, three labels 5.76 18,466 3.45 4,151
7-points, three labels 6.49 18,382 3.95 4,174
7-points, fully labeled 4.39 18,094 2.46 4,093
5-points, fully labeled 4.36 17,842 2.81 4,168
Coefficients from negative binomial regressions with fixed effects for companies and random effects for respondents.
Responses with more than 19 recommendations are excluded.
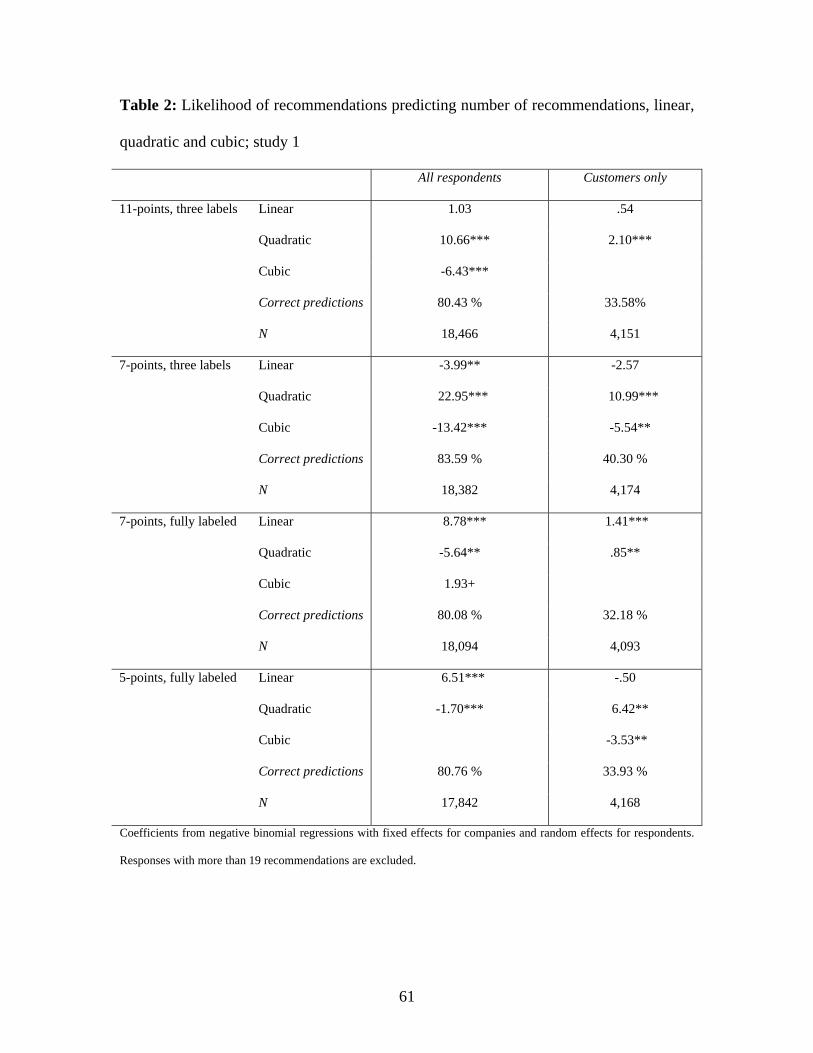
61
Table 2: Likelihood of recommendations predicting number of recommendations, linear,
quadratic and cubic; study 1
All respondents Customers only
Linear 1.03 .54
Quadratic 10.66*** 2.10***
Cubic -6.43***
Correct predictions 80.43 % 33.58%
11-points, three labels
N 18,466 4,151
Linear -3.99** -2.57
Quadratic 22.95*** 10.99***
Cubic -13.42*** -5.54**
Correct predictions 83.59 % 40.30 %
7-points, three labels
N 18,382 4,174
Linear 8.78*** 1.41***
Quadratic -5.64** .85**
Cubic 1.93+
Correct predictions 80.08 % 32.18 %
7-points, fully labeled
N 18,094 4,093
Linear 6.51*** -.50
Quadratic -1.70*** 6.42**
Cubic -3.53**
Correct predictions 80.76 % 33.93 %
5-points, fully labeled
N 17,842 4,168
Coefficients from negative binomial regressions with fixed effects for companies and random effects for respondents.
Responses with more than 19 recommendations are excluded.
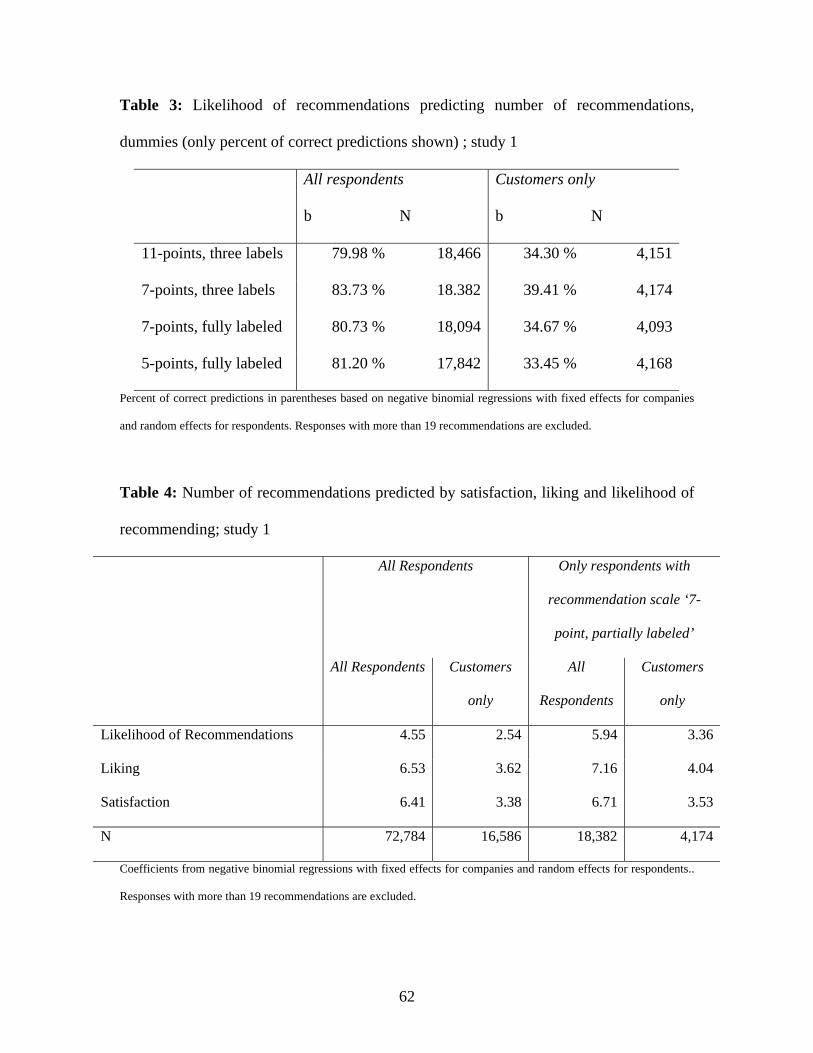
62
Table 3: Likelihood of recommendations predicting number of recommendations,
dummies (only percent of correct predictions shown) ; study 1
All respondents Customers only
b N b N
11-points, three labels 79.98 % 18,466 34.30 % 4,151
7-points, three labels 83.73 % 18.382 39.41 % 4,174
7-points, fully labeled 80.73 % 18,094 34.67 % 4,093
5-points, fully labeled 81.20 % 17,842 33.45 % 4,168
Percent of correct predictions in parentheses based on negative binomial regressions with fixed effects for companies
and random effects for respondents. Responses with more than 19 recommendations are excluded.
Table 4: Number of recommendations predicted by satisfaction, liking and likelihood of
recommending; study 1
All Respondents Only respondents with
recommendation scale ‘7-
point, partially labeled’
All Respondents Customers
only
All
Respondents
Customers
only
Likelihood of Recommendations 4.55 2.54 5.94 3.36
Liking 6.53 3.62 7.16 4.04
Satisfaction 6.41 3.38 6.71 3.53
N 72,784 16,586 18,382 4,174
Coefficients from negative binomial regressions with fixed effects for companies and random effects for respondents..
Responses with more than 19 recommendations are excluded.
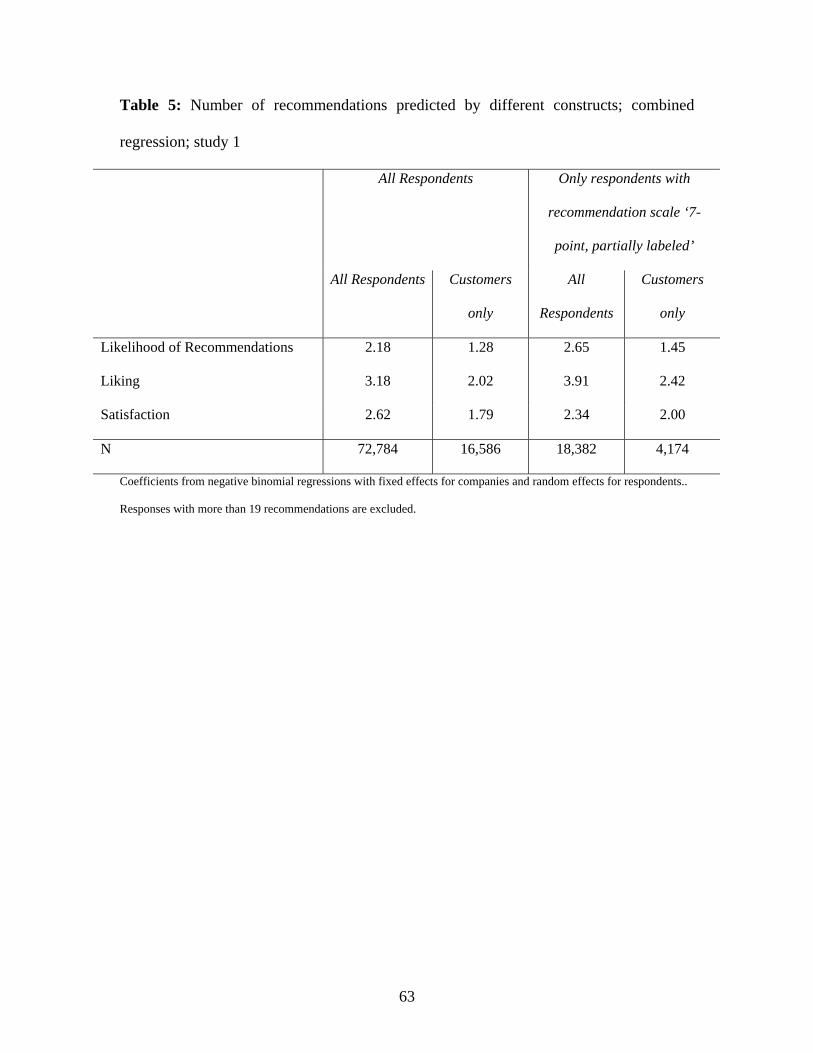
63
Table 5: Number of recommendations predicted by different constructs; combined
regression; study 1
All Respondents Only respondents with
recommendation scale ‘7-
point, partially labeled’
All Respondents Customers
only
All
Respondents
Customers
only
Likelihood of Recommendations 2.18 1.28 2.65 1.45
Liking 3.18 2.02 3.91 2.42
Satisfaction 2.62 1.79 2.34 2.00
N 72,784 16,586 18,382 4,174
Coefficients from negative binomial regressions with fixed effects for companies and random effects for respondents..
Responses with more than 19 recommendations are excluded.
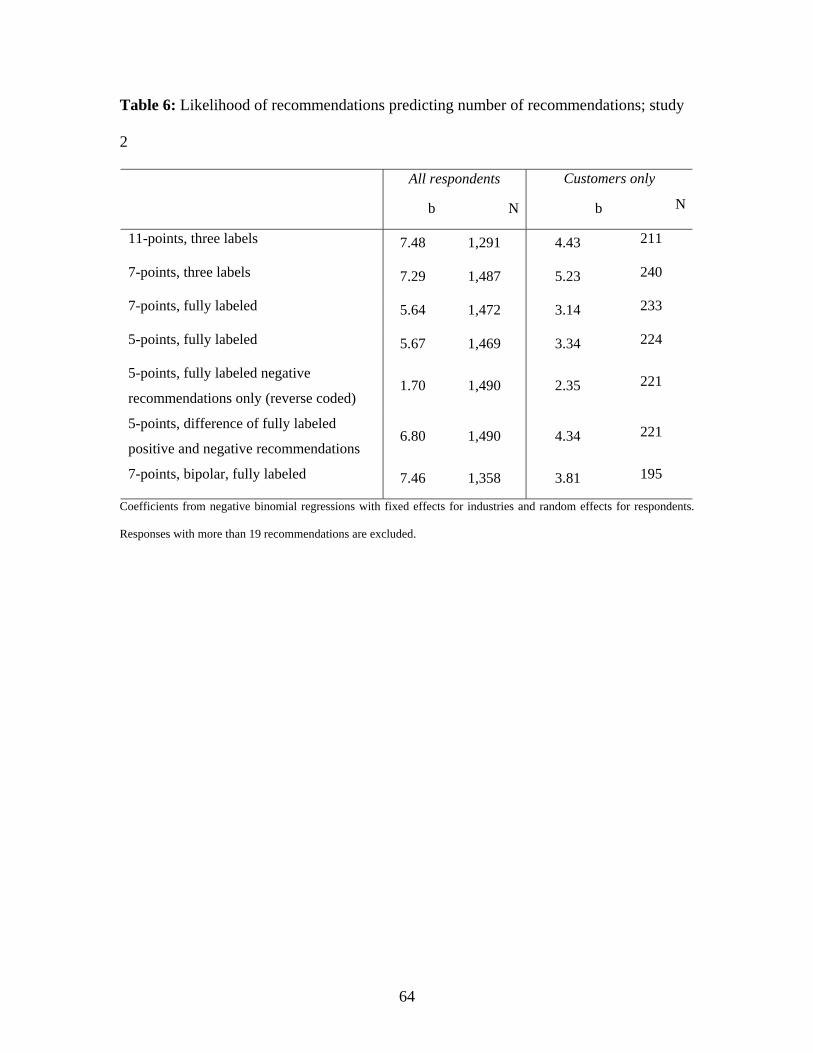
64
Table 6: Likelihood of recommendations predicting number of recommendations; study
2
All respondents Customers only
b N b N
11-points, three labels 7.48 1,291 4.43 211
7-points, three labels 7.29 1,487 5.23 240
7-points, fully labeled 5.64 1,472 3.14 233
5-points, fully labeled 5.67 1,469 3.34 224
5-points, fully labeled negative
recommendations only (reverse coded) 1.70 1,490 2.35 221
5-points, difference of fully labeled
positive and negative recommendations 6.80 1,490 4.34 221
7-points, bipolar, fully labeled 7.46 1,358 3.81 195
Coefficients from negative binomial regressions with fixed effects for industries and random effects for respondents.
Responses with more than 19 recommendations are excluded.

65
Table 7: Likelihood of recommendations predicting number of negative
recommendations; study 2
All respondents Customers only
b N b N
11-points, three labels -2.57 1,296 -4.05 214
7-points, three labels -2.52 1,497 -4.37 246
7-points, fully labeled -.91 1,479 -3.02 239
5-points, fully labeled -1.30 1,476 -3.72 231
5-points, fully labeled negative
recommendations only (reverse coded) -4.17 1,497 -3.90 221
5-points, fully labeled positive and
negative recommendations differences -4.46 1,497 -4.05 221
7-points, bipolar, fully labeled -4.69 1,372 -4.47 195
Coefficients from negative binomial regressions with fixed effects for industries and random effects for respondents.
Responses with more than 19 recommendations are excluded.
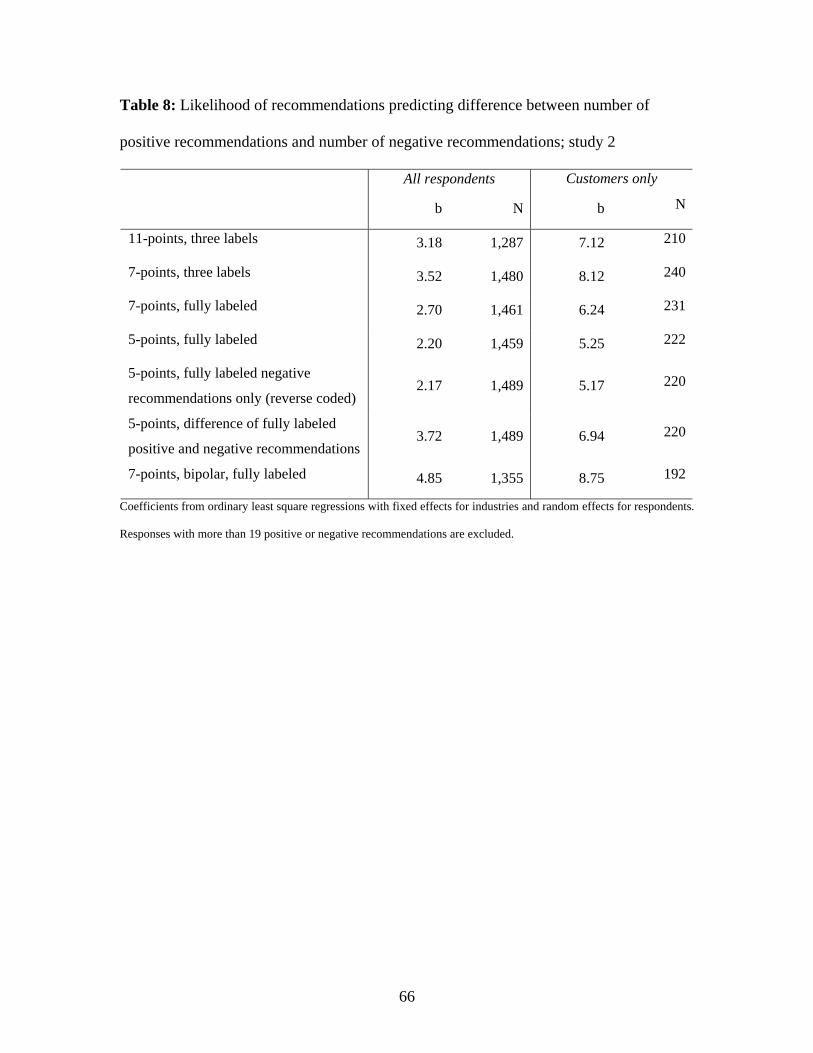
66
Table 8: Likelihood of recommendations predicting difference between number of
positive recommendations and number of negative recommendations; study 2
All respondents Customers only
b N b N
11-points, three labels 3.18 1,287 7.12 210
7-points, three labels 3.52 1,480 8.12 240
7-points, fully labeled 2.70 1,461 6.24 231
5-points, fully labeled 2.20 1,459 5.25 222
5-points, fully labeled negative
recommendations only (reverse coded) 2.17 1,489 5.17 220
5-points, difference of fully labeled
positive and negative recommendations 3.72 1,489 6.94 220
7-points, bipolar, fully labeled 4.85 1,355 8.75 192
Coefficients from ordinary least square regressions with fixed effects for industries and random effects for respondents.
Responses with more than 19 positive or negative recommendations are excluded.
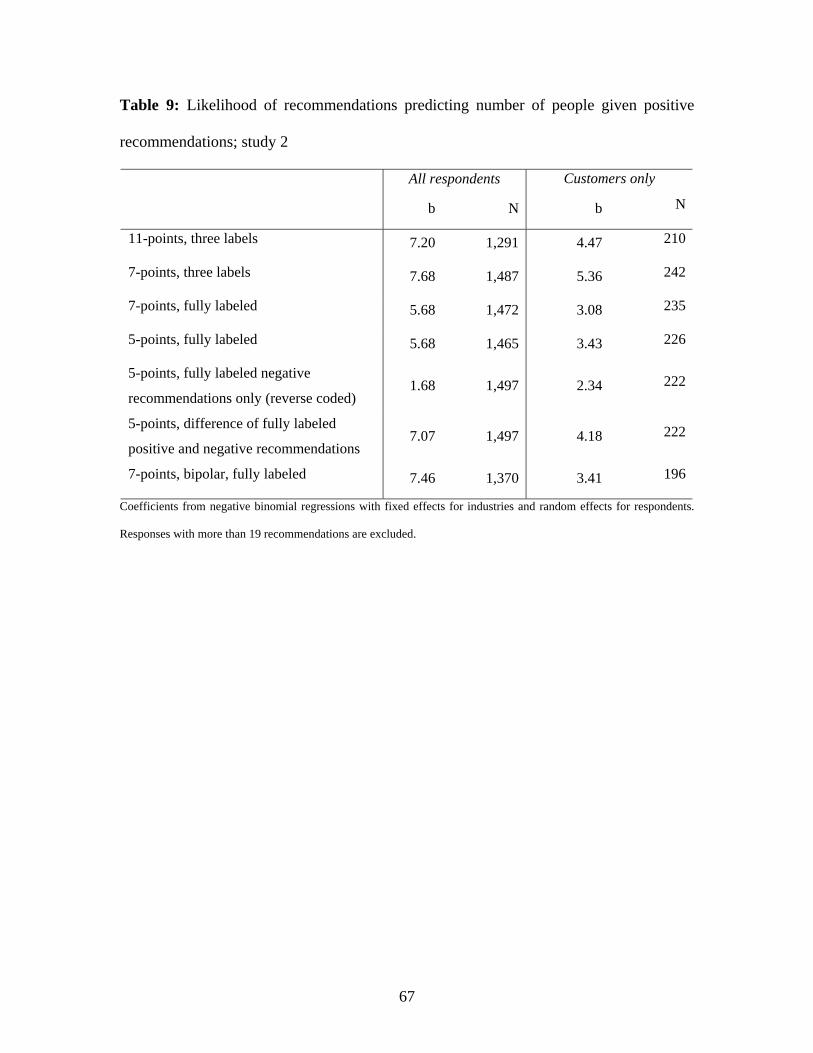
67
Table 9: Likelihood of recommendations predicting number of people given positive
recommendations; study 2
All respondents Customers only
b N b N
11-points, three labels 7.20 1,291 4.47 210
7-points, three labels 7.68 1,487 5.36 242
7-points, fully labeled 5.68 1,472 3.08 235
5-points, fully labeled 5.68 1,465 3.43 226
5-points, fully labeled negative
recommendations only (reverse coded) 1.68 1,497 2.34 222
5-points, difference of fully labeled
positive and negative recommendations 7.07 1,497 4.18 222
7-points, bipolar, fully labeled 7.46 1,370 3.41 196
Coefficients from negative binomial regressions with fixed effects for industries and random effects for respondents.
Responses with more than 19 recommendations are excluded.

68
Table 10: Likelihood of recommendations predicting number people given negative
recommendations; study 2
All respondents Customers only
b N b N
11-points, three labels -3.67 1,296 -5.22 210
7-points, three labels -3.06 1,497 -4.85 242
7-points, fully-labeled -1.56 1,479 -3.84 235
5-points, fully-labeled -2.63 1,476 -5.81 226
5-points, fully-labeled negative
recommendations only (reverse coded) -3.97 1,497 -4.11 222
5-points, fully-labeled positive and
negative recommendations differences -4.24 1,497 -3.63 222
7-points, bipolar, fully-labeled -5.58 1,372 -5.94 196
Coefficients from negative binomial regressions with fixed effects for industries and random effects for respondents.
Responses with more than 19 recommendations are excluded.
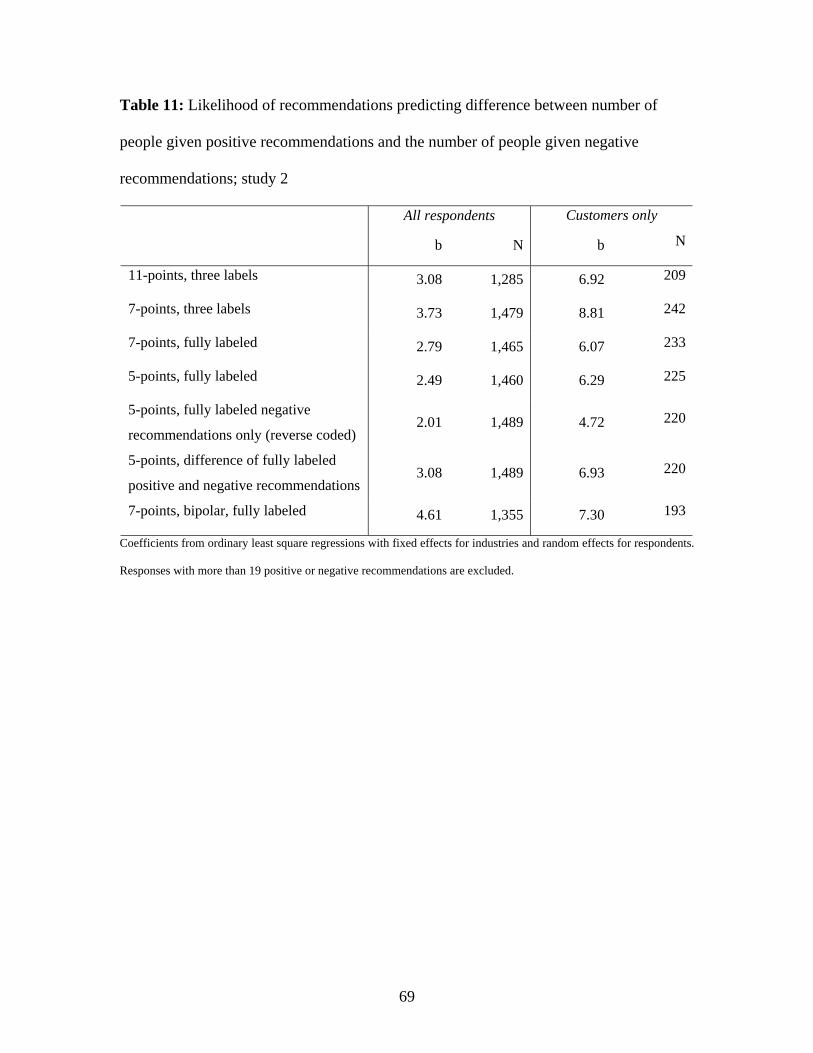
69
Table 11: Likelihood of recommendations predicting difference between number of
people given positive recommendations and the number of people given negative
recommendations; study 2
All respondents Customers only
b N b N
11-points, three labels 3.08 1,285 6.92 209
7-points, three labels 3.73 1,479 8.81 242
7-points, fully labeled 2.79 1,465 6.07 233
5-points, fully labeled 2.49 1,460 6.29 225
5-points, fully labeled negative
recommendations only (reverse coded) 2.01 1,489 4.72 220
5-points, difference of fully labeled
positive and negative recommendations 3.08 1,489 6.93 220
7-points, bipolar, fully labeled 4.61 1,355 7.30 193
Coefficients from ordinary least square regressions with fixed effects for industries and random effects for respondents.
Responses with more than 19 positive or negative recommendations are excluded.
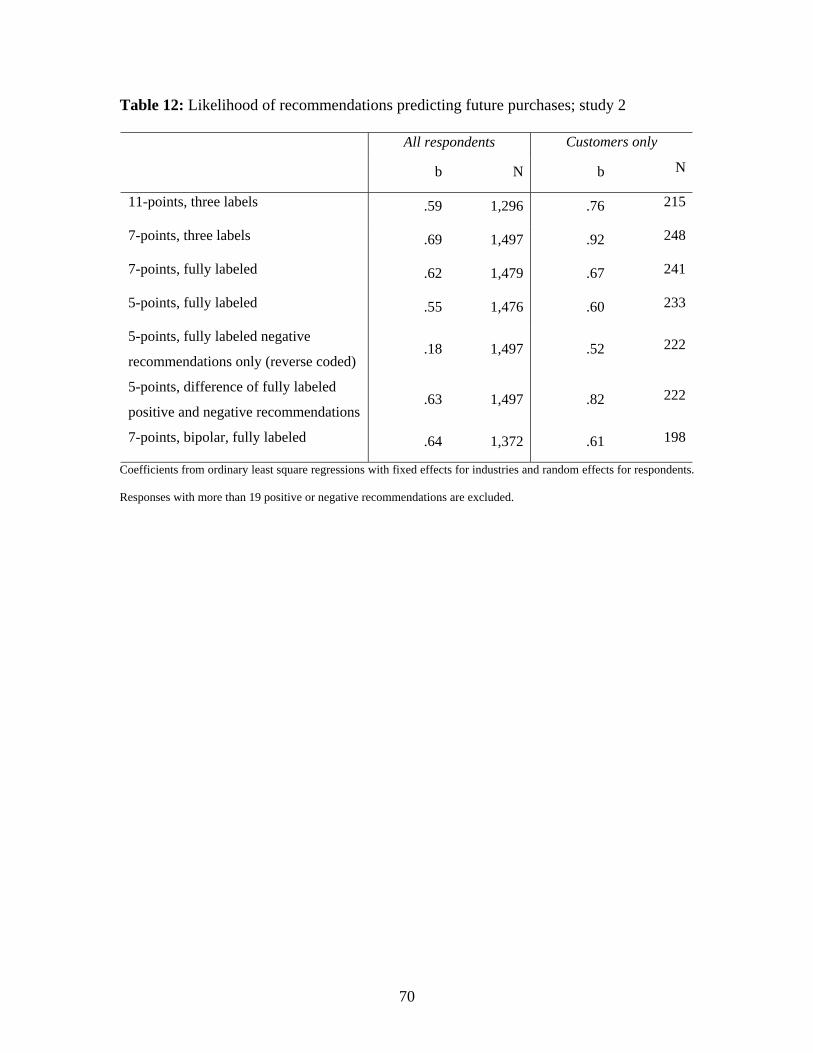
70
Table 12: Likelihood of recommendations predicting future purchases; study 2
All respondents Customers only
b N b N
11-points, three labels .59 1,296 .76 215
7-points, three labels .69 1,497 .92 248
7-points, fully labeled .62 1,479 .67 241
5-points, fully labeled .55 1,476 .60 233
5-points, fully labeled negative
recommendations only (reverse coded) .18 1,497 .52 222
5-points, difference of fully labeled
positive and negative recommendations .63 1,497 .82 222
7-points, bipolar, fully labeled .64 1,372 .61 198
Coefficients from ordinary least square regressions with fixed effects for industries and random effects for respondents.
Responses with more than 19 positive or negative recommendations are excluded.
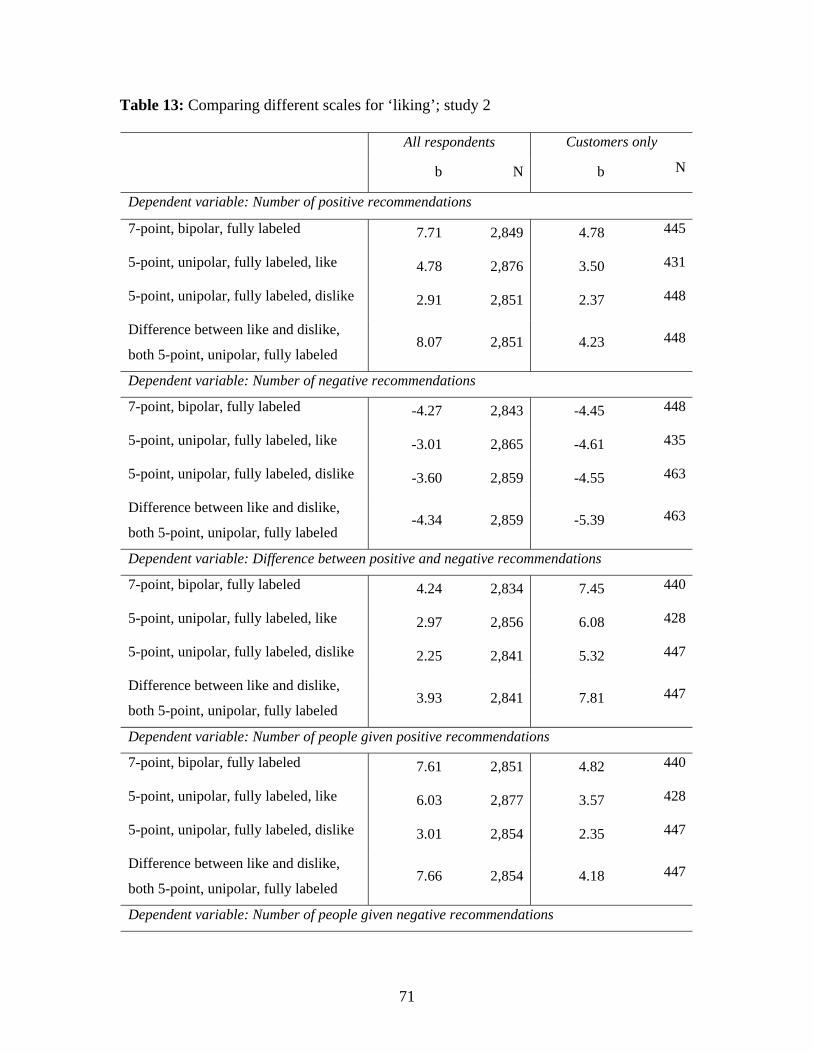
71
Table 13: Comparing different scales for ‘liking’; study 2
All respondents Customers only
b N b N
Dependent variable: Number of positive recommendations
7-point, bipolar, fully labeled 7.71 2,849 4.78 445
5-point, unipolar, fully labeled, like 4.78 2,876 3.50 431
5-point, unipolar, fully labeled, dislike 2.91 2,851 2.37 448
Difference between like and dislike,
both 5-point, unipolar, fully labeled 8.07 2,851 4.23 448
Dependent variable: Number of negative recommendations
7-point, bipolar, fully labeled -4.27 2,843 -4.45 448
5-point, unipolar, fully labeled, like -3.01 2,865 -4.61 435
5-point, unipolar, fully labeled, dislike -3.60 2,859 -4.55 463
Difference between like and dislike,
both 5-point, unipolar, fully labeled -4.34 2,859 -5.39 463
Dependent variable: Difference between positive and negative recommendations
7-point, bipolar, fully labeled 4.24 2,834 7.45 440
5-point, unipolar, fully labeled, like 2.97 2,856 6.08 428
5-point, unipolar, fully labeled, dislike 2.25 2,841 5.32 447
Difference between like and dislike,
both 5-point, unipolar, fully labeled 3.93 2,841 7.81 447
Dependent variable: Number of people given positive recommendations
7-point, bipolar, fully labeled 7.61 2,851 4.82 440
5-point, unipolar, fully labeled, like 6.03 2,877 3.57 428
5-point, unipolar, fully labeled, dislike 3.01 2,854 2.35 447
Difference between like and dislike,
both 5-point, unipolar, fully labeled 7.66 2,854 4.18 447
Dependent variable: Number of people given negative recommendations
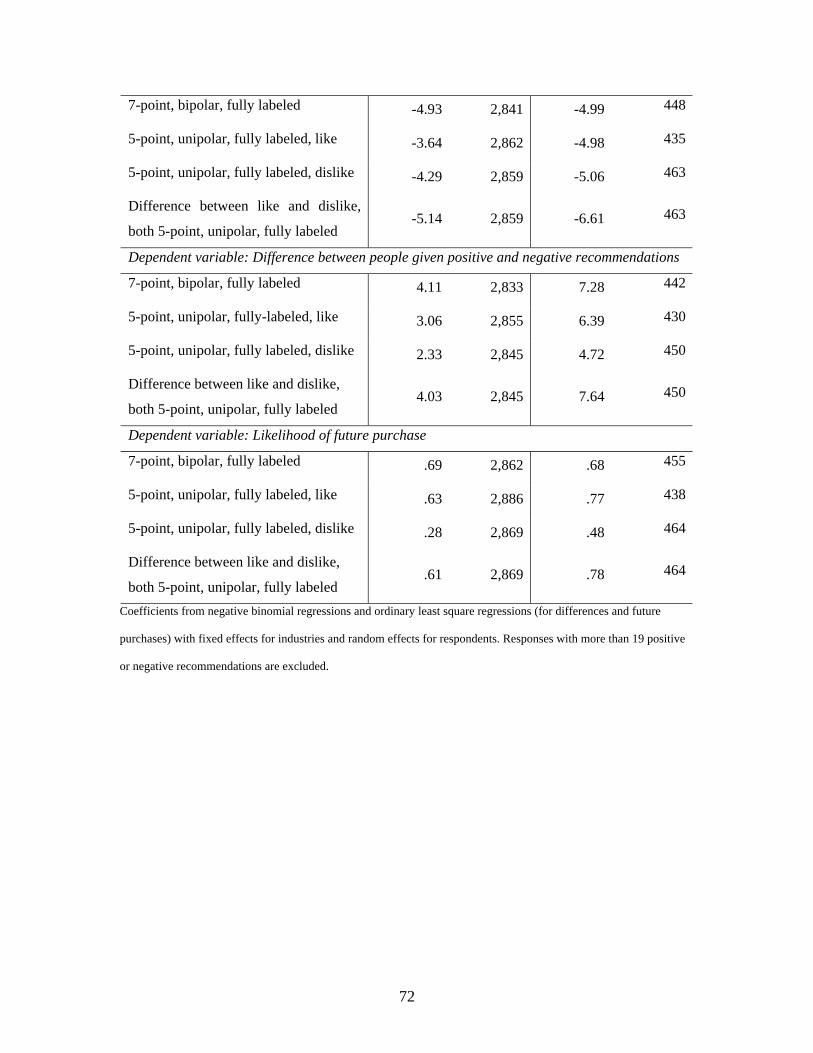
72
7-point, bipolar, fully labeled -4.93 2,841 -4.99 448
5-point, unipolar, fully labeled, like -3.64 2,862 -4.98 435
5-point, unipolar, fully labeled, dislike -4.29 2,859 -5.06 463
Difference between like and dislike,
both 5-point, unipolar, fully labeled -5.14 2,859 -6.61 463
Dependent variable: Difference between people given positive and negative recommendations
7-point, bipolar, fully labeled 4.11 2,833 7.28 442
5-point, unipolar, fully-labeled, like 3.06 2,855 6.39 430
5-point, unipolar, fully labeled, dislike 2.33 2,845 4.72 450
Difference between like and dislike,
both 5-point, unipolar, fully labeled 4.03 2,845 7.64 450
Dependent variable: Likelihood of future purchase
7-point, bipolar, fully labeled .69 2,862 .68 455
5-point, unipolar, fully labeled, like .63 2,886 .77 438
5-point, unipolar, fully labeled, dislike .28 2,869 .48 464
Difference between like and dislike,
both 5-point, unipolar, fully labeled .61 2,869 .78 464
Coefficients from negative binomial regressions and ordinary least square regressions (for differences and future
purchases) with fixed effects for industries and random effects for respondents. Responses with more than 19 positive
or negative recommendations are excluded.
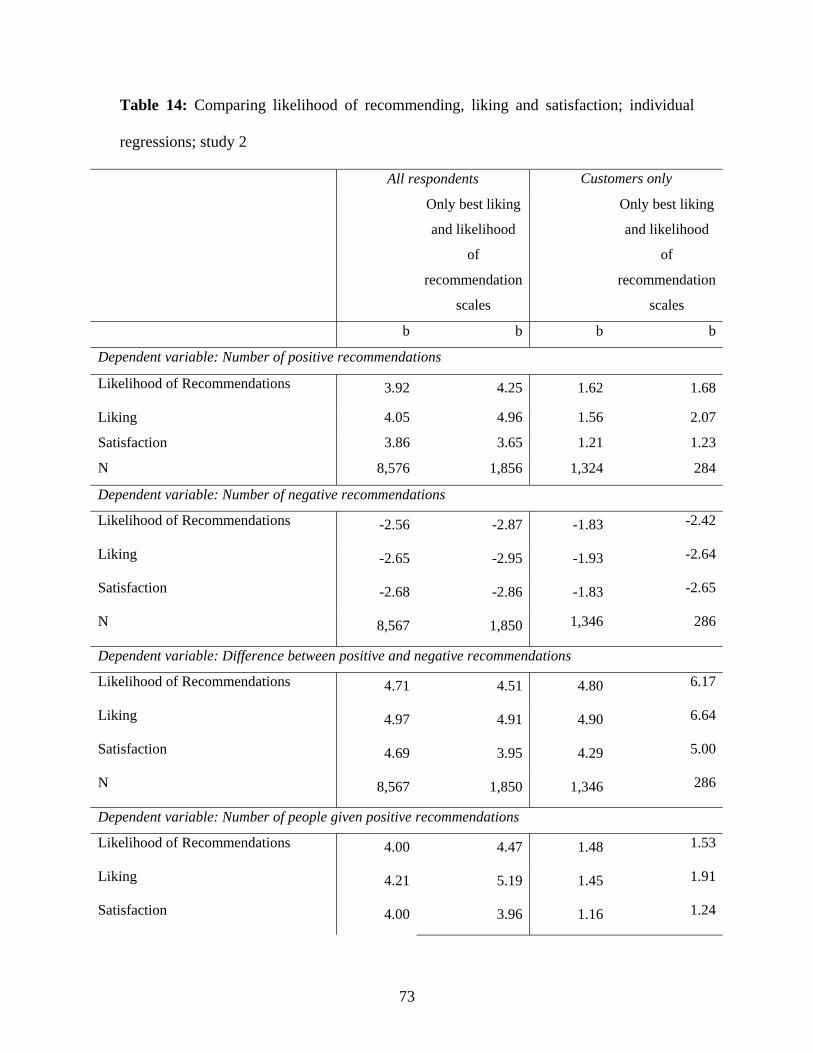
73
Table 14: Comparing likelihood of recommending, liking and satisfaction; individual
regressions; study 2
All respondents Customers only
Only best liking
and likelihood
of
recommendation
scales
Only best liking
and likelihood
of
recommendation
scales
b b b b
Dependent variable: Number of positive recommendations
Likelihood of Recommendations 3.92 4.25 1.62 1.68
Liking 4.05 4.96 1.56 2.07
Satisfaction 3.86 3.65 1.21 1.23
N 8,576 1,856 1,324 284
Dependent variable: Number of negative recommendations
Likelihood of Recommendations -2.56 -2.87 -1.83 -2.42
Liking -2.65 -2.95 -1.93 -2.64
Satisfaction -2.68 -2.86 -1.83 -2.65
N 8,567 1,850 1,346 286
Dependent variable: Difference between positive and negative recommendations
Likelihood of Recommendations 4.71 4.51 4.80 6.17
Liking 4.97 4.91 4.90 6.64
Satisfaction 4.69 3.95 4.29 5.00
N 8,567 1,850 1,346 286
Dependent variable: Number of people given positive recommendations
Likelihood of Recommendations 4.00 4.47 1.48 1.53
Liking 4.21 5.19 1.45 1.91
Satisfaction 4.00 3.96 1.16 1.24

74
N 8,582 1,857 1,331 286
Dependent variable: Number of people given negative recommendations
Likelihood of Recommendations -2.95 -3.53 -1.41 -1.94
Liking -3.02 -3.39 -1.52 -1.83
Satisfaction -2.98 -3.29 -1.41 -1.79
N 8,582 1,857 1,331 286
Dependent variable: Difference between people given positive and negative recommendations
Likelihood of Recommendations 3.31 4.93 8.30 5.65
Liking 3.79 5.43 7.84 6.09
Satisfaction 3.62 4.42 6.74 4.68
N 8,567 1,850 1,346 286
Dependent variable: Likelihood of future purchase
Likelihood of Recommendations .38 .52 .33 .43
Liking .43 .55 .34 .45
Satisfaction .39 .43 .30 .34
N 8,617 1,865 1,357 291
Coefficients from negative binomial regressions and ordinary least square regressions (for differences and future
purchases) with fixed effects for industries and random effects for respondents. Responses with more than 19 positive
or negative recommendations are excluded.

75
Table 15: Comparing likelihood of recommending, liking and satisfaction; combined in
one regression; study 2
All respondents Customers only
Only best liking
and likelihood
of
recommendation
scales
Only best liking
and likelihood
of
recommendation
scales
b b b b
Dependent variable: Number of positive recommendations
Likelihood of Recommendations 4.12 5.08 2.86 2.89
Liking 2.80 3.01 1.24 2.04
Satisfaction .68 .02 .26 -.11
N 8,567 1,850 1,346 286
Dependent variable: Number of negative recommendations
Likelihood of Recommendations .43 .78 .21 .70
Liking -1.16 -2.26 -2.44 -3.77
Satisfaction -3.73 -3.43 -2.70 -1.88
N 8,567 1,850 1,346 286
Dependent variable: Difference between positive and negative recommendations
Likelihood of Recommendations 1.28 2.17 3.68 5.02
Liking 1.53 2.21 2.65 3.99
Satisfaction 1.38 .92 1.66 .41
N 8,567 1,850 1,315 281
Dependent variable: Number of people given positive recommendations
Likelihood of Recommendations 4.06 5.39 2.76 2.89
Liking 3.03 2.72 1.30 2.08
Satisfaction .73 .26 .24 -.08
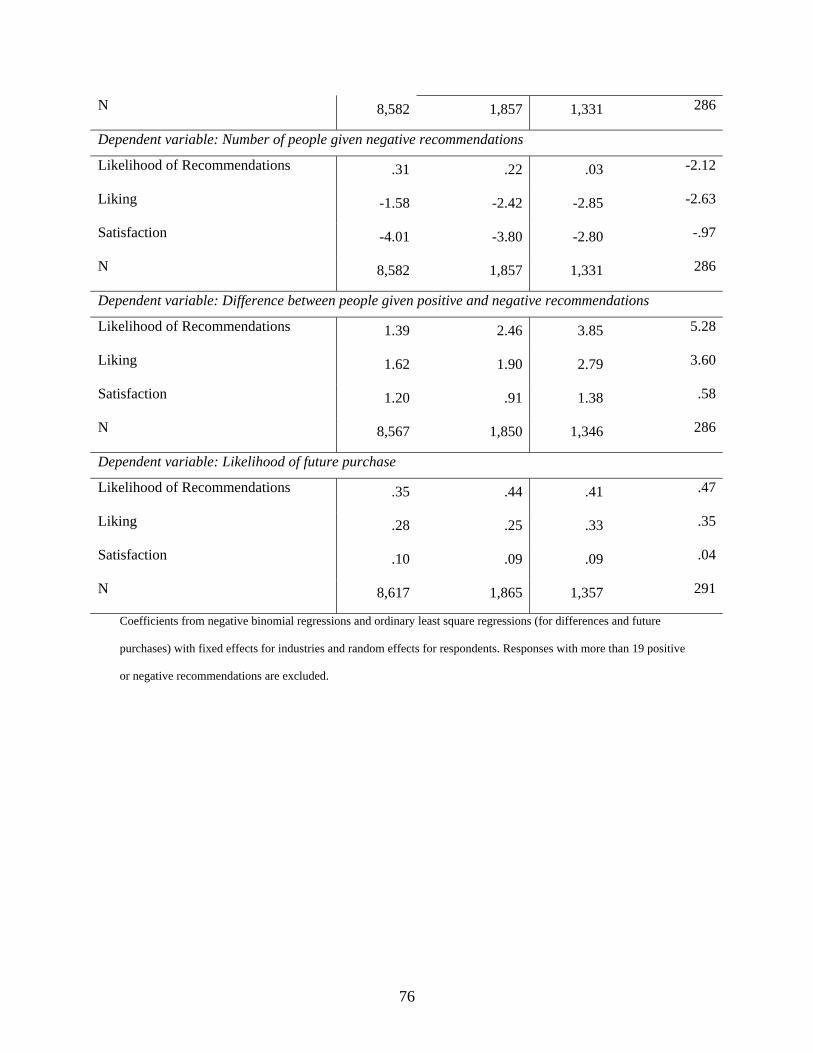
76
N 8,582 1,857 1,331 286
Dependent variable: Number of people given negative recommendations
Likelihood of Recommendations .31 .22 .03 -2.12
Liking -1.58 -2.42 -2.85 -2.63
Satisfaction -4.01 -3.80 -2.80 -.97
N 8,582 1,857 1,331 286
Dependent variable: Difference between people given positive and negative recommendations
Likelihood of Recommendations 1.39 2.46 3.85 5.28
Liking 1.62 1.90 2.79 3.60
Satisfaction 1.20 .91 1.38 .58
N 8,567 1,850 1,346 286
Dependent variable: Likelihood of future purchase
Likelihood of Recommendations .35 .44 .41 .47
Liking .28 .25 .33 .35
Satisfaction .10 .09 .09 .04
N 8,617 1,865 1,357 291
Coefficients from negative binomial regressions and ordinary least square regressions (for differences and future
purchases) with fixed effects for industries and random effects for respondents. Responses with more than 19 positive
or negative recommendations are excluded.
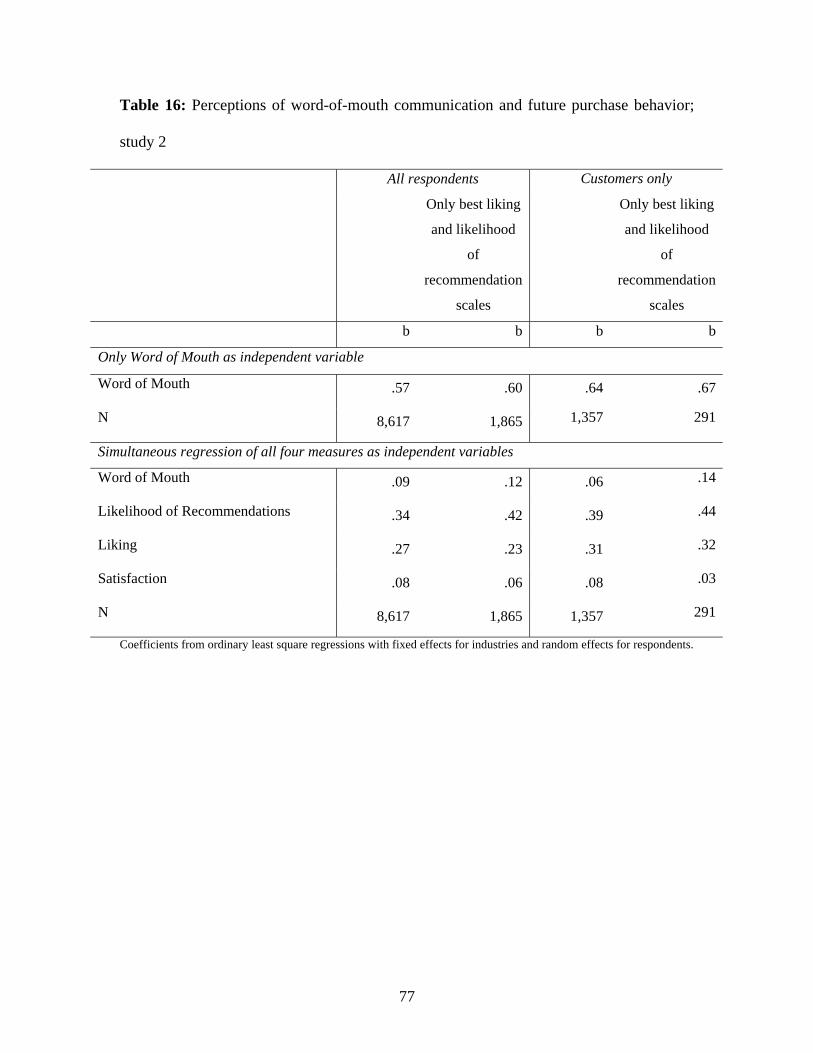
77
Table 16: Perceptions of word-of-mouth communication and future purchase behavior;
study 2
All respondents Customers only
Only best liking
and likelihood
of
recommendation
scales
Only best liking
and likelihood
of
recommendation
scales
b b b b
Only Word of Mouth as independent variable
Word of Mouth .57 .60 .64 .67
N 8,617 1,865 1,357 291
Simultaneous regression of all four measures as independent variables
Word of Mouth .09 .12 .06 .14
Likelihood of Recommendations .34 .42 .39 .44
Liking .27 .23 .31 .32
Satisfaction .08 .06 .08 .03
N 8,617 1,865 1,357 291
Coefficients from ordinary least square regressions with fixed effects for industries and random effects for respondents.
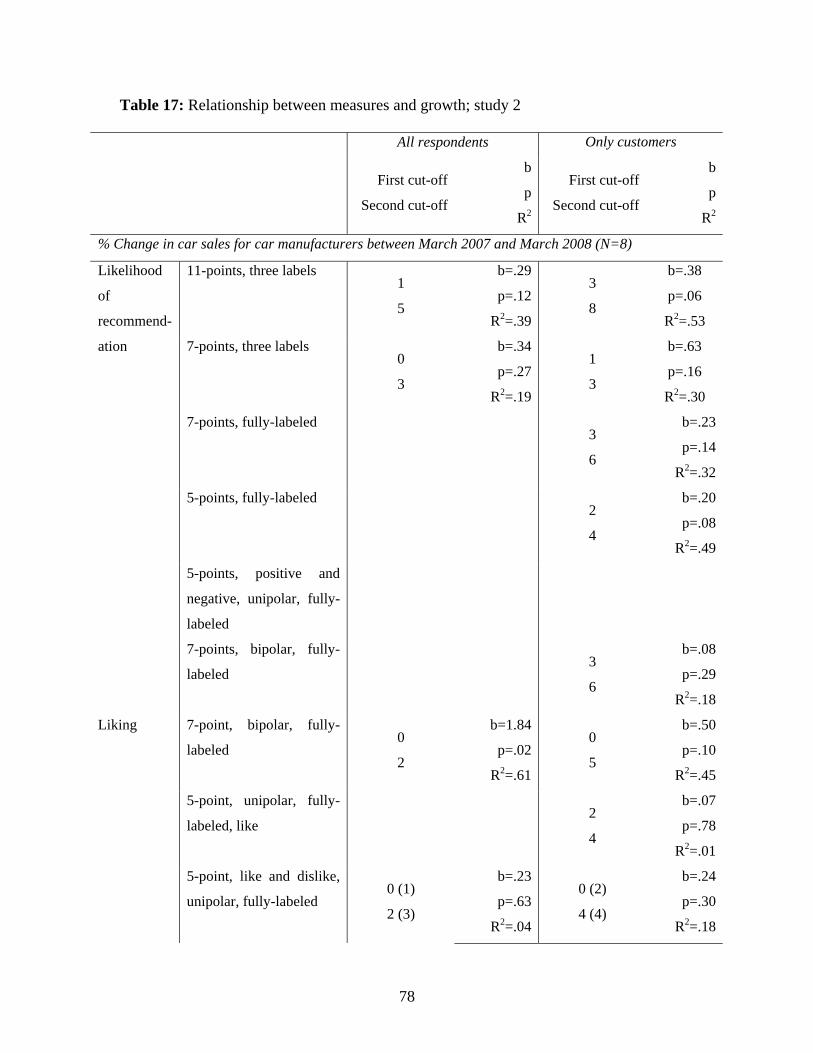
78
Table 17: Relationship between measures and growth; study 2
All respondents Only customers
First cut-off
Second cut-off
b
p
R2
First cut-off
Second cut-off
b
p
R2
% Change in car sales for car manufacturers between March 2007 and March 2008 (N=8)
11-points, three labels 1
5
b=.29
p=.12
R2=.39
3
8
b=.38
p=.06
R2=.53
7-points, three labels 0
3
b=.34
p=.27
R2=.19
1
3
b=.63
p=.16
R2=.30
7-points, fully-labeled
3
6
b=.23
p=.14
R2=.32
5-points, fully-labeled
2
4
b=.20
p=.08
R2=.49
5-points, positive and
negative, unipolar, fully-
labeled
Likelihood
of
recommend-
ation
7-points, bipolar, fully-
labeled 3
6
b=.08
p=.29
R2=.18
7-point, bipolar, fully-
labeled 0
2
b=1.84
p=.02
R2=.61
0
5
b=.50
p=.10
R2=.45
5-point, unipolar, fully-
labeled, like 2
4
b=.07
p=.78
R2=.01
Liking
5-point, like and dislike,
unipolar, fully-labeled 0 (1)
2 (3)
b=.23
p=.63
R2=.04
0 (2)
4 (4)
b=.24
p=.30
R2=.18
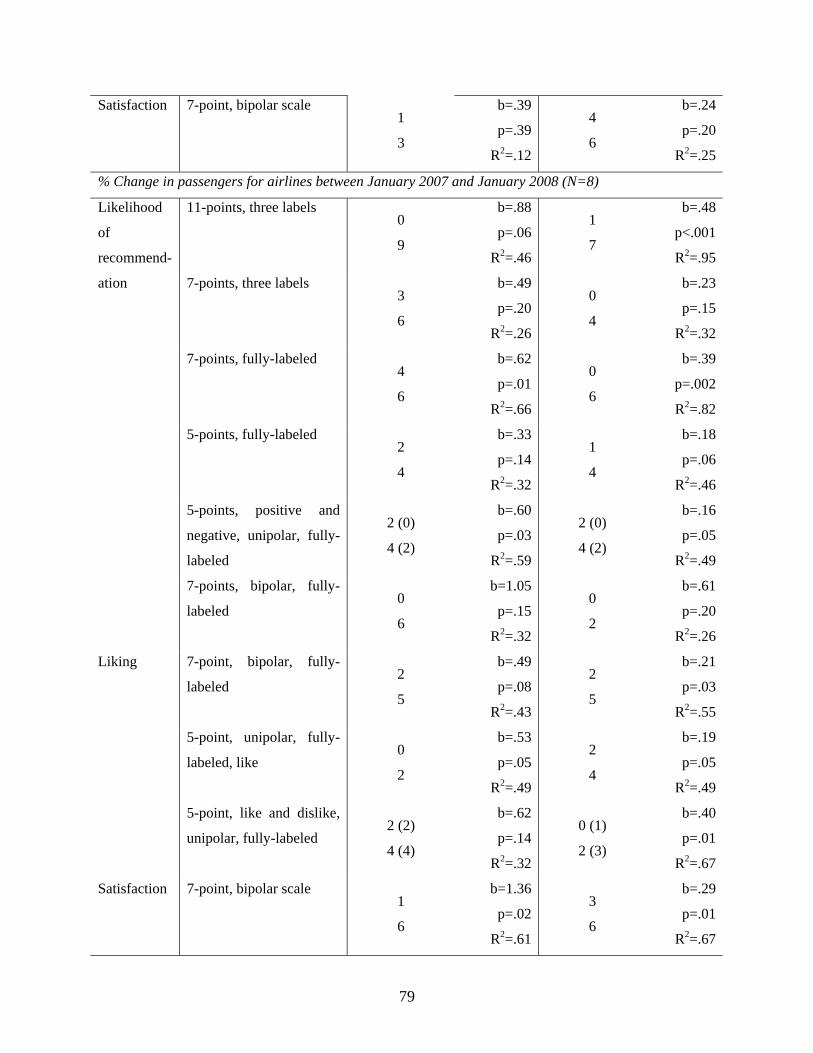
79
Satisfaction 7-point, bipolar scale 1
3
b=.39
p=.39
R2=.12
4
6
b=.24
p=.20
R2=.25
% Change in passengers for airlines between January 2007 and January 2008 (N=8)
11-points, three labels 0
9
b=.88
p=.06
R2=.46
1
7
b=.48
p<.001
R2=.95
7-points, three labels 3
6
b=.49
p=.20
R2=.26
0
4
b=.23
p=.15
R2=.32
7-points, fully-labeled 4
6
b=.62
p=.01
R2=.66
0
6
b=.39
p=.002
R2=.82
5-points, fully-labeled 2
4
b=.33
p=.14
R2=.32
1
4
b=.18
p=.06
R2=.46
5-points, positive and
negative, unipolar, fully-
labeled
2 (0)
4 (2)
b=.60
p=.03
R2=.59
2 (0)
4 (2)
b=.16
p=.05
R2=.49
Likelihood
of
recommend-
ation
7-points, bipolar, fully-
labeled 0
6
b=1.05
p=.15
R2=.32
0
2
b=.61
p=.20
R2=.26
7-point, bipolar, fully-
labeled 2
5
b=.49
p=.08
R2=.43
2
5
b=.21
p=.03
R2=.55
5-point, unipolar, fully-
labeled, like 0
2
b=.53
p=.05
R2=.49
2
4
b=.19
p=.05
R2=.49
Liking
5-point, like and dislike,
unipolar, fully-labeled 2 (2)
4 (4)
b=.62
p=.14
R2=.32
0 (1)
2 (3)
b=.40
p=.01
R2=.67
Satisfaction 7-point, bipolar scale 1
6
b=1.36
p=.02
R2=.61
3
6
b=.29
p=.01
R2=.67

80
Coefficients, p-values and R2 from ordinary least square regressions weighted by the number of respondents for each
summary statistic. Responses with more than 19 positive or negative recommendations, or more than 19 people given
positive or negative recommendations are excluded.
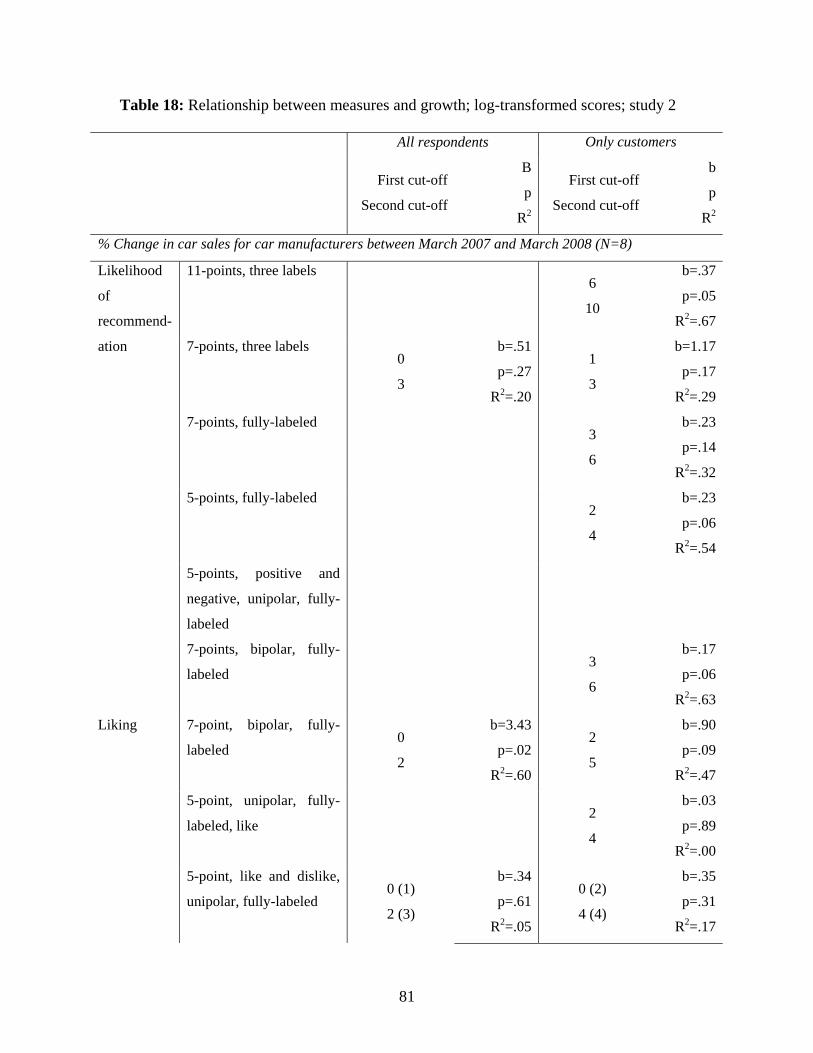
81
Table 18: Relationship between measures and growth; log-transformed scores; study 2
All respondents Only customers
First cut-off
Second cut-off
B
p
R2
First cut-off
Second cut-off
b
p
R2
% Change in car sales for car manufacturers between March 2007 and March 2008 (N=8)
11-points, three labels
6
10
b=.37
p=.05
R2=.67
7-points, three labels 0
3
b=.51
p=.27
R2=.20
1
3
b=1.17
p=.17
R2=.29
7-points, fully-labeled
3
6
b=.23
p=.14
R2=.32
5-points, fully-labeled
2
4
b=.23
p=.06
R2=.54
5-points, positive and
negative, unipolar, fully-
labeled
Likelihood
of
recommend-
ation
7-points, bipolar, fully-
labeled 3
6
b=.17
p=.06
R2=.63
7-point, bipolar, fully-
labeled 0
2
b=3.43
p=.02
R2=.60
2
5
b=.90
p=.09
R2=.47
5-point, unipolar, fully-
labeled, like 2
4
b=.03
p=.89
R2=.00
Liking
5-point, like and dislike,
unipolar, fully-labeled 0 (1)
2 (3)
b=.34
p=.61
R2=.05
0 (2)
4 (4)
b=.35
p=.31
R2=.17
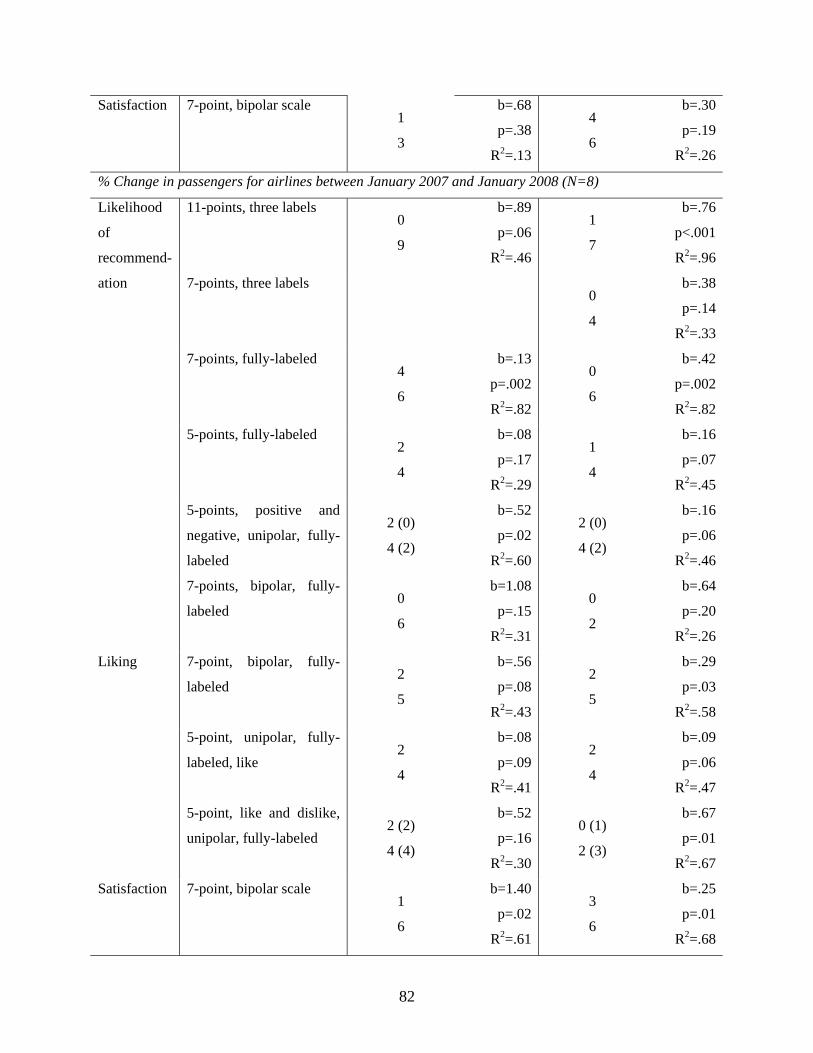
82
Satisfaction 7-point, bipolar scale 1
3
b=.68
p=.38
R2=.13
4
6
b=.30
p=.19
R2=.26
% Change in passengers for airlines between January 2007 and January 2008 (N=8)
11-points, three labels 0
9
b=.89
p=.06
R2=.46
1
7
b=.76
p<.001
R2=.96
7-points, three labels
0
4
b=.38
p=.14
R2=.33
7-points, fully-labeled 4
6
b=.13
p=.002
R2=.82
0
6
b=.42
p=.002
R2=.82
5-points, fully-labeled 2
4
b=.08
p=.17
R2=.29
1
4
b=.16
p=.07
R2=.45
5-points, positive and
negative, unipolar, fully-
labeled
2 (0)
4 (2)
b=.52
p=.02
R2=.60
2 (0)
4 (2)
b=.16
p=.06
R2=.46
Likelihood
of
recommend-
ation
7-points, bipolar, fully-
labeled 0
6
b=1.08
p=.15
R2=.31
0
2
b=.64
p=.20
R2=.26
7-point, bipolar, fully-
labeled 2
5
b=.56
p=.08
R2=.43
2
5
b=.29
p=.03
R2=.58
5-point, unipolar, fully-
labeled, like 2
4
b=.08
p=.09
R2=.41
2
4
b=.09
p=.06
R2=.47
Liking
5-point, like and dislike,
unipolar, fully-labeled 2 (2)
4 (4)
b=.52
p=.16
R2=.30
0 (1)
2 (3)
b=.67
p=.01
R2=.67
Satisfaction 7-point, bipolar scale 1
6
b=1.40
p=.02
R2=.61
3
6
b=.25
p=.01
R2=.68

83
Coefficients, p-values and R2 from ordinary least square regressions weighted by the number of respondents for each
summary statistic. Responses with more than 19 positive or negative recommendations, or more than 19 people given
positive or negative recommendations are excluded.
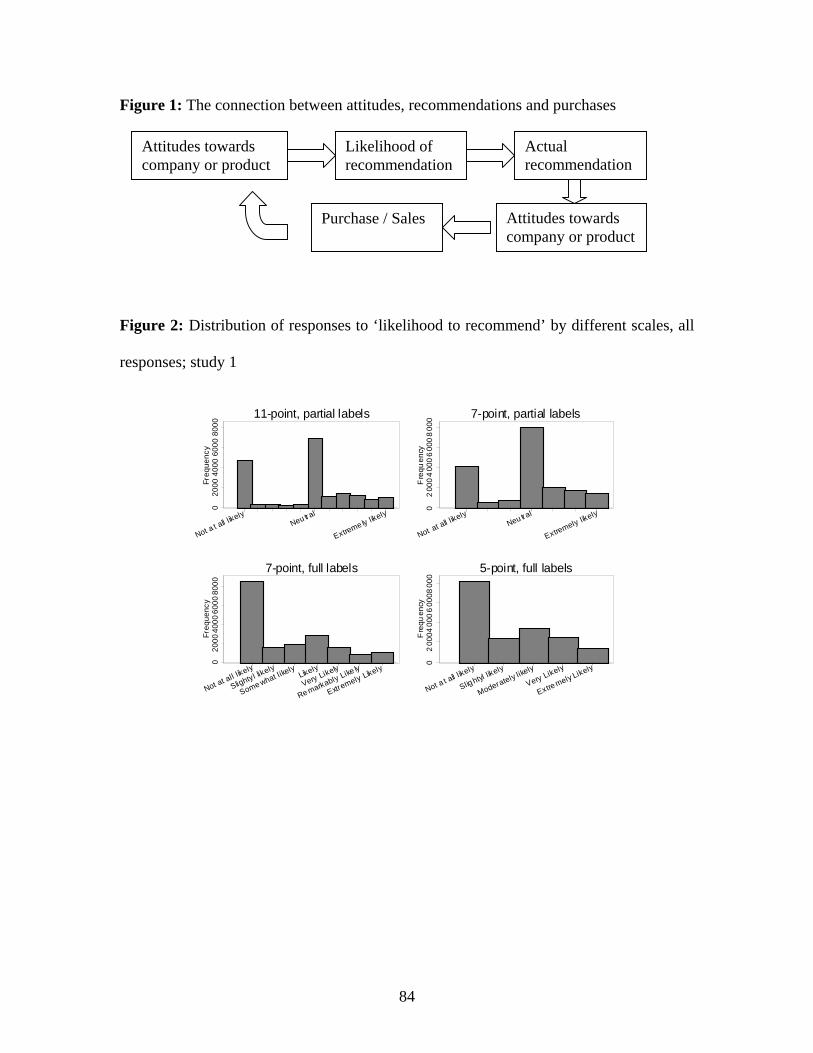
84
Figure 1: The connection between attitudes, recommendations and purchases
Figure 2: Distribution of responses to ‘likelihood to recommend’ by different scales, all
responses; study 1
020
0040
0060
0080
00Fr
eque
ncy
Not a t all likely
Neu tral
Extreme ly likely
11-point, partial labels0
200
04
000
600
08
000
Fre
quen
cy
Not at all likely
Neu tral
Extremely likely
7-point, partial labels
020
0040
0060
0080
00Fr
eque
ncy
Not at all likely
Slightyl likely
Some what likely
Likely
Very Likely
Re markably Like ly
Extremely Likely
7-point, full labels
02
0004
000
600
0800
0F
requ
ency
Not a t all likely
Slig htyl likely
Moderately likely
Very Likely
Extre mely Likely
5-point, full labels
Attitudes towards company or product
Likelihood of recommendation
Actual recommendation
Purchase / Sales Attitudes towards company or product
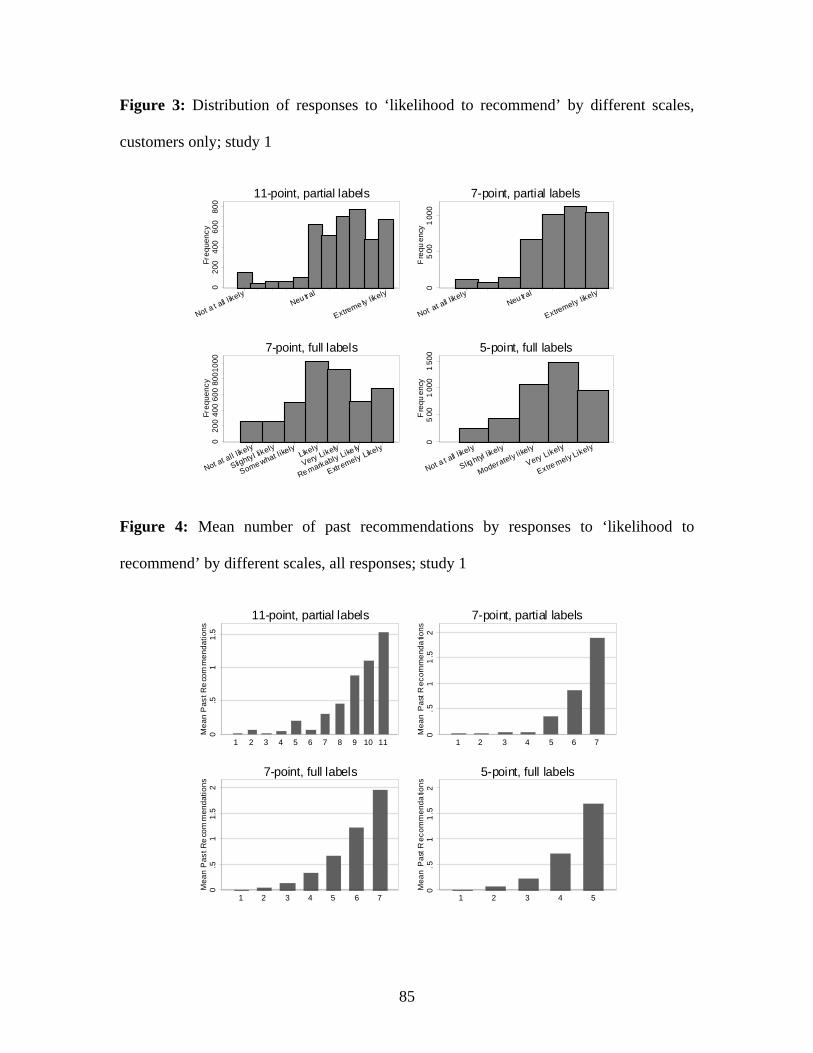
85
Figure 3: Distribution of responses to ‘likelihood to recommend’ by different scales,
customers only; study 1
020
040
060
080
0Fr
eque
ncy
Not a t all likely
Neu tral
Extreme ly likely
11-point, partial labels
05
001
000
Fre
quen
cy
Not at all likely
Neu tral
Extremely likely
7-point, partial labels0
200
400
600
8001
000
Freq
uenc
y
Not at all likely
Slightyl likely
Some what likely
Likely
Very Likely
Re markably Like ly
Extremely Likely
7-point, full labels
05
001
000
150
0F
requ
ency
Not a t all likely
Slig htyl likely
Moderately likely
Very Likely
Extre mely Likely
5-point, full labels
Figure 4: Mean number of past recommendations by responses to ‘likelihood to
recommend’ by different scales, all responses; study 1
0.5
11.
5M
ean
Pas
t Re
com
men
datio
ns
1 2 3 4 5 6 7 8 9 10 11
11-point, partial labels
0.5
11
.52
Mea
n P
ast R
ecom
men
datio
ns
1 2 3 4 5 6 7
7-point, partial labels
0.5
11.
52
Mea
n P
ast R
eco
mm
enda
tions
1 2 3 4 5 6 7
7-point, full labels
0.5
11
.52
Mea
n P
ast R
ecom
men
datio
ns
1 2 3 4 5
5-point, full labels
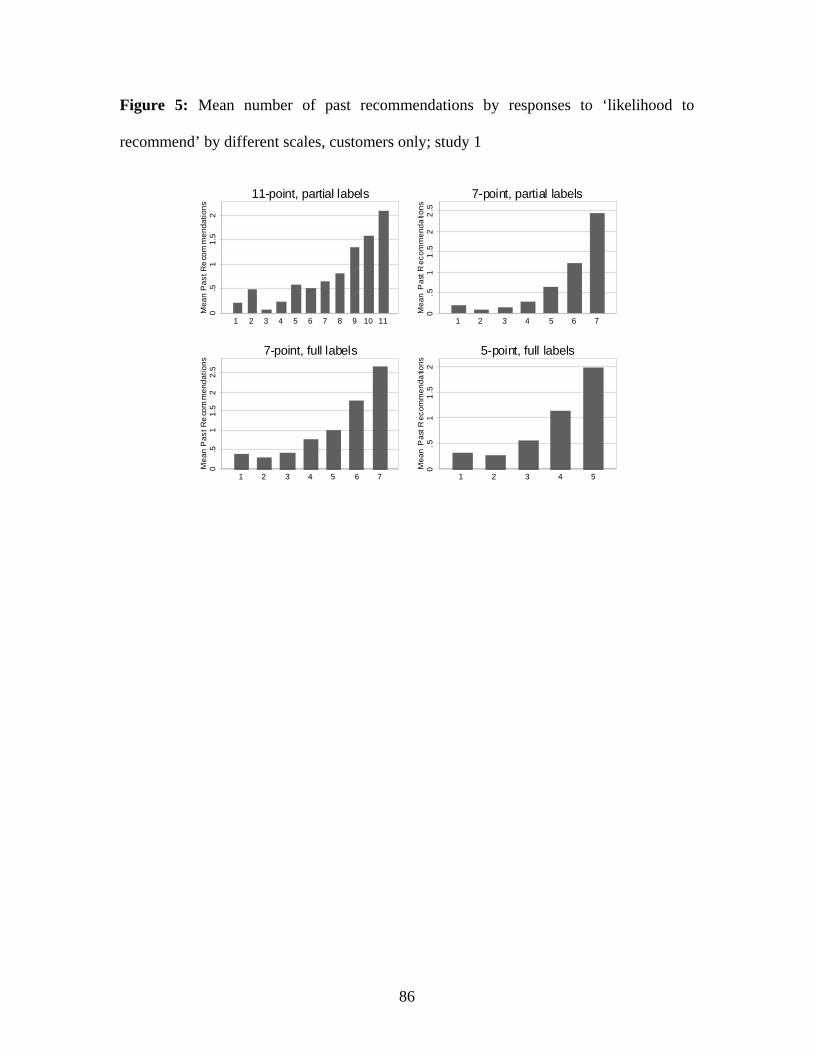
86
Figure 5: Mean number of past recommendations by responses to ‘likelihood to
recommend’ by different scales, customers only; study 1
0.5
11.
52
Mea
n P
ast R
eco
mm
enda
tions
1 2 3 4 5 6 7 8 9 10 11
11-point, partial labels
0.5
11
.52
2.5
Mea
n P
ast R
ecom
men
datio
ns
1 2 3 4 5 6 7
7-point, partial labels0
.51
1.5
22.
5M
ean
Pas
t Re
com
men
datio
ns
1 2 3 4 5 6 7
7-point, full labels
0.5
11
.52
Mea
n P
ast R
ecom
men
datio
ns
1 2 3 4 5
5-point, full labels
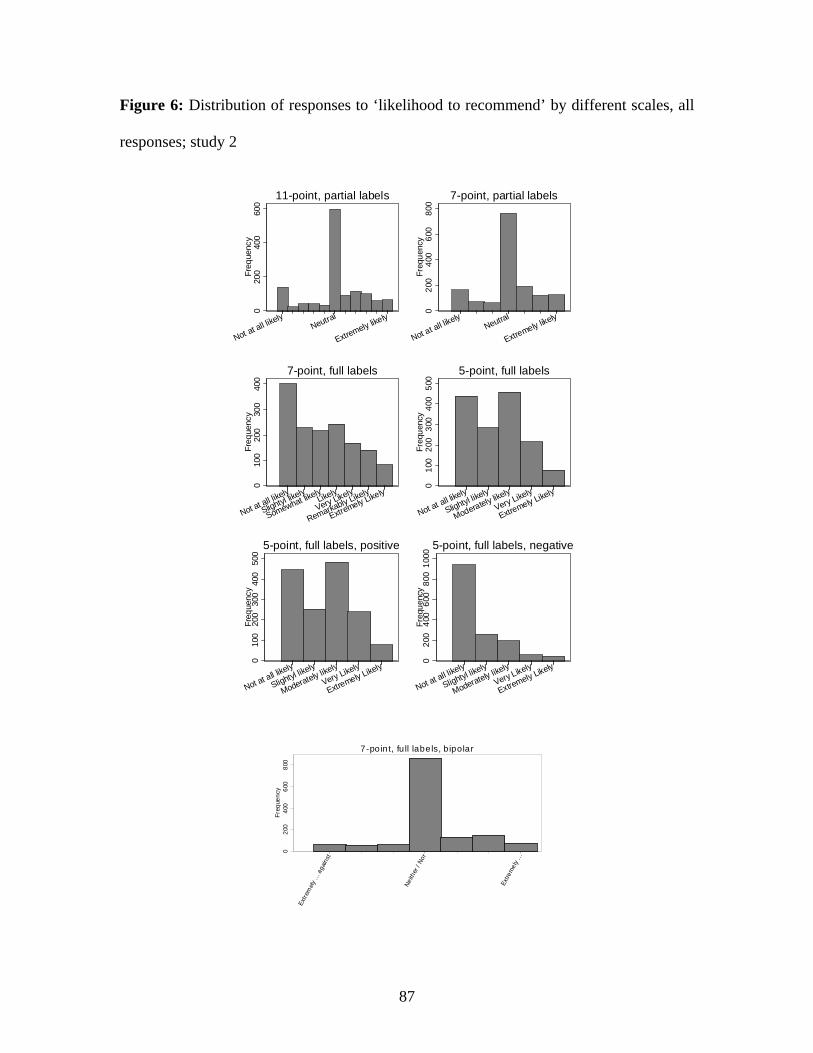
87
Figure 6: Distribution of responses to ‘likelihood to recommend’ by different scales, all
responses; study 2
020
040
060
0Fr
eque
ncy
Not at all likely
Neutral
Extremely likely
11-point, partial labels
020
040
060
080
0Fr
eque
ncy
Not at all likely
Neutral
Extremely likely
7-point, partial labels
010
020
030
040
0Fr
eque
ncy
Not at all likely
Slightyl likely
Somewhat likelyLikely
Very Likely
Remarkably Likely
Extremely Likely
7-point, full labels
010
020
030
040
050
0Fr
eque
ncy
Not at all likely
Slightyl likely
Moderately likely
Very Likely
Extremely Likely
5-point, full labels
010
020
030
040
050
0Fr
eque
ncy
Not at all likely
Slightyl likely
Moderately likely
Very Likely
Extremely Likely
5-point, full labels, positive
020
040
060
080
010
00Fr
eque
ncy
Not at all likely
Slightyl likely
Moderately likely
Very Likely
Extremely Likely
5-point, full labels, negative
020
040
060
080
0Fr
eque
ncy
Extre
mely
... a
gain
st
Neith
er /
Nor
Extre
mel
y ...
7 -point, fu ll labels, b ipolar
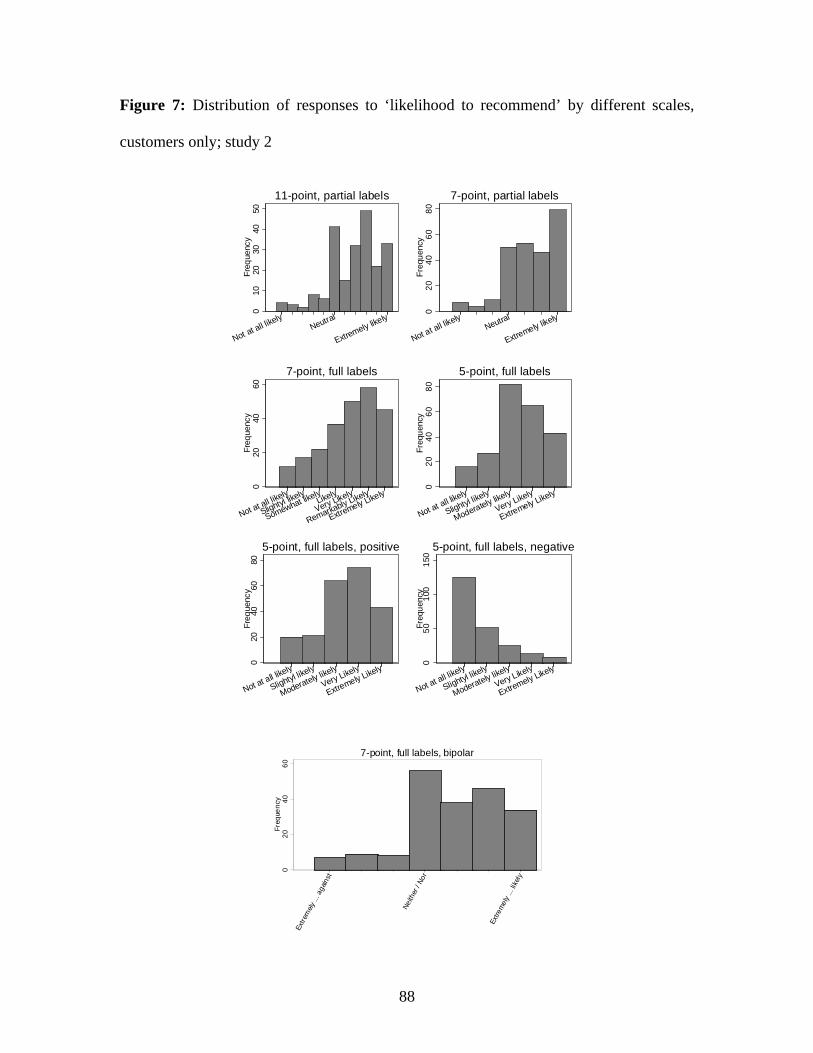
88
Figure 7: Distribution of responses to ‘likelihood to recommend’ by different scales,
customers only; study 2
010
2030
4050
Freq
uenc
y
Not at all likely
Neutral
Extremely likely
11-point, partial labels
020
4060
80Fr
eque
ncy
Not at all likely
Neutral
Extremely likely
7-point, partial labels
020
4060
Freq
uenc
y
Not at all likely
Slightyl likely
Somewhat likelyLikely
Very Likely
Remarkably Likely
Extremely Likely
7-point, full labels
020
4060
80Fr
eque
ncy
Not at all likely
Slightyl likely
Moderately likely
Very Likely
Extremely Likely
5-point, full labels
020
4060
80Fr
eque
ncy
Not at all likely
Slightyl likely
Moderately likely
Very Likely
Extremely Likely
5-point, full labels, positive
050
100
150
Freq
uenc
y
Not at all likely
Slightyl likely
Moderately likely
Very Likely
Extremely Likely
5-point, full labels, negative
020
4060
Freq
uenc
y
Extre
mely
... a
gain
st
Neith
er /
Nor
Extre
mel
y ...
like
ly
7-point, full labels, bipolar
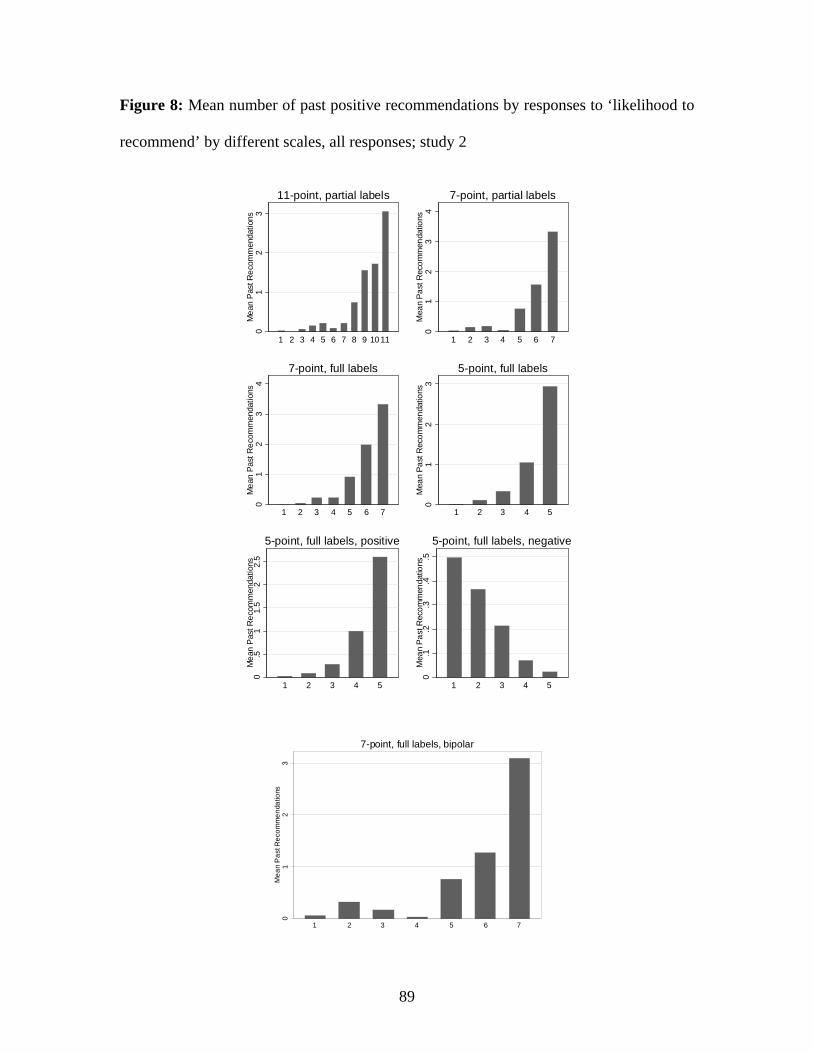
89
Figure 8: Mean number of past positive recommendations by responses to ‘likelihood to
recommend’ by different scales, all responses; study 2
01
23
Mea
n Pa
st R
ecom
men
datio
ns
1 2 3 4 5 6 7 8 9 10 11
11-point, partial labels
01
23
4M
ean
Past
Rec
omm
enda
tions
1 2 3 4 5 6 7
7-point, partial labels
01
23
4M
ean
Past
Rec
omm
enda
tions
1 2 3 4 5 6 7
7-point, full labels
01
23
Mea
n Pa
st R
ecom
men
datio
ns
1 2 3 4 5
5-point, full labels
0.5
11.
52
2.5
Mea
n Pa
st R
ecom
men
datio
ns
1 2 3 4 5
5-point, full labels, positive
0.1
.2.3
.4.5
Mea
n Pa
st R
ecom
men
datio
ns
1 2 3 4 5
5-point, full labels, negative
01
23
Mea
n P
ast R
ecom
men
datio
ns
1 2 3 4 5 6 7
7-point, full labels, bipolar
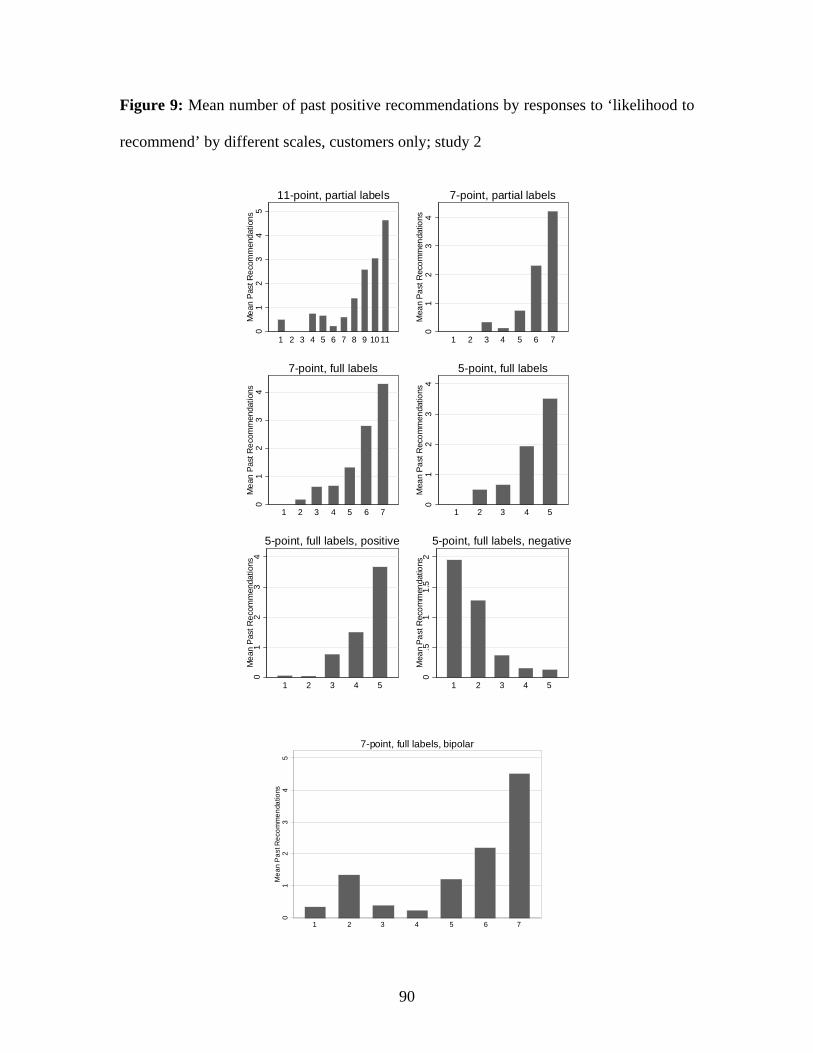
90
Figure 9: Mean number of past positive recommendations by responses to ‘likelihood to
recommend’ by different scales, customers only; study 2
01
23
45
Mea
n Pa
st R
ecom
men
datio
ns
1 2 3 4 5 6 7 8 9 10 11
11-point, partial labels
01
23
4M
ean
Past
Rec
omm
enda
tions
1 2 3 4 5 6 7
7-point, partial labels
01
23
4M
ean
Past
Rec
omm
enda
tions
1 2 3 4 5 6 7
7-point, full labels
01
23
4M
ean
Past
Rec
omm
enda
tions
1 2 3 4 5
5-point, full labels
01
23
4M
ean
Past
Rec
omm
enda
tions
1 2 3 4 5
5-point, full labels, positive
0.5
11.
52
Mea
n Pa
st R
ecom
men
datio
ns
1 2 3 4 5
5-point, full labels, negative
01
23
45
Mea
n P
ast R
ecom
men
datio
ns
1 2 3 4 5 6 7
7-point, full labels, bipolar
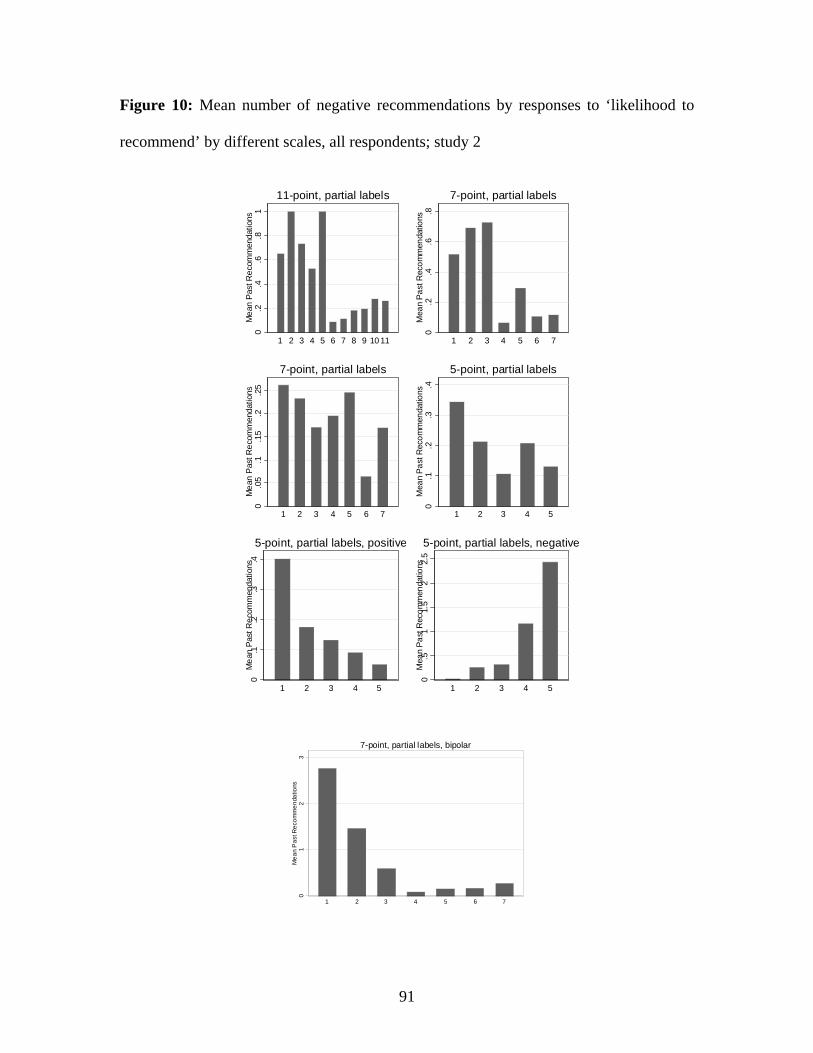
91
Figure 10: Mean number of negative recommendations by responses to ‘likelihood to
recommend’ by different scales, all respondents; study 2
0.2
.4.6
.81
Mea
n Pa
st R
ecom
men
datio
ns
1 2 3 4 5 6 7 8 9 10 11
11-point, partial labels
0.2
.4.6
.8M
ean
Past
Rec
omm
enda
tions
1 2 3 4 5 6 7
7-point, partial labels
0.0
5.1
.15
.2.2
5M
ean
Past
Rec
omm
enda
tions
1 2 3 4 5 6 7
7-point, partial labels
0.1
.2.3
.4M
ean
Past
Rec
omm
enda
tions
1 2 3 4 5
5-point, partial labels
0.1
.2.3
.4M
ean
Past
Rec
omm
enda
tions
1 2 3 4 5
5-point, partial labels, positive
0.5
11.
52
2.5
Mea
n Pa
st R
ecom
men
datio
ns
1 2 3 4 5
5-point, partial labels, negative
01
23
Mea
n P
ast R
ecom
men
datio
ns
1 2 3 4 5 6 7
7-point, partial labels, bipolar
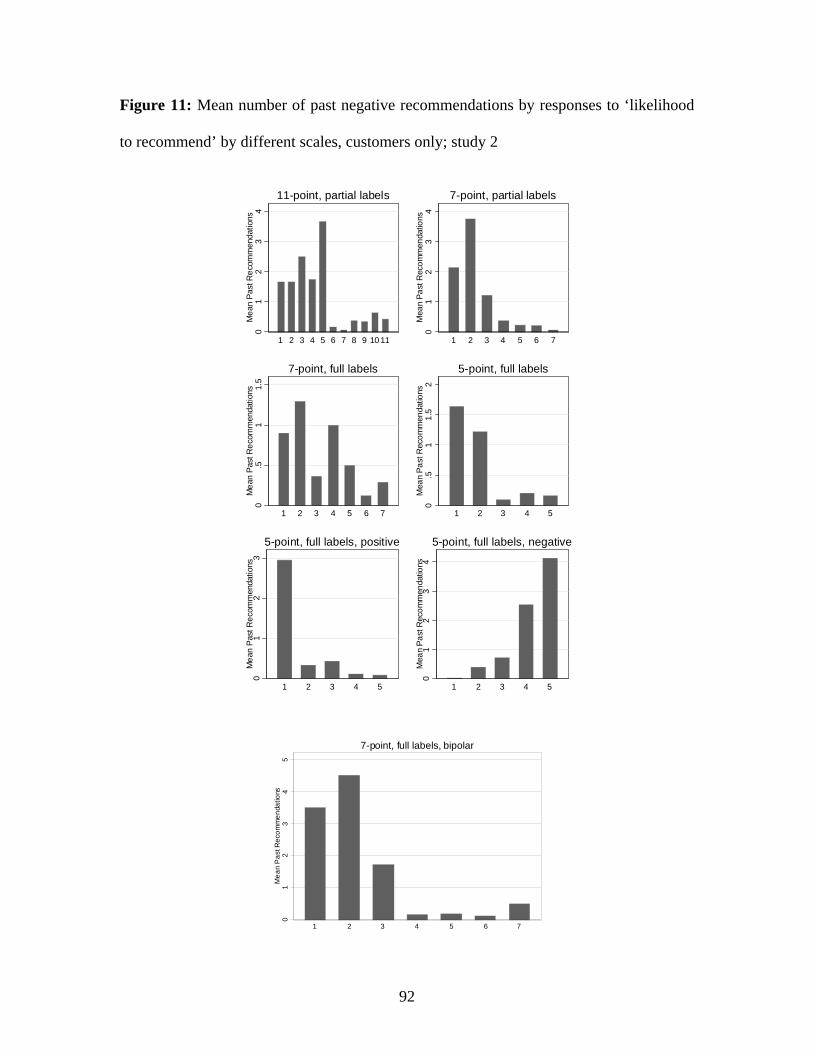
92
Figure 11: Mean number of past negative recommendations by responses to ‘likelihood
to recommend’ by different scales, customers only; study 2
01
23
4M
ean
Past
Rec
omm
enda
tions
1 2 3 4 5 6 7 8 9 10 11
11-point, partial labels
01
23
4M
ean
Past
Rec
omm
enda
tions
1 2 3 4 5 6 7
7-point, partial labels
0.5
11.
5M
ean
Past
Rec
omm
enda
tions
1 2 3 4 5 6 7
7-point, full labels
0.5
11.
52
Mea
n Pa
st R
ecom
men
datio
ns
1 2 3 4 5
5-point, full labels
01
23
Mea
n Pa
st R
ecom
men
datio
ns
1 2 3 4 5
5-point, full labels, positive
01
23
4M
ean
Past
Rec
omm
enda
tions
1 2 3 4 5
5-point, full labels, negative
01
23
45
Mea
n P
ast R
ecom
men
datio
ns
1 2 3 4 5 6 7
7-point, full labels, bipolar
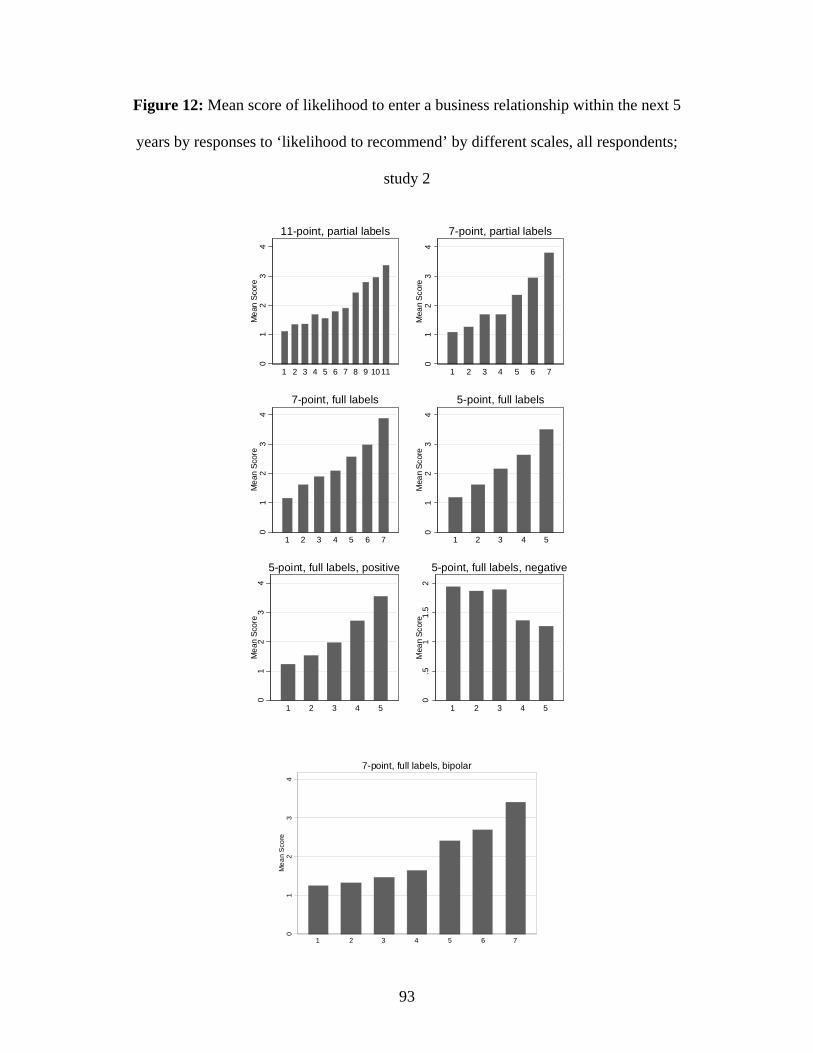
93
Figure 12: Mean score of likelihood to enter a business relationship within the next 5
years by responses to ‘likelihood to recommend’ by different scales, all respondents;
study 2
01
23
4M
ean
Scor
e
1 2 3 4 5 6 7 8 9 10 11
11-point, partial labels
01
23
4M
ean
Scor
e
1 2 3 4 5 6 7
7-point, partial labels
01
23
4M
ean
Scor
e
1 2 3 4 5 6 7
7-point, full labels
01
23
4M
ean
Scor
e
1 2 3 4 5
5-point, full labels
01
23
4M
ean
Scor
e
1 2 3 4 5
5-point, full labels, positive
0.5
11.
52
Mea
n Sc
ore
1 2 3 4 5
5-point, full labels, negative
01
23
4M
ean
Sco
re
1 2 3 4 5 6 7
7-point, full labels, bipolar
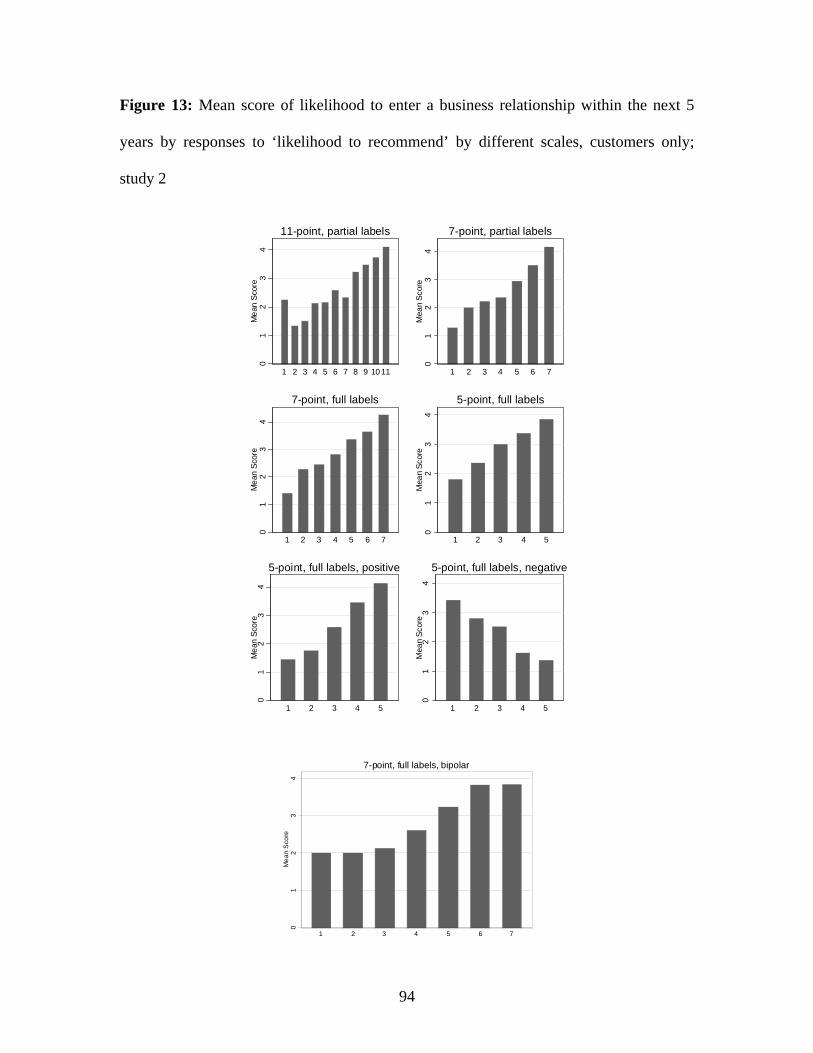
94
Figure 13: Mean score of likelihood to enter a business relationship within the next 5
years by responses to ‘likelihood to recommend’ by different scales, customers only;
study 2
01
23
4M
ean
Scor
e
1 2 3 4 5 6 7 8 9 10 11
11-point, partial labels
01
23
4M
ean
Scor
e
1 2 3 4 5 6 7
7-point, partial labels
01
23
4M
ean
Scor
e
1 2 3 4 5 6 7
7-point, full labels
01
23
4M
ean
Scor
e
1 2 3 4 5
5-point, full labels
01
23
4M
ean
Scor
e
1 2 3 4 5
5-point, full labels, positive
01
23
4M
ean
Scor
e
1 2 3 4 5
5-point, full labels, negative
01
23
4M
ean
Sco
re
1 2 3 4 5 6 7
7-point, full labels, bipolar