Embed Size (px)
Citation preview

Improving Battery Thermal Management Design using Six
Sigma Processby
Andreas Vlahinos, Kenneth Kelly,
John Rugh & Ahmad Pesaran
National Renewable Energy Lab
Golden, CO

Outline
• Project Objectives & Approach• Background Robust Design Techniques• Prismatic NiMH Battery Thermal
Analysis– Steady State Variation – Transient
• Summary and Future Plans
Objective and Approach
• The overall objective is apply variation analysis and Six Sigma design process to HEV battery thermal analysis– Better thermal performance– Longer battery life
• Approach: – Evaluate thermal management effectiveness of
cylindrical and prismatic batteries with air or liquid cooling for HEV or Fuel Cell vehicles using FreedomCAR 40 kW power profile
– Perform variation analysis and six sigma

Geometry and Load Cases
Two Battery Geometries:1. Prismatic 2. Cylindrical
Two Coolants1. Air Cooled2. Liquid Cooled
Two Ambient Load Cases:1. Buffalo, NY (-20°C amb) 2. Palm Springs (60°C amb)

Traditional Deterministic Design Approach
Accounts for uncertainties through the use of empiricalSafety factors:
– Are derived based on past experience– Do not guarantee safety or satisfactory performance– Do not provide sufficient information to achieve optimal use of
available resources
2 0 4 0 6 0 8 0 1 0 0 1 2 0 1 4 0 1 6 0 1 8 0 2 0 00
0 . 0 0 5
0 . 0 1
0 . 0 1 5
0 . 0 2
0 . 0 2 5
0 . 0 3
0 . 0 3 5
SupplyResistance Capacity
DemandLoad
Requirement

Six-sigma Design
– Identifying & qualifying causes of variation
– Centering performance on specification target
– Achieving Sigma level robustness on the key product performance characteristics with respect to the quantified variation

0.002
3.4
317311
45500
2700
63
0.57
308538
66807
6210
233
0
0
0
1
10
100
1,000
10,000
100,000
1,000,0000 1 2 3 4 5 6 7
Sigma Quality Level
Def
ects
(pa
rts
per m
illio
n)
Centered1.5 sigma shift

Robust Optimization
0.8 0 .85 0 .9 0 .95 1 1.05 1.1 1.1 5 1.20
2
4
6
8
1 0
1 2
1 4
Th ic kn e s s t (m m )
Pro
babi
lity
Den
sity
Th ic kn e s s Va ria tio n (No rm al) w ith µ t=1 .1 0 m m & σ t=0 .0 3 3 m m
0.8 0 .85 0 .9 0 .95 1 1.05 1.1 1.1 5 1.20
2
4
6
8
1 0
1 2
1 4
1 6
Th ic kn e s s t (m m )
Pro
babi
lity
Den
sity
Th ic kn e s s Va ria tio n (No rm a l) w ith µ t=0 .8 8 m m & σ t=0 .0 2 6 4 m m
0 10 20 30 40 50 60 700
0.005
0.01
0.015
0.02
0.025
0.03
0.035
0.04
0.045
0.05
Lo ad (N)
Rel
ativ
e Fr
eque
ncy
His to g ram o f Lo ad Variatio n (Lo g n o rmal)
-150 -100 -50 0 50 100 150 200
0.01
0.02
0.03
0.04
0.05
0.06
Rel
ativ
e Fr
eque
ncy
µt=2.00 mm
Histograms of Performance Function G for t=0.85, 1.0 and 2.0 mm
0.8 1 1.2 1.4 1.6 1.8 2-250
-200
-150
-100
-50
0
50
100
150
200
Me an Valu e o f Th ic kn e s s µ t (mm)
Mea
n V
alue
of G
- n σ
G (MP
a)
µG - 1 σG µG - 2 σG µG - 3 σG µG - 4 σG µG - 5 σG µG - 6 σG
0
Performance Function G MPa

Robust Optimizationreusable workflow template
Ford Motor CompanySAE – IEBEC 2001
0 10 20 30 40 50 60 700
0.005
0.01
0 .015
0.02
0 .025
0.03
0 .035
0.04
0 .045
0.05
Lo ad (N)
Rel
ativ
e F
requ
ency
His to g ram o f Lo ad Variatio n (Lo g no rmal)
0.8 0.85 0.9 0.9 5 1 1.05 1.1 1.15 1.20
2
4
6
8
10
12
14
Th ic kn e s s t (mm )
Pro
babi
lity
Den
sity
Th ic kn e s s Va riatio n (No rm al) w ith µ t=1 .10 mm & σ t=0 .03 3 mm
0.8 0.85 0.9 0.9 5 1 1.05 1.1 1.15 1.20
2
4
6
8
10
12
14
16
Th ic kn e s s t (mm )
Pro
babi
lity
Den
sity
Th ic kn e s s Va riatio n (No rm al) w ith µ t=0 .88 mm & σ t=0 .02 64 mm

Robust Optimizationreusable workflow template
Ford Motor CompanySAE – IEBEC 2002
0 10 20 30 40 50 60 700
0.005
0.01
0 .015
0.02
0 .025
0.03
0 .035
0.04
0 .045
0.05
Lo ad (N)
Rel
ativ
e F
requ
ency
His to g ram o f Lo ad Variatio n (Lo g no rmal)
0.8 0.85 0.9 0.9 5 1 1.05 1.1 1.15 1.20
2
4
6
8
10
12
14
Th ic kn e s s t (mm )
Pro
babi
lity
Den
sity
Th ic kn e s s Va riatio n (No rm al) w ith µ t=1 .10 mm & σ t=0 .03 3 mm
0.8 0.85 0.9 0.9 5 1 1.05 1.1 1.15 1.20
2
4
6
8
10
12
14
16
Th ic kn e s s t (mm )
Pro
babi
lity
Den
sity
Th ic kn e s s Va riatio n (No rm al) w ith µ t=0 .88 mm & σ t=0 .02 64 mm

Robust Optimizationreusable workflow template
Daimler ChryslerSAE Powertrain Conference
0 10 20 30 40 50 60 700
0.005
0.01
0 .015
0.02
0 .025
0.03
0 .035
0.04
0 .045
0.05
Lo ad (N)
Rel
ativ
e F
requ
ency
His to g ram o f Lo ad Variatio n (Lo g no rmal)
0.8 0.85 0.9 0.9 5 1 1.05 1.1 1.15 1.20
2
4
6
8
10
12
14
Th ic kn e s s t (mm )
Pro
babi
lity
Den
sity
Th ic kn e s s Va riatio n (No rm al) w ith µ t=1 .10 mm & σ t=0 .03 3 mm
0.8 0.85 0.9 0.9 5 1 1.05 1.1 1.15 1.20
2
4
6
8
10
12
14
16
Th ic kn e s s t (mm )
Pro
babi
lity
Den
sity
Th ic kn e s s Va riatio n (No rm al) w ith µ t=0 .88 mm & σ t=0 .02 64 mm

Robust Optimizationreusable workflow template
0 10 20 30 40 50 60 700
0.005
0.01
0 .015
0.02
0 .025
0.03
0 .035
0.04
0 .045
0.05
Lo ad (N)
Rel
ativ
e F
requ
ency
His to g ram o f Lo ad Variatio n (Lo g no rmal)
0.8 0.85 0.9 0.9 5 1 1.05 1.1 1.15 1.20
2
4
6
8
10
12
14
Th ic kn e s s t (mm )
Pro
babi
lity
Den
sity
Th ic kn e s s Va riatio n (No rm al) w ith µ t=1 .10 mm & σ t=0 .03 3 mm
0.8 0.85 0.9 0.9 5 1 1.05 1.1 1.15 1.20
2
4
6
8
10
12
14
16
Th ic kn e s s t (mm )
Pro
babi
lity
Den
sity
Th ic kn e s s Va riatio n (No rm al) w ith µ t=0 .88 mm & σ t=0 .02 64 mm
Plug PowerASME / RIT Fuel Cell Conference

Robust Optimizationreusable workflow template
USABC / FordAmerican Society of Quality
0 10 20 30 40 50 60 700
0.005
0.01
0 .015
0.02
0 .025
0.03
0 .035
0.04
0 .045
0.05
Lo ad (N)
Rel
ativ
e F
requ
ency
His to g ram o f Lo ad Variatio n (Lo g no rmal)
0.8 0.85 0.9 0.9 5 1 1.05 1.1 1.15 1.20
2
4
6
8
10
12
14
Th ic kn e s s t (mm )
Pro
babi
lity
Den
sity
Th ic kn e s s Va riatio n (No rm al) w ith µ t=1 .10 mm & σ t=0 .03 3 mm
0.8 0.85 0.9 0.9 5 1 1.05 1.1 1.15 1.20
2
4
6
8
10
12
14
16
Th ic kn e s s t (mm )
Pro
babi
lity
Den
sity
Th ic kn e s s Va riatio n (No rm al) w ith µ t=0 .88 mm & σ t=0 .02 64 mm
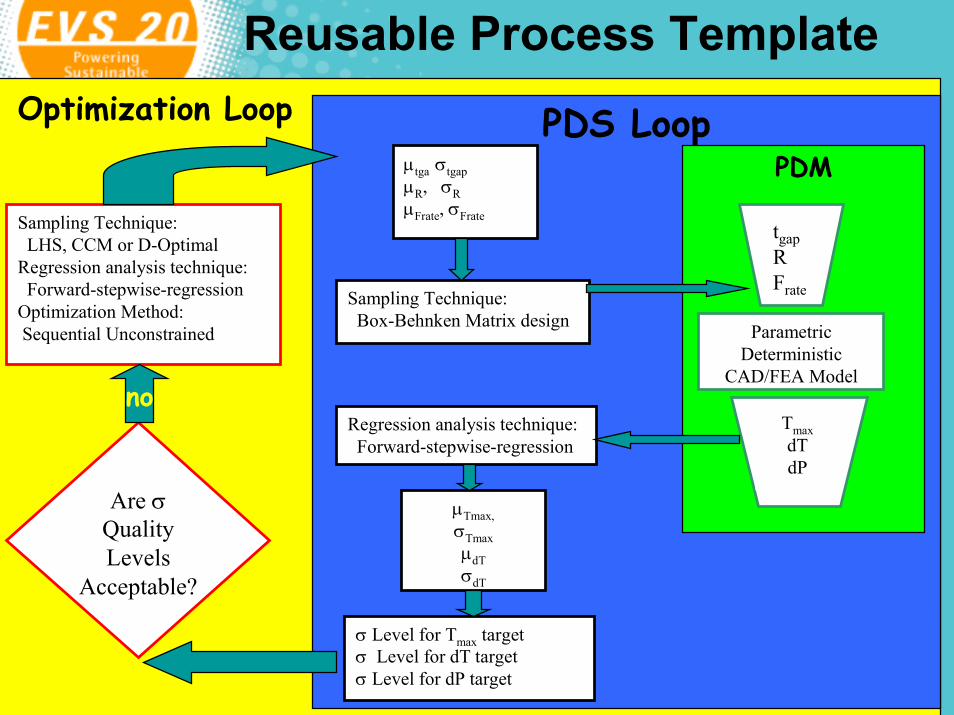
Reusable Process TemplateOptimization Loop PDS Loop
PDMµtga σtgapµR, σRµFrate, σFrate
Sampling Technique:Box-Behnken Matrix design
Regression analysis technique:Forward-stepwise-regression
µTmax, σTmaxµdTσdT
tgapRFrate
Parametric Deterministic
CAD/FEA Model
TmaxdTdP
σ Level for Tmax targetσ Level for dT targetσ Level for dP target
Sampling Technique:LHS, CCM or D-Optimal
Regression analysis technique:Forward-stepwise-regression
Optimization Method:Sequential Unconstrained
Are σQuality Levels
Acceptable?
no

Steady State Thermal Analysis with Input
Parameter Variations
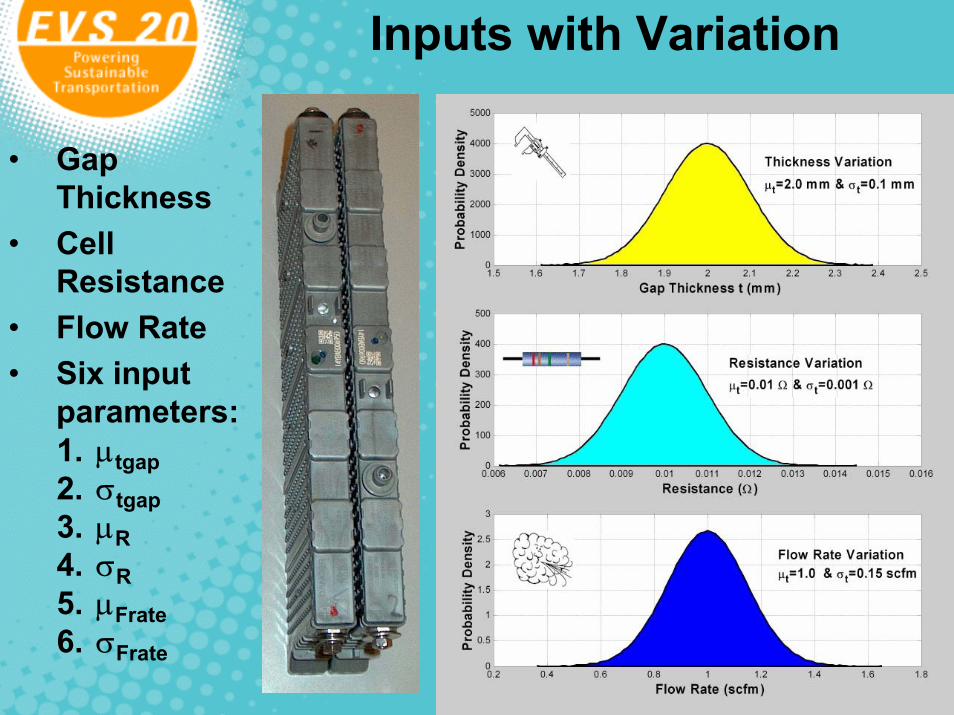
Inputs with Variation
• Gap Thickness
• Cell Resistance
• Flow Rate• Six input
parameters:1. µtgap2. σtgap3. µR4. σR5. µFrate6. σFrate

Model Outputsmax temperaturedifferential temperaturepressure drop
Six output parameters:1. µTmax
2. µdT
3. µdP
4. σTmax
5. σdT
6. σdPThree Upper SpecificationLimits (USL)

Temperature Differential and Sigma Quality Levels
Sigma Quality Level

Design Space with σ Quality Regions Tmax

Design Space with σ-Quality Regions dT

Design Space with σ-Quality Regions dP

Design Space with σ Quality Regions All Parameters

Sigma Quality Levels Versus Mean Value
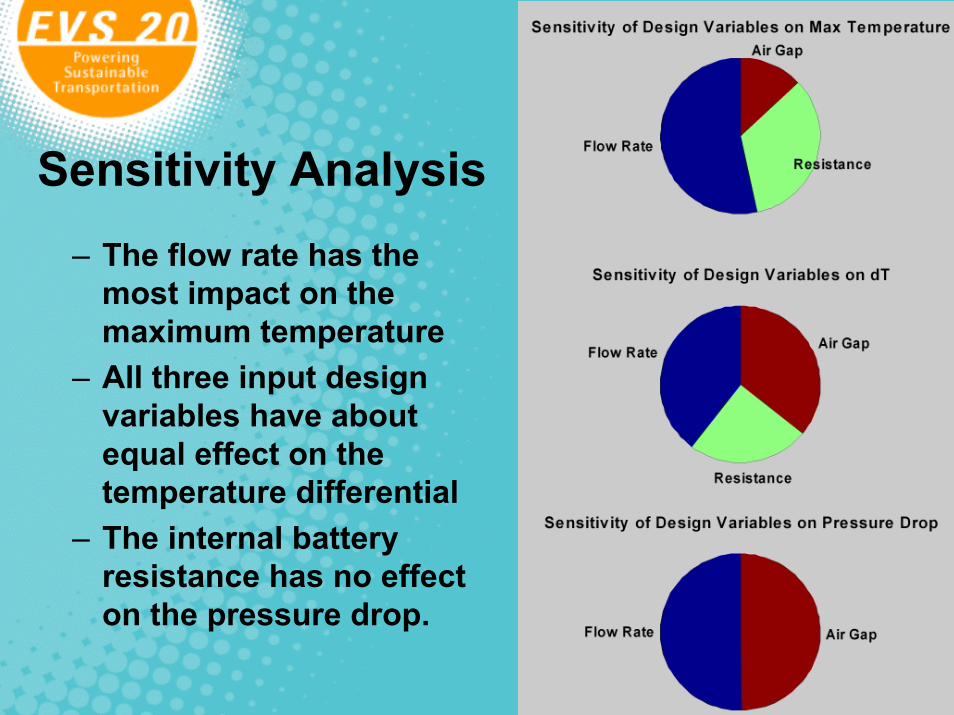
Sensitivity Analysis– The flow rate has the
most impact on the maximum temperature
– All three input design variables have about equal effect on the temperature differential
– The internal battery resistance has no effect on the pressure drop.

Transient Thermal Response of
Prismatic Batteries

FreedomCAR 40-kW Baseline Power Assist & Heat Generation Profiles

Inlet Temperatures for Air and Liquid Cooling

Inlet, Outlet and Core Temperature for Palm Springs with High Air Flow Rate
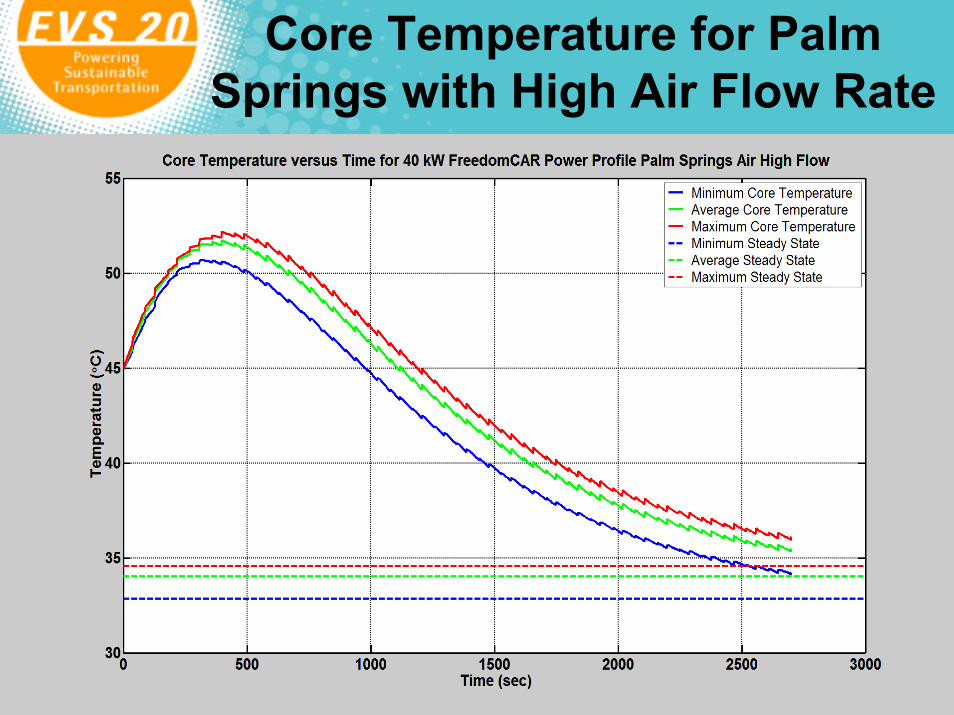
Core Temperature for Palm Springs with High Air Flow Rate

Core Differential Temperature for Palm Springs with High Air Flow Rate

Average Core Temperature(Palm Springs)

Distribution of Max Core Temperature

Average Core Temperature(Buffalo)

Summary• Demonstrated a re-usable process for including
statistical variation of input parameters for battery thermal analysis
• Initial analysis with variation shows:– Tmax is most difficult criterion to achieve with the
given design constraints and assumptions– Effect of conflicting design constraints on sigma
quality level• Completed first round of transient thermal analyses on
prismatic design• Initial transient results show
– the importance of including transient analysis– liquid cooling is more effective, but pressure drop
higher– transient cooling and warm up time of the heat
transfer fluid needs to be considered.
Future plans
1. Introduce feedback control on the fan1. Fan on–off, speed levels, etc2. Evaluate the effectives of various control systems on
thermal performance.2. Find the effect of power pulses in the load cycle on
thermal transient .3. Obtain a non-uniform heat generation profile from
published information or other test data (thermal imaging).
4. Modify duty-cycle to include appropriate diurnal ambient and load conditions
5. Perform transient thermal analysis on cylindrical battery pack

Acknowledgments
This research effort was funded by the Department of Energy (DOE), Office of the FreedomCAR and Vehicle Technology.
The authors would like to express their appreciation to:– Robert Kost, team leader of the FreedomCAR and
Vehicle Technology office– Tien Duong, Technology Manger of
Electrochemical Energy Storage program and – Ted J. Miller of Ford Motor Company and
FreedomCAR Battery Tech Team Chairman– Bruce Bryant, of Ford Motor Company