Embed Size (px)
Citation preview
2020-11-181
Technical webinar
Improvements in flood forecasting
Dominic Roussel (MELCC) and William Saunders (NOAA)
2020-11-182
Webinar content
• Current flood forecasting services• How a flood forecast is produced• Technological improvements driven by the LCRR study• Integration of multiple forecasts• Towards flood mapping services
2020-11-18
3
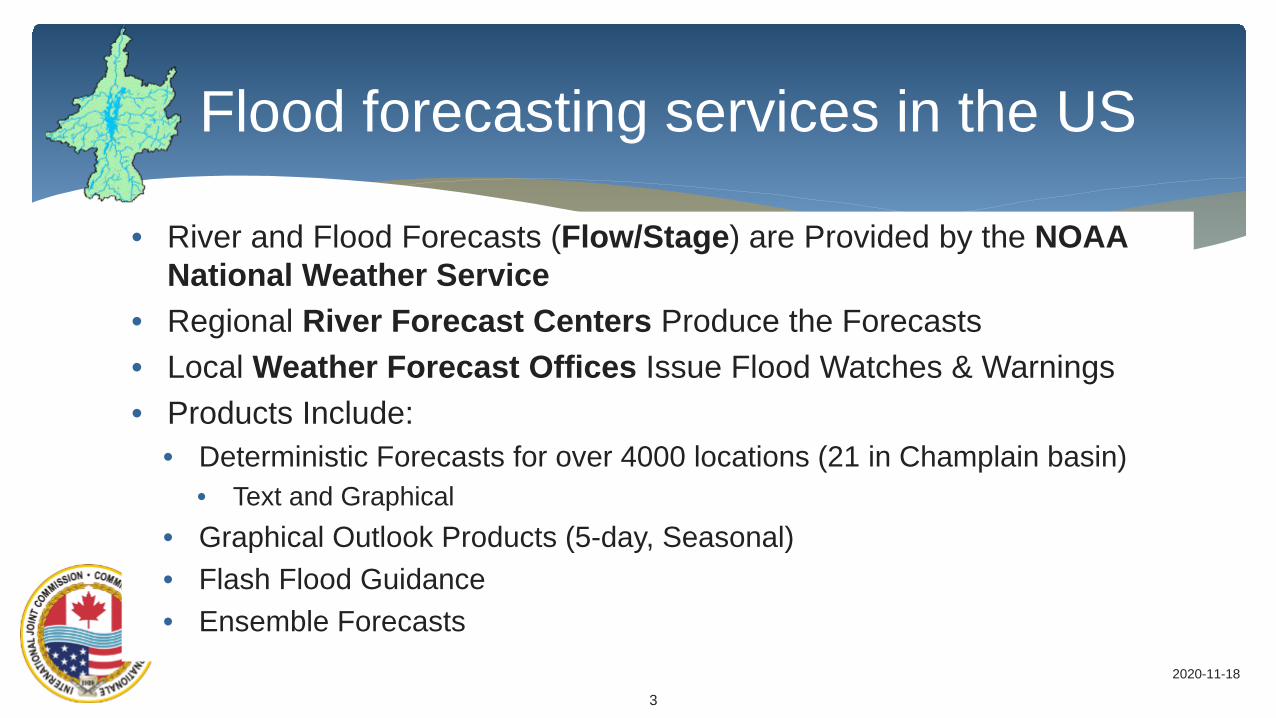
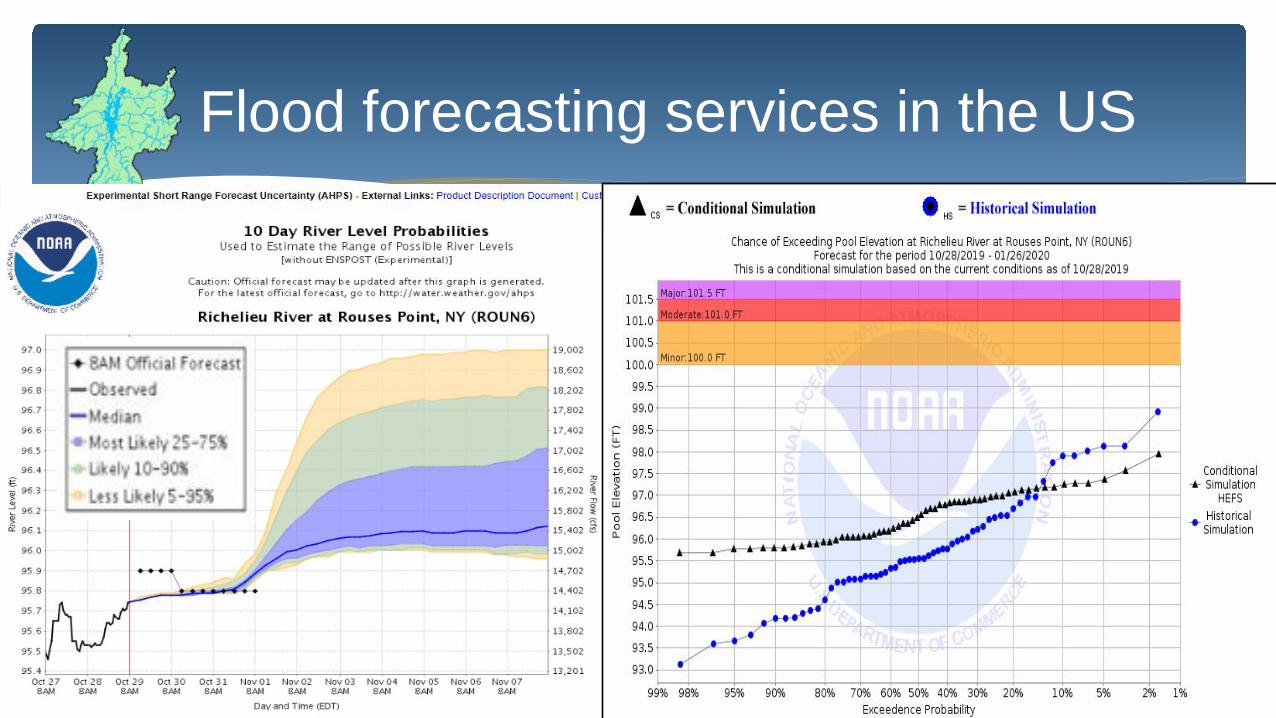
Flood forecasting services in the US
• River and Flood Forecasts (Flow/Stage) are Provided by the NOAA National Weather Service
• Regional River Forecast Centers Produce the Forecasts• Local Weather Forecast Offices Issue Flood Watches & Warnings• Products Include:
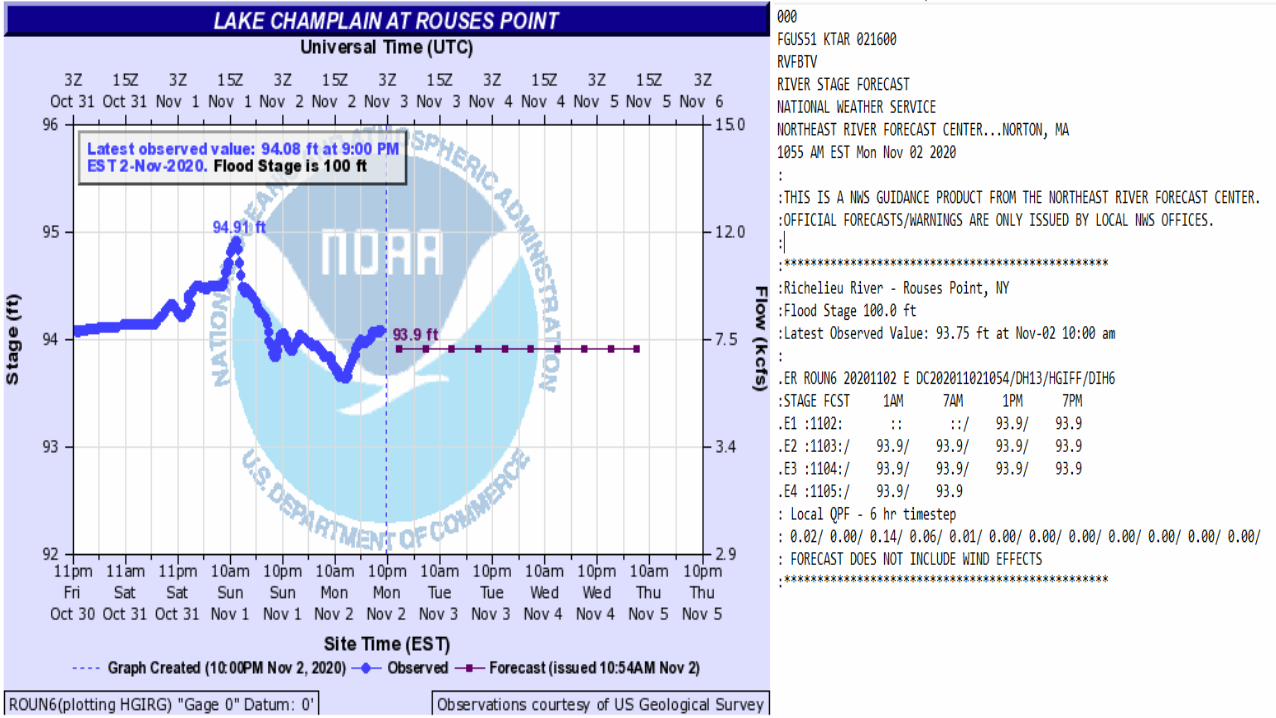
• Deterministic Forecasts for over 4000 locations (21 in Champlain basin)• Text and Graphical
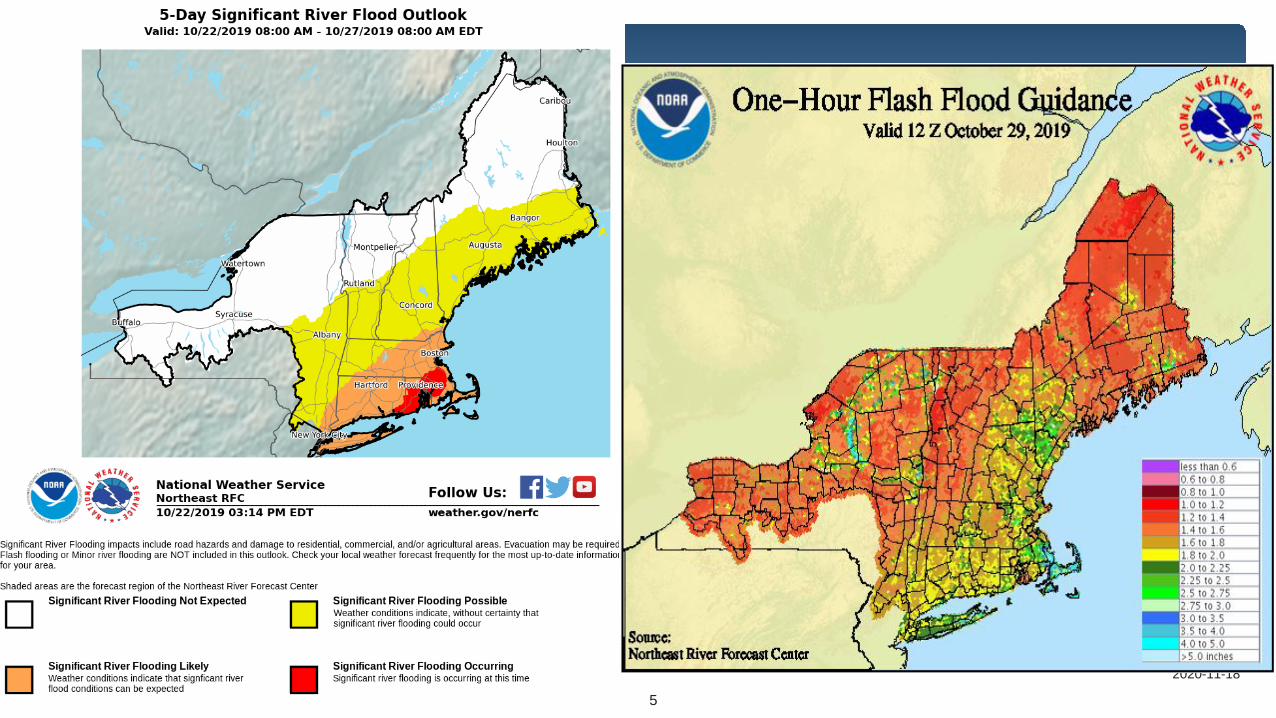
• Graphical Outlook Products (5-day, Seasonal)• Flash Flood Guidance• Ensemble Forecasts
2020-11-18
4
Flood forecasting services in the US
2020-11-18
5
Flood forecasting services in the US
2020-11-18
6
Flood forecasting services in the US
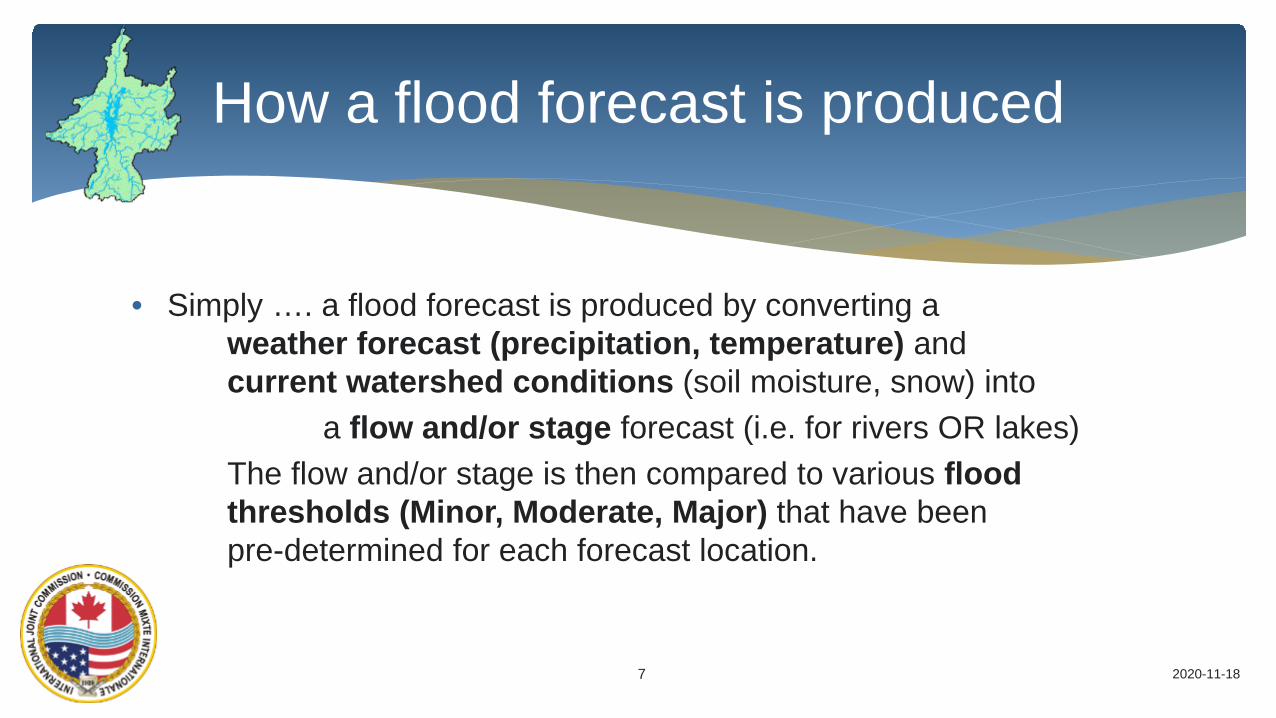
• Simply …. a flood forecast is produced by converting a weather forecast (precipitation, temperature) and current watershed conditions (soil moisture, snow) into
a flow and/or stage forecast (i.e. for rivers OR lakes)The flow and/or stage is then compared to various flood thresholds (Minor, Moderate, Major) that have been pre-determined for each forecast location.
How a flood forecast is produced
2020-11-187
How a flood forecast is produced
2020-11-188
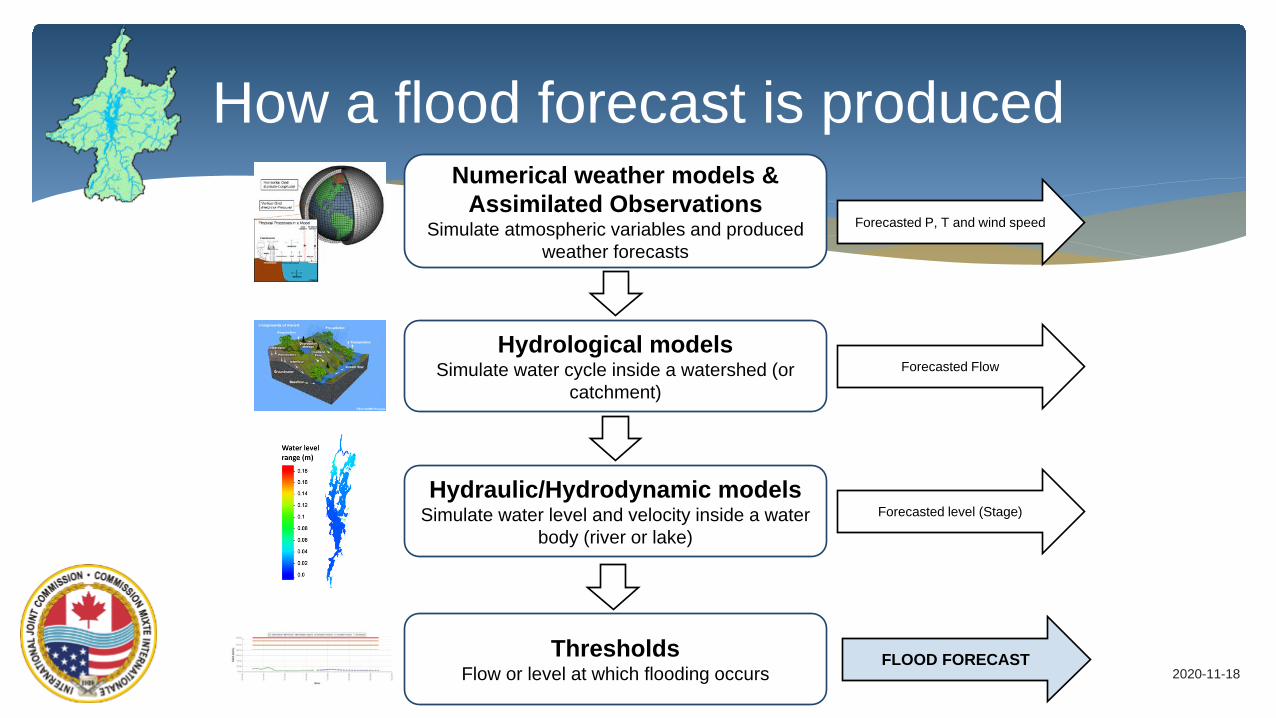
Numerical weather models & Assimilated Observations
Simulate atmospheric variables and producedweather forecasts
Hydrological modelsSimulate water cycle inside a watershed (or
catchment)
Hydraulic/Hydrodynamic modelsSimulate water level and velocity inside a water
body (river or lake)
ThresholdsFlow or level at which flooding occurs
Forecasted P, T and wind speed
Forecasted Flow
Forecasted level (Stage)
FLOOD FORECAST
2020-11-18
9
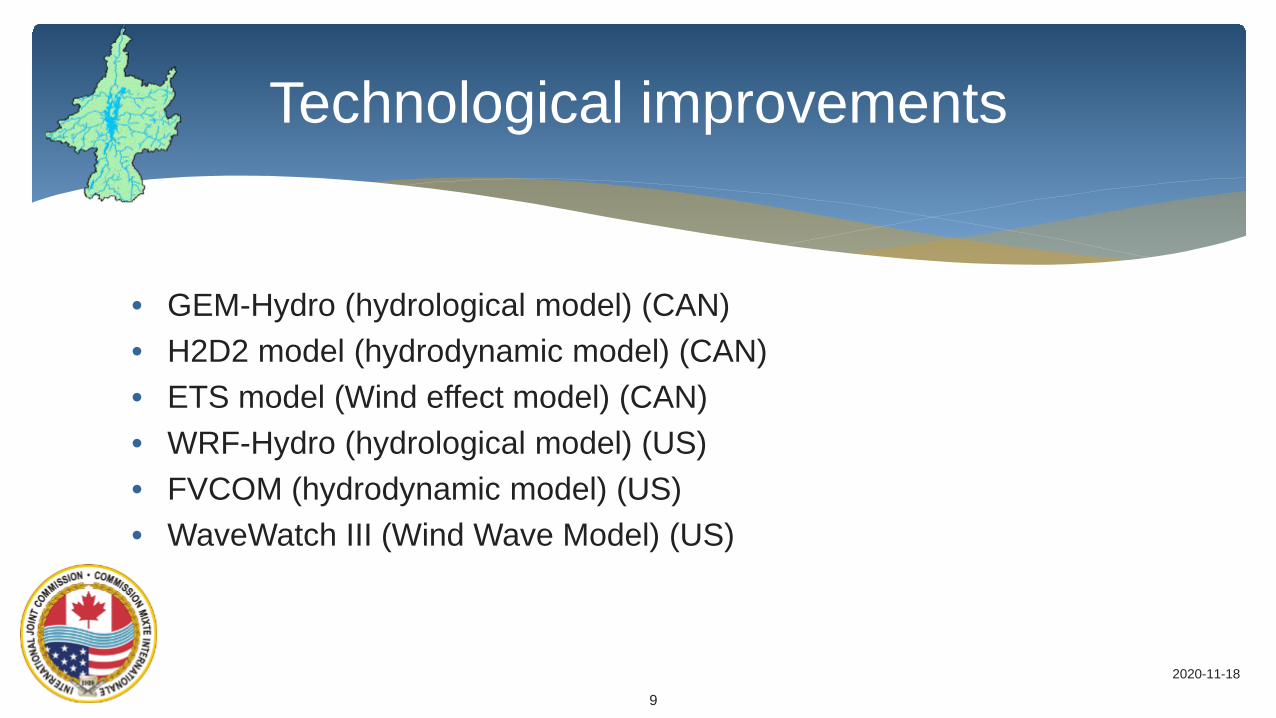
Technological improvements
• GEM-Hydro (hydrological model) (CAN)• H2D2 model (hydrodynamic model) (CAN)• ETS model (Wind effect model) (CAN)• WRF-Hydro (hydrological model) (US)• FVCOM (hydrodynamic model) (US)• WaveWatch III (Wind Wave Model) (US)
2020-11-18
10
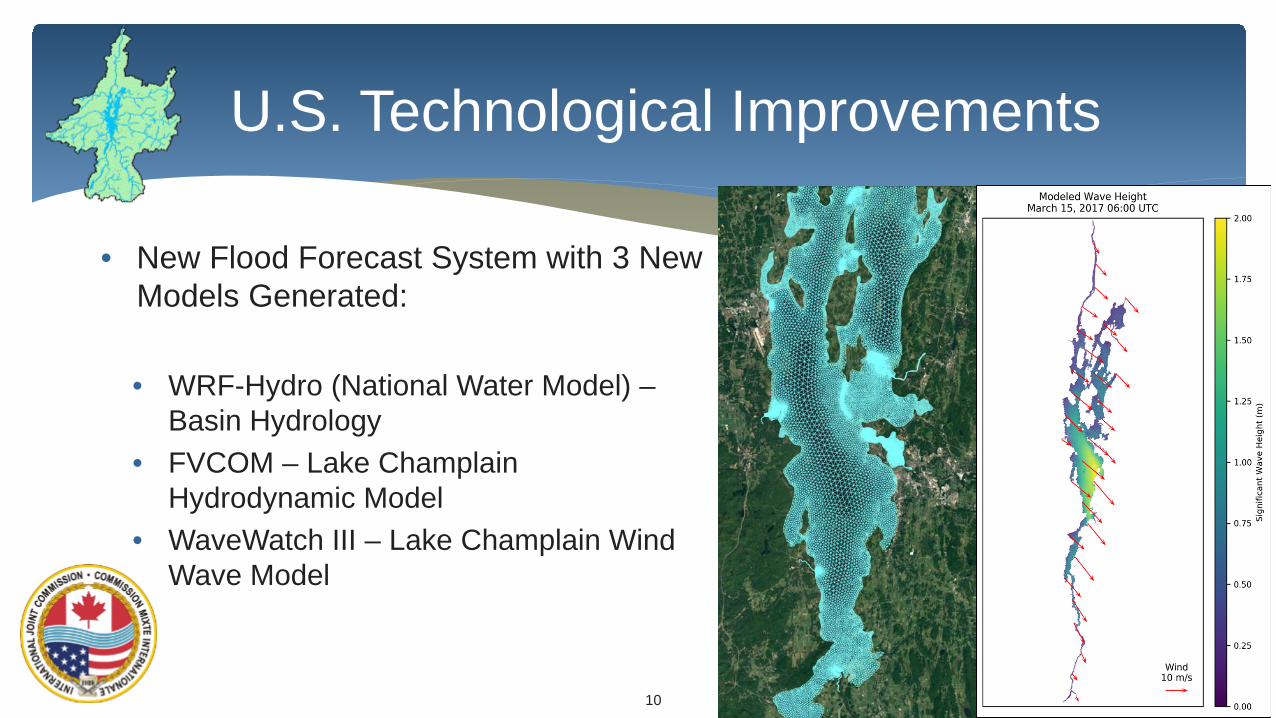
U.S. Technological Improvements
• New Flood Forecast System with 3 New Models Generated:
• WRF-Hydro (National Water Model) –Basin Hydrology
• FVCOM – Lake Champlain Hydrodynamic Model
• WaveWatch III – Lake Champlain Wind Wave Model
2020-11-18
11
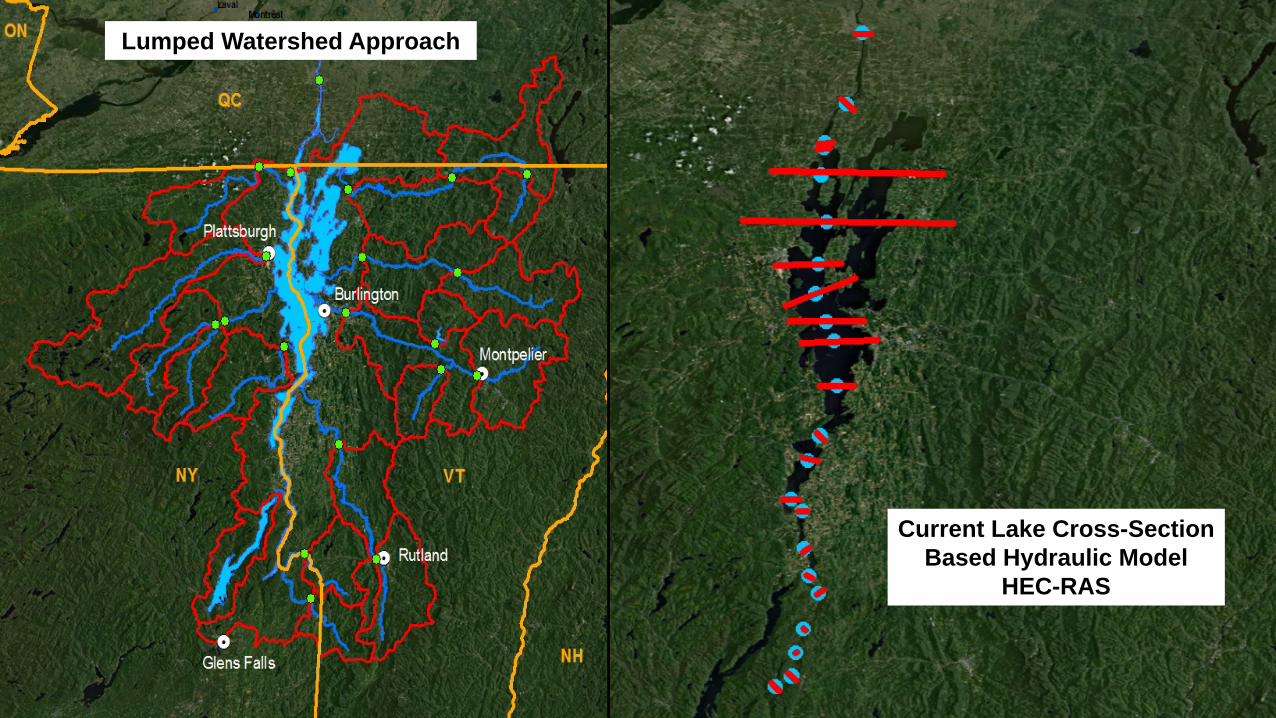
Technological improvementsLumped Watershed Approach
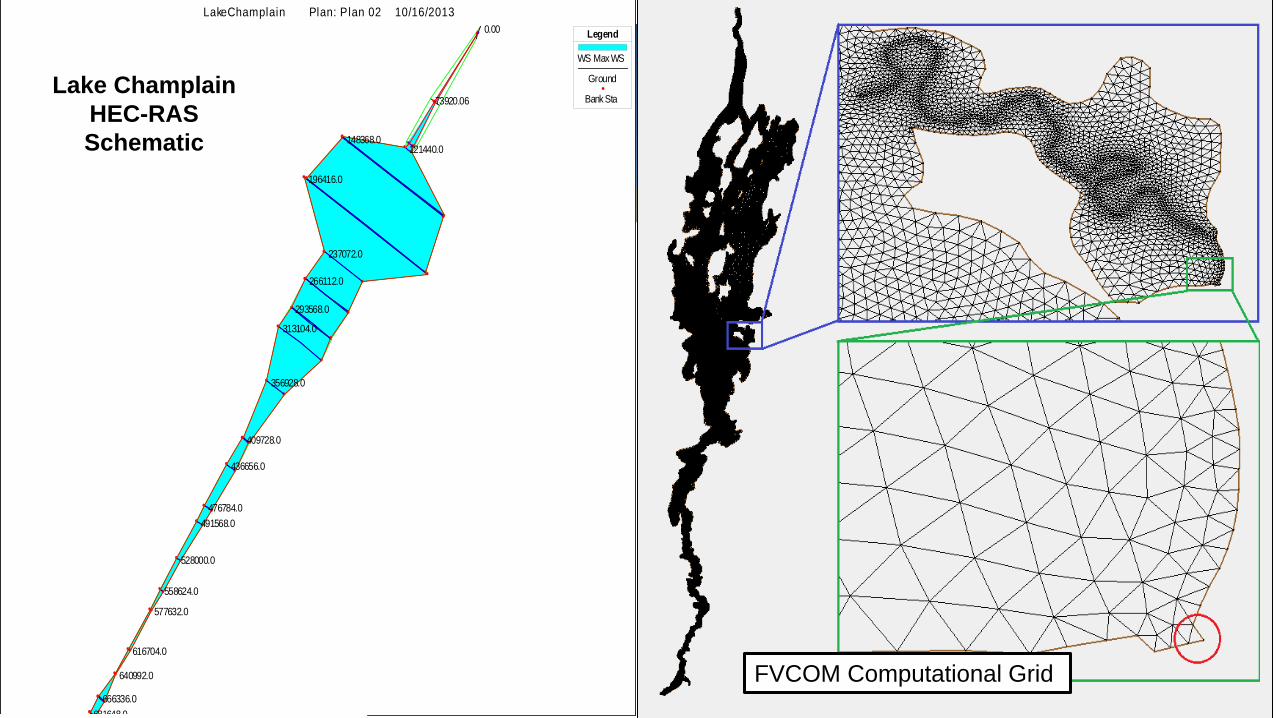
Current Lake Cross-Section Based Hydraulic Model
HEC-RAS
2020-11-18
12
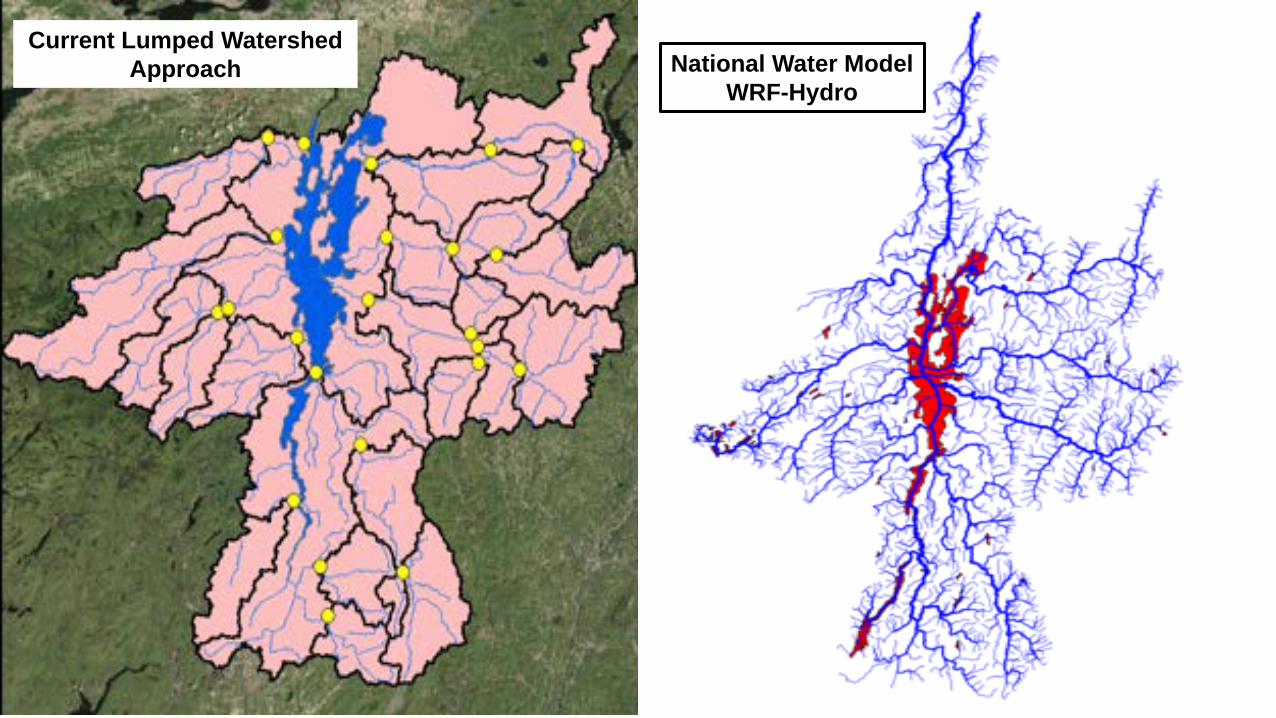
Hydrologic ModelCurrent Lumped Watershed
Approach National Water Model WRF-Hydro
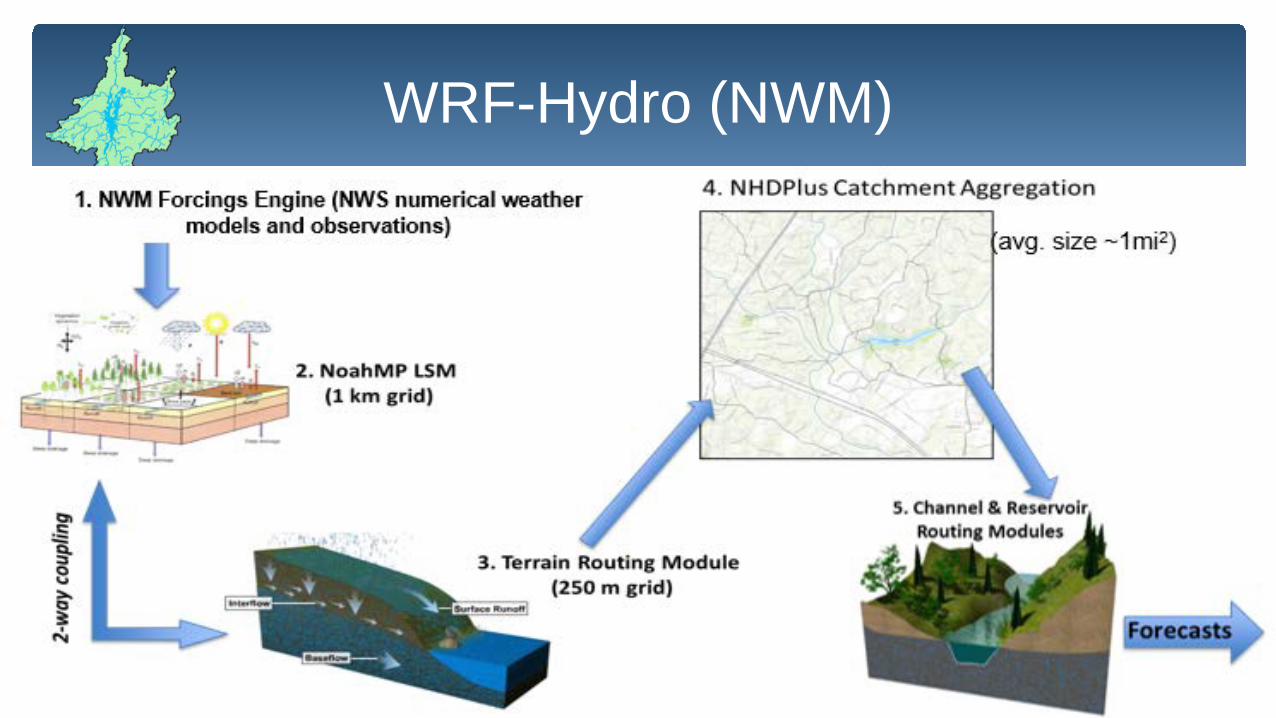
WRF-Hydro (NWM)
2020-11-1813
2020-11-18
14
Technological improvements
681648.0666336.0
640992.0
616704.0
577632.0
558624.0
528000.0
491568.0476784.0
436656.0
409728.0
356928.0
313104.0
293568.0
266112.0
237072.0
196416.0
148368.0121440.0
73920.06
0.00 LakeChamplain Plan: Plan 02 10/16/2013
Legend
WS Max WS
Ground
Bank StaLake Champlain
HEC-RAS Schematic
FVCOM Computational Grid
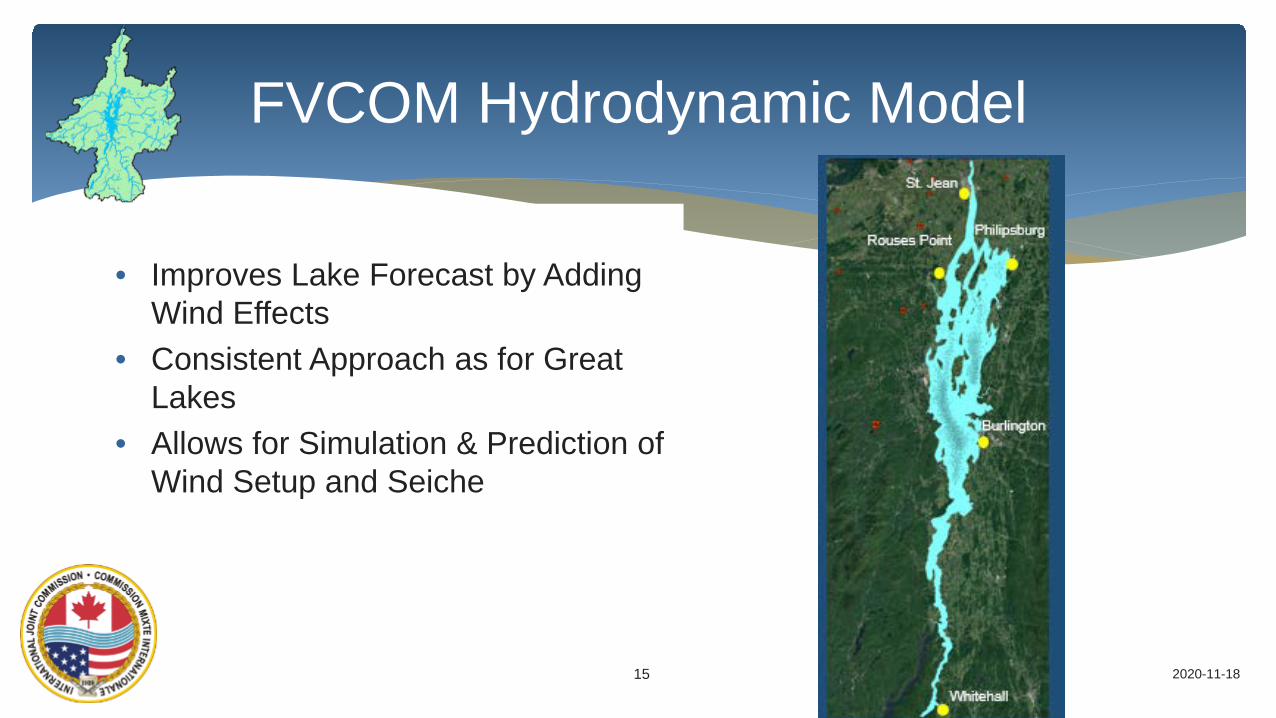
• Improves Lake Forecast by Adding Wind Effects
• Consistent Approach as for Great Lakes
• Allows for Simulation & Prediction of Wind Setup and Seiche
FVCOM Hydrodynamic Model
2020-11-1815
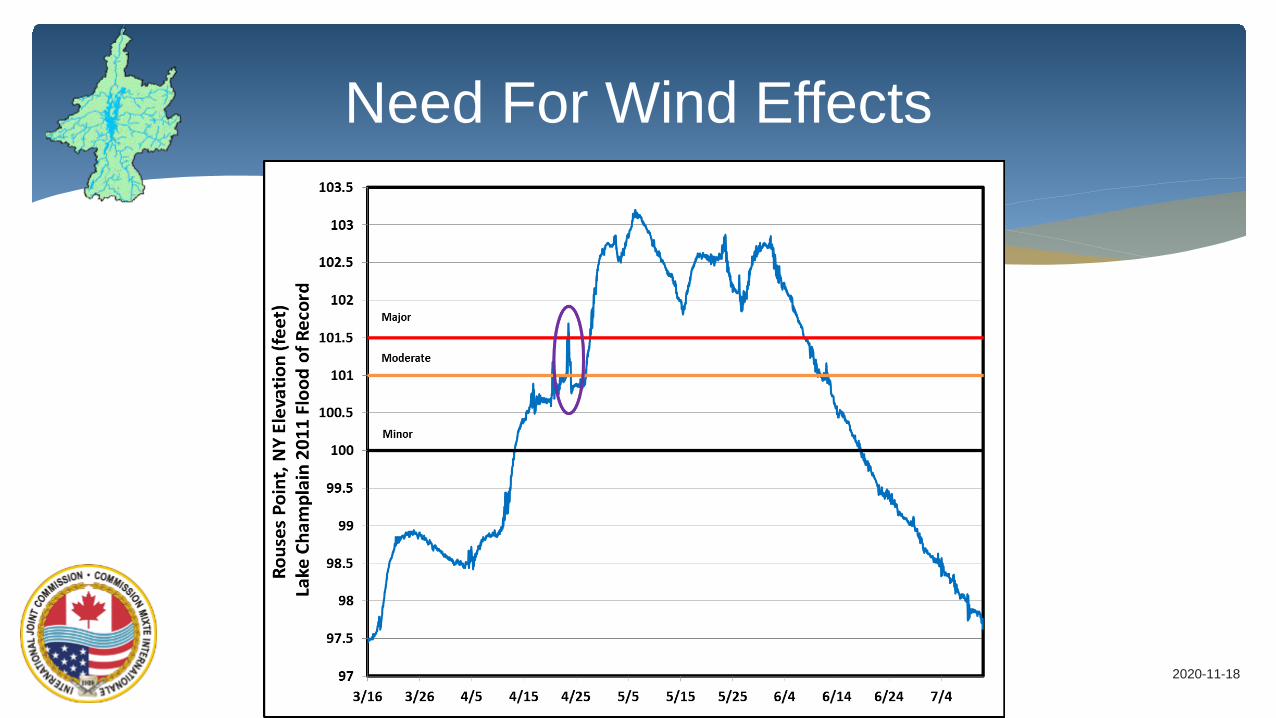
Need For Wind Effects
2020-11-1816
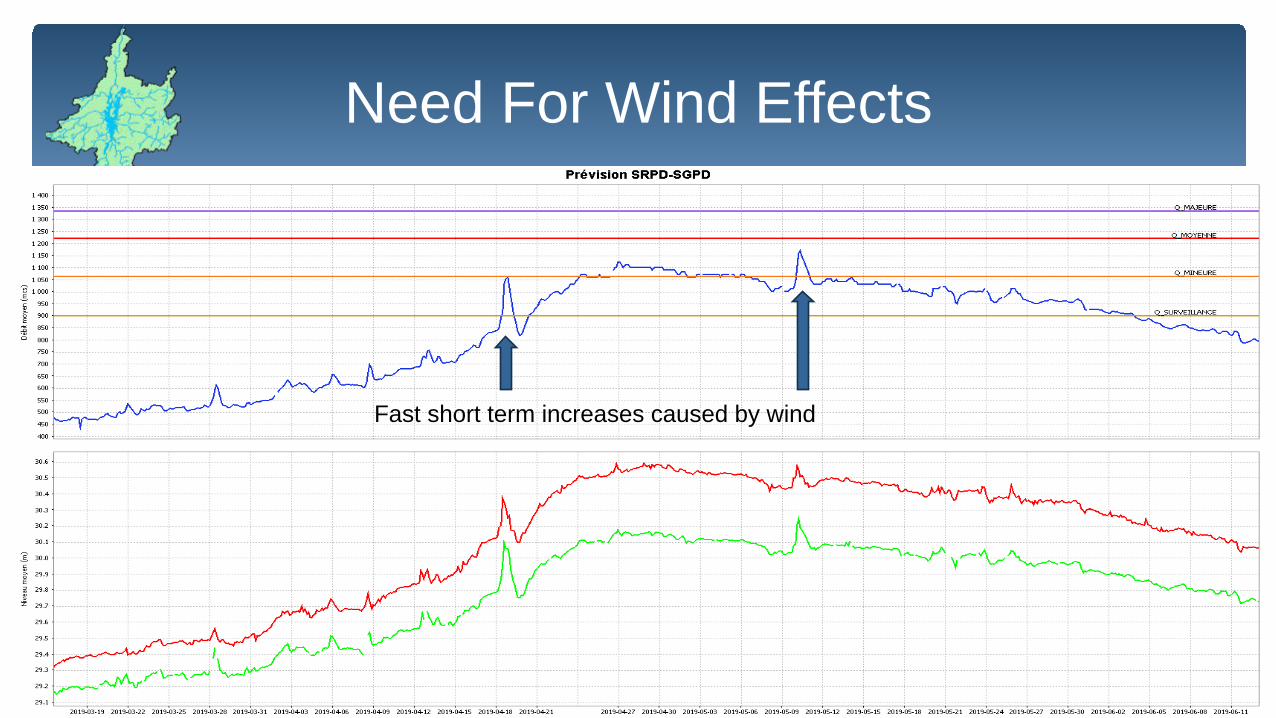
Need For Wind Effects
2020-11-1817
Fast short term increases caused by wind
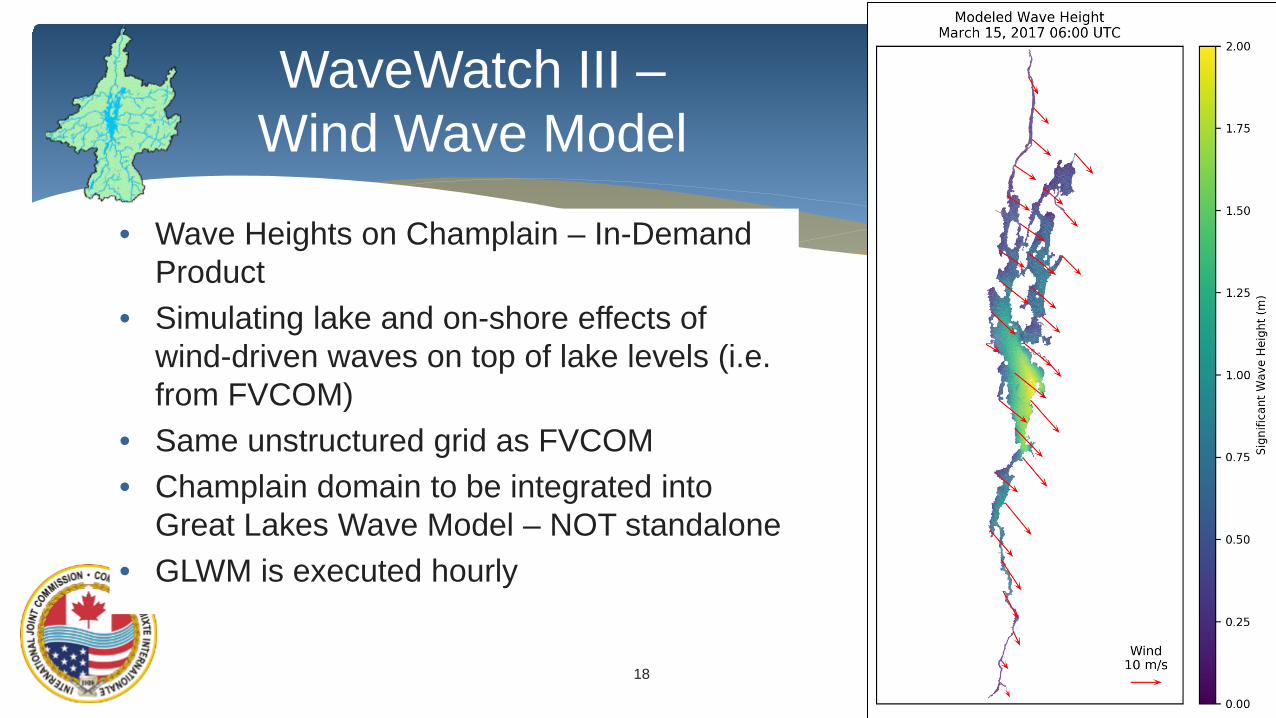
• Wave Heights on Champlain – In-Demand Product
• Simulating lake and on-shore effects of wind-driven waves on top of lake levels (i.e. from FVCOM)
• Same unstructured grid as FVCOM• Champlain domain to be integrated into
Great Lakes Wave Model – NOT standalone• GLWM is executed hourly
WaveWatch III –Wind Wave Model
2020-11-1818
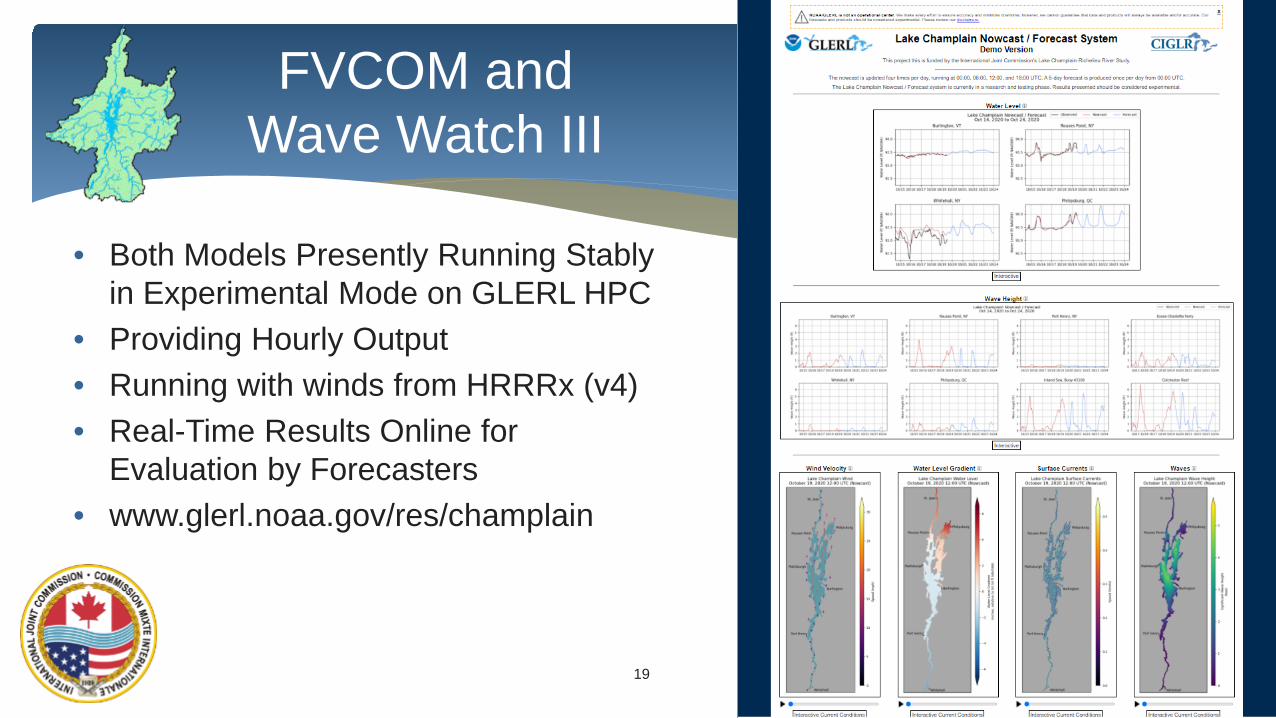
• Both Models Presently Running Stably in Experimental Mode on GLERL HPC
• Providing Hourly Output• Running with winds from HRRRx (v4)• Real-Time Results Online for
Evaluation by Forecasters• www.glerl.noaa.gov/res/champlain
FVCOM and Wave Watch III
2020-11-1819
2020-11-18
20
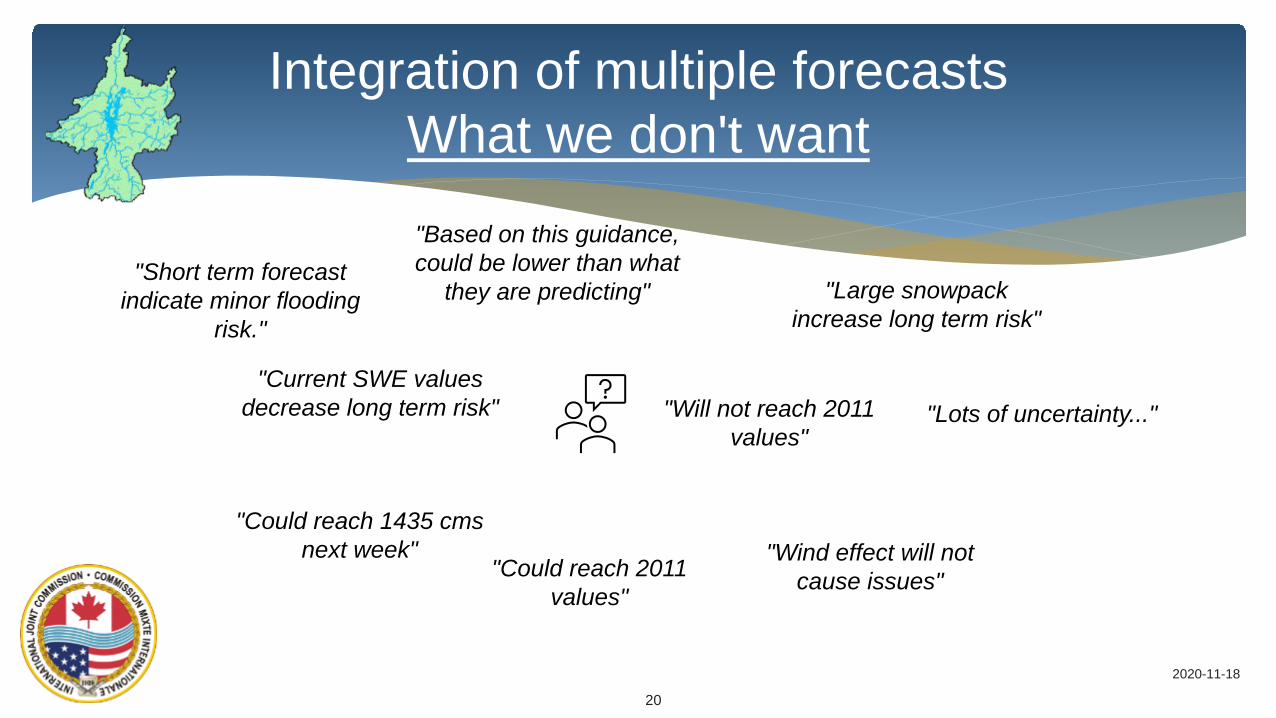
Integration of multiple forecastsWhat we don't want
"Short term forecastindicate minor flooding
risk.""Large snowpack
increase long term risk"
"Could reach 1435 cmsnext week" "Wind effect will not
cause issues"
"Based on this guidance, could be lower than what
they are predicting"
"Could reach 2011 values"
"Will not reach 2011 values"
"Current SWE values decrease long term risk" "Lots of uncertainty..."
2020-11-18
21
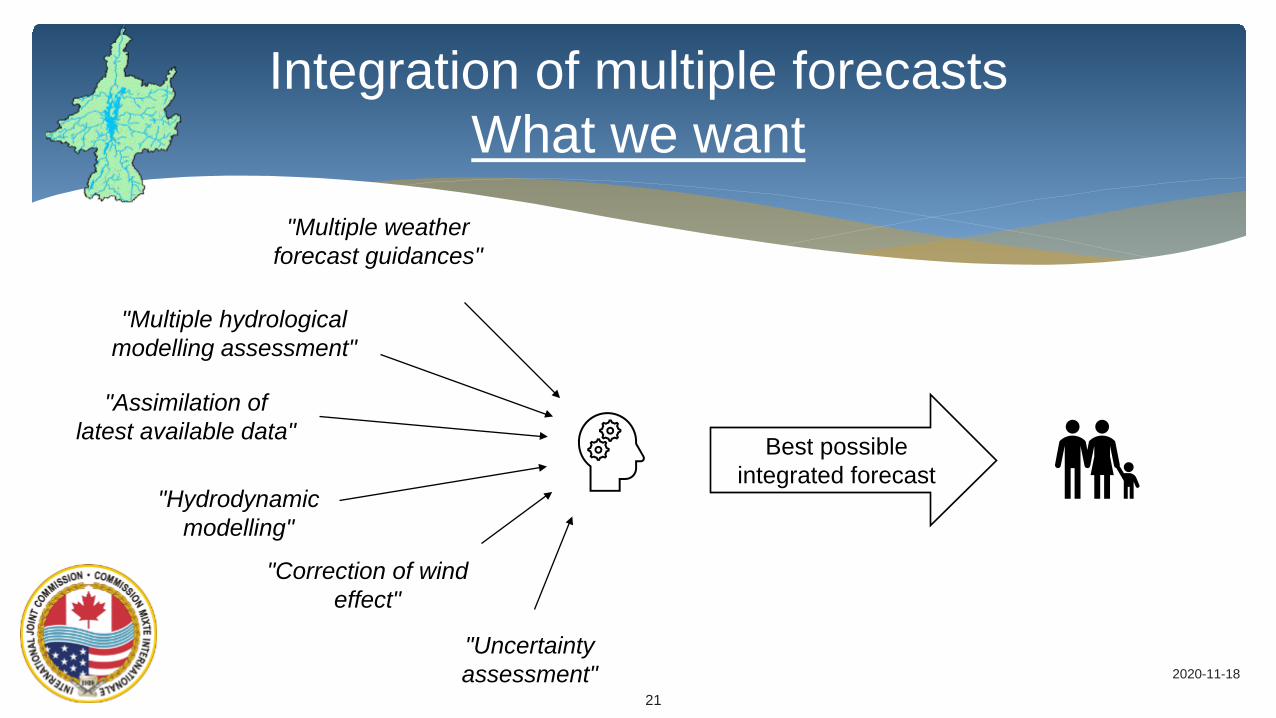
Integration of multiple forecastsWhat we want
"Multiple weatherforecast guidances"
"Multiple hydrologicalmodelling assessment"
"Hydrodynamicmodelling"
"Correction of windeffect"
"Assimilation of latest available data"
"Uncertaintyassessment"
Best possible integrated forecast
2020-11-18
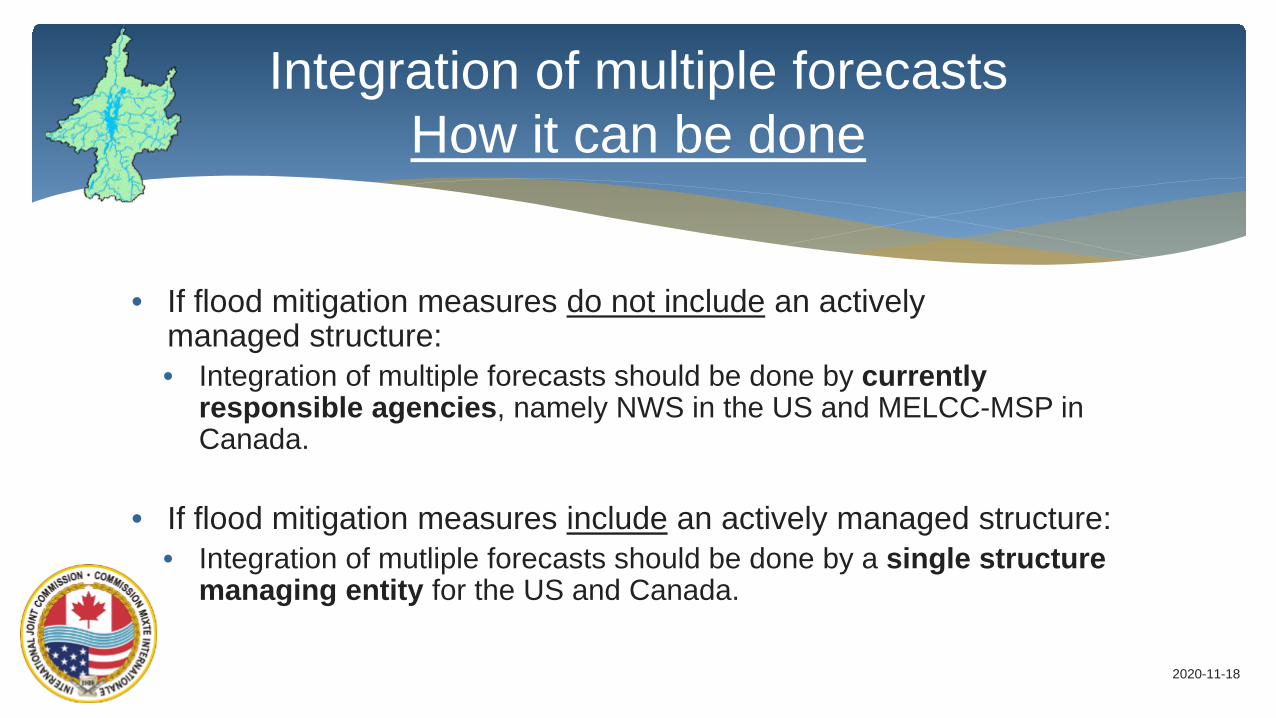
Integration of multiple forecastsHow it can be done
• If flood mitigation measures do not include an activelymanaged structure:• Integration of multiple forecasts should be done by currently
responsible agencies, namely NWS in the US and MELCC-MSP in Canada.
• If flood mitigation measures include an actively managed structure:• Integration of mutliple forecasts should be done by a single structure
managing entity for the US and Canada.
2020-11-18
23
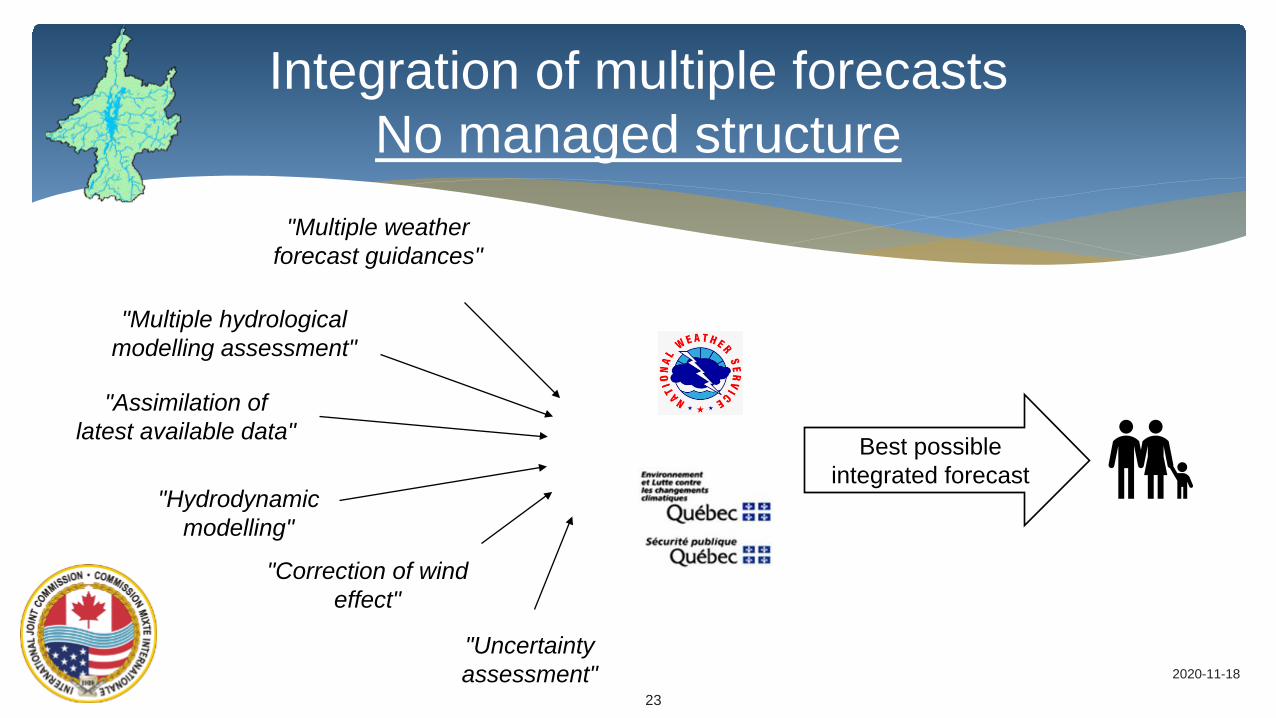
Integration of multiple forecastsNo managed structure
"Multiple weatherforecast guidances"
"Multiple hydrologicalmodelling assessment"
"Hydrodynamicmodelling"
"Correction of windeffect"
"Assimilation of latest available data"
"Uncertaintyassessment"
Best possible integrated forecast
2020-11-18
24
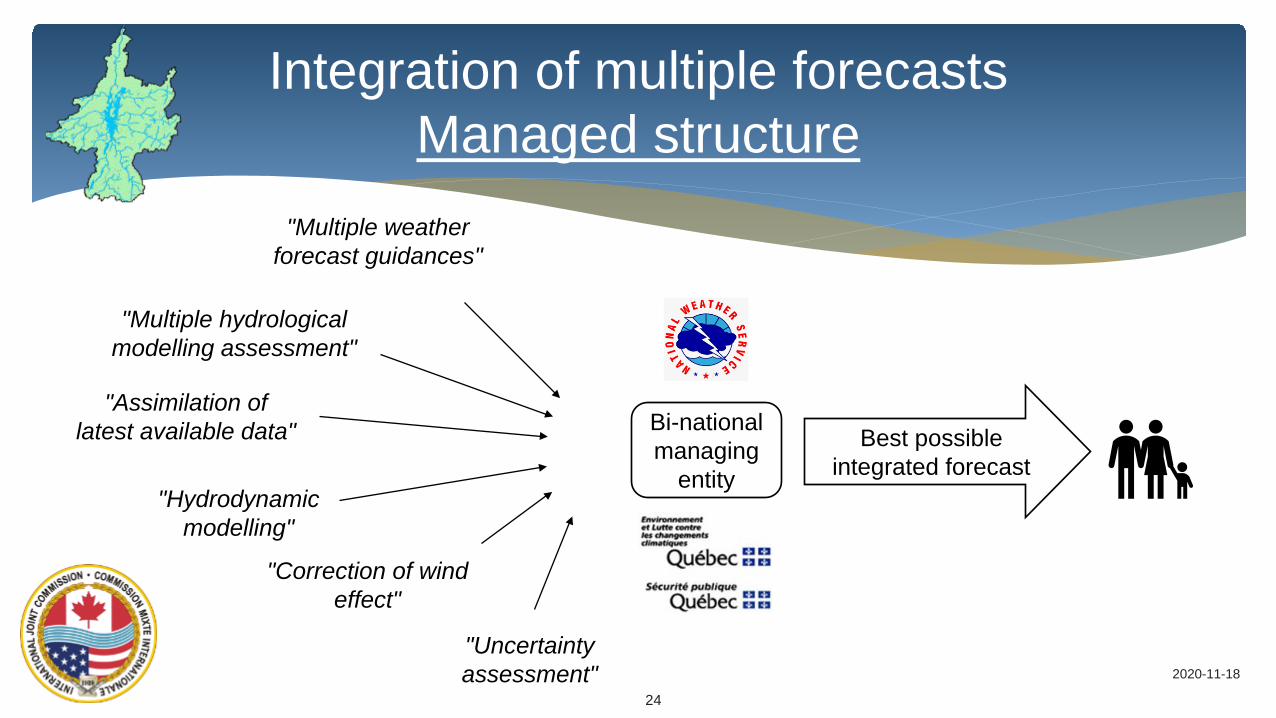
Integration of multiple forecastsManaged structure
"Multiple weatherforecast guidances"
"Multiple hydrologicalmodelling assessment"
"Hydrodynamicmodelling"
"Correction of windeffect"
"Assimilation of latest available data"
"Uncertaintyassessment"
Best possible integrated forecast
Bi-national managing
entity
2020-11-18
25
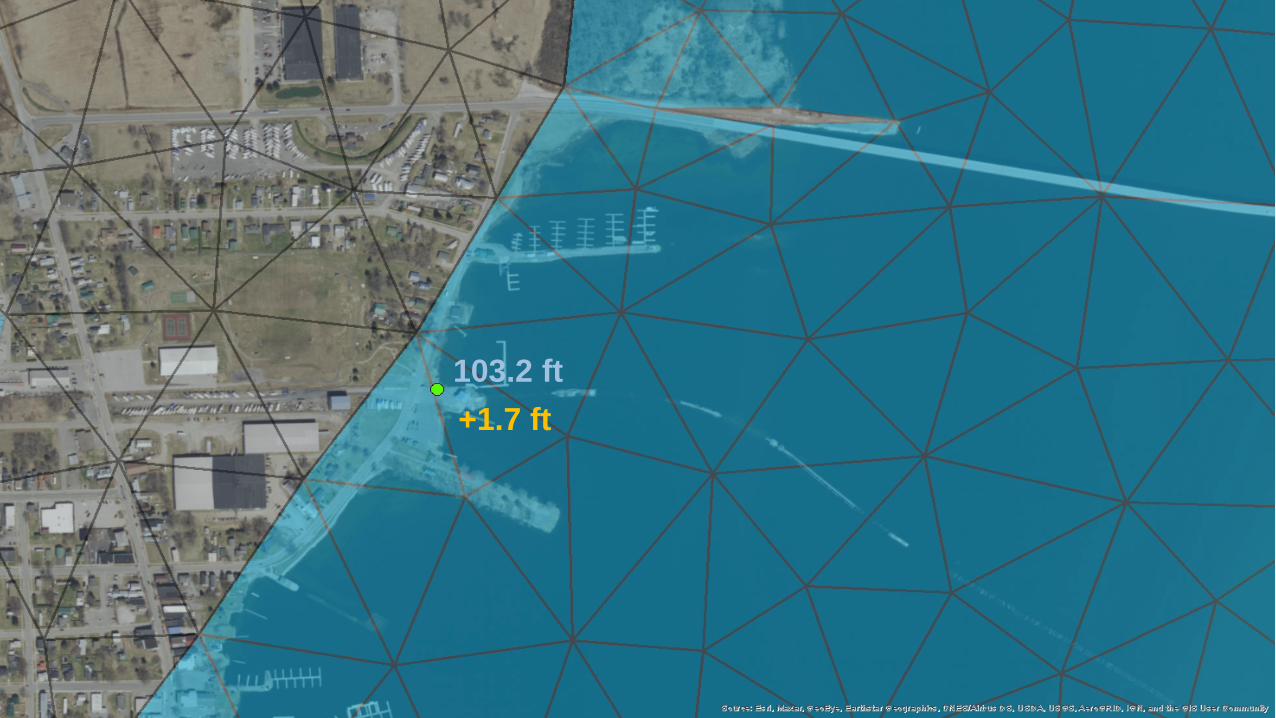
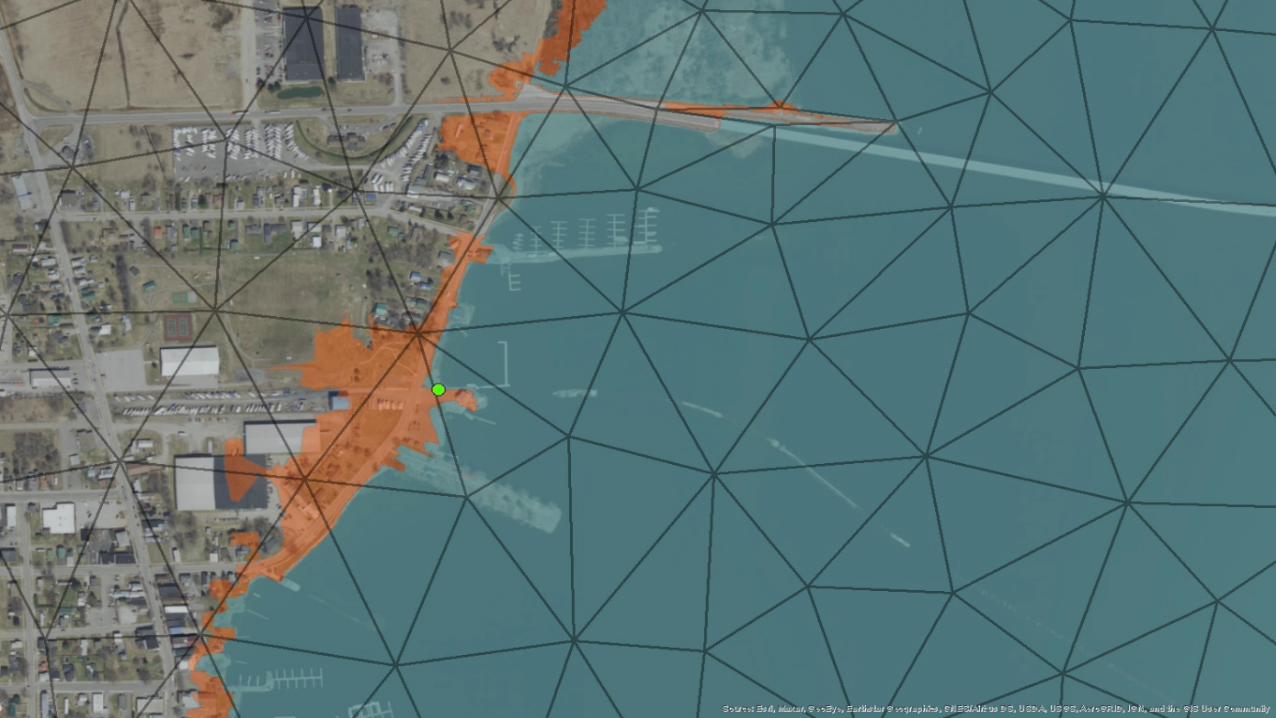
Towards flood mapping services in the US
• The “Service“ Aspect (i.e. what Agency will be responsible for generating inundation maps) Still Needs to be Determined
• NWS presently provides Inundation Maps for Ranges of DiscreteElevations (via AHPS pages)
• Technical approaches for real-time inundation on the lake basedon:• FVCOM predicted Shoreline Stages (for most Probable conditions)• WaveWatch III predicted Shoreline Stages (for Worst Case scenario)• Static Inundation Extents from Maps Developed in 2015 IJC Project
2020-11-1826
103.2 ft+1.7 ft
2020-11-1827
Towards flood mapping services in the US
• Existing Flood Forecast Coordination between NWS and MELCC will continue
• New Modeling Software for both Lake Champlain and Richelieu River
• Recommendation for Single Bi-National Forecast on Lake/River IF Mitigation Measures will Include an Actively Managed Structure
• Inundation Flood Mapping can Leverage new technological improvements AND existing products.
Key Messages
2020-11-1828
• Thank you for your time
• Feel free to contact me anytime regarding these topics:
Questions?
2020-11-1829