Embed Size (px)
Citation preview

Jeremy Hoyland
European Pricing ManagerPepsiCo Europe

The next 25 minutes, 13 slides and 10 pictures….
- What is “Pricing” all about ?
- Why bother looking at Price ?
- Why is a supplier talking about Pricing anyway ?
- What is Value based pricing and Value Progression ?
- How do you work out what the price should be ?
- Category price sensitivity and channel pricing
- A few challenges for you !
“The Value of Pricing”

What is Pack Price all about ?What is Pack Price all about ?What is Pricing all about?


Why is a supplier talking about In store Pricing anyway?

Why bother looking at Pricing?
0 5 10 15Ove
rhea
dMar
ketin
g
Volume
Price
operating profitmargin increasefor a 1%improvemmentin….
Source: PSL: Cross section of fmcg suppliers

“Price is what you pay, value is what you get”Value Pricing is about matching price with value
Value
Esteem
Differentiation
Image
Awareness
Availability
Adoption
Absolute Liking
Competition
Consistency
Product
Promotion
Emotion
For Shoppers, it is all about charging them no more than they are
willing to pay, but no less either.

Value should be progressive and needs to be fair.
288 @ £5
72 @ £2.50(£1.25 on offer)
2 x 72 @ £3.99
24 @ £1.39
2p per sheet
6p
4p
3p On average 23% of SKU’s have a
quantity surcharge. When Shopper’s
perceive this, it is the brand and not the
retailer that is blamed.
(Journal of Retailing studies)

So, how do you work out your Product Value ? Perceived Value Research….
What would be the What would be the
maximum price youmaximum price you
would consider would consider
paying for thispaying for this
product?product?
DemographicsDemographics
EndEnd
StartStart
What would be What would be
a fair price to pay a fair price to pay
for this product?for this product?
What would be What would be
An attractive price An attractive price
that would encourage that would encourage
you to buy more you to buy more
of this product?of this product?
Perceived Value is a simple and inexpensive test --- 3 basic questions per SKU ---
Perceived Value is a simple and inexpensive test --- 3 basic questions per SKU ---
PV / FairPV / FairPV / FairPV / Fair MaximumMaximumMaximumMaximum AttractiveAttractiveAttractiveAttractive
All Aided with structured price list

Look backwards with Econometric modelling
SIMULATION
% Regular
Price Change
Average
Weekly
Base
Sales (litres)
Average
Weekly
Base
Sales (value)
Average
Weekly
Manufacturer
Profit
Average
Weekly Retail
Margin
PEPSI 500ML PET SINGLE -4.0% 8.6% 4.2% -8.5% 4.2%
PEPSI 1,5L PET SINGLE 5.0% -9.3% -4.8% 8.9% -4.8%
COKE 330ML CAN 10PK 0.0% 0.0% 0.0% 0.0% 0.0%
COKE 500ML PET SINGLE 0.0% -0.4% -0.4% -0.4% -0.4%
COKE 1,5L PET SINGLE 0.0% -0.4% -0.4% -0.4% -0.4%
COKE 1,5L PET 2PK 0.0% 0.0% 0.0% 0.0% 0.0%
TOTAL -0.5% -0.3% -0.5% -0.3%
PEPSI -1.8% 0.7% -1.6% 0.7%
COKE -0.3% -0.4% -0.4% -0.4%
Item
Store level modelling allows us
to isolate and measure the
impact of price and promotion
activities on sales at store level
1 2 3 5 6 8 9 10 11 12 52#1
#4
#5
#67
#99
Weeks
Stores
Competitor activity
Competitor activity
Free GiftFree Gift
Price CutPrice Cut
MultibuysMultibuys
1 2 3 5 6 8 9 10 11 12 52#1
#4
#5
#67
#99
Weeks
Stores
Competitor activity
Competitor activity
Competitor activity
Competitor activity
Free GiftFree Gift
Price CutPrice CutPrice CutPrice Cut
MultibuysMultibuys

Or forwards, with Multiple Conjoint analysis
• Output provides the relative attractiveness of each SKU at different price points
• A model is then constructed that allows ‘What if?’ scenarios to be played, e.g.

Research gives an understanding of price sensitivity by pack but also category
AIG Grocery Elasticity Study, 2005-PCNA
-1,7 -1,2 -1,0-0,5
Elastic In-elasticHighly Elastic
HighlyIn-elastic
ModeratelyElastic
Super Premium Alcohol
-0,4
Saled Toppings
-0,4
Mouthwash-0,5
Condensed Soup-0,5
Household Cleaners
-0.8
Spaghetti Sauce -0,9
Chocolate Bars -1,0
Snack Nuts-1,1
FrozenBreakfast
-1.1
Baby Food -1,2
Red Wine -1.4
Butter -1,5
SaltySnacks
-1,6
Frozen Dinners
-1,7
Pet Food-1,9
CSDs -2,1
Ketchup -2,6
2L2L--2,12,1
24z6pk 24z6pk --2,32,3
12pk 12pk --2,22,2
24pk 24pk --3,03,0
20z 20z --1,11,1
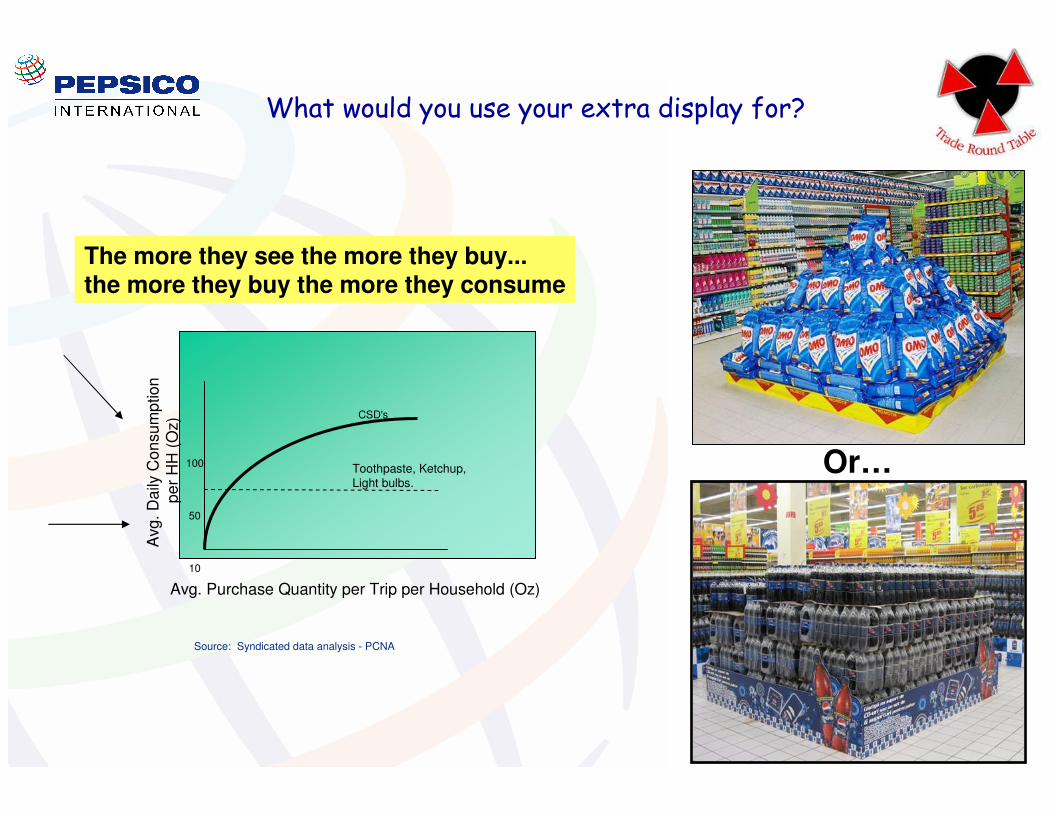
What would you use your extra display for?
Or…
The more they see the more they buy...the more they buy the more they consume
100
50
10
CSD's
Toothpaste, Ketchup,
Light bulbs.
Avg. Purchase Quantity per Trip per Household (Oz)
Avg.
Da
ily C
on
sum
ption
pe
r H
H (
Oz)
Source: Syndicated data analysis - PCNA

Shoppers have a different perception of value by channel
US Pricing by channel for Coke cans.
0.00
0.50
1.00
1.50
2.00
2.50
Hyper Super Bakery Vending -
Uni
Gas Vending -
street
Newstand Airport Train
station
$US

Some questions for you ?
As a supplier…
- Do you know the value of your products by channel?
- Do you know which packs are the most sensitive to shelf price changes
- Is your value/pack progression fair?
- Which packs drive volume, revenue and profit?
And as a retailer…
- Which are the expandable categories and how are you supporting them?
- Are your supplier’s giving you Pricing insights and making Pack as well as Product recommendations?

What is Pack Price all about ?What is Pack Price all about ?Go Shopping more !!!

Jeremy Hoyland
European Pricing ManagerPepsiCo Europe