Embed Size (px)
Citation preview
UNIVERSITY OF BIRMINGHAM INLOGOV, School of Government & Society (College of Social Sciences) Student ID No. (srn): 1712388 – Sharon Clayton Programme of study: Masters of Public Administration Year of study: 2017/2018 Module title: DL MPA Dissertation – Intake 3 – January 2019 Module banner code: Supervisor: Dr Philip Whiteman Submission date: 30 December 2018 Assignment title: “The Impact of Austerity on Local Authorities in England” Extension: yes / no date approved: Extension approved by:
new date:
Important Assignment Related Notices
A. Penalties: University policy requires that a penalty be imposed of 5 marks to be deducted from the actual mark achieved for each working day the assignment is late until 0 is reached. There is a strict deadline of 11:59pm on day of submission. A further 5 marks will be deducted for every 11:59pm deadline that is missed.
B. Extensions & Plagiarism Information:
For more information about extensions and plagiarism please refer to the Inlogov Hub. An Originality Report (OR) is generated by Turnitin every time a piece of work is submitted. The OR shows where matches have been found between the submitted document and other existing sources in the Turnitin database.
C. Canvas Assignment Discussions Canvas provides a Discussion Area for each assignment. Both staff and students can leave messages in this area. Please ensure that all communication is undertaken in a professional and polite manner. Remember that:
• Electronic discussions do not have the benefit of the nonverbal and vocal cues that normally convey meaning in a traditional face-to-face conversation. Satire, sarcasm and “heat of the moment” feelings can come across as rudeness. Please check your tone before you post a Comment.
• Instant delivery of a message does not mean an instant reply.
• Please make an appointment within advertised office hours in the first instance to discuss any matter of assignment feedback and grading. It is College policy that staff will not be actively engaging in debate over matters of feedback and grades with individual students via Canvas’ online Speed Grader system.
1
The Impact of Austerity on Local Authorities in England
Author: Sharon Clayton BA (Hons) Fellow SLCC
Masters of Public Administration
2018
Institute of Local Government Studies
School of Government and Society (INLOGOV)
Word count: 14,218
2
ABSTRACT
In 2009 the government introduced austerity measures by reducing grant funding to local
authorities in England. This, according to one city council respondent, has resulted in
“Difficult economic conditions created by government measures to reduce a budget deficit,
especially by reducing public expenditure” (Senior officer, 2018). Undeniably, reduced
government funding has had a significant impact on public services and local authorities have
had to face many challenges in an attempt to deliver the same level of service at reduced
cost.
A review of the literature looks at the definition of austerity and demonstrates how local
authorities have risen to the challenge of budget cuts, both positively and negatively. This
study aims to critically examine the impact of austerity on local authorities through the eyes
of practitioners, i.e. both politicians and local government officers.
The research was designed to produce both quantitative and qualitative results through a
questionnaire disseminated to the Leader and, where details were available, the Chief
Executive of 97 authorities throughout England. Additional questions were asked to fill a gap
within the literature which has added value, especially since respondents to this study are
practitioners with first-hand experience.
This study reveals that, whilst austerity has resulted in some positive outcomes, it has also
produced some negative outcomes that have led to reduced services. It further highlights
that austerity has impacted on the quality of life by increasing poverty in vulnerable
communities and also created low morale amongst local government employees due to
redundancies and re-structuring. Furthermore, whilst austerity continues to be driven by the
Conservative government, the outcome has affected both Conservative and Labour
controlled authorities in much the same way and therefore, this study has provided no
evidence to suggest that Conservative controlled authorities are coping with austerity any
better than Labour controlled authorities.
3
ACKNOWLEDGEMENTS
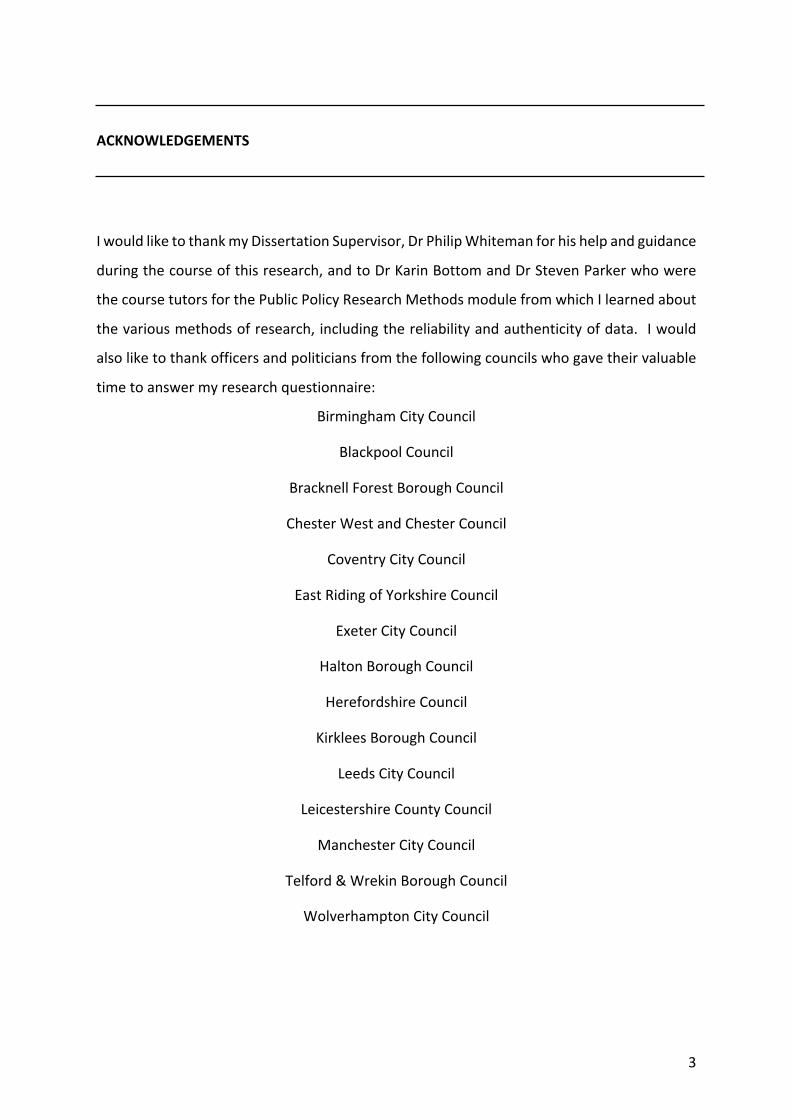
I would like to thank my Dissertation Supervisor, Dr Philip Whiteman for his help and guidance
during the course of this research, and to Dr Karin Bottom and Dr Steven Parker who were
the course tutors for the Public Policy Research Methods module from which I learned about
the various methods of research, including the reliability and authenticity of data. I would
also like to thank officers and politicians from the following councils who gave their valuable
time to answer my research questionnaire:
Birmingham City Council
Blackpool Council
Bracknell Forest Borough Council
Chester West and Chester Council
Coventry City Council
East Riding of Yorkshire Council
Exeter City Council
Halton Borough Council
Herefordshire Council
Kirklees Borough Council
Leeds City Council
Leicestershire County Council
Manchester City Council
Telford & Wrekin Borough Council
Wolverhampton City Council
4
CONTENTS PAGE
Abstract 2
Acknowledgements 3
Chapter 1: Introduction 7
1. Introduction 7 1.1. The research focus 7 1.2. Funding 7 1.3. How the money is spent 8 1.4. How income is raised 8 1.5. Financial sustainability 9 1.6. Summary 10
Chapter 2: Literature Review
2. Introduction 11 2.1. Defining austerity 11 2.2. The introduction of austerity 12 2.3. The impact of austerity 14 2.4. Is austerity necessary? 16 2.5. Service re-design 16 2.6. How some local authorities have adapted 17 2.7. Partnership working 18 2.8. Outsourcing of services 20 2.9. Delegation of local services 20 2.10. New technology 21 2.11. Disadvantages of cost cutting measures 22 2.12. Income generation 24 2.13. Emerging issues and the need for empirical research 24 2.14. Conclusion 25
Chapter 3: Research Methodology
3. Introduction 26 3.1. Aims and objectives 26 3.2. Research strategy 26 3.3. Anonymity 28 3.4. Data collection 28
5
CONTENTS PAGE 3.5. Research limitations 30 3.6. Research design 31 3.7. Benefits and validity of this research 32
Chapter 4: Findings
4. Introduction 34 4.1. Objectives of the research 34 4.2. Empirical findings from the research 34 4.3. The definition of austerity; how do you perceive austerity and
how would you define it? 35 4.4. What has been the impact of austerity on your council? 36 4.5. Have you re-designed any of your services because of budget cuts? 36 4.6. Have any of your services been reduced because of budget cuts? 37 4.7. Have you outsourced any of your services to the private sector in
response to austerity measures? 37 4.8. Have you used new technology to deliver services? 38 4.9. Have you formed new partnerships? 39 4.10. Have you introduced charging for non-statutory services? 39 4.11. Have you devolved any of your services to parish and town
councils in your area? 39 4.12. Do you know whether reduced services in your council has led
to more poverty amongst vulnerable communities? 40 4.13. Have budget cuts led to staff redundancies? 40 4.14. What impact has a review of your services had on staff morale
in response to austerity measures? 41 4.15. Response rate to the survey 41 4.16. Democratic makeup 42 4.17. Further responses 43 4.18. Summary 44
Chapter 5: Analysis and Discussion
5. Analysis and Discussion 45 5.1. Introduction 45 5.2. The definition of austerity 45 5.3. The impact of austerity - positive or negative? 47 5.4. Service re-design 48 5.5. Reduced services 49
6
5.6. Outsourcing of services to the private sector 51 5.7. Use of new technology to deliver services 52 5.8. Formation of new partnerships 53 5.9. Charging for non-statutory services 54 5.10. Devolution of services to parish and town councils 54 5.11. Have reduced services led to more poverty amongst vulnerable
communities? 55 5.12. Have budget cuts led to staff redundancies? 57 5.13. Impact of reviewed services on staff morale and absenteeism 58 5.14. Conclusion 59
6. Chapter 6: Conclusion and recommendation 61
Bibliography 63
References 67
Appendices:
1 Council Contact Details 73 2 (a) Research Questionnaire 79
(b) Completed Research Questionnaire (example) 85 3 Research Questionnaire Letter 93 4 Local Authority Statistics 94 5 Map showing location of responding local authorities 96
7
CHAPTER ONE
1. Introduction
1.1. The research focus
Public services in England are funded by various means but essentially from tax-
payers money. When the government introduced austerity in 2009 it had a
significant impact on local service provision and has since led to reduced or
withdrawn services such as libraries and recreational amenities. With less money
available and the subsequent reduction in staff local authorities have had to re-
design the way they provide and deliver local services thus creating issues around
the adequacy of their statutory functions which include children and adult social
care (PSE, January 2018).
The focus of this study is to examine the impact of austerity from a local authority
perspective. It explores how local authorities have adapted to cuts in
government funding and what impact these cuts have had on local services and
local authorities themselves. However, before the impact of austerity can be
fully understood it is necessary to understand how local authorities are funded.
1.2. Funding
The MHCLG1 has overall responsibility for English local authority funding which
is spent on local public services. Each year the Government agrees the Local
Government Finance Settlement and how much of it is to be distributed to each
local authority. This settlement is supported by the Business Rate Retention
Scheme, introduced in April 2013 by the Local Government Finance Act 2013,
which allows local authorities to retain 50% of the business rates they collect.
Local authorities also receive a Revenue Support Grant from central government
1 Ministry of Housing, Communities & Local Government
8
which can be used to finance revenue expenditure on any service they provide.
The amount each authority receives is determined in accordance with the
settlement. In addition, the government may make specific grants available
outside of the settlement; some may be ring-fenced and therefore the way they
are spent is restricted, for example grants for education, but non-specific grants
may be spent without restriction. Once each local authority is notified by
government how much settlement they can expect to receive they calculate how
much additional revenue they need to enable them to maintain and deliver local
public services (DCLG, 2013).
1.3. How the money is spent
Local authorities in England spend in three main areas:
o capital projects such as roads, bridges or school buildings;
o revenue spending on council housing;
o revenue expenditure which includes employment costs and the cost of
providing and maintaining services other than council housing (DCLG, 2013)
e.g. education and social services.
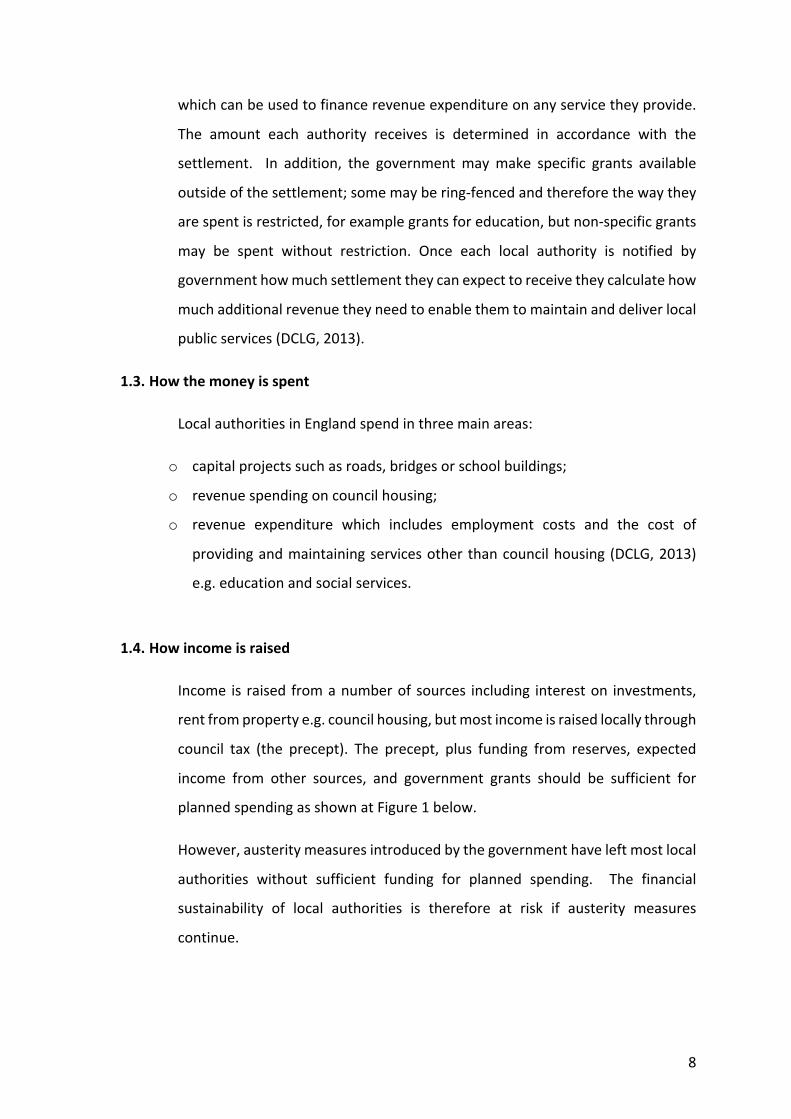
1.4. How income is raised
Income is raised from a number of sources including interest on investments,
rent from property e.g. council housing, but most income is raised locally through
council tax (the precept). The precept, plus funding from reserves, expected
income from other sources, and government grants should be sufficient for
planned spending as shown at Figure 1 below.
However, austerity measures introduced by the government have left most local
authorities without sufficient funding for planned spending. The financial
sustainability of local authorities is therefore at risk if austerity measures
continue.
9
Figure 1
1.5. Financial sustainability
In 2018 the NAO2 prepared a report for the House of Commons on the financial
sustainability of local authorities. It revealed that in the last eight years, there
has been a 49.1% reduction in real-terms of government funding for local
authorities which has given rise to additional pressure since the demand for key
services has grown, mostly attributable to an ageing population. Henceforth, the
reduction in government funding over the last six years has led local authorities
to reduce spending, which in the first three years enabled them to build up their
reserves. However, they have had to draw on these reserves over the last three
years in order to protect adult and children’s social care for which they have a
statutory responsibility.
According to the NAO (2018) amongst other factors the National Living Wage has
played a part in higher costs faced by local authorities especially in adult social
care which consumes a significant amount of council tax. Meanwhile, the
amount spent on discretionary services has fallen (NAO, 2018) although the
NAO’s 2014 report revealed that local authorities have tried to protect key
services for which they have a statutory responsibility. However, there is a limit
to how many savings can be made before front-line services begin to erode. The
2 National Audit Office
EXPENDITURE INCOME
Precept
Funding from reserves and
government grant
Interest from investments and rent from property
Planned spending
10
impact of austerity is therefore worthy of attention if an acceptable level of local
services is to be maintained.
1.6. Summary
The findings from this study, (explained in Chapter 4, and analysed in Chapter 5)
provide both qualitative and quantitative data gathered from various local
authorities throughout England, as detailed in Chapter 3. The study reveals how
local authorities and the communities they serve have really been affected by
austerity and its positive and negative impact. This valuable research highlights
the issues that have developed since austerity was introduced and its
detrimental effect on the social, economic and environmental capital throughout
England.
The following chapter examines the literature that is currently available on the
topic of austerity.
11
CHAPTER TWO
Literature Review
2. Introduction
Since austerity is a relatively new concept within the local government sector, there
is limited literature on this topic. The objectives of this literature review therefore are
to examine existing knowledge about austerity i.e. how it is perceived and how it has
impacted on local service provision.
This chapter explores how local authorities have risen to the challenge of doing more
with less and gives examples of how innovation has been exploited to maintain local
services with fewer resources. It attempts to draw out the advantages and
disadvantages that budget cuts have provoked and assess whether the standard of
local service provision has improved or deteriorated as a consequence of austerity.
2.1. Defining austerity
Austerity has different meanings depending on the situation to which it relates.
For example, Journalist Imogen Groome (2017) describes an austere individual
as someone who lives within their budget by spending less than their annual
income. By comparison, cost-cutting in organisations involves reduced spending,
a clampdown on expenses and staff redundancies. The Oxford English dictionary
defines austerity as “difficult economic conditions created by government
measures to reduce public expenditure”.
Bailey and Shibata (2017) assert that austerity is exemplified by reduced welfare
spending and a move towards privatisation and/or public services being de-
12
democratised. It is also the cause of reduced public spending and/or an increase
in tax revenues with the aim of improving the fiscal health of the government.
However, Groome (2017) observes that, when it comes to the economy,
austerity has a different meaning since a government can still spend more than
it receives because it can increase or introduce taxes. Indeed, Stanley (2014)
concurs with Groome that austerity simply means the “idea of living within one’s
means”, and this was what George Osborne3 intended when he proclaimed that
the Conservatives would ensure that Britain would start living within its means
(ibid.). However, perhaps government should take a closer look at its own
housekeeping and practice what it preaches because, if it lived within its means
by being more meticulous with government department spending and indeed
MPs’ expenditure, there might be no need for austerity!
Some people however are very sceptical of the term “austerity”. For instance,
when Blyth (2013) discovered that the G20 communiqué of June 2010 called for
“growth friendly fiscal consolidation” he called it a fancy way of saying
“austerity” which he thought was “as plausible as a unicorn with a bag of magic
salt”.
2.2. The introduction of austerity
For many years successive English governments have attempted to control local
authority spending and keep council tax at a ‘reasonable’ amount for local
citizens. Indeed, there have been significant budget cuts in the UK since 2010;
the aim being to improve service provision at reduced cost. But perhaps the
most notable curb to reduce local government expenditure was in response to
the global financial crisis of 2008 when, rather than allow several banks to
collapse, the government decided to nationalise them (Stanley, 2014).
3 Chancellor of the Exchequer from 2010 to 2016
13
As Conservative Leader in 2009 David Cameron announced that the UK had
reached an ‘Age of Austerity’ and that it was time to end an era of ‘excessive
government spending’. When he finally gained power as Prime Minister in May
2010 his coalition government4 set about cutting the UK’s deficit through an
austerity programme that included major public spending reductions (Ferry,
Coombs and Eckersley, 2017). Cameron blamed the Labour Party for
bankrupting the country and creating the debt crisis and used this as a reason for
austerity measures to be implemented (Stanley, 2014). Of course, blaming the
Labour Party was a good excuse to enable the Conservatives to gain favour with
voters since Cameron’s austerity tactic has since restricted council tax increases.
Notwithstanding that each newly elected government blames the previous one
for misspent public money; a blame culture that seems set to continue.
So, in response to Cameron’s rhetoric, in October 2010 George Osborne5,
announced cuts to English local authority budgets of circa 7% as part of his
Comprehensive Spending Review. These cuts applied in the 2010/2011 fiscal
year and the three following years. Indeed, the IFS6 claimed that between
2009/2010 and 2011/2012 planning and development services faced budget cuts
of 43% (Marrs, 2012). Subsequently, successive governments have reduced local
authority funding in England in an attempt to reduce the fiscal deficit, and these
austerity measures have led councils to re-design how they deliver local service
in order to meet their statutory duties, which range from children and adult
social care to waste collection.
Conversely, Stanley (2014) asserts that the introduction of austerity was framed
on the premise that the squeezed middle was “striking back against the unfair
distribution of ‘taxpayers’ money to restore parity” and because the general
mood at that time supported the argument that there was a debt crisis and cuts
were necessary. He alleges that, in order to legitimise spending cuts that benefit
4 Conservatives and Liberal Democrats 5 Chancellor of the Exchequer 6 Institute for Fiscal Studies (think-tank)

14
the whole country, governments need a debt ‘crisis’, and they seek to legitimise
harmful spending cuts by claiming that they will solve this ‘crisis’. He contends
that the public at large have accepted that the debt ‘crisis’ is responsible for
austerity measures without there being sufficient evidence to support this notion
and argues that, to curb spending, the state should act more like a responsible
household and be sufficiently thrifty to help solve England’s debt crisis. He
advocates that the UK has immorally lived beyond its means because of easy
credit and spending on the ‘underserving’ and that decisive intervention is
necessary to avert crisis and help prevent its continuation. He further claims that
the extent of spending cuts might have been exaggerated because evidence
suggests that only in 2010 were particularly sizable budget cuts introduced.
Indeed, he goes as far as to insinuate that we might have been duped (ibid.).
2.3. The impact of austerity
Austerity measures introduced by the Coalition Government in 2010 included
£30b spending cuts over four years as well as a two-year pay freeze for public
sector workers earning in excess of £21,000 per annum. This has led to £20b
worth of savings being made in the local government sector (LGA, 2016). The
consequences expected from these cuts were higher levels of unemployment,
reduced key services, an increase in crime and disorder and more poverty
amongst vulnerable communities. There was also an assumption that, as the
public sector retreated, the private sector would create employment, but there
is no evidence to support this in the short term (Lowndes and Pratchett, 2012).
Since its election in May 2015 the Conservative government has put austerity
and devolution at the forefront of its agenda by announcing a further 56%
reduction in grant funding to local authorities who have faced the most extensive
cuts of all public service providers. This has followed on from 5 years of spending
cuts which have reduced budgets by more than one third (NAO 2014). Lowndes
and Gardner (2016) refer to this as ‘super-austerity’ since the common context
of the Conservatives is spending cuts.
15
Local authorities have a legal duty to set budgets that will raise sufficient
income to deliver their statutory obligations, but consultation carried out by
the County Research Network revealed that almost 20% of council leaders think
their councils won’t be able to raise sufficient income to balance their books in
2019/2020 without more money from government. Indeed, early in 2018
Northamptonshire County Council declared itself bankrupt and DCLG7 began an
investigation following concerns that the council had mismanaged its finances
and failed to comply with its responsibilities. This was due to growing financial
pressures brought about by austerity measures. The council had found it
particularly challenging to meet the escalating costs and demand for adult
social care and children’s services and said that the government’s proposed
funding settlement did not recognise the pressures they faced (PSE, January
2018). Birmingham City Council too will have to make extensive budget cuts if
it is to balance its books (Public Sector Online, September 2018).
Hastings et al. (2015) assert that cuts to local government budgets have a
disproportionate impact on the most deprived areas partly attributable to socio-
demographic changes, such as an ageing population. As a consequence, local
authorities in England are having to cope with unprecedented funding reductions
and cost pressures. Indeed, much of the literature on the topic advocates that
“all local authority services are now at risk of reduction or complete
disappearance” (ibid.). Furthermore, some question whether austerity is
necessary (Bailey and Shibata, 2017). Whilst austerity has encouraged local
authorities to look for innovative ways of doing more with less, and has
subsequently led to some efficiency savings, there comes a point at which no
more savings can be made without jeopardising the quality or retention of a
service.
7 Department for Communities and Local Government
16
2.4. Is austerity necessary?
The present Conservative government insists that austerity is necessary to help
grow the economy and reduce debt. However, the economist Kate Raworth’s
(2017) perspective of the theory of demand and supply is that a healthy economy
should be designed to thrive rather than concentrate on growth. She argues that
the economy is too focussed on ‘forwards and upwards’ and questions whether
GDP growth is “always needed, always desirable or, indeed, always possible”
(ibid.). So, by the same logic, perhaps we should ask whether public services
should continue to be subjected to austerity measures in accordance with the
growth of the economy. Do we need a buffer to protect the quality of local
services no matter what the economic climate might be? After all, the erosion
and loss of some local services, such as social care, has a negative impact on the
quality of life. Raworth argues that, if the demands on the earth’s resources are
carefully controlled and safeguarded, we can look forward to a future that will
provide for every person’s needs (ibid.). She makes it sound simple, but her
concept is easier said than done otherwise why are people left wanting and why
aren’t local authorities making sufficient income from re-cycling to compensate
for austerity measures?
Journalist Whittam Smith argues that austerity hasn’t worked because it has not
reduced borrowing. He quotes the man who runs the world’s largest bond fund
as saying that the UK, and almost all of Europe, have mistakenly believed that
fiscal austerity is how real growth is produced, but it is not. In summary, he
alleges that austerity has not produced the results that government desired
(Smith, 2013).
2.5. Service re-design
Hastings et al. (2015) undertook a mixed methods case study of three local
authorities in England to determine how each had managed austerity over a 5-
year period between 2011 and 2016. It revealed that, following corporate re-
17
structuring, substantial staff reductions had generated efficiencies although it
had led to reduced services. Whilst efficiency savings could be made in the early
years it became more difficult in later years as they became progressively
exhausted and, paradoxically, it was felt that more capacity would be needed to
drive such a significant change agenda. Furthermore, there was a risk that re-
designed services may not be sufficiently resilient and have sufficient capacity to
respond to pressure and subsequent service failures. Services were therefore
retained in a diluted form rather than deleted, with council resources being
constrained unless services fell below acceptable standards, and councils have
increasingly used other agencies and citizens to maintain appropriate service
levels. Hastings et al’s. research clearly identified that the three local authorities
used in their case study eventually reached a point where efficiency was not
sufficient and instead had to move to retrenchment in order to close gaps in their
budgets.
2.6. How some local authorities have adapted
The 2010 Spending Review was not just to reduce budgets, it was also intended
to foster innovation among local authorities through reduced regulation so their
budgets could be used in new ways and thus change the way local services are
delivered (Lowndes and Pratchett, 2012). To this end the introduction of the
General Power of Competence8 has given local authorities additional freedoms
to improve their localities. However, because budget cuts were introduced at
the same time, these enabling powers are somewhat undermined without a
corresponding ability to raise more revenue (Ferry, Coombs and Eckersley, 2017).
Indeed, even with this new power, the cuts have been so significant that local
authorities have had to make some tough choices about which services they can
deliver within their budgets (Lowndes and Pratchett, 2012).
8 Introduced in the Localism act 2011
18
2.7. Partnership working
In order to reduce costs several councils have shared services with neighbouring
councils with some merging entire departments. However, many councils have
been forced to reduce their workforce (Marrs, 2012). Nonetheless, in spite of
budget cuts local authorities have demonstrated some resilience as they have
developed new technologies to deliver services through collaborative
relationships with other agencies, including public and non-public sector
providers. Some local authorities have even taken in business from the private
sector, for example, maintenance of local transport vehicles, and some have
acted as commissioners or providers of lower-cost utilities such as energy and
broadband (Lowndes and Gardner, 2016).
Increased pressures of austerity have led to public services being transformed
with many local authorities working in partnership by sharing resources. Indeed,
partnerships combine diverse resources and competences from public, private
and voluntary sectors (Lowndes and Sullivan, 2004). For example, the sharing of
senior management teams (SMTs). Through economies of scale, SMTs can build
resilience, reduce management costs and enable the sharing of wider expertise
(Bello et al, 2018). Examples of SMTs include Clinical Commissioning Groups and
blue light emergency services.
Research carried out by Bello et al in 2017 revealed that one of the main reasons
for councils to introduce SMTs was in response to austerity. Interestingly the
research found that Labour councils prefer to have control and more insourcing
activities whilst Conservative councils prefer to outsource and share services.
Between 2005 and 2014 twenty district councils in England shared SMTs and,
except for one which was Labour controlled, all were Conservative controlled
except for two with no overall control. However, the establishment of these
SMTs was more than likely attributable to councils sharing similar challenges.
Party politics also played a large part in combined leadership between councils,
thus making working together more conducive (ibid.).
19
In order to encourage more SMTs the government introduced the
Transformation Challenge Award in 2014, but this came as disappointing news
to those councils who had already incurred quite significant setting up costs prior
to 2014 and had missed out on this funding (Bello et al, 2018). Perhaps the
government had waited until there was evidence that this initiative could work
before it offered a ‘carrot’! However, Bello et al found that, whilst SMTs have
been advantageous in some areas they have been disadvantageous in others.
For instance, cost savings have led to redundancies following restructuring and,
because of reduced resources, have left some councils struggling. Bello et al’s.
research argues that savings brought about by SMTs are relatively modest with
average savings of around £300,000 per annum, the maximum being £1m and
the minimum £100,000, although cost cutting has helped to protect front-line
services (ibid.).
Some councils have reduced their costs through sharing services with
neighbouring councils and merging entire departments. For example, some have
shared specialist posts, such as archaeological or design officers who don’t
always have sufficient work to justify a full-time post. (One might question why
full-time posts existed in the first place if there was not enough work.) However,
the same number of staff are required so the only real savings have been one or
two managerial posts (Marrs, 2012). One council reduced the number of area
planning committee meetings to save on administration and councillor expenses,
and one London council has a policy whereby planning officers do not answer
the phone. (In terms of performance this can be likened to cuffing!9) However,
cost savings have been eroded because some upfront spending has been
necessary in order to align IT systems (ibid.).
9 Making things disappear; unreported statistics – see ‘A Tangled Web: Why You Can’t Believe Crime’ by Rodger Patrick (2014)
20
In 2016 local authorities were allowed to raise their precept for social care by
3%, but for two years only (IFS, 2016) although the LGA10 claimed the funding
gap would not be resolved by this alone. Those who have been affected the most
are disadvantaged areas particularly as localities become increasingly dependent
on local business rates. To protect public service provision and to offset funding
reductions local authorities began to share back-office services such as HR and
legal services as well as environmental services such as highway functions. They
have also engaged in joint services procurement and moved into commissioning.
This, coupled with the added benefit of digital technology, has helped to reduce
customer contact costs (Lowndes and Gardner, 2016).
2.8. Outsourcing of services
One authority in London benchmarked its performance against a neighbouring
authority which had outsourced most of its functions, but there was little
difference in costs therefore suggesting that outsourcing services did not
necessarily lead to cost savings. One of the downsides of outsourcing is that
agency staff may lead to a fall in standards often due to their unfamiliarity with
council procedures. Nevertheless, the benefits and cost savings of outsourcing
will not be obvious until sufficient data has been gathered over several years
(Marrs, 2012).
2.9. Delegation of local services
Local authorities are not the only organisations that provide public services;
there are also circa 10,000 parish and town councils in England. These local
councils are also statutory bodies with the power to raise their own precept.
However, only 30% of England is parished (NALC11, 2018), mostly in the more
rural areas and, therefore, local authorities are the major providers of public
10 Local Government Association 11 National Association of Local Councils, the national body that represents parish and town councils
21
services. However, both local authorities and local councils have the power12 to
discharge their functions to any other authority. This means that local
authorities may devolve certain functions to local councils if local councils are
willing to take them on.
Local councils often work with other agencies to “deliver services and promote
community development” (Pearce & Ellwood, 2002). However, their first priority
is articulating community concern and opinion which they convey to their local
authority and, although local councils have begun to show more innovation and
deliver a wide range of local services such as recreational facilities, cemeteries
and allotments, their increased capabilities have not been matched by the
transfer of additional powers and resources from principal authorities. Even
though local councils share a wide range of powers with local authorities for the
provision of local services principal authorities still opt to provide all or most
services themselves (ibid). This is a missed opportunity, although devolving local
services to local councils is only possible in areas that are parished, and not all
are, especially the more urban conurbations such as Birmingham and London.
Nonetheless, for those areas which are parished, local councils also have the
General Power of Competence which allows them greater freedom to address
community needs.
2.10. New technology
Some local authorities have made greater use of new technology in an attempt
to manage within their reducing budgets. For example, ‘cloud computing’
delivers on-demand computing resources accessible over the internet on a pay-
for-use basis. The supporting infrastructure, hardware and software is owned
and managed by providers and enables information to be accessed from any
location (IBM, 2018) thus offering council staff and councillors greater flexibility
as well as cost savings.
12 Local Government Act 1972, Section 101
22
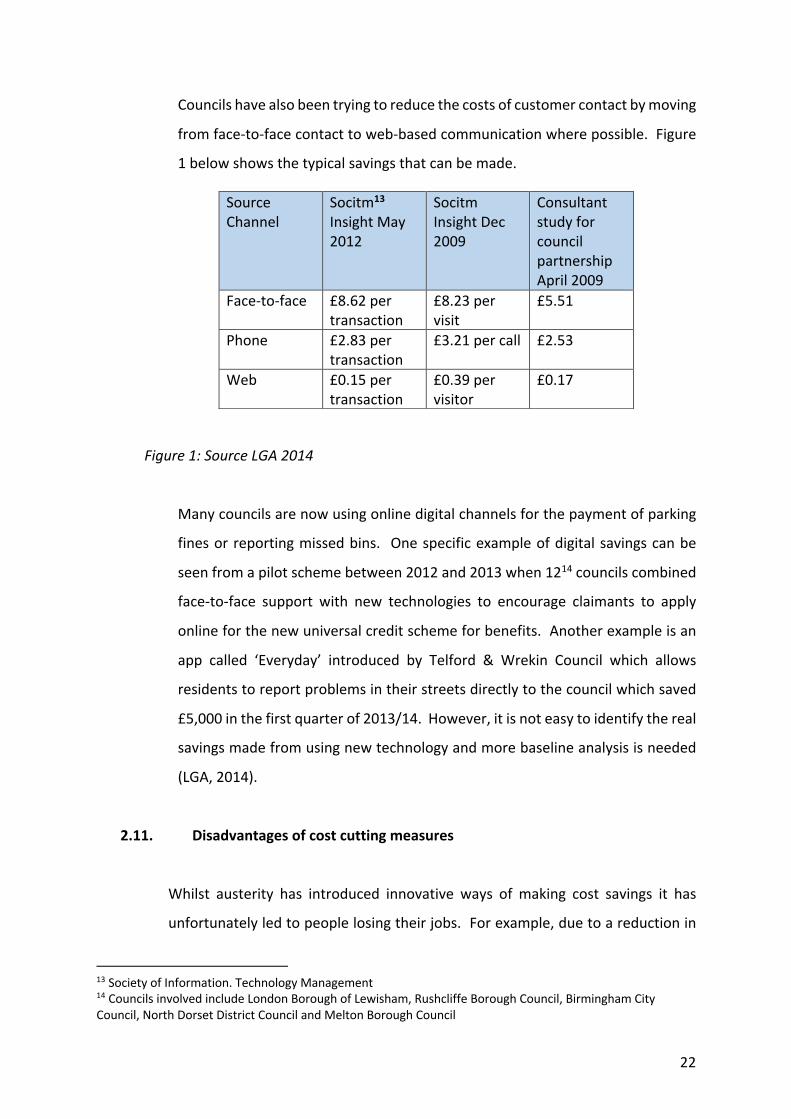
Councils have also been trying to reduce the costs of customer contact by moving
from face-to-face contact to web-based communication where possible. Figure
1 below shows the typical savings that can be made.
Figure 1: Source LGA 2014
Many councils are now using online digital channels for the payment of parking
fines or reporting missed bins. One specific example of digital savings can be
seen from a pilot scheme between 2012 and 2013 when 1214 councils combined
face-to-face support with new technologies to encourage claimants to apply
online for the new universal credit scheme for benefits. Another example is an
app called ‘Everyday’ introduced by Telford & Wrekin Council which allows
residents to report problems in their streets directly to the council which saved
£5,000 in the first quarter of 2013/14. However, it is not easy to identify the real
savings made from using new technology and more baseline analysis is needed
(LGA, 2014).
2.11. Disadvantages of cost cutting measures
Whilst austerity has introduced innovative ways of making cost savings it has
unfortunately led to people losing their jobs. For example, due to a reduction in
13 Society of Information. Technology Management 14 Councils involved include London Borough of Lewisham, Rushcliffe Borough Council, Birmingham City Council, North Dorset District Council and Melton Borough Council
Source Channel
Socitm13 Insight May 2012
Socitm Insight Dec 2009
Consultant study for council partnership April 2009
Face-to-face £8.62 per transaction
£8.23 per visit
£5.51
Phone £2.83 per transaction
£3.21 per call £2.53
Web £0.15 per transaction
£0.39 per visitor
£0.17
23
planning applications, some local authorities have been forced to reduce staffing
levels, although some have done this without compulsory redundancies. Indeed,
compulsory redundancies are not the favoured option and local authorities have
instead sought voluntary redundancies and introduced early retirement schemes
to avoid this. Some authorities have left vacant posts unfilled, thus the loss of
administrative staff has impacted on frontline services (Marrs, 2012).
According to journalist David Paine (2018), between 2010 and 2018, 223,000
workers have been made redundant by councils at a collective cost of £4b with
Birmingham City Council having made the most people redundant, that’s 8,769
people at a cost of £184.8m15. Indeed, a Birmingham City Council spokesperson
declared that a 50% reduction in staff has been necessary to enable the council to
respond to significant reductions in its grant from central government (Local
Government Chronical, 2018). Many councils are facing the same problem with
500 jobs at risk at Wolverhampton City Council as it struggles to tackle a £28m
deficit by the end of 2019/2020 (PSE, October 2018). Cornwall Council too
proposes to cut 388 full-time jobs to help it meet savings of £77m over the next 4
years (PSE, September 2018).
Staff reductions have obviously had a negative impact on efficiency as fewer
employees are left to cope and maintain an acceptable level of service delivery. It
has also had a negative impact on staff morale as those that remain in post are
under added pressure to keep up with demand, often by working longer hours.
Psychological research has revealed that cuts to public services contribute to
mental health problems since job insecurity creates anxiety and can lead to clinical
depression. Indeed, research carried out by Mawdsley & Lewis (2017) found that,
as a result of NPM16, public sector employees with long-term health conditions are
particularly vulnerable to workplace bullying and discrimination as they are
oppressed by more dominant co-workers and are subjected to ‘macho’ appraisal
15 Data collected by the Local Government Chronical using councils’ statements of accounts from 2010-11 to 2017-18 for all 152 of England’s top-tier councils and relate to compulsory and voluntary redundancies 16 New Public Management
24
systems that set unmanageable workloads or impossible deadlines.
Unsurprisingly, psychologists argue that government “cuts are both avoidable and
immoral” and that the psychological costs of austerity for individuals and
communities should be considered (McGrath, Griffin and Mundy, undated).
2.12. Income generation
Austerity has forced local authorities to review how income is generated and has
led some to charge for services that have previously been free, such as green
waste collection, and some have increased pre-existing charges such as car
parking fees (Hastings et al, 2015). However, although charging for services can
supplement funds for projects it can also lead to negative outcomes. For
example, income can be raised by charging for room hire. However, in one case,
this has led to self-help groups not being able to afford the charges and thus can
no longer meet, leading to the demise of this type of service (Clayton, Donovan
and Merchant, 2016).
2.13. Emerging issues and the need for empirical research
One issue that austerity is purported to be responsible for is poverty. According
to Oxfam for those already in poverty impoverishment has worsened and more
and more people are living on the breadline with at least half a million people
using food banks each year (Oxfam, 2013).
It is apparent from the literature that local authorities are under extreme
pressure to maintain the same level and quality of services amidst government
pressure to keep council taxes to a minimum. Whilst austerity has steered re-
organisation in the public sector, for instance, the merging of two-tier authorities
(district and county) into one unitary authority, it has still led to public services
being reduced or no longer available free of charge. It is therefore vital that
further research is carried out to identify whether the positive influence that
25
austerity has made to public sector service provision outweighs the negative
impact to service users.
2.14. Conclusion
As well as defining the meaning of austerity this chapter has demonstrated how
local authorities have responded to austerity. It has illustrated the impact of
budget cuts on local service provision, given examples of how cost savings have
been made, and highlighted how budget cuts have had a negative impact on local
communities and local authorities themselves. The literature has also revealed
that, whilst local government officers have welcomed innovation and the
transformational change necessary for a more sustainable future for their local
authority, they feel restricted by the tight financial situation in which they have
to work (Ferry, Coombs and Eckersley, 2017).
In conclusion, councils are having to make tough choices about which
discretionary functions should be maintained and, although some priorities have
been determined through community consultation, many are being decided by
councillors (Marrs, 2012). Indeed, local authorities have become increasingly
susceptible to being blamed for diminishing local services and not effectively
managing their budgets, rather than central government who is responsible for
budget cuts throughout the public sector (Clayton, Donovan and Merchant,
2016).
The following Chapter demonstrates how research has identified the positive
and negative impact of austerity on various local authorities in England
authenticated through the eyes of politicians and local authority officers.
26
CHAPTER THREE
Research Methodology
3. Introduction
3.1. Aims and objectives
The overall aim of this research is to examine the impact of austerity on local
authorities in England by using a practitioner-led approach. This chapter explains
the objectives of this research, its strategy, how the data was collected, the
research limitations, how the questionnaire was designed, how the target
audience was selected and the benefits and validity of the research.
The objectives of this research are to find out:
o how local authorities have coped with austerity;
o what are the consequences of austerity and whether it has had a positive or
negative impact on local service provision; and
o whether austerity is necessary or has been successful.
3.2. Research Strategy
The overall strategy for this research is to realise the impact of austerity on local
service provision by asking local authority practitioners themselves to explain
their own practical experience of how they have been affected by austerity.
This exploratory empirical research was conducted by a survey of local
authorities in England via a questionnaire (see Appendix 2). The research focuses
on identifying known problems created by austerity facilitated by a close
27
examination and analysis of the experience of local government practitioners i.e.
Politicians and officers.
The chosen research methodology was deployed because “surveys are best for
finding out what people think, believe, or perceive”, Johnson, 2002, p98).
Surveys also allow for primary data to be gathered from a broad spectrum.
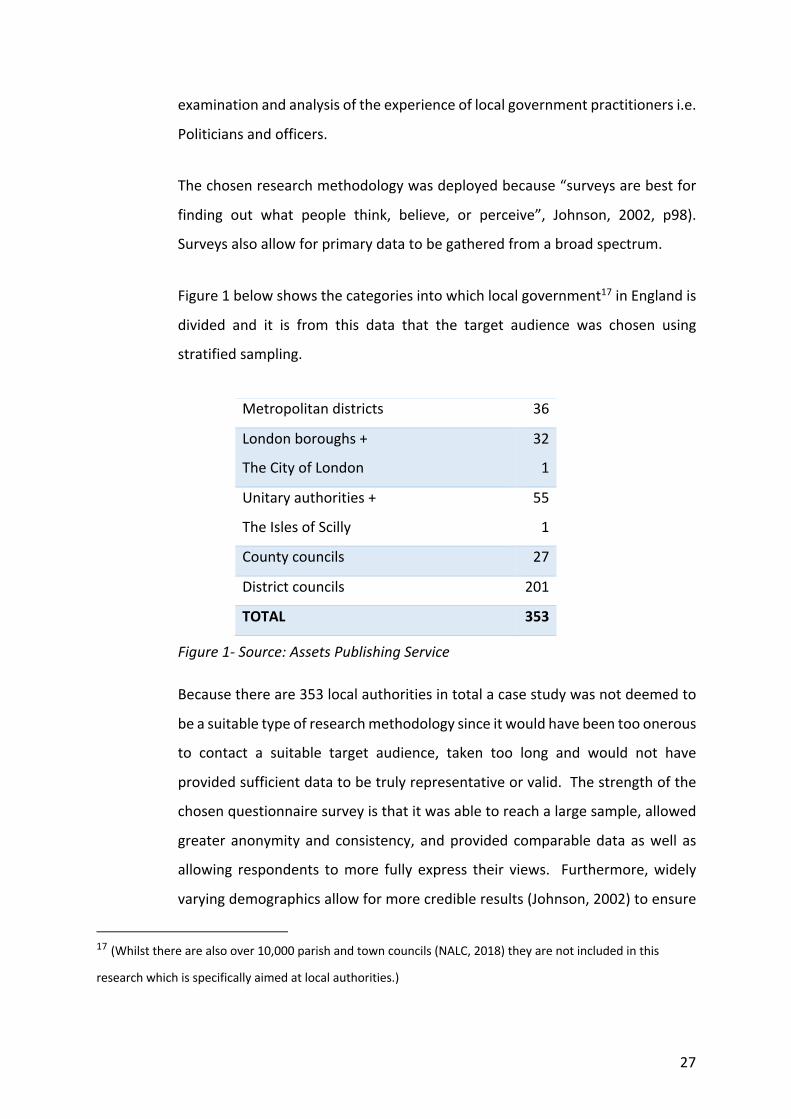
Figure 1 below shows the categories into which local government17 in England is
divided and it is from this data that the target audience was chosen using
stratified sampling.
Figure 1- Source: Assets Publishing Service
Because there are 353 local authorities in total a case study was not deemed to
be a suitable type of research methodology since it would have been too onerous
to contact a suitable target audience, taken too long and would not have
provided sufficient data to be truly representative or valid. The strength of the
chosen questionnaire survey is that it was able to reach a large sample, allowed
greater anonymity and consistency, and provided comparable data as well as
allowing respondents to more fully express their views. Furthermore, widely
varying demographics allow for more credible results (Johnson, 2002) to ensure
17 (Whilst there are also over 10,000 parish and town councils (NALC, 2018) they are not included in this
research which is specifically aimed at local authorities.)
Metropolitan districts 36
London boroughs +
The City of London
32
1
Unitary authorities +
The Isles of Scilly
55
1
County councils 27
District councils 201
TOTAL 353
28
political balance and that the data gathered would be sufficiently representative
of all the councils invited to participate in the survey. The target audience was
selected by stratified sampling with councils being chosen from the north, south,
east and west of England including the Midlands as well as from each category
as listed at Figure 1 above. A full list of those councils which were contacted can
be found at Appendix 1.
Contact details for each council were sourced through an internet search.
However, whilst the contact details for politicians could be found (although not
immediately obvious) contact details for senior officers were not readily
available. Nonetheless, the majority of responses to this survey are from senior
officers.
3.3. Anonymity
Respondents were assured that “all information provided will be treated in strict
confidence and participants will not be identified” as named individuals.
Therefore, only each respondent’s position and the type and political makeup of
their council is quoted, except in some instances where council documents have
been referred to and the information is publicly available.
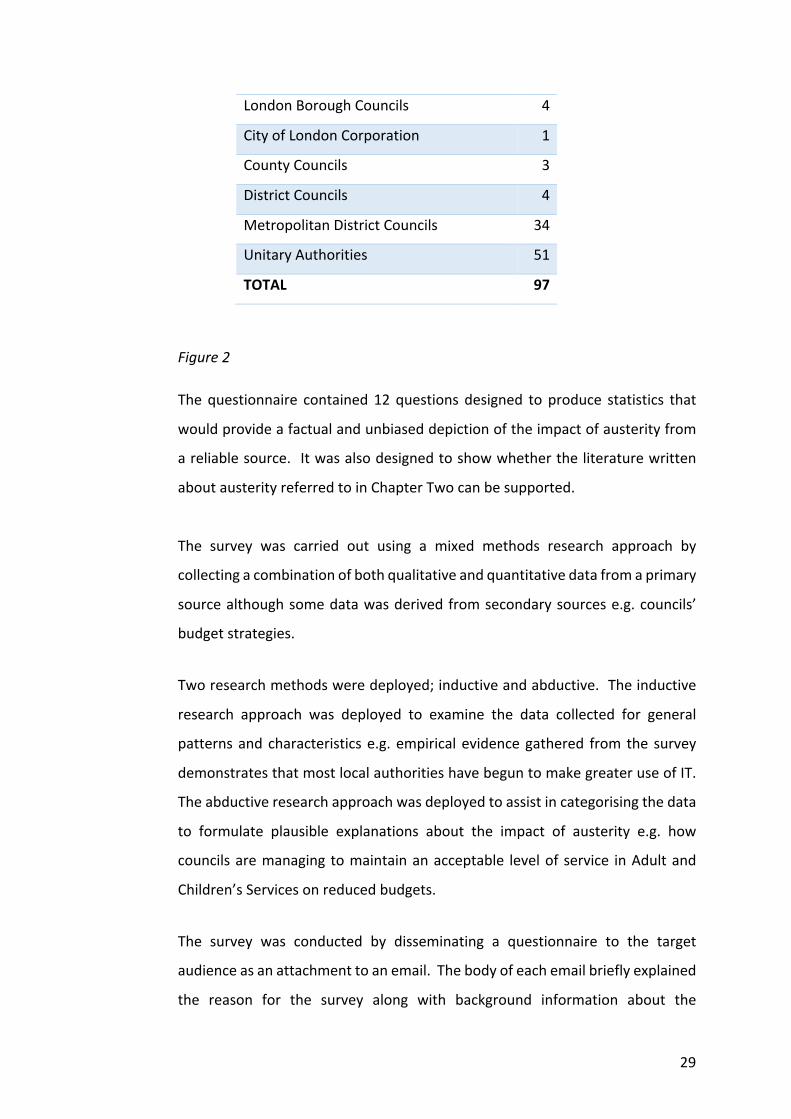
3.4. Data collection
Empirical data was collected via a questionnaire which was emailed to a target
audience of 97 authorities throughout England, as listed at Figure 2 below, but
only 15 authorities responded.
29
London Borough Councils 4
City of London Corporation 1
County Councils 3
District Councils 4
Metropolitan District Councils 34
Unitary Authorities 51
TOTAL 97
Figure 2
The questionnaire contained 12 questions designed to produce statistics that
would provide a factual and unbiased depiction of the impact of austerity from
a reliable source. It was also designed to show whether the literature written
about austerity referred to in Chapter Two can be supported.
The survey was carried out using a mixed methods research approach by
collecting a combination of both qualitative and quantitative data from a primary
source although some data was derived from secondary sources e.g. councils’
budget strategies.
Two research methods were deployed; inductive and abductive. The inductive
research approach was deployed to examine the data collected for general
patterns and characteristics e.g. empirical evidence gathered from the survey
demonstrates that most local authorities have begun to make greater use of IT.
The abductive research approach was deployed to assist in categorising the data
to formulate plausible explanations about the impact of austerity e.g. how
councils are managing to maintain an acceptable level of service in Adult and
Children’s Services on reduced budgets.
The survey was conducted by disseminating a questionnaire to the target
audience as an attachment to an email. The body of each email briefly explained
the reason for the survey along with background information about the
30
researcher (see Appendix 3). However, in order to encourage an adequate
response and provide meaningful empirical results, the invitation to participate
in the survey asked each recipient to pass on the questionnaire to a more
appropriate person to respond should the recipient be unable to do so. In several
cases, this did happen, thus increasing the response rate. Indeed, where the
Leader was unable to respond, the Deputy Leader has responded, and where the
Chief Executive was unable to respond, senior officers have responded.
Therefore, this strategy proved to be successful.
3.5. Research limitations
The questionnaire was emailed to the Leader of each council and, where
possible, the Chief Executive. This was to try and keep the answers politically
balanced and also to double the chances of a response. Unfortunately, in spite
of an attempt to reach as many English local authorities as possible, the response
was poor. However, whilst a poor response rate may lead to an inaccurate
reflection of the whole group (Johnson, 2002) responses were received from a
variety of councils from various locations throughout England with a good
mixture of Conservative and Labour control.
Whilst many councils declined to participate in the survey most did provide their
reasons for not doing so. Some of the reasons were due to them not being able
to afford officer time, a paradox that adds weight to how austerity has impacted
on local authorities and the pressure they are under, often due to a reduced
workforce. For example, one Conservative Metropolitan District Council Leader
was unable to help at this time but was willing to help in the future, the Labour
Mayor of one Unitary Council was unable to respond due to a busy diary, and
two Chief Executives of Unitary Councils were also unable to respond but
recommended looking at their Council’s recent Budget Report and other
financial information to which electronic links were provided. One unitary
authority in the Midlands was especially difficult from which to coax a response.
An officer eventually responded with a refusal to provide information claiming
31
that any views expressed would be the views of an individual and not the views
of the council as a whole. This seems a weak response, especially when the
questionnaire was pursuing factual information and not opinion, other than to
seek an opinion about the meaning of austerity. However, the most bizarre
response came from the Conservative Leader of a Unitary Council in the south of
England who said he was unable to respond “…because the questions are based
on false premises implying that “Austerity is a misnomer”. The entirety of this
response can be found in Chapter Four.
3.6. Research design
The research questions were based on the findings from the Literature Review
(Chapter Two) with the objective of determining whether a common pattern is
emerging as a result of how local authorities are reacting to austerity.
The research questions were therefore designed to:
o enable respondents to provide honest and unrestricted answers without
them being personally identified;
o reveal the impact of austerity from primary sources; and
o demonstrate how the empirical data gathered compares with the
literature on the topic of austerity;
by identifying:
o the issue, which is the erosion of public services;
o the problem, which is the impact of reduced public services on service
users; and
o the gap, which is how the withdrawal of some local services has affected
individuals e.g. psychologically.
The questionnaire included open and closed questions to provide both
qualitative and quantitative answers. The first question was open and qualitative
32
and invited respondents to define their perception of austerity. All but the first
and final question were closed and commenced with a ‘yes’ or ‘no’ question
followed by a blank space in which respondents could provide an example to
elaborate their ‘yes’/’no’ response if they so wished. These closed ‘yes’ and ‘no’
questions produced quantitative data whilst the more detailed responses
produced qualitative data.
A realist ontological approach has been deployed for this evidence-based
research with the purpose of understanding how local authorities have adapted
to austerity measures. The empiricist epistemological approach has identified
the social facts from which the triangulated data reveals how some local
authorities have dealt with austerity through a range of perspectives.
3.7. Benefits and validity of this research
The benefits of this research are that it has provided unbiased representative
views from respondents because the data has been derived from a primary
source e.g. service providers/practitioners. Through a comparison of theory and
practice this research has revealed a true and accurate picture of how local
authorities have adapted in response to budget cuts. It has also shown how
reduced services have led to staff redundancies and more poverty amongst
vulnerable communities. The literature (Chapter Two) identifies a gap in existing
research but, whilst it shows that austerity measures have impacted on peoples’
well-being, it does not provide comprehensive details. This current piece of
research however has somewhat filled this gap because it has drawn out more
liberal information about how individuals have been affected, which includes
local authority workers as well as service users.
It should be noted though that, whilst the research findings may not be beneficial
to those affected by austerity, it is hoped they can be utilised in a positive way
and help prove that austerity is not a panacea for the outcome of the global

33
financial crisis and that quality public services cannot be delivered adequately on
a low-budget.
34
CHAPTER FOUR
4. Introduction
This Chapter reiterates the objectives of the research and details the empirical
findings from the survey which was conducted via a questionnaire emailed to a
stratified sample of local authorities in England. This Chapter also details the council
types that were invited to respond to the survey, the democratic makeup of responding
councils and the proportion of politician/officer responses.
4.1. Objectives of the research
The objectives of this study are to discover the impact of austerity on local
authorities in terms of the quality of services they provide and how they have
adapted to doing more with less, in other words, can councils continue to deliver
the same quality of service on reduced budgets? In an attempt to answer this
question, the research questionnaire was compiled with the objective of
quantifying the findings from the literature on the topic of austerity. Subsequently,
this methodology resulted in the majority of responses being in parity with the
findings from the literature.
4.2. Empirical findings from the research
The findings from this research are presented below in the same order as the
questions contained within the questionnaire. A copy of the blank questionnaire
can be found at Appendix 2a and an example of a completed questionnaire can
be found at Appendix 2b. The first question was open and asked respondents to give their perception of
austerity, this question being particularly important since austerity is the focus of
the study. Further closed questions asked for a ‘yes’ or ‘no’ response followed
by an opportunity to expand further with examples to justify each response.

35
Therefore, these findings have provided both quantitative and qualitative answers
supported by anecdotal evidence.
4.3. Question 1: The definition of austerity; how do you perceive austerity and how would you define it?
All responses to “the definition of austerity” slightly differ although a common
theme has emerged which translates into austerity being another word for
‘reduced funding’ and a reduction in support from central government to local
government. Indeed, one senior officer at a large city council describes austerity
as being “harmful to services and the wellbeing of citizens”.
Respondents have associated austerity with the global financial crash of
2007/2008 and the recession that followed, linked to the Coalition and
Conservative governments that have been in power from 2010. One CEO
describes austerity as shorthand for the government’s drive to reduce the budget
deficit and deliver savings in public service delivery and, according to one Deputy
Leader, “…with little or no regard for the outcome”.
However, whilst he declined to respond to the questionnaire, the Conservative
Leader of a Unitary Council in the south of England argues that “Austerity is a
misnomer”. He asserts that “The Government is seeking to ensure the Country
lives within its means, an ambition I support. All sectors which receive public
subsidy need to contribute to that”. He explains how his Council’s net budget has
remained more or less unchanged over the last few years and infers that, unless
inflation is factored in, there has not been a spending cut. He says “It is the case
that there has been a reduction in Government Funding to councils on the one
side with council tax increases and income raising strategies on the other.
However, the biggest factor in budget pressures has been the huge increase in
demand for both children’s and adults social care. This statutory duty means that
there is less funding available for all other services”. So, whilst he declined to
complete the questionnaire, he has given an interesting response, even though
somewhat contradictory. Indeed, whilst it is extremely succinct, his response has
much in common with the research findings as detailed below.
36
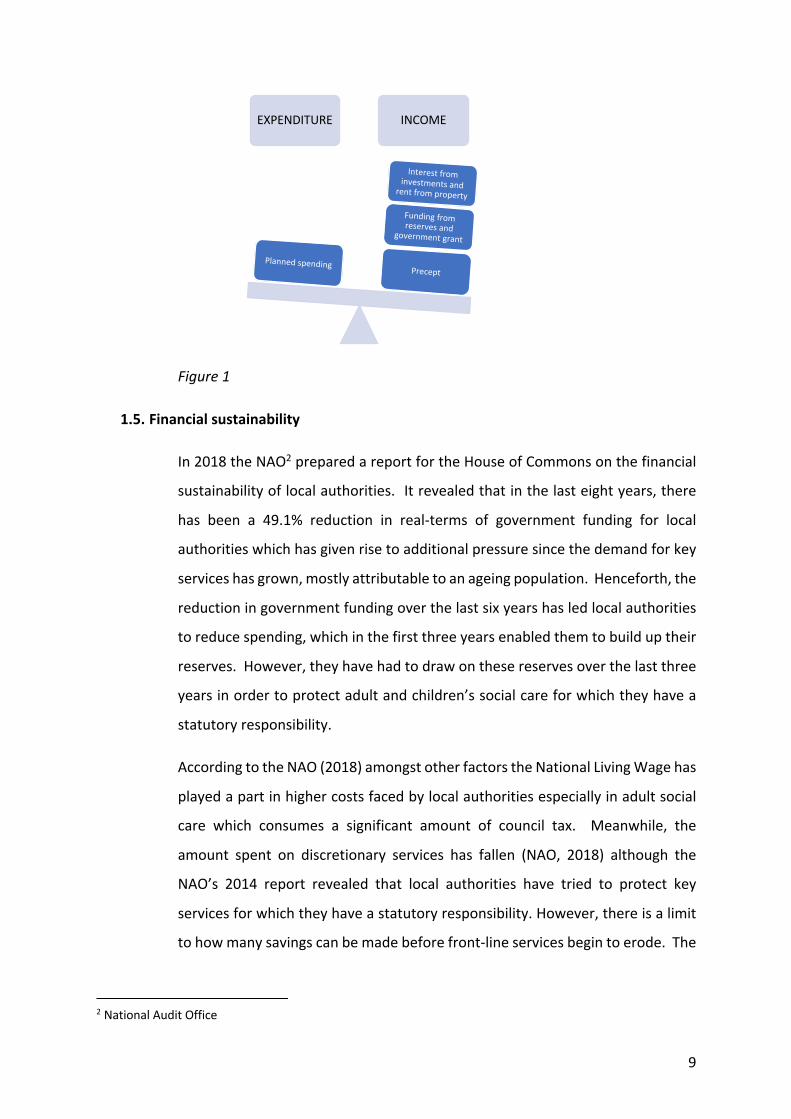
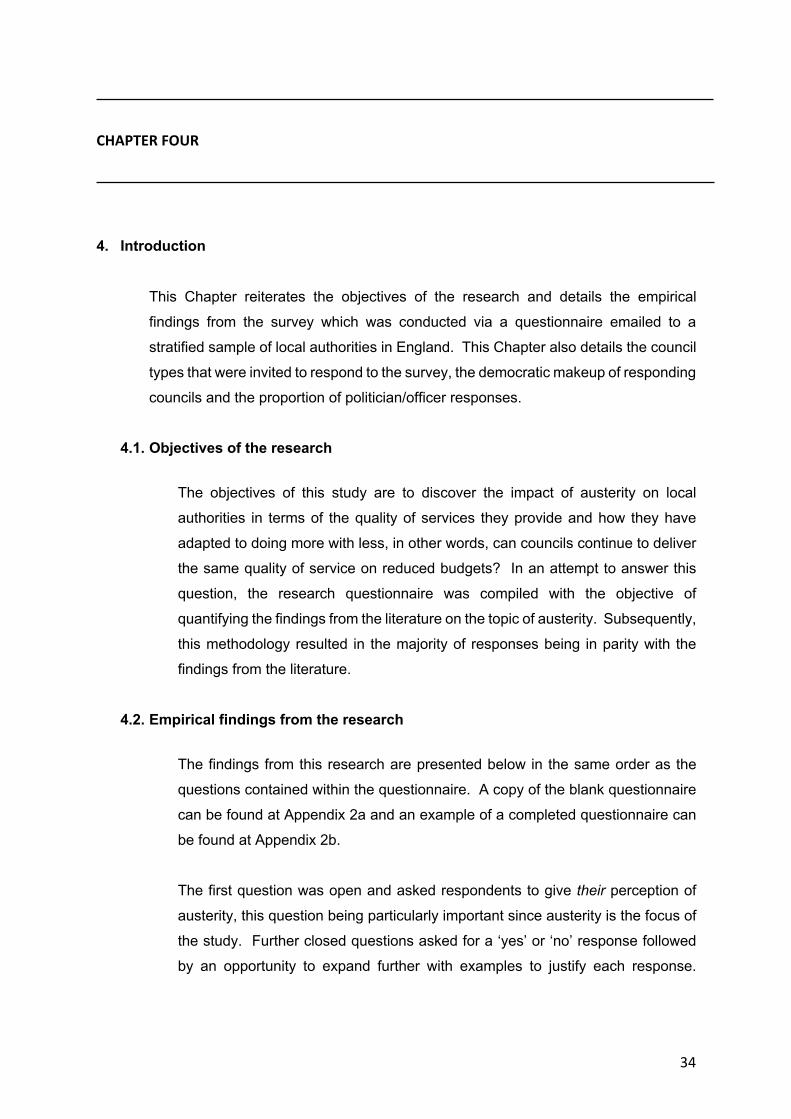
4.4. Question 2: What has been the Impact of Austerity on your council?
Respondents were asked whether the impact of austerity on their council has
been positive. Whilst the majority answered ‘no’ some answered both ‘no’ and
‘yes’ because they feel that austerity has led to some positive outcomes as well
as negative. 33% said that austerity has made a positive impact, 53% said
austerity has made a negative impact whilst 13% of respondents said that it had
been both positive and negative.
Figure 1
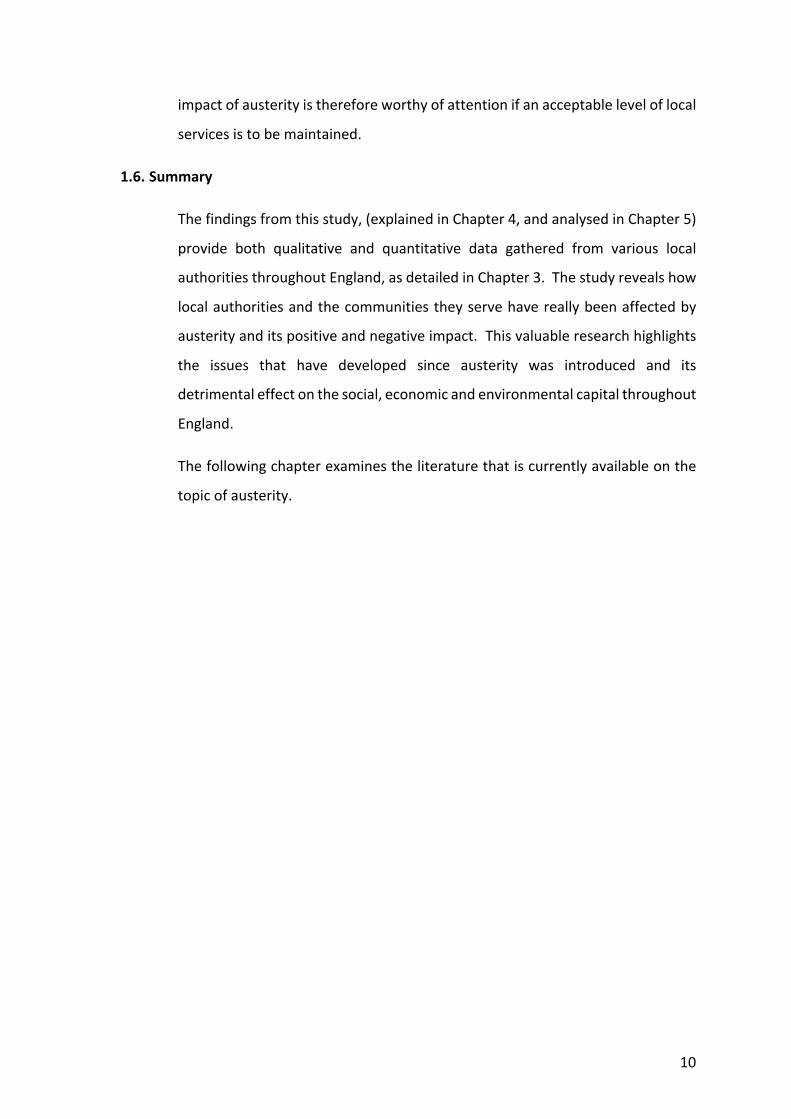
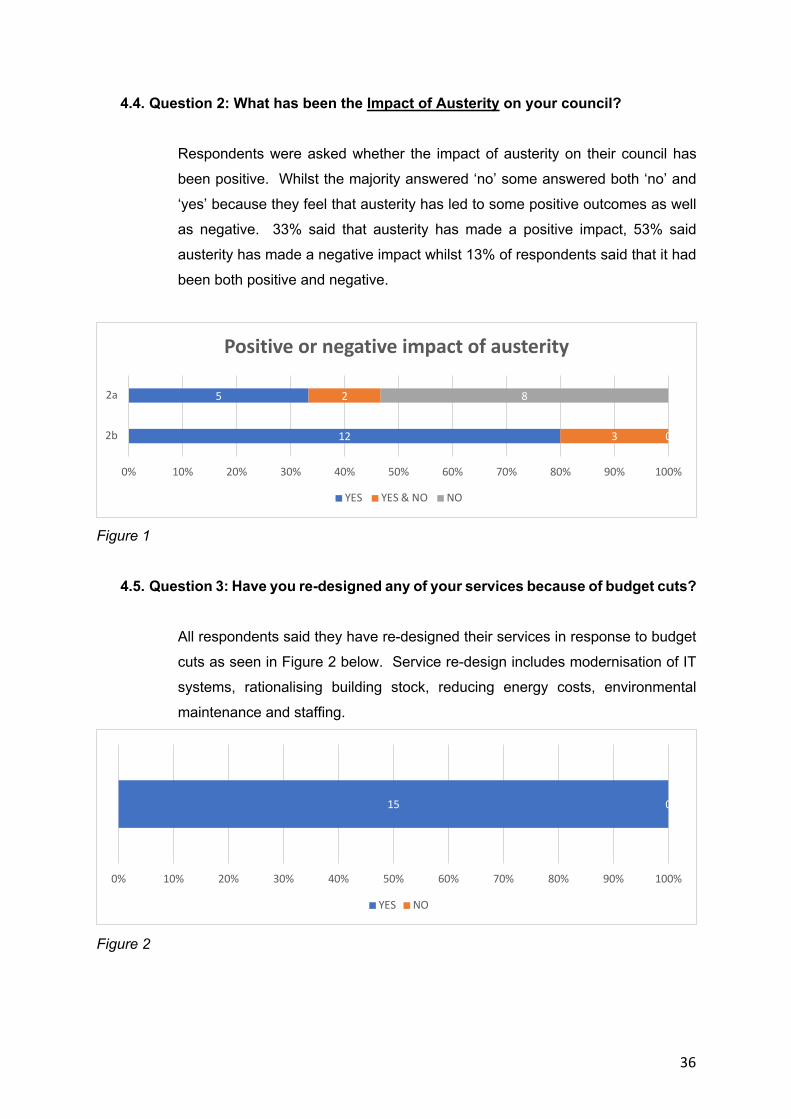
4.5. Question 3: Have you re-designed any of your services because of budget cuts?
All respondents said they have re-designed their services in response to budget
cuts as seen in Figure 2 below. Service re-design includes modernisation of IT
systems, rationalising building stock, reducing energy costs, environmental
maintenance and staffing.
Figure 2
12
5
3
2
0
8
0% 10% 20% 30% 40% 50% 60% 70% 80% 90% 100%
2b
2a
Positive or negative impact of austerity
YES YES & NO NO
15 0
0% 10% 20% 30% 40% 50% 60% 70% 80% 90% 100%
YES NO
37
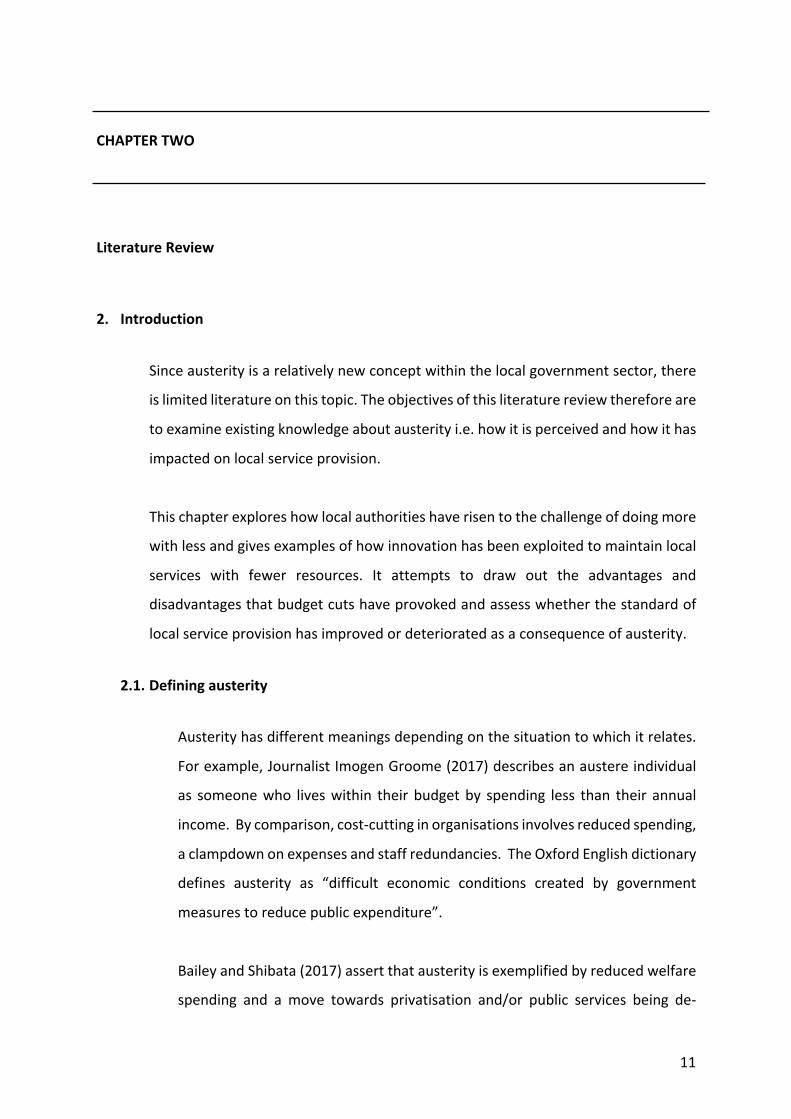
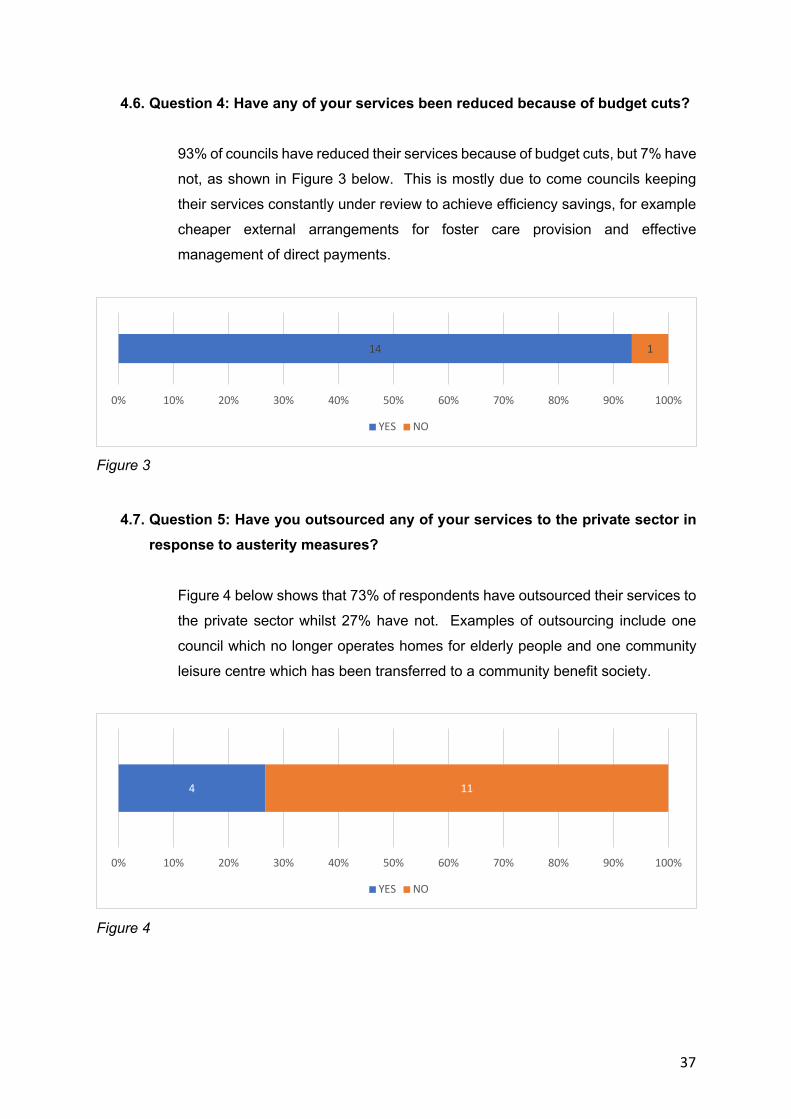
4.6. Question 4: Have any of your services been reduced because of budget cuts?
93% of councils have reduced their services because of budget cuts, but 7% have
not, as shown in Figure 3 below. This is mostly due to come councils keeping
their services constantly under review to achieve efficiency savings, for example
cheaper external arrangements for foster care provision and effective
management of direct payments.
Figure 3
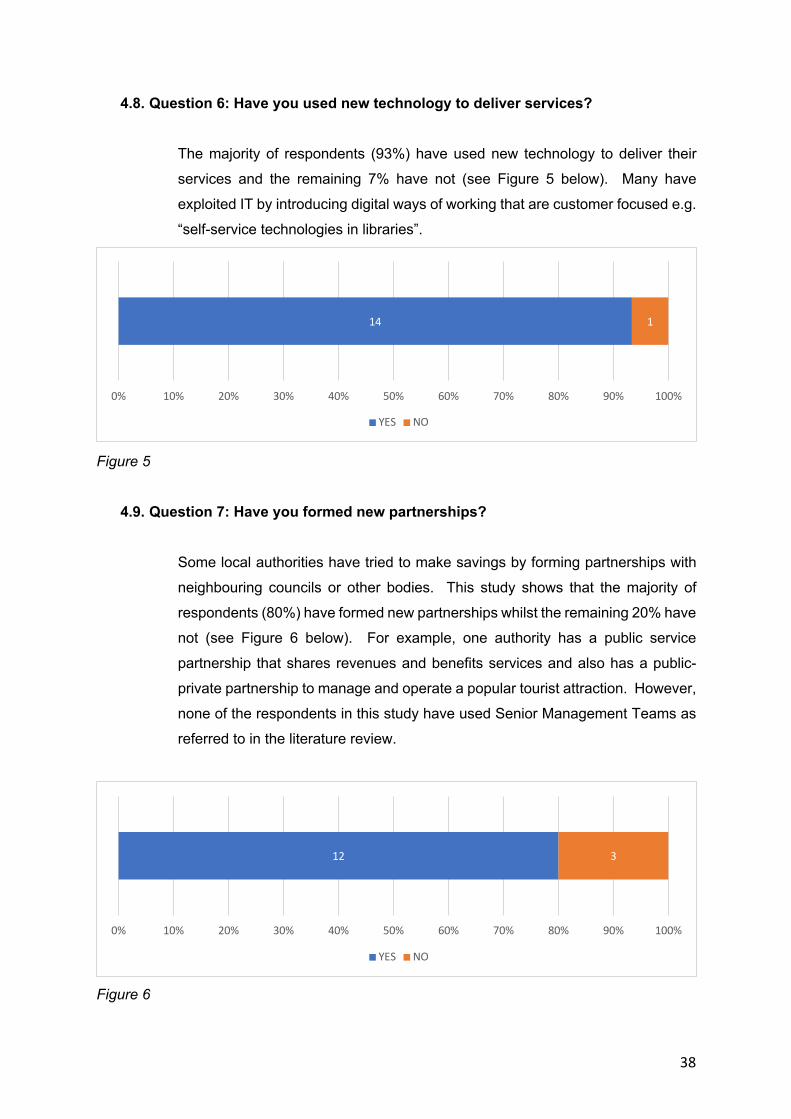
4.7. Question 5: Have you outsourced any of your services to the private sector in response to austerity measures?
Figure 4 below shows that 73% of respondents have outsourced their services to
the private sector whilst 27% have not. Examples of outsourcing include one
council which no longer operates homes for elderly people and one community
leisure centre which has been transferred to a community benefit society.
Figure 4
14 1
0% 10% 20% 30% 40% 50% 60% 70% 80% 90% 100%
YES NO
4 11
0% 10% 20% 30% 40% 50% 60% 70% 80% 90% 100%
YES NO
38
4.8. Question 6: Have you used new technology to deliver services?
The majority of respondents (93%) have used new technology to deliver their
services and the remaining 7% have not (see Figure 5 below). Many have
exploited IT by introducing digital ways of working that are customer focused e.g.
“self-service technologies in libraries”.
Figure 5
4.9. Question 7: Have you formed new partnerships?
Some local authorities have tried to make savings by forming partnerships with
neighbouring councils or other bodies. This study shows that the majority of
respondents (80%) have formed new partnerships whilst the remaining 20% have
not (see Figure 6 below). For example, one authority has a public service
partnership that shares revenues and benefits services and also has a public-
private partnership to manage and operate a popular tourist attraction. However,
none of the respondents in this study have used Senior Management Teams as
referred to in the literature review.
Figure 6
14 1
0% 10% 20% 30% 40% 50% 60% 70% 80% 90% 100%
YES NO
12 3
0% 10% 20% 30% 40% 50% 60% 70% 80% 90% 100%
YES NO
39
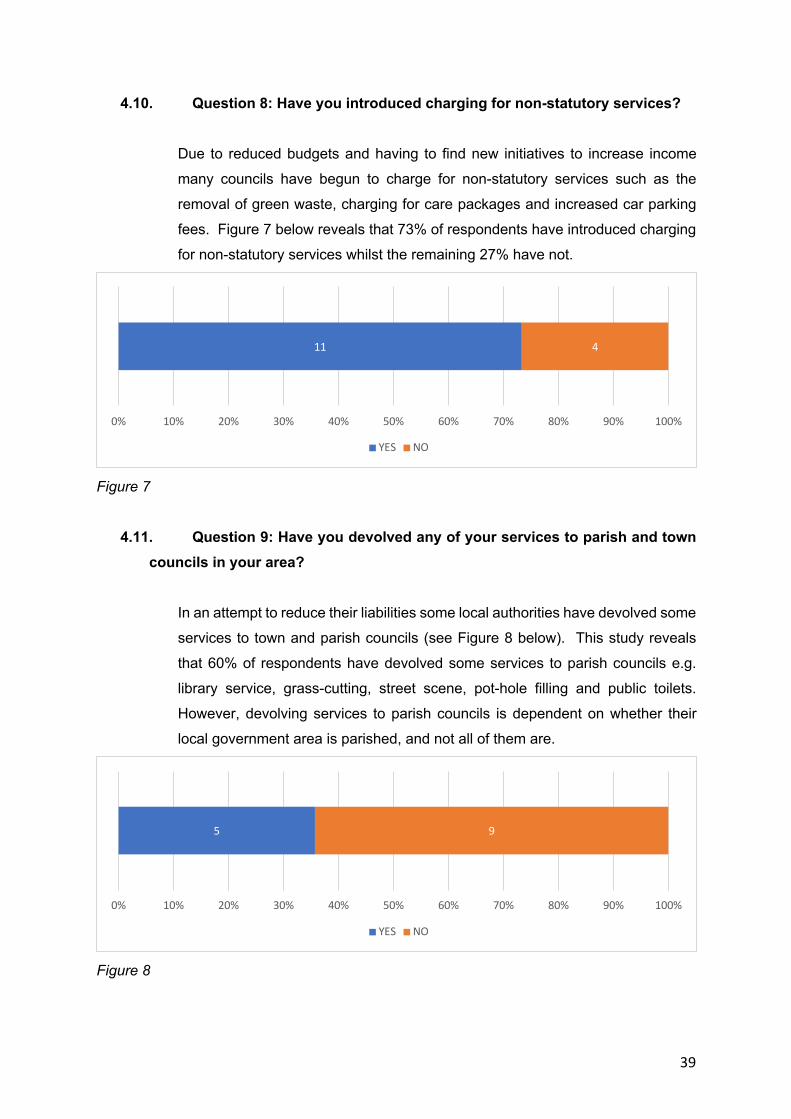
4.10. Question 8: Have you introduced charging for non-statutory services?
Due to reduced budgets and having to find new initiatives to increase income
many councils have begun to charge for non-statutory services such as the
removal of green waste, charging for care packages and increased car parking
fees. Figure 7 below reveals that 73% of respondents have introduced charging
for non-statutory services whilst the remaining 27% have not.
Figure 7
4.11. Question 9: Have you devolved any of your services to parish and town councils in your area?
In an attempt to reduce their liabilities some local authorities have devolved some
services to town and parish councils (see Figure 8 below). This study reveals
that 60% of respondents have devolved some services to parish councils e.g.
library service, grass-cutting, street scene, pot-hole filling and public toilets.
However, devolving services to parish councils is dependent on whether their
local government area is parished, and not all of them are.
Figure 8
11 4
0% 10% 20% 30% 40% 50% 60% 70% 80% 90% 100%
YES NO
5 9
0% 10% 20% 30% 40% 50% 60% 70% 80% 90% 100%
YES NO
40
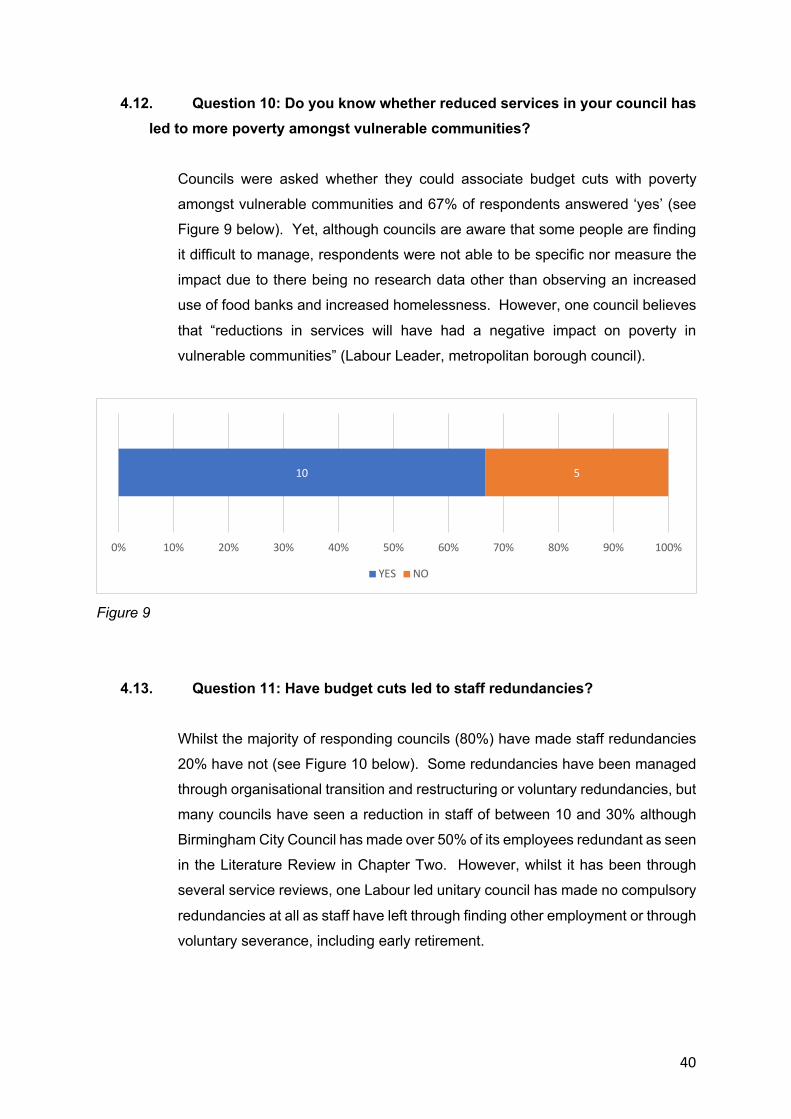
4.12. Question 10: Do you know whether reduced services in your council has led to more poverty amongst vulnerable communities?
Councils were asked whether they could associate budget cuts with poverty
amongst vulnerable communities and 67% of respondents answered ‘yes’ (see
Figure 9 below). Yet, although councils are aware that some people are finding
it difficult to manage, respondents were not able to be specific nor measure the
impact due to there being no research data other than observing an increased
use of food banks and increased homelessness. However, one council believes
that “reductions in services will have had a negative impact on poverty in
vulnerable communities” (Labour Leader, metropolitan borough council).
Figure 9
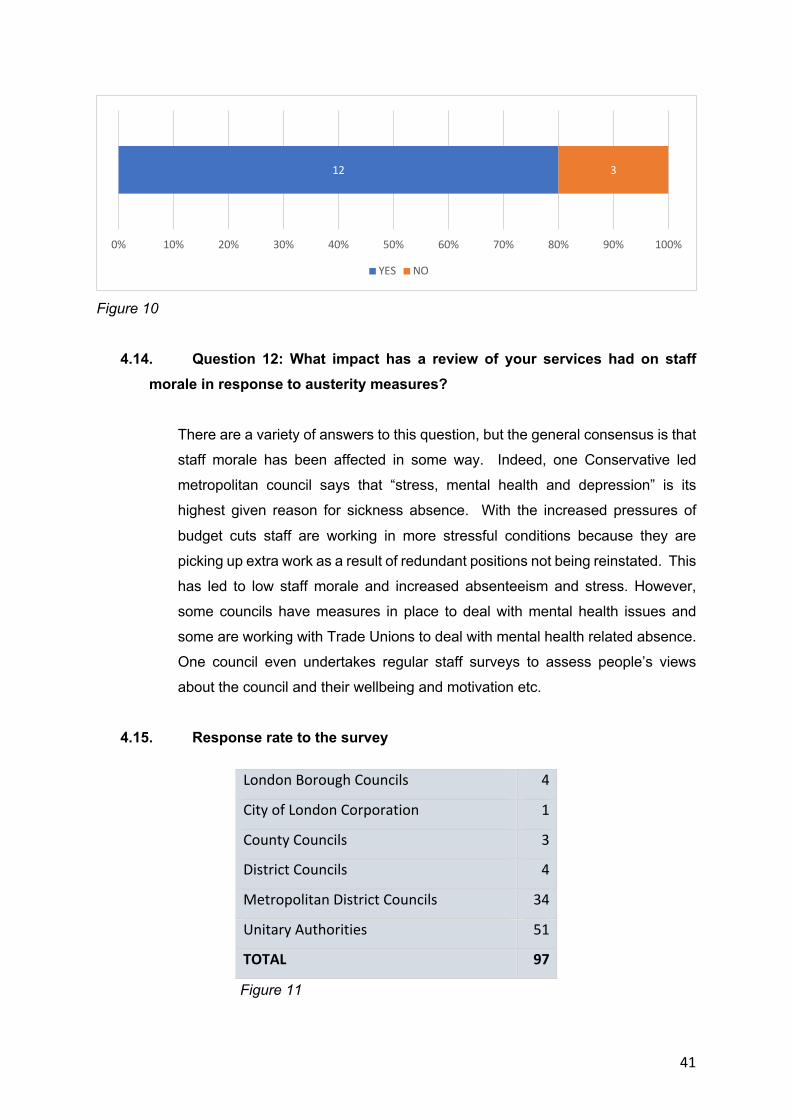
4.13. Question 11: Have budget cuts led to staff redundancies?
Whilst the majority of responding councils (80%) have made staff redundancies
20% have not (see Figure 10 below). Some redundancies have been managed
through organisational transition and restructuring or voluntary redundancies, but
many councils have seen a reduction in staff of between 10 and 30% although
Birmingham City Council has made over 50% of its employees redundant as seen
in the Literature Review in Chapter Two. However, whilst it has been through
several service reviews, one Labour led unitary council has made no compulsory
redundancies at all as staff have left through finding other employment or through
voluntary severance, including early retirement.
10 5
0% 10% 20% 30% 40% 50% 60% 70% 80% 90% 100%
YES NO
41
Figure 10
4.14. Question 12: What impact has a review of your services had on staff morale in response to austerity measures?
There are a variety of answers to this question, but the general consensus is that
staff morale has been affected in some way. Indeed, one Conservative led
metropolitan council says that “stress, mental health and depression” is its
highest given reason for sickness absence. With the increased pressures of
budget cuts staff are working in more stressful conditions because they are
picking up extra work as a result of redundant positions not being reinstated. This
has led to low staff morale and increased absenteeism and stress. However,
some councils have measures in place to deal with mental health issues and
some are working with Trade Unions to deal with mental health related absence.
One council even undertakes regular staff surveys to assess people’s views
about the council and their wellbeing and motivation etc.
4.15. Response rate to the survey
Figure 11
12 3
0% 10% 20% 30% 40% 50% 60% 70% 80% 90% 100%
YES NO
London Borough Councils 4
City of London Corporation 1
County Councils 3
District Councils 4
Metropolitan District Councils 34
Unitary Authorities 51
TOTAL 97
42
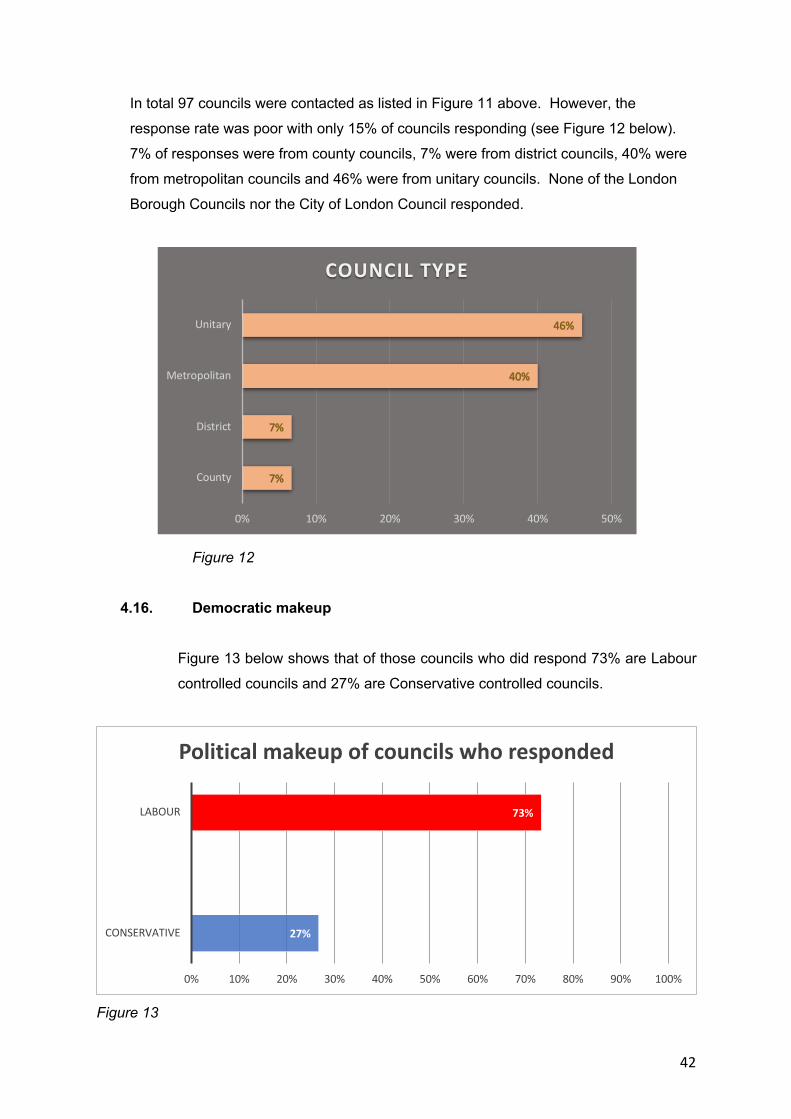
In total 97 councils were contacted as listed in Figure 11 above. However, the
response rate was poor with only 15% of councils responding (see Figure 12 below).
7% of responses were from county councils, 7% were from district councils, 40% were
from metropolitan councils and 46% were from unitary councils. None of the London
Borough Councils nor the City of London Council responded.
Figure 12
4.16. Democratic makeup
Figure 13 below shows that of those councils who did respond 73% are Labour
controlled councils and 27% are Conservative controlled councils.
Figure 13
27%
73%
0% 10% 20% 30% 40% 50% 60% 70% 80% 90% 100%
CONSERVATIVE
LABOUR
Political makeup of councils who responded
7%
7%
40%
46%
0% 10% 20% 30% 40% 50%
County
District
Metropolitan
Unitary
COUNCIL TYPE
43
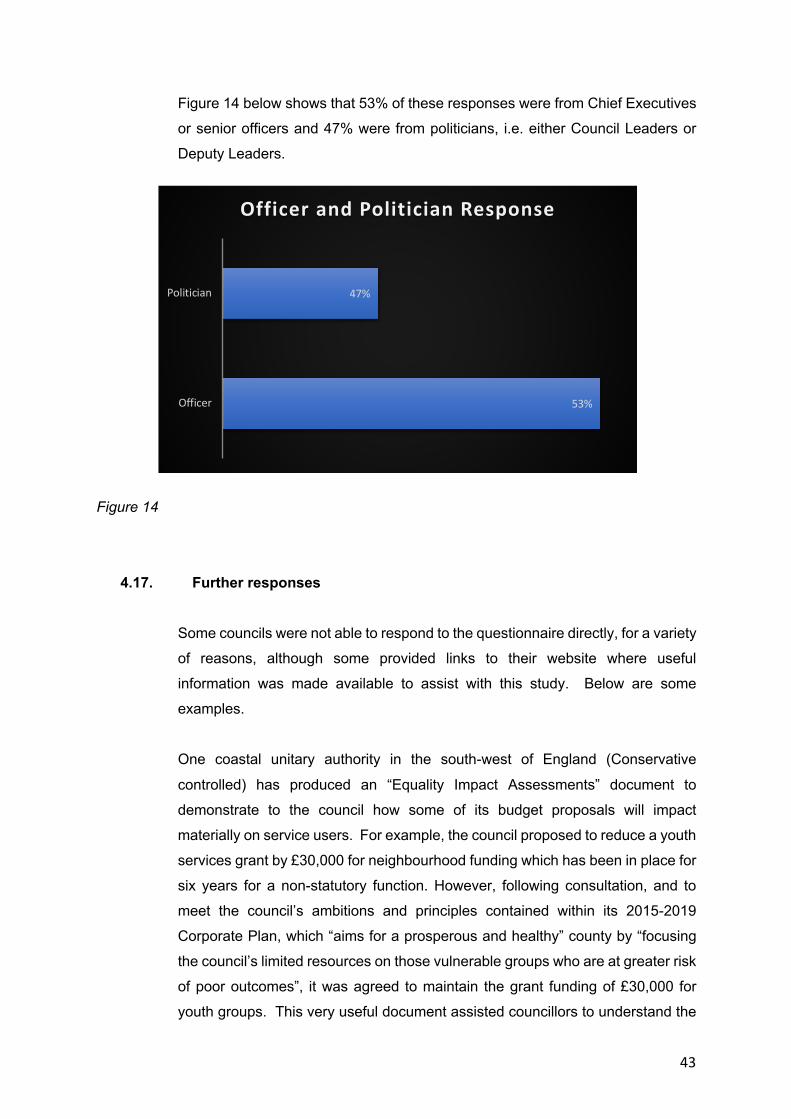
Figure 14 below shows that 53% of these responses were from Chief Executives
or senior officers and 47% were from politicians, i.e. either Council Leaders or
Deputy Leaders.
Figure 14
4.17. Further responses
Some councils were not able to respond to the questionnaire directly, for a variety
of reasons, although some provided links to their website where useful
information was made available to assist with this study. Below are some
examples.
One coastal unitary authority in the south-west of England (Conservative
controlled) has produced an “Equality Impact Assessments” document to
demonstrate to the council how some of its budget proposals will impact
materially on service users. For example, the council proposed to reduce a youth
services grant by £30,000 for neighbourhood funding which has been in place for
six years for a non-statutory function. However, following consultation, and to
meet the council’s ambitions and principles contained within its 2015-2019
Corporate Plan, which “aims for a prosperous and healthy” county by “focusing
the council’s limited resources on those vulnerable groups who are at greater risk
of poor outcomes”, it was agreed to maintain the grant funding of £30,000 for
youth groups. This very useful document assisted councillors to understand the
53%
47%
Officer
Politician
Officer and Politician Response
44
impact of budget cuts on a range of services the council has supported, such as
“Adult Substance Misuse Services” and “Citizens Advice Bureau” to ensure,
where possible, negative impacts are “eliminated, minimised or counter balanced
by other measures” (“Equality Impact Assessments”, Torbay Council, 2018).
In its 2018/2019 budget report Reading Borough Council, a unitary authority in
Berkshire (Labour controlled), informed councillors that the Council needs an
additional £43.2m if it is to deliver current services in 2020/21. In order to bridge
this gap savings proposals of £7.3m in 2018/19, £8.3m in 2019/20 and £7.7m in
2020/21 have been approved. The main financial challenges are in part due to
the costs of Children’s and Adults Services, the provision of pay awards and
increments, contract inflation, capital financing costs and, savings that can no
longer be delivered, which includes redefining some staff terms and conditions
(Report by Director of Finance, Reading Borough Council, 2018).
4.18. Summary
These findings clearly indicate that, irrespective of political makeup, all councils
who have contributed to this study are being financially challenged. Whilst each
interpretation of austerity varies all respondents have implied that it is the result
of government intervention resulting in reduced local authority funding. To quote
one policy officer at a large Labour led city council, “I agree with the following
definition from the Collins dictionary - difficult economic conditions created by
government measures to reduce a budget deficit, especially by reducing public
expenditure - it is perceived as harmful to services and the wellbeing of citizens.”
The next chapter analyses and discusses the survey results in more detail.
45
CHAPTER FIVE
5. Analysis and Discussion
5.1. Introduction
The objective of this study is to examine “The Impact of Austerity on Local
Authorities in England” and, having based the research questionnaire on the
findings from the Literature Review covered in Chapter 2, this chapter shows
there is parity with the literature to date. Indeed, the findings from the
Literature Review highlights that austerity has led to innovation and that local
authorities have adapted to doing more with less. However, they have had to
make hard choices about which services can be maintained and this has led to a
reduction or loss of some services.
This chapter interprets the findings from the study and compares them with the
research title. It demonstrates there is a commonality in each respondent’s
interpretation of austerity from which a collective theme has emerged; austerity
and its consequences are the fault of government wanting to reduce public
expenditure in the delivery of local public services. Not only does this chapter
analyse the impact of austerity on local authorities it also provides practical
examples of how the empirical findings compare with the findings from the
Literature Review and whether the research objectives have been met.
5.2. The definition of austerity
Respondents were first asked to define how they perceive austerity since the
term has different meanings to different people. The Finance Officer at a Labour
controlled city council says austerity “reflects the Government’s efforts to re-
46
balance the national financial position [which] includes reduction of funding
across a wide range of public services including local government”.
The Labour Leader of a metropolitan borough council associates austerity “with
the policies of the Coalition and Conservative governments that have been in
place since 2010 and this accords with Ferry, Coombs and Eckersley (2017) who
refer to the Conservative Leader, David Cameron announcing that the UK had
reached an ‘Age of Austerity’ in 2009 and that the coalition government18 would
cut the UK’s deficit through an austerity programme that would include major
public spending reductions. A senior policy officer at a Labour unitary authority
also agrees that austerity has “become particularly associated with the policies
of the Coalition and Conservative governments that have been in place since
2010”. Since spending cuts have continued because they are the common
context of the Conservatives, Lowndes and Gardner (2016) have now labelled
this ethos as ‘super-austerity’.
Austerity is described by one Labour Leader of a unitary authority as being
introduced “to undermine UK economic activity for the longer term, as the
Government gambled on the private sector growing as the public sector
reduced” Indeed, Bailey and Shibata (2017) also associate austerity with a move
towards privatisation and/or public services being de-democratised through
reduced public spending.
It is apparent from the literature and the responses from practitioners that
austerity is clearly linked with the Coalition and Conservative government’s
actions to reduce public spending. There now follows a practical comparison
between the literature and the research.
18 Conservatives and Liberal Democrats coalition government
47
5.3. The impact of austerity – positive or negative?
Positive - The 2010 Spending Review was not just to cut budgets but to foster
innovation (Lowndes and Pratchett, 2012). This study shows that, to some
extent, local authorities have responded constructively to austerity and have
seen it as having made a positive impact because it has encouraged them to
examine the way they provide local services and urged them to become more
efficient and innovative. As the Chief Executive of one Labour led city council
says, “…there has been a great deal of innovation promoted by austerity”. This
is supported by a senior officer at another unitary Labour led council where the
council has worked “…in partnership with neighbouring councils, invested in
more evidence-based programmes, …[and] early prevention to reduce cost
demand for failure, and worked in partnership with other public sector
partners”. This, he believes, has “…resulted in improved services for residents,
and the better provision of both outcomes and value for money…driven
somewhat, by necessity”. Another senior officer at a Labour led unitary authority
agrees that “the drive to save money has certainly had a positive impact in terms
of increasing efficiencies and cutting waste in some processes…and forces us to
think more creatively about how to achieve outcomes for the public sector
through greater partnership working and closer working with communities”. The
CEO of a Conservative controlled rural unitary authority says the positive impact
of austerity “has caused us to re-invent our organisation – think anew, to
innovate, to refresh and change in many areas that have benefited. So, for
example we have reduced our offices by around 50% and moved to a much more
digitally based organisation that works mobile/agile – much less emphasis on
going to a place of work every day, and more focussed on getting the work
done/outputs, wherever you do your work. In a huge county, the geographic size
of greater London, this saves a lot of wasted travel time for employees, which
can be good for employees and employer alike.” The positive impact of austerity
is further supported by the Deputy Leader of a Conservative led unitary authority
who says that “…austerity has focussed us to review all our service delivery,
accelerated use of technology and hastened our transformation programme”,
48
and the Labour Leader of a metropolitan borough council says “The drive to save
money has certainly had a positive impact in terms of increasing efficiencies and
cutting waste in some processes. It has also forced us to think more creatively
about how to achieve outcomes for the public through greater partnership
working and closer working with communities”.
Negative - Whilst austerity has resulted in positive outcomes the majority of
respondents see austerity has being responsible for some significant negative
outcomes. For example, councils have been forced to seek efficiency savings
which “…have not proved sufficient to balance local authority budgets, so service
reductions have been required. The Council has “made savings of £178m since
2010, £97m of which are efficiency savings and £20m from increased income,
but £61m relate to service reductions and the Council needs to make additional
savings of around £50m by 2021/22” (Conservative led metropolitan council).
One Labour unitary council has re-commissioned services for lesser cost, altered
eligibility levels to access services, increased fees and charges for services and
increased council tax for residents “which are bound to have impacted on a
number of residents’ quality of life” (Senior officer).
These are just a few examples that demonstrate how local authorities have
responded to austerity and, in their words, have been forced to address.
5.4. Service re-design
Over a 5-year period between 2011 and 2016 a case study of three local
authorities was carried out by Hastings et al. (2015) to determine how each had
managed austerity. It revealed that, whilst efficiencies had been made, they had
led to reduced services brought about by corporate re-structuring and
substantial staff reductions. Subsequently, whilst services were retained, they
were more diluted, and the councils began to use other agencies and citizens to
maintain appropriate service levels. This research revealed that these local
authorities had eventually reached a point where efficiency was not sufficient,
49
and they had to resort to cost-cutting measures in order to close gaps in their
budgets (ibid.).
This study too reveals that councils have re-designed their services to enable
them to deliver public services within their budget. For example, one
Conservative metropolitan council has expanded internal foster care provision
through cheaper external arrangements, converted street lighting to LEDs and
switched off or dimmed some lights, reviewed waste disposal and all ‘back office’
functions as well as modernising IT systems, rationalising building stock, reduced
energy costs and carbon footprint, and its outlook has become more commercial
(Finance Officer). One Labour city council has “re-modelled community based
social work to an assets-based approach and taken a new approach to the
provision of day opportunities services for people with learning disabilities, re-
designed the early years provision, rationalised children’s centres focusing on
areas of greatest need” (Policy Officer). These are typical examples of efficiency
savings within both Conservative and Labour councils.
Some councils have made better use of IT through greater use of online services.
Indeed, one unitary Conservative council has almost every employee digitally
connected which enables more frequent communication as well as residents
having 24/7 access through the council’s investment in superfast broadband
across the [rural] county (CEO).
In order to make savings one council has reduced its number of buildings and
officers, increased its use of technology and is trying to deliver adult and
children’s social care for less money through a different structure or alongside
partners on the NHS (Labour Deputy Leader, metropolitan district council).
5.5. Reduced services
All local authorities are at risk of not being able to maintain local services with
some services at risk of disappearing altogether (Hastings et al., 2015). For
50
example, between 2011 and 2019 “Blackpool Council [Labour controlled] will
have cut £143m from its recurrent budget” and “whilst statutory services are
being maintained these cuts have resulted in lower standards of services and
indeed some withdrawals of non-statutory services” (Senior Officer). The Labour
Leader of one unitary authority says “The majority of services have now been
reduced to the point where they only just meet the Council’s statutory
obligations and cannot adequately provide many of the non-statutory services
which residents consider essential. There is also a lack of robustness and
resilience in many key services areas, due to staffing and other resources being
reduced to such an extent.”
“Service reductions have impacted on most services. Some examples include
changing the eligibility criteria for Adult Social Care (statutory), reduction in
grants to local groups, reduction in highways maintenance expenditure
(statutory) and review of special education needs transport policy (statutory)”
(Finance Officer, Conservative metropolitan council). “Often formerly free-to-
use environmental services have either been reduced in frequency or scale, for
example cutting grass less often or having an alternate weekly black/recycling
bin collection. Other formerly free services have become charged-for such as
bulky waste collections. The limits of reductions of statutory services while still
meeting obligations to residents have been the subject of recent court cases
including libraries in Northamptonshire” (Deputy Leader, Labour metropolitan
district council). One Labour led city council has “reduced neighbourhood advice
and information centres from X to 2, cut supporting people programme…and
grants to voluntary sector organisations, reduced day services for people with
disabilities, closed 8-day centres…and drastically reduced back office
functions…and customer services support staff” (Policy Officer).
Only one respondent from a Conservative led unitary authority said, “No services
have been cut as yet and statutory services will be protected” (Deputy Leader).
51
Growing financial pressures have forced many councils to reduce their services
and the escalating costs and demand for adult social care and children’s services
is becoming increasingly challenging for local authorities to maintain at an
acceptable level. Unfortunately, the government’s funding settlement fails to
recognise these pressures (PSE, January 2018).
5.6. Outsourcing of services to the private sector
Not many respondents have outsourced any of their services to the private
sector. In fact, one unitary authority has “brought services back ‘in-house’ as a
result” (Conservative Deputy Leader). However, one Labour city council has
transferred “community leisure centres and some elements of the health and
wellbeing service to a community benefit society” and another Conservative led
unitary authority now has its leisure pool, sports centre, and golf course run by
a private company on a 10-year SLA19. One reason for outsourcing is due to
insufficient funds which resulted in the need to “recruit to some key roles e.g.
quantity surveyors, legal services” (CEO Conservative led unitary authority).
One Labour led unitary council has not outsourced any of its services although it
has transferred some services “to wholly-owned companies of the council”
(Director of Resources).
These examples demonstrate some parity with research carried out by Bello et
al. (2018) in 2017 which revealed that “Conservative councils prefer to outsource
and share services” whilst “Labour councils prefer to have more control and
more insourcing activities”.
However, according to Marrs (2012) outsourcing of services has made little
difference in cost savings. Furthermore, outsourcing often means that agency
19 Service Level Agreement
52
staff are unfamiliar with council procedures and this can lead to a fall in
standards (ibid.).
5.7. Use of new technology to deliver services
Digital technology has helped to reduce costs especially for customer contact
(Lowndes and Gardner, 2016). Indeed, councils have moved from face-to-face
contact to web-based communication which has huge cost saving advantages.
For example, in one Labour led city council “…far greater use is being made of
mobile hand-held devices and monitoring systems for vulnerable people”
(Finance Officer) and another Labour led unitary authority has too introduced
“tablet devices for social workers to access information and complete
assessments whilst with service-users”. The council has also “introduced a
citizen’s account online, with a focus on app technology, for which many
customer enquiries are now serviced at first point contact”. The council is now
“investigating the opportunities of artificial intelligence” (Senior Officer) as is
another metropolitan borough council (Labour Leader).
One Labour led unitary council has used “new systems and telemedicine” which
allows the council to do more with the same resource especially “in demand-
growing areas” (Director of Resources) whilst another council has introduced
Telecare digital information which is a channel shift from visits to telephone to
online (Leader, Labour city council).
One Conservative unitary authority has self-service libraries, and quite a few
respondents now have a range of services that customers can access online e.g.
council tax and housing benefits. One unitary council has “one-stop-shops and
call centre [which] utilise a CRM system that enables operators to directly access
and update many of the Council’s ICT systems in order to assist customers
immediately rather than re-directing them to other parts of the Council” (Labour
Leader). New technology has also been used “…in residents’ homes to
53
communicate with [us] if they are unwell or not moving around” (CEO,
Conservative unitary authority).
5.8. Formation of new partnerships
Some local authorities have begun to share back-office services including HR and
legal services, environmental services and highways functions (Lowndes and
Gardner, 2016). Some councils have introduced SMTs20 to build resilience,
reduce management costs and enable the sharing of wider expertise. However,
the formation of SMTs produced fairly modest savings which, in some cases, led
to redundancies following restructuring and left councils struggling due to
reduced resources (Bello et al., 2018).
Whilst none of the respondents have introduced SMTs many local authorities
have formed partnerships of some sort. For example, “East Midlands Shared
Services was created in 2012” which is “a partnership with Nottingham City
Council to provide transaction finance and HR services (including payroll)”. This
Conservative led metropolitan council has been part of the Leicester and
Leicestershire business rates Pool, along with the 7 districts councils, Leicester
City Council and the Fire authority since 2013/14 (Senior Officer). However,
whilst partnership working has led to some cost savings, one Conservative led
unitary authority found that typically, there would be more on-cost involved than
cost savings when Worcestershire and Gloucestershire explored jointly
delivering superfast broadband and energy from waste. This was due to the
geography and distances involved (CEO).
One Labour led unitary authority is “forming new partnerships at all levels,
through a more greater [sic] focus on partnership working, from regional or large
agencies to the voluntary sector…driven by the needs of the communities”. The
council has not shared SMTs “other than in closer integration with CCGs” (Senior
20 Senior Management Teams
54
Officer). Other councils have joined up services with neighbouring councils
and/or other agencies e.g. “adoption services, highway maintenance and mental
health services” (Labour Leader, unitary authority).
5.9. Charging for non-statutory services
Because budget cuts have led to less available income for councils to spend some
have begun to increase their income by charging for services which have
previously been free e.g. green waste collection or increasing pre-existing
charges such as car parking (Hastings et al., 2015). Indeed, one council has
looked across the board at “raising income from allotments through to higher car
parking income” (CEO, Labour led city council).
Nearly all respondents have begun to charge for green waste, as Hastings et al.
(2015) have found. Other charges introduced include bulky waste, with one
Labour led city council charging for care packages in certain cases (Policy Officer).
Again, in parity with Hastings et al’s. (2015) findings many councils have
increased charges for highways permits, planning applications/monitoring, car
parking, registry office fees and permits for waste disposal. One council has
“introduced charging for access to some facilities, e.g. maintained woodland park
for walks” (CEO, Conservative led unitary authority).
5.10. Devolution of services to parish and town councils
As well as local authorities there are also 10,000 parish and town councils in
England who also provide public services (NALC, 2018). They share a wide range
of powers with local authorities and often work in partnership together to deliver
local services (Pearce & Ellwood, 2002). For example, austerity has meant that
the retention of libraries has come under threat but, as it is a statutory duty for
local authorities to “…provide a comprehensive and efficient library service for
55
all persons desiring to make use thereof…”21, many local authorities have
overcome this by either devolving library management to parish councils22,
maintaining services with the help of volunteers, or with some automation.
Indeed, the library in Sutton Coldfield has been devolved to the Town Council as
well as the Town Hall (Senior Officer, Labour led city council). Other services that
have been devolved to parish and town councils include community centres,
grass-cutting, pot-hole filling, street scene, and play parks. However, whilst one
of the respondents has not devolved any services it is “looking to divest valley
parks to a Wildlife Trust, not to save money but to enable investment that we
cannot make” (CEO, Labour led city council).
In contrast, although one council is located in an area where there are no parish
and town councils it is “working with an organisation around public sector
estate and reform” (Labour Leader, city council).
5.11. Have reduced services led to more poverty amongst vulnerable
communities?
Disadvantaged areas have been affected the most especially in areas that are
increasingly dependent on income derived from local business rates (Lowndes
and Gardner, 2016). Furthermore, government cuts have had a disproportionate
impact on the most deprived areas often due to socio-demographic changes such
as an ageing population (Hastings et al., 2015). This puts added pressure on local
authority budgets since adult social care and children’s services are statutory
duties.
It is expected that government funding cuts will result in reduced key services
and more poverty amongst vulnerable communities (Lowndes and Pratchett,
2012). Indeed, the CEO of a Labour led city council agrees stating that increased
poverty has been brought about by the introduction of universal credit and not
21 Public Libraries and Museums Act 1964, Section 7(1)(2) and Local Government Act 1972, Section 206 22 Local Government Act 1972, Section 101
56
helped by a “rent deficit projected to rise from 1% of rent roll to 4% over” the
next 2 years. “Visibly more vulnerable and needy people are presenting
themselves”. Another council says that whilst it has “no research or data that
has examined cause and effect…child poverty has gone up in the city; there is a
huge increase in homelessness, rough sleeping and knife crime. We have had to
reduce many preventative services which may have impacted on poverty” but
this needs further research (Policy Officer, Labour led city council).
One respondent said it is difficult to read whether austerity has led to increased
poverty. The council does not “measure this directly – partly because the cost of
such work is prohibitive” however, “accessing foodbanks is high and access to
external 3rd sector support is high” (CEO, Conservative unitary authority).
Another council said the “common view is that reductions in services will have
had a negative impact on poverty in vulnerable communities. We work in a
district that has received one of the highest proportions of cuts in funding from
central government because of our demographics” (Senior Officer, Labour led
unitary authority).
One council did confirm that it has “seen an increase in poverty in the city…
although it is not clear whether it is [due to] a reduction in council services or
broader public policy changes, such as the benefits system” (Deputy Leader,
Labour metropolitan district council). However, another council said that it
monitored a range of indicators and that the “effect on vulnerable communities
is more affected by national policies rather than an effect of local initiatives or
reductions e.g. universal credit” (Conservative Deputy Leader, unitary authority).
“The demand for Adult Social Care and Children’s Social Care has increased
significantly since 2010 and continues to increase annually which is linked to
increased levels of poverty within the borough due to reduction in welfare
benefits and lack of resources available to the council to provide preventative
services” (Labour Leader, unitary authority). However, whilst some councils
57
have indicated that there is increased poverty within their jurisdiction, they have
not been able to pin it down to austerity alone since other factors have played
their part. Nonetheless, cuts to local authority budgets have a disproportionate
impact on the most deprived areas and the growing ageing population is a major
contributing factor (Hastings et al., 2015).
5.12. Have budget cuts led to staff redundancies?
Between 2010 and 2018 223,000 council workers have been made redundant
at a collective cost of £4b (Paine, 2018) but perhaps one of the most significant
loss of jobs is at Birmingham City Council where its staff have been reduced by
50% (Local Government Chronical, 2018). Some councils have not replaced
vacant posts and frontline services have had a significant impact on frontline
services (Marrs, 2012).
All but one council that responded to this study have reduced their workforce
through redundancy, either voluntary or compulsory, or by not replacing
employees when they resign or retire. One senior officer of a Labour controlled
city council says it has made a “significant reduction which has led to the council’s
reputation suffering as well as its service performance”.
Although its headcount has reduced by approximately 9% since 2015 one council
has managed redundancy through organisational change and “the overall
reduction is offset over a period of time by growth and inflation, and not all
budget reductions lead to redundancies – many savings are not related to
staffing” (Finance Officer, Conservative metropolitan council).
One council has reduced its staff “by about 25%...through voluntary redundancy
and not filling vacancies” (Labour Deputy Leader, metropolitan district council)
and another council, since 2010, has seen “many posts …deleted via natural
wastage as staff have left or reached retirement age” although staff have also
58
been encouraged to take voluntary redundancy” (Labour Leader, unitary
authority).
The findings from this study reveal that staff reductions range between 10% and
50% which equates to thousands of employees in each council.
5.13. Impact of reviewed services on staff morale and absenteeism
Public service cuts contribute to mental health problems which psychologists
argue is both avoidable and immoral (McGrath, Griffin and Mundy, undated).
Indeed, one council says “stress, mental health and depression is our highest
given set of reasons for sickness absence (around 25%)” (Finance Officer,
Conservative metropolitan council).
In one council “change has become a constant theme and staff are tired of
change, it is relentless, stress levels rise at times of service re-design and
management restructures” (CEO, Labour city council). Indeed, one respondent
says “no process of transforming services has led to greater commitment among
staff remaining. Those who did not like the change have largely gone resulting
in negative influence” (Labour Leader, city council). Following an annual staff
survey one council found there was “an overall reduction of staff morale
and…absences with stress have increased” (Conservative Leader, unitary
authority). “Staff morale is consistently low and…stress related illness is high.
The need for staff to be very flexible and undertake additional duties and
multiple roles for no extra remuneration is essential but understandably isn’t
always well received and absenteeism levels are high in certain services,
particularly those front-line services dealing with adults and children” (Labour
Leader, unitary authority).
59
5.14. Conclusion
The findings from this study have revealed that austerity has had a negative
impact on local service provision resulting in some services either being re-
designed, reduced or withdrawn. In order to cope some have outsourced their
services to the private sector, increased their use of technology, formed
partnerships, devolved some services to parish councils, or begun to charge for
non-statutory services such as the collection of green waste. The most obvious
outcome is that the majority of councils have made staff redundant and evidence
suggests that this has had a negative psychological impact on the remaining
employees. But, perhaps one of the most distressing outcomes of austerity is its
impact on vulnerable communities which, in some cases, has led to more
poverty.
The general consensus from participants in this study is that there have been
“…pressures on services for older people and adults with disabilities, closure of
youth service[s], reduction in frequency of refuse collection”, and a “reduction
in opening hours of the library”, (Labour Leader, city council). This has led to a
“dramatic reduction in funding for adult social care and safeguarding children, at
a time of increase in demand”, (Labour Leader, borough council). Indeed, as
people are living longer local authorities are facing increased demands on
providing care for the elderly, especially in the more rural counties where local
authorities receive less government funding than local authorities in more urban
areas. As one CEO of a Conservative rural unitary authority says, “…costs of
accessing residents is higher due to the sparse population” where far less funding
is received than many other parts of England due to “…a very unfair and
unbalanced system”.
This study has found parity with much of the literature. However, it has also
added value since it has given more detailed accounts of what is actually
happening in practice.
60
To conclude, overall the impact of austerity on local authorities, “has been an
extraordinarily challenging period – and it is not over yet. One of the most
difficult aspects has been getting central government to rise above basic raw
politics. They spent many years denouncing local government. That badly
impacted morale, but it also impacted residents’ views about councils…they had
a continuous diet of statements from ministers that local government wasted
vast amounts of cash. Ministers put forward ridiculous ‘solutions’ like joining up
IT departments between councils as a simple way to save the necessary money.
Now we have a common view of residents that the local authority does very little
for them – because central government has controlled this narrative. That is
deeply divisive and very unhelpful for everybody. This is particularly so as we
need to work with residents in communities to design new and sustainable ways
of developing better services in future – and we need communities to appreciate
the work and the role of local government – and to respect and value it.” (CEO,
Conservative led unitary authority). Indeed, local authorities are being blamed
for the consequences of austerity rather than central government which is
responsible for budget cuts throughout the public sector (Clayton, Donovan and
Merchant, 2016).
61
CHAPTER SIX
6. Conclusion and Recommendation
This study has considered the impact that austerity has had on local authorities
throughout England and shown in practical terms how they have dealt with it. The
research findings reveal that all respondents have much in common in how they have
re-designed their services, worked in partnership, made greater use of technology
and found new income streams by charging for services that were previously free.
The study also demonstrates that, as well as efficiency savings through service re-
design, the majority of councils have had to make staff redundant which has impacted
on their morale. Service reductions have also led to more poverty in vulnerable
communities although their impact is difficult to measure. However, factors that
have led councils to assume there is more poverty are due to a higher demand for
foodbanks and an increase in homelessness and rough sleeping.
The strength of this study emanates from the origins of the findings which have been
derived from practitioners with first-hand understanding of the impact of austerity.
Even though only a few councils have responded their experiences are very similar,
not only with each other but also with what the literature has revealed to date. The
study further finds that the politics of those councils who responded has not been a
causation for how they have reacted to austerity. Indeed, politician and officer
responses from both Conservative and Labour controlled councils show some
empathy with how budget cuts have impacted on the loss and reduction of vital
services as well as staff morale. Undeniably they have realised that, if austerity does
not end soon, they will not be able to continue to raise sufficient funds to maintain a
reasonable level of service.
Nonetheless, local authorities have coped with budget cuts and have demonstrated
some resilience. However, they have mostly done this by sheltering front-line
62
services through savings from back-office functions (Hastings et al., 2015). Research
published by Hastings et al. in 2015 found that whilst consumers seemed reasonably
satisfied with service provision in 2013 this is now not the case as dissatisfaction rises.
Furthermore, not only has service ‘thinning’ led to loss of expertise and ‘de-
professionalisation’ it has also resulted in front-line staff having burgeoning
workloads which has reduced staff morale (ibid). Moreover, the less well-off are
suffering even more as the services they need are not so readily available thus leading
to more poverty amongst vulnerable communities. All this accords with the research
findings.
It would appear there are no appropriate monitoring systems in place to capture the
diversity of experiences of both service providers and service users. It is therefore
recommended that local authorities use a tool-kit to evaluate and monitor budget
management over time so that a clearer picture of the impact of austerity can be
understood (Hastings et al., 2015).
63
BIBLIOGRAPHY
Bailey, D.J., and Shibata, S. (2017) ‘Austerity and Anti-Austerity: The Political Economy of Refusal in ‘Low-Resistance’ Models of Capitalism’, Cambridge University Press
Bello, B., Downe, J., Andrews, R., Martin, S. (2018) ‘Public Money & Management: Does austerity drive public service innovation? Evidence from shared senior management teams in local government’, 38:2, 131-138, Routledge Taylor & Francis Group
Blyth, M. (2013) Austerity: the history of a dangerous idea, Oxford University Press, Oxford
Clayton, J., Donovan, C., and Merchant, J. (2016) ‘Distancing and limited resourcefulness: Third sector service provision under austerity localism in the north east of England’, Urban Studies, Vol. 53(4), p723-740
Department for Communities and Local Government (2013) ‘A guide to the local government finance settlement in England’, DCLG, London
English Oxford Living Dictionaries, available at: https://en.oxforddictionaries.com/definition/austerity (accessed 06.05.2018)
Ferry, L., Andrews, R., Skelcher, C., and Wegorowski, P. (2018) New development: Corporization of local authorities in England in the wake of austerity 2010-2016, Public Money & Management, Vol. 38(6), pp477-480
Ferry, L., Coombs, H., Eckersley P. (2017) ‘Budgetary Stewardship, Innovation and Working Culture: Identifying the Missing Ingredient in English and Welsh Local Authorities’ Recipes for Austerity Management’, Financial Accountability & Management, Vol. 33(2), pp220-243
Goveval National and Local Government Database, available at: http://www.goveval.com/provision.html (accessed 8.7.18)
Groome, I. (June 2017) ‘What is austerity and what does it mean in UK politics?’, Metro News, available at: http://metro.co.uk/2017/06/28/what-is-austerity-6740771/ (accessed 05.05.2018)
Hastings, A., Bailey, N., Gannon, M., Besemer, K., and Bramley G. (2015) ‘Coping with the Cuts? The Management of the Worst Financial Settlement in Living Memory’, Local Government Studies, Vol. 41, No. 4, pp601-621
Hastings, A., Bailey, N., Bramley, G., Gannon, M., and Watkins, D. (2015) ‘The Cost of the Cuts: The Impact on Local Government and Poorer Communities’, Joseph Rowntree Foundation, York
64
House of Commons, ‘Financial sustainability of local authorities; Fiftieth Report of Session 2017-19’, available at: https://beta.parliament.uk/search?q=fiftieth+report+of+session+2017-19 (accessed 30.8.18)
IBM, ‘What is cloud computing?’, available at: https://www.ibm.com/cloud/learn/what-is-cloud-computing (accessed 10.11.18)
Johnson, G (2002) ‘Research Methods for Public Administrators’, Greenwood Publishing Group, Incorporated, USA
List of Councils in England, available at: https://assets.publishing.service.gov.uk/government/uploads/system/uploads/attachment_data/file/491463/List_of_councils_in_England.pdf (accessed 8.7.18)
Local Government Association, available at: https://www.local.gov.uk/ (accessed 8.7.18)
Local Government Association, available at: https://www.local.gov.uk/parliament/briefings-and-responses/local-democracy-uk-house-lords (accessed 10.6.18)
Local Government Association (2014)’Transforming local public services: using technology and digital tools and approaches’, Local Government Association, London
Paine, D. (2018), Local Government Chronical, ‘Revealed: the ‘staggering’ £4bn cost of a decade of job losses’, available at: https://www.lgcplus.com/7025900.article?utm_source=newsletter&utm_medium=email&utm_campaign=LGC_EditorialNewsletters.Paid:%20Send%20-%20Daily%20Newsletter&mkt_tok=eyJpIjoiWVRJNU56QTJOR1ZpTWpNNSIsInQiOiJ0VUJEQW9OS1Q1TngzTlRNZmlIVWZcL1Q2Zk9zcXc3MlVxVEpFVWtFcG5pcUhNTitDTk1heERaK1BPQjNKNWN6WkJqWHVZSVlEVE5kdUo1R0duSExJd1VGcSsyRmZET0Q3NDVxdm5nZXM0TkJBckhaTmdVTjZJNFRDRkVJOXBPQksifQ%3D%3D (accessed 23.9.18)
Lowndes, V., and Gardner, A. (2016) ‘Local governance under the Conservatives: super-austerity, devolution and the ‘smarter state’, Local Government Studies, 42:3, pp357-375
Lowndes, V., and Pratchett, L. (2012) ‘Local Government Studies, Local Governance under the Coalition Government: Austerity, Localism and the ‘Big Society’’, Taylor & Francis
Lowndes, V., and Sullivan, H. (2004) ‘Like a Horse and Carriage or a Fish on a Bicycle: How Well do Local Partnership and Public Participation go Together?’ Local Government Studies, Vol. 30, No. 1, pp.51-73
Marrs, C. (2012) ‘Planning; Balancing the books’, Issue 1930, pp.20-21,23
McGrath, L., Griffin, V., and Mundy, E. (undated) ‘The Psychological Impact of Austerity; A Briefing Paper, Psychologists Against Austerity’, available online at:
65
https://psychagainstausterity.files.wordpress.com/2015/03/paa-briefing-paper.pdf (accessed 7.7.18)
Metropolitan boroughs of the County of London, available at: https://en.wikipedia.org/wiki/Metropolitan_boroughs_of_the_County_of_London (accessed 8.7.18)
National Audit Office (March 2018) ‘Financial sustainability of local authorities 2018’, Ministry of Housing, Communities and Local Government
National Association of Local Councils, available at: https://www.nalc.gov.uk/ (accessed 26.08.18)
Patrick, R. (2014) ‘A Tangled Web: Why You Can’t Believe Crime’, pp4-5, Civitas, London
Pearce, G., and Ellwood, S. (2002) Modernising Local Government: A Role for Parish and Town Councils, Local Government Studies, Vol. 28(2), pp33-54
Public Sector Executive; audit, inspection and safety, ‘Northamptonshire council finances to be investigated by DCLG’, available at: http://www.publicsectorexecutive.com/News/northamptonshire-council-finances-to-be-investigated-by-dclg/191587 (accessed 31.5.18)
Public Sector Executive, ‘Worst is yet to come: Councils fear inability to balance books despite legal duty to do so’, available at: http://www.publicsectorexecutive.com/Public-Sector-News/worst-is-yet-to-come-councils-fear-inability-to-balance-books-despite-legal-duty-to-do-so?utm_source=Public%20Sector%20Executive&utm_medium=email&utm_campaign=9618513_PSE%20ROUND-UP%20Jun%2018%20wk%204&dm_i=IJU,5Q5OX,FX5KH5,MB2JK,1 (accessed 04.07.18)
Public Sector Executive, ‘Northamptonshire crisis: Calls for leader to resign as protesters mourn cuts’, available at: http://www.publicsectorexecutive.com/Public-Sector-News/northamptonshire-crisis-calls-for-leader-to-resign-as-protesters-mourn-cuts?utm_source=Public%20Sector%20Executive&utm_medium=email&utm_campaign=9727747_PSE%20ROUND-UP%20Aug%2018%20wk%201&dm_i=IJU,5SHZ7,FX5KH5,MLP08,1 (accessed 21.08.18)
Public Sector Executive, ‘Audit, inspection and safety: Deficit-ridden Birmingham council faces £84m shortfall in Commonwealth Games funding’, available at: http://www.publicsectorexecutive.com/Public-Sector-News/84m-shortfall-in-commonwealth-games-funding-for-struggling-birmingham-council?utm_source=Public%20Sector%20Executive&utm_medium=email&utm_campaign=9852898_2018%20PSE%20NEWSLETTER%20Sep%2018%20wk%203&dm_i=IJU,5V6JM,FX5KH5,MXOKY,1 (accessed 18.09.18)
66
Public Sector Executive, ‘National and Devolved Politics: 500 jobs could go as city council eyes 5% tax hike to tackle £28m deficit’, available at: http://www.publicsectorexecutive.com/Public-Sector-News/500-jobs-could-go-as-wolverhampton-council-eyes-5-tax-hike-to-tackle-28m-deficit-?utm_source=Public%20Sector%20Executive&utm_medium=email&utm_campaign=9930539_PSE%20ROUND-UP%20W2%2012-10-18&dm_i=IJU,5WUGB,FX5KH5,N4WKT,1 (accessed 09.11.18)
Public Sector Executive, ‘Economy and Infrastructure: Cornwall to cut hundreds of jobs in bid to save £80m and avoid Northants-style disaster’, available at: http://www.publicsectorexecutive.com/Public-Sector-News/cornwall-to-cut-hundreds-of-jobs-in-bid-to-save-80m-and-avoid-northants-style-disaster?utm_source=Public%20Sector%20Executive&utm_medium=email&utm_campaign=9867596_PSE%20ROUND-UP%20Sep%2018%20wk%203&dm_i=IJU,5VHVW,FX5KH5,MZ2O5,1 (accessed 09.11.18)
Raworth, K (2017) ‘Doughnut economics; Seven Ways to Think Like a 21st Century Economist’, Chelsea Green Publishing, USA
Stanley, L. (2014) ‘The Everyday Politics of the Age of Austerity: Crisis and the Legitimation of Fiscal Consolidation in the UK’, Department of Political Science and International Studies, School of Government and Society College of social Sciences, University of Birmingham
Torbay Council, Finance and budgets, available at: https://www.torbay.gov.uk/council/finance/ (accessed 5.9.18)
Watt, P.A., and Fender, J. (1999) ‘Central Control of Local Expenditure: Feasible Changes in the UK Controls on Local Government Expenditure’, Public Money and Management, 19:3, 17-22, Routledge
Whittam Smith, A. (2013) ‘The age of austerity is over. Why? It doesn’t work’; Economics, p19, The Independent, London
67
REFERENCES
Below are the website addresses for the councils which were asked to participate in the research. Barnsley Metropolitan Borough Council, available at: https://www.barnsley.gov.uk/, (accessed 21 August 2018) Bath and North East Somerset Council, available at: http://www.bathnes.gov.uk/, (accessed 23 August 2018) Bedford Borough Council, available at: http://www.bedford.gov.uk/, (accessed 23 August 2018) Birmingham City Council, available at: https://www.birmingham.gov.uk/, (accessed 18 July 2018) Blackburn with Darwen Borough Council, available at: https://www.blackburn.gov.uk/Pages/Home.aspx, (accessed 23 August 2018) Blackpool Council, available at: https://www.blackpool.gov.uk/Home.aspx, (accessed 23 August 2018) Bolton Borough Council, available at: http://www.democracy.bolton.gov.uk/cmis5/Home.aspx, (accessed 21 August 2018) Bournemouth Borough Council, available at: https://www.bournemouth.gov.uk/Home.aspx, (accessed 23 August 2018) Bracknell Forest Borough Council, available at: https://www.bracknell-forest.gov.uk/, (accessed 23 August 2018) Bradford Metropolitan District Council, available at: https://www.bradford.gov.uk/, (accessed 21 August 2018) Brent Borough Council, available at: https://www.brent.gov.uk/, (accessed 18 July 2018) Brighton and Hove City Council, available at: https://www.brighton-hove.gov.uk/, (accessed 23 August 2018) Bristol City Council, available at: https://www.bristol.gov.uk/, (accessed 23 August 2018)
68
Bury Borough Council, available at: https://www.bury.gov.uk/index.aspx?articleid=10298, (accessed 21 August 2018) Calderdale Borough Council, available at: https://www.calderdale.gov.uk/v2, (accessed 21 August 2018) Central Bedfordshire Council, available at: http://www.centralbedfordshire.gov.uk/, (accessed 23 August 2018) Cheshire East Council, available at: https://www.cheshireeast.gov.uk/Home.aspx, (accessed 23 August 2018) Chester West and Chester Council, available at: https://www.cheshirewestandchester.gov.uk/home.aspx, (accessed 23 August 2018) City of London Corporation, available at: https://www.cityoflondon.gov.uk/about-the-city/about-us/Pages/key-officers.aspx, (accessed 18 July 2018) City of York Council, available at: https://www.york.gov.uk/, (accessed 23 August 2018) Cornwall Council, available at: https://www.cornwall.gov.uk/, (accessed 23 August 2018) Coventry City Council, available at: http://www.coventry.gov.uk/, (accessed 21 August 2018) Darlington Borough Council, available at: https://www.darlington.gov.uk/, (accessed 23 August 2018) Derby City Council, available at: https://www.derby.gov.uk/, (accessed 23 August 2018) Derbyshire County Council, available at: https://www.derbyshire.gov.uk/home.aspx, (accessed 20 July 2018) Doncaster Borough Council, available at: http://www.doncaster.gov.uk/, (accessed 21 August 2018) Dudley Borough Council, available at: http://www.dudley.gov.uk/, (accessed 21 August 2018) Durham County Council, available at: https://www.durham.gov.uk/, (accessed 23 August 2018) East Riding of Yorkshire Council, available at: https://www.eastriding.gov.uk/, (accessed 23 August 2018) Exeter City Council, available at: https://exeter.gov.uk/, (accessed 20 July 2018)
69
Gateshead Borough Council, available at: https://www.gateshead.gov.uk/, (accessed 21 August 2018) Hackney Borough Council, available at: https://hackney.gov.uk/, (accessed 18 July 2018) Halton Borough Council, available at: https://www3.halton.gov.uk/Pages/Home.aspx, (accessed 23 August 2018) Hammersmith and Fulham Borough Council, available at: https://www.lbhf.gov.uk/, (accessed 18 July 2018) Hartlepool Borough Council, available at: https://www.hartlepool.gov.uk/, (accessed 23 August 2018) Herefordshire Council, available at: https://www.herefordshire.gov.uk/, (accessed 23 August 2018) Hull City Council, available at: http://www.hull.gov.uk/, (accessed 23 August 2018) Isle of Wight Council, available at: https://www.iow.gov.uk/, (accessed 23 August 2018) Kirklees Borough Council, available at: http://www.kirklees.gov.uk/beta/default.aspx, (accessed 21 August 2018) Knowsley Borough Council, available at: http://www.knowsley.gov.uk/home.aspx, (accessed 21 August 2018) Lancaster City Council, available at: https://www.lancaster.gov.uk/, (accessed 20 July 2018) Leeds City Council, available at: https://www.leeds.gov.uk/, (accessed 21 August 2018) Leicestershire County Council, available at: https://www.leicestershire.gov.uk/, (accessed 20 July 2018) Liverpool City Council, available at: https://liverpool.gov.uk/, (accessed 21 August 2018) Luton Borough Council, available at: https://www.luton.gov.uk/Pages/Homepage.aspx, (accessed 23 August 2018) Manchester City Council, available at: https://www.manchester.gov.uk/, (accessed 21 August 2018) Medway Council, available at: https://www.medway.gov.uk/, (accessed 23 August 2018) Middlesbrough Borough Council, available at: https://www.middlesbrough.gov.uk/, (accessed 23 August 2018)
70
Milton Keynes Council, available at: https://www.milton-keynes.gov.uk/, (accessed 23 August 2018) Newcastle Upon Tyne City Council, available at: https://www.newcastle.gov.uk/, (accessed 21 August 2018) North Lincolnshire Council, available at: http://www.northlincs.gov.uk/, (accessed 23 August 2018) North Somerset Council, available at: https://www.n-somerset.gov.uk/, (accessed 28 August 2018) Northamptonshire County Council, available at: https://www3.northamptonshire.gov.uk/pages/default.aspx, (accessed 20 July 2018) Northumberland County Council, available at: http://www.northumberland.gov.uk/Home.aspx, (accessed 23 August 2018) Nottingham City Council, available at: http://www.nottinghamcity.gov.uk/, (accessed 23 August 2018) Peterborough City Council, available at: https://www.peterborough.gov.uk/, (accessed 23 August 2018) Poole Borough Council, available at: https://www.poole.gov.uk/, (accessed 23 August 2018) Portsmouth City Council, available at: https://www.portsmouth.gov.uk/, (accessed 23 August 2018) Oldham Borough Council, available at: https://www.oldham.gov.uk/, (accessed 21 August 2018) Reading Borough Council, available at: http://www.reading.gov.uk/, (accessed 23 August 2018) Redcar and Cleveland Borough Council, available at: https://www.redcar-cleveland.gov.uk/Pages/default.aspx, (accessed 23 August 2018) Rochdale Borough Council, available at: http://www.rochdale.gov.uk/council-and-democracy/council-departments/pages/chief-executive.aspx, (accessed 21 August 2018) Rotherham Borough Council, available at: https://www.rotherham.gov.uk/, (accessed 21 August 2018) Royal Borough of Greenwich Council, available at: https://www.royalgreenwich.gov.uk/site/, (accessed 18 July 2018)
71
Royal Borough of Windsor and Maidenhead Council, available at: https://www3.rbwm.gov.uk/, (accessed 23 August 2018) Selby District Council, available at: https://www.selby.gov.uk/, (accessed 20 July 2018) Salford City Council, available at: https://www.salford.gov.uk/, (accessed 21 August 2018) Sandwell Borough Council, available at: http://www.sandwell.gov.uk/, (accessed 21 August 2018) Sefton Borough Council, available at: https://www.sefton.gov.uk/sefton-home.aspx, (accessed 21 August 2018) Sheffield City Council, available at: https://www.sheffield.gov.uk/, (accessed 21 August 2018) Shropshire Council, available at: http://www.shropshire.gov.uk/, (accessed 12 August 2018) Slough Borough Council, available at: http://www.slough.gov.uk/, (accessed 23 August 2018) Solihull Borough Council, available at: http://www.solihull.gov.uk/, (accessed 21 August 2018) South Gloucestershire Council, available at: http://www.southglos.gov.uk/, (accessed 23 August 2018) South Tyneside Borough Council, available at: https://www.southtyneside.gov.uk/, (accessed 21 August 2018) Southampton City Council, available at: http://www.southampton.gov.uk/, (accessed 23 August 2018) Southend-on-Sea Borough Council, available at: http://www.southend.gov.uk/, (accessed 23 August 2018) St Helens Borough Council, available at: https://www.sthelens.gov.uk/, (accessed 21 August 2018) Stockport Borough Council, available at: https://www.stockport.gov.uk/, (accessed 21 August 2018) Stockton-on-Tees Borough Council, available at: https://www.stockton.gov.uk/, (accessed 23 August 2018) Stoke-on-Trent City Council, available at: https://www.stoke.gov.uk/site/, (accessed 18 August 2018)
72
Suffolk Coastal District Council, available at: http://www.eastsuffolk.gov.uk/, (accessed 20 July 2018) Swindon Borough Council, available at: https://www.swindon.gov.uk/, (accessed 23 August 2018) Tameside Borough Council, available at: https://www.tameside.gov.uk/, (accessed 21 August 2018) Telford & Wrekin Borough Council, available at: http://www.telford.gov.uk/, (accessed 23 August 2018) Thurrock Council, available at: https://www.thurrock.gov.uk/, (accessed 23 August 2018) Torbay Council, available at: http://www.torbay.gov.uk/, (accessed 23 August 2018) Trafford Borough Council, available at: http://trafford.gov.uk/about-your-council/your-council.aspx, (accessed 21 August 2018) Wakefield City Council, available at: http://www.wakefield.gov.uk/, (accessed 21 August 2018) Walsall Borough Council, available at: https://go.walsall.gov.uk/, (accessed 21 August 2018) Warrington Borough Council, available at: https://www.warrington.gov.uk/, (accessed 23 August 2018) West Berkshire Council, available at: http://westberks.gov.uk/, (accessed 23 August 2018) Wigan Borough Councils, available at: https://www.wigan.gov.uk/Council/index.aspx, (accessed 21 August 2018) Wiltshire Council, available at: http://www.wiltshire.gov.uk/, (accessed 23 August 2018) Wirral Borough Council, available at: http://www.wirral.gov.uk/, (accessed 21 August 2018) Wokingham Borough Council, available at: https://www.wokingham.gov.uk/, (accessed 23 August 2018) Wolverhampton City Council, available at: http://www.wolverhampton.gov.uk/home, (accessed 21 August 2018)
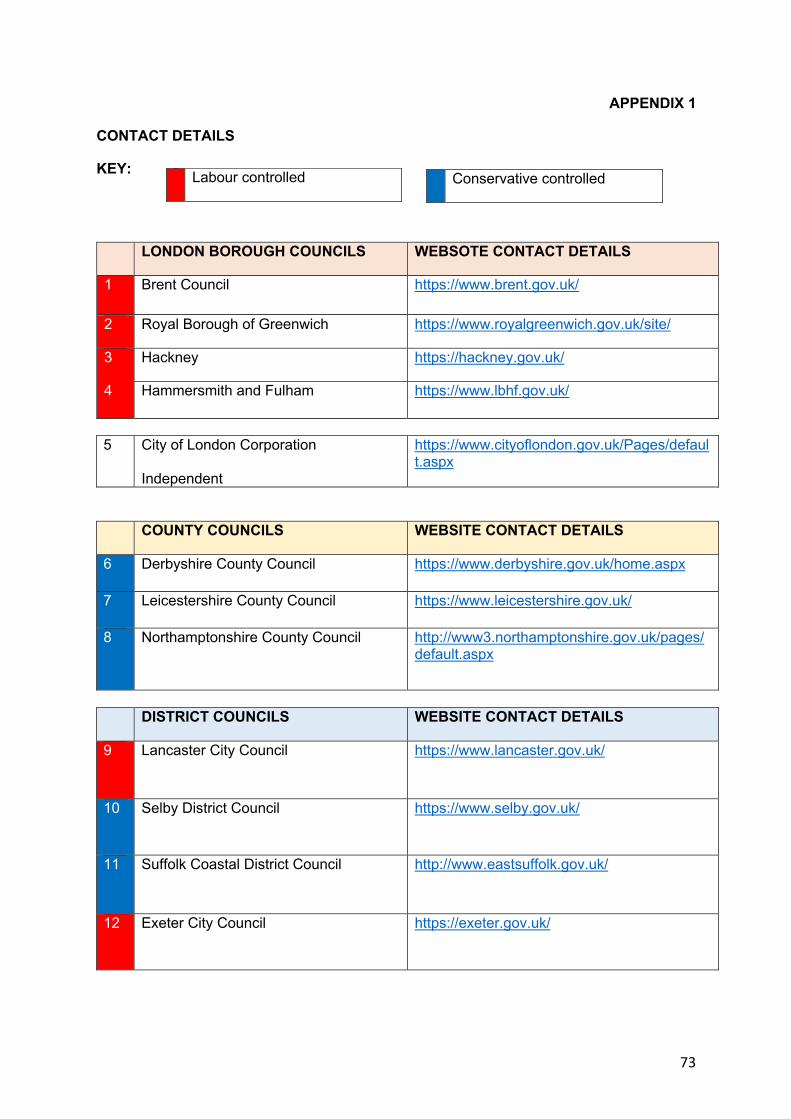
73
APPENDIX 1
CONTACT DETAILS
KEY:
LONDON BOROUGH COUNCILS WEBSOTE CONTACT DETAILS
1 Brent Council
https://www.brent.gov.uk/
2 Royal Borough of Greenwich https://www.royalgreenwich.gov.uk/site/
3 Hackney https://hackney.gov.uk/
4 Hammersmith and Fulham
https://www.lbhf.gov.uk/
5 City of London Corporation
Independent
https://www.cityoflondon.gov.uk/Pages/default.aspx
COUNTY COUNCILS WEBSITE CONTACT DETAILS
6 Derbyshire County Council
https://www.derbyshire.gov.uk/home.aspx
7 Leicestershire County Council
https://www.leicestershire.gov.uk/
8 Northamptonshire County Council
http://www3.northamptonshire.gov.uk/pages/default.aspx
DISTRICT COUNCILS WEBSITE CONTACT DETAILS
9 Lancaster City Council https://www.lancaster.gov.uk/
10 Selby District Council
https://www.selby.gov.uk/
11 Suffolk Coastal District Council
http://www.eastsuffolk.gov.uk/
12 Exeter City Council
https://exeter.gov.uk/
Labour controlled Conservative controlled
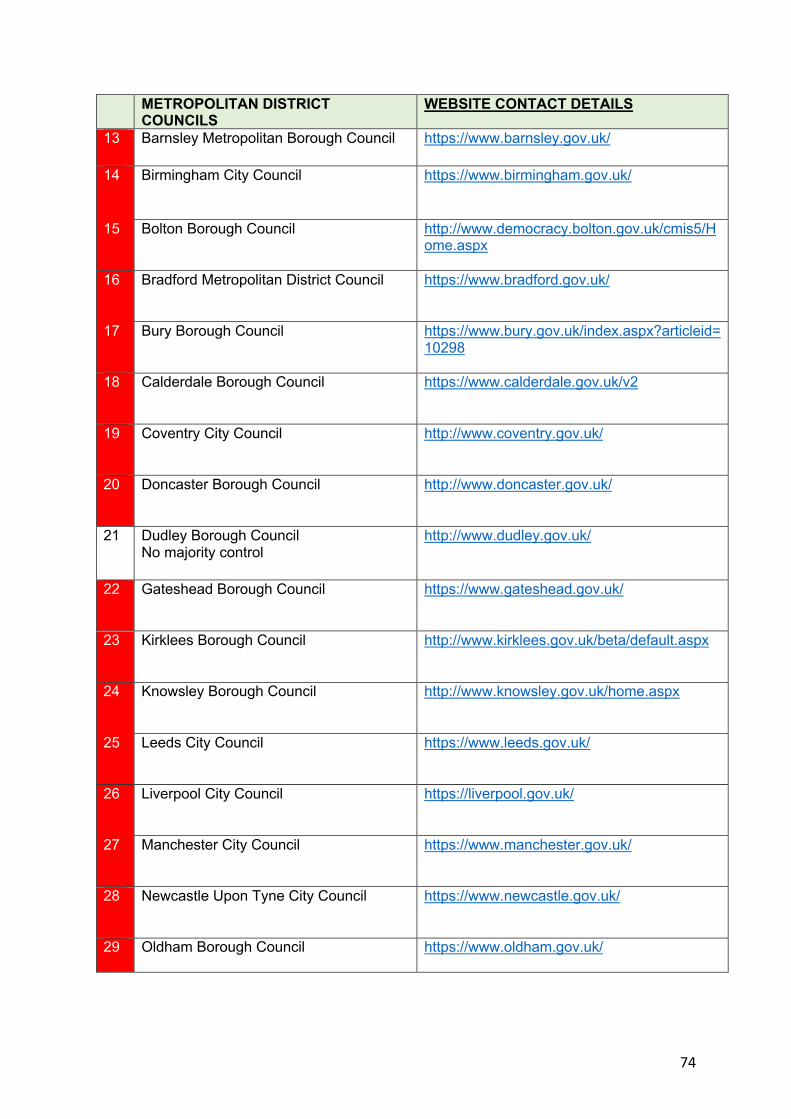
74
METROPOLITAN DISTRICT COUNCILS
WEBSITE CONTACT DETAILS
13 Barnsley Metropolitan Borough Council
https://www.barnsley.gov.uk/
14 Birmingham City Council
https://www.birmingham.gov.uk/
15 Bolton Borough Council
http://www.democracy.bolton.gov.uk/cmis5/Home.aspx
16 Bradford Metropolitan District Council
https://www.bradford.gov.uk/
17 Bury Borough Council
https://www.bury.gov.uk/index.aspx?articleid=10298
18 Calderdale Borough Council
https://www.calderdale.gov.uk/v2
19 Coventry City Council
http://www.coventry.gov.uk/
20 Doncaster Borough Council
http://www.doncaster.gov.uk/
21 Dudley Borough Council No majority control
http://www.dudley.gov.uk/
22 Gateshead Borough Council
https://www.gateshead.gov.uk/
23 Kirklees Borough Council
http://www.kirklees.gov.uk/beta/default.aspx
24 Knowsley Borough Council
http://www.knowsley.gov.uk/home.aspx
25 Leeds City Council
https://www.leeds.gov.uk/
26 Liverpool City Council
https://liverpool.gov.uk/
27 Manchester City Council
https://www.manchester.gov.uk/
28 Newcastle Upon Tyne City Council
https://www.newcastle.gov.uk/
29 Oldham Borough Council https://www.oldham.gov.uk/
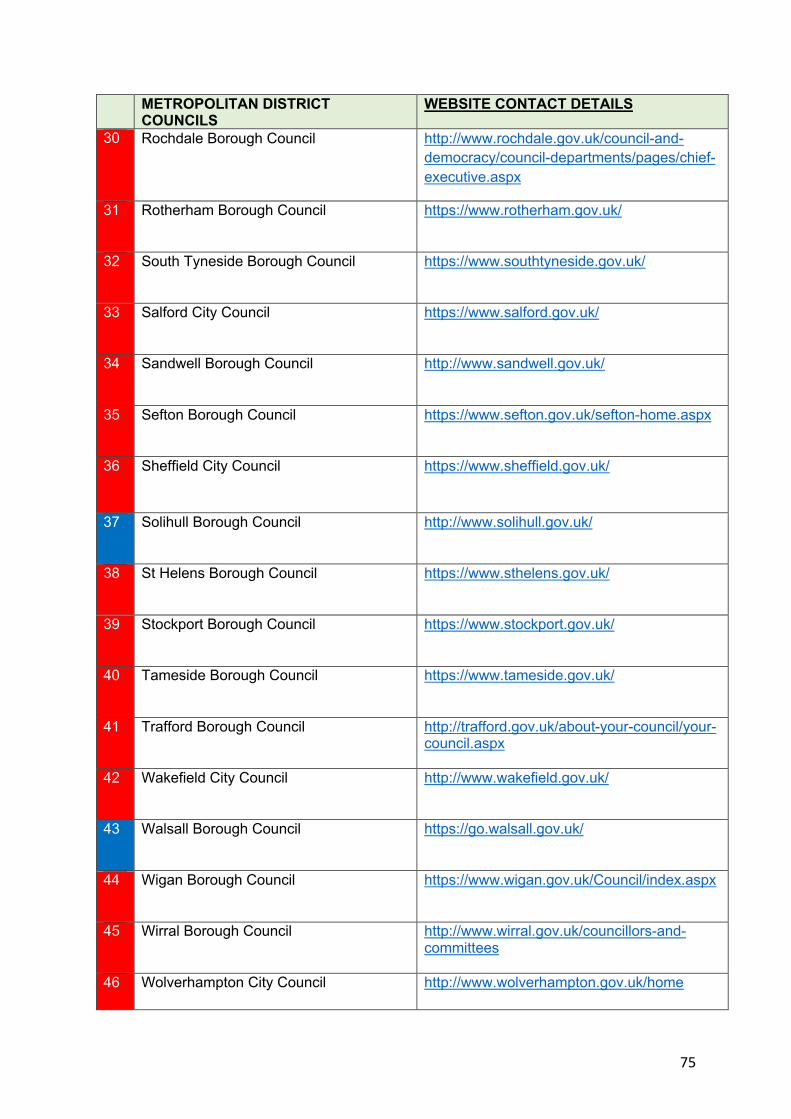
75
METROPOLITAN DISTRICT COUNCILS
WEBSITE CONTACT DETAILS
30 Rochdale Borough Council
http://www.rochdale.gov.uk/council-and-democracy/council-departments/pages/chief-executive.aspx
31 Rotherham Borough Council
https://www.rotherham.gov.uk/
32 South Tyneside Borough Council
https://www.southtyneside.gov.uk/
33 Salford City Council
https://www.salford.gov.uk/
34 Sandwell Borough Council
http://www.sandwell.gov.uk/
35 Sefton Borough Council
https://www.sefton.gov.uk/sefton-home.aspx
36 Sheffield City Council
https://www.sheffield.gov.uk/
37 Solihull Borough Council
http://www.solihull.gov.uk/
38 St Helens Borough Council
https://www.sthelens.gov.uk/
39 Stockport Borough Council
https://www.stockport.gov.uk/
40 Tameside Borough Council
https://www.tameside.gov.uk/
41 Trafford Borough Council
http://trafford.gov.uk/about-your-council/your-council.aspx
42 Wakefield City Council
http://www.wakefield.gov.uk/
43 Walsall Borough Council
https://go.walsall.gov.uk/
44 Wigan Borough Council
https://www.wigan.gov.uk/Council/index.aspx
45 Wirral Borough Council
http://www.wirral.gov.uk/councillors-and-committees
46 Wolverhampton City Council
http://www.wolverhampton.gov.uk/home
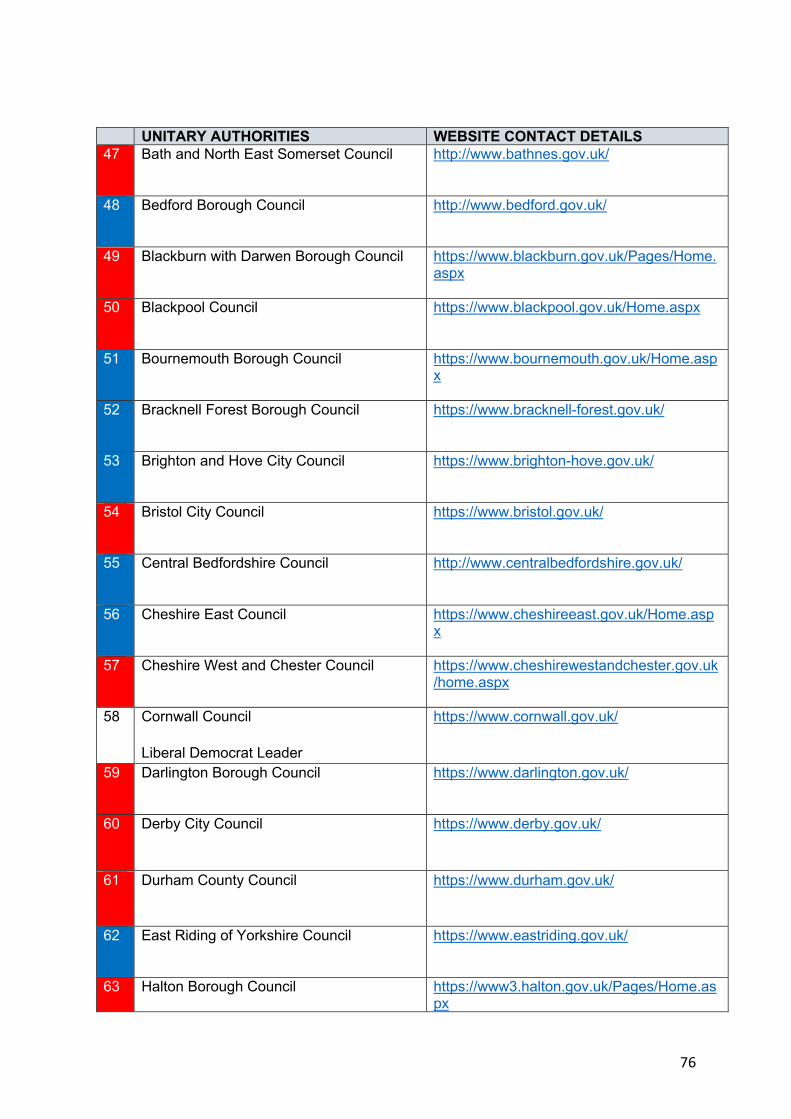
76
UNITARY AUTHORITIES WEBSITE CONTACT DETAILS 47 Bath and North East Somerset Council
http://www.bathnes.gov.uk/
48 Bedford Borough Council
http://www.bedford.gov.uk/
49 Blackburn with Darwen Borough Council
https://www.blackburn.gov.uk/Pages/Home.aspx
50 Blackpool Council
https://www.blackpool.gov.uk/Home.aspx
51 Bournemouth Borough Council
https://www.bournemouth.gov.uk/Home.aspx
52 Bracknell Forest Borough Council
https://www.bracknell-forest.gov.uk/
53 Brighton and Hove City Council
https://www.brighton-hove.gov.uk/
54 Bristol City Council
https://www.bristol.gov.uk/
55 Central Bedfordshire Council
http://www.centralbedfordshire.gov.uk/
56 Cheshire East Council
https://www.cheshireeast.gov.uk/Home.aspx
57 Cheshire West and Chester Council
https://www.cheshirewestandchester.gov.uk/home.aspx
58 Cornwall Council Liberal Democrat Leader
https://www.cornwall.gov.uk/
59 Darlington Borough Council
https://www.darlington.gov.uk/
60 Derby City Council
https://www.derby.gov.uk/
61 Durham County Council
https://www.durham.gov.uk/
62 East Riding of Yorkshire Council
https://www.eastriding.gov.uk/
63 Halton Borough Council
https://www3.halton.gov.uk/Pages/Home.aspx
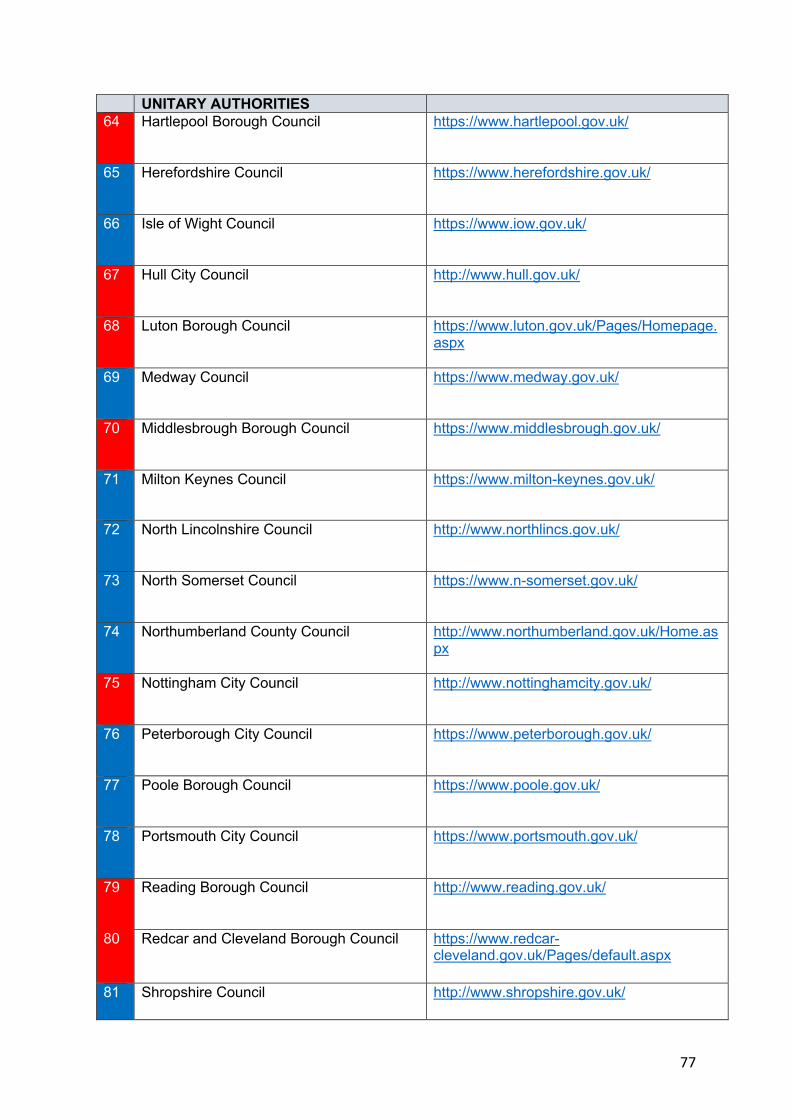
77
UNITARY AUTHORITIES 64 Hartlepool Borough Council
https://www.hartlepool.gov.uk/
65 Herefordshire Council
https://www.herefordshire.gov.uk/
66 Isle of Wight Council
https://www.iow.gov.uk/
67 Hull City Council
http://www.hull.gov.uk/
68 Luton Borough Council
https://www.luton.gov.uk/Pages/Homepage.aspx
69 Medway Council
https://www.medway.gov.uk/
70 Middlesbrough Borough Council
https://www.middlesbrough.gov.uk/
71 Milton Keynes Council
https://www.milton-keynes.gov.uk/
72 North Lincolnshire Council
http://www.northlincs.gov.uk/
73 North Somerset Council
https://www.n-somerset.gov.uk/
74 Northumberland County Council
http://www.northumberland.gov.uk/Home.aspx
75 Nottingham City Council
http://www.nottinghamcity.gov.uk/
76 Peterborough City Council
https://www.peterborough.gov.uk/
77 Poole Borough Council
https://www.poole.gov.uk/
78 Portsmouth City Council
https://www.portsmouth.gov.uk/
79 Reading Borough Council
http://www.reading.gov.uk/
80 Redcar and Cleveland Borough Council
https://www.redcar-cleveland.gov.uk/Pages/default.aspx
81 Shropshire Council
http://www.shropshire.gov.uk/
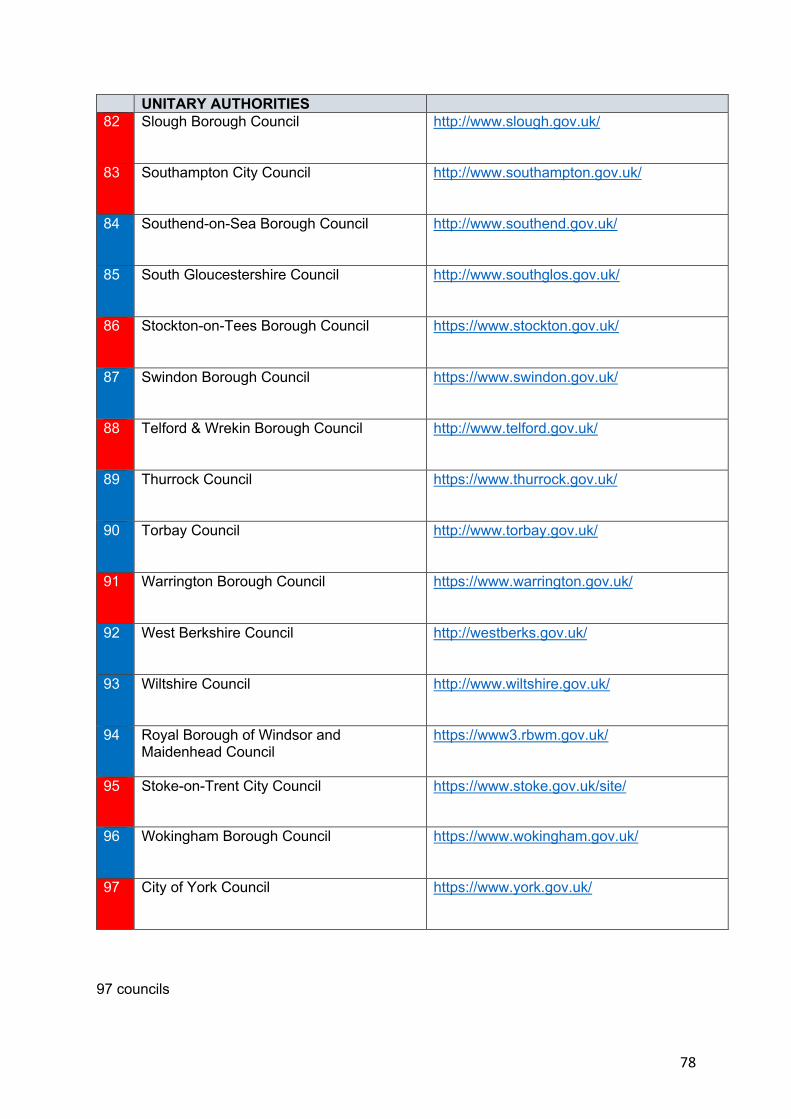
78
UNITARY AUTHORITIES 82 Slough Borough Council
http://www.slough.gov.uk/
83 Southampton City Council
http://www.southampton.gov.uk/
84 Southend-on-Sea Borough Council
http://www.southend.gov.uk/
85 South Gloucestershire Council
http://www.southglos.gov.uk/
86 Stockton-on-Tees Borough Council
https://www.stockton.gov.uk/
87 Swindon Borough Council
https://www.swindon.gov.uk/
88 Telford & Wrekin Borough Council
http://www.telford.gov.uk/
89 Thurrock Council
https://www.thurrock.gov.uk/
90 Torbay Council
http://www.torbay.gov.uk/
91 Warrington Borough Council
https://www.warrington.gov.uk/
92 West Berkshire Council
http://westberks.gov.uk/
93 Wiltshire Council
http://www.wiltshire.gov.uk/
94 Royal Borough of Windsor and Maidenhead Council
https://www3.rbwm.gov.uk/
95 Stoke-on-Trent City Council
https://www.stoke.gov.uk/site/
96 Wokingham Borough Council
https://www.wokingham.gov.uk/
97 City of York Council
https://www.york.gov.uk/
97 councils
79
APPENDIX 2A
RESEARCH QUESTIONNAIRE
“The Impact of Austerity on Local Authorities”
The purpose of this questionnaire is to compare existing literature written on austerity with what is really happening on the ground. The questions are designed to explore how local authorities have risen to the challenge of doing more with less and to examine examples of how innovation has been utilised to maintain local services with fewer resources. It also attempts to draw out the advantages and disadvantages that austerity has induced and its impact on local service provision in response to budget cuts.
Please answer the following 12 questions as honestly as you can. You may write as little or as much as you can and please be assured that your anonymity will be maintained throughout. For your convenience you may cut and paste this P into the boxes below as appropriate.
Thank you for taking the time to assist with this research.
QUESTION 1 – the definition of austerity
How do you perceive austerity and how would you define it?
WHAT HAS BEEN THE IMPACT OF AUSTERITY ON YOUR COUNCIL?
QUESTION 2
Has the impact of austerity on your council been positive?
YES NO
80
Has the impact of austerity on your council been negative?
YES NO
Please give examples.
QUESTION 3 - have you re-designed any of your services because of budget cuts?
YES NO
If you answered yes, please give examples.
QUESTION 4 – have any of your services been reduced because of budget cuts?
YES NO
If you answered yes, please give examples and state whether they are statutory of non-statutory services.

81
QUESTION 5 – have you outsourced any of your services to the private sector in response to austerity measures?
YES NO
If you answered yes, please give examples.
QUESTION 6 - have you used new technology to deliver services? For example, artificial intelligence.
YES NO
If you answered yes, please give examples.

82
QUESTION 7 – have you formed new partnerships e.g. sharing SMTs (Senior Management Teams)?
YES NO
If you answered yes, please give examples.
QUESTION 8 – have you introduced charging for non-statutory services e.g. green waste collection?
YES NO
If you answered yes, please give examples.
QUESTION 9 – have you devolved any of your services to parish/town councils in your area?
YES NO

83
If you answered yes, please give examples of the services you have devolved.
QUESTION 10 – do you know whether reduced services in your council has led to more poverty amongst vulnerable communities?
YES NO
If you answered yes, please explain.
QUESTION 11 – have budget cuts led to staff redundancies?
YES NO
If you answered yes, by what percentage is the reduction in staff?

84
QUESTION 12 – what impact has a review of your services had on staff morale in response to austerity measures? For example, are you aware of any psychological impact on employees, are they working in more stressful conditions and has it led to greater absenteeism?
If you would like to make any further comments that you think will contribute to this research, please write in the space below.
THANK YOU.
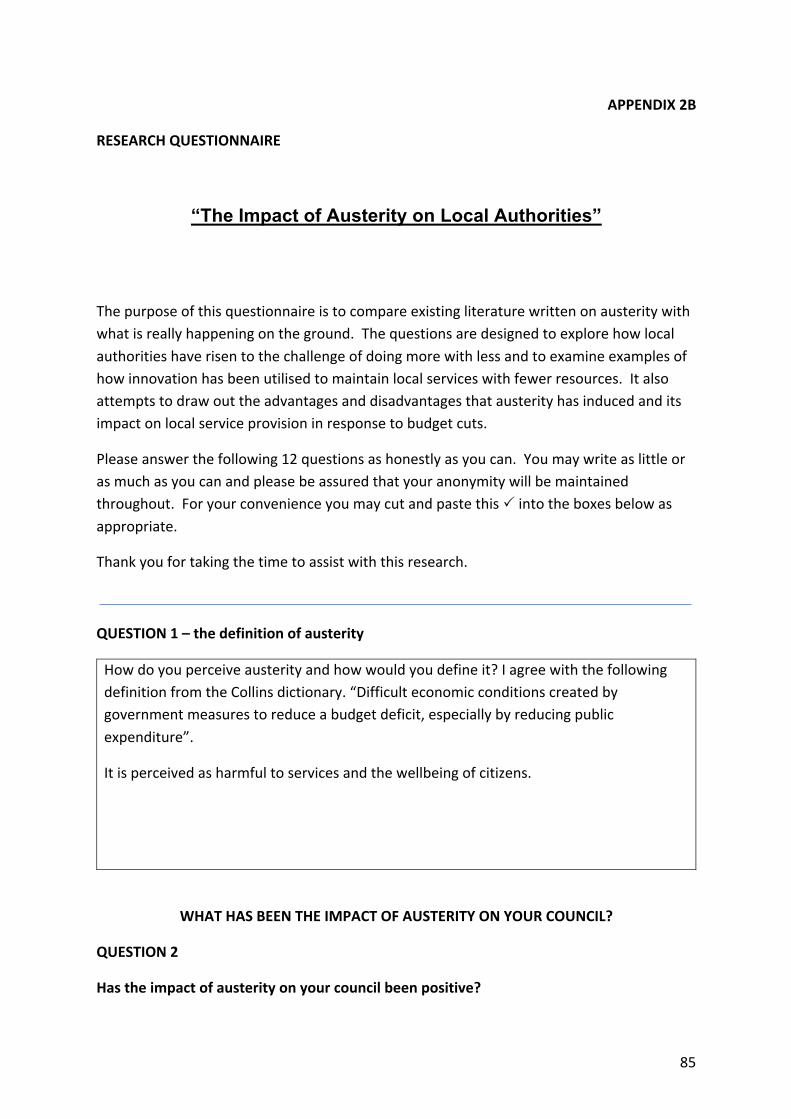
85
APPENDIX 2B
RESEARCH QUESTIONNAIRE
“The Impact of Austerity on Local Authorities”
The purpose of this questionnaire is to compare existing literature written on austerity with what is really happening on the ground. The questions are designed to explore how local authorities have risen to the challenge of doing more with less and to examine examples of how innovation has been utilised to maintain local services with fewer resources. It also attempts to draw out the advantages and disadvantages that austerity has induced and its impact on local service provision in response to budget cuts.
Please answer the following 12 questions as honestly as you can. You may write as little or as much as you can and please be assured that your anonymity will be maintained throughout. For your convenience you may cut and paste this P into the boxes below as appropriate.
Thank you for taking the time to assist with this research.
QUESTION 1 – the definition of austerity
How do you perceive austerity and how would you define it? I agree with the following definition from the Collins dictionary. “Difficult economic conditions created by government measures to reduce a budget deficit, especially by reducing public expenditure”.
It is perceived as harmful to services and the wellbeing of citizens.
WHAT HAS BEEN THE IMPACT OF AUSTERITY ON YOUR COUNCIL?
QUESTION 2
Has the impact of austerity on your council been positive?
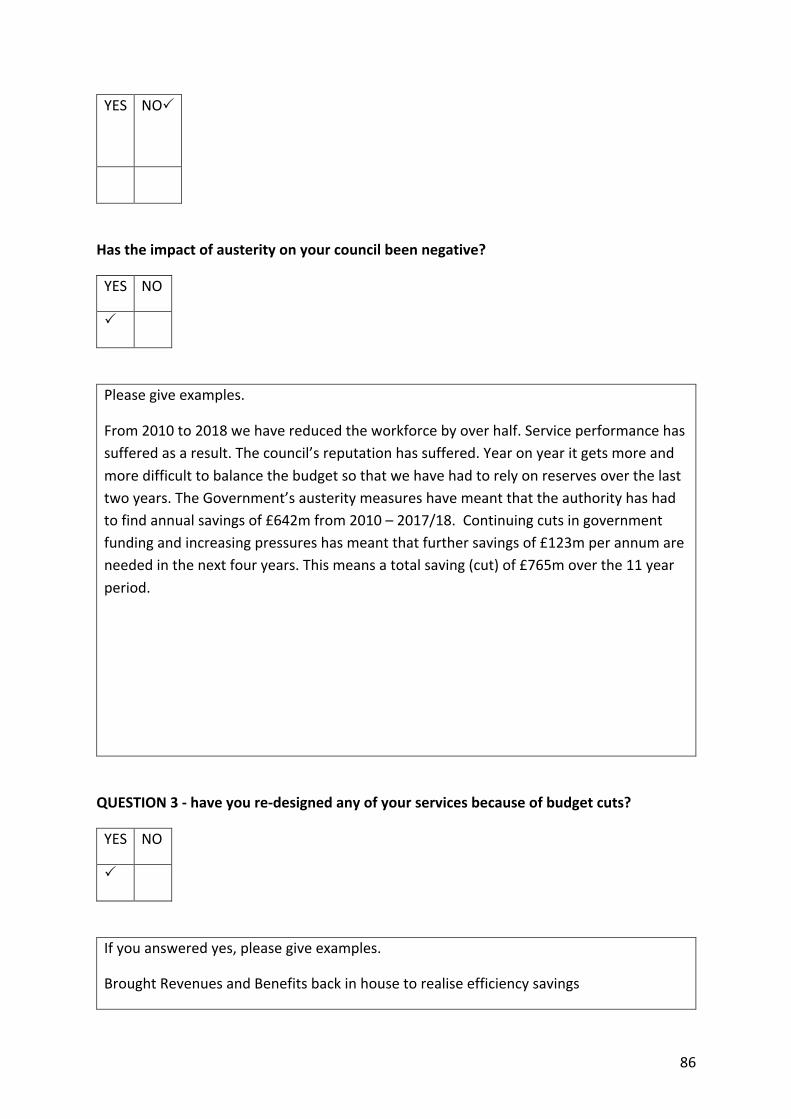
86
YES NOP
Has the impact of austerity on your council been negative?
YES NO
P
Please give examples.
From 2010 to 2018 we have reduced the workforce by over half. Service performance has suffered as a result. The council’s reputation has suffered. Year on year it gets more and more difficult to balance the budget so that we have had to rely on reserves over the last two years. The Government’s austerity measures have meant that the authority has had to find annual savings of £642m from 2010 – 2017/18. Continuing cuts in government funding and increasing pressures has meant that further savings of £123m per annum are needed in the next four years. This means a total saving (cut) of £765m over the 11 year period.
QUESTION 3 - have you re-designed any of your services because of budget cuts?
YES NO
P
If you answered yes, please give examples.
Brought Revenues and Benefits back in house to realise efficiency savings
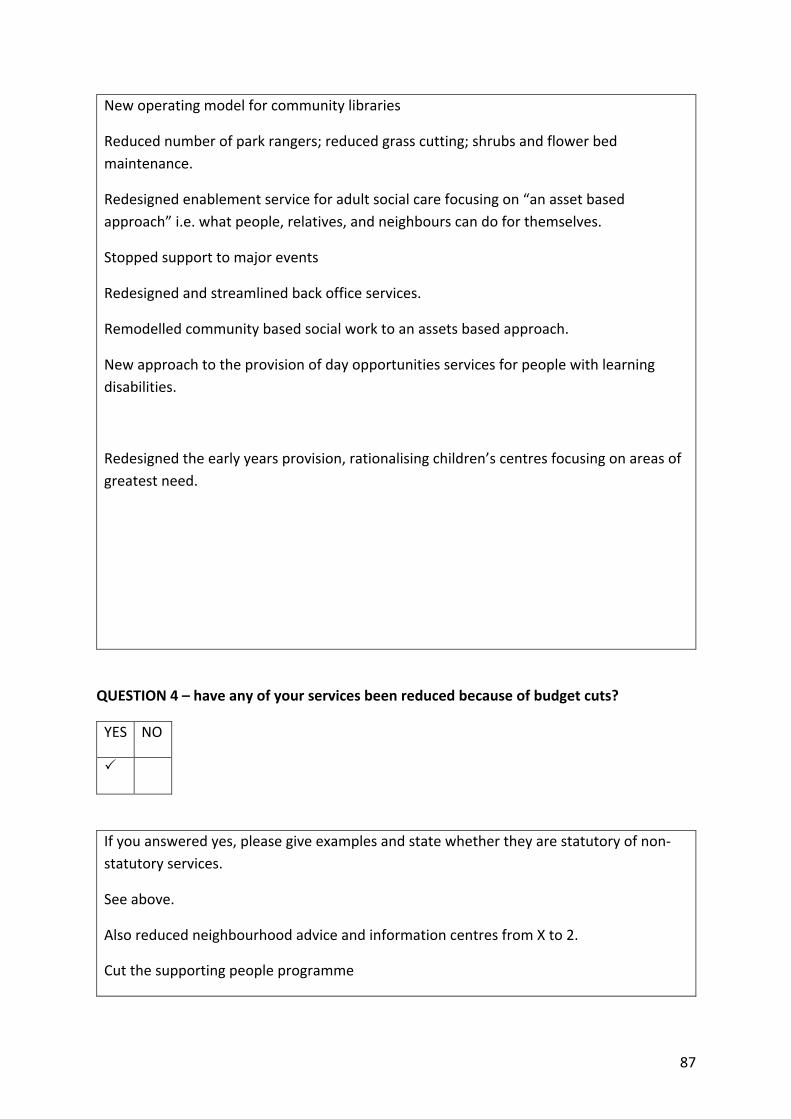
87
New operating model for community libraries
Reduced number of park rangers; reduced grass cutting; shrubs and flower bed maintenance.
Redesigned enablement service for adult social care focusing on “an asset based approach” i.e. what people, relatives, and neighbours can do for themselves.
Stopped support to major events
Redesigned and streamlined back office services.
Remodelled community based social work to an assets based approach.
New approach to the provision of day opportunities services for people with learning disabilities.
Redesigned the early years provision, rationalising children’s centres focusing on areas of greatest need.
QUESTION 4 – have any of your services been reduced because of budget cuts?
YES NO
P
If you answered yes, please give examples and state whether they are statutory of non-statutory services.
See above.
Also reduced neighbourhood advice and information centres from X to 2.
Cut the supporting people programme
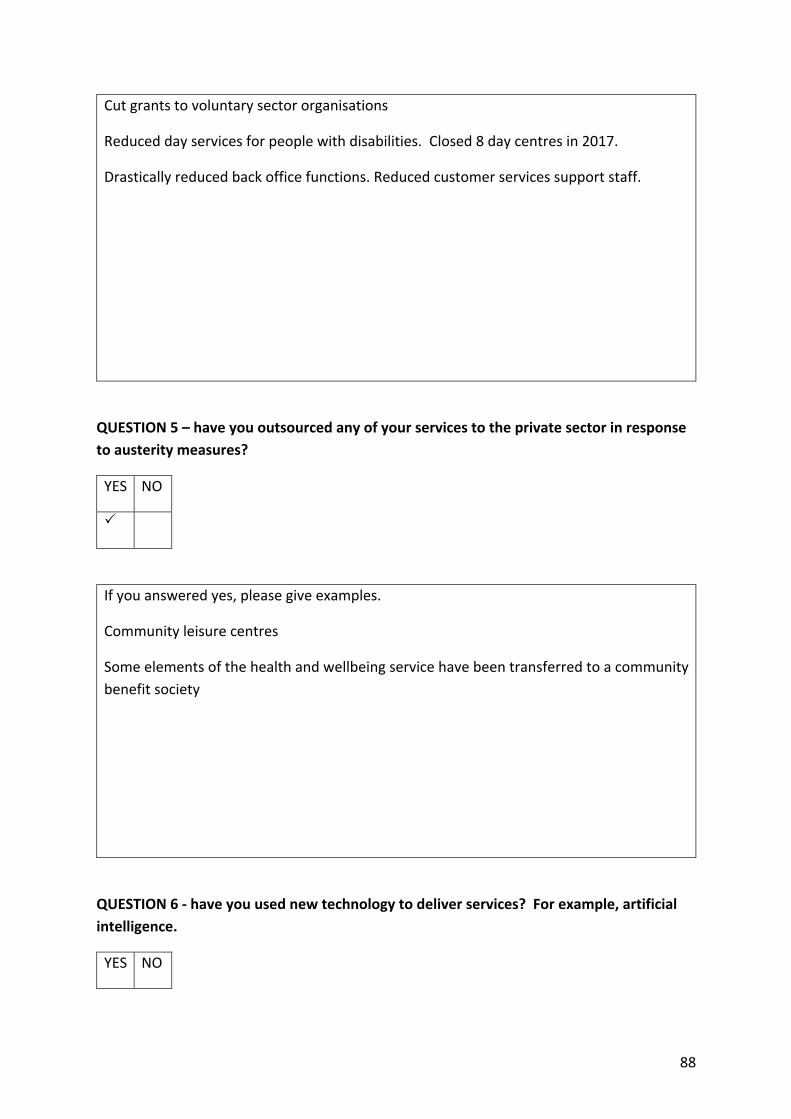
88
Cut grants to voluntary sector organisations
Reduced day services for people with disabilities. Closed 8 day centres in 2017.
Drastically reduced back office functions. Reduced customer services support staff.
QUESTION 5 – have you outsourced any of your services to the private sector in response to austerity measures?
YES NO
P
If you answered yes, please give examples.
Community leisure centres
Some elements of the health and wellbeing service have been transferred to a community benefit society
QUESTION 6 - have you used new technology to deliver services? For example, artificial intelligence.
YES NO
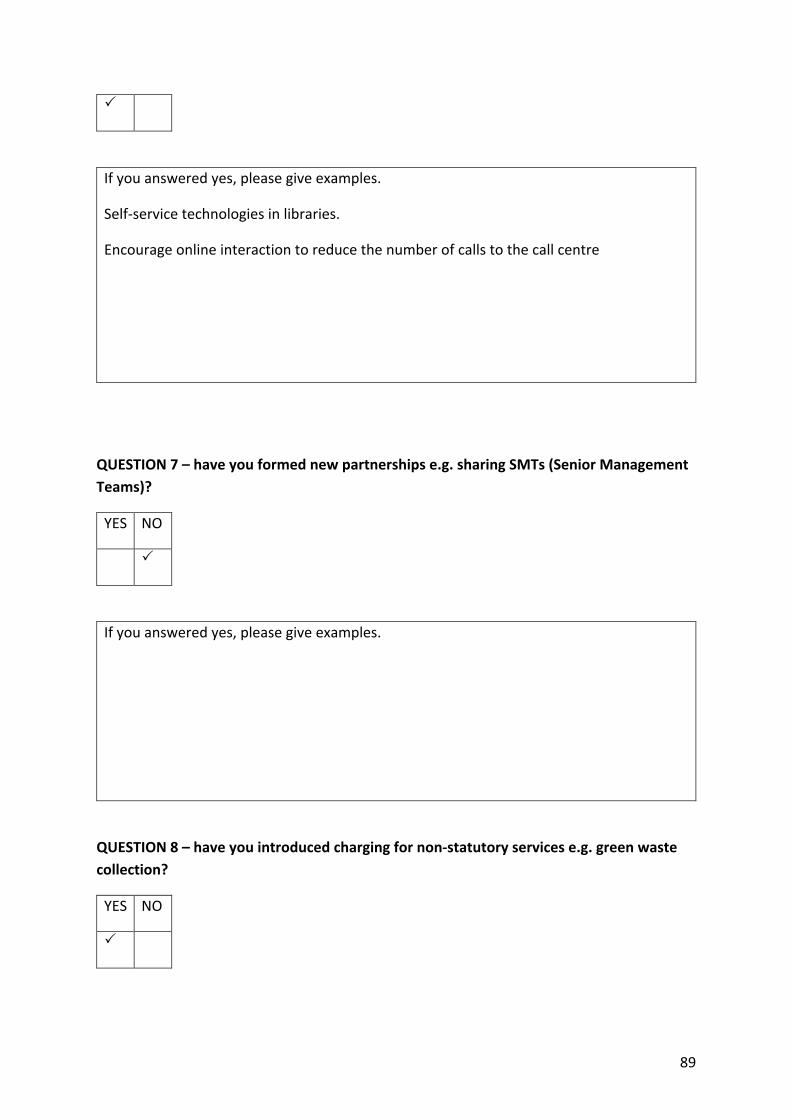
89
P
If you answered yes, please give examples.
Self-service technologies in libraries.
Encourage online interaction to reduce the number of calls to the call centre
QUESTION 7 – have you formed new partnerships e.g. sharing SMTs (Senior Management Teams)?
YES NO
P
If you answered yes, please give examples.
QUESTION 8 – have you introduced charging for non-statutory services e.g. green waste collection?
YES NO
P
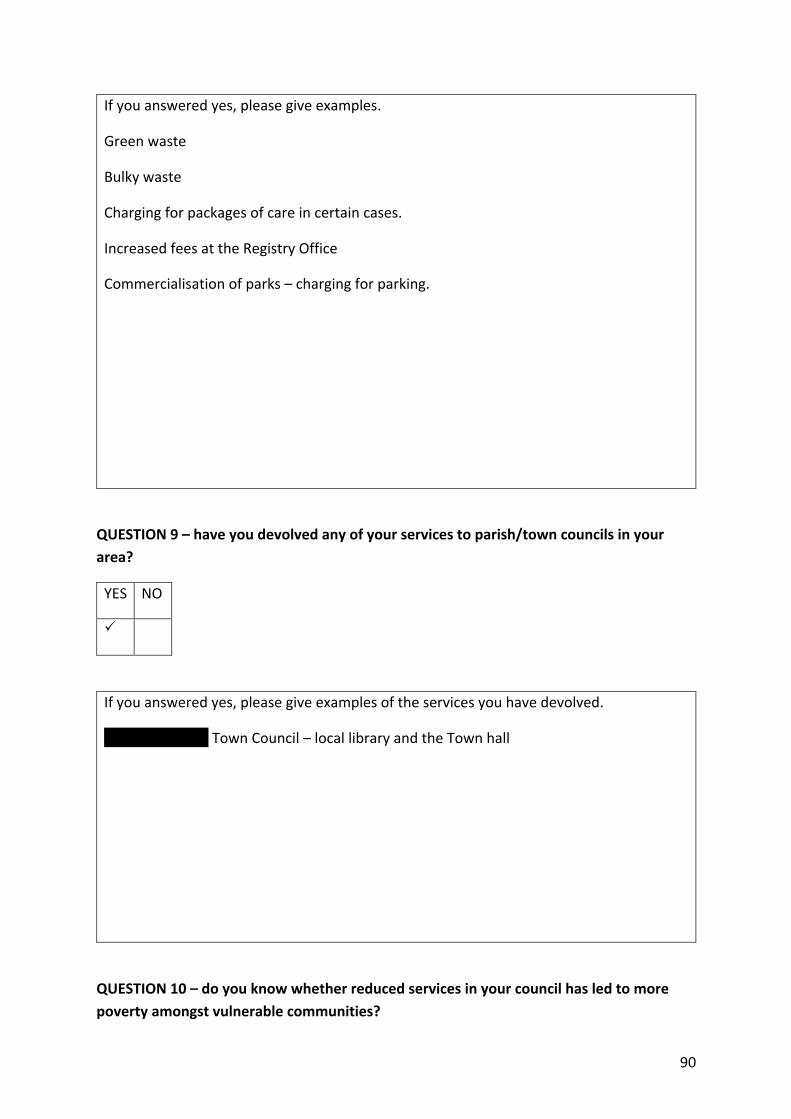
90
If you answered yes, please give examples.
Green waste
Bulky waste
Charging for packages of care in certain cases.
Increased fees at the Registry Office
Commercialisation of parks – charging for parking.
QUESTION 9 – have you devolved any of your services to parish/town councils in your area?
YES NO
P
If you answered yes, please give examples of the services you have devolved.
Sutton Coldfield Town Council – local library and the Town hall
QUESTION 10 – do you know whether reduced services in your council has led to more poverty amongst vulnerable communities?
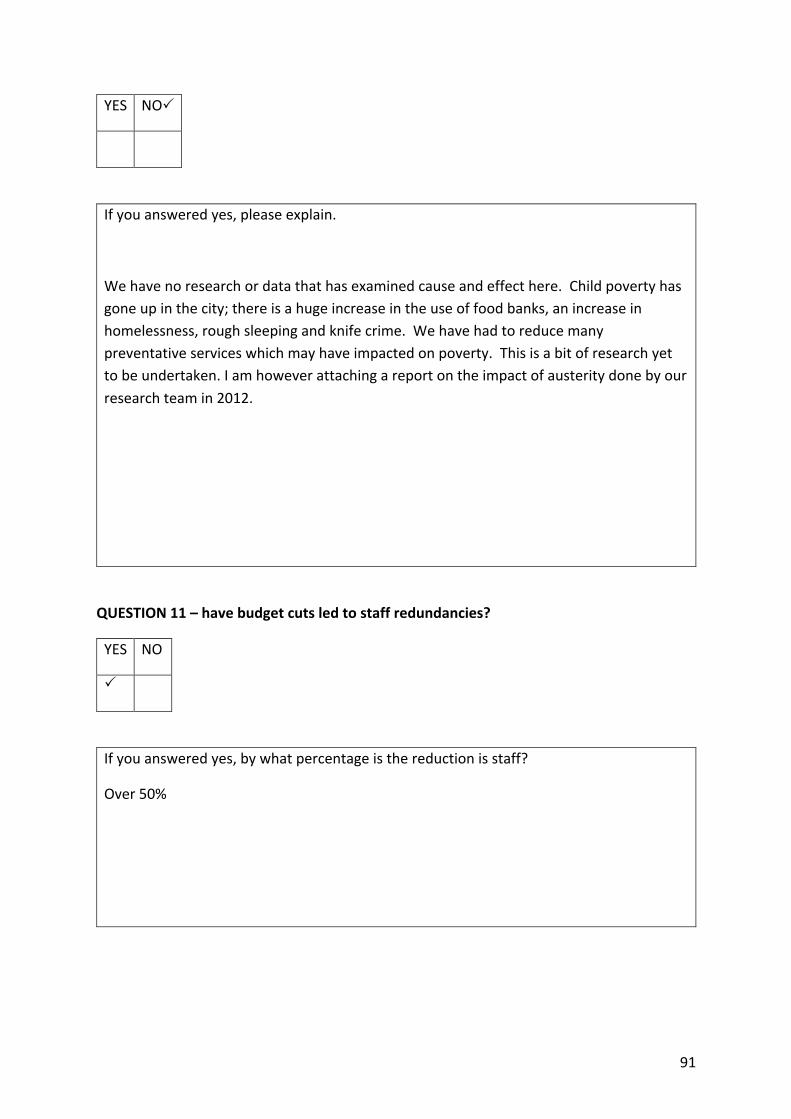
91
YES NOP
If you answered yes, please explain.
We have no research or data that has examined cause and effect here. Child poverty has gone up in the city; there is a huge increase in the use of food banks, an increase in homelessness, rough sleeping and knife crime. We have had to reduce many preventative services which may have impacted on poverty. This is a bit of research yet to be undertaken. I am however attaching a report on the impact of austerity done by our research team in 2012.
QUESTION 11 – have budget cuts led to staff redundancies?
YES NO
P
If you answered yes, by what percentage is the reduction is staff?
Over 50%
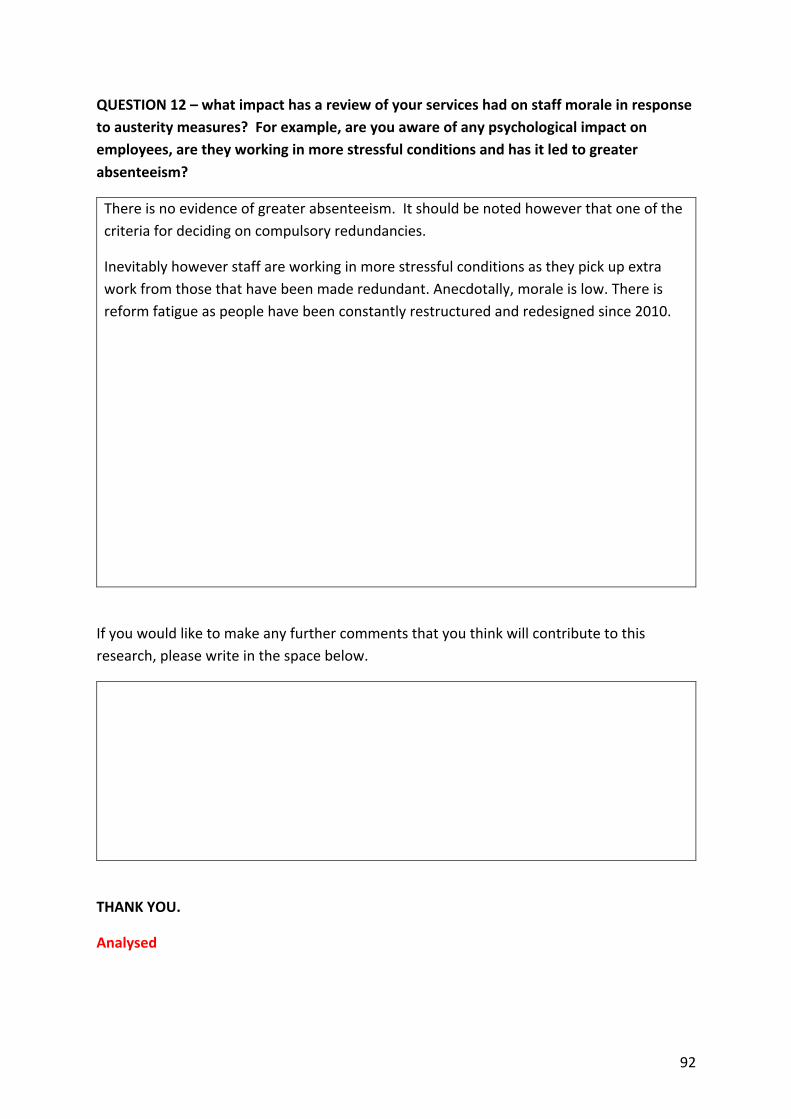
92
QUESTION 12 – what impact has a review of your services had on staff morale in response to austerity measures? For example, are you aware of any psychological impact on employees, are they working in more stressful conditions and has it led to greater absenteeism?
There is no evidence of greater absenteeism. It should be noted however that one of the criteria for deciding on compulsory redundancies.
Inevitably however staff are working in more stressful conditions as they pick up extra work from those that have been made redundant. Anecdotally, morale is low. There is reform fatigue as people have been constantly restructured and redesigned since 2010.
If you would like to make any further comments that you think will contribute to this research, please write in the space below.
THANK YOU.
Analysed

93
APPENDIX 3 Dear xxxxx I am currently a postgraduate student at the University of Birmingham undertaking a Masters of Public Administration. I am now writing my dissertation; its purpose is to explore the impact that austerity measures have had on local service delivery and how local authorities have risen to the challenge of trying to do more with less. As someone who is at the coal face of budget cuts I shall be extremely grateful if you will kindly complete the attached questionnaire which contains 12 short questions. Your participation in this research will help to demonstrate the challenges facing local authorities and how they are coping, and it is my intention to pass on the findings from this research to government to enable a greater appreciation of how people have been affected by government cuts. As a full-time Town Clerk to a small town in Shropshire I am certainly well aware of the impact budget cuts are having on my local authority. All information provided will be treated in strict confidence and participants will not be identified. If you are not the appropriate person to help with this research, please will you pass it on to someone who is willing and able? I have also attached the University’s Code of Ethics and a ‘Consent Form’ which will need to be completed along with the questionnaire. Thank you in anticipation for your valuable time in helping with this research. Yours sincerely
Sharon Clayton BA (Hons) Fellow SLCC Institute of Local Government Studies School of Government and Society Muirhead Tower University of Birmingham Edgbaston B15 2TT 0121 4114 5008
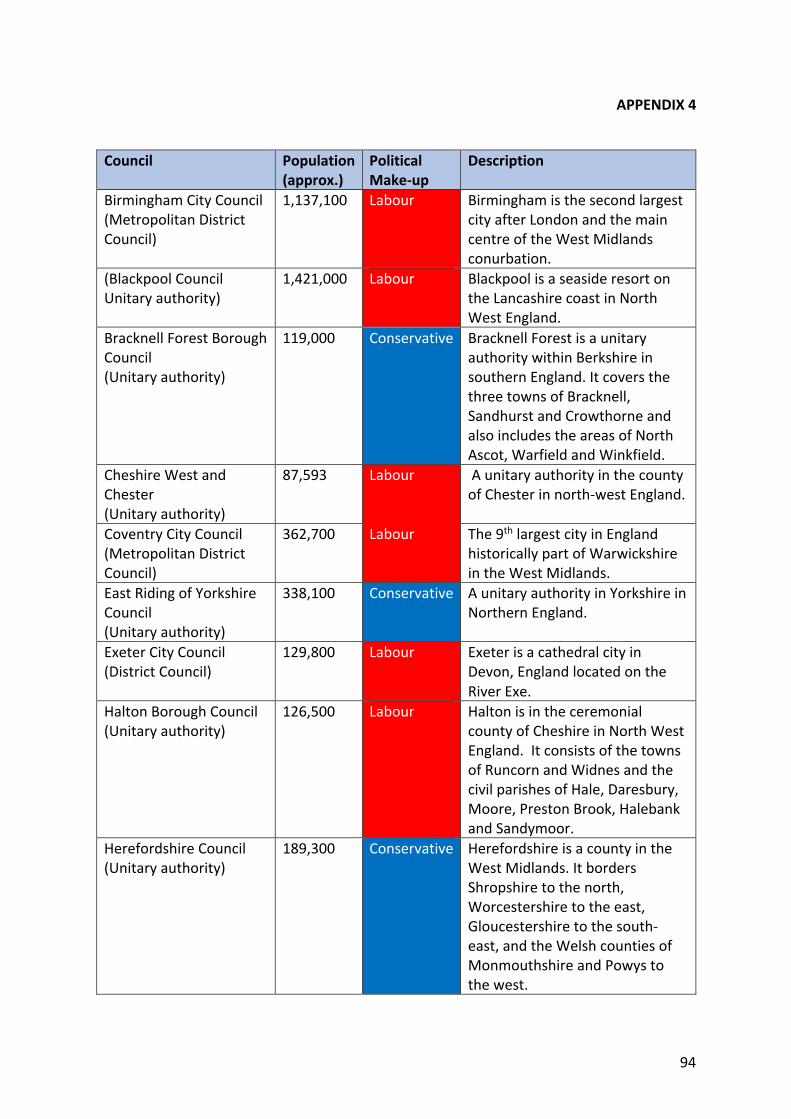
94
APPENDIX 4
Council Population (approx.)
Political Make-up
Description
Birmingham City Council (Metropolitan District Council)
1,137,100 Labour Birmingham is the second largest city after London and the main centre of the West Midlands conurbation.
(Blackpool Council Unitary authority)
1,421,000 Labour Blackpool is a seaside resort on the Lancashire coast in North West England.
Bracknell Forest Borough Council (Unitary authority)
119,000 Conservative Bracknell Forest is a unitary authority within Berkshire in southern England. It covers the three towns of Bracknell, Sandhurst and Crowthorne and also includes the areas of North Ascot, Warfield and Winkfield.
Cheshire West and Chester (Unitary authority)
87,593 Labour A unitary authority in the county of Chester in north-west England.
Coventry City Council (Metropolitan District Council)
362,700 Labour The 9th largest city in England historically part of Warwickshire in the West Midlands.
East Riding of Yorkshire Council (Unitary authority)
338,100 Conservative
A unitary authority in Yorkshire in Northern England.
Exeter City Council (District Council)
129,800 Labour Exeter is a cathedral city in Devon, England located on the River Exe.
Halton Borough Council (Unitary authority)
126,500 Labour Halton is in the ceremonial county of Cheshire in North West England. It consists of the towns of Runcorn and Widnes and the civil parishes of Hale, Daresbury, Moore, Preston Brook, Halebank and Sandymoor.
Herefordshire Council (Unitary authority)
189,300 Conservative Herefordshire is a county in the West Midlands. It borders Shropshire to the north, Worcestershire to the east, Gloucestershire to the south-east, and the Welsh counties of Monmouthshire and Powys to the west.

95
Council Population (approx.)
Political Make-up
Description
Kirklees Borough Council (Metropolitan Borough Council)
434,300 Labour Kirklees is situated in the district of West Yorkshire.
Leeds City Council (Metropolitan District Council)
766,400 Labour Leeds is a city in West Yorkshire.
Leicestershire County Council
690,200 Conservative Situated in the Midlands and borders Nottinghamshire, Lincolnshire, Rutland, Northamptonshire, Warwickshire, Staffordshire and Derbyshire.
Manchester City Council (Metropolitan District Council)
545,500 Labour Manchester is the third largest city. It is fringed by the Cheshire Plain to the south, the Pennines to the north and east, and an arc of towns with which it forms a continuous conurbation.
Telford & Wrekin Borough Council
169,400 Labour Telford & Wrekin is in Shropshire. It is parishes and includes the market towns of Dawley, Madeley, Oakengates, Newport and Wellington and smaller parish councils. The borough borders Staffordshire.
Wolverhampton City Council (Metropolitan District Council)
251,000 Labour Wolverhampton is in the West Midlands.
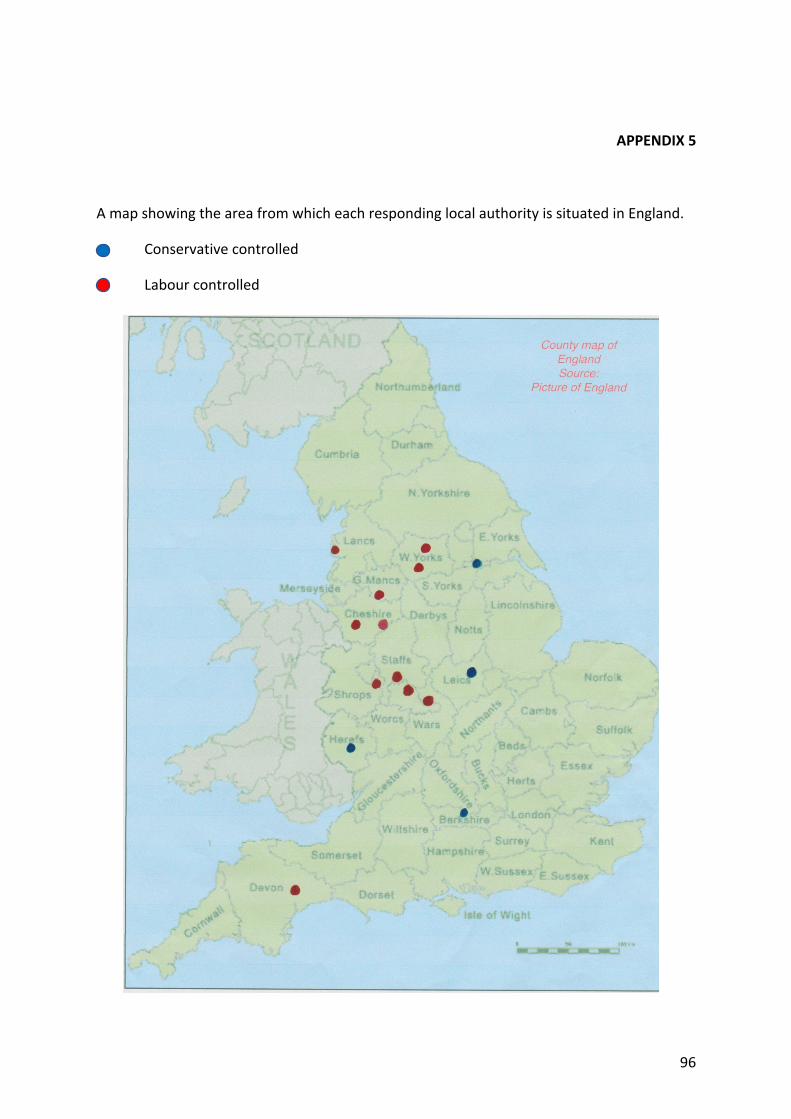
96
APPENDIX 5
A map showing the area from which each responding local authority is situated in England.
Conservative controlled
Labour controlled