Embed Size (px)
Citation preview

MICROBIOLOGY OF AQUATIC SYSTEMS
Importance of Bacterial Maintenance Respiration in a Subarctic Estuary:a Proof of Concept from the Field
Kevin Vikström1& Johan Wikner1,2
Received: 4 January 2018 /Accepted: 7 August 2018# The Author(s) 2018
AbstractBacterial respiration contributes to atmospheric carbon dioxide accumulation and development of hypoxia and is a critical, oftenoverlooked, component of ecosystem function. This study investigates the concept that maintenance respiration is a significantproportion of bacterial respiration at natural nutrient levels in the field, advancing our understanding of bacterial living conditionsand energy strategies. Two river-sea transects of respiration and specific growth rates were analyzed representing low- and high-productivity conditions (by in situ bacterial biomass production) in a subarctic estuary, using an established ecophysiologicallinear model (the Pirt model) estimating maintenance respiration. The Pirt model was applicable to field conditions during high,but not low, bacterial biomass production. However, a quadratic model provided a better fit to observed data, accounting for themaintained respiration at low μ. A first estimate of maintenance respiration was 0.58 fmol O2 day
−1 cell−1 by the quadratic model.Twenty percent to nearly all of the bacterial respiration was due to maintenance respiration over the observed range of μ (0.21–0.002 day−1). In the less productive condition, bacterial specific respiration was high and without dependence on μ, suggestingenhanced bacterial energy expenditure during starvation. Annual maintenance respiration accounted for 58% of the totalbacterioplankton respiration based on μ frommonitoring data. Phosphorus availability occasionally, but inconsistently, explainedsome of the remaining variation in bacterial specific respiration. Bacterial maintenance respiration can constitute a large share ofpelagic respiration and merit further study to understand bacterial energetics and oxygen dynamics in the aquatic environment.
Keywords Marine . Bacteria .Maintenance . Respiration . Stoichiometry .Model
Introduction
Bacterial respiration constitutes the largest cause of aquaticoxygen consumption and, therefore, is crucial for the devel-opment of oxygen minimum zones and hypoxia worldwide[1–3]. The level and control of bacterial respiration are alsocrucial for bacterial growth efficiency (BGE), determining theallocation of carbon between bacterial biomass productionand CO2 emission. Advancement of our understanding of
bacterial respiration and its influence on growth efficiency isrequired to model the global carbon cycle, as well as to coun-teract hypoxia worldwide and correctly manage the status ofthe marine environment. In this context, bacterial maintenancerespiration has been overlooked.
It has been common in the scientific literature to use aconstant (i.e., average) value for BGE between 0.1 and 0.4when calculating the bacterial carbon demand (cf. [4]). Thiscommon practice suggests that respired carbon constitutes awell-defined fraction of assimilated carbon. In contrast, BGEvaries at least 50-fold with the level of bacterial production[5–8]. In oligotrophic (e.g., deep ocean) or cold environments(i.e., winter, polar seas) constituting a large and sparsely in-vestigated volume of the ocean, bacterial growth is low andBGE may be below 10% [5, 9–11]. This suggests that main-tenance respiration from a global perspective may besubstantial.
To understand the level and control of maintenance respi-ration in the natural environment, we used the best availableecophysiological model for bacterial respiration, the Pirt
Electronic supplementary material The online version of this article(https://doi.org/10.1007/s00248-018-1244-7) contains supplementarymaterial, which is available to authorized users.
* Johan [email protected]
1 Department of Ecology and Environmental Science, UmeåUniversity, SE-901 87 Umeå, Sweden
2 Umeå Marine Sciences Center, Norrbyn 557, SE-90571 Hörnefors, Sweden
Microbial Ecologyhttps://doi.org/10.1007/s00248-018-1244-7

model [9]. Neijssel and Tempest [12] investigated the influ-ence of nutrient stoichiometry on growth and respiration inKlebsiella aerogenes measured in chemostat monocultures.The resulting model describes the relationship between thespecific rate of substrate utilization (e.g., O2), the specificbacterial growth rate, and the nutrient limitations underenergy- and carbon-rich conditions. Maintenance respirationis part of the model and is at significantly higher levels duringphosphorus limitation than during nitrogen or carbon limita-tion. This model was further developed by Pirt [9] to includethe influence of a growth-dependent maintenance respiration(m′), which suggests a relationship between the rate of sub-strate utilization (e.g., specific respiration, Rsb) and μ, furtherexplained in the BMethods and Materials^ section. However,to our knowledge, only one study has used the Pirt model andliterature values to investigate the control of bacterial growthefficiency, also providing an estimate of bacterial maintenancerespiration [13]. Thus, the validity of this postulate in naturalaquatic environments remains to be investigated. By simpli-fying the Pirt model, we observed an opportunity to test itsvalidity in field conditions and to estimate total maintenancerespiration for natural bacterial communities. The contributionon a yearly scale was calculated using monitoring data, as-suming the marked governance of Rsb by μ in the Pirt modelapplicable to field conditions.
Current knowledge shows that temperature, nutrient stoi-chiometry, and the concentration and quality of carbon sub-strates are the main factors governing bacterial respiration(e.g. [14–18]). A study in the Hudson River suggests thatrespiration is positively influenced by glucose addition (i.e.,carbon substrate) and temperature [8]. Other studies from theChesapeake Bay and from Canadian lakes show that elevatedcarbon-to-phosphorus (C:P) ratios increase respiration [19,20]. Nutrients interacting with temperature also influence bac-terial respiration according to earlier studies [21, 22]. Thus,the ratio of the bioavailable C:P and C:N, as well as the qualityof carbon substrates, may interact with temperature to influ-ence the level of Rsb and, thus, the BGE in the field. A generalmodel describing the control of bacterial respiration by thesefactors is, however, still lacking.
Here, we investigate (1) if the Pirt model can be appliedto natural bacterial communities and estimate the bacterialmaintenance respiration, (2) the potential contribution frombacterial maintenance respiration over an annual scale usingdata from a monitoring program, and (3) the influence ofnutrient stoichiometry (i.e., C:P) and limitation on the levelof bacterial respiration. This was performed by analyzingmeasurements from subarctic river-sea transects under nat-ural nutrient levels and growth rates of free-living bacteria.By sampling at high- and low-productivity conditions, thisprovided a large range of bacterial specific growth ratescomparable to the annual range. Bacterial maintenance res-piration (Rm) was estimated as the y-intercept using a
simplified Pirt model, assuming bacterial specific growthrates as the main predictor for bacterial respiration.
Methods and Materials
Study Site and Sampling
Samples were taken from transects with 10 stations at a periodof low productivity (April) and 11 stations at a period of highproductivity (August) in the Öre Estuary, located in the north-western Bothnian Sea (a basin in the Baltic Sea, Fig. 1). Thissubarctic estuary had a high input of dissolved organic carbon(DOC) from the Öre River (12 × 106 [kg total organic carbon]year−1 [23]), was generally phosphorus limited [24], and has amean depth of 10 m and a residence time of 10 days, exchang-ing water primarily with the main basin of the Bothnian Sea.
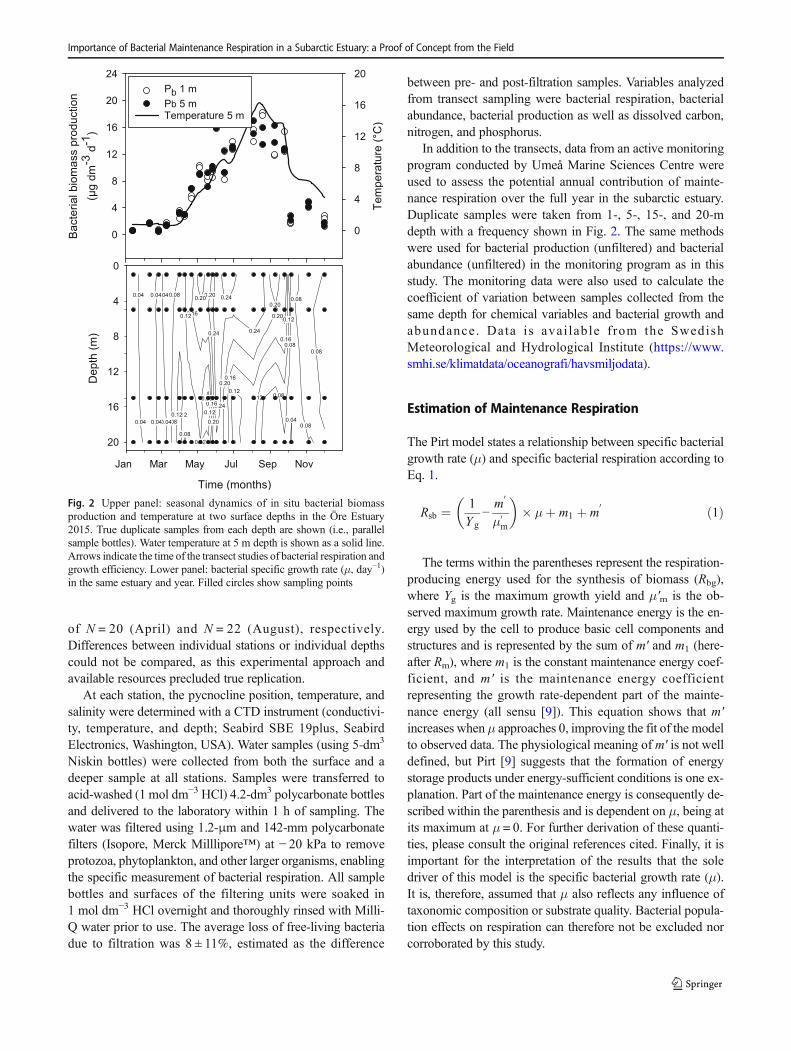
Water samples were obtained from 20 to 22 April 2015,showing poor bacterial growth conditions, and from 3 to 7August 2015, showing favorable bacterial growth conditions.The productivity level was deduced from the annualbacterioplankton biomass production in situ (Fig. 2, upperpanel). Stations were randomized with removal of once cho-sen stations to avoid time dependency during the samplingweek. The experimental design was developed to allow anal-ysis of the whole transect at two depth layers (above andbelow the pycnocline upper part), maximizing the range ofboth growth and respiration rates, resulting in total samples
Fig. 1 Map of sampling sites (filled circles) in the Öre Estuary, northernBaltic Sea. Decimal degrees for latitude and longitude shown on the axes
Vikström K., Wikner J.
of N = 20 (April) and N = 22 (August), respectively.Differences between individual stations or individual depthscould not be compared, as this experimental approach andavailable resources precluded true replication.
At each station, the pycnocline position, temperature, andsalinity were determined with a CTD instrument (conductivi-ty, temperature, and depth; Seabird SBE 19plus, SeabirdElectronics, Washington, USA). Water samples (using 5-dm3
Niskin bottles) were collected from both the surface and adeeper sample at all stations. Samples were transferred toacid-washed (1 mol dm−3 HCl) 4.2-dm3 polycarbonate bottlesand delivered to the laboratory within 1 h of sampling. Thewater was filtered using 1.2-μm and 142-mm polycarbonatefilters (Isopore, Merck Milllipore™) at − 20 kPa to removeprotozoa, phytoplankton, and other larger organisms, enablingthe specific measurement of bacterial respiration. All samplebottles and surfaces of the filtering units were soaked in1 mol dm−3 HCl overnight and thoroughly rinsed with Milli-Q water prior to use. The average loss of free-living bacteriadue to filtration was 8 ± 11%, estimated as the difference
between pre- and post-filtration samples. Variables analyzedfrom transect sampling were bacterial respiration, bacterialabundance, bacterial production as well as dissolved carbon,nitrogen, and phosphorus.
In addition to the transects, data from an active monitoringprogram conducted by Umeå Marine Sciences Centre wereused to assess the potential annual contribution of mainte-nance respiration over the full year in the subarctic estuary.Duplicate samples were taken from 1-, 5-, 15-, and 20-mdepth with a frequency shown in Fig. 2. The same methodswere used for bacterial production (unfiltered) and bacterialabundance (unfiltered) in the monitoring program as in thisstudy. The monitoring data were also used to calculate thecoefficient of variation between samples collected from thesame depth for chemical variables and bacterial growth andabundance. Data is avai lable f rom the SwedishMeteorological and Hydrological Institute (https://www.smhi.se/klimatdata/oceanografi/havsmiljodata).
Estimation of Maintenance Respiration
The Pirt model states a relationship between specific bacterialgrowth rate (μ) and specific bacterial respiration according toEq. 1.
Rsb ¼ 1
Y g−m
0
μ0m
� �� μþ m1 þ m
0 ð1Þ
The terms within the parentheses represent the respiration-producing energy used for the synthesis of biomass (Rbg),where Yg is the maximum growth yield and μ′m is the ob-served maximum growth rate. Maintenance energy is the en-ergy used by the cell to produce basic cell components andstructures and is represented by the sum of m′ and m1 (here-after Rm), where m1 is the constant maintenance energy coef-ficient, and m′ is the maintenance energy coefficientrepresenting the growth rate-dependent part of the mainte-nance energy (all sensu [9]). This equation shows that m′increases when μ approaches 0, improving the fit of the modelto observed data. The physiological meaning of m′ is not welldefined, but Pirt [9] suggests that the formation of energystorage products under energy-sufficient conditions is one ex-planation. Part of the maintenance energy is consequently de-scribed within the parenthesis and is dependent on μ, being atits maximum at μ = 0. For further derivation of these quanti-ties, please consult the original references cited. Finally, it isimportant for the interpretation of the results that the soledriver of this model is the specific bacterial growth rate (μ).It is, therefore, assumed that μ also reflects any influence oftaxonomic composition or substrate quality. Bacterial popula-tion effects on respiration can therefore not be excluded norcorroborated by this study.
Fig. 2 Upper panel: seasonal dynamics of in situ bacterial biomassproduction and temperature at two surface depths in the Öre Estuary2015. True duplicate samples from each depth are shown (i.e., parallelsample bottles). Water temperature at 5 m depth is shown as a solid line.Arrows indicate the time of the transect studies of bacterial respiration andgrowth efficiency. Lower panel: bacterial specific growth rate (μ, day−1)in the same estuary and year. Filled circles show sampling points
Importance of Bacterial Maintenance Respiration in a Subarctic Estuary: a Proof of Concept from the Field

The Pirt model (Eq. 1) was simplified to enable an estimateof the maintenance respiration when μ approached 0 for anatural bacterial community and at nutrient levels found inthe field according to the following equation:
ð2Þwhere Rsb is the measured cell-specific bacterioplanktonrespiration, b is the expression within the parenthesis inEq. 1, and μ is the measured cell-specific bacterial growthrate. The product bμ describes respiration associated withthe synthesis of bacterial biomass (i.e., growth or celldivision, referred to as Rbg in Fig. 6). Rm is the sum ofconstant (m1) and growth-dependent maintenance respira-tion (m′), with the latter showing a maximum at μ = 0 asexplained above. Rm was estimated as the y-axis interceptby model II linear regression with a major axis loss func-tion according to Eq. 2 or the quadratic model (seeBResults^ section, Eq. 5). Major axis regression takesthe uncertainty in both the x and y terms into account byminimizing the perpendicular distance from the predictedto the observed y rather than considering the least squaressum of the squared vertical distances (SPSSTM [25]).
Calculation of the Annual Influence of MaintenanceRespiration
The potential influence of maintenance respiration (RmA/RsbA)in the natural environment on the annual scale was calculatedas a weighted sum, assuming a distinct dependence on μ andusing a full annual monitoring data set for observed μ (Fig. 2,lower panel) according to Eq. 3.
RmA
RsbA¼ ∑0:28
0 f h �Rm μð ÞRsb μð Þ ð3Þ
where fh is the fraction of values in μ intervals of 0.02 day−1
(i.e., calculated from a histogram), encompassing the range ofμ values observed in the monitoring data [26] from the ÖreEstuary ranging from January to December 2015 and thewhole water column (i.e., 0.02–0.28 day−1, Fig. 2, lower pan-el). Rsb(μ) was calculated with observed μ values from the fullannual data set, using Rm(μ) and b as derived from the Augustdata and Eq. 2 (linear model). The same calculation was also
done using the nonlinear Eq. 5 (quadratic model, see below) tocompare the results of the different models. This calculationassumed that factors other than bacterial specific growth ratehad negligible effects on the relationship with Rsb, as postu-lated by the Pirt model. The calculation also ignored the po-tentially higher influence of Rm under low-productivity con-ditions implied by the April observations.
Respiration Measurements
Bacterial respiration was measured in one replicate for eachsample in acid-washed 1-dm3 glass bottles according toWikner et al. [27] using Aanderaa model 4330 oxygenOptodes™ with a titanium housing rather than the previousplastic-housed model 3835. Controls with autoclaved seawa-ter showed a negligible drift, resulting in a detection limit of0.9μmol O2 dm
−3 day−1. The detection limit was calculated asthe sum of squared standard error (SE) per sample and thesquared standard deviation (SD) of the drift, and it fell withinthe ranges reported elsewhere (e.g., [15, 27–29]). The sampleswere incubated in the dark at in situ temperature (± 0.05 °C) ina temperature-controlled water bath (Julabo ED, Julabo 13)equipped with an immersion cooler (Julabo FT 200). Theoxygen concentration was measured every minute for 12–24 h with continuous stirring using a magnetic bead. Therespiration rate was calculated by a linear regression when amonotonic decline in oxygen was observed. For nonlineardeclines, the respiration rate was calculated after 1 h of incu-bation using the first derivative function of a second-orderpolynomial. Respiration curves were defined as nonlinearwhen the fitted R2 value was 0.02 higher than when fitting alinear curve. Using this criterion as a guideline, ~ 67% ofmeasurements were nonlinear, leading to an underestimationof the respiration rates if using a linear model (mean − 70%).Cell-specific bacterioplankton respiration (Rsb) was calculatedby dividing the bacterial respiration rate by bacterial cell abun-dance determined directly after 1.2-μm filtration. The varia-tion coefficient between sample bottles from the same depthwas estimated to be ± 9.5% based on individually sampledmeasurements from the same estuary (n = 8, data not shown).
Bacterial Abundance
Bacterial abundance was estimated by direct epifluorescencemicroscopy according to Hobbie et al. [30]. Samples werecollected to determine the total bacterial abundance prior tofiltration, after filtration, and after 12 to 24 h of respirationmeasurements. Water was collected in 50-cm3 Falcon tubesrinsed with sample water and was preserved with 37% form-aldehyde (2% final concentration); 5-cm3 sample aliquotswere filtered onto 0.2-μm black-stained polycarbonate filters(25 mm, DHI) and stained with Acridine orange(10 mmol dm−3, Sigma-Aldrich) which enables proper
Vikström K., Wikner J.
whole-cell labeling for accurate cell volume calculation ac-cording to Blackburn et al. [31]. Cell abundance and cell vol-ume were determined by epifluorescence microscopy(Axiovert 100, Zeiss GmBH Germany) using image analysisprocedures [31]. The coefficient of variation between samplebottles was estimated to be ± 4.2%, based on separate samplesfrom the same estuary (n = 33, monitoring data). Cell volumewas converted to cell carbon density according to the func-tions described by Norland [32] and Simon and Azam [33] forcalculating bacterial biomass production in carbon units. Onebacterial abundance sample was lost during fixation, reducingthe number of samples for calculating μ in April (from N = 20to N = 19).
Bacterial Growth
Bacterial community biomass production (Pb) was deter-mined in triplicate subsamples directly after 1.2-μm filtrationusing the thymidine incorporation method at an in situ tem-perature in the same water baths as described for the respira-tion measurements [34]. Thymidine incorporation was select-ed because the rate of cell division is relevant for measuringthe bacterial specific growth rate (μ), and season-specific con-version factors for cell production were available. In addition,using the thymidine method standardized the procedure forbiomass calculation between bacterial biomass and the bacte-rial biomass production reducing uncertainty. The choice of atrace compound should, however, not be critical when usingempirical conversion factors, as thymidine and leucine incor-pora t ion then provide comparab le es t imates ofbacterioplankton production [35]. A 1-cm3 water samplewas added to an Eppendorf tube, and 100 mm3 ice-coldTCA (50%) was added to the controls to stop growth. 3H-thymidine (2 mm3, 86 mCi mmol−1, 20 nM final concentra-tion; GE Healthcare, Buckinghamshire, UK) was added to thesamples and controls, which were then incubated for 1 h.Uptake of 3H-thymidine was converted to cell productionusing a season-specific thymidine conversion factor (TCF)of 1.2 × 10¹⁸ (April, ±SE 0.66 × 10¹⁸, n = 3) or 1.7 × 10¹⁸
(August, ±SE 0.21 × 10¹⁸, n = 2) cells [mol thymidine]−1,where the August TCF was 46% higher than the April TCF.The same conversion factor was assumed applicable for allsamples during each transect. The estimated TCFs were closeto reported values from the same environment [11]. The sea-sonal TCFswere determined by simultaneousmeasurement ofthymidine uptake and bacterial abundance in duplicate batchcultures with reduced predator abundance by dilution in0.2-μm filtered sea water (1:3, unpublished data). For thenumerical analysis, the modified derivative analysis methodwas applied according to Kirchman and Ducklow [36]. Forconversion to carbon units, the cell carbon density determinedabove for bacterial biomass, based on the cell volume calcu-lation for each sample, was multiplied by cell production. The
same method was used for the field estimates of in situ bacte-rial biomass production in unfiltered samples (i.e., monitoringdata). The bacterial biomass production estimates had a medi-an coefficient of variation between sample bottles from thesame depth of ± 6.4%, based on separate samples from thesame estuary (n = 60, monitoring data). The bacterial specificgrowth rate (μ) within 1 h of the 1.2-μm filtration was calcu-lated by dividing bacterial production with bacterial abun-dance, both in cell units. The μ in filtered samples in this studywas compared with μ in unfiltered samples derived frommon-itoring data (see below) from the same month and depth layer(n = 4). Medians of specific growth rate were compared usingan independent-samples k-sample median test with SPSS™(v.23) software.
Bacterial Growth Efficiency
BGE was determined by the function
BGE ¼ Pb
Pb þ Rbð4Þ
where Pb is the measured bacterial community biomass pro-duction in carbon units, and Rb is the measured bacterial com-munity respiration within an hour of filtration of the sample. Arespiration quotient (RQ) of 0.9 was applied to convert O2
consumption to carbon units [37].
Nutrients and Dissolved Organic Carbon
Fifty cubic centimeters of the 1.2-μm filtrate at each stationand depth was collected and stored in Falcon tubes pre-rinsedwithMilli-Q water. The samples were filtered through 0.2-μmsterile filters, filtrate oxidized with potassium peroxodisulfate,autoclaved, and stored at room temperature. Analysis wasdone within a week using an accredited standard operatingprocedure at Umeå Marine Sciences Centre to measure totaldissolved phosphorus (TDP) and total dissolved nitrogen(TDN). The method described by Grasshoff et al. [38] wasused, including a four-channel autoanalyzer (QuAAtroMarine, Bran & Luebbe®, Sweden). The median variationcoefficient between samples from the same depth was estimat-ed to be ± 2.1% for TDP and ± 8.2% for TDN based on sam-ples from the same estuary.
The concentration of DOC was determined by transferring60 cm3 subsamples from the 1.2-μm filtrate to rinsed hydro-philic surface-coated polystyrene bottles (Nunc®, ThermoFisher Scientific) according to accredited and calibrated stan-dard operating procedures at Umeå Marine Sciences Centre.Duplicate subsamples with a volume of 30 cm3 were filtersteri l ized (0.2 μm, 25 mm Ø , Supor fil ters, PallCorporation), acidified with HCl to an approximate pH of 4,and stored in the dark at 8 °C for less than a week. The DOC
Importance of Bacterial Maintenance Respiration in a Subarctic Estuary: a Proof of Concept from the Field

was determined using a high-temperature catalytic oxidationinstrument with nondispersive infrared (NDIR) detection anda TOC-L instrument (Schimadzu Corporation, Kyoto, Japan)[39, 40]. The median variation coefficient between samplescollected from the same depth was estimated to be ± 2.2% forthe DOC based on samples from the same estuary.
Correlation Analysis
The correlation analysis was conducted using IBM SPSS™(version 22). The data were generally not normally distributed(Shapiro-Wilks test) within months or across transects.Transformations using the inverse and the natural logarithmfailed to transform all independent variables to fit a normaldistribution. Therefore, a nonparametric Kendall’s tau two-tailed test with Bonferroni correction for multiple comparisonswas used to determine the correlation coefficient rτ. The datawere analyzed per depth layer (April n = 10, August n = 11)and for the depth layers combined (April n = 20, August n =22) for both productivity conditions. One bacterial samplefrom April was lost. Due to the data distribution, parametrictests (including multiple factors) were not applicable.
Results
Environmental Conditions and Range of Variables
The average temperature was 3.1 °C in April and 13.9 °C inAugust, showing a 3 °C difference within the transect in Apriland a 10 °C difference in August (Table S1, Fig. 2). Thebacterial biomass production in situ co-varied with the tem-perature, where low- and high-productivity conditions for bac-teria were observed in April and August, respectively (Fig. 2).Salinity was higher in April (4.18 g kg−1) than in August(2.97 g kg−1), showing a similar range from 0 to 5 (± 0.5) gkg−1 over the whole transect in both productivity conditions.
TDP was approximately 40% higher in April than inAugust and showed a 7.7-fold range in April and a 3.8-foldrange in August (Table S1). The corresponding ranges forTDN were 2.6-fold in April and a 3.8-fold range in August,while median values were similar between productivity con-ditions. DOC was 61 μmol dm−3 higher in August than inApril, showing a similar 3-fold range within transects. Thecorresponding range for the C:P ratio was 9-fold in bothApril and August, demonstrating a 47% higher median inAugust. The observed nutrient ratios for both carbon and ni-trogen versus phosphorus were high compared to the stoichio-metric molar ratios expected for bacteria (45 C:10 N:1 P, [41])and phytoplankton (106 C:16 N:1 P, Redfield ratio, Table S1),respectively.
The bacterial specific growth rates in the 1.2-μm filteredsamples varied 4-fold in April and 10-fold in August. Specificbacterial respiration (Rsb) showed a 24-fold range in the river-to-offshore transect in April and a 6.3-fold range in August,with similar median values between the productivity condi-tions (Table S1). The median value of BGE for both depthlayers was approximately three times lower in April (2%)compared to the value in August (7%, Mann-Whitney U test,p < 0.01, n = 20). All BGE values were below 18%, and theminimum values approached 0 at both productivityconditions.
The bacterial specific growth rate (μ) of free-living bacteriain the 1.2-μm filtrate was approximately 4 times lower inApril than the growth rates measured in unfiltered samplesduring the same month (Table 1). For August, the values were3 times lower in the filtered samples. The effect of filtrationwas statistically significant for both months at both depthlevels (k-sample median test, p < 0.05), with the exception ofApril below the pycnocline, which was slightly above theconventional significance level for both depth layers (k-sam-ple median test, p = 0.07). The latter was related to a higherstandard deviation for the August samples for both the filteredtransect samples and unfiltered monitoring data. The filtered
Table 1 Median values of bacterial specific growth rate (μ) in the 1.2-μm filtrate compared with field (monitoring) data measured in the samemonth in unfiltered water samples from the Öre Estuary in 2015.
Maximum values (Max.), minimum values (Min.), standard deviation(SD), and number of samples (n) are shown
Month Treatment Surface water μ (day−1) Deep water μ (day−1)
Median Max. Min. SD n Median Max. Min. SD n
April < 1.2 μm 0.032 0.043 0.013 0.010 11 0.018 0.031 0.007 0.007 9
Whole water 0.13 0.16 0.12 0.023 4 0.10 0.11 0.075 0.017 4
Whole w./ < 1.2 μm 2.6 2.9
August < 1.2 μm 0.047 0.20 0.013 0.069 12 0.015 0.17 0.002 0.052 10
Whole water 0.26 0.28 0.24 0.015 4 0.10 0.14 0.072 0.035 4
Whole w./ < 1.2 μm 4.8 7.5
Vikström K., Wikner J.

samples in August still covered 75% of the range of μ inunfiltered samples over the full year and water column(monitoring data, Fig. 2, lower panel). Minimum values infiltered samples were in general clearly lower than in the un-filtered samples (Table S1).
Relationships Between Bacterial Specific Respirationand μ
Only the August data showed a significant linear rela-tionship between Rsb and μ (R2 = 0.45, model II regres-sion, Fig. 3). The y-intercept corresponded to a Rm of0.32 (± 95% CI 0.18) fmol O2 day−1 cell−1 and a linearslope coefficient (bl) of 8.0 ± 95% CI 2.96. A nonlinearregression with a quadratic polynomial model resultedin a better coefficient of determination (R2 = 0.57):
Rsb ¼ Rm þ bn � μ2 ð5Þ
The y-intercept coefficient was statistically significant(0.58 fmol O2 day
−1 cell−1, 95% trimmed range 0.44–0.78),as was the nonlinear coefficient bn (28.7 fmol O2 day cell−1,95% trimmed range 18.6–41.3). Trimmed range is the uncer-tainty measure of nonlinear analysis due to bootstrappingmethodology. Neither April alone nor both months combinedshowed a statistically significant relationship between Rsb andμ. However, the April data clearly demonstrated higher respi-ration rates in individual samples than the data from August(Fig. 3, cf. 95% CI). The average specific bacterial respira-tion in April was also significantly different from 0, at1.75 fmol O2 day−1 cell−1 (± 95% CI 0.45), which was
approximately 3 times higher than the Rm for the Augustdata and twice the mean for Rsb in August (0.81 fmol O2
day−1 cell−1 ± 95% CI 0.22).Most values for μ observed in April were in the lower range
of the August values, as expected, but this difference was notstatistically significant (Mann-Whitney U test, p > 0.05, N =19, one lost sample). Thus, despite similar μ values for sam-ples from April and August, the bacterial cell-specific respira-tion was, on average, higher in April (Mann-Whitney U test,p < 0.01, N = 19). Heterotrophic productivity was higher inAugust, as verified by the significantly higher bacterial bio-mass production both in filtered samples (Mann-Whitney Utest, p < 0.01, N = 19, Fig. 2 upper panel, Table S1) and inunfiltered samples from the field (t test, p < 0.05).
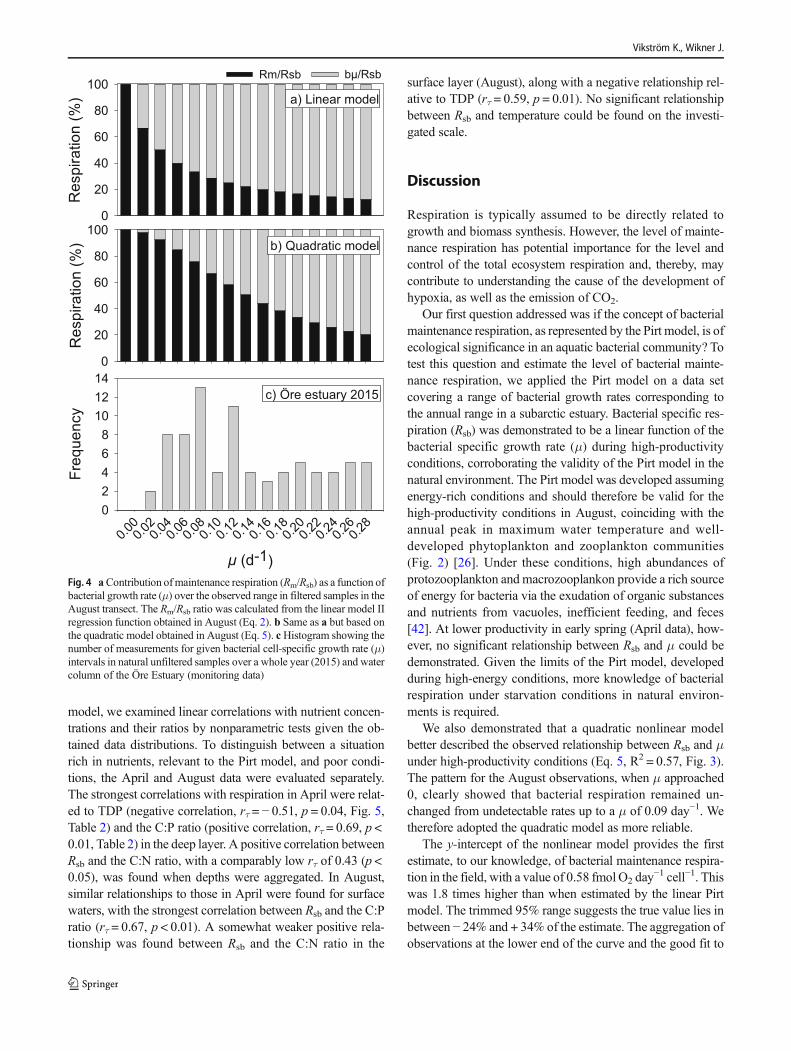
To assess the potential contribution of maintenance respi-ration at different specific growth rates, the relative contribu-tion of Rm versus that of Rsb was calculated for the set of μvalues observed in the monitoring data of the Öre Estuary2015. Specific growth rates from the monitoring data span-ning January to December of 2015 and the whole water col-umn were aggregated in intervals of 0.02 day−1 (i.e., a histo-gram, Fig. 4). Calculations of maintenance respiration (Rm)according to the modified linear Pirt model (Eq. 2) showedthatRm amounted to over 40% ofRsb at μ less than 0.06 day−1,declining exponentially with increasing μ (Fig. 4a). Using thecoefficients from the empirically derived quadratic model, Rmamounted to 85% of Rsb at the same μ, showing a sigmoidalincrease as μ declined (Fig. 4b). It was assumed in this calcu-lation that growth-related maintenance respiration remainedunchanged at higher growth rates (rather than decreasing),suggesting a possible overestimate of Rm at a higher μ.
To prove the concept regarding the contribution of Rm onan annual scale, the calculated Rm/Rsb was integrated over theyear 2015 and over the whole water column for the ÖreEstuary (Eq. 3). The obtained histogram of bacterial specificgrowth rates (Fig. 4c) showed that the range of μ observed inAugust covered the majority (75%) of the μ range measuredduring 2015. Thus, bacterial specific growth rates measured insamples collected during a week in August, covering a land-sea transect and different depth layers, matched the rangefound during a full year for unfiltered samples from this sub-arctic estuary. By using the relationship of Rm/Rsb values andμ in Fig. 4a (linear model), we calculated a weighted annualaverage contribution of Rm to Rsb (Eq. 3) of 24% for the ÖreEstuary in 2015. Using the coefficients from the nonlinearmodel (Eq. 5), the influence of maintenance respiration onan annual level increased to 58%.
Correlations between Respiration, Nutrients,and Temperature
Based on the linear influence of nutrients, and especially ofphosphorus, on bacterial respiration postulated by the Pirt
µ Fig. 3 Bacterial cell-specific respiration rate (Rsb) plotted against bacte-rial cell-specific growth rate (μ) for both months. The dashed line showsthe significant model II regression for August (Eq. 2). The solid lineshows the fit for the quadratic model (Eq. 5). Error bars show 2 × SDcalculated from replicate sample bottles in the monitoring data set
Importance of Bacterial Maintenance Respiration in a Subarctic Estuary: a Proof of Concept from the Field
model, we examined linear correlations with nutrient concen-trations and their ratios by nonparametric tests given the ob-tained data distributions. To distinguish between a situationrich in nutrients, relevant to the Pirt model, and poor condi-tions, the April and August data were evaluated separately.The strongest correlations with respiration in April were relat-ed to TDP (negative correlation, rτ = − 0.51, p = 0.04, Fig. 5,Table 2) and the C:P ratio (positive correlation, rτ = 0.69, p <0.01, Table 2) in the deep layer. A positive correlation betweenRsb and the C:N ratio, with a comparably low rτ of 0.43 (p <0.05), was found when depths were aggregated. In August,similar relationships to those in April were found for surfacewaters, with the strongest correlation between Rsb and the C:Pratio (rτ = 0.67, p < 0.01). A somewhat weaker positive rela-tionship was found between Rsb and the C:N ratio in the
surface layer (August), along with a negative relationship rel-ative to TDP (rτ = 0.59, p = 0.01). No significant relationshipbetween Rsb and temperature could be found on the investi-gated scale.
Discussion
Respiration is typically assumed to be directly related togrowth and biomass synthesis. However, the level of mainte-nance respiration has potential importance for the level andcontrol of the total ecosystem respiration and, thereby, maycontribute to understanding the cause of the development ofhypoxia, as well as the emission of CO2.
Our first question addressed was if the concept of bacterialmaintenance respiration, as represented by the Pirt model, is ofecological significance in an aquatic bacterial community? Totest this question and estimate the level of bacterial mainte-nance respiration, we applied the Pirt model on a data setcovering a range of bacterial growth rates corresponding tothe annual range in a subarctic estuary. Bacterial specific res-piration (Rsb) was demonstrated to be a linear function of thebacterial specific growth rate (μ) during high-productivityconditions, corroborating the validity of the Pirt model in thenatural environment. The Pirt model was developed assumingenergy-rich conditions and should therefore be valid for thehigh-productivity conditions in August, coinciding with theannual peak in maximum water temperature and well-developed phytoplankton and zooplankton communities(Fig. 2) [26]. Under these conditions, high abundances ofprotozooplankton and macrozooplankon provide a rich sourceof energy for bacteria via the exudation of organic substancesand nutrients from vacuoles, inefficient feeding, and feces[42]. At lower productivity in early spring (April data), how-ever, no significant relationship between Rsb and μ could bedemonstrated. Given the limits of the Pirt model, developedduring high-energy conditions, more knowledge of bacterialrespiration under starvation conditions in natural environ-ments is required.
We also demonstrated that a quadratic nonlinear modelbetter described the observed relationship between Rsb and μunder high-productivity conditions (Eq. 5, R2 = 0.57, Fig. 3).The pattern for the August observations, when μ approached0, clearly showed that bacterial respiration remained un-changed from undetectable rates up to a μ of 0.09 day−1. Wetherefore adopted the quadratic model as more reliable.
The y-intercept of the nonlinear model provides the firstestimate, to our knowledge, of bacterial maintenance respira-tion in the field, with a value of 0.58 fmol O2 day
−1 cell−1. Thiswas 1.8 times higher than when estimated by the linear Pirtmodel. The trimmed 95% range suggests the true value lies inbetween − 24% and + 34% of the estimate. The aggregation ofobservations at the lower end of the curve and the good fit to
µFig. 4 aContribution ofmaintenance respiration (Rm/Rsb) as a function ofbacterial growth rate (μ) over the observed range in filtered samples in theAugust transect. The Rm/Rsb ratio was calculated from the linear model IIregression function obtained in August (Eq. 2). b Same as a but based onthe quadratic model obtained in August (Eq. 5). cHistogram showing thenumber of measurements for given bacterial cell-specific growth rate (μ)intervals in natural unfiltered samples over a whole year (2015) and watercolumn of the Öre Estuary (monitoring data)
Vikström K., Wikner J.

the quadratic model contribute to the confidence in the Rm
estimate. Fewer data in the mid-range of the curve leave someuncertainty as to the validity of the nonlinear model at a higherμ. The maintenance respiration estimate reported by Cajal-Medrano and Maske [13], using the Pirt model on literaturevalues, was three times higher than our value. Recalculating
our maintenance respiration rate by measured cell density(1.5 fmol C cell−1, RQ = 1) gives a value of 0.39 day−1.Their estimate would therefore indicate an even higher influ-ence of maintenance respiration. However, we question theirestimate as respiration was calculated from μ and growthyield, leading to autocorrelation in their data set.
Under low-productivity conditions (i.e., April), bacterialrespiration per cell unexpectedly exceeded respiration inAugust by approximately a factor of 3, and no relationshipto the bacterial specific growth rate could be demonstrated(Fig. 3). The observed lack of a relationship between μ andRsb in the 1.2-μm filtrates unambiguously demonstrates thatbacterial respiration can be significant and uncoupled fromcontemporary biomass growth requirements. Consequently,the Pirt model could not explain the observations duringlow-productivity conditions. We suggest that these specificrespiration rates are primarily due to maintenance respiration.Hence, we conclude that Rm was responsible for nearly all ofthe Rsb under low-productivity conditions in April, reducingBGE under low-productivity conditions.
It remains unclear what bacterial communities arespending their energy on during periods of low
Table 2 Kendall’s tau b correlation coefficient (rτ) between bacterialspecific respiration (Rsb) and explanatory factors for both month andsurface and deep water. Data with p values < 0.05 are shown in italics
Factor Rsb April Rsb August
Surface water Deep water Surface water Deep water
Temperature 0.34 0.03 − 0.04 − 0.02
TDP − 0.07 − 0.51 − 0.59 − 0.15TDN − 0.47 − 0.11 − 0.06 0.13
DOC − 0.07 0.51 0.24 0.38
C:P ratio − 0.07 0.69 0.67 0.13
C:N ratio 0.38 0.56 0.53 0.06
μ 0.38 0.16 0.56 0.09
Fig. 5 Presentation ofrelationships between Rsb and themeasured nutrient variables.Relationships with a significant(p < 0.05) Kendall’s taucorrelation coefficient of rτ > 0.5are indicated by a line. A solidline and filled symbols showsurface water, while deep water isshown by a dashed line and opensymbols. Lines are derived bymodel II regressions. Nosignificant correlations werefound for total nitrogen
Importance of Bacterial Maintenance Respiration in a Subarctic Estuary: a Proof of Concept from the Field
productivity in the natural environment, despite extensiveknowledge about bacterial adaptations at low-energy con-ditions in laboratory cultures [43]. We can only speculatethat elevated maintenance energy requirements drive activ-ities to gain competitive advantages such as the productionof external enzymes, formation of storage material, or fla-gellar motion, as previously reported [9, 43, 44]. Bacteriain continuous cultures also show energy-spilling reactions,suggested to be related to removal of toxic end products orpriming of metabolites for future anabolism, possibly con-tributing to maintenance respiration [44].
Our second question addressed how important mainte-nance respiration is when compared to total bacterial respira-tion. The contribution of Rm to Rsb was calculated from therelationships above (Eqs. 2 and 5) and plotted versus μ (Fig.4). Bothmodels showed that bacterial maintenance respirationconstituted a significant share of total respiration on the orderof tens of percent. At the median μ (0.14 day−1) of the rangeanalyzed, Rm/Rsb was 20% when using the linear Pirt model.For the empirically derived model, this was even more pro-nounced, with a Rm/Rsb quotient of approximately 50% at thesame μ. This corresponded to the 20–80% observed forKlebsiella aerogenes in continuous culture, depending onwhether glucose or phosphate was limiting, used in the devel-opment of the Pirt model [12].
To investigate the contribution from Rm on an annual scale,we calculated a minimum value using Eq. 3 and the range of μmeasured in the active environmental monitoring program (cf.Fig. 2). Assuming that μ was the major predictor of Rm andRsb, as found above for the high-productivity conditions inAugust (i.e., Eq. 2), Rm accounted for 24% of the annualbacterial respiration, and when using the empirically derivedcoefficients from the quadratic model (Eq. 5), this value in-creased to 58%. We conclude from this that bacterial mainte-nance respiration can make up a significant part of annualbacterial respiration in this subarctic estuary.
The quadratic model more accurately represented Rm whenμ approached zero growth. We may still have overestimatedthe influence of Rm since the constant maintenance cost (m1)was not discernible from the growth-dependent maintenancecost (m′, cf. Eq. 1). In contrary, the higher share of Rm underthe low-productivity conditions (April data) means a risk tohave underestimated Rm influence on an annual basis, assum-ing this Rm is valid for the unproductive half of the year.Hence, with a conservative assumption that these uncertaintiescancel out, maintenance respiration is likely to account for atleast half of the annual bacterial respiration in this subarcticestuary.
No clear relationship to μ could be demonstrated in April.Instead, Rsb varied substantially, showing unexpectedly highcell-specific respiration rates compared with the observed lowμ. This inconsistency leads to the third question addressed inthe BIntroduction,^ to what extent does nutrient stoichiometry
explain the level of maintenance respiration in the field. Basedon the conclusions of Neijssel and Tempest [12], we hypoth-esized that Rsb could be stimulated by an increase in the C:Pratio, and for the Öre Estuary, phosphorus is the limiting nu-trient [24, 45, 46]. Nutrient ratios also indicated marked phos-phorus limitation (Table S1). Significant relationships betweenRsb and both TDP (negative) and the C:P ratio (positive,squared rτ = 36%) in deep water implied a higher cellular res-piration demand at phosphorus shortage as postulated by thePirt model. For the surface layer, no consistent relationshipcould be demonstrated in April between Rsb and nutrients ortheir ratios. In August, the C:P ratio could explain as much as49% of the variation in Rsb in the surface water, and a weakercorrelation with TDPwas also observed, but no correlation wasfound in the deep layer (Table 2, Fig. 5). Thus, our results couldonly partly support a role of phosphorus in imposing highmaintenance respiration rates as found in the laboratory exper-iments of Neijssel and Tempest [12], and factors other thanTDN, TDP, DOC, and their ratios should explain more thanhalf of the variation in Rsb during periods of low productivity.
Similar effects of phosphorus and carbon on bacterialrespiration in natural environments have been observed inother environments. Smith and Prairie [19] reported amarked increase in Rsb as the phosphorus concentrationdecreased in North American lakes, in line with our find-ings. Supporting our interpretation, Smith and Kemp [20]also found that increased carbon levels stimulated respira-tion in the lower part of the Chesapeake Bay, while a de-crease in phosphorus resulted in an increase in bacterialspecific respiration. In other parts of the Chesapeake Bay,however, no effect of either carbon or phosphorus additioncould be demonstrated. Given that current literature and ourresults show a variable response of Rsb in relation to nutri-ent stoichiometry in the field, we cannot make general con-clusions based on the present observations.
Temperature was not significantly correlated to Rsb in ourstudy, in contrary to other reports [17]. We conclude that (1)temperature was of less importance as significant in the con-trol of bacterial respiration by two discrete productivity levelsand (2) the lack of a relationship can primarily be explained bythe limited span of temperatures present in April (Δt = 3 °C).The range of both nutrients (3- to 9-fold) and bacterial vari-ables (6- to 24-fold), however, was significant. The spatiotem-poral scale of this study, our short-term measurement directlyafter filtration, and the use of natural nutrient levels, mayexplain differences in results compared to studies using incu-bation over days in small sample volumes with nutrientamendments (e.g., [22]).
Experimental Design and Validity of Data
Our experimental design to study filtered samples was im-posed by the need to specificallymeasure bacterial respiration,
Vikström K., Wikner J.
and it limits the generalizability of our results to free-livingbacteria. By using estimates within 1 h after filtration, theeffects of enclosure during incubation time or experimentallyinduced activity of natural viruses should be minor. The ob-served low μ following filtration (Table 1), however, indicatedthat the prefiltration resulted in degraded growth conditions incomparison to bacterioplankton growth in unfiltered samples(compared with monitoring data, Fig. 2). We probably de-prived bacteria of continuous supply of nutrients from proto-zoan and zooplankton egestion and nutrient-rich particlesthereby lowering μ. That particle-attached bacteria showhigher activity and different taxonomy than free-living hasbeen shown in other estuaries [47, 48]. The span of specificgrowth rates remaining in the August study was still sufficientto cover the majority (75%) of the μ range observed during ayear in the estuary (Figs. 2, 3, and 4c). Given that μ constitutesa major predictor for bacterial respiration by both laboratoryexperiments [12] and field studies [5], our results are relevantfor the natural environment. In April, a coverage of the naturalrange ofμwas not met and we cannot exclude that a starvationresponse (i.e., stress), imposed by prefiltration, influenced thehigh respiration rates observed. The observations in April stillshow that bacterial respiration can be high at low growth rates.
The level of BGE observed suggests that the results fromour filtered samples are relevant for the natural environmentand applicability to natural samples. The average BGE valueof 0.09 (August) was close to that found by Wikner et al. [49](i.e., median 0.11), who used a different method to calculateBGE in the same water body (i.e., bacterial carbon yield andDOC net change). The observed level of BGE also results in acarbon budget for the estuary better in line with planktonrespiration recently reported [50, 51]. Both these comparisonssuggest that bacterial growth and respiration measurements inthe filtered samples were realistic and match global models forBGE versus bacterial biomass production [5, 10].
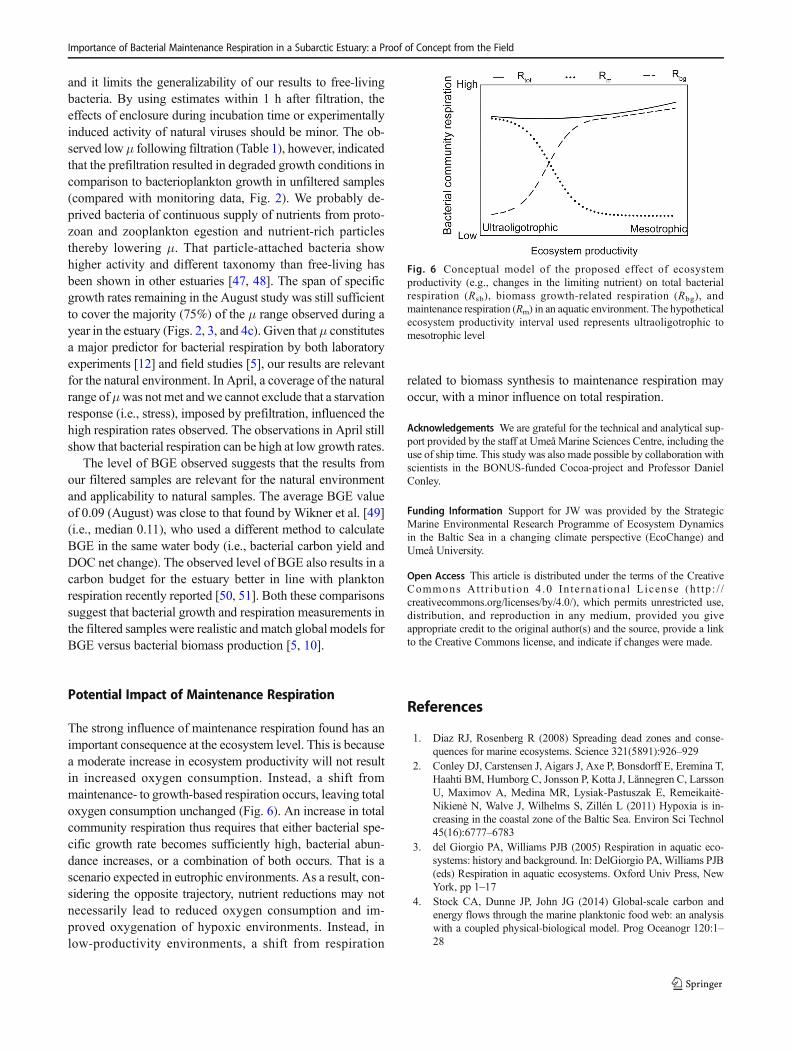
Potential Impact of Maintenance Respiration
The strong influence of maintenance respiration found has animportant consequence at the ecosystem level. This is becausea moderate increase in ecosystem productivity will not resultin increased oxygen consumption. Instead, a shift frommaintenance- to growth-based respiration occurs, leaving totaloxygen consumption unchanged (Fig. 6). An increase in totalcommunity respiration thus requires that either bacterial spe-cific growth rate becomes sufficiently high, bacterial abun-dance increases, or a combination of both occurs. That is ascenario expected in eutrophic environments. As a result, con-sidering the opposite trajectory, nutrient reductions may notnecessarily lead to reduced oxygen consumption and im-proved oxygenation of hypoxic environments. Instead, inlow-productivity environments, a shift from respiration
related to biomass synthesis to maintenance respiration mayoccur, with a minor influence on total respiration.
Acknowledgements We are grateful for the technical and analytical sup-port provided by the staff at Umeå Marine Sciences Centre, including theuse of ship time. This study was also made possible by collaboration withscientists in the BONUS-funded Cocoa-project and Professor DanielConley.
Funding Information Support for JW was provided by the StrategicMarine Environmental Research Programme of Ecosystem Dynamicsin the Baltic Sea in a changing climate perspective (EcoChange) andUmeå University.
Open Access This article is distributed under the terms of the CreativeCommons At t r ibut ion 4 .0 In te rna t ional License (h t tp : / /creativecommons.org/licenses/by/4.0/), which permits unrestricted use,distribution, and reproduction in any medium, provided you giveappropriate credit to the original author(s) and the source, provide a linkto the Creative Commons license, and indicate if changes were made.
References
1. Diaz RJ, Rosenberg R (2008) Spreading dead zones and conse-quences for marine ecosystems. Science 321(5891):926–929
2. Conley DJ, Carstensen J, Aigars J, Axe P, Bonsdorff E, Eremina T,Haahti BM, Humborg C, Jonsson P, Kotta J, Lännegren C, LarssonU, Maximov A, Medina MR, Lysiak-Pastuszak E, Remeikaitė-Nikienė N, Walve J, Wilhelms S, Zillén L (2011) Hypoxia is in-creasing in the coastal zone of the Baltic Sea. Environ Sci Technol45(16):6777–6783
3. del Giorgio PA, Williams PJB (2005) Respiration in aquatic eco-systems: history and background. In: DelGiorgio PA, Williams PJB(eds) Respiration in aquatic ecosystems. Oxford Univ Press, NewYork, pp 1–17
4. Stock CA, Dunne JP, John JG (2014) Global-scale carbon andenergy flows through the marine planktonic food web: an analysiswith a coupled physical-biological model. Prog Oceanogr 120:1–28
Fig. 6 Conceptual model of the proposed effect of ecosystemproductivity (e.g., changes in the limiting nutrient) on total bacterialrespiration (Rsb), biomass growth-related respiration (Rbg), andmaintenance respiration (Rm) in an aquatic environment. The hypotheticalecosystem productivity interval used represents ultraoligotrophic tomesotrophic level
Importance of Bacterial Maintenance Respiration in a Subarctic Estuary: a Proof of Concept from the Field

5. del Giorgio PA, Cole JJ (1998) Bacterial growth efficiency in nat-ural aquatic systems. Annu Rev Ecol Syst 29:503–541
6. Manzoni S, Taylor P, Richter A, Porporato A, Ågren GI (2012)Environmental and stoichiometric controls on microbial carbon-use efficiency in soils. New Phytol 196(1):79–91
7. Sinsabaugh RL, Shah JJF, Findlay SG, Kuehn KA, Moorhead DL(2015) Scalingmicrobial biomass, metabolism and resource supply.Biogeochemistry 122(2):175–190
8. Roland F, Cole JJ (1999) Regulation of bacterial growth efficiencyin a large turbid estuary. Aquat Microb Ecol 20(1):31–38
9. Pirt SJ (1982) Maintenance energy—a general-model for energy-limited and energy-sufficient growth. Arch Microbiol 133(4):300–302
10. Sinsabaugh RL, Shah JJF (2010) Integrating resource utilizationand temperature in metabolic scaling of riverine bacterial produc-tion. Ecology 91(5):1455–1465
11. Wikner J, Hagstrom A (1999) Bacterioplankton intra-annual vari-ability: importance of hydrography and competition. Aquat MicrobEcol 20(3):245–260
12. Neijssel OM, Tempest DW (1976) Bioenergetic aspects of aerobicgrowth of Klebsiella aerogenes NCTC 418 in carbon-limited andcarbon-sufficient chemostat culture. Arch Microbiol 107(2):215–221
13. Cajal-Medrano R, Maske H (1999) Growth efficiency, growth rateand the remineralization of organic substrate by bacterioplankton—revisiting the Pirt model. Aquat Microb Ecol 19(2):119–128
14. Vazquez-Dominguez E, Vaque D, Gasol AM (2007) Oceanwarming enhances respiration and carbon demand of coastal mi-crobial plankton. Glob Chang Biol 13(7):1327–1334
15. Duarte CM, Agustí S, Vaqué D (2004) Controls on planktonicmetabolism in the Bay of Blanes, northwestern Mediterranean lit-toral. Limnol Oceanogr 49(6):2162–2170
16. Robinson C (2000) Plankton gross production and respiration in theshallow water hydrothermal systems of Miles, Aegean Sea. JPlankton Res 22(5):887–906
17. Apple JK, del Giorgio PA, Kemp WM (2006) Temperature regula-tion of bacterial production, respiration, and growth efficiency in atemperate salt-marsh estuary. Aquat Microb Ecol 43(3):243–254
18. Hopkinson CS, Smith EM (2005) Respiration in aquatic ecosys-tems: history and background. In: DelGiorgio PA, Williams PJB(eds) Respiration in aquatic ecosystems. Oxford Univ Press, NewYork, pp 1–17
19. Smith EM, Prairie YT (2004) Bacterial metabolism and growthefficiency in lakes: the importance of phosphorus availability.Limnol Oceanogr 49(1):137–147
20. Smith EM, Kemp WM (2003) Planktonic and bacterial respirationalong an estuarine gradient: responses to carbon and nutrient en-richment. Aquat Microb Ecol 30(3):251–261
21. Kritzberg E, Arrieta J, Duarte C (2010) Temperature and phospho-rus regulating carbon flux through bacteria in a coastal marine sys-tem. Aquat Microb Ecol 58(2):141–151
22. Berggren M, Laudon H, Jonsson A, Jansson M (2010) Nutrientconstraints on metabolism affect the temperature regulation ofaquatic bacterial growth efficiency. Microb Ecol 60(4):894–902
23. Wikner J, Andersson A (2012) Increased freshwater dischargeshifts the trophic balance in the coastal zone of the northern BalticSea. Glob Chang Biol 18(8):2509–2519
24. Zweifel UL, Wikner J, Hagström Å, Lundberg E, Norrman B(1995) Dynamics of dissolved organic carbon in a coastal ecosys-tem. Limnol Oceanogr 40(2):299–305
25. Sokal RR, Rohlf JF (1995) Biometry. The principles and practice ofstatistics in biological research3rd edn. W.H. Freeman, New York
26. SMHI. Swedish Meteorological and Hydrological Institute. 2016;Available from: http://www.smhi.se/en/services/open-data/search-smhi-s-open-data-1.81004
27. Wikner J et al (2013) Precise continuous measurements of pelagicrespiration in coastal waters with oxygen Optodes. LimnolOceanogr Methods 11(1):1–15
28. Maranger RJ, Pace ML, del Giorgio PA, Caraco NF, Cole JJ (2005)Longitudinal spatial patterns of bacterial production and respirationin a large river-estuary: implications for ecosystem carbon con-sumption. Ecosystems 8(3):318–330
29. Williams PJLB, Morris PJ, Karl DM (2004) Net community pro-duction and metabolic balance at the oligotrophic ocean site, stationALOHA. Deep-Sea Res I Oceanogr Res Pap 51(11):1563–1578
30. Hobbie JE, Daley RJ, Jasper S (1977) Use of nuclepore filters forcounting bacteria by fluorescence microscopy. Appl EnvironMicrobiol 33(5):1225–1228
31. Blackburn N, Hagstrom A, Wikner J, Cuadros-Hansson R,Bjornsen PK (1998) Rapid determination of bacterial abundance,biovolume, morphology, and growth by neural network-based im-age analysis. Appl Environ Microbiol 64(9):3246–3255
32. Norland S (1993) The relationship between biomass and volume ofbacteria. In: Kemp PF et al (eds) Handbook of methods in aquaticmicrobial ecology. Lewis, Boca Raton
33. Simon M, Azam F (1989) Protein content and protein synthesisrates of planktonic marine bacteria. Mar Ecol Prog Ser 51(3):201–213
34. Smith DC, Azam F (1992) A simple, economical method for mea-suring bacterial protein synthesis rates in seawater using tritiated-leucine. Marine Microbial Food Webs 6(2):107–114
35. Bell RT (1993) Estimating production of heterotrophicbacterioplankton via incorporation of tritiated thymidine. In:Kemp PF, Sherr, BF, Sherr EB, Cole J (eds) Handbook of methodsin aquatic micobial ecology, 1st edn. Lewis Publishers, BocaRaton, pp 495–503
36. Kirchman DL, Ducklow HW (1993) Estimating conversion factorsfor the thymidine and leucine methods for measuring bacterial pro-duction. In: Sherr EB, Sherr BF, Cole JJ (eds) Handbook ofmethods in aquatic microbial ecology. Lewis Publishers, BocaRaton, pp 513–518
37. Robinson C, Stephen DA, Peter JLBW (1999) Microbial dynamicsin coastal waters of East Antarctica: plankton production and res-piration. Mar Ecol Prog Ser 180:23–36
38. Grasshoff K, Ehrhardt M, Kremling K (1983) Methods of SeawaterAnalysis. Verlag Chemie Weinheim, Weinheim
39. Norrman B (1993) Filtration of water samples for DOC studies.Mar Chem 41(1–3):239–242
40. Sugimura Y, Suzuki Y (1988) A high-temperature catalytic-oxida-tion method for the determination of non-volatile dissolved organic-carbon in seawater by direct injection of a liquid sample. Mar Chem24(2):105–131
41. Neidhardt FC, Ingraham JL, Schaechter M Physiology of thebacterial cell a molecular approach. In: Neidhardt FC,Ingraham JL, Schaechter M (eds) Physiology of the bacterialcell: a molecular approach, vol 7.1990. Sinauer Associates,Sunderland XV+507P
42. Kirchman DL (2008) Introduction and overview. In: Kirchman DL(ed) Microbial ecology of the oceans, 2 edn. John Wiley & sonsInc., Hoboken, pp 1–26
43. Lever MA, Rogers KL, Lloyd KG, Overmann J, Schink B, ThauerRK, Hoehler TM, Jørgensen BB (2015) Life under extreme energylimitation: a synthesis of laboratory- and field-based investigations.FEMS Microbiol Rev 39(5):688–728
44. Russell JB, Cook GM (1995) Energetics of bacterial growth: bal-ance of anabolic and catabolic reactions. Microbiol Rev 59(1):48–62
45. Zweifel UL, Norrman B, Hagstrom A (1993) Consumption of dis-solved organic-carbon bymarine-bacteria and demand for inorganicnutrients. Mar Ecol Prog Ser 101(1–2):23–32
Vikström K., Wikner J.

46. Andersson A, Hajdu S, Haecky P, Kuparinen J, Wikner J (1996)Succession and growth limitation of phytoplankton in the Gulf ofBothnia (Baltic Sea). Mar Biol 126(4):791–801
47. Rieck A et al (2015) Particle-associated differ from free-living bac-teria in surface waters of the Baltic Sea. Front Microbiol 6:13
48. Crump BC, Armbrust EV, Baross JA (1999) Phylogenetic analysisof particle-attached and free-living bacterial communities in theColumbia river, its estuary, and the adjacent coastal ocean. ApplEnviron Microbiol 65(7):3192–3204
49. Wikner J, Cuadros R, Jansson M (1999) Differences inconsumption of allochthonous DOC under limnic and
estuarine conditions in a watershed. Aquat Microb Ecol17(3):289–299
50. Panigrahi S, Nydahl A, Anton P, Wikner J (2013) Strong seasonaleffect of moderate experimental warming on plankton respiration ina temperate estuarine plankton community. Estuar Coast Shelf Sci135:269–279
51. Sandberg J, Andersson A, Johansson S, Wikner J (2004)Pelagic food web and carbon budget in the northern BalticSea: potential importance of terrigenous carbon. Mar EcolProg Ser 268:13–29
Importance of Bacterial Maintenance Respiration in a Subarctic Estuary: a Proof of Concept from the Field