Embed Size (px)
Citation preview

10 Edwin Villagran
Rev. Ceres, Viçosa, v. 68, n.1, p. 010-022, jan/feb, 2021
ABSTRACT
Submitted on April 16th, 2020 and accepted on September 21th, 2020.1 Corporación Colombiana de Investigación Agropecuaria - AGROSAVIA, Centro de Investigación Tibaitata, Bogotá, Colombia. [email protected]
*Corresponding Author: [email protected]
Implementation of ventilation towers in a greenhouse established in lowaltitude tropical climate conditions: numerical approach
to the behavior of the natural ventilation
Deficient ventilation rates and airflow patterns in naturally ventilated greenhouses are the main causes for thegeneration of inadequate and heterogeneous thermal conditions inside this type of structure. In this research, a numericalstudy was developed using a two-dimensional computational fluid dynamics model validated in a Colombian greenhouseestablished under warm climate conditions (PG). The objective of the research was to evaluate the effect on naturalventilation generated by the coupling of two ventilation towers on the PG greenhouse, scenario called MPG. The resultsindicated that airflow patterns over the region where crops are established in MPG are between 25.9% and up to 142.5%faster compared to PG, which generates ventilation rates up to 57.3% higher in MPG, which is why the temperaturedistribution under this scenario is more homogeneous inside the structure and its average thermal differential with theoutside environment does not exceed 1.1 °C.
Keywords: ventilation rates; CFD simulation; air flows; thermal differential.
Edwin Villagran1*
10.1590/0034-737X202168010002
This is an open accessarticle under the CC BY
license Creative Commons
INTRODUCTION
The increase in the world’s population, together withthe deterioration of natural resources and current andfuture food demands, is one of the frequent problems thatreceives the most attention within the working agendasof the governmental and non-governmental entities of thenations (Akrami et al., 2020). One of the alternatives ofintensification of the agriculture more promoted for thefood production is the agriculture under cover, at presentit is estimated that for the production of fresh vegetablesthere are about 3,220,000 has under this type of productivesystem and of this total approximately 95% of the area aremedium and low technology structures, within which oneof the most relevant are passive type greenhousestructures, which are used in more than 115 countriesworldwide (Baeza et al., 2020; Ezzaeri et al., 2020).
The main functions of a greenhouse are; to protectthe crops from extreme climatic factors, to generate an
adequate microclimate for the growth and development ofthe plants and to protect them from the attack of pestsand diseases (Syed & Hachem, 2019; Villagrán et al., 2019).The benefits sought with the implementation of the cropunder cover are; increases in crop yields, increase in thefinal quality of the harvested product, reduction of waterand fertilizer consumption, reduction of pesticides andensure agricultural production throughout the year (Pakari& Ghani, 2019a). Passive greenhouses are characterizedby the lack of climate control equipment for tasks such ascooling and heating, therefore, this type of greenhouse isconsidered low cost and low environmental impact bynot requiring energy from non-renewable sources for itsoperation (Graamans et al., 2018).
The management of the microclimate in passivegreenhouses is carried out by opening and closingventilation areas on the sides and roof of the greenhouse,a process known as natural ventilation. From thismanagement of the ventilation areas, air flow movements

11Implementation of ventilation towers in a greenhouse established in low altitude tropical climate...
Rev. Ceres, Viçosa, v. 68, n.1, p. 010-022, jan/feb, 2021
are generated from physical phenomena such as naturalconvection by buoyancy or thermal effect and bydifferences in pressure between the external and internalenvironment known as wind effect (Bournet & Boulard,2010; Espinoza et al., 2017). Through the naturalventilation phenomenon, an air exchange is inducedbetween the external and internal environment of thegreenhouse. This exchange allows the regulation of thethermal and humidity excesses in the internal environmentof the greenhouse and it is also the only source of carbonenrichment in passive greenhouses (Singh et al., 2018).
The efficiency of natural ventilation depends on manyfactors such as: the geometry and size of the greenhouse,the area of the ventilation surfaces, the speed and directionof the outside wind, the thermal gradient between theindoor and outdoor environment, as well as the presenceor not of insect screens also play an important role in thebehavior of the airflow patterns (Baeza et al., 2009).Deficient natural ventilation rates are mainly characterizedby inadequate airflow patterns within the greenhouses,thus generating microclimatic conditions that cause stressconditions in the plants that affect their growth anddevelopment, these stress conditions are usually morecritical in hot climate regions (Molina-Aiz et al., 2017).
Currently there is a need to seek strategies to improvethe airflow patterns of passive greenhouses and themicroclimate generated inside them using differentrenewable energy sources. A little explored alternative isthe use of wind energy by coupling aeration towers to thesides of the greenhouse, these towers have the ability togenerate air flow movements by taking advantage of thepressure differences that are created between thewindward and leeward sides (Pakari & Ghani, 2019b). Atechnique for the study and optimization of air flowpatterns inside greenhouses is the numerical simulationby computational fluid dynamics (CFD), this is a matureand robust technique with which it is possible to evaluatedifferent alternatives in a virtual scenario of engineeringproblems that include transport phenomena and fluidmovements (Dhiman et al., 2019; Mesmoudi et al., 2017).
The use of wind towers is not widespread inagricultural structures, in a recent study developed byPakari & Ghani (2019b), the authors analyzed by means ofCFD and an experimental validation in a wind tunnel theeffect of a wind capture tower on the flow patterns insidea greenhouse type tunnel of 81 m2. This study onlyconsidered the wind effect of natural ventilation and theauthors reported air flows with speeds inside the tunnelthat varied between 0.41 and 1.81 m s-1, for simulationscenarios with outside wind speeds between 1 and 5 m s-
1. The objective of this research was to evaluate, using anexperimentally validated 2D CFD model, the effect thatthe implementation of an air capture tower in each side
wall of the greenhouse would have on air flow patternsand thermal distribution. The numerical model consideredthe thermal and wind effect of the natural ventilationphenomenon.
MATERIALS AND METHODSDescription of the greenhouse
The experiment was conducted in a naturally ventilatedflat roof chapel type greenhouse (PG), built of structuralsteel and covered with polyethylene, located in theColombian Caribbean region in the municipality of Seville,department of Magdalena, at the Caribbean ResearchCenter of the Colombian Agricultural ResearchCorporation - AGROSAVIA. The dimensions of thegreenhouse were 20 m in cross section and 25 m in length,which is equivalent to a covered area of 500 m2. Thegreenhouse was equipped with side and roof vents, thesevents have an insect proof mesh (Figure 1). Thisgreenhouse model already built at full scale was used tocarry out the comparisons of air flow and thermaldistribution with the possible scenario of a greenhouseequipped with air capture towers (MPG). The capture andrecording of experimental data will also be carried out onPG for the purpose of validating the CFD model.
The region of study presents climatological conditionswhere the average of the multiannual temperature for aperiod of 30 years is 28.16 °C, with a maximum and minimumaverage of 32.8 and 23.2 °C, respectively, the relativehumidity presented an average behavior with values over65% and an annual precipitation with average values of1245.1 mm, the dominant wind speed values in the regionof study vary between 0.5 and 3 m s-1, with a dominantdirection of in the E-W direction, which is perpendicularto the longitudinal axis and side walls of the greenhouse.
Description of air capture towers
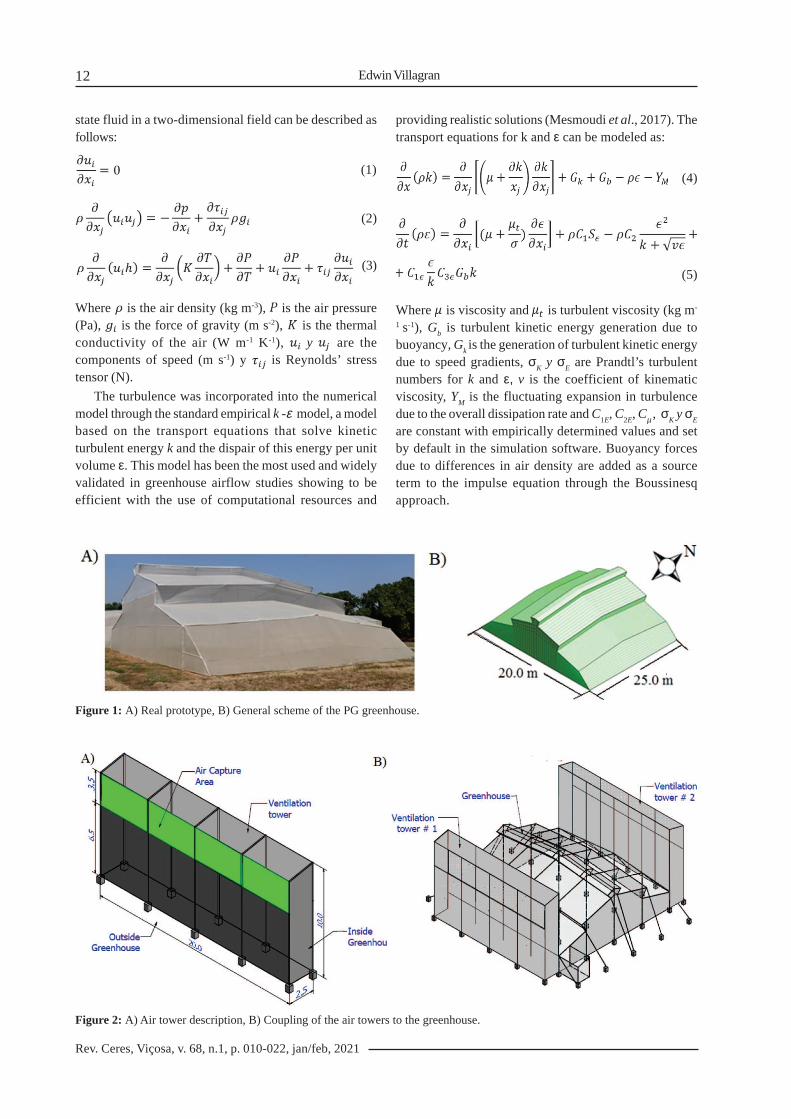
The air capture towers proposed in this researchshould be attached to each of the lateral sides of thegreenhouse studied (Figure 2B). The towers can be builtin the same structural and covering material in which thegreenhouse is manufactured, in this case structural steeland polyethylene covering. The overall dimensions of thetowers are 10 m and 9.5 m for maximum and minimum height,the width of the tower is 2.5 m, the length should be simi-lar to the side length of the greenhouse in this case 20 mand at the top of the tower an area should be generatedfor air inlet into the greenhouse with a width of 3.5 m(Figure 2A).
Numerical model
The non-linear partial differential equations known asNavier Stokes (RANS) averaged by Reynolds that governthe amount of energy, momentum and mass of a steady
12 Edwin Villagran
Rev. Ceres, Viçosa, v. 68, n.1, p. 010-022, jan/feb, 2021
state fluid in a two-dimensional field can be described asfollows:
(1)
(2)
(3)
Where is the air density (kg m-3), is the air pressure(Pa), is the force of gravity (m s-2), is the thermalconductivity of the air (W m-1 K -1), y are thecomponents of speed (m s-1) y is Reynolds’ stresstensor (N).
The turbulence was incorporated into the numericalmodel through the standard empirical k -ε model, a modelbased on the transport equations that solve kineticturbulent energy k and the dispair of this energy per unitvolume ε. This model has been the most used and widelyvalidated in greenhouse airflow studies showing to beefficient with the use of computational resources and
providing realistic solutions (Mesmoudi et al., 2017). Thetransport equations for k and ε can be modeled as:
(4)
(5)
Where is viscosity and is turbulent viscosity (kg m-1 s-1), G
b is turbulent kinetic energy generation due to
buoyancy, Gk is the generation of turbulent kinetic energy
due to speed gradients, σK y σ
E are Prandtl’s turbulent
numbers for k and ε, v is the coefficient of kinematicviscosity, Y
M is the fluctuating expansion in turbulence
due to the overall dissipation rate and C1E
, C2E
, Cµ , σK y σ
E
are constant with empirically determined values and setby default in the simulation software. Buoyancy forcesdue to differences in air density are added as a sourceterm to the impulse equation through the Boussinesqapproach.
Figure 2: A) Air tower description, B) Coupling of the air towers to the greenhouse.
Figure 1: A) Real prototype, B) General scheme of the PG greenhouse.

13Implementation of ventilation towers in a greenhouse established in low altitude tropical climate...
Rev. Ceres, Viçosa, v. 68, n.1, p. 010-022, jan/feb, 2021
The presence of anti-insect screens was modelled byusing equations derived from the flow of a free and forcedfluid through porous materials, taking into account theirmain characteristics of porosity and permeability (Valeraet al., 2005). These equations can be derived from theForchheimer equation:
(6)
Where u is the speed of air (m s-1); µ is the dynamicviscosity of the fluid (kg m-1 s-1), K is the permeability ofthe medium (m2); C f is the inertial factor of the porousmesh; ñ is the air density (kg m-3) and ϑx the thickness ofthe porous material (m). In our research we use a two-dimensional modeling approach, this is valid and generallyreliable results are obtained for cases where there aredominant wind directions and in regions where thegreenhouses establish their orientation under this concept(Villagrán et al., 2019).
Construction of the computer domain andmeshing process
This type of research involving transport phenomena,where the final objective is to analyze the phenomenon ofnatural ventilation in the middle section of a greenhousestructure equipped with side openings. It is possible toimplement a two-dimensional simulation model that allowsto obtain results in a shorter period of time than in a three-dimensional simulation model (Baxevanou et al., 2010;Benni et al., 2016). The 2D approach also allows to obtaina saving of the computational resources that are consumedin the process of development of the model, meshing andnumerical simulation (Mesmoudi et al., 2017). Finally,through the two-dimensional models, precise and reliablesolutions can be obtained when the fluid flow is perpen-dicular to the ventilation sections under study (Bartzanaset al., 2004: Villagrán & Bojacá, 2019b).
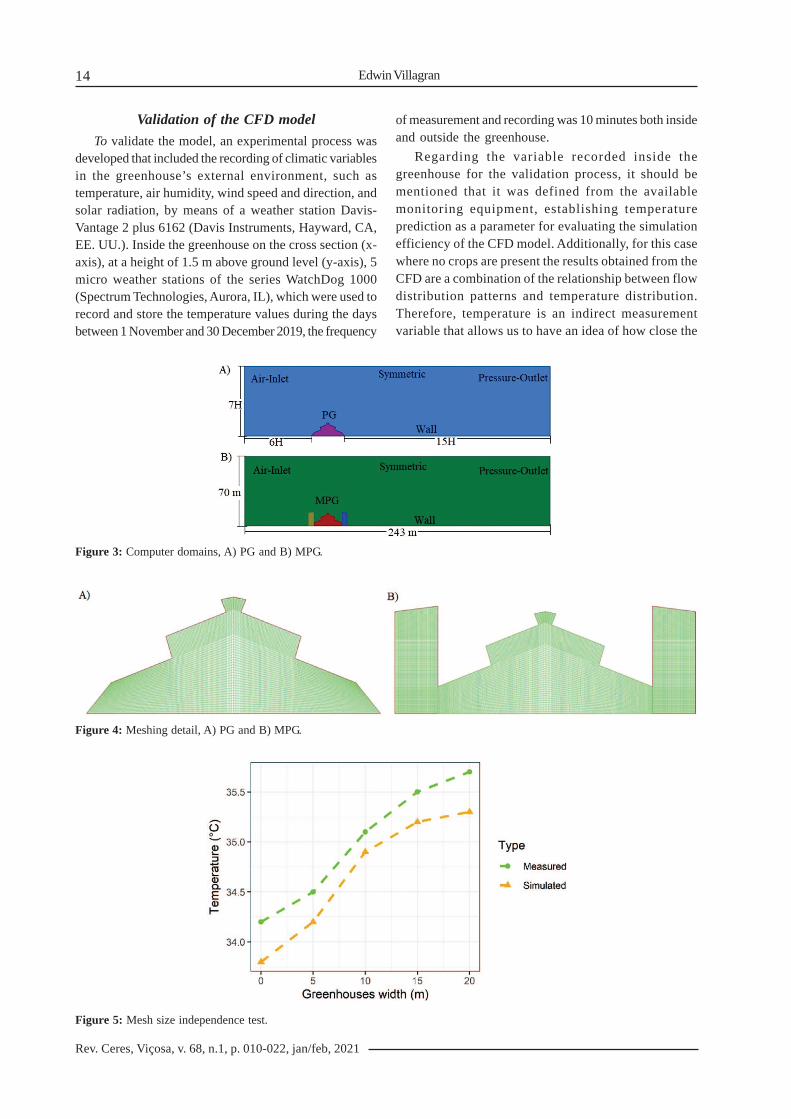
For pre-processing stage of the CFD-RANS simulation,it is recommended to follow guidelines for the constructionof the computational domain in engineering problemsinvolving air movement and its interaction with buildings,such as those proposed by Blocken (2015). Where it isestablished that the entrance and upper limit of the domainmust have a minimum separation with the building of 5H,while the exit limit must have a minimum distance of 10Hwith the building, where H is the maximum height of thebuilding under analysis. In our case, this computationaldomain has dimensions of 70 m (y-axis) and 243 m (x-axis)(Figure 3).
The meshing process must be of high quality in orderto ensure high quality results, independent of mesh sizeand without convergence problems (Tominaga et al.,2008). The computational domain was divided into an
unstructured mesh of 520,183 and 561,235 square elementsfor PG and MPG respectively (Figure 4).
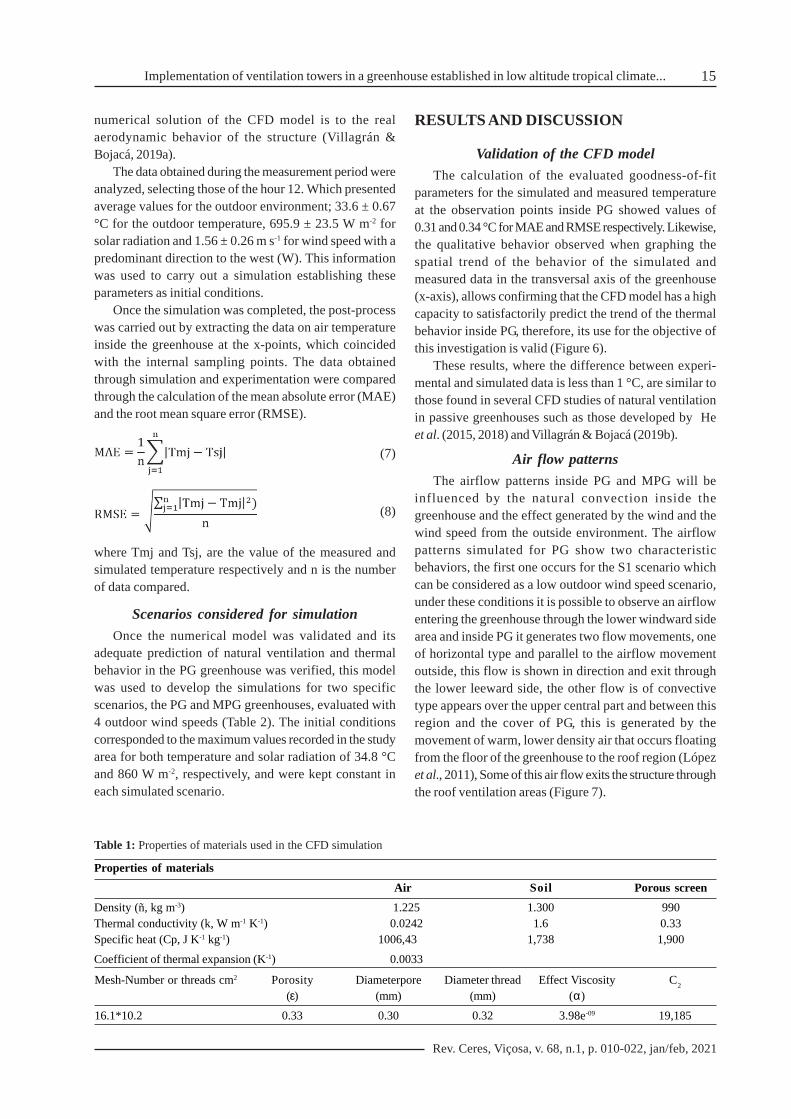
This mesh resolution was defined after developing asensitivity analysis of 8 squares with different sizes, whichallowed to verify the independence of the numericalsolution to the mesh size (Figure 5). The quality of themesh was evaluated by means of 2X2 determinant and theorthogonality criterion, where for the first one values wereobtained for 99.8% of the cells between 0.95 and 1 and forthe second criterion a minimum value of 0.94 results thatare considered of high quality (Reynafarje et al., 2020).
Numerical simulation and boundary conditions
In the upper part of the computer domain a limitcondition of symmetry was established, the floor, the airintake towers and the walls of the greenhouse the limitcondition established was that of an enhanced wall. Theventilation areas of the greenhouse with porous meshesfor protection against insects were treated as porous me-dia, the air inlets and outlets in the intake towers weretreated with the limit condition of the interior, the flowoutput of the computational domain was set to thepressure output condition.
While the air intake side was set by a user-definedfunction (UDF) to a logarithmic pattern profile for airvelocity, where vertical air movement profile parametersand turbulence conditions are set, this profile wasgenerated following the procedure established byHargreaves & Wright (2007). For each material consideredin the computational domain such as; air, polyethylene,soil, porous screen, physical, optical and aerodynamicproperties were established in the case of the porousscreen, the values of these properties were previouslyestablished by Flores-Velazquez et al. (2013) and Villagránet al. (2019; 2020) (Table 1).
As the objective of the work is to determine the effecton the ventilation rates and the thermal behavior insidethe greenhouse due to the possible implementation of aircapture towers, the numerical model does not considereither the presence of plants, nor was the phenomenon ofsolar radiation simulated with any of the availablesimulation models. For this last case and as a validsimplification a condition of heat flow dependent on thelevel of solar radiation was established as it was done inthe work recently developed by Flores-Velázquez & Vega-García (2019) and by Villagrán & Bojaca (2019c). Thenumerical simulations were developed in steady state witha pressure-based, segregated solver and an implicitformulation for the linearization of the discretizedequations by second order schemes, the convergencecriteria according to the absolute residues for theequations of momentum, turbulence, mass and energywere established in 10-6 (Bouhoun Ali et al., 2017).
14 Edwin Villagran
Rev. Ceres, Viçosa, v. 68, n.1, p. 010-022, jan/feb, 2021
Validation of the CFD model
To validate the model, an experimental process wasdeveloped that included the recording of climatic variablesin the greenhouse’s external environment, such astemperature, air humidity, wind speed and direction, andsolar radiation, by means of a weather station Davis-Vantage 2 plus 6162 (Davis Instruments, Hayward, CA,EE. UU.). Inside the greenhouse on the cross section (x-axis), at a height of 1.5 m above ground level (y-axis), 5micro weather stations of the series WatchDog 1000(Spectrum Technologies, Aurora, IL), which were used torecord and store the temperature values during the daysbetween 1 November and 30 December 2019, the frequency
of measurement and recording was 10 minutes both insideand outside the greenhouse.
Regarding the variable recorded inside thegreenhouse for the validation process, it should bementioned that it was defined from the availablemonitoring equipment, establishing temperatureprediction as a parameter for evaluating the simulationefficiency of the CFD model. Additionally, for this casewhere no crops are present the results obtained from theCFD are a combination of the relationship between flowdistribution patterns and temperature distribution.Therefore, temperature is an indirect measurementvariable that allows us to have an idea of how close the
Figure 3: Computer domains, A) PG and B) MPG.
Figure 4: Meshing detail, A) PG and B) MPG.
Figure 5: Mesh size independence test.
15Implementation of ventilation towers in a greenhouse established in low altitude tropical climate...
Rev. Ceres, Viçosa, v. 68, n.1, p. 010-022, jan/feb, 2021
numerical solution of the CFD model is to the realaerodynamic behavior of the structure (Villagrán &Bojacá, 2019a).
The data obtained during the measurement period wereanalyzed, selecting those of the hour 12. Which presentedaverage values for the outdoor environment; 33.6 ± 0.67°C for the outdoor temperature, 695.9 ± 23.5 W m-2 forsolar radiation and 1.56 ± 0.26 m s-1 for wind speed with apredominant direction to the west (W). This informationwas used to carry out a simulation establishing theseparameters as initial conditions.
Once the simulation was completed, the post-processwas carried out by extracting the data on air temperatureinside the greenhouse at the x-points, which coincidedwith the internal sampling points. The data obtainedthrough simulation and experimentation were comparedthrough the calculation of the mean absolute error (MAE)and the root mean square error (RMSE).
(7)
(8)
where Tmj and Tsj, are the value of the measured andsimulated temperature respectively and n is the numberof data compared.
Scenarios considered for simulation
Once the numerical model was validated and itsadequate prediction of natural ventilation and thermalbehavior in the PG greenhouse was verified, this modelwas used to develop the simulations for two specificscenarios, the PG and MPG greenhouses, evaluated with4 outdoor wind speeds (Table 2). The initial conditionscorresponded to the maximum values recorded in the studyarea for both temperature and solar radiation of 34.8 °Cand 860 W m-2, respectively, and were kept constant ineach simulated scenario.
RESULTS AND DISCUSSION
Validation of the CFD model
The calculation of the evaluated goodness-of-fitparameters for the simulated and measured temperatureat the observation points inside PG showed values of0.31 and 0.34 °C for MAE and RMSE respectively. Likewise,the qualitative behavior observed when graphing thespatial trend of the behavior of the simulated andmeasured data in the transversal axis of the greenhouse(x-axis), allows confirming that the CFD model has a highcapacity to satisfactorily predict the trend of the thermalbehavior inside PG, therefore, its use for the objective ofthis investigation is valid (Figure 6).
These results, where the difference between experi-mental and simulated data is less than 1 °C, are similar tothose found in several CFD studies of natural ventilationin passive greenhouses such as those developed by Heet al. (2015, 2018) and Villagrán & Bojacá (2019b).
Air flow patterns
The airflow patterns inside PG and MPG will beinfluenced by the natural convection inside thegreenhouse and the effect generated by the wind and thewind speed from the outside environment. The airflowpatterns simulated for PG show two characteristicbehaviors, the first one occurs for the S1 scenario whichcan be considered as a low outdoor wind speed scenario,under these conditions it is possible to observe an airflowentering the greenhouse through the lower windward sidearea and inside PG it generates two flow movements, oneof horizontal type and parallel to the airflow movementoutside, this flow is shown in direction and exit throughthe lower leeward side, the other flow is of convectivetype appears over the upper central part and between thisregion and the cover of PG, this is generated by themovement of warm, lower density air that occurs floatingfrom the floor of the greenhouse to the roof region (Lópezet al., 2011), Some of this air flow exits the structure throughthe roof ventilation areas (Figure 7).
Table 1: Properties of materials used in the CFD simulation
Properties of materials
Air Soil Porous screen
Density (ñ, kg m-3) 1.225 1.300 990Thermal conductivity (k, W m-1 K-1) 0.0242 1.6 0.33Specific heat (Cp, J K-1 kg-1) 1006,43 1,738 1,900
Coefficient of thermal expansion (K-1) 0.0033
Mesh-Number or threads cm2 Porosity Diameterpore Diameter thread Effect Viscosity C2
(ε) (mm) (mm) (α)
16.1*10.2 0.33 0.30 0.32 3.98e-09 19,185

16 Edwin Villagran
Rev. Ceres, Viçosa, v. 68, n.1, p. 010-022, jan/feb, 2021
For PG scenarios S2, S3 and S4 the same flow patternis observed with different speed due to the speed of theoutside air in the simulated case, air movement for PGunder this scenario shows inflow through the windwardside and roof ventilation areas to the leeward sideventilation areas where they eventually exit to the outside(Figure 7).
For the simulated MPG scenarios, the effects of the aircollection towers on the flow pattern inside the structureare observed (Figure 7). It identifies a pattern of flow thatenters the greenhouse through the ventilation tower, this
airflow is accelerated and directed towards the groundand then enter MPG and move horizontally over the areawhere the crops are established, it is also observed thatas air flow inside MPG suffers a slowdown, these resultsare consistent with those reported in the study developedpor Li & Mak (2007) and Pakari & Ghani. (2019b).
In the case of low velocity it is observed that the flowpattern leaves the greenhouse through the leeward sideventilation tower and the ventilation areas located in theroof area of the greenhouse, on the contrary for theremaining scenarios it is observed that the airflow entering
Table 2: Simulation scenarios developed
Wind speed(m s-1)
PGS1 0.6
PGS2 1.0
PGS3 2.0
PGS4 3.0
MPGS1 0.6
MPGS2 1.0
MPGS3 2.0
MPGS4 3.0
Scenario Simulation Scheme
Figure 6: Spatial trend of measured and simulated temperature data.

17Implementation of ventilation towers in a greenhouse established in low altitude tropical climate...
Rev. Ceres, Viçosa, v. 68, n.1, p. 010-022, jan/feb, 2021
from the windward side collides with an airflow enteringfrom the leeward tower causing two convective cells ofdifferent size and exiting the greenhouse through the roofventilation areas (Figure 7). These airflow patterns differfrom those reported by Pakari & Ghani. (2019b). This canbe generated by the buoyancy effects and the presenceof anti-insect nets considered in our study.
The quantitative behavior of the air movement wasmade through the calculation of the mean speed (MV)and the normalized speed (NV) for two heights aboveground level 1 and 2 meters, this parameter is the relationof the speed of the internal air flow with the speed ofthe external wind (Table 3). MV values for PG rangedfrom 0.27 ± 0.05 to 0.54 ± 0.22 m s-1 for the 1 m height,while for the 2 m height these values were 0.22 ± 0.06and 0.66 ± 0.35 m s-1 characteristic velocities in side-ventilated and roof-ventilated passive greenhouses(Teitel et al., 2006).
On the other hand, for MPG the values of MV were0.34 ± 0.09 and 1.31 ± 0.39 m s-1 for the height of 1 meter,which represents an increase of 25.9 and 142.5% comparedto PG, for the 2 meter height the MV values were 0.13 ±
0.09 and 0.78 ± 0.39 m s-1 which compared to PG are 40.4%lower for S1 and 18.1% higher for S4.
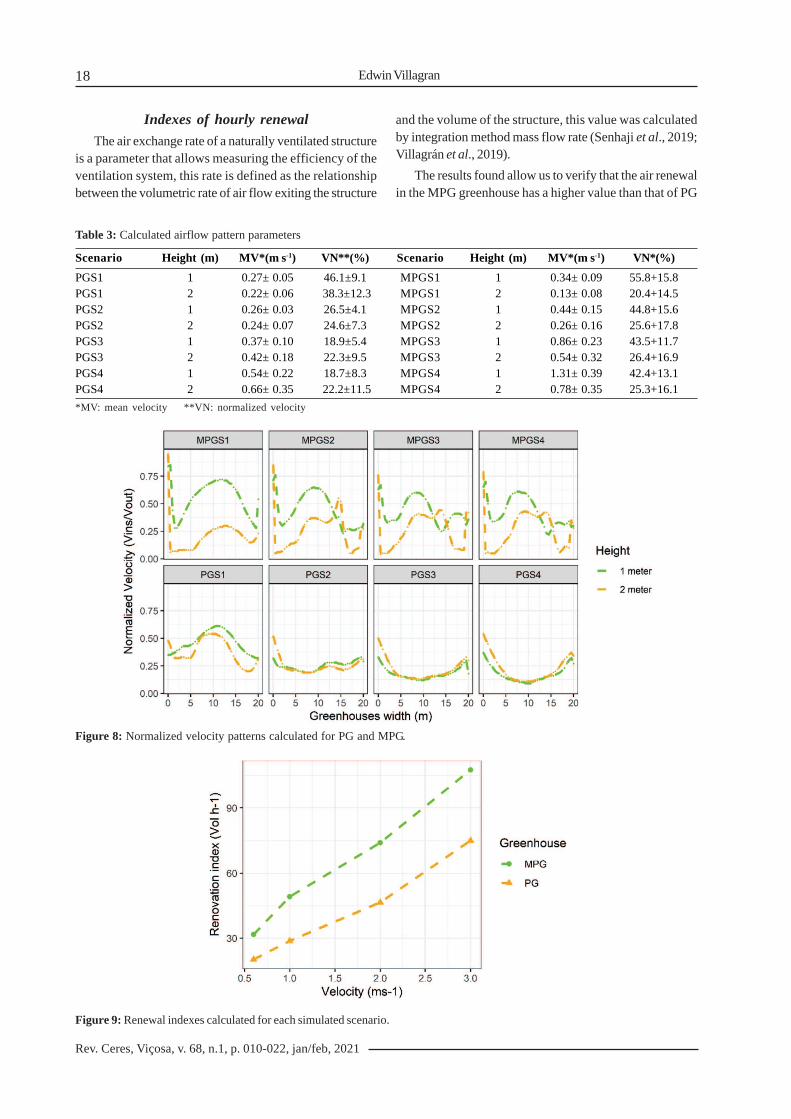
In general it can be mentioned that for MPG the indoorair flows have a higher velocity compared to PG and thisis demonstrated by the VN value obtained in the crosssection of the greenhouse at each of the two heightsevaluated (Figure 8). Additionally, it is possible that theVN value in MPG presents a greater variation along thetransversal axis and between heights analyzed, this isgenerated by the convective type movements that arepresented in this MPG (Figure 7).
The VN values show a reduction in airflow velocitycompared to outdoor velocity of 82.3 and 79.6% for themost critical case in PG and MPG respectively, while thelowest reduction was 53.9 and 44.2% for PG and MPG, thisdifference in speed between the exterior and interior flowof the greenhouses is caused by the presence of the insectprotection meshes, which generate a restriction to themovement of air towards the interior of the greenhouse,the values obtained in PG are similar to those reported byBaeza et al. (2009) in a natural ventilation study developedin a greenhouse equipped with anti-insect screens.
Figure 7: Simulated airflow patterns (ms-1) for PG and MPG.
18 Edwin Villagran
Rev. Ceres, Viçosa, v. 68, n.1, p. 010-022, jan/feb, 2021
Indexes of hourly renewal
The air exchange rate of a naturally ventilated structureis a parameter that allows measuring the efficiency of theventilation system, this rate is defined as the relationshipbetween the volumetric rate of air flow exiting the structure
and the volume of the structure, this value was calculatedby integration method mass flow rate (Senhaji et al., 2019;Villagrán et al., 2019).
The results found allow us to verify that the air renewalin the MPG greenhouse has a higher value than that of PG
Figure 8: Normalized velocity patterns calculated for PG and MPG.
Table 3: Calculated airflow pattern parameters
Scenario Height (m) MV*(m s -1) VN**(%) Scenario Height (m) MV*(m s -1) VN*(%)
PGS1 1 0.27± 0.05 46.1±9.1 MPGS1 1 0.34± 0.09 55.8+15.8PGS1 2 0.22± 0.06 38.3±12.3 MPGS1 2 0.13± 0.08 20.4+14.5PGS2 1 0.26± 0.03 26.5±4.1 MPGS2 1 0.44± 0.15 44.8+15.6PGS2 2 0.24± 0.07 24.6±7.3 MPGS2 2 0.26± 0.16 25.6+17.8PGS3 1 0.37± 0.10 18.9±5.4 MPGS3 1 0.86± 0.23 43.5+11.7PGS3 2 0.42± 0.18 22.3±9.5 MPGS3 2 0.54± 0.32 26.4+16.9PGS4 1 0.54± 0.22 18.7±8.3 MPGS4 1 1.31± 0.39 42.4+13.1PGS4 2 0.66± 0.35 22.2±11.5 MPGS4 2 0.78± 0.35 25.3+16.1
*MV : mean velocity **VN: normalized velocity
Figure 9: Renewal indexes calculated for each simulated scenario.
19Implementation of ventilation towers in a greenhouse established in low altitude tropical climate...
Rev. Ceres, Viçosa, v. 68, n.1, p. 010-022, jan/feb, 2021
(Figure 9). The values for PG ranged from 20.1 to 74.9 volh-1, while those for MPG were 31.7 and 107.5 for S1 and S4respectively, The renewal rate in MPG is 57.3 and 43.4%higher than PG for these two cases. In the case of MPG itcan be said that for speeds e” at 1 ms-1 the renewal ratesare above the minimum value recommended for naturallyventilated greenhouses which is 45 vol h-1, value thatallows to regulate the temperature and relative humidityconditions inside the greenhouse (ASHRAE, 2009;Villagrán et al., 2012).
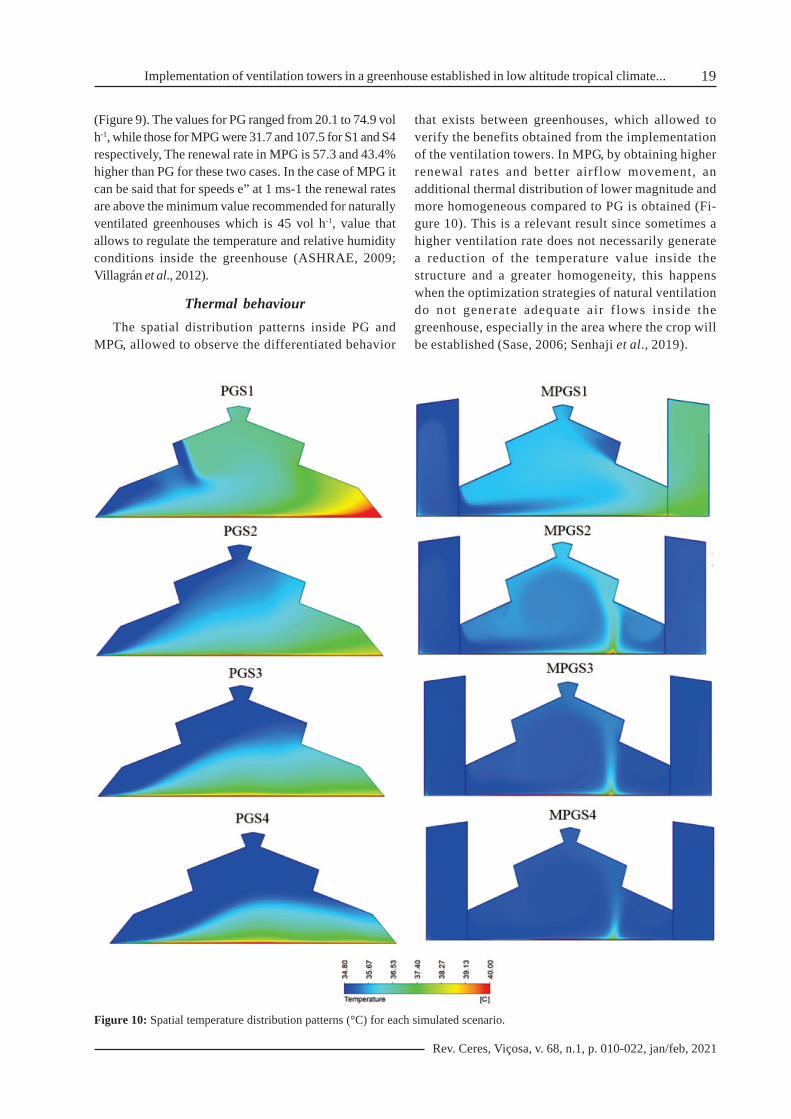
Thermal behaviour
The spatial distribution patterns inside PG andMPG, allowed to observe the differentiated behavior
that exists between greenhouses, which allowed toverify the benefits obtained from the implementationof the ventilation towers. In MPG, by obtaining higherrenewal rates and better airflow movement, anadditional thermal distribution of lower magnitude andmore homogeneous compared to PG is obtained (Fi-gure 10). This is a relevant result since sometimes ahigher ventilation rate does not necessarily generatea reduction of the temperature value inside thestructure and a greater homogeneity, this happenswhen the optimization strategies of natural ventilationdo not generate adequate air f lows inside thegreenhouse, especially in the area where the crop willbe established (Sase, 2006; Senhaji et al., 2019).
Figure 10: Spatial temperature distribution patterns (°C) for each simulated scenario.

20 Edwin Villagran
Rev. Ceres, Viçosa, v. 68, n.1, p. 010-022, jan/feb, 2021
Figure 11: Thermal differential distribution patterns calculated for each simulated scenario.
The average values of temperature (MT) and thermaldifferential between outside and inside (∆T
m) were
calculated for each of the simulated scenarios and for thetwo heights analyzed (Table 4). The MT value obtainedfor PG ranges from 36.3 ± 0.6 to 37.1 ± 1.1 °C, giving valuesof ∆T
m of 1.5 ± 0.6 and 2.3 ± 1.1 °C respectively. On the
other hand, for MPG the MV value varies between 35.0 ±0.2 and 35.9 ± 0.3 which gives values of ∆T
m 0.2 ± 0.2 and
1.0 ± 1.5 °C.Likewise, the standard deviation values of the
parameters evaluated show us that the spatial behaviorof the temperature in this greenhouse is morehomogeneous, a factor that is undoubtedly key in themanagement of the microclimate since this variableintervenes in the physiological and biological processesof the plants and any heterogeneous distribution willdirectly influence the uniformity in the growth of the crops,
which affects the quality of the final product obtained(Ma et al., 2019 a,b).
Additionally, to analyze the spatial distribution of thethermal differential (∆T), it was plotted for all simulatedscenarios, in a cross-sectional profile of the greenhouse(Figure 11). For MPG it can be seen that the distributionof ∆T is very uniform in the profiles analyzed, in the caseof the scenario S1 it is observed as a large part of thetransversal profile (0-15 m) presents a ∆T of approximately1.0 °C, while for the scenarios S2, S3 and S4 the value of∆T shows values lower than 0.8 °C in a large part of thetransversal axis of the greenhouse with the exception of aregion between 12.5 and 15 m, this region is the oneinfluenced by the two convective cells analyzed in the airflow patterns (Figure 7).
On the contrary, for scenario S1 of PG the greatestheterogeneity found in this study is observed where the
Table 4: Thermal evaluation parameters calculated for each simulated scenario
Scenario Height (m) MT*(°C) ∆∆∆∆∆Tm (°C) Scenario Height (m) MT*(°C) ∆∆∆∆∆T
m (°C)
PGS1 1 37.1±1.1 2.3±1.1 MPGS1 1 35.8±0.5 1.0±0.5PGS1 2 36.6±1.2 1.8±1.2 MPGS1 2 35.9±0.3 1.1±0.3PGS2 1 36.6±0.7 1.8±0.7 MPGS2 1 35.4±0.4 0.6±0.4PGS2 2 36.4±0.7 1.6±0.7 MPGS2 2 35.5±0.2 0.7±0.2PGS3 1 36.7±0.8 1.9±0.8 MPGS3 1 35.2±0.3 0.4±0.3PGS3 2 36.4±0.7 1.6±0.7 MPGS3 2 35.3±0.2 0.5±0.2PGS4 1 36.5±0.9 1.7±0.9 MPGS4 1 35.0±0.2 0.2±0.2PGS4 2 36.3±0.6 1.5±0.6 MPGS4 2 35.1±0.1 0.3±0.1
*MT : mean temperature
21Implementation of ventilation towers in a greenhouse established in low altitude tropical climate...
Rev. Ceres, Viçosa, v. 68, n.1, p. 010-022, jan/feb, 2021
value of ∆T reaches over 4 °C in a region of the greenhouse,on the other hand, for S2, S3 and S4 it is observed that ∆Tcan reach values of 2.8, 3.0 and 2.5 °C respectively (Figure11). The greater homogeneity of the temperature in MPGcan be explained by the convective-type airflow patterns,which usually generate a better air mixture that ifcomplemented by adequate ventilation areas generatehomogeneous thermal conditions (Mesmoudi et al., 2017).
CONCLUSIONSThe implementation of ventilation towers proved to
be an interesting alternative for the optimization of thenatural ventilation of passive greenhouses. Thismicroclimatic optimization alternative can be applied tothe various models of passive greenhouses used in tropi-cal countries.
Air flow patterns in Colombian greenhouses equippedwith side air capture towers showed higher velocity andconvective type movement which together generateventilation rates of up to 57.3% compared to the standardgreenhouse. The greenhouse with ventilation towersshowed a highly homogeneous thermal behavior withthermal differentials between inside and outside below1.1 °C.
Under the methodological approach presented in thiswork, future research can be proposed to evaluate thebehavior of natural ventilation in this same greenhouseprototype with the presence of crops of commercialinterest such as; tomatoes, cucumbers and paprika. Tostudy the combined effect of natural ventilation togetherwith evaporative cooling strategies. This methodologycan be applied to other types of established greenhousesin various climatic conditions. Finally, it would also beinteresting to reinforce the validation method by meansof a sonic anemometry or hot-wire analysis, or in itsabsence by a study in the wind tunnel.
ACKNOWLEDGEMENTS, FINANCIALSUPPORT AND FULL DISCLOSURE
The authors are grateful to the Colombian AgriculturalResearch Corporation - AGROSAVIA for technical andadministrative support in this study and to the RegionalFund for Agricultural Technology (FONTAGRO) forfunding research entitled Innovations for horticulture inprotected environments in tropical zones: option forsustainable intensification of family agriculture in thecontext of climate change in LAC. The opinions expressedin this publication are solely those of the authors and donot necessarily reflect the views of FONTAGRO, its Boardof Directors, the Bank, its sponsoring institutions, or thecountries it represents. The authors declare that there isno conflict of interesting carrying this research andpublishing this manuscript.
REFERENCESAkrami M, Javadi AA, Hassanein MJ, Farmani R, Dibaj M, Tabor
GR & Negm A (2020) Study of the Effects of Vent Configurationon Mono-Span Greenhouse Ventilation Using ComputationalFluid Dynamics. Sustainability, 12:986-998.
ASHRAE (2009) ASHRAE Handbook. Atlanta, Fundamentals.1000p.
Baeza E, Hemming S & Stanghellini C (2020) Materials withswitchable radiometric properties: Could they become the perfectgreenhouse cover? Biosystems Engineering, 193:157-173.
Baeza EJ, Pérez-Parra JJ, Montero JI, Bailey BJ, López JC &Gázquez JC (2009) Analysis of the role of sidewall vents onbuoyancy-driven natural ventilation in parral-type greenhouseswith and without insect screens using computational fluiddynamics. Biosystems Engineering, 104:86-96.
Bartzanas T, Boulard T & Kittas C (2004) Effect of VentArrangement on Windward Ventilation of a TunnelGreenhouse. Biosystems Engineering, 88:479-490.
Baxevanou C, Fidaros D, Bartzanas T & Kittas C (2010) Numericalsimulation of solar radiation, air flow and temperature distributionin a naturally ventilated tunnel greenhouse. AgriculturalEngineering International: CIGR Journal, 12:48-67.
Benni S, Tassinari P, Bonora F, Barbaresi A & Torreggiani D (2016)Efficacy of greenhouse natural ventilation: Environmentalmonitoring and CFD simulations of a study case. Energy andBuildings, 125:276-286.
Blocken B (2015) Computational Fluid Dynamics for urbanphysics: Importance, scales, possibilities, limitations and tentips and tricks towards accurate and reliable simulations. Buildingand Environment, 91:219-245.
Bouhoun AH, Bournet PE, Cannavo P & Chantoiseau E (2018)Development of a CFD crop submodel for simulatingmicroclimate and transpiration of ornamental plants grown ina greenhouse under water restriction. Computers and Electronicsin Agriculture, 149:26-40.
Bournet PE & Boulard T (2010) Effect of ventilator configurationon the distributed climate of greenhouses: A review of experi-mental and CFD studies. Computers and electronics in agriculture,74:195-217.
Dhiman M, Sethi VP, Singh B & Sharma A (2019) CFD analysis ofgreenhouse heating using flue gas and hot water heat sink pipenetworks. Computers and Electronics in Agriculture,163:104853.
Espinoza K, López A, Valera DL, Molina-Aiz FD, Torres JA &Pena A (2017) Effects of ventilator configuration on the flowpattern of a naturally-ventilated three-span Mediterraneangreenhouse. Biosystems Engineering, 164:13-30.
Ezzaeri K, Fatnassi H, Wifaya A, Bazgaou A, Aharoune A, PoncetC & Bouirden L (2020) Performance of photovoltaic canariangreenhouse: A comparison study between summer and winterseasons. Solar Energy, 198:275-282.
Flores-Velázquez J, Guerrero FV, Lopez IL, Montero JI & Piscia D(2013). 3-Dimensional thermal analysis of a screenhouse withplane and multispan roof by using computational fluid dynamics(CFD). Acta Horticulturae, 1008:151–158.
Flores-Velázquez J & Vega-García M (2019) Regional managementof the environment in a zenith greenhouse with computationalfluid dynamics (CFD). Ingeniería Agrícola y Biosistemas, 11:3-20.
Graamans L, Baeza E, Van Den Dobbelsteen A, Tsafaras I &Stanghellini C (2018) Plant factories versus greenhouses:Comparison of resource use efficiency. Agricultural Systems,160:31-43.

22 Edwin Villagran
Rev. Ceres, Viçosa, v. 68, n.1, p. 010-022, jan/feb, 2021
Hargreaves DM & Wright NG (2007) On the use of the k–ε modelin commercial CFD software to model the neutral atmosphericboundary layer. Journal of wind engineering and industrialaerodynamics, 95:355-369.
He KS, Chen DY, Sun LJ, Liu ZL & Huang ZY (2015) The effectof vent openings on the microclimate inside multi-spangreenhouses during summer and winter seasons. EngineeringApplications of Computational Fluid Mechanics, 9:399-410.
He X, Wang J, Guo S, Zhang J, Wei B, Sun J & Shu S (2018)Ventilation optimization of solar greenhouse with removableback walls based on CFD. Computers and Electronics inAgriculture, 149:16-25.
Li L & Mak CM (2007) The assessment of the performance of awindcatcher system using computational fluid dynamics. Buildingand Environment, 42:1135-1141.
López A, Valera DL & Molina-Aiz FD (2011) Sonic anemometryto measure natural ventilation in greenhouses. Sensors, 11:9820–9838.
Ma D, Carpenter N, Amatya S, Maki H, Wang L, Zhang L & Jin J(2019a) Removal of greenhouse microclimate heterogeneitywith conveyor system for indoor phenotyping. Computers andElectronics in Agriculture, 166:104979.
Ma D, Carpenter N, Maki H, Rehman TU, Tuinstra MR & Jin J(2019b) Greenhouse environment modeling and simulation formicroclimate control. Computers and electronics in agriculture,162:134-142.
Mesmoudi K, Meguallati KH & Bournet PE (2017) Effect of thegreenhouse design on the thermal behavior and microclimatedistribution in greenhouses installed under semi arid climate.Heat Transfer Asian Research, 46:1294-1311.
Molina-Aiz FD, Norton T, López A, Reyes-Rosas A, Moreno MA,Marín P, Espinoza K & Valera DL (2017) Using computationalfluid dynamics to analyse the CO2 transfer in naturally ventilatedgreenhouses. Acta Horticulturae, 1182:283–292.
Pakari A & Ghani S (2019a) Evaluation of a novel greenhousedesign for reduced cooling loads during the hot season insubtropical regions. Solar Energy, 181:234-242.
Pakari A & Ghani S (2019b) Airflow assessment in a naturallyventilated greenhouse equipped with wind towers: numericalsimulation and wind tunnel experiments. Energy and Buildings,199:1-11.
Reynafarje X, Villagrán EA, Bojacá CR, Gil R & Schrevens E(2020) Simulation and validation of the airflow inside a naturallyventilated greenhouse designed for tropical conditions. ActaHorticulturae, 1271:55–62.
Sase S (2006) Air movement and climate uniformity in ventilatedgreenhouses. Acta Horticulturae, 719:313–323.
Senhaji A, Mouqallid M & Majdoubi H (2019) CFD assisted studyof multi-chapels greenhouse vents openings effect on insideairflow circulation and microclimate patterns. Open Journal ofFluid Dynamics, 9:119-139.
Singh MC, Singh JP & Singh KG (2018) Development of amicroclimate model for prediction of temperatures inside anaturally ventilated greenhouse under cucumber crop in soillessmedia. Computers and electronics in agriculture, 154:227-238.
Syed AM & Hachem C (2019) Review of Construction; Geometry;Heating, Ventilation, and Air -Conditioning; and Indoor ClimateRequirements of Agricultural Greenhouses. Journal of BiosystemsEngineering, 23:18-27.
Teitel M, Liran O, Barak M & Tanny J (2006). Air velocities in anaturally ventilated greenhouse. Acta Horticulturae, 719:189-196
Tominaga Y, Mochida A, Yoshie R, Kataoka H, Nozu T, YoshikawaM & Shirasawa T (2008) AIJ guidelines for practical applicationsof CFD to pedestrian wind environment around buildings. Journalof wind engineering and industrial aerodynamics, 96:1749-1761.
Valera DL, Molina FD, Álvarez AJ, López JA, Terrés-Nicoli JM& Madueño A (2005) Contribution to characterisation of insect-proof screens: Experimental measurements in wind tunnel andCFD simulation. Acta Horticulturae, 691:441–448.
Villagrán EA, Gil R, Acuña JF & Bojacá CR (2012) Optimizationof ventilation and its effect on the microclimate of a colombianmultispan greenhouse. Agronomía Colombiana, 30:282-288.
Villagrán EA & Bojacá CR (2019a) Effects of surrounding objectson the thermal performance of passively ventilatedgreenhouses. Journal of Agricultural Engineering, 50:20-27.
Villagrán EA & Bojacá CR (2019b) Study of natural ventilation ina Gothic multi-tunnel greenhouse designed to produce rose (Rosaspp.) in the high-Andean tropic. Ornamental Horticulture,25:133-143.
Villagrán EA & Bojacá CR (2019c) CFD Simulation of the Increaseof the Roof Ventilation Area in a Traditional ColombianGreenhouse: Effect on Air Flow Patterns and Thermal Behavior.International Journal of Heat and Technology, 37:881-892.
Villagrán EA, Baeza EJ & Bojacá CR (2019) Transient CFD analysisof the natural ventilation of three types of greenhouses usedfor agricultural production in a tropical mountain climate.Biosystems Engineering, 188:288-304.
Villagrán E, Ramirez R, Rodriguez A, Pacheco RL & Jaramillo J(2020) Simulation of the Thermal and Aerodynamic Behaviorof an Established Screenhouse under Warm Tropical ClimateConditions: A Numerical Approach. International Journal ofSustainable Development and Planning, 15:487-499.