Embed Size (px)
Citation preview

www.bakbasel.com
Id539 / 1
Impact of tax burden on regional productivity growth
Martin Eichler, BAK Basel Economics
July 4th, 2006, OECD, Paris
OECD Workshop: Effective Corporate Taxation
www.bakbasel.com
Id539 / 2
Policy question: What are the drivers of regional growth?
What are the measures decision makers can choose to foster economic growth?
BAK research project: Understanding the relation between location factors and Policy and Regional Growth regional growth using empirical and econometric tools
Project Sponsors:
How relevant is policy for regional growth?
BAK Analytical Approach:1. Benchmarking: Comparing economic performance and location factors2. Analysis: Understanding the relationship between performance and location factors3. Policy: Advice on policy measures and possible trade-offs
www.bakbasel.com
Id539 / 3
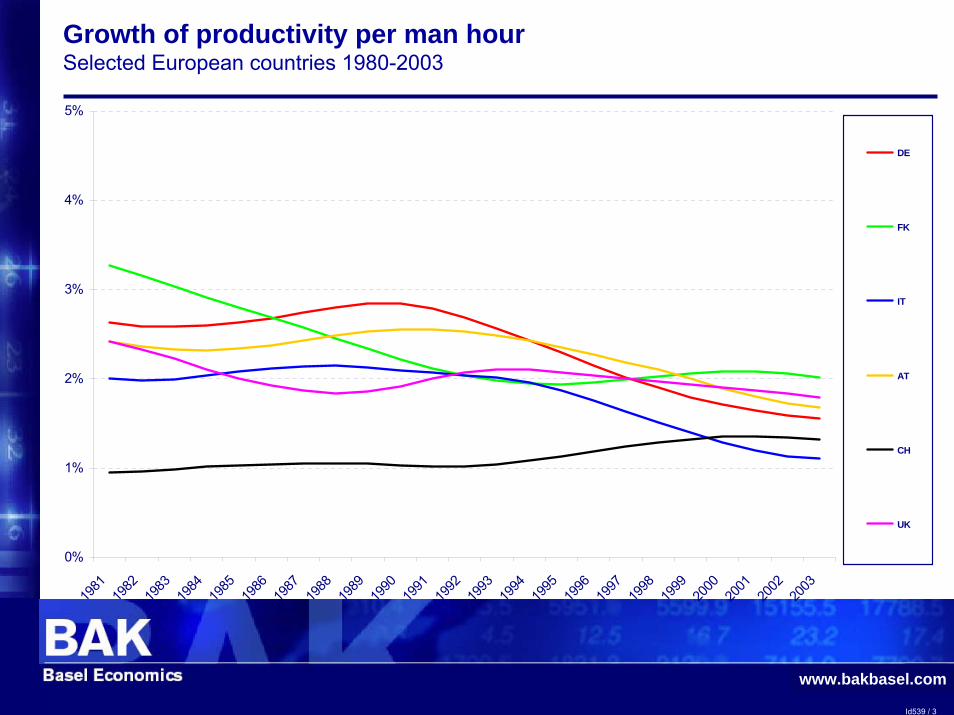
Growth of productivity per man hourSelected European countries 1980-2003
0%
1%
2%
3%
4%
5%
1981
1982
1983
1984
1985
1986
1987
1988
1989
1990
1991
1992
1993
1994
1995
1996
1997
1998
1999
2000
2001
2002
2003
DE
FK
IT
AT
CH
UK
www.bakbasel.com
Id539 / 4
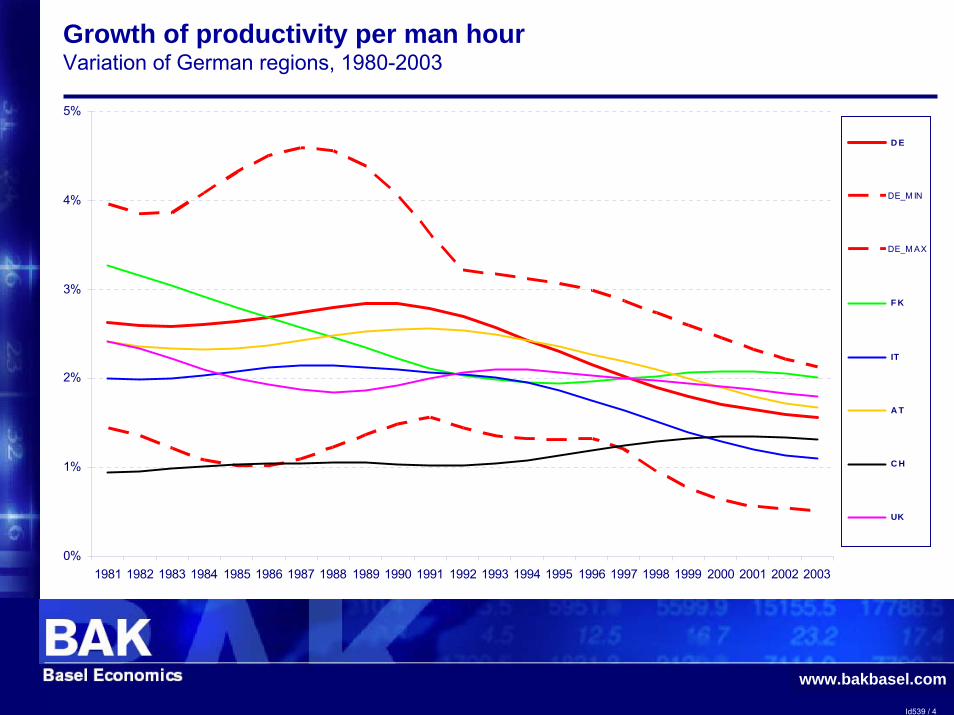
Growth of productivity per man hourVariation of German regions, 1980-2003
0%
1%
2%
3%
4%
5%
1981 1982 1983 1984 1985 1986 1987 1988 1989 1990 1991 1992 1993 1994 1995 1996 1997 1998 1999 2000 2001 2002 2003
D E
DE_M IN
DE_M AX
F K
IT
A T
C H
UK
www.bakbasel.com
Id539 / 5
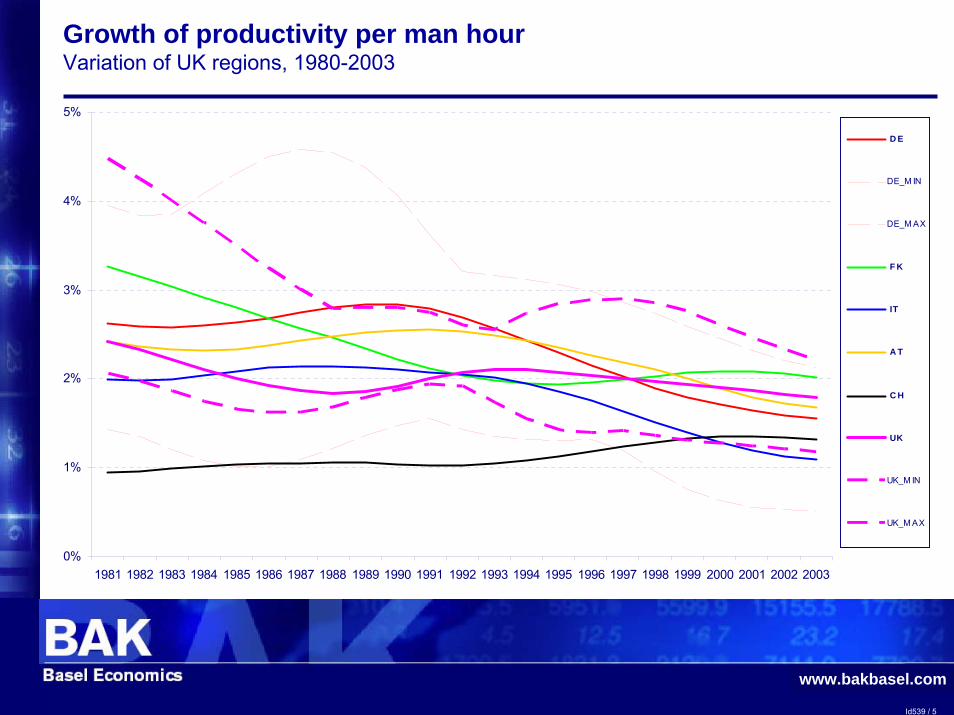
Growth of productivity per man hourVariation of UK regions, 1980-2003
0%
1%
2%
3%
4%
5%
1981 1982 1983 1984 1985 1986 1987 1988 1989 1990 1991 1992 1993 1994 1995 1996 1997 1998 1999 2000 2001 2002 2003
D E
DE_M IN
DE_M AX
F K
IT
A T
C H
UK
UK_M IN
UK_M AX
www.bakbasel.com
Id539 / 6
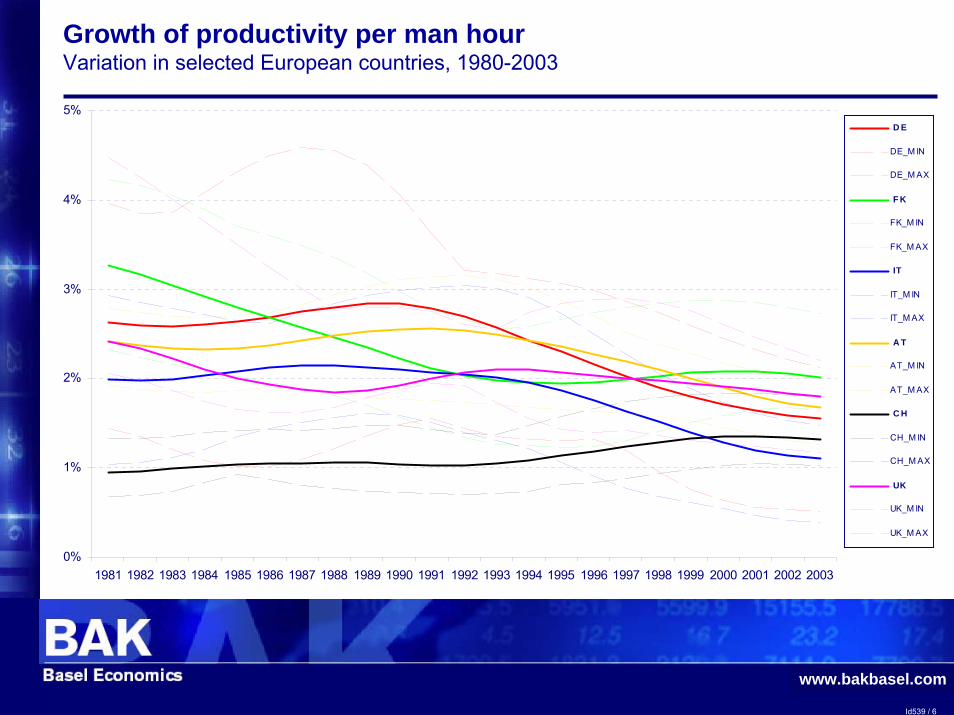
Growth of productivity per man hourVariation in selected European countries, 1980-2003
0%
1%
2%
3%
4%
5%
1981 1982 1983 1984 1985 1986 1987 1988 1989 1990 1991 1992 1993 1994 1995 1996 1997 1998 1999 2000 2001 2002 2003
D E
DE_M IN
DE_M AX
F K
FK_M IN
FK_M AX
IT
IT_M IN
IT_M AX
A T
AT_M IN
AT_M AX
C H
CH_M IN
CH_M AX
UK
UK_M IN
UK_M AX
www.bakbasel.com
Id539 / 7
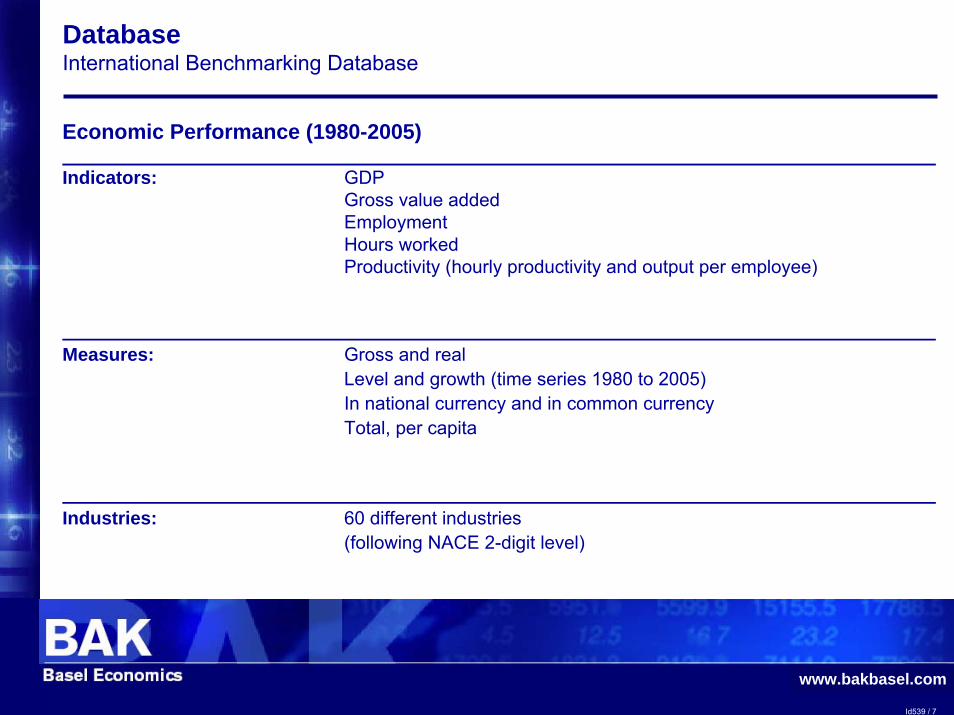
DatabaseInternational Benchmarking Database
Economic Performance (1980-2005)
Indicators: GDPGross value addedEmploymentHours workedProductivity (hourly productivity and output per employee)
Measures: Gross and realLevel and growth (time series 1980 to 2005)In national currency and in common currencyTotal, per capita
Industries: 60 different industries(following NACE 2-digit level)
www.bakbasel.com
Id539 / 8
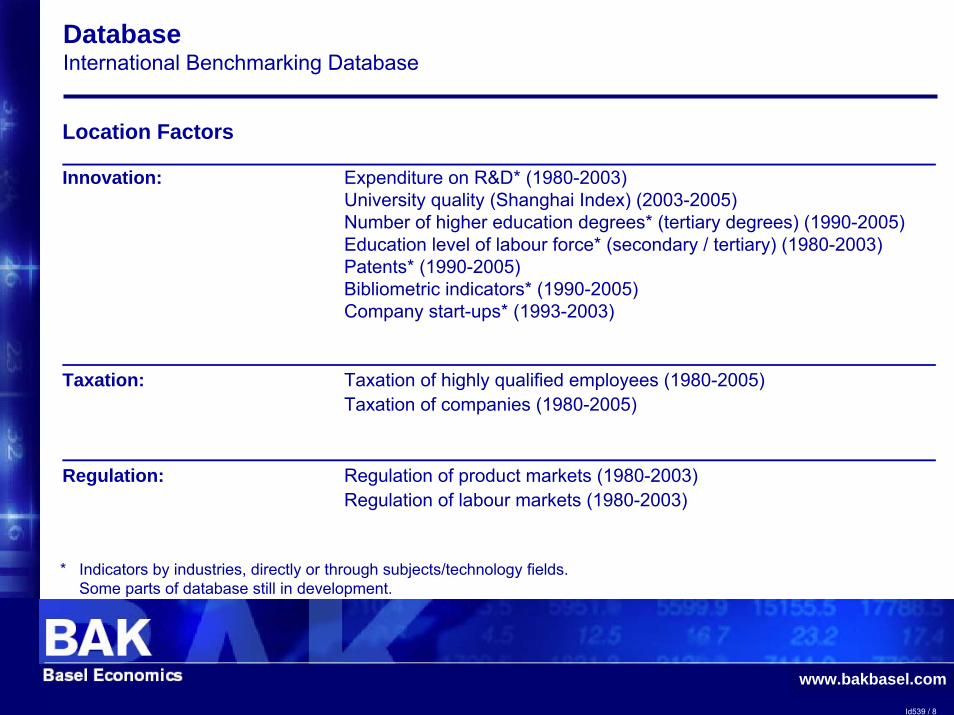
Database International Benchmarking Database
Location Factors
Innovation: Expenditure on R&D* (1980-2003)University quality (Shanghai Index) (2003-2005)Number of higher education degrees* (tertiary degrees) (1990-2005)Education level of labour force* (secondary / tertiary) (1980-2003) Patents* (1990-2005)Bibliometric indicators* (1990-2005)Company start-ups* (1993-2003)
Taxation: Taxation of highly qualified employees (1980-2005)Taxation of companies (1980-2005)
Regulation: Regulation of product markets (1980-2003)Regulation of labour markets (1980-2003)
* Indicators by industries, directly or through subjects/technology fields.Some parts of database still in development.
www.bakbasel.com
Id539 / 9
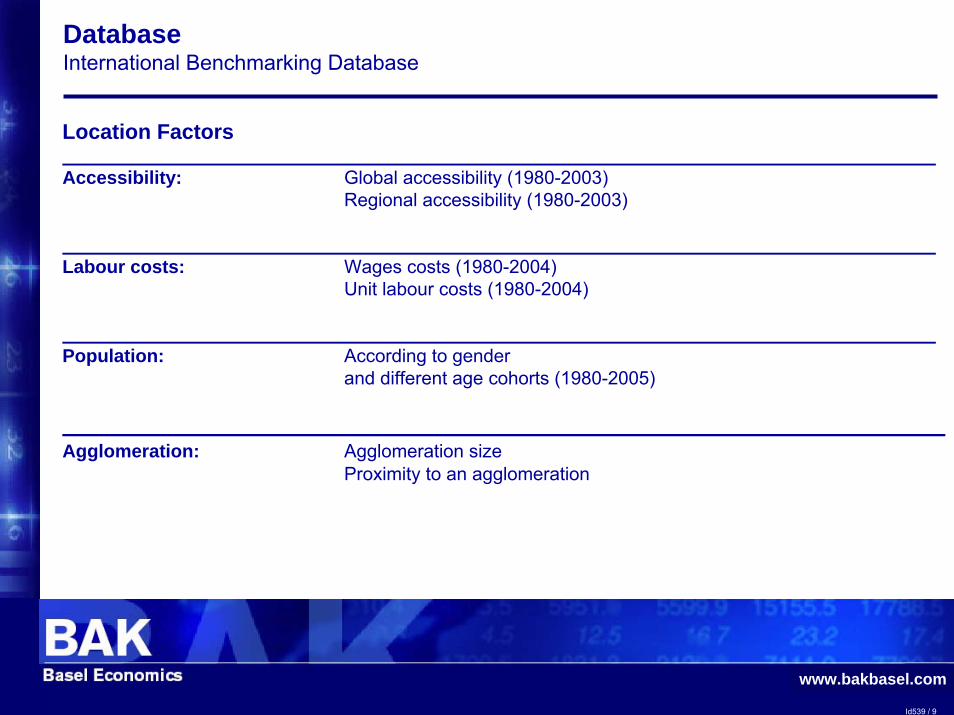
Database International Benchmarking Database
Location Factors
Accessibility: Global accessibility (1980-2003)Regional accessibility (1980-2003)
Labour costs: Wages costs (1980-2004)Unit labour costs (1980-2004)
Population: According to gender and different age cohorts (1980-2005)
Agglomeration: Agglomeration size Proximity to an agglomeration
www.bakbasel.com
Id539 / 10
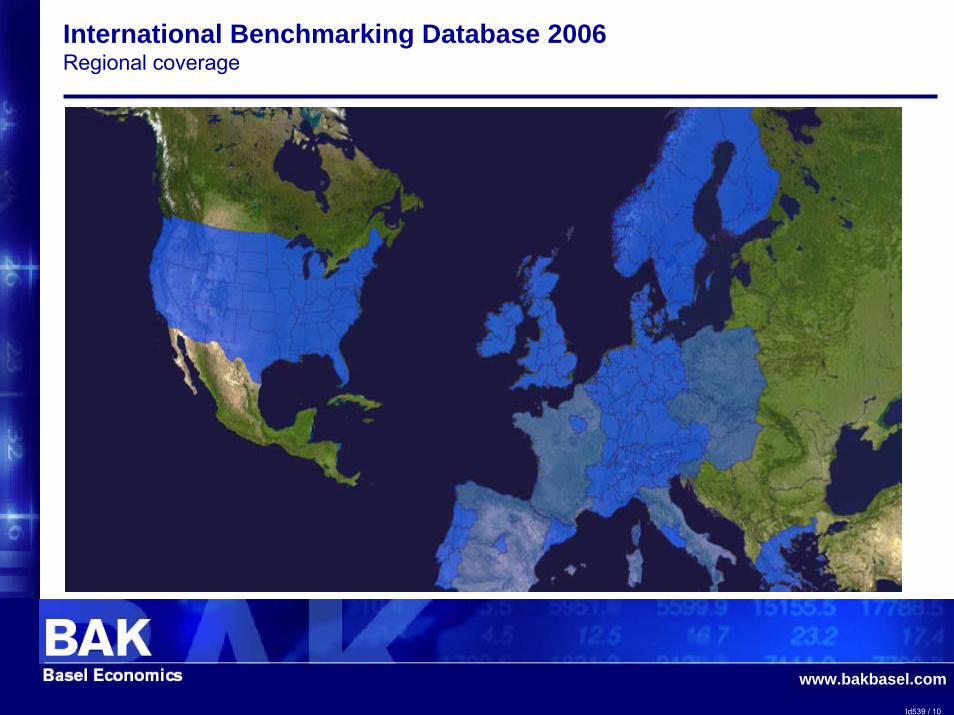
International Benchmarking Database 2006Regional coverage
www.bakbasel.com
Id539 / 11
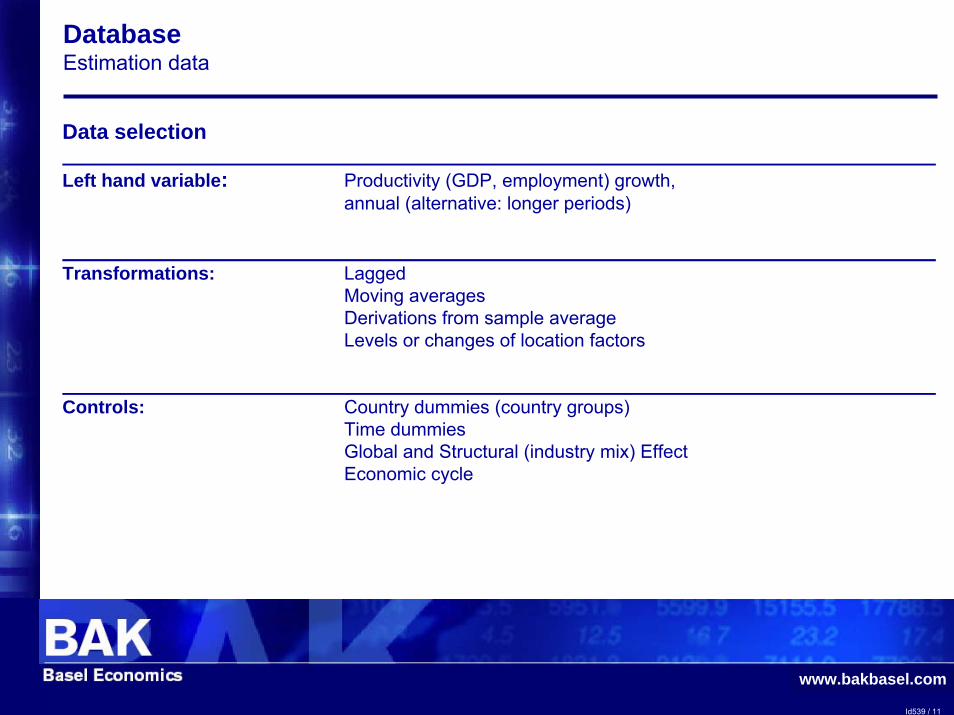
Database Estimation data
Data selection
Left hand variable: Productivity (GDP, employment) growth, annual (alternative: longer periods)
Transformations: LaggedMoving averagesDerivations from sample averageLevels or changes of location factors
Controls: Country dummies (country groups)Time dummiesGlobal and Structural (industry mix) EffectEconomic cycle
www.bakbasel.com
Id539 / 12
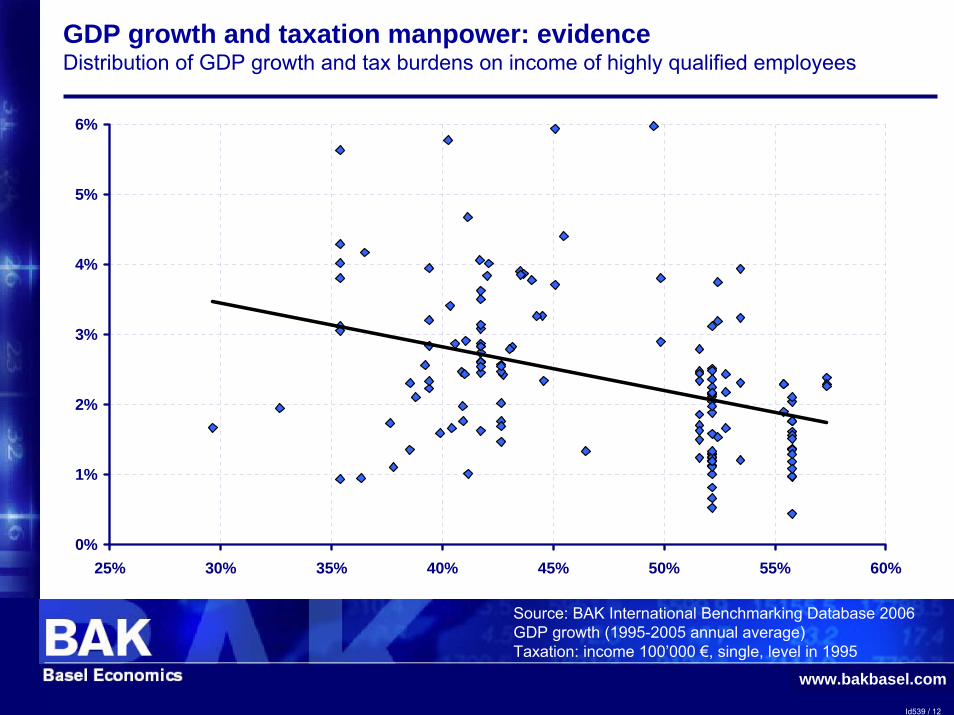
GDP growth and taxation manpower: evidenceDistribution of GDP growth and tax burdens on income of highly qualified employees
0%
1%
2%
3%
4%
5%
6%
25% 30% 35% 40% 45% 50% 55% 60%
Source: BAK International Benchmarking Database 2006GDP growth (1995-2005 annual average) Taxation: income 100’000 €, single, level in 1995
www.bakbasel.com
Id539 / 13
0%
1%
2%
3%
4%
5%
6%
10% 15% 20% 25% 30% 35% 40% 45% 50% 55%
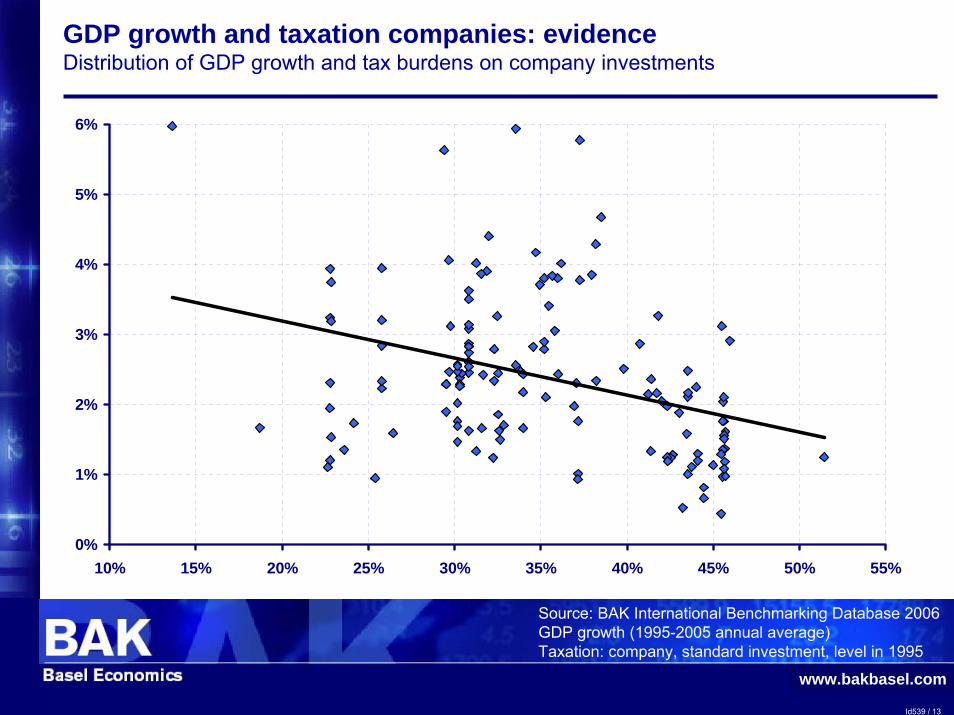
Source: BAK International Benchmarking Database 2006GDP growth (1995-2005 annual average) Taxation: company, standard investment, level in 1995
GDP growth and taxation companies: evidenceDistribution of GDP growth and tax burdens on company investments
www.bakbasel.com
Id539 / 14
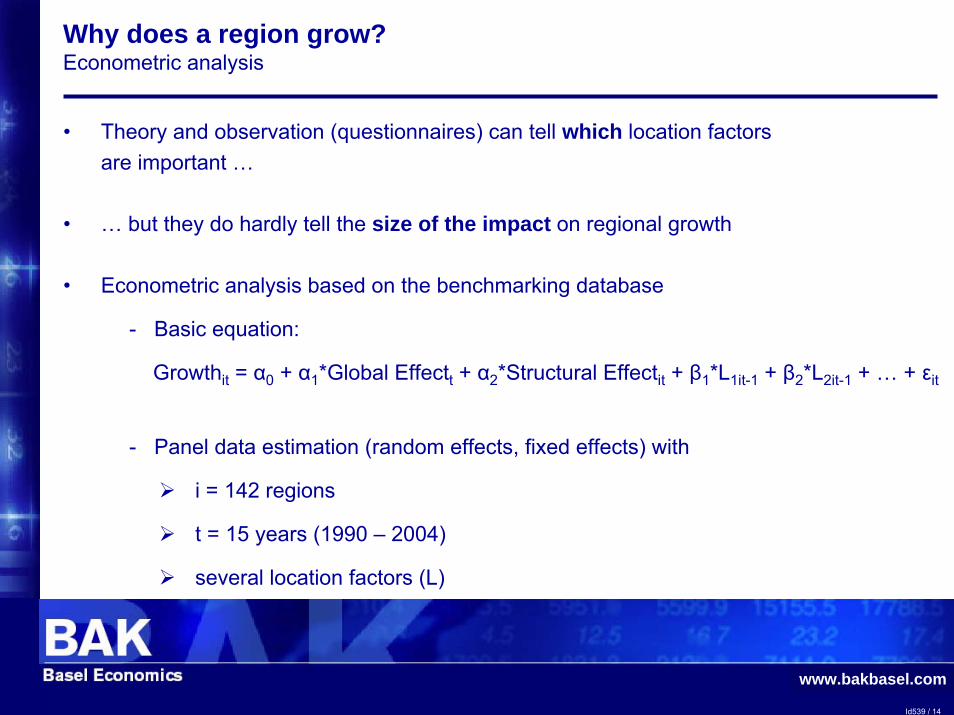
• Theory and observation (questionnaires) can tell which location factors are important …
• … but they do hardly tell the size of the impact on regional growth
• Econometric analysis based on the benchmarking database
- Basic equation:
Growthit = α0 + α1*Global Effectt + α2*Structural Effectit + β1*L1it-1 + β2*L2it-1 + … + εit
- Panel data estimation (random effects, fixed effects) with
i = 142 regions
t = 15 years (1990 – 2004)
several location factors (L)
Why does a region grow?Econometric analysis
www.bakbasel.com
Id539 / 15
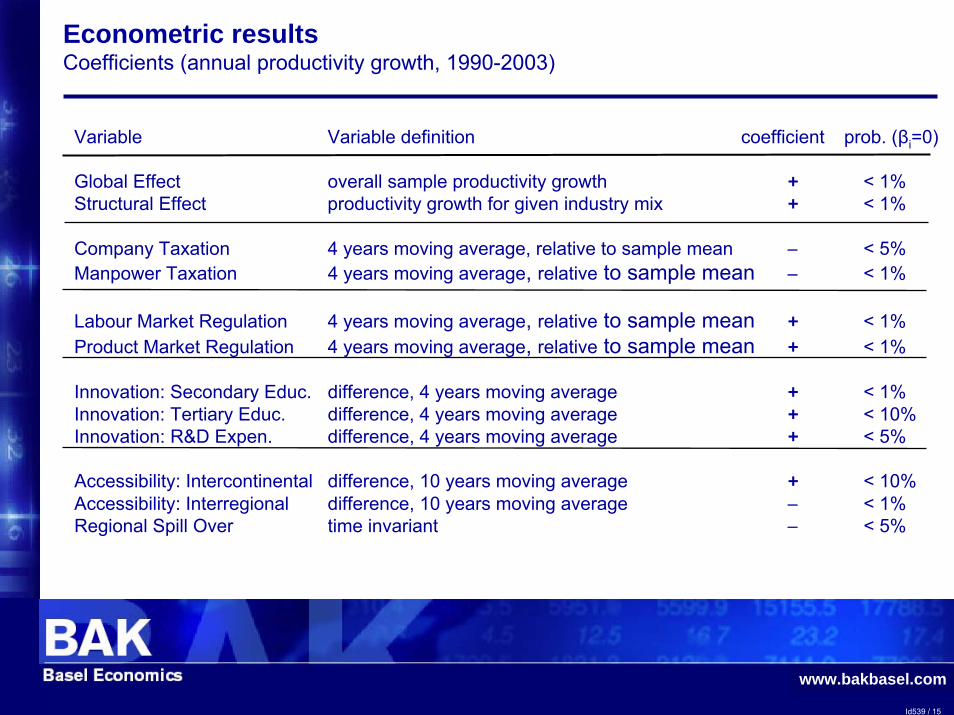
Econometric resultsCoefficients (annual productivity growth, 1990-2003)
Variable Variable definition coefficient prob. (βi=0)
Global Effect overall sample productivity growth + < 1%Structural Effect productivity growth for given industry mix + < 1%
Company Taxation 4 years moving average, relative to sample mean − < 5%Manpower Taxation 4 years moving average, relative to sample mean − < 1%
Labour Market Regulation 4 years moving average, relative to sample mean + < 1%Product Market Regulation 4 years moving average, relative to sample mean + < 1%
Innovation: Secondary Educ. difference, 4 years moving average + < 1%Innovation: Tertiary Educ. difference, 4 years moving average + < 10%Innovation: R&D Expen. difference, 4 years moving average + < 5%
Accessibility: Intercontinental difference, 10 years moving average + < 10%Accessibility: Interregional difference, 10 years moving average − < 1%Regional Spill Over time invariant − < 5%
www.bakbasel.com
Id539 / 16
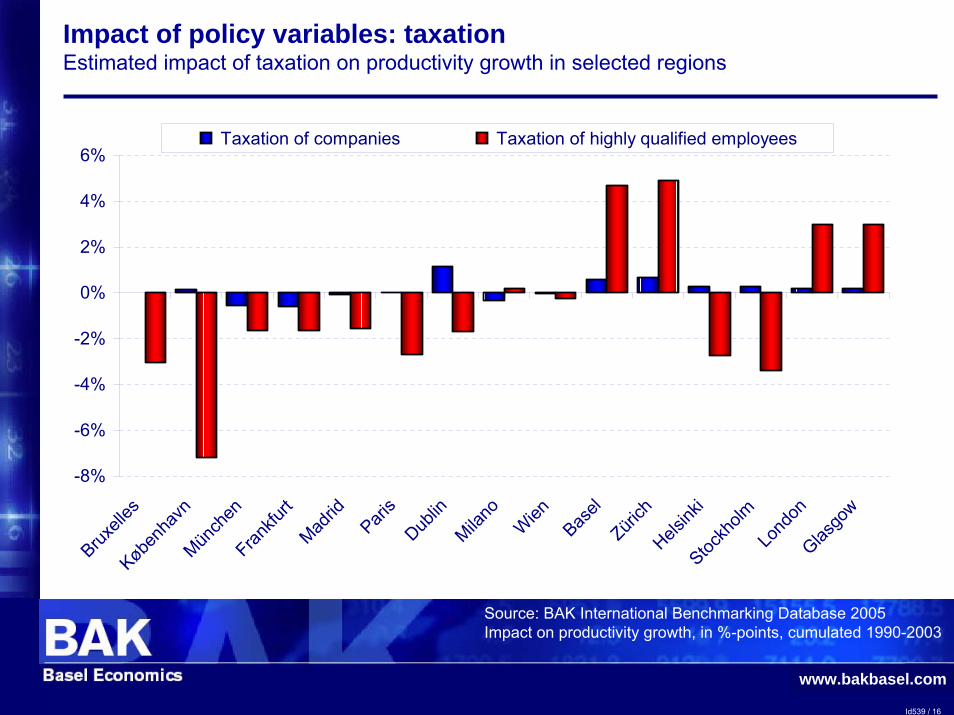
Impact of policy variables: taxationEstimated impact of taxation on productivity growth in selected regions
-8%
-6%
-4%
-2%
0%
2%
4%
6%
Bruxell
esKøbe
nhav
nMün
chen
Frankfu
rtMad
ridPari
sDub
linMila
noWienBas
elZüri
chHels
inki
Stockh
olmLo
ndon
Glasgo
w
Taxation of companies Taxation of highly qualified employees
Source: BAK International Benchmarking Database 2005Impact on productivity growth, in %-points, cumulated 1990-2003
www.bakbasel.com
Id539 / 17
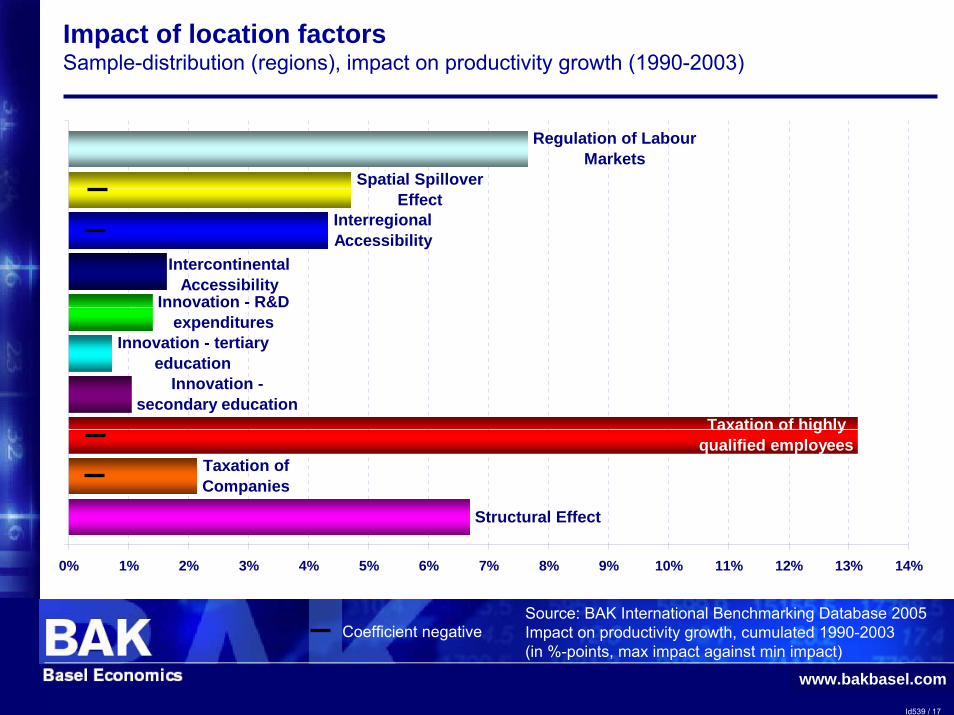
Source: BAK International Benchmarking Database 2005Impact on productivity growth, cumulated 1990-2003(in %-points, max impact against min impact)
Structural Effect
Taxation of Companies
Innovation - secondary education
Innovation - tertiary education
Innovation - R&D expenditures
Spatial Spillover Effect
Regulation of Labour Markets
Taxation of highly qualified employees
Intercontinental Accessibility
Interregional Accessibility
0% 1% 2% 3% 4% 5% 6% 7% 8% 9% 10% 11% 12% 13% 14%
Impact of location factorsSample-distribution (regions), impact on productivity growth (1990-2003)
Coefficient negative
www.bakbasel.com
Id539 / 18
Research agenda2006
• Regional coverageUS states
Increase regional coverage in Europe (France, Italy), Portugal and Greece
• Left hand side
Include labour market (hours worked, employment ratio, population)
Industry specific estimations
• Methods
Evaluation of system approach
• Right hand side
www.bakbasel.com
Id539 / 19
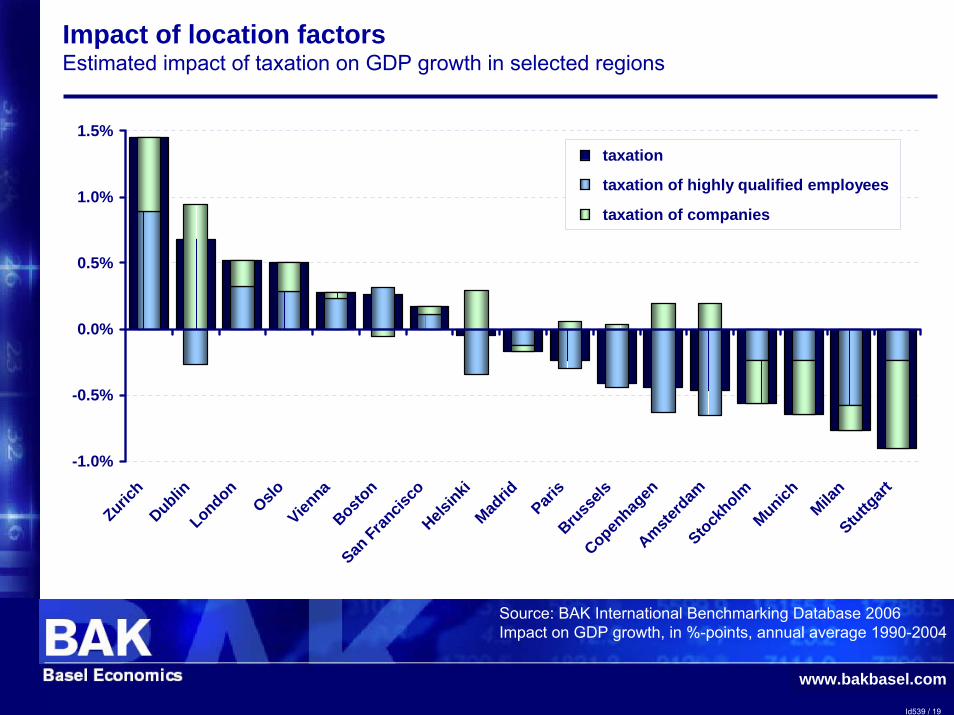
Impact of location factorsEstimated impact of taxation on GDP growth in selected regions
Source: BAK International Benchmarking Database 2006Impact on GDP growth, in %-points, annual average 1990-2004
-1.0%
-0.5%
0.0%
0.5%
1.0%
1.5%
Zurich
DublinLondon
OsloVien
naBosto
nSan
Francis
coHels
inkiMad
ridPari
sBru
ssels
Copenhag
enAmste
rdam
Stockholm
MunichMila
nStuttg
art
taxation
taxation of highly qualified employees
taxation of companies
www.bakbasel.com
Id539 / 20
-1.5% -1.0% -0.5% 0.0% 0.5% 1.0% 1.5% 2.0%
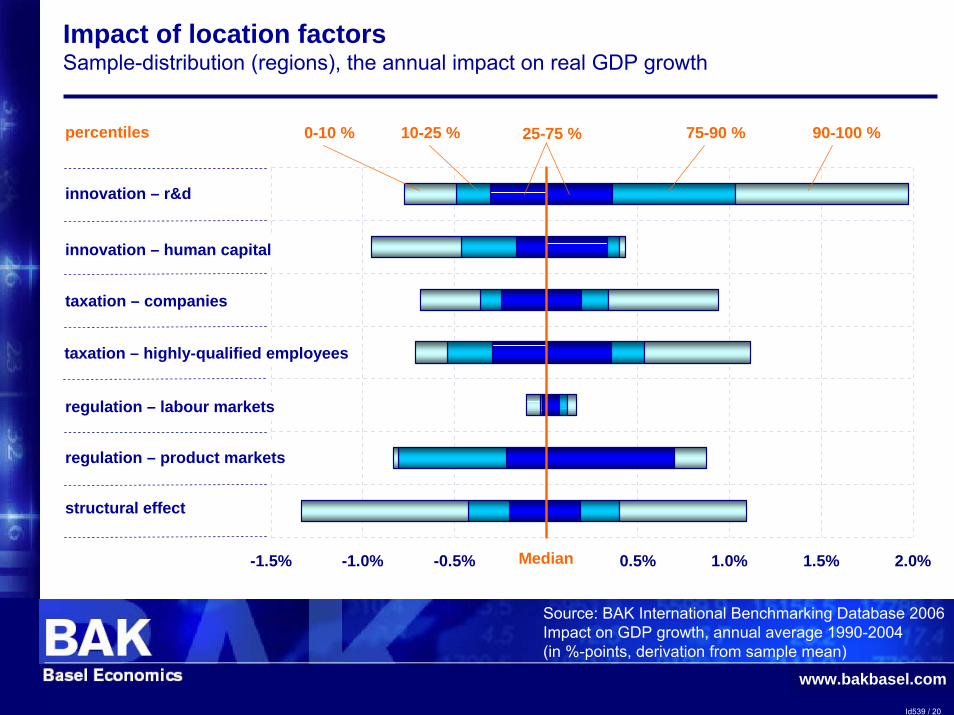
Impact of location factorsSample-distribution (regions), the annual impact on real GDP growth
Source: BAK International Benchmarking Database 2006Impact on GDP growth, annual average 1990-2004(in %-points, derivation from sample mean)
innovation – r&d
innovation – human capital
taxation – companies
taxation – highly-qualified employees
regulation – labour markets
regulation – product markets
structural effect
0-10 % 10-25 % 25-75 % 75-90 % 90-100 %
Median
percentiles
www.bakbasel.com
Id539 / 21
Summary of resultsOECD workshop on corporate taxation, July 4th, 2006
• Research program on impact of location factors on economic growthRegional variation is large …
… and available location factors can only explain a part of the difference
Signs of location factors largely as expected from theory & significant
Strong country effects and time trend, industry mix has important influence
• Impact of taxation
Tax burdens exercise ceteris paribus a negative impact on economic growth
This result is confirmed by stability tests
Differences of the tax burden on the income of highly qualified employees explains more regional growth differences than company taxation,especially for productivity growth
www.bakbasel.com
Id539 / 22
Research agendaOECD workshop on corporate taxation, July 4th, 2006
• Further research directionsRegional coverage
More specific on sources of growth (productivity, hours worked, employment ratio, population)
Advanced Methods (system estimation)
Add more location factors, especially varying between regions(regulation; fragmentation and decentralization; innovation; …)
Industry specific estimations
• Further research directions (taxation)
Test more different types of tax burdens
Influence on specific industries different?
Add more regions with different tax burdens