Embed Size (px)
Citation preview
The Tax Foundation is the nation’s leading independent tax policy research organization. Since 1937, our research, analysis, and experts have informed smarter tax policy at the federal, state, and global levels. We are a 501(c)(3) nonprofit organization.
©2020 Tax FoundationDistributed underCreative Commons CC-BY-NC 4.0
Editor, Rachel ShusterDesigner, Dan Carvajal
Tax Foundation1325 G Street, NW, Suite 950Washington, DC 20005
202.464.6200
taxfoundation.org
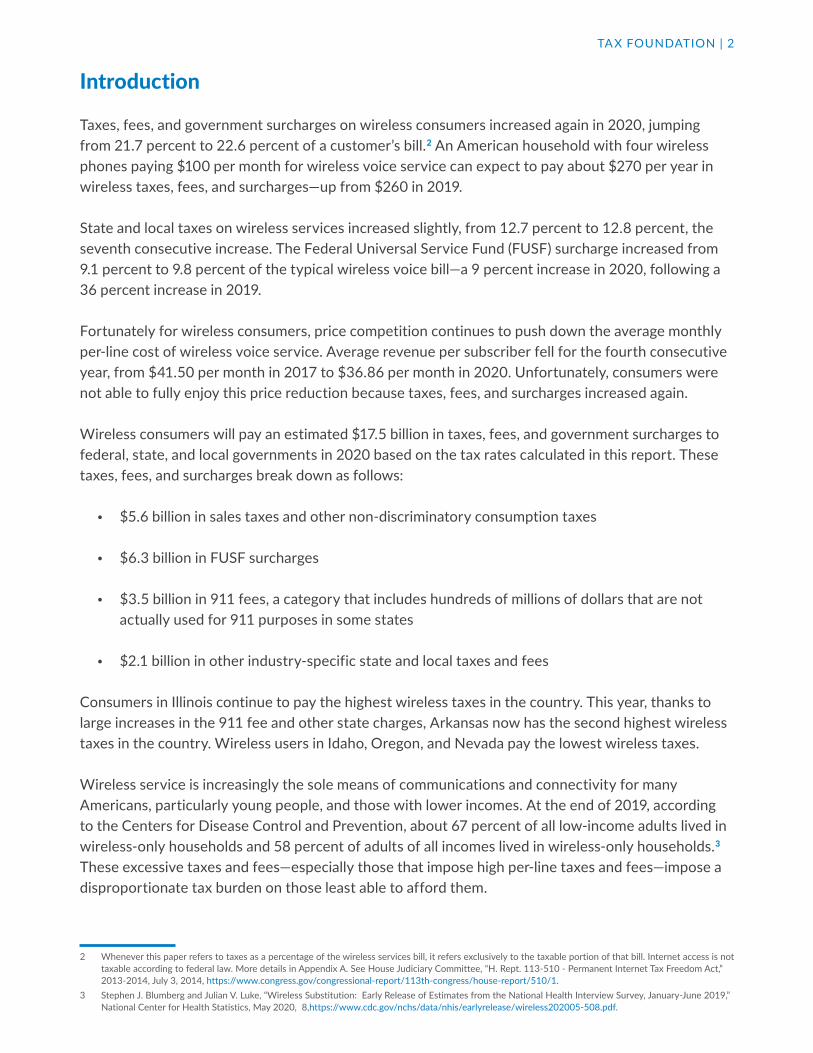
Wireless Tax Burden Remains High Due to Federal Surcharge Increase
Key Findings
• A typical American household with four phones on a “family share” plan, paying $100 per month for taxable wireless service, can expect to pay about $270 per year in taxes, fees, and surcharges—up from $260 in 2019.
• Nationally, these impositions make up about 22.6 percent of the average bill—the highest rate ever. Illinois has the highest wireless taxes in the country at 32.2 percent, followed by Arkansas at 30.0 percent, Washington at 29.7 percent, Nebraska at 29.1 percent, and New York at 28.6 percent.
• Since 2008, average monthly wireless service bills per subscriber have dropped by 26 percent, from $50 per line to about $37 per line. However, wireless taxes have increased by 50 percent, from 15.1 percent to 22.6 percent of the average bill.
• At the end of 2019, over 67 percent of low-income adults had wireless as their phone service, and 58 percent of all adults were wireless-only. Excessive taxes and fees, especially the very high per-line charges, impose a disproportionate burden on low-income consumers. In Chicago, a family with four lines of taxable wireless service paying $100 per month is subjected to over $500 per year in taxes and fees.
FISCAL FACTNo. 732 Nov. 2020
Scott MackeyManaging Partner, Leonine Public Affairs LLP
Ulrik BoesenSenior Policy Analyst, Excise Taxes
TAX FOUNDATION | 2
Introduction
Taxes, fees, and government surcharges on wireless consumers increased again in 2020, jumping from 21.7 percent to 22.6 percent of a customer’s bill.2 An American household with four wireless phones paying $100 per month for wireless voice service can expect to pay about $270 per year in wireless taxes, fees, and surcharges—up from $260 in 2019.
State and local taxes on wireless services increased slightly, from 12.7 percent to 12.8 percent, the seventh consecutive increase. The Federal Universal Service Fund (FUSF) surcharge increased from 9.1 percent to 9.8 percent of the typical wireless voice bill—a 9 percent increase in 2020, following a 36 percent increase in 2019.
Fortunately for wireless consumers, price competition continues to push down the average monthly per-line cost of wireless voice service. Average revenue per subscriber fell for the fourth consecutive year, from $41.50 per month in 2017 to $36.86 per month in 2020. Unfortunately, consumers were not able to fully enjoy this price reduction because taxes, fees, and surcharges increased again.
Wireless consumers will pay an estimated $17.5 billion in taxes, fees, and government surcharges to federal, state, and local governments in 2020 based on the tax rates calculated in this report. These taxes, fees, and surcharges break down as follows:
• $5.6 billion in sales taxes and other non-discriminatory consumption taxes
• $6.3 billion in FUSF surcharges
• $3.5 billion in 911 fees, a category that includes hundreds of millions of dollars that are not actually used for 911 purposes in some states
• $2.1 billion in other industry-specific state and local taxes and fees
Consumers in Illinois continue to pay the highest wireless taxes in the country. This year, thanks to large increases in the 911 fee and other state charges, Arkansas now has the second highest wireless taxes in the country. Wireless users in Idaho, Oregon, and Nevada pay the lowest wireless taxes.
Wireless service is increasingly the sole means of communications and connectivity for many Americans, particularly young people, and those with lower incomes. At the end of 2019, according to the Centers for Disease Control and Prevention, about 67 percent of all low-income adults lived in wireless-only households and 58 percent of adults of all incomes lived in wireless-only households.3 These excessive taxes and fees—especially those that impose high per-line taxes and fees—impose a disproportionate tax burden on those least able to afford them.
2 Whenever this paper refers to taxes as a percentage of the wireless services bill, it refers exclusively to the taxable portion of that bill. Internet access is not taxable according to federal law. More details in Appendix A. See House Judiciary Committee, “H. Rept. 113-510 - Permanent Internet Tax Freedom Act,” 2013-2014, July 3, 2014, https://www.congress.gov/congressional-report/113th-congress/house-report/510/1.
3 Stephen J. Blumberg and Julian V. Luke, “Wireless Substitution: Early Release of Estimates from the National Health Interview Survey, January-June 2019,” National Center for Health Statistics, May 2020, 8,https://www.cdc.gov/nchs/data/nhis/earlyrelease/wireless202005-508.pdf.
TAX FOUNDATION | 3
Wireless Taxes and Fees Increase in 2020
This is the eleventh in a series of reports that examine trends in taxes, fees, and government surcharges imposed on wireless voice service by federal, state, and local governments since 2003. The methodology, originally developed by the Council on State Taxation in a 1999 report, is detailed in Appendix A.
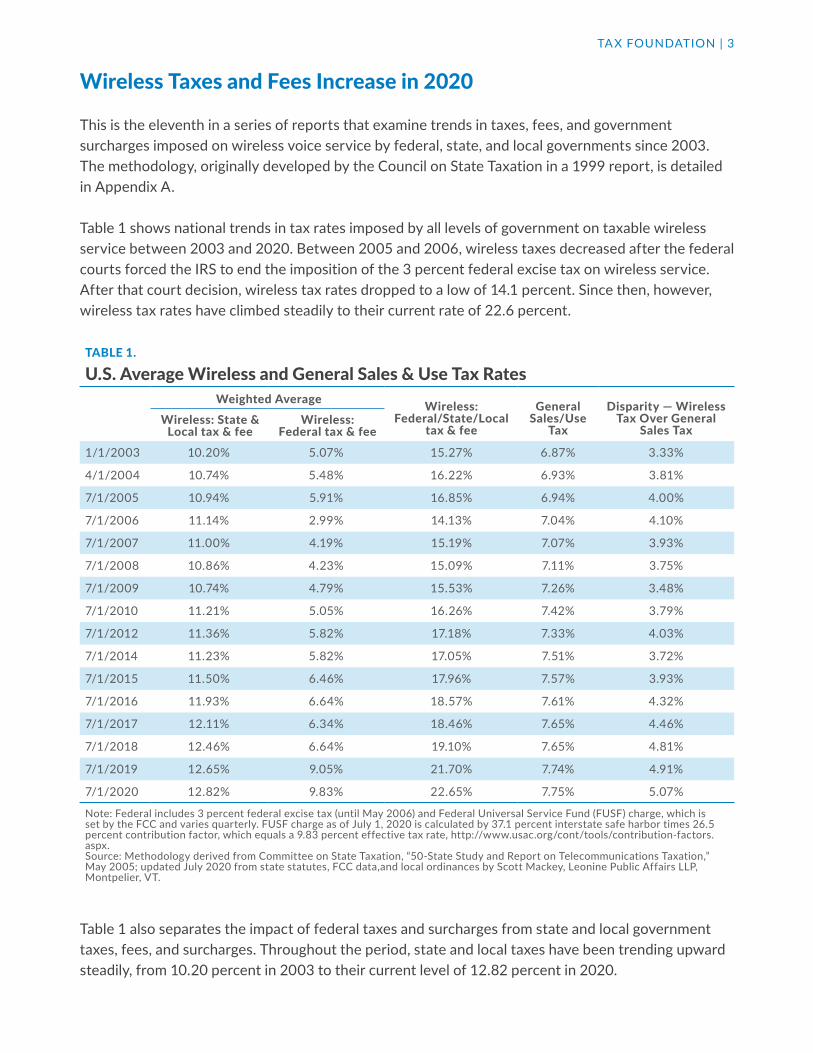
Table 1 shows national trends in tax rates imposed by all levels of government on taxable wireless service between 2003 and 2020. Between 2005 and 2006, wireless taxes decreased after the federal courts forced the IRS to end the imposition of the 3 percent federal excise tax on wireless service. After that court decision, wireless tax rates dropped to a low of 14.1 percent. Since then, however, wireless tax rates have climbed steadily to their current rate of 22.6 percent.
TABLE 1.
U.S. Average Wireless and General Sales & Use Tax RatesWeighted Average Wireless:
Federal/State/Local tax & fee
General Sales/Use
Tax
Disparity — Wireless Tax Over General
Sales TaxWireless: State &
Local tax & feeWireless:
Federal tax & fee1/1/2003 10.20% 5.07% 15.27% 6.87% 3.33%
4/1/2004 10.74% 5.48% 16.22% 6.93% 3.81%
7/1/2005 10.94% 5.91% 16.85% 6.94% 4.00%
7/1/2006 11.14% 2.99% 14.13% 7.04% 4.10%
7/1/2007 11.00% 4.19% 15.19% 7.07% 3.93%
7/1/2008 10.86% 4.23% 15.09% 7.11% 3.75%
7/1/2009 10.74% 4.79% 15.53% 7.26% 3.48%
7/1/2010 11.21% 5.05% 16.26% 7.42% 3.79%
7/1/2012 11.36% 5.82% 17.18% 7.33% 4.03%
7/1/2014 11.23% 5.82% 17.05% 7.51% 3.72%
7/1/2015 11.50% 6.46% 17.96% 7.57% 3.93%
7/1/2016 11.93% 6.64% 18.57% 7.61% 4.32%
7/1/2017 12.11% 6.34% 18.46% 7.65% 4.46%
7/1/2018 12.46% 6.64% 19.10% 7.65% 4.81%
7/1/2019 12.65% 9.05% 21.70% 7.74% 4.91%
7/1/2020 12.82% 9.83% 22.65% 7.75% 5.07%
Note: Federal includes 3 percent federal excise tax (until May 2006) and Federal Universal Service Fund (FUSF) charge, which is set by the FCC and varies quarterly. FUSF charge as of July 1, 2020 is calculated by 37.1 percent interstate safe harbor times 26.5 percent contribution factor, which equals a 9.83 percent effective tax rate, http://www.usac.org/cont/tools/contribution-factors.aspx.Source: Methodology derived from Committee on State Taxation, “50-State Study and Report on Telecommunications Taxation,” May 2005; updated July 2020 from state statutes, FCC data,and local ordinances by Scott Mackey, Leonine Public Affairs LLP, Montpelier, VT.
Table 1 also separates the impact of federal taxes and surcharges from state and local government taxes, fees, and surcharges. Throughout the period, state and local taxes have been trending upward steadily, from 10.20 percent in 2003 to their current level of 12.82 percent in 2020.
TAX FOUNDATION | 4
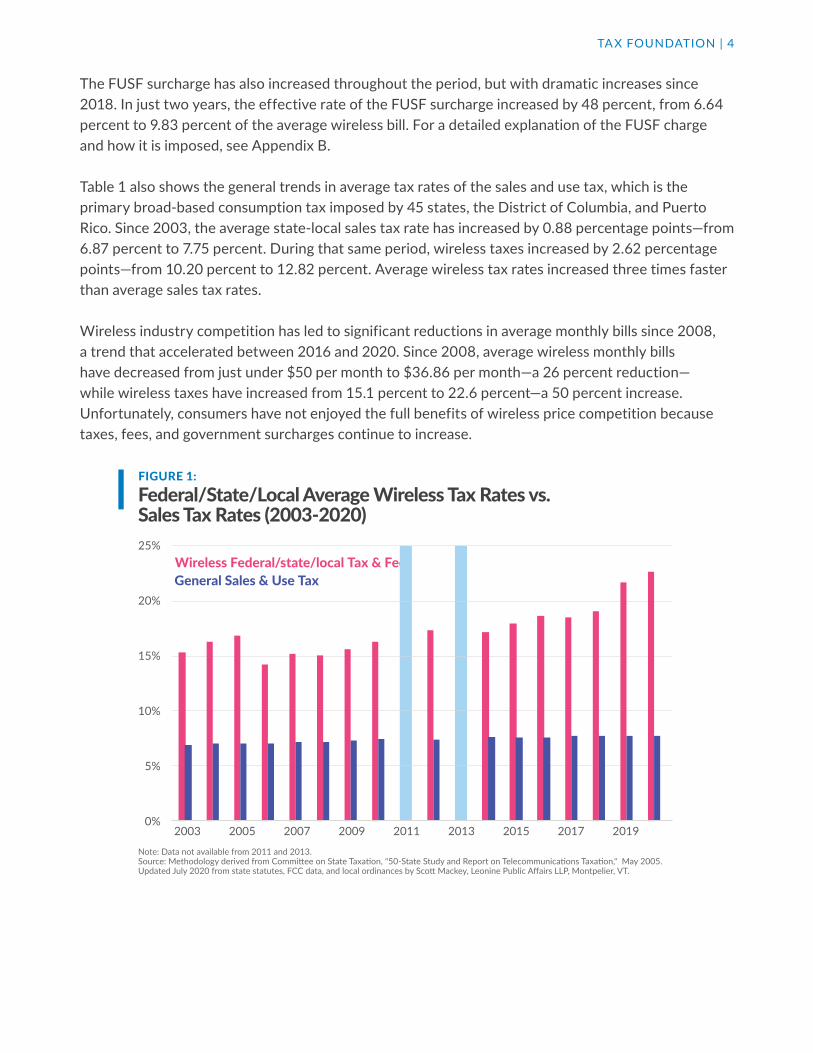
The FUSF surcharge has also increased throughout the period, but with dramatic increases since 2018. In just two years, the effective rate of the FUSF surcharge increased by 48 percent, from 6.64 percent to 9.83 percent of the average wireless bill. For a detailed explanation of the FUSF charge and how it is imposed, see Appendix B.
Table 1 also shows the general trends in average tax rates of the sales and use tax, which is the primary broad-based consumption tax imposed by 45 states, the District of Columbia, and Puerto Rico. Since 2003, the average state-local sales tax rate has increased by 0.88 percentage points—from 6.87 percent to 7.75 percent. During that same period, wireless taxes increased by 2.62 percentage points—from 10.20 percent to 12.82 percent. Average wireless tax rates increased three times faster than average sales tax rates.
Wireless industry competition has led to significant reductions in average monthly bills since 2008, a trend that accelerated between 2016 and 2020. Since 2008, average wireless monthly bills have decreased from just under $50 per month to $36.86 per month—a 26 percent reduction—while wireless taxes have increased from 15.1 percent to 22.6 percent—a 50 percent increase. Unfortunately, consumers have not enjoyed the full benefits of wireless price competition because taxes, fees, and government surcharges continue to increase.
FIGURE 1:
TAX FOUNDATION
Note: Data not available from 2011 and 2013.Source: Methodology derived from Committee on State Taxation, "50-State Study and Report on Telecommunications Taxation," May 2005. Updated July 2020 from state statutes, FCC data, and local ordinances by Scott Mackey, Leonine Public Affairs LLP, Montpelier, VT.
Federal/State/Local Average Wireless Tax Rates vs. Sales Tax Rates (2003-2020)
Wireless Federal/state/local Tax & FeeGeneral Sales & Use Tax
0%
5%
10%
15%
20%
25%
2003 2005 2007 2009 2011 2013 2015 2017 2019
TAX FOUNDATION | 5
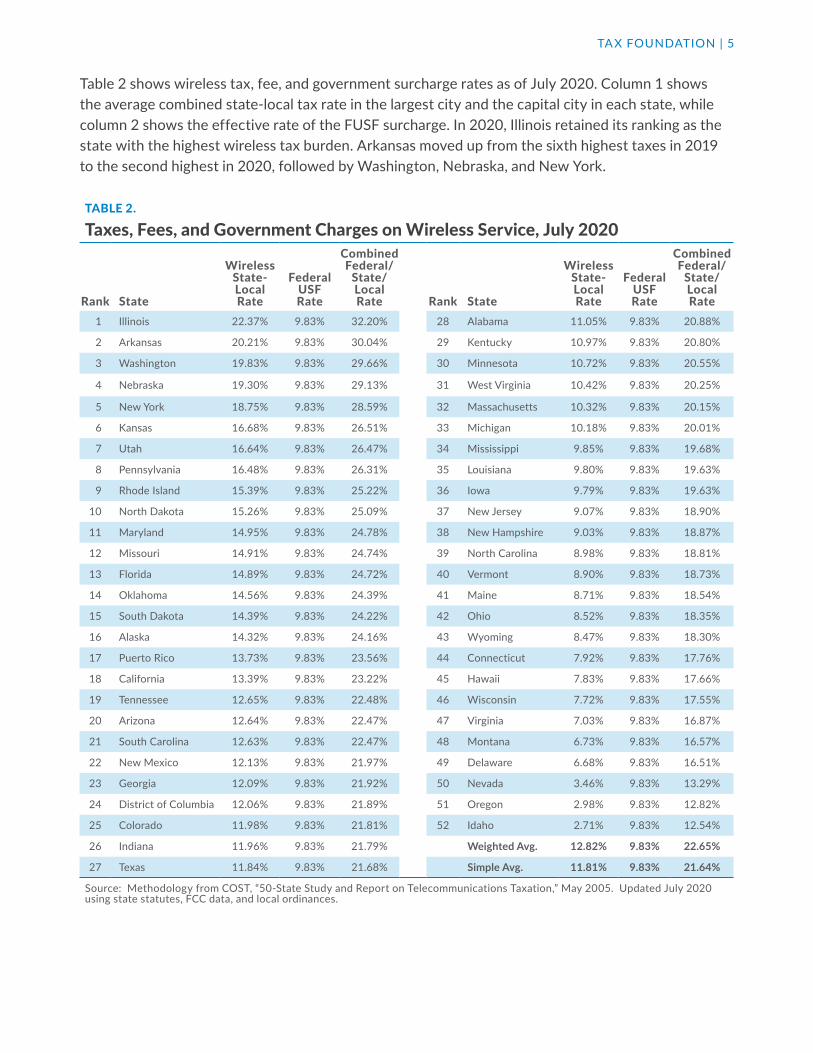
Table 2 shows wireless tax, fee, and government surcharge rates as of July 2020. Column 1 shows the average combined state-local tax rate in the largest city and the capital city in each state, while column 2 shows the effective rate of the FUSF surcharge. In 2020, Illinois retained its ranking as the state with the highest wireless tax burden. Arkansas moved up from the sixth highest taxes in 2019 to the second highest in 2020, followed by Washington, Nebraska, and New York.
TABLE 2.
Taxes, Fees, and Government Charges on Wireless Service, July 2020
Rank State
WirelessState-LocalRate
Federal USFRate
Combined Federal/
State/LocalRate Rank State
WirelessState-LocalRate
Federal USFRate
Combined Federal/
State/LocalRate
1 Illinois 22.37% 9.83% 32.20% 28 Alabama 11.05% 9.83% 20.88%
2 Arkansas 20.21% 9.83% 30.04% 29 Kentucky 10.97% 9.83% 20.80%
3 Washington 19.83% 9.83% 29.66% 30 Minnesota 10.72% 9.83% 20.55%
4 Nebraska 19.30% 9.83% 29.13% 31 West Virginia 10.42% 9.83% 20.25%
5 New York 18.75% 9.83% 28.59% 32 Massachusetts 10.32% 9.83% 20.15%
6 Kansas 16.68% 9.83% 26.51% 33 Michigan 10.18% 9.83% 20.01%
7 Utah 16.64% 9.83% 26.47% 34 Mississippi 9.85% 9.83% 19.68%
8 Pennsylvania 16.48% 9.83% 26.31% 35 Louisiana 9.80% 9.83% 19.63%
9 Rhode Island 15.39% 9.83% 25.22% 36 Iowa 9.79% 9.83% 19.63%
10 North Dakota 15.26% 9.83% 25.09% 37 New Jersey 9.07% 9.83% 18.90%
11 Maryland 14.95% 9.83% 24.78% 38 New Hampshire 9.03% 9.83% 18.87%
12 Missouri 14.91% 9.83% 24.74% 39 North Carolina 8.98% 9.83% 18.81%
13 Florida 14.89% 9.83% 24.72% 40 Vermont 8.90% 9.83% 18.73%
14 Oklahoma 14.56% 9.83% 24.39% 41 Maine 8.71% 9.83% 18.54%
15 South Dakota 14.39% 9.83% 24.22% 42 Ohio 8.52% 9.83% 18.35%
16 Alaska 14.32% 9.83% 24.16% 43 Wyoming 8.47% 9.83% 18.30%
17 Puerto Rico 13.73% 9.83% 23.56% 44 Connecticut 7.92% 9.83% 17.76%
18 California 13.39% 9.83% 23.22% 45 Hawaii 7.83% 9.83% 17.66%
19 Tennessee 12.65% 9.83% 22.48% 46 Wisconsin 7.72% 9.83% 17.55%
20 Arizona 12.64% 9.83% 22.47% 47 Virginia 7.03% 9.83% 16.87%
21 South Carolina 12.63% 9.83% 22.47% 48 Montana 6.73% 9.83% 16.57%
22 New Mexico 12.13% 9.83% 21.97% 49 Delaware 6.68% 9.83% 16.51%
23 Georgia 12.09% 9.83% 21.92% 50 Nevada 3.46% 9.83% 13.29%
24 District of Columbia 12.06% 9.83% 21.89% 51 Oregon 2.98% 9.83% 12.82%
25 Colorado 11.98% 9.83% 21.81% 52 Idaho 2.71% 9.83% 12.54%
26 Indiana 11.96% 9.83% 21.79% Weighted Avg. 12.82% 9.83% 22.65%
27 Texas 11.84% 9.83% 21.68% Simple Avg. 11.81% 9.83% 21.64%
Source: Methodology from COST, “50-State Study and Report on Telecommunications Taxation,” May 2005. Updated July 2020 using state statutes, FCC data, and local ordinances.
TAX FOUNDATION | 6
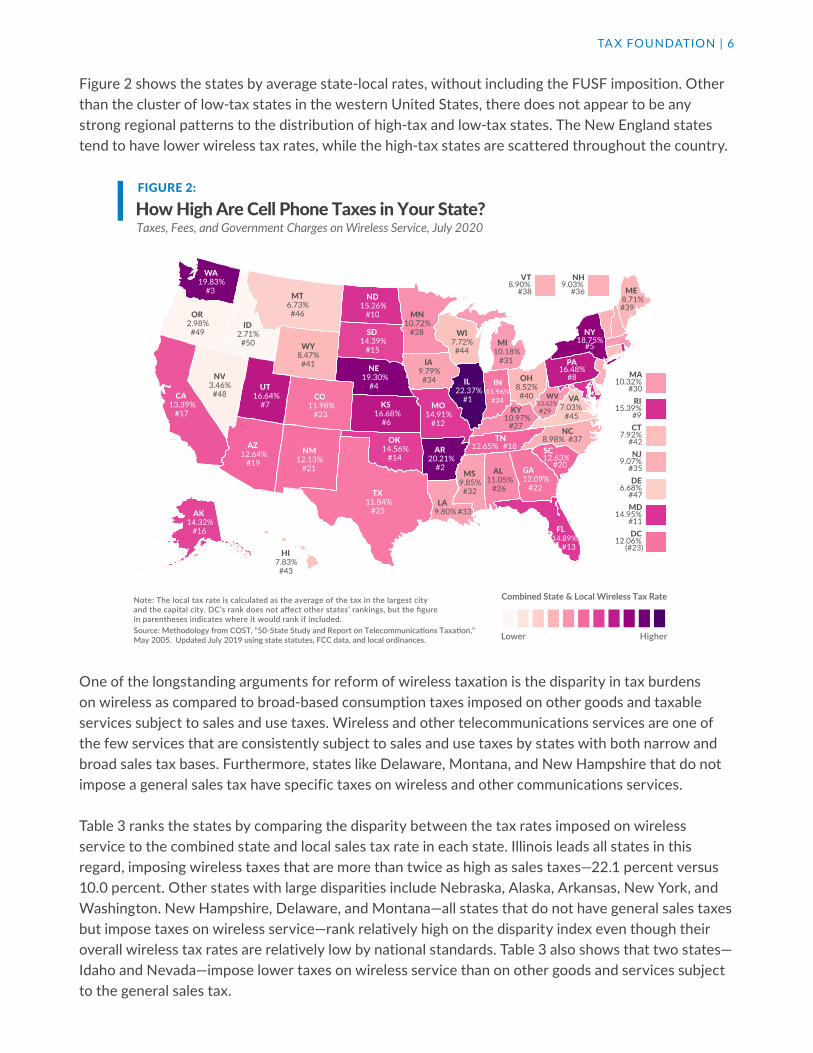
Figure 2 shows the states by average state-local rates, without including the FUSF imposition. Other than the cluster of low-tax states in the western United States, there does not appear to be any strong regional patterns to the distribution of high-tax and low-tax states. The New England states tend to have lower wireless tax rates, while the high-tax states are scattered throughout the country.
FIGURE 2:
One of the longstanding arguments for reform of wireless taxation is the disparity in tax burdens on wireless as compared to broad-based consumption taxes imposed on other goods and taxable services subject to sales and use taxes. Wireless and other telecommunications services are one of the few services that are consistently subject to sales and use taxes by states with both narrow and broad sales tax bases. Furthermore, states like Delaware, Montana, and New Hampshire that do not impose a general sales tax have specific taxes on wireless and other communications services.
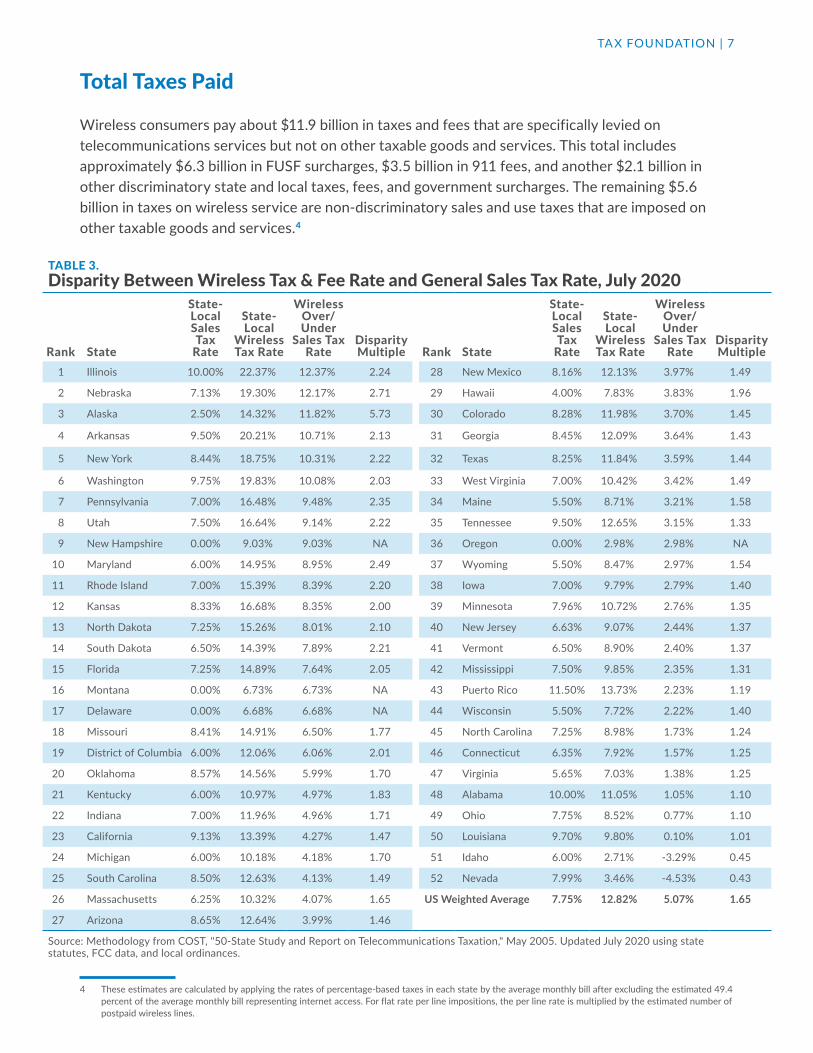
Table 3 ranks the states by comparing the disparity between the tax rates imposed on wireless service to the combined state and local sales tax rate in each state. Illinois leads all states in this regard, imposing wireless taxes that are more than twice as high as sales taxes—22.1 percent versus 10.0 percent. Other states with large disparities include Nebraska, Alaska, Arkansas, New York, and Washington. New Hampshire, Delaware, and Montana—all states that do not have general sales taxes but impose taxes on wireless service—rank relatively high on the disparity index even though their overall wireless tax rates are relatively low by national standards. Table 3 also shows that two states—Idaho and Nevada—impose lower taxes on wireless service than on other goods and services subject to the general sales tax.
How High Are Cell Phone Taxes in Your State?Taxes, Fees, and Government Charges on Wireless Service, July 2020
TAX FOUNDATION
Lower Higher
Combined State & Local Wireless Tax Rate
WA19.83%
#3 MT6.73%#46
ID2.71%#50
ND15.26%
#10 MN10.72%
#28
ME8.71%#39
MI10.18%
#31
WI7.72%#44
OR2.98%#49 SD
14.39%#15
NH9.03%
#36
VT8.90%
#38
NY18.75%
#5WY8.47%#41 IA
9.79%#34
NE19.30%
#4MA
10.32%#30
IL22.37%
#1
PA16.48%
#8
CT7.92%
#42
RI15.39%
#9
CA13.39%
#17
UT16.64%
#7
NV3.46%#48
OH8.52%#40
IN11.96%
#24
NJ9.07%
#35
CO11.98%
#23
WV10.42%#29
MO14.91%
#12
KS16.68%
#6
DE6.68%
#47MD
14.95%#11
(#23)
VA7.03%
#45KY
10.97%#27
DC12.06%
AZ12.64%
#19
OK14.56%
#14NM
12.13%#21
TN12.65% #18
NC8.98% #37
TX11.84%
#25
AR20.21%
#2
SC12.63%
#20AL
11.05%#26
GA12.09%
#22
MS9.85%#32
LA9.80% #33
FL14.89%
#13HI
7.83%#43
AK14.32%
#16
Note: The local tax rate is calculated as the average of the tax in the largest city and the capital city. DC’s rank does not affect other states’ rankings, but the figure in parentheses indicates where it would rank if included.Source: Methodology from COST, "50-State Study and Report on Telecommunications Taxation," May 2005. Updated July 2019 using state statutes, FCC data, and local ordinances.
TAX FOUNDATION | 7
Total Taxes Paid
Wireless consumers pay about $11.9 billion in taxes and fees that are specifically levied on telecommunications services but not on other taxable goods and services. This total includes approximately $6.3 billion in FUSF surcharges, $3.5 billion in 911 fees, and another $2.1 billion in other discriminatory state and local taxes, fees, and government surcharges. The remaining $5.6 billion in taxes on wireless service are non-discriminatory sales and use taxes that are imposed on other taxable goods and services.4
4 These estimates are calculated by applying the rates of percentage-based taxes in each state by the average monthly bill after excluding the estimated 49.4 percent of the average monthly bill representing internet access. For flat rate per line impositions, the per line rate is multiplied by the estimated number of postpaid wireless lines.
TABLE 3.Disparity Between Wireless Tax & Fee Rate and General Sales Tax Rate, July 2020
Rank State
State-LocalSales Tax
Rate
State-Local
Wireless Tax Rate
Wireless Over/ Under
Sales Tax Rate
Disparity Multiple Rank State
State-LocalSales Tax
Rate
State-Local
Wireless Tax Rate
Wireless Over/ Under
Sales Tax Rate
Disparity Multiple
1 Illinois 10.00% 22.37% 12.37% 2.24 28 New Mexico 8.16% 12.13% 3.97% 1.49
2 Nebraska 7.13% 19.30% 12.17% 2.71 29 Hawaii 4.00% 7.83% 3.83% 1.96
3 Alaska 2.50% 14.32% 11.82% 5.73 30 Colorado 8.28% 11.98% 3.70% 1.45
4 Arkansas 9.50% 20.21% 10.71% 2.13 31 Georgia 8.45% 12.09% 3.64% 1.43
5 New York 8.44% 18.75% 10.31% 2.22 32 Texas 8.25% 11.84% 3.59% 1.44
6 Washington 9.75% 19.83% 10.08% 2.03 33 West Virginia 7.00% 10.42% 3.42% 1.49
7 Pennsylvania 7.00% 16.48% 9.48% 2.35 34 Maine 5.50% 8.71% 3.21% 1.58
8 Utah 7.50% 16.64% 9.14% 2.22 35 Tennessee 9.50% 12.65% 3.15% 1.33
9 New Hampshire 0.00% 9.03% 9.03% NA 36 Oregon 0.00% 2.98% 2.98% NA
10 Maryland 6.00% 14.95% 8.95% 2.49 37 Wyoming 5.50% 8.47% 2.97% 1.54
11 Rhode Island 7.00% 15.39% 8.39% 2.20 38 Iowa 7.00% 9.79% 2.79% 1.40
12 Kansas 8.33% 16.68% 8.35% 2.00 39 Minnesota 7.96% 10.72% 2.76% 1.35
13 North Dakota 7.25% 15.26% 8.01% 2.10 40 New Jersey 6.63% 9.07% 2.44% 1.37
14 South Dakota 6.50% 14.39% 7.89% 2.21 41 Vermont 6.50% 8.90% 2.40% 1.37
15 Florida 7.25% 14.89% 7.64% 2.05 42 Mississippi 7.50% 9.85% 2.35% 1.31
16 Montana 0.00% 6.73% 6.73% NA 43 Puerto Rico 11.50% 13.73% 2.23% 1.19
17 Delaware 0.00% 6.68% 6.68% NA 44 Wisconsin 5.50% 7.72% 2.22% 1.40
18 Missouri 8.41% 14.91% 6.50% 1.77 45 North Carolina 7.25% 8.98% 1.73% 1.24
19 District of Columbia 6.00% 12.06% 6.06% 2.01 46 Connecticut 6.35% 7.92% 1.57% 1.25
20 Oklahoma 8.57% 14.56% 5.99% 1.70 47 Virginia 5.65% 7.03% 1.38% 1.25
21 Kentucky 6.00% 10.97% 4.97% 1.83 48 Alabama 10.00% 11.05% 1.05% 1.10
22 Indiana 7.00% 11.96% 4.96% 1.71 49 Ohio 7.75% 8.52% 0.77% 1.10
23 California 9.13% 13.39% 4.27% 1.47 50 Louisiana 9.70% 9.80% 0.10% 1.01
24 Michigan 6.00% 10.18% 4.18% 1.70 51 Idaho 6.00% 2.71% -3.29% 0.45
25 South Carolina 8.50% 12.63% 4.13% 1.49 52 Nevada 7.99% 3.46% -4.53% 0.43
26 Massachusetts 6.25% 10.32% 4.07% 1.65 US Weighted Average 7.75% 12.82% 5.07% 1.65
27 Arizona 8.65% 12.64% 3.99% 1.46
Source: Methodology from COST, "50-State Study and Report on Telecommunications Taxation," May 2005. Updated July 2020 using state statutes, FCC data, and local ordinances.
TAX FOUNDATION | 8
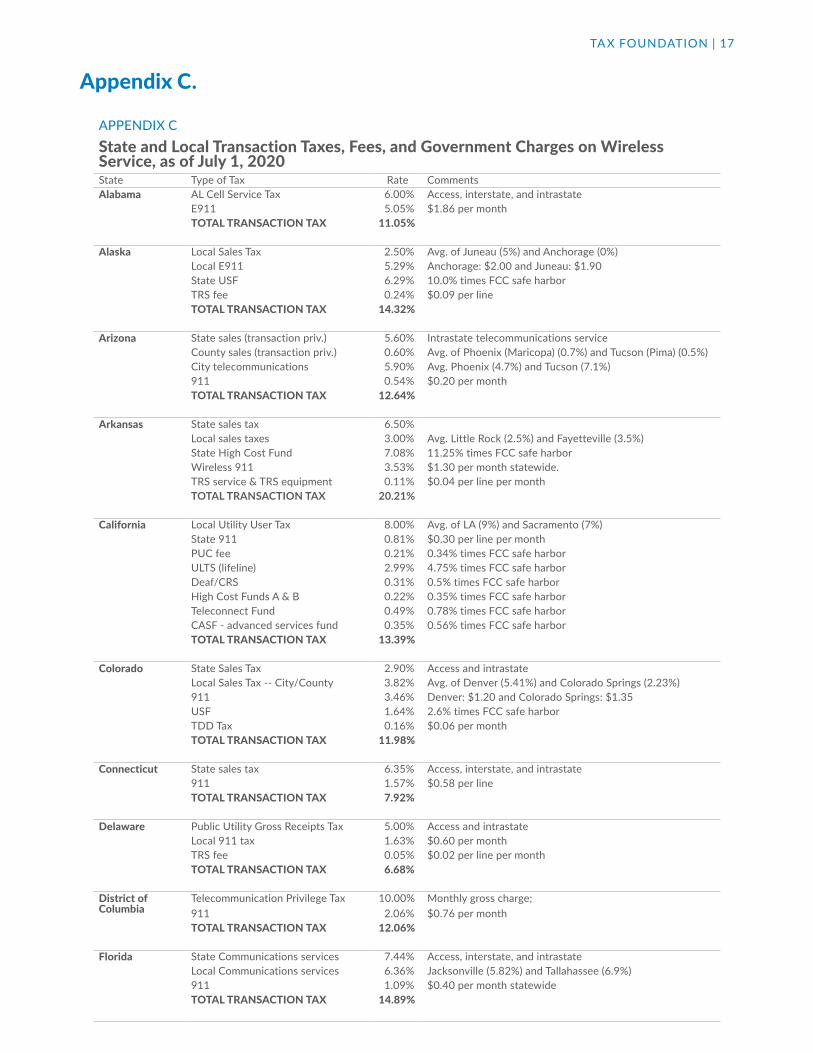
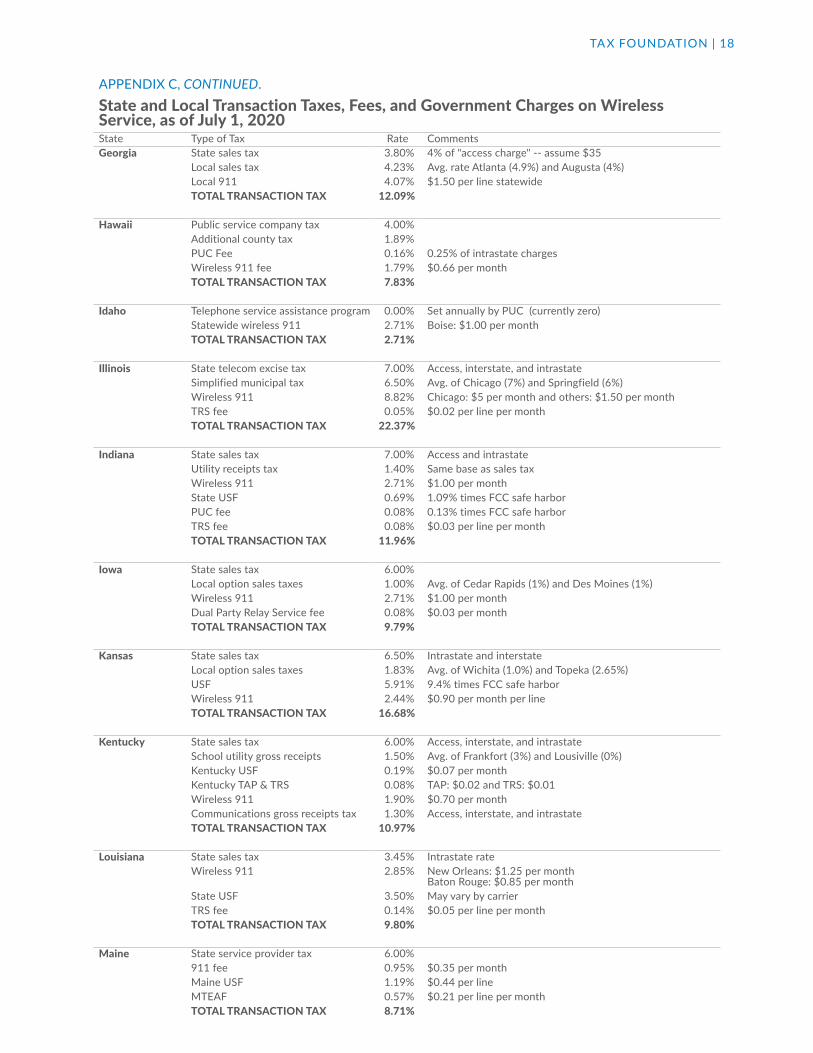
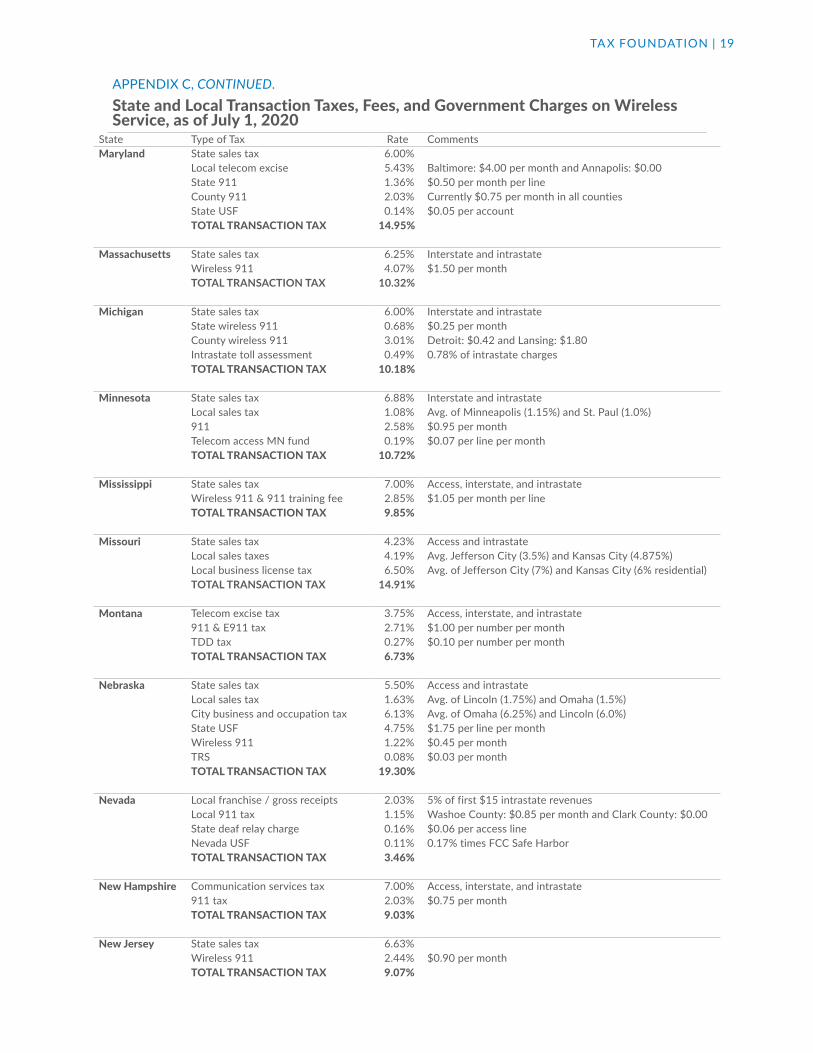
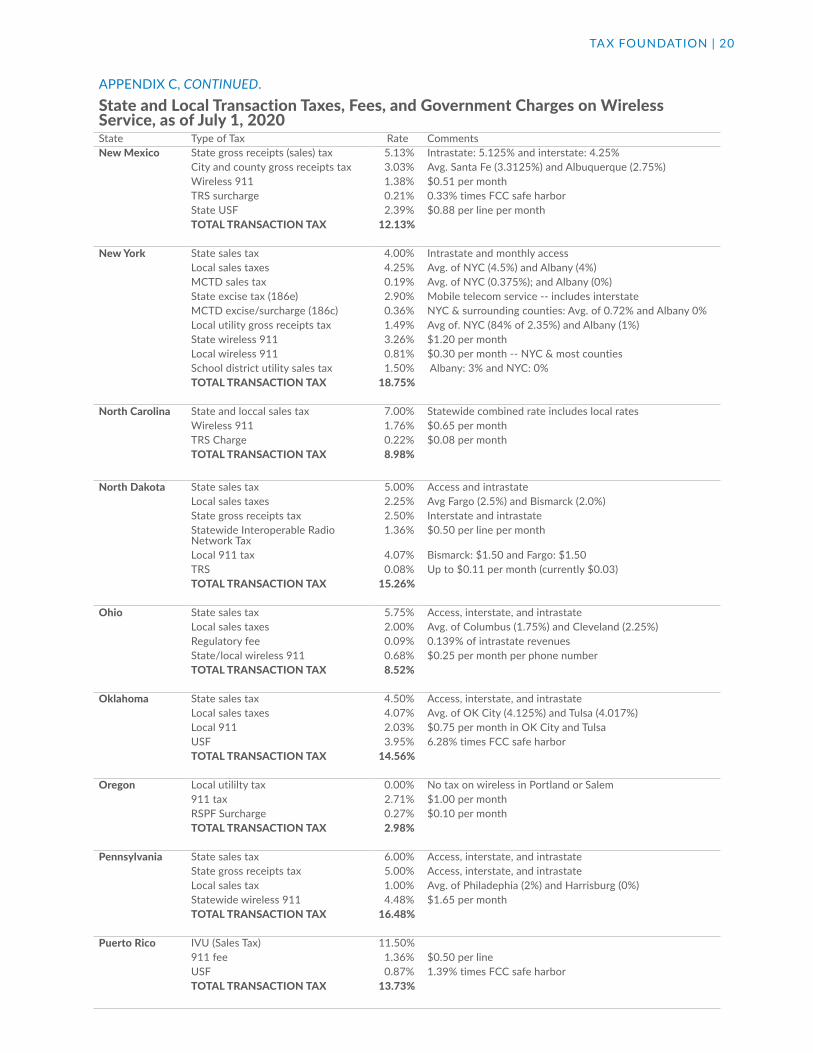
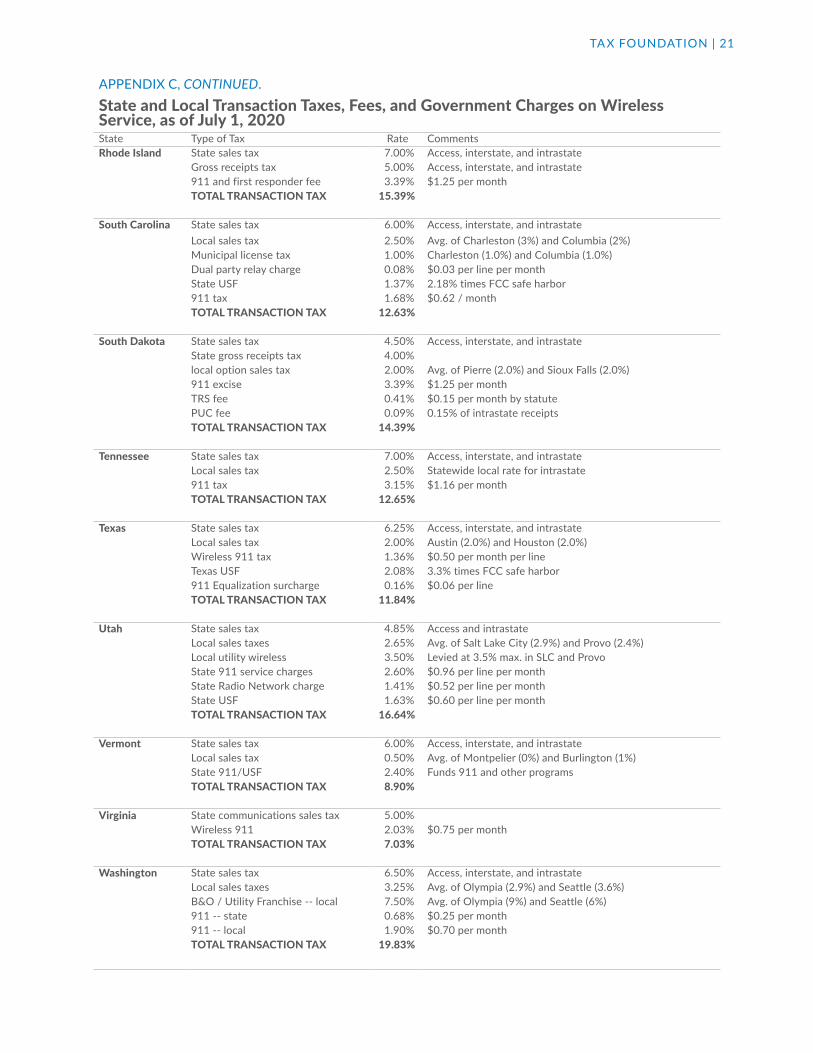
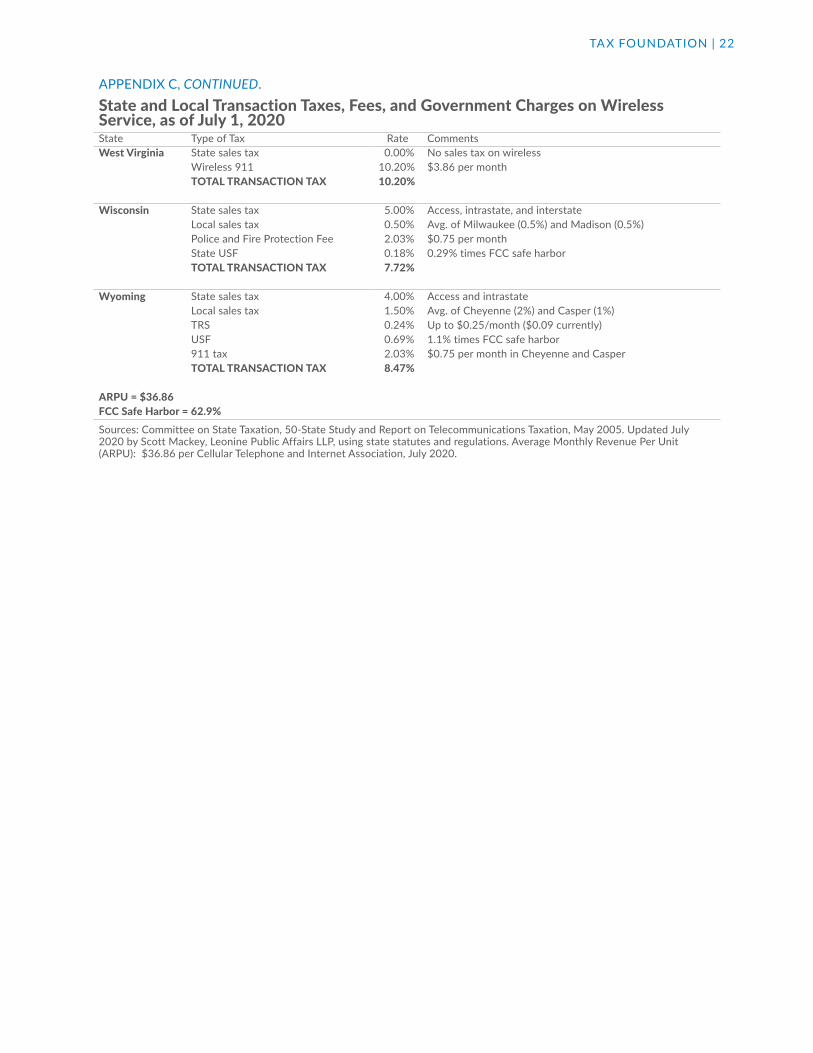
Appendix C provides a detailed breakdown of the specific taxes, fees, and government surcharges imposed in each state, including the respective rates of each. To facilitate interstate comparisons, local rates imposed in the most populated city and the capital city in each state are averaged into a single rate. In the case of taxes and fees that are imposed on a flat per-line basis—for example, $1.00 per month per line—the tax is converted from a flat amount to a percentage by dividing the flat amount by the industry average revenue per line of $36.86 per month. For a detailed description of the methodology in this report, please see Appendix A.
Trends in Wireless Taxes and Fees
911 Fees
Most states impose 911 fees to fund capital expenses associated with the 911 system, and in some states these fees fund operations as well. Wireless 911 fees vary greatly by state, from a low of zero in Missouri5 to a high of $5.00 per line per month in the City of Chicago.
In 2020, Arkansas doubled the state 911 fee from $.65 per line per month to $1.30 per line per month. Oregon increased the 911 fee from $0.75 per line per month to $1.00 per line per month. Maine reduced the 911 fee from $0.45 per line per month to $0.35 per line per month.
Unfortunately, according to the Federal Communications Commission (FCC), some states and localities routinely divert 911 fees for other purposes.6 For example, the City of Chicago used the authority granted by the legislature to increase its monthly 911 fee from $3.90 per line to $5.00 per line, effective January 1, 2018. Media reports suggested that the 911 fee increase was intended to cover a shortfall in city pension obligations.7 The FCC report identified other states that routinely divert 911 fees paid by wireless consumers to other purposes: Nevada, New Jersey, New York, Rhode Island, and West Virginia.
State Universal Service Funds
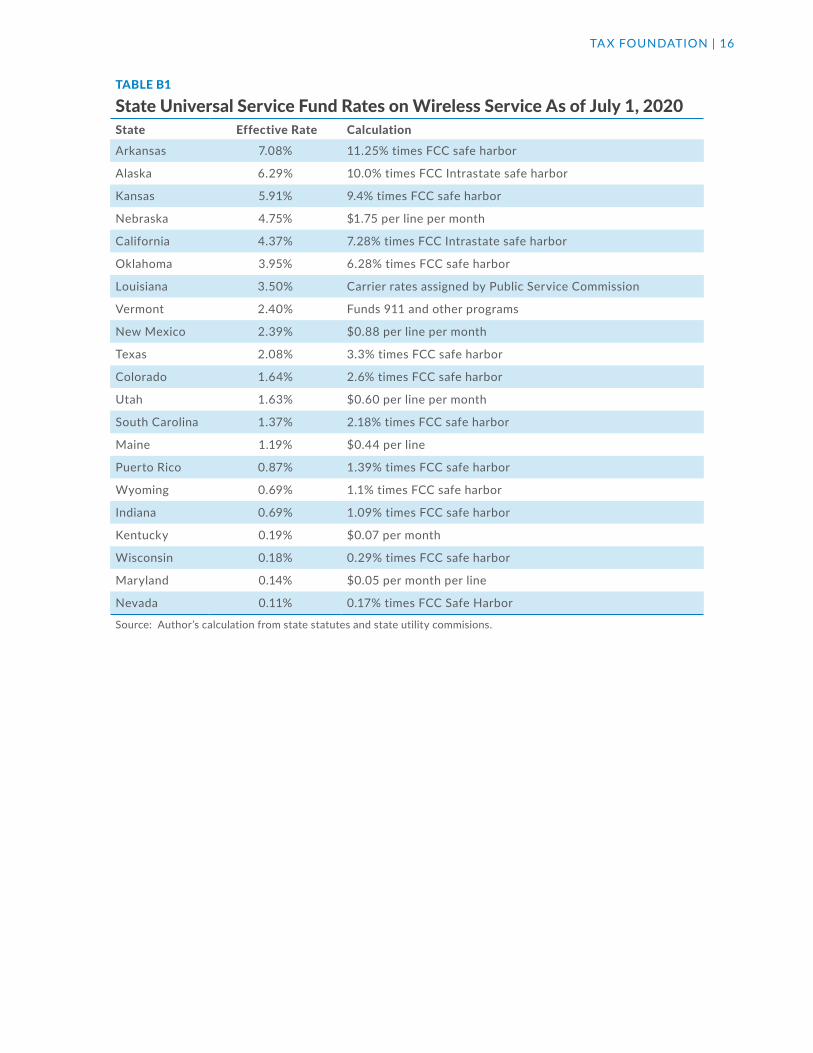
Some states have their own universal service funds (USF) that provide subsidies for many of the same purposes as the FUSF. State USF surcharges are imposed on intrastate revenues, while the FUSF is imposed on interstate revenues. In states like Arkansas, Alaska, Kansas, Nebraska, and California, high state USF surcharge rates add significantly to the overall burden on wireless consumers. For example, the USF rate in Arkansas is 11.25 percent of all intrastate charges. Table B1 in Appendix B lists the rates in the 20 states that impose a state USF charge.
In 2020, state USF rates were increased in Arkansas, Kansas, Michigan, and South Carolina and were reduced in Nevada, New Mexico, and Wyoming.
5 Missouri enacted HB1456 in 2018 that authorizes certain cities and counties to impose wireless 911 fees on or after January 1, 2019 if approved by voters. As of this writing, no local jurisdictions had imposed a wireless 911 fee.
6 Federal Communications Commission, “Eleventh Annual Report to Congress on State Collection and Distribution of 911 Fees and Enhanced 911 Fees and Charges for the Period January 1, 2018 to December 31, 2018,” Dec. 19, 2019, https://www.fcc.gov/files/11thannual911feereport2019pdf.
7 Bill Ruthhart and Hal Dardick, “Emanuel’s Latest Possible Tax Hike: 911 Phone Fees,” Chicago Tribune, June 1, 2017, http://www.chicagotribune.com/news/local/politics/ct-rahm-emanuel-phone-fee-increase-met-0602-20170601-story.html.
TAX FOUNDATION | 9
State-Level Wireless Taxes
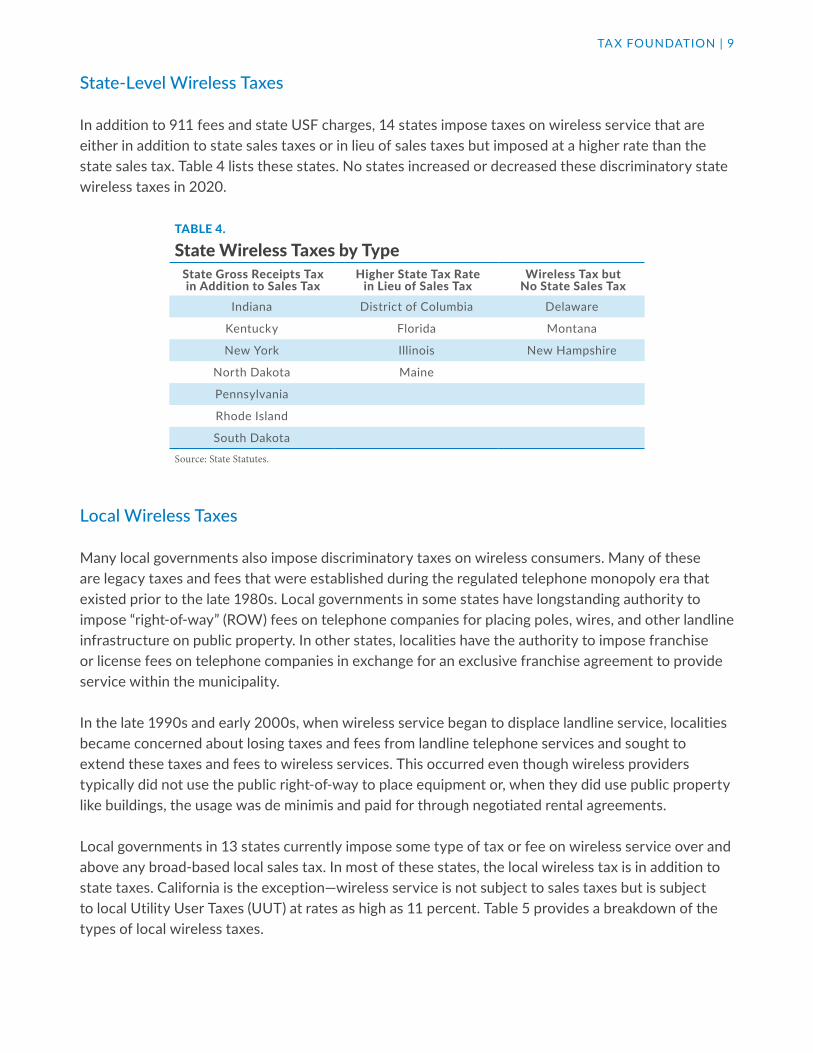
In addition to 911 fees and state USF charges, 14 states impose taxes on wireless service that are either in addition to state sales taxes or in lieu of sales taxes but imposed at a higher rate than the state sales tax. Table 4 lists these states. No states increased or decreased these discriminatory state wireless taxes in 2020.
TABLE 4.
State Wireless Taxes by TypeState Gross Receipts Taxin Addition to Sales Tax
Higher State Tax Ratein Lieu of Sales Tax
Wireless Tax butNo State Sales Tax
Indiana District of Columbia Delaware
Kentucky Florida Montana
New York Illinois New Hampshire
North Dakota Maine
Pennsylvania
Rhode Island
South Dakota
Source: State Statutes.
Local Wireless Taxes
Many local governments also impose discriminatory taxes on wireless consumers. Many of these are legacy taxes and fees that were established during the regulated telephone monopoly era that existed prior to the late 1980s. Local governments in some states have longstanding authority to impose “right-of-way” (ROW) fees on telephone companies for placing poles, wires, and other landline infrastructure on public property. In other states, localities have the authority to impose franchise or license fees on telephone companies in exchange for an exclusive franchise agreement to provide service within the municipality.
In the late 1990s and early 2000s, when wireless service began to displace landline service, localities became concerned about losing taxes and fees from landline telephone services and sought to extend these taxes and fees to wireless services. This occurred even though wireless providers typically did not use the public right-of-way to place equipment or, when they did use public property like buildings, the usage was de minimis and paid for through negotiated rental agreements.
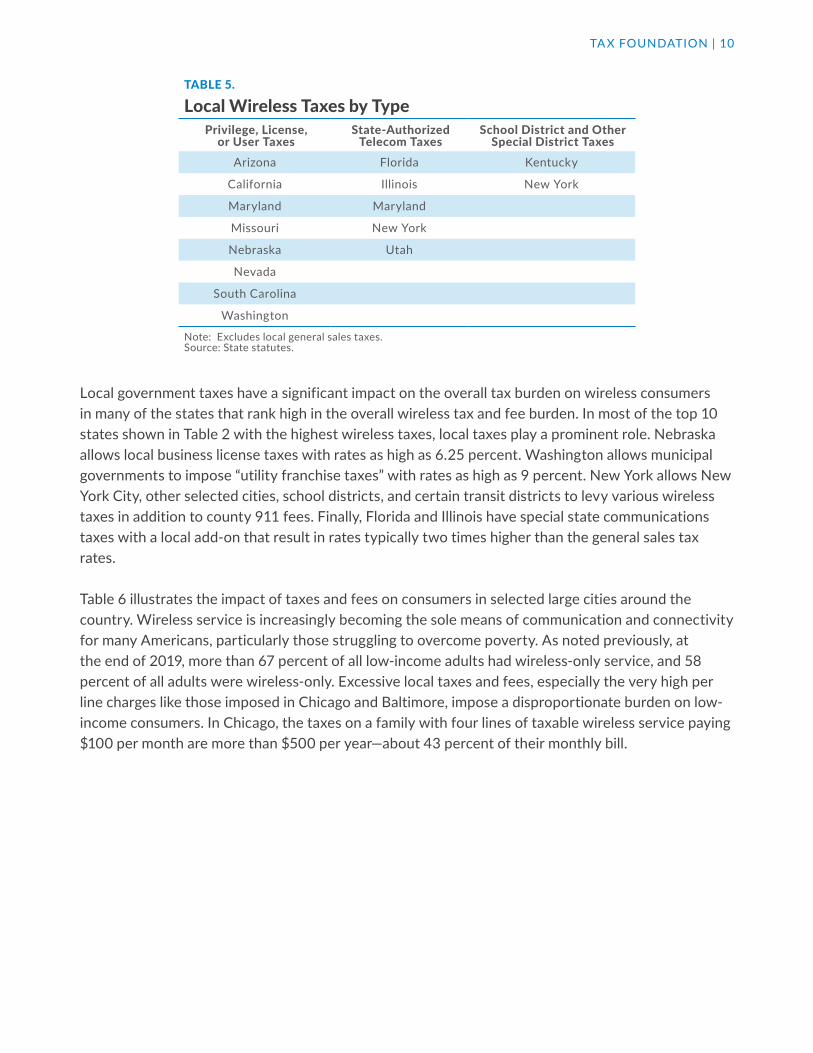
Local governments in 13 states currently impose some type of tax or fee on wireless service over and above any broad-based local sales tax. In most of these states, the local wireless tax is in addition to state taxes. California is the exception—wireless service is not subject to sales taxes but is subject to local Utility User Taxes (UUT) at rates as high as 11 percent. Table 5 provides a breakdown of the types of local wireless taxes.
TAX FOUNDATION | 10
TABLE 5.
Local Wireless Taxes by TypePrivilege, License,
or User TaxesState-Authorized
Telecom TaxesSchool District and Other
Special District TaxesArizona Florida Kentucky
California Illinois New York
Maryland Maryland
Missouri New York
Nebraska Utah
Nevada
South Carolina
Washington
Note: Excludes local general sales taxes.Source: State statutes.
Local government taxes have a significant impact on the overall tax burden on wireless consumers in many of the states that rank high in the overall wireless tax and fee burden. In most of the top 10 states shown in Table 2 with the highest wireless taxes, local taxes play a prominent role. Nebraska allows local business license taxes with rates as high as 6.25 percent. Washington allows municipal governments to impose “utility franchise taxes” with rates as high as 9 percent. New York allows New York City, other selected cities, school districts, and certain transit districts to levy various wireless taxes in addition to county 911 fees. Finally, Florida and Illinois have special state communications taxes with a local add-on that result in rates typically two times higher than the general sales tax rates.
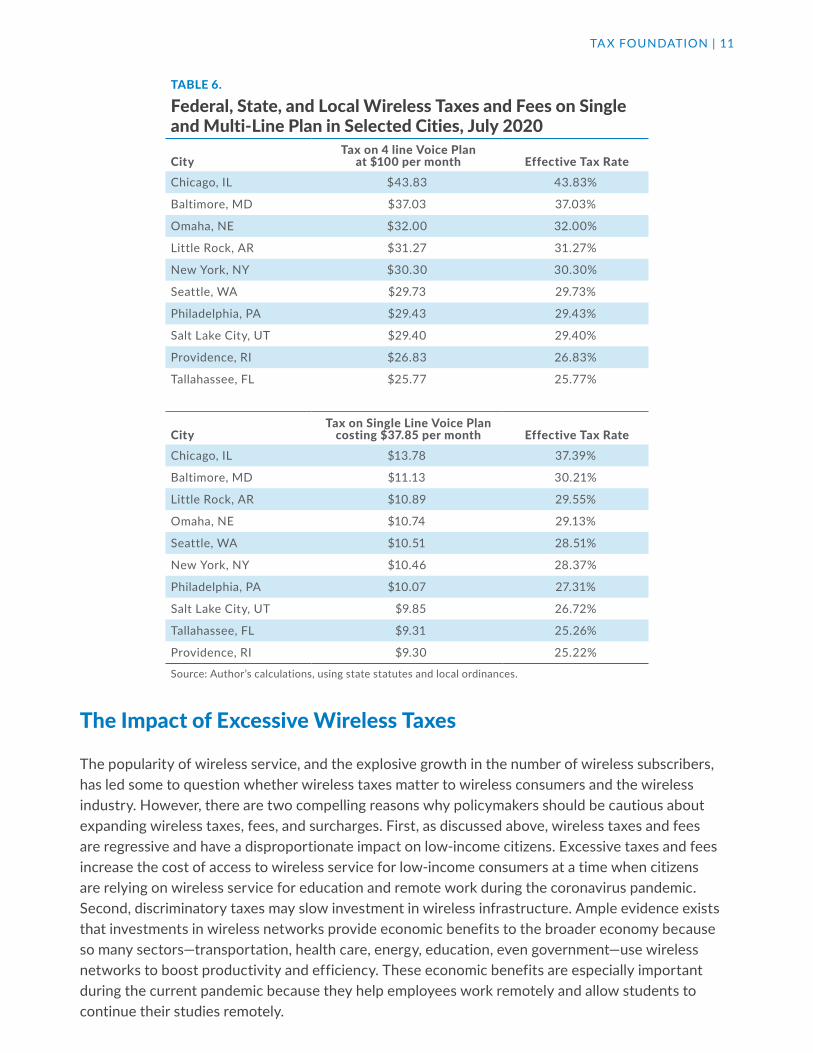
Table 6 illustrates the impact of taxes and fees on consumers in selected large cities around the country. Wireless service is increasingly becoming the sole means of communication and connectivity for many Americans, particularly those struggling to overcome poverty. As noted previously, at the end of 2019, more than 67 percent of all low-income adults had wireless-only service, and 58 percent of all adults were wireless-only. Excessive local taxes and fees, especially the very high per line charges like those imposed in Chicago and Baltimore, impose a disproportionate burden on low-income consumers. In Chicago, the taxes on a family with four lines of taxable wireless service paying $100 per month are more than $500 per year—about 43 percent of their monthly bill.
TAX FOUNDATION | 11
TABLE 6.
Federal, State, and Local Wireless Taxes and Fees on Single and Multi-Line Plan in Selected Cities, July 2020
CityTax on 4 line Voice Plan
at $100 per month Effective Tax RateChicago, IL $43.83 43.83%
Baltimore, MD $37.03 37.03%
Omaha, NE $32.00 32.00%
Little Rock, AR $31.27 31.27%
New York, NY $30.30 30.30%
Seattle, WA $29.73 29.73%
Philadelphia, PA $29.43 29.43%
Salt Lake City, UT $29.40 29.40%
Providence, RI $26.83 26.83%
Tallahassee, FL $25.77 25.77%
CityTax on Single Line Voice Plan
costing $37.85 per month Effective Tax RateChicago, IL $13.78 37.39%
Baltimore, MD $11.13 30.21%
Little Rock, AR $10.89 29.55%
Omaha, NE $10.74 29.13%
Seattle, WA $10.51 28.51%
New York, NY $10.46 28.37%
Philadelphia, PA $10.07 27.31%
Salt Lake City, UT $9.85 26.72%
Tallahassee, FL $9.31 25.26%
Providence, RI $9.30 25.22%
Source: Author’s calculations, using state statutes and local ordinances.
The Impact of Excessive Wireless Taxes
The popularity of wireless service, and the explosive growth in the number of wireless subscribers, has led some to question whether wireless taxes matter to wireless consumers and the wireless industry. However, there are two compelling reasons why policymakers should be cautious about expanding wireless taxes, fees, and surcharges. First, as discussed above, wireless taxes and fees are regressive and have a disproportionate impact on low-income citizens. Excessive taxes and fees increase the cost of access to wireless service for low-income consumers at a time when citizens are relying on wireless service for education and remote work during the coronavirus pandemic. Second, discriminatory taxes may slow investment in wireless infrastructure. Ample evidence exists that investments in wireless networks provide economic benefits to the broader economy because so many sectors—transportation, health care, energy, education, even government—use wireless networks to boost productivity and efficiency. These economic benefits are especially important during the current pandemic because they help employees work remotely and allow students to continue their studies remotely.
TAX FOUNDATION | 12
Network investment is important not only to consumers and businesses that use these networks but also to the entire American economy. A report by the International Chamber of Commerce (ICC) in Paris surveyed the evidence not only from the United States and Europe but from the developing world as well.8 Economists that have examined the link between investments in communications and information technology infrastructure and economic growth have consistently found a strong link. Simply put, wireless infrastructure investment enables an entire entrepreneurial culture to focus on creating applications and devices to make businesses more productive and to improve the lives of consumers. These tools in turn make businesses more productive and profitable so that they can create new jobs that generate economic activity and tax revenues for governments.
While most infrastructure investments create these types of multiplier effects, the multiplier effects for telecommunications infrastructure are higher than other industries because communications and information technology are so deeply embedded in business processes. These infrastructure investments also benefit the government and nonprofit sectors in ways that do not necessarily show up directly in economic statistics, but nonetheless make these sectors more efficient and enable them to lower the cost of providing government services.
As noted in the ICC report, “Remedying the discriminatory tax treatment of telecom goods and services may reduce tax receipts in the short-term, but the longer-term increase in the use of advanced capability devices, service demand, and network deployment resulting from these tax reductions is likely to counteract this loss of revenue over time.”9 Policymakers need to weigh the trade-offs between the short-term revenue benefits of excessive wireless taxes versus the long-term economic impact on the state from reduced infrastructure investment.
Conclusion
Wireless consumers continue to be burdened with high taxes, fees, and surcharges in many states and localities across the United States. While state and local government taxes and fees were relatively stable between 2019 and 2020, significant increases in the FUSF over the last two years have pushed taxes on wireless service to record-high levels. Excessive taxes on wireless consumers disproportionately impact low-income families and may have ramifications for long-term state economic development and growth. Higher taxes on wireless service, coupled with increased taxes on wireless investments, may lead to slower deployment of wireless network infrastructure, including fifth generation (5G) wireless broadband technologies.
States should study their existing communications tax structure and consider policies that transition their tax systems away from narrowly-based wireless taxes and toward broad-based tax sources that do not distort consumer purchasing decisions and do not slow investment in critical infrastructure like wireless broadband.
8 International Chamber of Commerce, “ICC Discussion Paper on the Adverse Effects of Discriminatory Taxes on Telecommunications Service,” Oct. 26, 2010. https://cdn.iccwbo.org/content/uploads/sites/3/2010/10/ICC-discussion-paper-on-the-adverse-effects-of-discriminatory-taxes-on-telecommunications-services.pdf.
9 “International Chamber of Commerce, “ICC Discussion Paper on the Adverse Effects of Discriminatory Taxes on Telecommunications Service,” 2.
TAX FOUNDATION | 13
Appendix A Methodology
The methodology used in this report to calculate wireless taxes compares the applicable federal, state, and local rates on wireless voice service in the capital city and the most populated city in each state. This methodology was developed by the Committee on State Taxation (COST) in its landmark “50-State Study and Report on Telecommunications Taxation,” first published in 2000.
The use of a consistent methodology allows for accurate time-series comparisons across states and over time. However, changes in consumer demand for wireless services pose challenges when measuring the impact of wireless taxes on consumer bills. Two trends in the industry are significantly impacting the amount of taxes that wireless consumers pay on their monthly bills.
First, a growing share of wireless consumer purchases is for internet access. U.S. Census Bureau data from 2018 suggests that about 49.7 percent of total wireless service revenues (which excludes sales and rental of equipment and other non-service operating revenue) for the industry as a whole are from the sale of internet access.10 This percentage continues to grow as wireless consumers utilize more internet access and less voice telephone service each year.
Under federal law, as of July 1, 2020, all states are precluded from imposing taxes on internet access. This suggests that of the “typical” consumer’s monthly expenditure of $36.86 per month, approximately $18.32 is for non-taxable internet access and $18.54 is for taxable wireless service. A consumer applying the tax rates in this report to their total bill will find that the effective tax rate overstates their actual tax paid if their calling plan includes both taxable voice service and exempt internet access.
Second, the report’s methodology understates the tax rate impact of flat rate taxes and fees—those that are imposed as a set dollar amount per line. Under the report’s methodology, a $1.00 per month per line tax is converted to a percentage amount by dividing $1.00 by the $36.86 average monthly bill, resulting in a tax rate of 2.7 percent in this example. However, these flat rate taxes and fees are only permitted to be imposed on the portion of the wireless bill that is not internet access. In this same example, if the $1.00 per month were divided by the taxable portion of the bill ($18.54), the tax rate would be 5.4 percent.
Notwithstanding these methodological challenges, the authors have determined that the benefits of retaining the current methodology—consistent measurement of trends in tax rates over time—outweigh the benefits of changing the methodology to adjust to recent trends. This is particularly true since the Census Bureau has only been tracking the percentage of wireless expenditures on internet access since 2012, so it would not be possible to go back and retroactively adjust data prior to 2012.
10 U.S. Census Bureau, “Service Annual Survey Latest Data (NAICS-basis),” Nov. 26, 2019, https://www.census.gov/data/tables/2018/econ/services/sas-naics.html.
TAX FOUNDATION | 14
Appendix B: What Are Universal Service Funds?
The Federal Universal Service Fund
The Federal Universal Service Fund (FUSF) is administered by the FCC under open-ended authority from Congress. The program subsidizes telecommunications services for schools, libraries, hospitals, low-income people, and rural telephone companies operating in high-cost areas. The FCC has also recently decided to use funds to subsidize broadband deployment.
The FCC has authority to set spending for these programs outside of the normal congressional appropriations process. After deciding what to spend on the various programs, the FCC sets the quarterly “contribution factor” or surcharge rate that telecommunications providers must remit to the FUSF to generate sufficient revenues to fund the expenditure commitments. Providers may elect to surcharge these “contributions” on their customer bills.
FUSF surcharges apply only to revenues from interstate telecommunications services. They currently do not apply to internet access service, information services, and intrastate telecommunications services.
Wireless carriers generally sell plans that include either unlimited voice minutes or a fixed number of voice minutes for a set amount. Since these plans include both interstate calls (subject to the FUSF) and intrastate calls (not subject to FUSF), the FCC allows providers to allocate the fixed monthly plans to interstate and intrastate calls by one of two methods. Carriers may use “traffic studies” to show the actual split between interstate and interstate calls for all subscribers and apply the FUSF to the aggregated interstate portion of subscriber calls.
Alternatively, carriers may use a single uniform national “safe harbor” percentage to its fixed monthly plans. The FCC currently sets this safe harbor at 37.1 percent of the fixed monthly charge. For example, when determining the FUSF, a $50 monthly wireless voice calling plan is deemed to include $18.55 in interstate calls and $31.45 in intrastate calls. If a carrier elects to use the safe harbor, the FUSF rate would be applied to $18.55 of the bill each month.
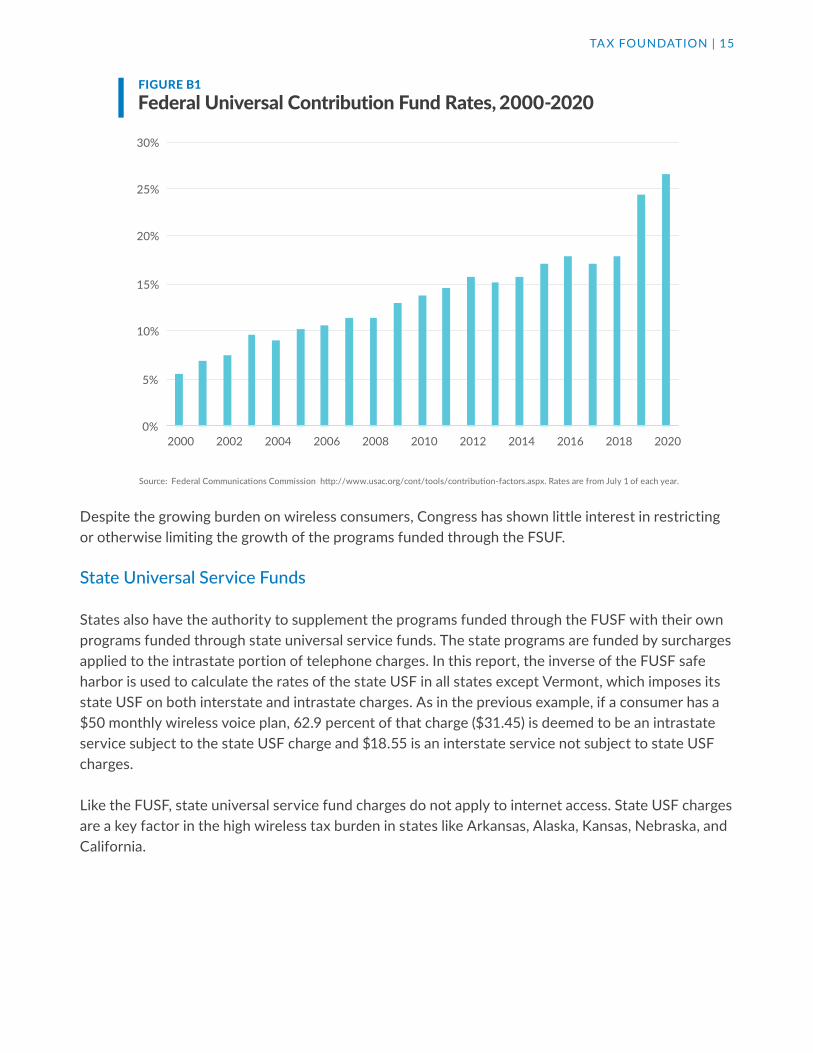
The FUSF rate is set by the FCC each quarter. For the period beginning July 1, 2020, the rate is 26.5 percent. Thus, the FUSF rate applied on assessable wireless revenues using the FCC safe harbor amount is 9.83 percent (26.5 percent times 37.1 percent).11 Figure B1 highlights the significant growth in the FCC contribution rate since 2003.
11 For the purposes of this report, the FCC safe harbor percentage is used. This allows for consistent multiyear comparisons of taxes, fees, and surcharges.
TAX FOUNDATION | 15
FIGURE B1
Despite the growing burden on wireless consumers, Congress has shown little interest in restricting or otherwise limiting the growth of the programs funded through the FSUF.
State Universal Service Funds
States also have the authority to supplement the programs funded through the FUSF with their own programs funded through state universal service funds. The state programs are funded by surcharges applied to the intrastate portion of telephone charges. In this report, the inverse of the FUSF safe harbor is used to calculate the rates of the state USF in all states except Vermont, which imposes its state USF on both interstate and intrastate charges. As in the previous example, if a consumer has a $50 monthly wireless voice plan, 62.9 percent of that charge ($31.45) is deemed to be an intrastate service subject to the state USF charge and $18.55 is an interstate service not subject to state USF charges.
Like the FUSF, state universal service fund charges do not apply to internet access. State USF charges are a key factor in the high wireless tax burden in states like Arkansas, Alaska, Kansas, Nebraska, and California.
TAX FOUNDATION
Federal Universal Contribution Fund Rates, 2000-2020
Source: Federal Communications Commission http://www.usac.org/cont/tools/contribution-factors.aspx. Rates are from July 1 of each year.
0%
5%
10%
15%
20%
25%
30%
2000 2002 2004 2006 2008 2010 2012 2014 2016 2018 2020
TAX FOUNDATION | 16
TABLE B1
State Universal Service Fund Rates on Wireless Service As of July 1, 2020State Effective Rate Calculation Arkansas 7.08% 11.25% times FCC safe harbor
Alaska 6.29% 10.0% times FCC Intrastate safe harbor
Kansas 5.91% 9.4% times FCC safe harbor
Nebraska 4.75% $1.75 per line per month
California 4.37% 7.28% times FCC Intrastate safe harbor
Oklahoma 3.95% 6.28% times FCC safe harbor
Louisiana 3.50% Carrier rates assigned by Public Service Commission
Vermont 2.40% Funds 911 and other programs
New Mexico 2.39% $0.88 per line per month
Texas 2.08% 3.3% times FCC safe harbor
Colorado 1.64% 2.6% times FCC safe harbor
Utah 1.63% $0.60 per line per month
South Carolina 1.37% 2.18% times FCC safe harbor
Maine 1.19% $0.44 per line
Puerto Rico 0.87% 1.39% times FCC safe harbor
Wyoming 0.69% 1.1% times FCC safe harbor
Indiana 0.69% 1.09% times FCC safe harbor
Kentucky 0.19% $0.07 per month
Wisconsin 0.18% 0.29% times FCC safe harbor
Maryland 0.14% $0.05 per month per line
Nevada 0.11% 0.17% times FCC Safe Harbor
Source: Author’s calculation from state statutes and state utility commisions.
TAX FOUNDATION | 17
APPENDIX CState and Local Transaction Taxes, Fees, and Government Charges on Wireless Service, as of July 1, 2020State Type of Tax Rate CommentsAlabama AL Cell Service Tax 6.00% Access, interstate, and intrastate
E911 5.05% $1.86 per monthTOTAL TRANSACTION TAX 11.05%
Alaska Local Sales Tax 2.50% Avg. of Juneau (5%) and Anchorage (0%)Local E911 5.29% Anchorage: $2.00 and Juneau: $1.90State USF 6.29% 10.0% times FCC safe harborTRS fee 0.24% $0.09 per lineTOTAL TRANSACTION TAX 14.32%
Arizona State sales (transaction priv.) 5.60% Intrastate telecommunications serviceCounty sales (transaction priv.) 0.60% Avg. of Phoenix (Maricopa) (0.7%) and Tucson (Pima) (0.5%)City telecommunications 5.90% Avg. Phoenix (4.7%) and Tucson (7.1%)911 0.54% $0.20 per monthTOTAL TRANSACTION TAX 12.64%
Arkansas State sales tax 6.50%Local sales taxes 3.00% Avg. Little Rock (2.5%) and Fayetteville (3.5%)State High Cost Fund 7.08% 11.25% times FCC safe harborWireless 911 3.53% $1.30 per month statewide. TRS service & TRS equipment 0.11% $0.04 per line per monthTOTAL TRANSACTION TAX 20.21%
California Local Utility User Tax 8.00% Avg. of LA (9%) and Sacramento (7%)State 911 0.81% $0.30 per line per monthPUC fee 0.21% 0.34% times FCC safe harborULTS (lifeline) 2.99% 4.75% times FCC safe harborDeaf/CRS 0.31% 0.5% times FCC safe harborHigh Cost Funds A & B 0.22% 0.35% times FCC safe harborTeleconnect Fund 0.49% 0.78% times FCC safe harborCASF - advanced services fund 0.35% 0.56% times FCC safe harborTOTAL TRANSACTION TAX 13.39%
Colorado State Sales Tax 2.90% Access and intrastateLocal Sales Tax -- City/County 3.82% Avg. of Denver (5.41%) and Colorado Springs (2.23%)911 3.46% Denver: $1.20 and Colorado Springs: $1.35USF 1.64% 2.6% times FCC safe harborTDD Tax 0.16% $0.06 per monthTOTAL TRANSACTION TAX 11.98%
Connecticut State sales tax 6.35% Access, interstate, and intrastate911 1.57% $0.58 per lineTOTAL TRANSACTION TAX 7.92%
Delaware Public Utility Gross Receipts Tax 5.00% Access and intrastateLocal 911 tax 1.63% $0.60 per monthTRS fee 0.05% $0.02 per line per monthTOTAL TRANSACTION TAX 6.68%
District of Columbia
Telecommunication Privilege Tax 10.00% Monthly gross charge; 911 2.06% $0.76 per monthTOTAL TRANSACTION TAX 12.06%
Florida State Communications services 7.44% Access, interstate, and intrastateLocal Communications services 6.36% Jacksonville (5.82%) and Tallahassee (6.9%)911 1.09% $0.40 per month statewideTOTAL TRANSACTION TAX 14.89%
Appendix C.
TAX FOUNDATION | 18
State Type of Tax Rate CommentsGeorgia State sales tax 3.80% 4% of "access charge" -- assume $35
Local sales tax 4.23% Avg. rate Atlanta (4.9%) and Augusta (4%)Local 911 4.07% $1.50 per line statewideTOTAL TRANSACTION TAX 12.09%
Hawaii Public service company tax 4.00%Additional county tax 1.89%PUC Fee 0.16% 0.25% of intrastate chargesWireless 911 fee 1.79% $0.66 per monthTOTAL TRANSACTION TAX 7.83%
Idaho Telephone service assistance program 0.00% Set annually by PUC (currently zero)Statewide wireless 911 2.71% Boise: $1.00 per month TOTAL TRANSACTION TAX 2.71%
Illinois State telecom excise tax 7.00% Access, interstate, and intrastateSimplified municipal tax 6.50% Avg. of Chicago (7%) and Springfield (6%)Wireless 911 8.82% Chicago: $5 per month and others: $1.50 per month TRS fee 0.05% $0.02 per line per monthTOTAL TRANSACTION TAX 22.37%
Indiana State sales tax 7.00% Access and intrastateUtility receipts tax 1.40% Same base as sales taxWireless 911 2.71% $1.00 per monthState USF 0.69% 1.09% times FCC safe harborPUC fee 0.08% 0.13% times FCC safe harborTRS fee 0.08% $0.03 per line per monthTOTAL TRANSACTION TAX 11.96%
Iowa State sales tax 6.00%Local option sales taxes 1.00% Avg. of Cedar Rapids (1%) and Des Moines (1%)Wireless 911 2.71% $1.00 per monthDual Party Relay Service fee 0.08% $0.03 per monthTOTAL TRANSACTION TAX 9.79%
Kansas State sales tax 6.50% Intrastate and interstateLocal option sales taxes 1.83% Avg. of Wichita (1.0%) and Topeka (2.65%)USF 5.91% 9.4% times FCC safe harborWireless 911 2.44% $0.90 per month per lineTOTAL TRANSACTION TAX 16.68%
Kentucky State sales tax 6.00% Access, interstate, and intrastateSchool utility gross receipts 1.50% Avg. of Frankfort (3%) and Lousiville (0%)Kentucky USF 0.19% $0.07 per monthKentucky TAP & TRS 0.08% TAP: $0.02 and TRS: $0.01Wireless 911 1.90% $0.70 per monthCommunications gross receipts tax 1.30% Access, interstate, and intrastateTOTAL TRANSACTION TAX 10.97%
Louisiana State sales tax 3.45% Intrastate rateWireless 911 2.85% New Orleans: $1.25 per month
Baton Rouge: $0.85 per monthState USF 3.50% May vary by carrier TRS fee 0.14% $0.05 per line per monthTOTAL TRANSACTION TAX 9.80%
Maine State service provider tax 6.00%911 fee 0.95% $0.35 per monthMaine USF 1.19% $0.44 per lineMTEAF 0.57% $0.21 per line per monthTOTAL TRANSACTION TAX 8.71%
APPENDIX C, CONTINUED.State and Local Transaction Taxes, Fees, and Government Charges on Wireless Service, as of July 1, 2020
TAX FOUNDATION | 19
State Type of Tax Rate CommentsMaryland State sales tax 6.00%
Local telecom excise 5.43% Baltimore: $4.00 per month and Annapolis: $0.00State 911 1.36% $0.50 per month per lineCounty 911 2.03% Currently $0.75 per month in all countiesState USF 0.14% $0.05 per accountTOTAL TRANSACTION TAX 14.95%
Massachusetts State sales tax 6.25% Interstate and intrastateWireless 911 4.07% $1.50 per monthTOTAL TRANSACTION TAX 10.32%
Michigan State sales tax 6.00% Interstate and intrastateState wireless 911 0.68% $0.25 per month County wireless 911 3.01% Detroit: $0.42 and Lansing: $1.80Intrastate toll assessment 0.49% 0.78% of intrastate chargesTOTAL TRANSACTION TAX 10.18%
Minnesota State sales tax 6.88% Interstate and intrastateLocal sales tax 1.08% Avg. of Minneapolis (1.15%) and St. Paul (1.0%)911 2.58% $0.95 per monthTelecom access MN fund 0.19% $0.07 per line per monthTOTAL TRANSACTION TAX 10.72%
Mississippi State sales tax 7.00% Access, interstate, and intrastateWireless 911 & 911 training fee 2.85% $1.05 per month per lineTOTAL TRANSACTION TAX 9.85%
Missouri State sales tax 4.23% Access and intrastateLocal sales taxes 4.19% Avg. Jefferson City (3.5%) and Kansas City (4.875%)Local business license tax 6.50% Avg. of Jefferson City (7%) and Kansas City (6% residential) TOTAL TRANSACTION TAX 14.91%
Montana Telecom excise tax 3.75% Access, interstate, and intrastate911 & E911 tax 2.71% $1.00 per number per monthTDD tax 0.27% $0.10 per number per monthTOTAL TRANSACTION TAX 6.73%
Nebraska State sales tax 5.50% Access and intrastateLocal sales tax 1.63% Avg. of Lincoln (1.75%) and Omaha (1.5%)City business and occupation tax 6.13% Avg. of Omaha (6.25%) and Lincoln (6.0%)State USF 4.75% $1.75 per line per monthWireless 911 1.22% $0.45 per monthTRS 0.08% $0.03 per monthTOTAL TRANSACTION TAX 19.30%
Nevada Local franchise / gross receipts 2.03% 5% of first $15 intrastate revenuesLocal 911 tax 1.15% Washoe County: $0.85 per month and Clark County: $0.00State deaf relay charge 0.16% $0.06 per access lineNevada USF 0.11% 0.17% times FCC Safe HarborTOTAL TRANSACTION TAX 3.46%
New Hampshire Communication services tax 7.00% Access, interstate, and intrastate911 tax 2.03% $0.75 per monthTOTAL TRANSACTION TAX 9.03%
New Jersey State sales tax 6.63%Wireless 911 2.44% $0.90 per month TOTAL TRANSACTION TAX 9.07%
APPENDIX C, CONTINUED.State and Local Transaction Taxes, Fees, and Government Charges on Wireless Service, as of July 1, 2020
TAX FOUNDATION | 20
State Type of Tax Rate CommentsNew Mexico State gross receipts (sales) tax 5.13% Intrastate: 5.125% and interstate: 4.25%
City and county gross receipts tax 3.03% Avg. Santa Fe (3.3125%) and Albuquerque (2.75%)Wireless 911 1.38% $0.51 per monthTRS surcharge 0.21% 0.33% times FCC safe harborState USF 2.39% $0.88 per line per monthTOTAL TRANSACTION TAX 12.13%
New York State sales tax 4.00% Intrastate and monthly accessLocal sales taxes 4.25% Avg. of NYC (4.5%) and Albany (4%)MCTD sales tax 0.19% Avg. of NYC (0.375%); and Albany (0%)State excise tax (186e) 2.90% Mobile telecom service -- includes interstateMCTD excise/surcharge (186c) 0.36% NYC & surrounding counties: Avg. of 0.72% and Albany 0%Local utility gross receipts tax 1.49% Avg of. NYC (84% of 2.35%) and Albany (1%)State wireless 911 3.26% $1.20 per month Local wireless 911 0.81% $0.30 per month -- NYC & most countiesSchool district utility sales tax 1.50% Albany: 3% and NYC: 0%TOTAL TRANSACTION TAX 18.75%
North Carolina State and loccal sales tax 7.00% Statewide combined rate includes local ratesWireless 911 1.76% $0.65 per monthTRS Charge 0.22% $0.08 per monthTOTAL TRANSACTION TAX 8.98%
North Dakota State sales tax 5.00% Access and intrastateLocal sales taxes 2.25% Avg Fargo (2.5%) and Bismarck (2.0%)State gross receipts tax 2.50% Interstate and intrastateStatewide Interoperable Radio Network Tax
1.36% $0.50 per line per month
Local 911 tax 4.07% Bismarck: $1.50 and Fargo: $1.50 TRS 0.08% Up to $0.11 per month (currently $0.03)TOTAL TRANSACTION TAX 15.26%
Ohio State sales tax 5.75% Access, interstate, and intrastateLocal sales taxes 2.00% Avg. of Columbus (1.75%) and Cleveland (2.25%)Regulatory fee 0.09% 0.139% of intrastate revenuesState/local wireless 911 0.68% $0.25 per month per phone numberTOTAL TRANSACTION TAX 8.52%
Oklahoma State sales tax 4.50% Access, interstate, and intrastateLocal sales taxes 4.07% Avg. of OK City (4.125%) and Tulsa (4.017%)Local 911 2.03% $0.75 per month in OK City and TulsaUSF 3.95% 6.28% times FCC safe harborTOTAL TRANSACTION TAX 14.56%
Oregon Local utililty tax 0.00% No tax on wireless in Portland or Salem911 tax 2.71% $1.00 per monthRSPF Surcharge 0.27% $0.10 per monthTOTAL TRANSACTION TAX 2.98%
Pennsylvania State sales tax 6.00% Access, interstate, and intrastateState gross receipts tax 5.00% Access, interstate, and intrastateLocal sales tax 1.00% Avg. of Philadephia (2%) and Harrisburg (0%)Statewide wireless 911 4.48% $1.65 per monthTOTAL TRANSACTION TAX 16.48%
Puerto Rico IVU (Sales Tax) 11.50%911 fee 1.36% $0.50 per lineUSF 0.87% 1.39% times FCC safe harborTOTAL TRANSACTION TAX 13.73%
APPENDIX C, CONTINUED.State and Local Transaction Taxes, Fees, and Government Charges on Wireless Service, as of July 1, 2020
TAX FOUNDATION | 21
State Type of Tax Rate CommentsRhode Island State sales tax 7.00% Access, interstate, and intrastate
Gross receipts tax 5.00% Access, interstate, and intrastate911 and first responder fee 3.39% $1.25 per monthTOTAL TRANSACTION TAX 15.39%
South Carolina State sales tax 6.00% Access, interstate, and intrastateLocal sales tax 2.50% Avg. of Charleston (3%) and Columbia (2%)Municipal license tax 1.00% Charleston (1.0%) and Columbia (1.0%) Dual party relay charge 0.08% $0.03 per line per monthState USF 1.37% 2.18% times FCC safe harbor911 tax 1.68% $0.62 / monthTOTAL TRANSACTION TAX 12.63%
South Dakota State sales tax 4.50% Access, interstate, and intrastateState gross receipts tax 4.00%local option sales tax 2.00% Avg. of Pierre (2.0%) and Sioux Falls (2.0%)911 excise 3.39% $1.25 per monthTRS fee 0.41% $0.15 per month by statutePUC fee 0.09% 0.15% of intrastate receiptsTOTAL TRANSACTION TAX 14.39%
Tennessee State sales tax 7.00% Access, interstate, and intrastateLocal sales tax 2.50% Statewide local rate for intrastate 911 tax 3.15% $1.16 per month TOTAL TRANSACTION TAX 12.65%
Texas State sales tax 6.25% Access, interstate, and intrastateLocal sales tax 2.00% Austin (2.0%) and Houston (2.0%)Wireless 911 tax 1.36% $0.50 per month per lineTexas USF 2.08% 3.3% times FCC safe harbor911 Equalization surcharge 0.16% $0.06 per lineTOTAL TRANSACTION TAX 11.84%
Utah State sales tax 4.85% Access and intrastateLocal sales taxes 2.65% Avg. of Salt Lake City (2.9%) and Provo (2.4%)Local utility wireless 3.50% Levied at 3.5% max. in SLC and ProvoState 911 service charges 2.60% $0.96 per line per monthState Radio Network charge 1.41% $0.52 per line per monthState USF 1.63% $0.60 per line per monthTOTAL TRANSACTION TAX 16.64%
Vermont State sales tax 6.00% Access, interstate, and intrastateLocal sales tax 0.50% Avg. of Montpelier (0%) and Burlington (1%)State 911/USF 2.40% Funds 911 and other programsTOTAL TRANSACTION TAX 8.90%
Virginia State communications sales tax 5.00%Wireless 911 2.03% $0.75 per monthTOTAL TRANSACTION TAX 7.03%
Washington State sales tax 6.50% Access, interstate, and intrastateLocal sales taxes 3.25% Avg. of Olympia (2.9%) and Seattle (3.6%)B&O / Utility Franchise -- local 7.50% Avg. of Olympia (9%) and Seattle (6%)911 -- state 0.68% $0.25 per month 911 -- local 1.90% $0.70 per monthTOTAL TRANSACTION TAX 19.83%
APPENDIX C, CONTINUED.State and Local Transaction Taxes, Fees, and Government Charges on Wireless Service, as of July 1, 2020
TAX FOUNDATION | 22
State Type of Tax Rate CommentsWest Virginia State sales tax 0.00% No sales tax on wireless
Wireless 911 10.20% $3.86 per monthTOTAL TRANSACTION TAX 10.20%
Wisconsin State sales tax 5.00% Access, intrastate, and interstateLocal sales tax 0.50% Avg. of Milwaukee (0.5%) and Madison (0.5%)Police and Fire Protection Fee 2.03% $0.75 per month State USF 0.18% 0.29% times FCC safe harborTOTAL TRANSACTION TAX 7.72%
Wyoming State sales tax 4.00% Access and intrastateLocal sales tax 1.50% Avg. of Cheyenne (2%) and Casper (1%)TRS 0.24% Up to $0.25/month ($0.09 currently)USF 0.69% 1.1% times FCC safe harbor911 tax 2.03% $0.75 per month in Cheyenne and CasperTOTAL TRANSACTION TAX 8.47%
ARPU = $36.86 FCC Safe Harbor = 62.9%Sources: Committee on State Taxation, 50-State Study and Report on Telecommunications Taxation, May 2005. Updated July 2020 by Scott Mackey, Leonine Public Affairs LLP, using state statutes and regulations. Average Monthly Revenue Per Unit (ARPU): $36.86 per Cellular Telephone and Internet Association, July 2020.
APPENDIX C, CONTINUED.State and Local Transaction Taxes, Fees, and Government Charges on Wireless Service, as of July 1, 2020