Embed Size (px)
Citation preview

Impact of Projected Biofuel Production on Water Use and Water Quality
MAY WU, MI-AE HA, HUI XU Argonne National Laboratory
March 6-9, 2017 Analysis and Sustainability WBS:4.2.1.10 This presentation does not contain any proprietary, confidential, or otherwise restricted information
DOE BIOENERGY TECHNOLOGIES OFFICE (BETO) 2017 PROJECT PEER REVIEW

GOAL STATEMENT
The goal of this project is to establish quantitative metrics to identify and
select water-sustainable scenarios in the production of bio-energy and bio-
products by developing water consumption analysis and hydrologic models &
tools for evaluating water footprint, water quality, and water resource
availability at a regional scale in the United States.
2

3
Timeline Project start date: FY15 Project end date: FY17 Percent complete: 67%
Budget
Barriers St.-D. Implementing indicators and
methodology for evaluating and improving sustainability St.-E. Best practices and systems for
sustainable bioenergy production St.-B. Consistent and science-based
message on bioenergy sustainability Partners Collaborations/interactions: ─ ORNL (Y. Jager, M. Langholtz), PNNL (L.
Snowden-Swan, K. Albrecht, M. Wigmosta), NREL (R. Davis), ANL (C. Negri, J. Dunn)
─ U.S. Army Corp. Engineers ─ USDA NRCS (H. Lal), ARS (M. Tomer) ─ U.S. EPA (K. Flahive, J. Turgeon)
QUAD CHART OVERVIEW
FY 15 Costs
FY 16 Costs
Total Planned Funding
(FY 17-Project End Date)
DOE Funded ($K)
625 725 730

DEFINITIONS BMPs – Best management practices Blue water – Surface and ground water consumed in the production process Evapotranspiration (ET) – Loss of water from the land cover both by evaporation from the soil surface
and by transpiration from the leaves of the plants growing on it ETc – ET of a specific crop Effective Rain (ER) – The part of rain that remains in the root zone after deep percolation and run-off
and can be used by the plant Green water – Soil moisture from rainfall that is consumed by vegetation Grey water footprint – Volume of water required to dilute the chemicals in the wastewater to an
acceptable level of concentration for the water body (specific to the WF methodology) IRB – Iowa River Basin MRB – Mississippi River Basin Renewable Diesel Blend (RDB) – Fuel produced from biological sugar-to-hydrocarbon process SWAT – Soil Water Analysis Tool, a hydrologic watershed model Water footprint (WF) – Net water loss to evapotranspiration and evaporation; incorporation of water
into products or solids by a production process or activity Water withdrawal – Water uptake from surface or groundwater Water consumption or Water use – Water loss (accounted for in WF analysis)
4
PROJECT OVERVIEW
5
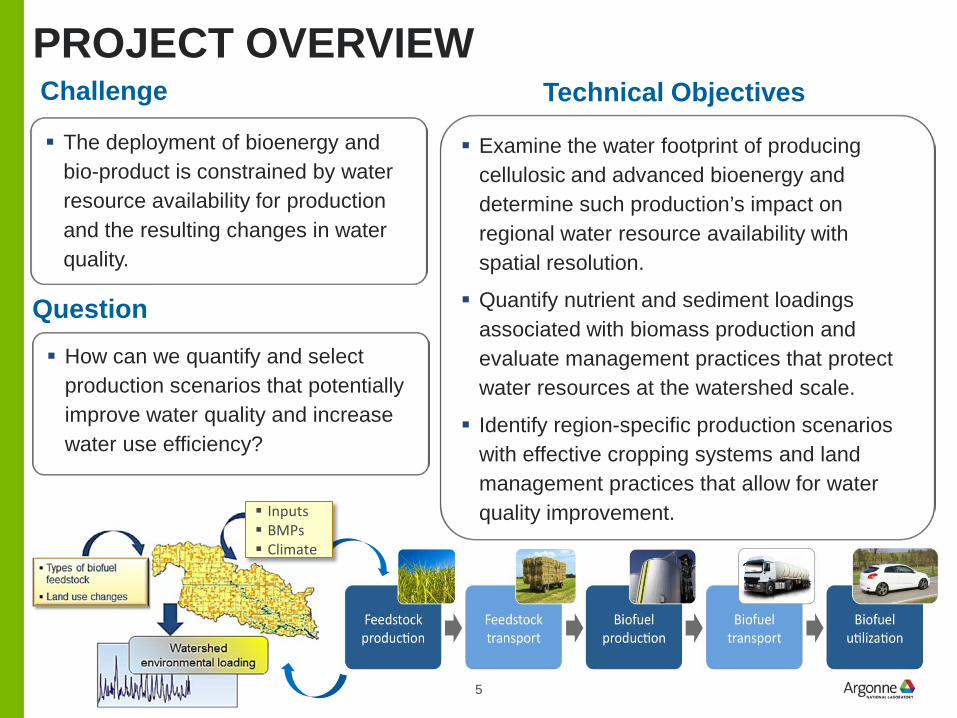
Examine the water footprint of producing cellulosic and advanced bioenergy and determine such production’s impact on regional water resource availability with spatial resolution.
Quantify nutrient and sediment loadings associated with biomass production and evaluate management practices that protect water resources at the watershed scale.
Identify region-specific production scenarios with effective cropping systems and land management practices that allow for water quality improvement. Inputs
BMPs Climate
Technical Objectives Challenge
Question How can we quantify and select
production scenarios that potentially improve water quality and increase water use efficiency?
The deployment of bioenergy and bio-product is constrained by water resource availability for production and the resulting changes in water quality.

PROJECT OVERVIEW (CONT.)
Comprehensive energy-water data inventory WATER - Spatial-explicit
water footprint analysis tool for bioenergy at county level A suite of SWAT models ‒ Mississippi River Basin
(UMRB, ORB, MoRB, LMRB)
‒ Iowa River Basin, South Fork watershed
Wastewater management guidelines for biorefinery processes
1. Water Footprint Analysis Analyze multiple production pathways:
biofuels (starch, oil seeds, algae, residue, perennials, forest resources), conventional fuels (oil, natural gas), electricity Focus on major production stages (feedstock
and conversion) and apply to national scale at county level Distinguish water resources
2. Hydrologic Modeling Characterize nutrients, sediments, and
hydrology for the biomass producing regions Estimate value proposition of nutrient
reduction Apply to multiple scales: watershed to river
basin 3. Wastewater Management Analysis Biorefinery wastewater management options Regional regulatory requirements
The objectives will be achieved by
Output
(View the PowerPoint “Notes” page for additional information)

7
Success factors ‒ Well-defined technical approach,
transparent analysis ‒ Strong collaboration with other
government agencies/expertise in the field to collect critical data, update pathways, and identify synergy and leverage
‒ WATER Tool: online, user- friendly, and open access, meeting the needs of bioenergy industry and policy makers
‒ Hydrologic model: consistent methodology, rigorous calibration
Potential challenges ‒ Uncertainty associated with early
process R&D and field testing ‒ Incomplete data coverage at state level
or county level; poor quality data
Approach
Planning and checking: Set quarterly milestones and deliverables, monitor monthly progress and expenditure, and brief BETO quarterly Interface with feedstock and pathway
development and TEA: feedstock study (Langholtz, ORNL); process R&D (Albrecht, Snowden-Swan, PNNL); process simulation (Davis, NREL) Employ interdisciplinary team: Hydrologist,
computer engineer, environmental engineer
1 – MANAGEMENT APPROACH
(View the PowerPoint “Notes” page for additional information)

2 – TECHNICAL APPROACH
Adopt WF methodology (UNESCO, ISO) Develop major assumptions in consultation with USDA, USGS, USFS, US Army Corp., and
biofuel industry Calibrate model with decades of historical data; verify assessment results with field
observations 8
Resource & ProductionData Inventory
Watershed Model
(SWAT)
BMPs, New feedstock, New process, Advanced fuels
Water Footprint
WATERWeb Tool
Wat
er s
usta
inab
ility
in
dica
tors
TEA
SCSA
Water Availability
Index
Future scenarios
Wastewater Management
Industry

3 – TECHNICAL ACCOMPLISHMENTS: OVERVIEW Since 2015 Peer Review, this project Contributed to two chapters of BT16 Report Volume II environmental analysis
– Developed water consumption footprint analysis for six BT16 agriculture and forest scenarios.
– Developed SWAT simulation of BT16 scenario BC1 2040 in Iowa River Basin (IRB), incorporating BMPs for water quality improvements.
Developed SWAT hydrologic models – Lower Mississippi River Basin to simulate output of nutrient, sediments, and flow to the
Gulf of Mexico. – For Iowa River Basin, evaluated impact of management options (cover crop, tile
drainage control, slow-release fertilizer, and riparian buffer), land use, and climate on water quality. Implemented future land use and BMP scenarios in South Fork watershed.
Engaged stakeholders to address MRB water quality issue by participating in EPA’s Hypoxia Task Force and surveying modeling groups in other agencies. Implemented sugar-to-hydrocarbon pathway in WATER; updated energy-water database
with new electricity water data. Developed Water Availability Index for biomass and biofuel production. Reviewed biorefinery wastewater treatment options for cellulosic sugar-to-hydrocarbon
process; updated pyrolysis/hydrotreating grey water.
9

County, state, region 30-year historic
climate Direct and embedded
water use Co-product credit
3 – 1. WATER FOOTPRINT ACCOUNTING
10

11
An on-line interactive model for water use, water resource, and water quality assessment
Application Analyzes multiple feedstock production in a region
to support regional water resource planning and management and biorefinery location comparison. Enables compatible spatial resolution with
POLYSYS, LEAF, FAPRI, and other models/tools, allowing analysis of the interplay of policy, economics, and environmental factors. Provides support to bioenergy industry,
government, academia, and community for informed decision making.
Feature Water footprint at county level for the United
States Feedstock production and conversion stages;
biomass production volume distribution Land use: agriculture and forestry Metric: product, feedstock, land use
Corn grain & stover, soy bean, wheat straw
Switchgrass and Miscanthus Forest wood (hard, soft) resource SRWC (willow, hybrid poplar, pine) Ethanol, biodiesel, renewable diesel
blend, mixed alcohol blend Electricity (fossil, renewable) Petroleum (conventional, oil sands) Natural gas
Production pathway analysis Future scenarios evaluation
WATER (Water Analysis Tool for Energy Resources) http://WATER.es.anl.gov

KEY MILESTONES AND PROGRESS (Since 2015 peer review) Completed Develop methodology for estimating regional WF of multiple feedstock. Apply the method
for one BT16 agriculture and forestry scenario (actual: 6 scenarios completed), contributing to Chapter 8 in BT16 Volume II.
Reach out to stake holders and other agencies to identify potential candidates for developing case studies to demonstrate the value of WF analysis.
Conduct a review of methodology for estimating water resource availability; develop representation of water availability index (WAI) for biofuels. Develop WAI and apply to historical crop, residue, and perennial pathways.
Develop WF analysis for biofuels produced via biological sugar-to-hydrocarbon pathway. Review biorefinery wastewater management.
Update WATER energy-water database: electricity generation. Validate SRWC grey water in southeast forest regions. In Progress
Release analysis of water resource availability index (WAI) for six BT16 agriculture and forestry scenarios at the county scale for the United States (25%).
Deliver a set of guidelines for biorefinery wastewater management options and potential treatment schemes that meet the regulation for process wastewater generated from fast pyrolysis/hydrotreating and HTL processes at design scale (10%).
12
3 – 1. Water Footprint Accounting

WATER CONSUMPTION FOOTPRINT OF BT16 SCENARIOS: GROUND WATER
13
3 – 1. Water Footprint Accounting
Reduction in irrigation water is significant from BC1&ML2017 to HH3&HH2040. Ground water consumption would reduce 207 billion gallons in the four states in Great
Plains; nationally, the figure would be 276 billion gallons. A transition from irrigated feedstock to non-irrigated cellulosic dominant feedstock for
biomass production could contribute to ground water resource conservation.

BT16 SCENARIO: NATIONAL IMPLICATIONS
14
From BC1&ML 2017 to HH3&HH 2040, biomass could increase by a factor of 2.4 while irrigation water consumption could decrease by 27% in the contiguous United States. Green water use increases from
BC1&ML2017 to 2040 scenarios. Future research is needed on
the implication of the green water use to regional and local development.
3 – 1. Water Footprint Accounting

STAKEHOLDER ENGAGEMENT US EPA adoption of WATER
– Recent EPA economic analysis using FAPRI and WATER to estimate food/fuel production and their water footprint
Reached out to state and local agencies and biofuel stakeholders to seek input and validate data – Antares, USDA NRCS, Great Plain Institute, others – Potential data coverage area: Virginia, Iowa, Minnesota, California – NDA in progress
Compared WATER with other tools – Reviewed WQI (NRCS) and existing irrigation model used by USDA – Explored synergy between WQI and WATER; identified grey water as area for
future collaboration Identify potential candidates for developing and validating WF analysis
– Crop land conversion to switchgrass – Crop residue harvest and cover crop – Long-term monitoring data, large acreages – Leverage DOE-funded projects
3 – 1. Water Footprint Accounting
(View the PowerPoint “Notes” page for additional information)
16

16
3 – 1. Water Footprint Accounting
WATER AVAILABILITY INDEX (WAI)
USDA-SCS NHD Plus V2 (View the PowerPoint “Notes” page for additional information)
WAI_R for BC1 2017
A significant water resource is precipitation, a portion of which represented by effective rain (ER) is available for feedstock. Compared three major methods to estimate ER. Extensive regional variation in seasonal
precipitation pattern affects the amount of water available to meet the water demand of crops/biomass (ETc). WAI_R is being developed for BT16 scenario
BC1 2017. Preliminary results show ER used for the feedstock is relatively small.
Temporal and Spatial Variations
Effective Rain(mm/yr)0 - 100
101 - 200
201 - 300
301 - 400
401 - 600
601 - 800
801 - 1000
1001 - 2008Smith
Annual Effective Rain
WAI_R0.00 - 0.02
0.03 - 0.04
0.05 - 0.06
0.07 - 0.08
0.09 - 0.10
0.11 - 0.15
0.16 - 0.20
0.21 - 0.25
0.26 - 0.30

WATER: NEW FEATURES SINCE LAST REVIEW (2015) Database for BT16
– Six scenarios (BC1 2017, BC1 2040, HH3 2040, ML2017 ML2040, HH 2040), county level
– Crop (annual and perennial) production and land use, tillage, fertilizer application
– Fraction of corn stover harvested for biomass – Forest resource feedstock harvest (wood type, feedstock type) Regional platform (in progress)
– In parallel to pathway-based platform – Estimate regional WF of multiple feedstock – Modify computation processes, change codes, prepare documentation Biological cellulosic sugar-to-hydrocarbon conversion process Energy-water database update
– Electricity generation and water usage (2010, 2014) Development version
3 – 1. Water Footprint Accounting
(View the PowerPoint “Notes” page for additional information) 18

This work examines the impact of bioenergy production on water by simulating nutrients, stream flow, and suspended sediments. ‒ Evaluate conservation practices;
select effective watershed strategies to improve water quality and reduce impacts.
– Estimate potential value proposition of reducing nutrients output to the Gulf of Mexico by using biomass.
– Apply multiple-scale SWAT hydrologic modeling.
– Identify key players/factors in integrated landscape management.
‒ Focus on agriculturally dominant regions where a majority of conventional biofuel is produced and potentially a significant portion of cellulosic will come from.
(View the PowerPoint “Notes” page for additional information) 19
3 – 2. WATERSHED MODELING
Assist in a variety of management decisions and protection strategies to meet regulatory limit and sustainability criteria
Assist policy makers through regional-specific impact analysis

KEY MILESTONES AND PROGRESS (Since 2015 peer review)
Completed Conduct a survey of MRB modeling efforts by federal agencies. Develop a calibrated and validated SWAT base model for IRB, incorporate management
strategies, and simulate water quality and quantity under future climate. Implement BC1 2040 scenario to stover-harvesting-dominant Iowa River Basin, apply
conservation practices, simulate and analyze water quality improvement, and release simulation and analysis contributing to BT16 Volume II. Continue to incorporate riparian buffer strip and double-cropping to South Fork
watershed SWAT model to simulate water quality and hydrology.
In progress A Lower MRB SWAT model simulation of 20 years of nitrogen, phosphorus, and sediments
loadings to the Gulf of Mexico at HUC-8 scale (80%). An analysis of potential land use and practices that could reduce the loadings (20%). Define and demonstrate potential value proposition of reducing the nutrient loss to the
Gulf of Mexico from Lower MRB by using biomass (10%).
19
3 – 2. Watershed Modeling

STAKEHOLDER ENGAGEMENT ON MISSISSIPPI RIVER BASIN WATER QUALITY
3 – 2. Watershed Modeling
(View the PowerPoint “Notes” page for additional information) 21
Federal Agency MRB Modeling Survey – Aims to exchange ongoing modeling projects for the region, identify gaps,
share lessons and resources, avoid duplication, and forge collaborations. Output helps MRB model planning.
– Reached out to key research teams in MRB modeling in each agency. Organized a Federal Agency MRB Modeling Group web-conference in early 2016. K. Johnson gave an overview of BETO-sponsored work. Argonne and ORNL presented MRB modeling results.
– Other presenters: USDA SWAT developer, USGS new SPARROW developer, USACE SWAT-HECRAS developer, EPA One Biosphere framework lead, EPA Hypoxia Task Force (HTF) lead.
– All participating agencies expressed strong interests in continuing the communication as a group. Several follow-up calls have already been taking place among agencies to seek potential collaboration.
– We are planning on another call for the group to present BT16 SWAT work in FY17.

Hypoxia Task Force (HTF) Communication ‒ Reached out to HTF coordinating committee in EPA, HTF leadership in
USDA ARS and NRCS, and Iowa (core team member). Collaboration with ORNL (Jager).
‒ ANL/ORNL presented MRB tributary simulation results to HTF twelve MRB states, thereby introducing BETO-supported MRB modeling work.
Joined HTF Modeling Group ‒ Hold regular conference calls with 12 MRB states. ‒ Identify areas in which the BETO MRB modeling work can make
contributions. ‒ Incorporate biomass production scenario into nutrient reduction planning of
MRB states, in response to HTF interest. ‒ Current interaction: buffer application and benefits in Indiana
3 – 2. Watershed Modeling
STAKEHOLDER ENGAGEMENT ON MISSISSIPPI RIVER BASIN WATER QUALITY (CONT.)
22

3 – 2. Watershed Modeling
Reduction of nutrient loss
BC1 2040 scenario simulation in IRB: ‒ SWAT model calibrated and validated with
20-year hydrology for flow, nitrogen, phosphorus, and sediments. Implemented land use, tillage, and management programs.
‒ Biomass feedstock: corn stover, miscanthus, willow, grain, soy bean.
‒ Conservation practices: Riparian buffer, cover crop, slow-release fertilizer, and tile drain control.
Satisfactory 20-year nitrate calibration results
BT16 WATER QUALITY MODELING IN IOWA RIVER BASIN - AGRICULTURE
(View the PowerPoint “Notes” page for additional information)
23

BC1 2040 SCENARIO WATER QUALITY IMPROVEMENT
3 – 2. Watershed Modeling
Riparian buffer is most effective in reducing suspended sediments. Cover crop could reduce 27% of
phosphorus loss in addition to reductions of 19% in nitrate and 37% in sediments. Tile drain control resulted in significant
reduction in nitrate loss (up to 5000 MT) for downstream communities.
The practices could reduce nitrogen loading from 8% to 28%, compared with that from baseline BC1 2040 scenario. A combination of the conservation
practices could result in substantial improvement. Selection depends on water quality issue in the watershed.
(View the PowerPoint “Notes” page for additional information)

Nitrogen Phosphorus Sediments
3 – 2. Watershed Modeling DEVELOP SWAT MODEL FOR LOWER MISSISSIPPI RIVER BASIN
Gulf of Mexico
Inputs from five upstream Mississippi river tributaries
Elevation, soil map Weather Land cover, land use Row crop rotation Tillage Fertilizer management Live stock operation Municipal discharge Other point sources
HUC-8, calibrated and validated with 20 year hydrology
Value proposition of reducing nutrient loss
Scenarios Historical land
use Proposed
production
Conservation Practices

Grey water footprint
Wastewater composition
Water quality
standard
Wastewater discharge
limits
Treatment cost
Technology feasibility
Treatment options
Wastewater stream flow Local water
resource
Climate
Local water chemistry
Refinery scale
BIOREFINERY WASTEWATER
25
3 – 3. Wastewater Management Analysis
(View the PowerPoint “Notes” page for additional information)
Wastewater management is often the last factor to be considered in process R&D. Stringent regulation can affect the cost because of complex treatment options.

26
3 – 3. Wastewater Management Analysis
RENEWABLE DIESEL BLEND PRODUCTION VIA SUGAR-TO-HYDROCARBON PROCESS Solid waste disposal was identified as a management
issue, and its inverse relationship with wastewater management could affect process economics. Increased TSS loadings could affect both the size of anaerobic reactors and the quantity of solid waste, resulting in an ~18% cost increase. Results will feed to TEA. Uncertainties in wastewater sample analysis hinder
plant design. In FY17, we are providing expertise to the process conversion team to address the issue. Bioelectricity generation from the biorefinery resulted in
a net water credit, which reduced the water footprint.
(View the PowerPoint “Notes” page for additional information)
Developing wastewater management guidelines supports biorefinery design, process techno-economic assessment (TEA) and Supply Chain Sustainability Analysis (SCSA)

27
3 RELEVANCE Water use and wastewater release are two key issues associated with water sustainability
in bioenergy development. Sufficiency of water resource and ability to meet tightened regulations can become a barrier in the financing and siting of refinery and thus limit deployment. This project provides a consistent platform to examine water sustainability metrics for
bioenergy production, to meet BETO A&S’s strategic goal of integrating water quantity and quality assessments into biomass and bioenergy production analyses (MYPP 2016). ─Water footprint translates feedstock/pathway selection and biomass production
scenarios into estimates of demand to regional water resource; wastewater management analysis identifies key factors that constrain biorefinery design.
─SWAT modeling permits multi-scale watershed analysis of water quality impacts of future feedstock production scenarios and evaluates approaches to reduce nutrient and sediments burdens.
This project supports stakeholders ─Quantifies value of conservation practices with production scenarios to downstream
community and incorporates them into state/local planning. ─Provides guidelines on water resource management from water quality, quantity, and
regulatory perspectives to biorefinery TEA/SCSA; supports decision making by the bioenergy industry.
─Informs BETO’s strategic thinking by evaluating the potential degree of impact of energy policies on natural resource.

28
5 – FUTURE WORK
(View the PowerPoint “Notes” page for additional information)
Hydrologic Modeling Complete SWAT baseline model for
LMRB, analyze model performance, simulate selected conservation practices. Define and demonstrate potential value
proposition of reducing the nutrient loss to the Gulf of Mexico from Lower MRB by using biomass. Outcome: Value of reduced nutrient
loss by conservation practice in LMRB at sub basins and outlet to the Gulf.
Wastewater Management Analysis Develop and compare management options for biorefinery wastewater generated from
FP hydrotreating and HTL at design scale. Outcome: A set of wastewater management guidelines to biorefinery design and
TEA.
Water Footprint Develop WAI for six BT16 scenarios. Design model architecture for the regional
platform; develop architecture to connect existing pathway platform with the new platform; full implementation of the six BT16 scenarios. Design and implement WAI feature. Outcome: WATER model able to
simulate WF and WAI for a given pathway and BT16 scenarios at county, state, and regions.

29
Approach Data, modeling, and analysis (DMA) is based
on well-defined framework, consistent methodology, and rigorous calibration. Spatial and temporal resolution; regional and
national coverage Technical Accomplishments Principal authors of water quality and WF
modeling chapters of BT16 Report Volume II. Developed a SWAT model for LMRB to
evaluate nutrient reduction in the output to the gulf of Mexico. Simulated impact of land use, multiple BMPs, and climate on water quality in IRB. Engaged with stakeholders to address water
quality by participating in EPA’s Hypoxia Task Force and organizing a federal MRB modeling group virtual meeting. The effort will continue. Developed Water Availability Index.
Implemented sugar-to-hydrocarbon pathway to WATER; evaluated WF and wastewater treatment of the pathway.
Relevance Provide a platform to analyze water use
and wastewater release along the production stages to address potential resource barriers limiting deployment. Assist DOE stakeholders with modeling
and analysis to estimate regional water sustainability of various production scenarios.
Critical Success factors Strong collaborations with water resource
community and technical R&D team. Strong stake-holder engagement. Technology Transfer and Future work WF and wastewater management
analysis results feed to TEA/SCSA SWAT model outputs support HTF
Major future work: WAI of six BT16 scenarios LMRB value proposition Wastewater management guideline
SUMMARY Analytical Framework for Water Sustainability
30

Acknowledgement
BETO: Kristen Johnson
ORNL: Yetta Jager, Matt Langholtz, Laurence Eaton, Craig Brandt, Rebecca Efroymson
PNNL: Lesley Snowden-Swan, Sue Jones, Karl Albrecht, Mark Wigmosta
NREL: Ryan Davis

31
ADDITIONAL SLIDES

RESPONSES TO PREVIOUS REVIEWERS’ COMMENTS (2015) Comments: This is a truly exciting project. For years, stakeholders in the environmental community have lamented the lack of data and attention to the possible water impacts of bioenergy. The WATER tool (available to stakeholders outside the immediate BETO research community) addresses their concerns very well. This project is an important center of gravity for all of the work being done in the program on water impacts. The team has made great progress since 2013. I applaud plans to update the water use of electricity generation as well as natural gas. Biogas could be another resource to add in the future. Continued development of better spatial analysis is also important. Algae due to its high water use but also its ability to utilize gray and salty water would be a great addition to the model. Also, taking a renewed look at water use in the production of baseline gasoline from petroleum would help make consistent comparisons possible. This project continues to be key in understanding water issues, and it will play an even greater role in the future as water scarcity and water conservation become more prevalent. This project has contributed and should continue to contribute great value to the assessment of bioenergy impacts on water systems. Overall score: 9.83/10 Responses: We would like to express our deep appreciations to the comments and constructive inputs from the reviewers. We are so excited about what have been accomplished in last two years. Moving forward, we hope to continue the data, modeling and analysis in the water area and contribute to BETO's overall mission of developing a sustainable bio-industry.
32

PUBLICATIONS Ha, M. and M. Wu, 2017. Land management strategies for improving water quality in biomass production under changing climate,
Environ. Res. Lett. Feb. 2017. https://doi.org/10.1088/1748-9326/aa5f32 Xu, H. and M. Wu, 2017. Water Availability Indices – A Literature Review, ANL/ESD-17/5, Argonne National Laboratory Technical
Report, Lemont, IL 60439. Wu, M. and B. Sawyer, 2016. Estimating Water Footprint and Managing Biorefinery Wastewater in the Production of Bio-based
Renewable Diesel Blendstock, ANL/ESD-17/2, Argonne National Laboratory Technical Report, Lemont, IL 60439 http://water.es.anl.gov/documents/CellSugartoHC%20WF.pdf
Wu, M. and M. Ha, Incorporating Conservation Practices into the Future Bioenergy Landscape: Water Quality and Hydrology, Book Chapter in “Land use and Bioenergy Production”, Ed. Qin et al. Accepted, AGU Books, Pub. John Wiley & Sons, Inc.
Rogers, J. N., B. Stokes, J. B. Dunn, H. Cai, M. Wu, Z. Haq, H. Baumes. 2016. An Assessment of the Potential Products and Economic and Environmental Impacts Resulting from a Billion Ton Bioeconomy, BioFPR. (2016), doi/10.1002/bbb.1728/
Lampert, D. and M. Wu, An automated approach for construction of long-term, data intensive watershed models, under review with Journal of Computing in Civil Engineering.
Sujit Das, Jeni Keisman, May Wu, David Andress, Fred Joseck, Tien Nguyen, Amgad Elgowainy, Jake Ward, Michael Wang, Kristen Johnson. Water Consumption for Light-Duty Vehicles' Transportation Fuel, under review with Energy for Sustainable Development.
Ha, M. and M. Wu, 2015. Simulating riparian buffer in integrated landscape management scenarios for biofuel feedstock production, BioFPR. DOI: 10.1002/bbb.1579
Lampert, D.J., M. Wu. 2015. Development of PyHSPF, Open-Source Software for Watershed Modeling with the Hydrological Simulation Program in Fortran, Environmental Modelling & Software, 68 (2015), 166-174.
Linville, J.L., Y. Shen, M. Wu, M. Urgun-Demirtas, 2015. Current State of Anaerobic Digestion of Organic Wastes in North America, Curr. Sustainable Renewable Energy Rep., DOI 10.1007/s40518-015-0039-4.
Wu, M., M. Ha, Yi-wen Chiu, 2015. Reclaimed Municipal Wastewater for the Production of Bioenergy in the United States — A Resource Assessment, Proceedings of Water and Energy 2015 Water Environment Federation, June 7-10, 2015, Washington DC.
Wu, M. and M. Ha, 2015. Integrated Land Management to Address Energy-Water-Food Sustainability, Proceedings of 2015 International Conference on Healthy Watershed Management, National Taiwan University, Taiwan, March 10
Zhang, Z.L and M. Wu, 2015. Progress and challenges in quantifying water quality and ecosystem responses from agricultural, forestry, and bioenergy landscapes, Curr. Sustainable Renewable Energy Rep., DOI 10.1007/s40518-015-0041-x.
33

PRESENTATIONS Ha, M. and M. Wu, Incorporating Conservation Management into a Future Bioenergy Cropping System in Iowa River Basin: A Water
Quality Evaluation, AWRA annual conference, Nov. 15-17, 2016, Orlando FL. Wu, M., How are innovations in engineering and technology helping to address water challenges? Engineering and Technology Panel
Session in “The 2016 U.S.-China Forum: Water and Urban Development”, Oct. 13-14, 2016, University of Chicago, Chicago IL. Stephen, J. and M. Wu, Surface water discharge of treated municipal wastewater as a potential water resource in the United States,
Summer 2016 Symposium, July, 2016, Argonne National Laboratory, Lemont IL. Karlen, D., R. Cruse, M. Wu, J. Sadler, An overview of biofuel production in the U.S.- Impact on groundwater quality and groundwater
availability, and potential improvements/alternatives in management practices, Toward Sustainable Groundwater in Agriculture - An International Conference Linking Science and Policy", June 28-30, 2016, San Francisco, CA.
Wu, M., Quantifying Potential Benefits and Challenges in Biofuel ‒ Water Landscape, 2016 NCSE National Conference and Global Forum on Science, Policy and the Environment, Jan. 19-21, 2016, Washington DC.
Wu, M., Confronting Uncertainties in Biofuel ‒ Water Landscape: Assessment and Attributes, NSF Food-Energy-Water Workshop organized by Colorado State University, Dec. 7–8, 2015, Washington, DC.
Zhang, Z. and M. Wu, Assessing spatial and temporal distribution of sediment, nitrogen, and phosphorus loading in the Missouri River Basin, 2015 International Soil and Water Assessment Tool Workshop and Conference, October 12-16, 2015, West Lafayette, IN.
Ha, M. and M. Wu, Investing impacts of BMPs and land use change on water quality for sustainable bioenergy production, 2015 International Soil and Water Assessment Tool Workshop and Conference, October 12-16, 2015, West Lafayette, IN.
Wu, M. Food Energy Water Nexus, NSF Food-Energy-Water Workshop organized by AIChE, Oct. 7–9, 2015, Baltimore, MD. Wu, M., Application of WFA to Support BioEnergy Policy Development in the U.S., Water Footprint Network Partner Projects in the
Spotlight in World Water Week, Aug. 25, 2015, Stockholm. Chiu, Y. and M. Wu, Water Analysis Tool For Energy Resources (WATER) - A Modeling Framework Quantifying Water Footprint
Associated With Multiple Biofuel Production Pathways, International Society for Industrial Ecology Conference, July 7-10, 2015, Guildford, England.
Wu, M., Achieving Water-Sustainable Bioenergy Production, Session 3–A: Growing a Water-Smart Bioeconomy, BioEnergy 2015 Conference, June 23–24, 2015, Washington, DC.
Ha, M. and M. Wu, Resilient bioenergy production system through integrated landscape design in Iowa River watershed, IA, Climate Change Adaptation, 2015 AWRA Summer Specialty Conference, June 15-17, 2015, New Orleans, LA.
Wu, M. and M. Ha, Reclaimed Municipal Wastewater for the Production of Bioenergy in the United States - A Resource Assessment, Water and Energy 2015, June 7-10, 2015, Washington DC.
Ha, M. and M. Wu, Impacts of climate change and BMPs for sustainable bioenergy production in South Fork of Iowa River watershed, IA, ASABE 1st Climate Change Symposium: Adaptation and Mitigation, May 3-5, 2015, Chicago, IL.
34