Embed Size (px)
Citation preview

ii
WORLD MARITIME UNIVERSITY
Malmö, Sweden
IMPACT OF PORT EFFICIENCY AND
PRODUCTIVITY ON THE ECONOMY OF
BANGLADESH – A CASE STUDY OF
CHITTAGONG PORT
By
HALIMA BEGUM
Bangladesh
A dissertation submitted to the World Maritime University in partial fulfillment
of the requirement for the award of the degree of
MASTER OF SCIENCE
in
MARITIME AFFAIRS
(Port Management)
2003
© Copyright Halima Begum, 200

ii
ABSTRACT
Title of dissertation: Impact of port efficiency and productivity on the economy of
Bangladesh – A case study of Chittagong Port.
Degree: MSc.
This dissertation is a study of evaluating the performance of the Chittagong Port to
find out the impact on the economy of Bangladesh. With this end in view, the over
all socio-economic situation of Bangladesh has been analyzed in general and the
economic impact of the port in particular.
Chittagong Port is the ‘Gateway of Bangladesh’ as more than 80% of export and
import cargoes are transported through this port. It is a self-financing service oriented
organization. The management and the operation systems are still like first
generation port. The average revenue earning of the port is about 1.4% of average
Annual Income of the country. It provides 23,000 employment opportunities directly
and generating per year about 57million dollars as added value excluding the indirect
and induced impact.
Based on the various performance indicators, it is found that the performance of CPA
is very low. The growth rate is 4% for cargo and 11% of container as it handles only
the captive cargo. The average turn-around time of a ship is 6 days and average dwell
time of imported container is 25 days. The inefficiency cost to the economy is
worked out at $92million per year, which is about 1.5% of average export earning of
Bangladesh. On the other hand, during 2001-2002 an improvement of 1.05 days in
turn- around time over the previous year the ship owners have saved up to
$15million.

iii
The dependency on maritime transport is increasing successively with the increase of
international trade of the country. Port activities are a derived demand of trade.
About 30% of the annual income of the country comes from imported goods in the
form of import duties and taxes. Furthermore, CPA earns foreign currency, which is
about 1.5% of the average deficit trade balance. Hence, the importance of port
efficiency is unquestionable, in a country like Bangladesh.
Keywords: Efficiency, Performance, Economic impact, Turn-around time, Dwell
time.

TABLE OF CONTENTS
Page
Declaration ii
Acknowledgement iii
Abstract iv
Table of Contents vi
List of Tables x
List of Figures xii
List of Abbreviation xiii
1 Background and objective of the study
1.1 Introduction 1
1.2 Relationship among macroeconomics, port economics
and port performance 2
1.3 Impact on the export and import prices 3
1.4 Background of the study 4
1.5 Objective of the study 5
1.6 Research methodology 5
1.7 Limitations 6
1.8 Scope 6
1.9 Conclusion 7
2 Socio-economic aspects of Bangladesh
2.1 Introduction 8
2.2 Geographical location, physical and topographical features 8
2.3 Population 8
2.4 Economy 9
2.4.1 Macro economic indicators 9
2.4.2 Balance of trade 10
2.4.3 Maritime dependency factor 11
2.4.4 Balance of payment 11
2.4.5 Dependency on foreign aid and loan 12

page
2.4.6 Annual budget 2003-04 12
2.4.7 Foreign currency reserve 13
2.5 Conclusion 14
3 Role and function of the Chittagong Port Authority and impacts on the
economy
3.1 Introduction 15
3.2 History 15
3.3 Administration 16
3.4 Objectives 16
3.5 Functions of the Authority 16
3.6 Planned capacity and handling 17
3.7 Port administration model 18
3.8 Finance 19
3.9 Cargo and container operation 20
3.10 Development programme 21
3.11 Hinterland and foreland connection 21
3.11.1 Dhaka ICD 22
3.12 Traffic forecast 23
3.13 SWOT analysis 24
3.13.1 Strength 24
3.13.2 Weakness 24
3.13.3 Opportunities 25
3.13.4 Threats 25
3.14 The Role of port on the national economy 26
3.14.1 Direct impact 27
3.14.2 Indirect impact 28
3.14.3 Induced impact 29
3.15 Local economic impact of investment and maintenance 29
3.16 Conclusion 30

page
4 Performance of Chittagong Port and comparison with other Ports
4.1 Introduction 31
4.2 Indicators of Service 33
4.2.1 Ship turn-around time 33
4.2.2 Waiting time 35
4.2.3 Service time 35
4.2.4 Grade of waiting time 36
4.3 Berth utilization indicators 36
4.3.1 Berth occupancy 37
4.3.2 Berth worked time ratio 37
4.4 Handling indicators 38
4.4.1 Berth output 38
4.4.2 Ship output 39
4.4.3 Gang output 39
4.5 Equipment utilization and availability 40
4.5.1 Downtime 41
4.5.2 Utilization of equipment 42
4.6 Storage indicator 44
4.6.1 Dwell time 45
4.7 Quality of service indicator 45
4.7.1The working hours 46
4.8 Reliability indicator 47
4.9 Financial indicators 47
4.10 The information system 48
4.11 Comparison with other ports 48
4.11.1 Local port 48
4.11.2 Regional port 49
4.12 Projection of container port capacity in Indian sub-continent50
4.13 Conclusion 51

page
5 Impact of port performance on Bangladesh economy
5.1 Introduction 53
5.2 Efficiency benefit to ship for 2001-2002 54
5.3 Inefficiency cost to ship and cargo 54
5.3.1 Cost to ship 54
5.3.2 Dwell time cost of cargo 55
5.3.3 Cost of lighterage 56
5.4 Conclusion 56
6 Constraints of efficient port performance
6.1 Introduction 58
6.2 Forces of change 58
6.3 Major constraints 59
6.3.1 Institutional/organizational constraints 59
6.3.2 Labour and employment constraints 64
6.3.3 Logistic support/physical facilities 65
6.4 Conclusion 68
7 Conclusion and Recommendations 7.1 Conclusion 69 7.2 Recommendation 70
7.2.1 Short term measures 70 7.2.2 Long term measure 73
References 74 Appendices
Appendix A Map of Bangladesh 78
Appendix B Organogram of CPA 79
Appendix C Details of facilities 80
Appendix D Details of ongoing development projects 82
Appendix E Details of equipment downtime,
availability and utilization 83
Appendix F Location of Chittagong Port 84

LIST OF TABLES
page
Table 2.1 Population 9
Table 2.2 Macroeconomic indicators 10
Table 2.3 Balance of trade of Bangladesh 10
Table 2.4 Maritime dependency factor 11
Table 2.5 Balance of payment of Bangladesh 12
Table 2.6 Dependency on foreign aid and loan 12
Table 2.7 Annual Budget (2003-2004) 12
Table 2.8 Revenue earning on account of import
duty and taxes 13
Table 2.9 Foreign currency reserve 13
Table 3.1 Import and export cargo handled through CPA 17
Table 3.2 Container and container cargo throughput 18
Table 3.3 Foreign currency earned by CPA 20
Table 3.4 ICD throughput and share of port traffic 22
Table 3.5 Container throughput forecast up to 2005 and
as projected in the Master Plan and Study Report 23
Table 3.6 Value added service of CPA 28
Table 3.7 Employment opportunity and salary 28
Table 3.8 Direct impact 30
Table 4.1 Turn-around time of vessel 34
Table 4.2 Waiting time of ship 35
Table 4.3 Service time of ship 35
Table 4.4 Grade of waiting time 36

page
Table 4.5 Berth occupancy ratio 37
Table 4.6 Container handling at CCT and GCB 39
Table 4.7 Ship output 39
Table 4.8 Gang output 39
Table 4.9 Gang and ship output of JNP, Colombo
and Singapore Port 40
Table 4.10 Equipment availability 41
Table 4.11 Demand and availability of container
handling equipment, July- Dec 2002 43
Table 4.12 Average Dwell time of containers at CPA 45
Table 4.13 CPA opening hours as compared to
non-coordinating hours 46
Table 4.14 Financial indicators 48
Table 4.15 Performance Indicators of Kolkata
Port Trust for 2001-02 50
Table 4.16 Future container port capacity in
Indian sub-continent 51
Table 5.1 Savings to ship due to improved
turn-around time (2001-2002) 54
Table 5.2 Per year inefficiency cost to ship 54
Table 5.3 Opportunity cost to the importer
(for manufacturing goods) 55
Table 5.4 Opportunity cost to the exporter (for RMG) 56
Table 5.5 Lighterage cost 56
Table 5.6 Total inefficiency cost 57
Table 6.1 List of annual holidays and leave in CPA 63
ii
LIST OF FIGURES
Page
Figure 1.1 Relationship of macroeconomics and port economics 2
Figure 1.2 Impact on export and import price 4
Figure 3.1 Income and expenditure of CPA 19
Figure 3.2 Modal split of cargo 21
Figure 4.1 Berth operation flow 33
Figure 4.2 Distribution of port expenses 34
Figure 4.3 Ship service time 38
Figure 6.1 Forces of change and their impact 58

1
LIST OF ABBREVIATIONS
ADB - Asian Development Bank
BC - Before Christ
BIWTA - Bangladesh Inland Water Transport Authority
BOI - Board of Investment
CCT - Chittagong Container Terminal
CBA - Collective Bargaining Agent
C&F Agent - Clearing and Forwarding Agent
CFS - Container Freight Station
CFTC - Chittagong Feeder Trade Committee
CIF - Cost, Insurance and Freight
CPA - Chittagong Port Authority
DWMB - Dock Workers Management Board
EDI - Electronic Data Interchange
EPZ - Export Processing Zone
EU - European Union
FCL - Full Container Load
FEU - Forty Foot Equivalent Unit
FOB - Free on Board
GCB - General Cargo Berth
GDP - Gross Domestic Product
ICD - Inland Container Depot
IT - Information Technology
JNPT - Jarharlal Nehru Port Terminal
LCL - Less Container Load
LOA - Length Over All
ISPS Code - International Ship and Port Facility Security Code

2
MDS - Maritime Dependency Factor
MIS - Management Information System
MPA - Mongla Port Authority
NBR - National Board of Revenue
POL - Petroleum Oil
RMG - Ready Made Garments
RTG - Rail Mounted Gantry
SSA - Stevedoring Services of America
TEU - Twenty Foot Equivalent Unit
UK - United Kingdom
UNCTAD - United Nations Conference on Trade and Development
USA - United States of America
VAT - Value Added Tax
VTS - Vessels Traffic System

1
CHAPTER 1
Background and objective of the study
1.1 Introduction
The efficiency of a port is the La mode of the present international trade since a
seaport is the nerve centre of foreign trade of a country. A seaport is the compulsory
transit point for the bulk of this trade, permitting the import of goods, which the
country does not itself produce in sufficient quantity, and the export of items
contributing to the development of its economy. Besides, a port is also a place for
the provision of further services, which add value to the products transported and
thus helps the increasing demand of trade. Port activities, therefore, contribute not
only to the economic independence of a nation but also vital to the political
independence, and perform a strategic role in the international trade.
Nagorski (1972, p.11) wrote about the importance of port functions that
Without Hamburg, Bremen, Rotterdam or Antwerp, Western Europe could
never have achieved such a spectacular and rapid progress. Yet for various
reasons, economies of most developing nations depend on maritime trade and
on ports in a still higher degree than in the case in affluent countries.
The globalisation of world economy has brought about tremendous increase in
exchange of goods across the world. The world trade also accelerated as cost of
shipping has dwindled due to the introduction of economy of scale and the
development of technology in shipping. To cope with the ever-growing world trade,

2
ports of every country will no doubt continue to play a critical and indispensable
role.
Dr. Mathathir, Prime Mininister, Malaysia rightly commented, “No matter how
information technology advances, the world trade cannot be materialized without
ports. This is exactly why every country needs to develop much more advanced and
efficient ports for its prosperity” (As cited in Inoue, 2002, p.5).
1.2 Relationship among macroeconomics, port economics and port performance
Port performance and port economics are closely related with macroeconomics.
Hence, any change in port traffic or operation and/ port organization has an impact
on national economy particularly on the hinterland. This relationship is shown in
Figure 1.1.
Figure 1.1-Relationship of port economics and macroeconomics
Source: Port Economics Handout, Francou.
From Figure1.1 it is thus clear that any change in the port infrastructure, organization
and operation has an impact on the efficiency of the supply chain and then on the
cost.
Port performances
Seaborne Trade
Port Economics
Hinterland Eco Environ Facilities Organisation
Macro Economics
Economic Port Impact

3
Productivity in any system is the output in relation to input and is a measure of
efficiency in the utilization of resources. In turn, efficiency is one of the three basic
output dimensions of the organizational performance i.e.
Performance = effectiveness, efficiency and participant satisfaction
(Meletiou, p.48)
Effectiveness is concerned with the accomplishment of explicit or implicit goals,
whereas efficiency refers to the ratio of output to input or benefit to cost. In case of
port ratio of time, cost, capacity etc. constitute the over all efficiency. This
efficiency has a considerable impact on the national economy. According to Francou
(2002, p.16)
This impact takes place on at least four major elements. They are:
- The efficiency is the main factor of the competition between ports, if any.
- The efficiency has effects on the export trade competition.
- The efficiency has effects on the price of imported goods.
- The port may have impact on the balance of payment.
1.3 Impact on the export and import prices
The export and import trade include more and more a logistical component. On the
other hand, a port is a vital part in the logistic chain. According to Beth, “Specialists
estimate the port cost to an average 10% of the total supply chain cost” (as cited in
Francou, 2002, p.16). Hence, if the port is inefficient, freight and handling cost
become high, which contributes to increasing the FOB export and import price. The
consequences are that import prices become high and export faces tough competition
in the international market. To survive in the competitive market exporters reduce
their profit margin. Figure 1.2 explains this situation:

4
FOB price
Figure 1.2- Impact on export and import price
Source: Impacts of ports and shipping on the economy, Francou, 2002.
So it is obvious why the country needs an efficient port. Port services are essentially
intermediate to goods. As it is known that congestion/inefficiency causes under
utilising of resources, declining of the productivity, prolonging of the ship turn
around time consequently increasing the cost per ton. According to Oram and CCR
(1971, p.2), “No single cause directly affects the costs of living of a maritime country
than the speed with which ships are turnaround in her ports”.
Between the two seaports (Chittagong and Mongla) Chittagong Port is the principal
port of Bangladesh, which is situated on the right bank of the river Karnaphuli, about
9 nautical miles away from the Bay of Bengal. The Chittagong Port Authority
(CPA), the ‘Gateway of Bangladesh’ handles about 85% of import and 80% of
export cargoes of the country. Hence, it acts as the nodal point of foreign trade.
1.4 Background of the study
The author has visited various ports particularly Rotterdam (the Netherlands), Malta
Freeport (Malta), Le Havre (France), Copenhagen Malmö Port (Denmark- Sweden).
Besides, from the lecture and various news media it is gathered that the port(s) of
Port A cost
Port B costFreight rate
Profit margin
Market price
Port influence

5
Singapore, Malta, and France contribute about more than 10% to the GDP. “About
11% of GDP of the Netherlands is generated by the activities of the port of
Rotterdam alone” (Alderton, 1999, p.121). “Spanish ports provide an Added Value
ranging from 6.78% to 7.70% of total GNP and generate an amount ranging from
8.20 to 8.95% of Spanish employment in 1993” (Coto Millan, Martinez Budria,
1999, p.163).
The author was impressed by the co-operative, professional, consistent, and
transparent and research based decision approach of these countries by the
bureaucrats and government to the port development. In these countries, the port is
regarded as the engine of the economy and emphasise on increasing the efficiency of
the port, which stimulates trade, distribution, transport and logistics.
Therefore, the author is motivated to study the performance and productivity of
Chittagong Port to workout the efficiency benefit and/ inefficiency cost to the nation.
1.5 Objective of the study
The objective of this dissertation is to: evaluate the impact of any improvement of
port efficiency on the national economy of Bangladesh.
1.6 Research methodology
In order to achieve the objective, the author had to depend on secondary data only.
Secondary data were gathered from the lecturers, field trip presentations, relevant
books, UNCTAD publications, various reports of CPA and information through
Internet. Data/ information was collated from World Bank, Bangladesh Bank, CPA
report, Chittagong Customs and various books.
The steps followed are:
- Study and analyse the economy of Bangladesh and the infrastructure and
super structure facilities of Chittagong Port.
- Analyse the direct and indirect impact of the port.
6
- Evaluate the port performance and productivity based on the internationally
standardised indicators.
- Identify the main constraints of the port to the efficiency and effectiveness of
the port from analysing the indicators.
- Recommendation in order to improve the port efficiency.
1.7 Limitations
Every port is unique. Still the author tried to compare the performance of Chittagong
Port with the neighbouring and other countries. Moreover, working out indirect and
induced impact of port is a massive work, which is almost impossible to carry out
from abroad and within 2 months time. There is no proper system for this kind of
information collection and preservation in Bangladesh. The following research could
not be done in the true sense because there was lack of required information:
- Data regarding indirect and induced impact of Chittagong Port.
- Port performance and productivity, tariff system of the neighbouring
countries e.g. Kolkata port, Myanmar Port.
- Details data like chartered cost, demurrage, cargo-wise export-import value,
ultimate market price of imported goods etc. to work out inefficiency cost.
- Up-to-date information could not be provided.
1.8 Scope
This dissertation is organized into seven chapters in order to describe and identify the
economic importance of Chittagong port. It evaluates the impact of any improvement
of port efficiency and productivity on the economy of the country.
Chapter one is an introduction, which provides a general overview of the port in
relation to macroeconomics and economic port impact, background of the study
including the objectives, research methodology, limitation and scope.
Chapter two indicates the socio-economic situation, international trade, and maritime
dependency of the country.

7
Chapter three describes the role and function of Chittagong Port Authority. It also
shows the traffic forecast and SWOT analysis. In addition to these, the direct indirect
and induced impacts are analysed.
Chapter four examines the performance indicators of CPA to find out the standard of
the efficiency.
Chapter five evaluates the efficiency benefit/inefficiency cost due to port operations
to the economy.
Chapter six analyses the major constraints of efficient port performance.
Chapter seven deals with conclusions and recommendations.
1.9 Conclusions
Because, more than 80% of the country’s international trade is transported through
Chittagong port, all the operational activities definitely have impact on the domestic
as well international trade and thus influence on economy. Hence, the question
comes: What is the impact? What are the indicators? How to evaluate the impact? Is
it high or low?
To get the answers, the author endeavours in the next chapter to analyse the socio–
economic situation as well the dependency on international trade of the country.

1
CHAPTER 2
Socio-economic aspects of Bangladesh
2.1 Introduction
Bangladesh is one of the least developing countries of South Asia. About 130 million
people in a land of 144,000 sq. km need rapid development for its economic
emancipation. The country is prone to natural calamities almost every year. In the
absence of rapid industrialization unemployment rate is increasing. It is expected that
the government will give emphasise on development activities as the country is
running in democratic way since 1991.
2.2 Geographical location and physical and topographical features Bangladesh is situated in the northeast corner of the South Asian subcontinent. It is
bordered in the north, east and west by India, on the southeast by Myanmar and on
the south by the Bay of Bengal (see Appendix A).
The Bay of Bengal is known for its cyclonic storms, which whip up its water,
sending them crashing on to the coastal areas, occasionally causing flooding. Is has a
typical monsoon climate. It experiences heavy rainfall, which generally exceeds 60
inches annually. Though the majority of the population live in rural areas, the influx
of population in urban areas is increasing and the urban population is about 20%.
2.3 Population
The population of Bangladesh stands at around 130m, making it the 8th most
populous nation in the world. The population growth rate is 1.7% per year (see Table

2
2.1). So, the country itself has a big market for consumption that ranges from food
item to life saving drugs.
Table 2.1- Population
Indicator 1997 2001 2002 Population 124.4 million 131.1million 133.3 million Population growth (annual %)
1.7%
1.7%
1.7%
Source: The World Bank Group
2.4 Economy
Bangladesh is an agricultural country. Major agricultural products are rice, jute,
potatoes and tobacco. The country is the world’s largest exporter of jute and jute
goods. Tea is also one of the foreign exchange earners. Other remarkable exported
items are frozen shrimps, frog legs and handicrafts. In addition, there has also been a
rapid growth in manufacturing industries, which offer a wide range of exportable
goods e.g. leather goods and readymade garments. RMG contributes about 76% of
the total national earning. In 2001-2002 fiscal year, the total export earnings were
$4583 million, which was about 9.5% of GDP.
Major import commodities are: machinery and equipment, chemicals, food grain,
crude oil, cement, iron and steel. The main import partners are: India, EU, Japan,
Singapore, China, and USA. On the other hand, the main export partners are USA,
Germany, UK, France, Netherlands and Italy.
2.4.1 Macro economic indicators
World Bank has predicted 7% GDP growth rate for the sustainable economic
development of Bangladesh. During 2002 the GDP growth rate was 4.8%.
The government developed a medium-term macroeconomic framework to
implement its strategy, envisaging an increase in growth rate to 6.5% in the
fiscal year 2005-06 from 5.5% in 2003-04 (projected).

3
Table 2.2 – Macro economic indicators
Economic indicator 2000 2001 2002 GNP (billion $) 47.2 49.7 52.08 GDP Growth (Annual%) 5.9% 5.3% 4.8% Value Added in agriculture (%of GDP)
24.6% 25% 24.6%
Value added in industry (%of GDP)
24.4% 26.2% 26.5%
Value Added in services and others (% of GDP)
51.0% 48.8% 48.9%
Source: The World Bank Group& Bangladesh Bank
From Table 2.2 it is obvious that about half of GDP is generated through the
service sector but nearly two- thirds of Bangladeshis are employed in the
agricultural sector. Major impediments to growth include frequent cyclones
and floods, inefficient state-owned enterprises, inadequate port facilities, a
rapidly growing labour force, unable to exploit energy resources, insufficient
power supplies and slow implementation of economic reforms. Again, the
economic reform is stalled in many instances by political infighting and
corruption at all levels of government.
2.4.2 Balance of trade
Bangladesh economy is heavily dependent on import. The import value is
almost 1.5 times higher than export value. Hence the balance of trade is
always negative. The last three years trade position is shown in Table 2.3:
Table 2.3 - Balance of trade of Bangladesh (billion $)
Year Export (FOB) Import (CIF) Balance 1999-2000 5.75 8.40 -2.65 2000-2001 6.47 9.34 -2.87 2001-2002 5.99 8.54 -2.55
Source: Bangladesh Bank.

4
2.4.3 Maritime dependency factor(MDF)
In order to know the MDF of the Bangladesh economy is compared the
country’s international seaborne cargo in value with the GDP.
MDF= Seaborne Trade in Value/ GDP*100%
“Generally, the level of MDF is affected mainly by; the difference in the type
of the economy, the size of economy, the level of economy, alternative
transport modes and geographical location” (Ma, 2002, p.13). The MDF of
Bangladesh for the last few years is shown in Table 2.4:
Table 2.4- Maritime dependency factor
Year GDP (In US$ Billion)
Total Export & Import ($ billion)
MDF
1991 31.0 5.208 17% 2000 47.2 14.155 30% 2001 49.7 15.83 32% 2002 52.08 14.53 28%
Source: Bangladesh Bank.
With the increase of development activities, the export-import through
seaports also increases. Table 2.4 shows the maritime dependency of the
country on average (2000 to 2002) is 30%.
2.4.4 Balance of payment
The balance of payment is also negative, (see Table 2.5). As the value of
Bangladesh’s export earnings is less than the value of imports the country has
to relay heavily on large amounts of foreign aid, particularly commodity aid
and loan from the World Bank, donor countries and foreign remittance of
Bangladeshi working abroad to help bridge the widening trade gap.

5
Table 2.5- Balance of Payment (US$ million)
1981 1991 2000 2001 Exports and goods & services*
933 2113 6611 7178
Import of goods & services*
2718 3829 9060 10103
Resource balance -1785 -1716 -2449 -2925 Net income -23 -102 -221 -264 Net current transfer 963 846 2392 2171 Current account balance -845 -972 -278 -1018
Source: The World Bank Group
*Includes services, which are not included in Table2.3.
2.4.5 Dependency on foreign aid and loan
The outstanding stock of the country’s external debt rose to $16.65 billion or
35% of GDP as of end June 2002 from $ 16.24 billion or 34.60% of GDP as
of end June 2001(Bangladesh Bank). With the export growth rate much
higher than the increase in debt payment, Debt Service/ Export ratio declined
(see Table 2.6).
Table 2.6 - Dependency on foreign aid and loan
Year Debt service Liability ($billion)
Export ($Billion)
Debt service/export ratio
1991 0.610 1.698 36% 2000 0.789 5.752 14% 2001 0.678 6.467 7%
Source: Compiled from World Bank and Bangladesh Bank.
* In all cases of compilation conversion rate for 1$ is equivalent Taka 58.00.
2.4.6 Annual budget 2003-2004
In June 2003 $9.12 billion budget for 2003-04 was declared, which is a
deficit budget shown in Table 2.7.
Table 2.7 - Annual budget (In billion US$)
Year Income Expenditure Deficit 2003-04 6.34 9.12 2.78
Source: Bangladesh Bank.

6
The deficit of $2.78 billion has been planned for financing with foreign aid,
domestic sources and through borrowing from banks. The main sources of
revenue in this budget are customs duty, income tax and VAT. A total of
$2.07 billion was targeted for collection as tax from import level, which is
about 33% of total revenue earning.
One of the main sources of revenue of the Bangladesh Government is duty
and taxes on import and export cargoes. The revenue collection on import
goods through Chittagong Port is increasing on an average of 13% per year.
On average 30% of the Annual Revenue of Bangladesh comes from import
duty and taxes and the imported goods are handled through Chittagong Port
(see Table 2.8).
Table 2.8-Revenue earning on account of import duty and taxes
(Cargo handled through Chittagong Port)
FY Import Tax and Duty ($million)
Annual revenue ($million)
% of Annual Revenue
1999-2000 1049 3461 30% 2000-2001 1262 4197 32% 2001-2002 1313 4809 27% 2002-2003 1494 5357 28%
Source: Chittagong Customs and compilation
Hence, the importance of the port to the economy is unquestionable.
2.4.7 Foreign currency reserve
The foreign currency reserve is also in a delicate situation, which is less than
three months import value, shown in Table 2.8.
Table 2.9-Foreign currency reserve
Year Foreign Currency Reserve (in million)
% Of Import Value
2000-01 1306.7 15% 2001-02 1582.9 17%
Source: WWW.BANGLADESH-BANK.ORG/ECONDATA
7
With a view to achieve 7% GDP growth rate, the government offers generous
opportunities under its liberalized Industrial Policy and export –oriented, private
sector led growth strategy for rapid industrial development and to encourage direct
foreign investment. The Board of Investment (BOI) has been established for
accelerating private investment and to provide institutional support services to
intending investors. Among other infrastructural and institutional facilities, the
efficient port is one of the vital facilities to attract foreign investment. Therefore, the
port not only facilitates international trade but also helps to improve overall
Bangladesh’s investment and business environment.
2.5 Conclusion
The Bangladesh economy is heavily dependent on import. Though more than half of
the GDP is generated through the service sector, nearly two-thirds of Bangladeshi are
employed in the agricultural sector. The population is increasing at 1.7% per year.
The import value is almost 1.5 times higher than the export value. The import item
ranges from food grain to capital goods whereas export items are limited to a few
items like jute, tea and ready-made garments. The RMG, which faces severe
competition in the world market, still contributes about 76% of the total national
earning. The balance of trade and balance of payment is always negative.
Due to economic, natural and other conditions there is no doubt that the level of
Maritime Dependency Factor (MDF) of Bangladesh cannot be underestimated. The
MDF on average for the last three years is 30%. Economic growth is clearly related
to trade, in particular international trade. Again, international trade is both a cause
and a consequence of economic growth of the country. In this backdrop the question
arises: What is the contribution (direct, indirect and induced impact) of Chittagong
Port to the economy of Bangladesh?
In the next chapter the author will endeavour to analyse the role and the economic
impact of Chittagong Port.

1
CHAPTER 3
Role and functions of the Chittagong Port Authority and its impact on the
economy
3.1 Introduction
The previous section sustained the fact that Bangladesh economy is depending more
and more on seaborne trade as economy expands and industrialization proceeds
while more than 80% of imports and exports are transported by sea. This explains the
importance of the seaport to the process of economic development in Bangladesh and
the dependency of the country on efficient maritime transport links with its major
trading partners.
3.2 History
The history of Chittagong Port dates back to the 4th century B.C. From the 9th to the
15th century Chittagong was known as ‘SHETGANG’, which means ‘Delta of the
Ganges’. During this period this port had sufficient trade with Middle Eastern ports,
China and other South-eastern countries. In the 16th century the Portuguese named it
‘Porte Grande’ meaning a great port. The records show that the Porte Grande offered
easy access and safe anchorage of ships of 20’ draught.
The administrative history of the port began in 1875 with the enactment of Indian
Ports Act 1875 (ActXII). To administer the port of Chittagong a Trust was
constituted during 1887-88 and the Chittagong Port Commissioners Act
1887(Bengal) came into effect from 25th April 1888. The present location of the port
was, however, established in the year 1887. Since then, up to 1910 four jetties were
constructed to handle 0.5 million tons of cargo per year. The Port Commissioners
2
and the Port Railway administered the port jointly. The Port Trust was formed in
1960. The liberation of Bangladesh in 1971 set a new trend in the external trade of
Bangladesh. To cope with the rapid development and massive expansion programme
the government promulgated the Chittagong Port Authority Ordinance in 1976 and
thus the Chittagong Port Authority came into existence.
3.3 Administration
The Chittagong Port Authority (CPA) is a service organization under the
administrative control the of Ministry of Shipping, the Government of the Peoples’
Republic of Bangladesh. The port is managed and run by a ‘Board’ consisting of
Chairman and three members appointed by the government. There are 18
departments (including three projects) headed by one Chief or Director responsible to
the authority. The organizational setup is shown in Appendix B.
3.4 Objectives
The objectives are:
o Provide the highest standard of cargo / container safety and security
while ensuring a navigationally safe haven for ships.
o Strive for a cost–effective service through performance of
international standard.
o Develop a highly trained and motivated workforce to meet the
growing demands of the port industry.
3.5 Functions of the Authority
The functions as stipulated in the port ordinance are to:
o Manage, maintain, improve and develop the port
o Provide and maintain adequate and efficient port services and
facilities in the port or the approaches to the port.

3
o Regulate and control berthing and movement of vessels and
navigation within the port;
o Do such acts and things as may be necessary or convenient to be done
in connection with, or incidental or conducive to, the performance of
its functions under this Ordinance.
3.6 Planned capacity and handling
The planned capacities of CPA are 190,000 TEU and 8,000,000 metric tons of
cargoes. Pilotage is compulsory. Maximum 9.14 m draught and 185 m LOA vessels
can enter into the port channel. There are 15 jetties of which 13 are provided with
shore cranes and railway tracks, 11 are provided with transit sheds. Night navigation
is allowed at a few jetties. Containers are handled from ship to shore by the ship’s
derrick. Details of facilities are shown in Appendix C.
Table 3.1- Import and export cargo handled through CPA
Year Import (Million tons)
Export (Million tons)
Total (Million tons)
Vessels (Numbers)
1999-2000 13.38 1.75 15.13 1,439 2000-2001 14.91 2.00 16.91 1,615 2001-2002 16.09 2.00 18.09 1557 2002-2003 18.32 2.26 20.58 1670
Source: CPA
There is a high correlation between the growth rate of GDP and trade of the country.
Tables 3.1 and 3.2 show that cargo and container handling through the port of
Chittagong increases every year. The average cargo and container growth rate for the
last five years through CPA are 4% & 11% respectively.

4
Table3.2 - Container handled at CPA (in 000)
Export Import Total Year
TEU TEU TEU 1999-2000 205 202 407
2000-2001 248 242 490
2001-2002 249 274 523
2002-2003 279 281 560
Source : CPA
Chittagong Port is ranked 100 in 2001 as shown in the ‘Containerisation
International Yearbook 2003’.
3.7 Port administration model
Chittagong port is a service port as it owns, maintains and operates every available
asset (fixed and mobile) and cargo-handling activities are executed by employing
labour directly. The Ministry of Shipping controls the port authority and the
Chairparson is a civil servant (usually) appointed by and/ or directly reporting to the
ministry concerned. Many ports in developing countries are still managed according
to this model (e.g. India, Sri Lanka) though over the years, the functions of the port
have significantly evolved from the technical tool to the logistical platform and
economic tool.
The function of CPA is only limited to as a first generation port, which is merely,
interface locations for cargo between land and sea transport. The port is isolated from
the trade and transport activities. Since the port handles the captive cargo, it is rarely
concerned about the port user’s needs. Due to absence of marketing culture, the
customers are considered as users and not as clients. From the logistic point of view,
the port is not an active element of the chain. The management is not pro-active but
rather prone to crisis -solving-management.

5
3.8 Finance
CPA is a self-financing organization. The average growth rates of income and
expenditure for the last five years are 11% and 12 % respectively.
Figure 3.1- Income and expenditure of CPA.
Source: CPA overview.
The heads of earning during 2000-2001 consist of port dues on vessels 17.35% and
cargo 81.20% and miscellaneous charges 1.45% whereas, the heads of expenditure
consist of salary and allowances (6%), operating and maintenance expenses (60%),
other charges (15 %) and capital expenditure (21%).
The income of CPA came under the purview of Income Tax from the financial year
1999-2000 through the enactment of Financial Act 2000 and paid $7.55 million for
the financial year 1999-00 and $5.14 million for FY 2000-01. In addition, CPA pays
income tax for its employees about $0.11 million every year. Before the introduction
of corporate tax, CPA cumulatively contributed $56million to the National
Exchequer from 1994-95 to 1999-2000.
A port is a good source of direct foreign currency as some tariff items on cargo and
ship handling are charged in US Dollars. Chittagong Port earned about $42.33
million during 2002-03 on the heads of port dues, pilotage, tug hire charges, berthing
/unberthing charges, water supply, berth/ mooring occupancy, loading/discharging of

6
container and storage charges of container. Table 3.3 shows the direct foreign
currency earning of last three years.
Table 3.3-Foreign currency earning by CPA
Year
Foreign currency earned (million $)
Total earning (million $)
% of total earning
2000-01 38.43 82.24 46%
2001-02 39.05 80.00 49%
2002-03 42.33 85.10 49% Source: CPA
3.9 Cargo and container operation
Generally bulk, break-bulk and container cargoes are handled at the port of
Chittagong. The methods of handling for these kinds of cargoes are also different.
Containerization started during 1976-77 with the handling of 6 boxes. At that time
there was no facility to handle containers. The country has to trade with developed
nations where technological developments are taking place and then transferred to
other countries; CPA has no other alternative but to accept it. To cope with the
changing situation CPA undertook a project named ‘Construction of two multi-
purpose berths with back-up and interim facilities and procurement of cargo handling
equipments’. The foreign currency component of the project was financed by World
Bank loan and Finish Grant .The project was completed and put into full-fledged
operation in 1995. The rapid growth of containerization has surpassed all the
projections. The facilities have become inadequate.
Containers are handled in the General Cargo Berth (GCB) area (1-13 jetties) and in
the Chittagong Container Terminal (CCT). The cargo handling system at CPA
consists of two types: Forklift system and straddle carrier direct system. At the GCB,
a tractor-trailer is used to transfer containers from quay to yard and in the yard
forklifts are used. At CCT straddle carrier system is used for both yard operation as

7
well as transfer between quayside and yards. At CCT, works are done in a two-shift
system (8 hours a shift) with two hours break and 6 hours overtime.
About 35-40% of general import cargoes are delivered from berth /hook especially
food grain, cold rolled coil, galvanized iron sheet, logs, scrap items and cement
clinker.
3.10 Development programme
The Chittagong Port Authority has undertaken development works under a Five-Year
Plan and has implemented the same through the Annual Development Programme
that is approved by the government. It also implements development work on a
limited scale out of its revenue budget. An amount of $3.86 million has been
allocated for 2002-2003 to implement five investment projects. All the development
programmes are carried out from its revenue surplus. Details of development projects
are shown in Appendix D.
3.11 Hinterland and foreland connection
The port is connected by rail, road, river and air with the hinterland. Bulk and break-
bulk cargos are transported by rail, road and river throughout the country. About
40% of the bulk and break bulk cargoes are transported through inland waterways
from outer anchorage or/specialised terminals (oil, grain, fertilizer) including over
side handling.
Figure 3.2- Modal split of cargo Source: CPA
8
However, containers are mainly transported by rail to the capital city- Dhaka on a
limited scale. Adequate facilities have not been developed for inland movement of
containers by all these three modes, which is pre-requisite for door-to-door services
of containers in Bangladesh. There is no facility as yet to carry containers by
waterways. As a result, about 90% of the containers terminate their journey at port
and handled in port premises including completion of customs clearance formalities
putting additional stress on existing port facilities due to multiple handling of
containers. The ratio of FCL and LCL is 3:2.
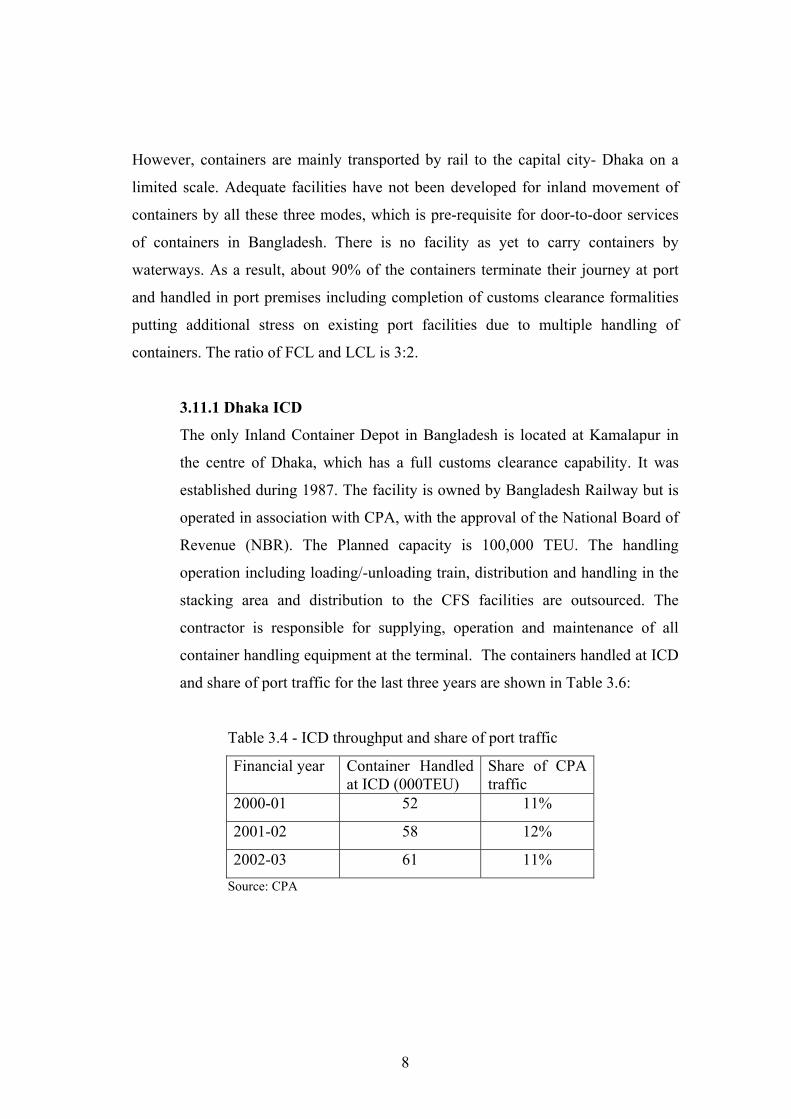
3.11.1 Dhaka ICD
The only Inland Container Depot in Bangladesh is located at Kamalapur in
the centre of Dhaka, which has a full customs clearance capability. It was
established during 1987. The facility is owned by Bangladesh Railway but is
operated in association with CPA, with the approval of the National Board of
Revenue (NBR). The Planned capacity is 100,000 TEU. The handling
operation including loading/-unloading train, distribution and handling in the
stacking area and distribution to the CFS facilities are outsourced. The
contractor is responsible for supplying, operation and maintenance of all
container handling equipment at the terminal. The containers handled at ICD
and share of port traffic for the last three years are shown in Table 3.6:
Table 3.4 - ICD throughput and share of port traffic
Financial year Container Handled at ICD (000TEU)
Share of CPA traffic
2000-01 52 11%
2001-02 58 12%
2002-03 61 11% Source: CPA

9
3.12 Traffic forecast
For assessment of port development, traffic forecasting is very significant. To
forecast the demand for port services, there is a need to predict demand for imports
and supply of exports of at least groups of commodities; these in turn depend on
domestic and foreign supply of demand. The factors that influence the traffic are:
- World seaborne trade and world economy
- Local and regional trade and economy
- Technological developments in maritime field
- Past trends and future influential events
In CPA, traffic forecasting has been worked out during 1995 while preparing the
port master plan. Another forecasting has been done up to 2017 under the project
‘Bangladesh Port System Development Project: Master Plan and trade facilitation
Study’ in 1998. The forecasting needs to be reviewed every year as the national
and international political, economic scenario changes. In Table 3.5 the
summaries of two studies and projection by the author are shown.
Table 3.5 - Container throughput forecast up to 2005 and as
projected in the Master Plan and Study Report (000TEU)
Fiscal
Year
CPA Master
Plan 1995
Port Development
project
By Author
2003-04 473 700 622
2004-05 509 765 690 Source: CPA master plan, 1995, Port system development
Project, 1998 and author’s estimation.
For the mentioned years, 7% and 9% growth rates have been considered in the CPA
Master Plan and Port System Development Project: Master Plan and Trade
Facilitation Study respectively. Considering the present political situation,

10
government policy regarding industrialisation, export and import and development
project, foreign direct investment and the average growth rate of containers the
author estimated an 11% growth rate for next two years.
3.13 SWOT analysis
SWOT analysis is important for the organization while working out long term
and/strategic planning to identify the internal and external strengths and
weaknesses. It will make it possible one to compare the weaknesses to the
opportunities and threats while the organization will take advantage of the
strengths and opportunities to target and position its core competencies. It will
necessarily develop an approach to minimise its weakness whilst findings
antidotes to the threats.
3.13.1 Strengths
- CPA handles more than 80% of the country’s sea borne export and import
trade. Every year the handling is increasing. The average growth rate is about
4% for cargo and 11% for containers.
- It has shorter pilotage distance than Mongla Port and a 9.14-metre draft
vessel can be accommodated.
- CPA is well connected with hinterland by rail, road and river and foreland.
- It is a self-financing organization. It implements all the development projects
from its own source.
- It is a service port. Hence, there is a good chain of command.
- Korean EPZ is being constructed on the opposite bank of the CPA. The
Chittagong Export Processing Zone is also near the limit of CPA.
3.13.2 Weaknesses
- Excessive control of government.
- Labour problems are more severe in CPA. The large numbers of the port
community often create hindrance in the work raising different issues. For

11
example, a militant truck driver can create disorder and even stop the
operational work.
- Deep draught vessels cannot enter into the channel. Ships’ should lighter,
which involves cost and time.
- There is no quay gantry crane. The containers are loaded/ unloaded by ships
derrick.
- As geared vessels are used for container loading/unloading, the capacity of
ships is low and transport cost is high.
- IT based MIS and EDI systems are yet to be developed.
3.13. 3 Opportunities
- CPA is situated at the heart of the city. So there is little scope to expand the
landside. Furthermore, any disturbance and unrest in the city influence port
operation.
- India and Nepal governments have shown keen interest in using Chittagong
Port. If there were bilateral trade agreements between Bangladesh and
neighbouring countries, cargo handling through CPA would be increased.
- CPA has shorter pilotage distance compared to Kolkata and Haldia ports.
- To accommodate bigger vessels (50,000 to 100,000 dwt) berths can be
constructed at Patenga i.e. near the mouth of the Karnafuli.
- ICD and Port Privatization Policy have been placed for government approval.
The government has already given permission to a number of organizations in
Dhaka and Chittagong to operate ICD.
- BIWTA has initiated to implement a project at Khanpure near the capital to
handle inland container vessels.
3.13.4 Threats
- SSA Bangladesh Ltd., a joint venture Co. of Oriental Maritime Ltd. (BD) and
Stevedoring Services of America, has been given permission to establish a
container terminal near Patenga to handle 300,000 TEU per year. If this

12
project is implemented, there would be competition between CPA and SSA
terminal.
- The Kolkata port has a modern dry dock, VTS, and IT based communication
system. During the time of political/ labour unrest CPA suffers from sever
congestion. The CFTC sometimes threatens to declare CPA as ‘Exclusive
Zone’ or impose high surcharges. If it continues, ships may divert their route
to Kolkata.
- Political unrest and government interference severely affects port
performance compared to other regional ports.
3.14 The role of port on the national economy
Raven described the port’s economic role in developing countries as
Because ports play such a catalytic role in economic expansion, we find that
many developing centres, where ports are able to function freely and
efficiently have made particularly rapid progress. Typical examples are
Singapore, Hong Kong, Taiwan and South Korea (As cited in Hee-Seok
1987, p68).
As to the port of Chittagong, due to time limit and lack of information theoretical
analysis is done for port economic impact to quantify the magnitude of the so-called
primary and secondary effects that can be attributed to port activities basically in
terms of added value, employment, salary incomes and taxes. The primary effects,
also known as direct impacts including all activities necessary for the operation and
use of the port facilities; while secondary effects refer to all economic activity of the
area of influence of the port that economically depends on primary activities.

13
In the words of Millan (1999, p.132)
Secondary impact is made up of two kinds of effects: individual and induced.
An indirect effect refer to all economic activities developed in the port region
and depends on the primary activities through a technical relationship, mainly
of buying and selling of goods and/ services. On the other hand, induced
effects refer to all activities that also take place in the port region and that
depends on the direct and indirect effects through consumption linkage. More
specifically, these induced effects include the activities derived from the
consumption payment made possible because of the wages and salaries of
those directly or indirectly employed in some kind of port activity.
Therefore, the port economic impact shows all of the net economic benefits for local
communities to be associated with the existence and operation of the port.
The CPA also acts as the lifeline to the development of commerce and industry of
Bangladesh. “It could be estimated that one in every six job existing in Chittagong
area is directly and indirectly related to the working of this port” (Chittagong Port
Authority, 1987, p.167). The impact to the national economy can be explained as
follows:
3.14.1 Direct impact
-CPA handles about 80% of the country’s foreign trade. It is mainly a captive
user port. During 2002-2003 it handled 0.56 million TEU container, 20.58
million tons of cargo, 1670 sea going vessels.
- During 2002-2003 it earned $85.10 million from all port services including
the cargo and ship handling services and also value added services. This
revenue is about 1.4% of Annual Revenue (2002-2003) of Bangladesh. The

14
value added service by Chittagong Port during 2002-2003 is shown in Table
3.6.
Table 3.6 – Value added service of Chittagong Port (million US$)
Year Salary Tax Profit Total
2002-2003 7.20 8.62 18.00 33.82 Source: CPA
The direct employment opportunity created for port activity is shown in Table
3.7.
Table 3.7 – Employment Opportunity and salary
Category Employment (numbers)
Salary (US$million)
Port Employee 8500 7.20 Dock workers 6200 6.8 Merchant Labours 5300 5.8 Stevedoring Worker 3000 3.3 Total 23000 23.10
Source: CPA and DWMB
-The port handles on an average 1550 sea going vessels. The port earns
revenues not only from the cargo handling service but also from the ship
handling service. On the head of port dues CPA earned $5.03 million during
2002-03.
-The port is also become a significant source of additional foreign exchange
earnings, on top of revenues from export. CPA earns foreign currency from
ship and container handling. With the increase of ships and containers,
foreign currency income is also increasing. During 2002-2003 it earned
$42.33million, which is about 49% of CPA’s total earnings.
3.14.2 Indirect impact
EPZ, cement industry, oil refinery, dry dock, fisheries, truck service, railway,
ICD, Customs, shipping agent, C&F agent, freight forwarder, importers,
exporters, banks, insurance companies benefit directly from the port. Their

15
survival and prosperity depend on the port’s existence, activities and
expansion. These sectors provide job opportunities for millions of people and
contribute to the GDP of the country.
3.14.3 Induced impact
The induced impacts are the effects of the direct and indirect activities on the
other sectors of the economy. Most importantly there is a multiplier effect as
the incomes generated among port professionals take care of expenses, and
these expenditures in turn become revenues to others. “In France and probably
in all the mature economy countries that the induced revenues in other sectors
amount to about 50% of the newly created revenue” (Francou, 2002).
Since, Bangladesh economy is not a mature economy, as it is highly based on
agriculture, the degree of induced impact may be less than 50%; but it is still
remarkable.
3.15 Local economic impact of investment and maintenance
CPA is implementing a numbers of investment projects at a cost of $191 million. A
great portion of the implementation and maintenance cost of those projects will be
spent for local materials (except procurement of equipment), which is about 80% of
the total investment cost. In addition, 1500 employment opportunities will be created
for which $ 1.00 million will be spent on salaries.
The port also improves a nation’s relationship with other countries. Due to
geographic and socio-economic conditions, Chittagong Port has not only played
major role in facilitating foreign and domestic trade but also in providing a place for
industry to be located. Moreover, a major port on its own national territory of a
country is the best possible guarantee of economic and even political independence.

16
3.16 Conclusion
It is obvious that the port is essential for the national development as well as to the
economic well being of the population. This chapter has made the point clear that the
functions of the port have significantly evolved from the technical tool to a logistic
platform, and an economic tool. Therefore, for CPA to be better able to perform its
role, it should evolve from its present status as a mere interface for cargoes between
land and sea transport. Value-added logistics are essential. The fact that the growth
rate of containerization has surpassed statistical projections in itself provides the
necessary milieu for the CPA to look beyond its role as a first generation port. There
are potential benefits to be tapped if the author’s container throughput forecast and a
growth rate of 11% is anything to go by.
However, CPA directly provides about 23,000 employment opportunities (including
dock and stevedoring) and generates per year about 57million dollars as value added,
which is shown in Table 3.8.
Table 3.8 - Direct Impact
Employment 23000 numbers
Value added $56.92 million i.e. $57 million
Source: Compilation from Table3.6 & Table 3.7
During 2002-03 the revenue of CPA is $85.10million, which is almost 1.4% of the
annual income of Bangladesh. Further, in the same year it earns $42.33 million as
direct foreign currency, which is about 1.5% of the deficit trade. Thus, it contributes
to the foreign currency reserve and also balances of payment of the country.
As the port plays a significant role to the economy of Bangladesh in the next chapter
the author will analyse the performance of the port operations to identify the
efficiency of port operations.
1
CHAPTER 4
Performance of Chittagong Port and comparison with other ports
4.1 Introduction
It is obvious that the economy of Bangladesh depends on foreign trade and, further
more Chittagong Port places a significant role as the gateway of the country. The
author will try to identify and compare the performance indicators of CPA with
international standard; focusing on the economic impact and the significance of an
increase in productivity on the port.
Performance indicators are the tools of measurement of the efficiency. The
measurement of efficiency of port operation is important because the cost of ships
and the goods at ports are determining the major part of the maritime transport chain.
“It is said that about 90% of the world total trade in volume terms are moved by sea”
(Ma, 2002,p.11). Therefore, the port plays a vital role in the supply chain but the
question of efficiency and productivity arises. This is simply because port costs today
account for a significant proportion of international sea transport costs. “According
to several studies, it is admitted that 2/3 of the total maritime cost happen in the ports
mainly wharfage, handling and storage” (Francou, 2003,p.3). Besides, cost also
incurred for the time in port and the quality of services in addition to port dues.
Hence, the survival of the port in a competitive market or the economy of the country
in case of monopoly, are determined by the efficiency of the port. “Port performance
indicators show how efficiency is influenced by the infrastructure, layouts,
equipment, storage facilities, work organization and labour policy” (Francou, 2002).

2
The port performance may be categorised as the physical, financial and quality
performance. Again, to measure the performances the indicators are mainly divided
into the following groups:
- Indicators of output (berth output, ship output and gang output),
- Indicators of service (Ship turn around time, grade of waiting time, ship out
turn)
- Indicators of utilization (berth utilisation, equipment utilisation)
- Indicators of quality of service (waiting time, turn-around time, working
hours in the port)
- Indicators of productivity.
The port operation system as indicated by Professor Francou (2002, p.1), consists
of the aquatorium, berthing and information system. The author will mainly
concentrate on the berthing system only. The berthing system has four major
sequences of activities. They are:
Ship operation
Quay transfer operation
Storage operation
Receipt/delivery operation.
These however, can be divided into shipside and landside activities. Ship
operation is concentrated at shipside whereas transfer operation, storage
operation and receipt/ delivery operation are considered landside operations.
Quay transfer operation is both the ship and landside activities. The performance
and efficiency of the port is fully depending on the harmonisation of the above
activities as they are interlinked and inter-dependent. The slow down of one will
inevitably affect the speed of others. “Similarly improvement made on any one
operation will not bring fruit unless corresponding efforts are also made on other

3
operations” (Ma, 2002,p.54). All four operation as mentioned can be seen in the
following figure:
Figure 4.1- Berth operation flow Source: UNCTAD 4.2 Indicators of services
Indicators of services are the measurement of quality services that are provided by
the port to the ship owner. According to Francou (2003, p.9)
This service indicators are useful for the ship owners and the shippers
because the turn-around time the ships spend in ports is paid by the
ship owner and also by the shipper (specially in the case of chartered
ships because he has to pay demurrage).
4.2.1 Ship turn-around time
“Ship turn-around time gives an excellent indication of the speed of service
being provided to ship operators, it is a very important element in Maritime
Transport Costs” (Roach, 1982, unit 2, p.18). Waiting time and service time
constitute the ship turn-around time at port. There is a close relationship
between service time and waiting time. In one example, “A 15% reduction of
service time results in a 45% reduction in waiting time and 28% of
turnaround time” (Francou, 2002, p.9). The ship’s turn-around time at CPA
from 1998-99 to 01-02 are shown in Table 4.1:
Ship Operation
Quay Transfer Operation
Storage Operation
Receipt/Delivery Operation
Road Rail Barge

4
Table 4.1- Turn- around time of vessels
Indicator 1998-99 1999-00 2000-01 2001-02
Turn around time of
vessels (days)
6.49
5.90
6.15
5.10 Source: CPA Overview 2002 & compilation.
During 2001-02 the average turn-around time was decreased. The reasons for
this improvement are the deployment of procured equipment, less stoppage of
working hours by the trade union, fewer strikes called by the political party
and more utilisation of working hours. In Singapore and Bangkok the turn-
around time of ships is only 1 and 2 days respectively in spite of higher
shipload than CPA. The average shipload (container vessel) at CPA during
2002-2003 is 874 TEU.
It is evident that ship turn-around time at Chittagong Port is very high. Hence,
it is heavily congested. Ship owners prefer the shortest turn-around time
because their profits are highly influenced by the time spent in port. The ship
earns when it makes a voyage. It takes 4 days voyage from Singapore and
from Colombo to Chittagong Port and vice versa. However, average turn-
around time for the last five years is 6 days at CPA.
Based on Francou (2003,p.2) “time in port is approximately 18% of
distribution of port expenses” (see figure 4.2).
Figure 4.2- Distributions of port expenses Source: Lecture Notes, Bernard Francou.
5
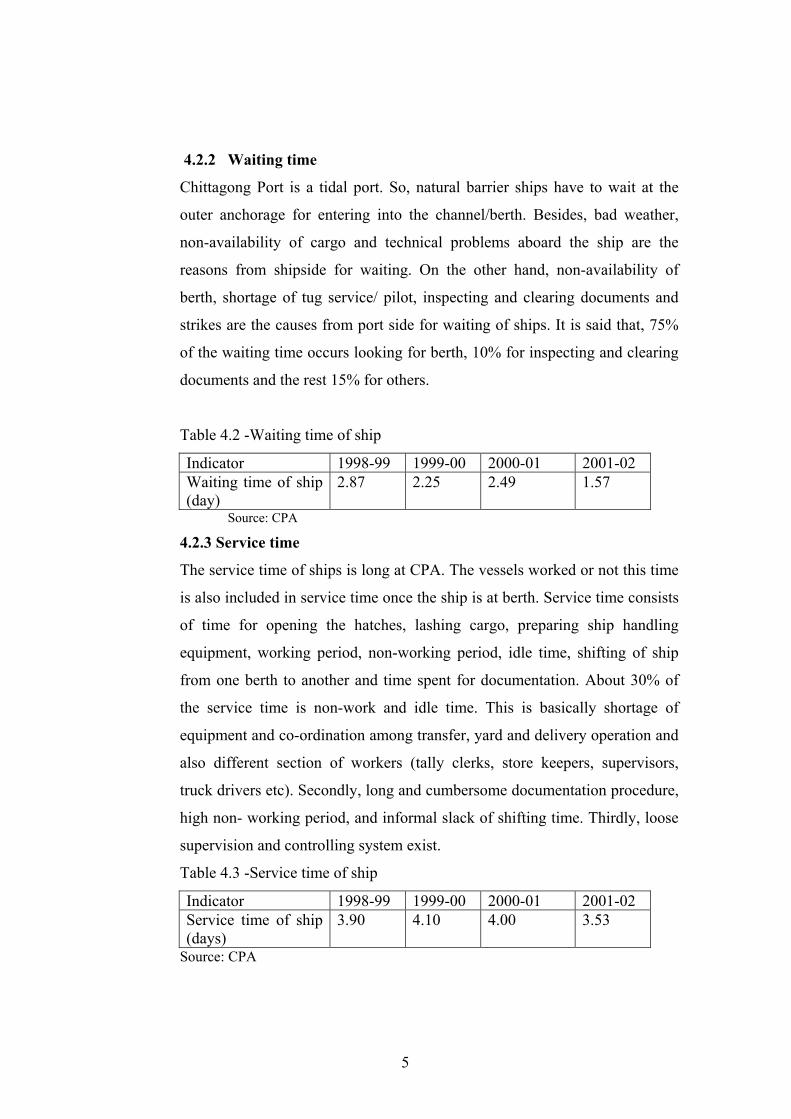
4.2.2 Waiting time
Chittagong Port is a tidal port. So, natural barrier ships have to wait at the
outer anchorage for entering into the channel/berth. Besides, bad weather,
non-availability of cargo and technical problems aboard the ship are the
reasons from shipside for waiting. On the other hand, non-availability of
berth, shortage of tug service/ pilot, inspecting and clearing documents and
strikes are the causes from port side for waiting of ships. It is said that, 75%
of the waiting time occurs looking for berth, 10% for inspecting and clearing
documents and the rest 15% for others.
Table 4.2 -Waiting time of ship
Indicator 1998-99 1999-00 2000-01 2001-02 Waiting time of ship (day)
2.87 2.25 2.49 1.57
Source: CPA
4.2.3 Service time
The service time of ships is long at CPA. The vessels worked or not this time
is also included in service time once the ship is at berth. Service time consists
of time for opening the hatches, lashing cargo, preparing ship handling
equipment, working period, non-working period, idle time, shifting of ship
from one berth to another and time spent for documentation. About 30% of
the service time is non-work and idle time. This is basically shortage of
equipment and co-ordination among transfer, yard and delivery operation and
also different section of workers (tally clerks, store keepers, supervisors,
truck drivers etc). Secondly, long and cumbersome documentation procedure,
high non- working period, and informal slack of shifting time. Thirdly, loose
supervision and controlling system exist.
Table 4.3 -Service time of ship
Indicator 1998-99 1999-00 2000-01 2001-02 Service time of ship (days)
3.90 4.10 4.00 3.53
Source: CPA

6
4.2.4 Grade of waiting time
For evaluating the quality a of port ship owners use the grade of waiting time.
In the words of Francou (2003, p.10)
The comparison of the waiting time with the service time gives a good
information about what is acceptable by ship owners; they usually
accept 10% rate for bulk and general cargo vessels; beyond this rate,
they consider the port as a low quality one. For Ro/Ro and container
ships, ship owner do usually not accept any waiting time.
Table 4.4-Grade of waiting time
Indicator 1998-99 1999-00 2000-01 2001-02
W ratio 74% 55% 62% 44%
Source: CPA Overview 2002 & compilation.
During 2001-02 the waiting time of CPA decreased dramatically by 1.05
days. As the availability of transfer handling equipment increased from 45%
to 59%, the berth occupancy ratio decreased from 87.30% to 63.51%;
consequently, the service time decreased 4 days to 3.53 days and the turn-
around time has come down to 5.10 days. During this period the grade of
waiting time is 44%. However, the average grade waiting time is very high at
Chittagong Port.
4.3 Berth utilization indicators
Berth utilization is the possibilities of maximum usage of berth by using different
means and the best techniques. The efficient berth utilization depends on good
7
planning and co-ordination of resources and facilities. Berth utilization embraces
berth occupancy and berth working time.
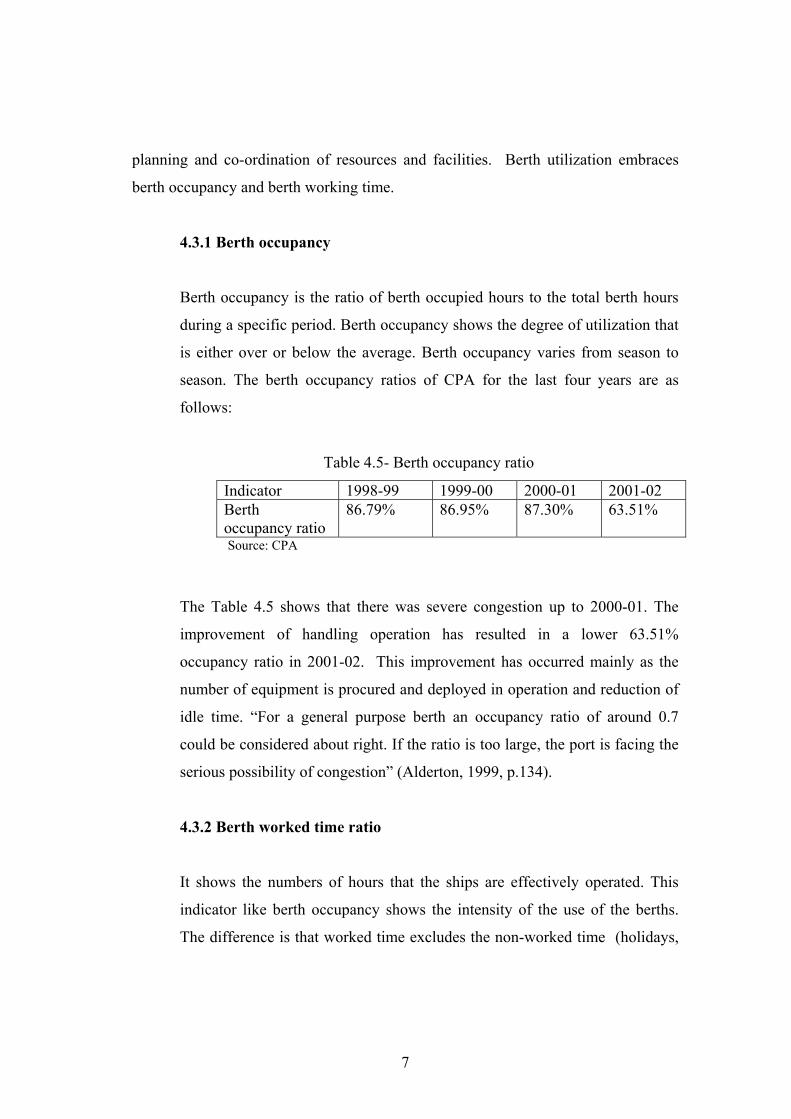
4.3.1 Berth occupancy
Berth occupancy is the ratio of berth occupied hours to the total berth hours
during a specific period. Berth occupancy shows the degree of utilization that
is either over or below the average. Berth occupancy varies from season to
season. The berth occupancy ratios of CPA for the last four years are as
follows:
Table 4.5- Berth occupancy ratio
Indicator 1998-99 1999-00 2000-01 2001-02 Berth occupancy ratio
86.79% 86.95% 87.30% 63.51%
Source: CPA
The Table 4.5 shows that there was severe congestion up to 2000-01. The
improvement of handling operation has resulted in a lower 63.51%
occupancy ratio in 2001-02. This improvement has occurred mainly as the
number of equipment is procured and deployed in operation and reduction of
idle time. “For a general purpose berth an occupancy ratio of around 0.7
could be considered about right. If the ratio is too large, the port is facing the
serious possibility of congestion” (Alderton, 1999, p.134).
4.3.2 Berth worked time ratio
It shows the numbers of hours that the ships are effectively operated. This
indicator like berth occupancy shows the intensity of the use of the berths.
The difference is that worked time excludes the non-worked time (holidays,

8
idle time, night time) and non-operational time such as shifting slack and
meal break. The ship service time at CPA is shown in figure 4.3:
Figure 4.3- Ship service time Source: CPA
At Chittagong Port the berth worked time ratio is about 75%. On average the
port works 18 hours. It shows high idle time during the operation. Idle time
occurs for tea break, meal break (lunch and dinner). Monsoon weather badly
hampers working hour productivity, which is about 5-5.5 months per year.
Moreover, the dock labourers maintenance go-slow on and off without any
prior notice on a trifling matters.
4.4 Handling indicators
4.4.1 Berth output
Berth output is the total quantity of cargo handled at a berth throughout the
year. This indicator is very useful for the port planner because it assists in
evaluating the performance of each berth and determining port capacity.
During 2002-2003 a total of 0.56 million TEU of containers and 20.58
million of cargoes were handled. About 50% containers are handled in the
CCT where the berth is 450m long berths, where two-sea going and one
inland vessels can be accommodated at a time. In general cargo berths (1-13)
all types of cargo are handled including container (bulk dry, drums, bags,
rolls, bales, logs, container). Again various types of vessels are handled at
GCB (e.g. conventional, bagged cargo carrier, bulk carrier, general cargo
Ship time at berth
Non-working time (25%)
Berth working time
Idle time (10%)
Operational time
9
carrier and Ro/Ro, feeder). The vessels that called at CPA are on average 15
years old.
Table 4.6- Container handled at CCT and GCB
Year CCT (TEU) GCB (TEU)
2002-2003 0.29 million 0.27 million Source:CPA
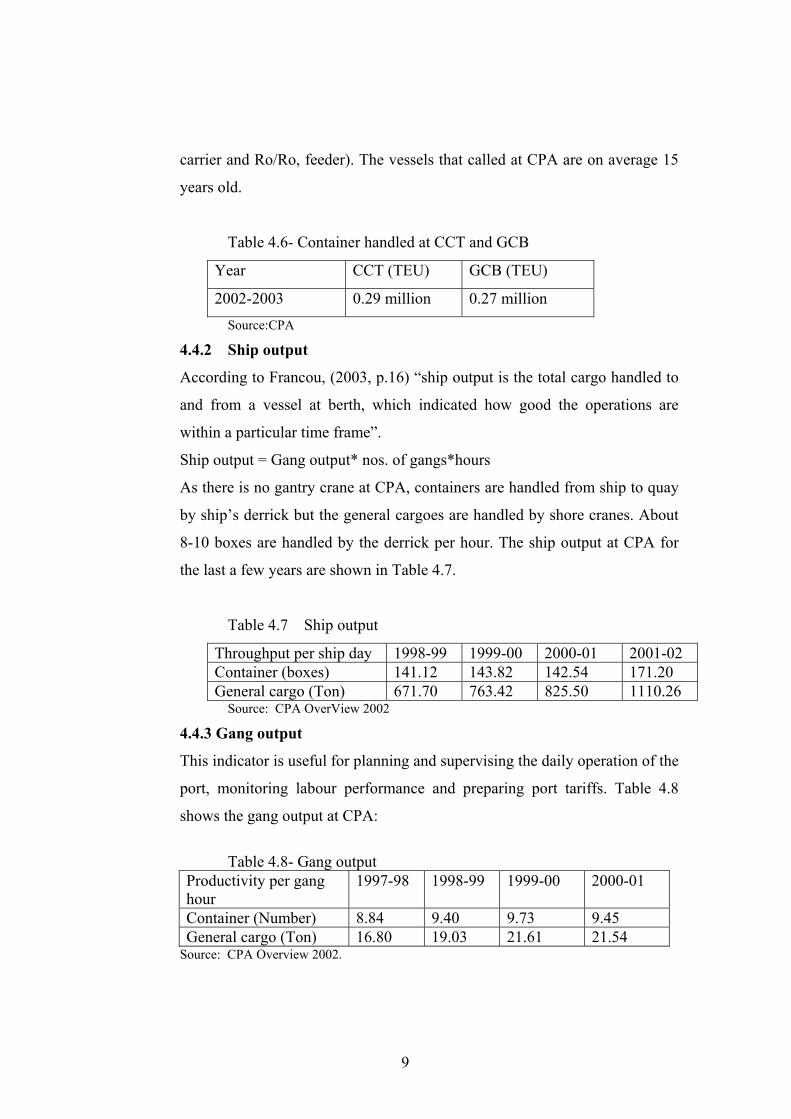
4.4.2 Ship output
According to Francou, (2003, p.16) “ship output is the total cargo handled to
and from a vessel at berth, which indicated how good the operations are
within a particular time frame”.
Ship output = Gang output* nos. of gangs*hours
As there is no gantry crane at CPA, containers are handled from ship to quay
by ship’s derrick but the general cargoes are handled by shore cranes. About
8-10 boxes are handled by the derrick per hour. The ship output at CPA for
the last a few years are shown in Table 4.7.
Table 4.7 Ship output
Throughput per ship day 1998-99 1999-00 2000-01 2001-02 Container (boxes) 141.12 143.82 142.54 171.20 General cargo (Ton) 671.70 763.42 825.50 1110.26
Source: CPA OverView 2002
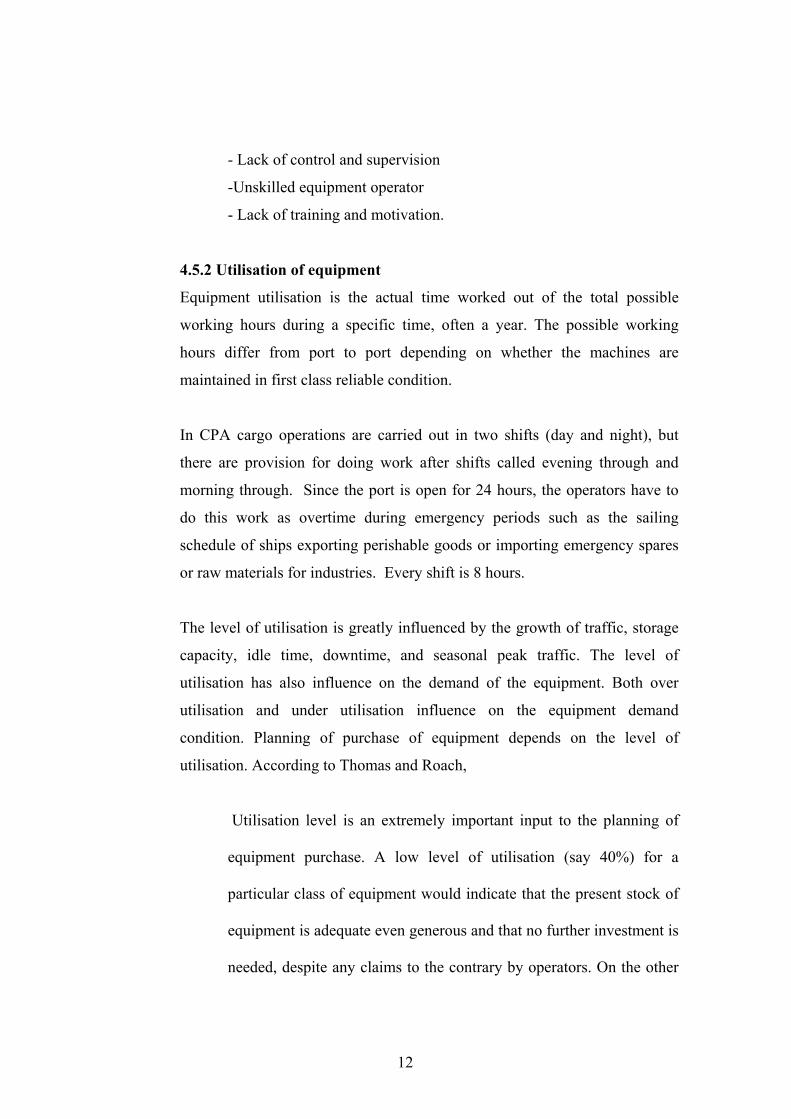
4.4.3 Gang output
This indicator is useful for planning and supervising the daily operation of the
port, monitoring labour performance and preparing port tariffs. Table 4.8
shows the gang output at CPA:
Table 4.8- Gang output
Productivity per gang hour
1997-98 1998-99 1999-00 2000-01
Container (Number) 8.84 9.40 9.73 9.45 General cargo (Ton) 16.80 19.03 21.61 21.54
Source: CPA Overview 2002.

10
Numbers of gang size differs from cargo category. In the absence of quay
gantry crane, containers are handled by ships derrick. Hence, the gang out put
is low.
The gang output and per crane output of JNP, Colombo and Singapore port in
1998 were:
Table 4.9-Gang and ship output of JNP, Colombo and Singapore
Port Country Boxes per ship hour
Boxes per crane hour
Juwaharial India - 15 Colombo Sri Lanka 20-24 26 Singapore 69 36
Source: Alderton, P. (1999, p.201).
4.5 Equipment utilization and availability
Day by day the port operations depend on the sophisticated handling equipment.
Because of the technological development in shipping and the consequential changes
to cargo handling, methods have compelled the port to purchase large quantities of
specialised, high capacity and complex cargo handling equipment. Hence, the
significance of the equipment availability to the port’s performance is
unquestionable.
The availability of equipment is the time when the equipment is ready for work or
use. The formula for availability is the total possible hours minus the down time,
availability of equipment depends upon the down time rate. The higher the
downtime, the lower the availability. The sufficient availability of equipment is the
best way for flexibility and high utilization because the utilisation is mainly
depending on using the right type of equipment, sufficient number of units and good
utilisation of its use. The equipment availability statistics of CPA for the last a few
years is shown in Table 4.10:

11
Table 4.10- Equipment availability
Indicator 1998-99 1999-2000 2000-01 2001-02
Equipment availability 52.72% 48.87% 45.24% 59.26% Source: CPA
It is clear that the equipment availability rate at CPA is very low. The standard rate is
above 90%. The low availability of all sorts of handling equipment causes low ship
handling operation and quay transfer operation consequently ship congestion at berth
and cargo congestion on the quay, shed and yard.
Due to lack of sufficient equipment and systematic operational procedure and multi
handling of containers, the equipment is over utilised. Hence, proper operation
maintenance, preventive maintenance is not done.
4.5.1 Downtime
It is estimated that the downtime of equipment at CPA is about 40%. The
downtime of equipment varies from one type of equipment to another and
even within the same type of equipment.
Details of equipment downtime, availability and utilization of container
handling equipment are shown in Appendix F. The statistics shows that the
container handling equipment are in a better position than general cargo
handling equipment but still much below the standard -85-90% for straddle
carries, 90% for forklifts (Thomas & Roach, 1993). Again, both types of
equipment have considerable downtime. The causes of downtime are:
- Poor equipment inventory
- Too much old equipment
- No standard of maintenance
- Non-availability of spares
12
- Lack of control and supervision
-Unskilled equipment operator
- Lack of training and motivation.
4.5.2 Utilisation of equipment
Equipment utilisation is the actual time worked out of the total possible
working hours during a specific time, often a year. The possible working
hours differ from port to port depending on whether the machines are
maintained in first class reliable condition.
In CPA cargo operations are carried out in two shifts (day and night), but
there are provision for doing work after shifts called evening through and
morning through. Since the port is open for 24 hours, the operators have to
do this work as overtime during emergency periods such as the sailing
schedule of ships exporting perishable goods or importing emergency spares
or raw materials for industries. Every shift is 8 hours.
The level of utilisation is greatly influenced by the growth of traffic, storage
capacity, idle time, downtime, and seasonal peak traffic. The level of
utilisation has also influence on the demand of the equipment. Both over
utilisation and under utilisation influence on the equipment demand
condition. Planning of purchase of equipment depends on the level of
utilisation. According to Thomas and Roach,
Utilisation level is an extremely important input to the planning of
equipment purchase. A low level of utilisation (say 40%) for a
particular class of equipment would indicate that the present stock of
equipment is adequate even generous and that no further investment is
needed, despite any claims to the contrary by operators. On the other

13
hand, a high average utilisation (80%) would support any request for
additional machines’ (Thomas and Roach, 1982. 1989,p.50).
The average utilization of equipment is around 45%. Poor utilisation of some
of the equipment categories for container and general cargo handling
equipment is due to excessive idle time. Idle time is the available hours that
are lost due to administrative procedures, bad weather, spending more time
by the operators and labourers for lunch/ dinner/ tea break/ praying.
Table 4.11 shows that the demand for equipment is always higher than the
supply at CPA. That means the port is not able to satisfy the customer’s
requirement of the equipment.
Table 4.11-Demand availability of container handling equipment, July–
Dec.2002
Equipment type Capacity Total demanded Total Supplied % Availability Hours Hours against demandStraddle Carrier 35 ton 217972 151600 69.55 Reach Stacker 45 ton 31903 16695 52.33 Forklift Truck 38-42 ton 51760 28655 55.36 Forklift Truck 32-35 ton 14991 7752 51.71 Forklift Truck 25-28 ton 40247 19850 49.32 Reach Stacker 7 ton 67995 48476 71.29 Empty handler 9-16 ton 83608 54212 64.84 Tractor 50 ton 337827 203102 60.12 Trailer 20'-40' 532476 294566 55.32
Source: CPA
Some remarkable reasons for the disposition of demand and supply are:
- High downtime
- High immobilisation time, which occurred due to incompetent/ lack of
supervision and co-ordination of the equipment and labourers.
- Lack of appropriate planning in deployment of equipment.

14
- Scattered yard and berth layout plan.
4.6 Storage indicator
Ports are not only gateways for international trade but also consolidation and
distribution centres. A high proportion of cargo passes through storage in the ports at
either end of the sea leg. “The efficiency of the storage operation has a considerable
influence on cargo handling performance at berth and on berth throughput” (Horck,
2003, p.18). Hence, storage operation provides a buffer between the ship and
receiving/delivery operation.
A good controlling and management of storage operations plays a considerable role
to maximise the ability of storage and saves the port from congestion. Again, the
efficiency of storage operations depends on the lay out of the yard /shed, equipment
availability and documentation procedure and above all the co-ordination of the four
operations (ship, transfer, storage, receipt/delivery operation).
Chittagong Port provides transit sheds of 52069 sq. m., warehouses of 26,746 sq. m.,
car shed 5,082 sq. m., and open dump of 90,000sq. m. The port has container freight
station of 98,868 sq. m. for stripping and un-stripping containers. The holding
capacity of the yards is 16,065 TEU. In addition, it has 210 reefer points for the
refrigerated containers.
According to UNCTAD publication “the realistic free storage period is in between 3
to 5 days” (Roach, 1982, unit 5, p. 59).
It is the author’s view that, the transit sheds and warehouses are under utilised, as the
vertical space is not used properly because the storage work is done manually.
Though officially it is occupied more that 90%. Captain Horck rightly said, “A better
way to increase the storage capacity is to better use the vertical space and use
appropriate equipment for the stowage” (Horck, 2003, p.21).

15
4.6.1 Dwell time
Dwell time is the time that cargo spends in storage. With the increase
of dwell time of cargo/ container the storage capacity of yard/ shed
decreases and vice versa. During the peak period ground balance is
much higher than the normal capacity. Hence, at times the port faces
over capacity that creates congestion for containers and other traffic.
All LCL containers including 90% of the FCL containers are
stripped/un stripped and delivered/received in break form inside the
port. The other main causes of high dwell time are the delay on
account of customs documentation. Customs in the port require many
formalities and much paper work to be completed for inspection of
different types of cargoes. The working time of the customs does not
conform to port operations. Port operations go on 24 hours but
customs officials appraise the container from 10 to 13 hours though
the official work time is from 9 to 17 hours. Besides, container
appraisal is done manually in the absence of a scanning machine. The
average dwell time of import containers at Chittagong Port is 25 days,
which is very long. This is shown in Table 4.12.
Table 4.12-Average Dwell time of containers in CPA
Container status Dwell time (days) Import LCL & FCL Container 25.04 Import Empty Container 25.61 Export LCL Container 5 Export FCL Container 3
Source: CPA
4.7 Quality of service indicator
Like the physical service indicator, the quality service indicators are also important.
At present, ship owners are more interested in and giving priority to the indicators of

16
quality of service. The quantifiable quality of services is waiting time, turn-around
time, handling productivity, storage grace period and working hours in port. The
flexibility and indicators are the other measurements of quality of service. Again the
flexibility indicator also consists of flexible working hours and punctuality. The
reliability indicator also consists of work liability, security and commercial climate.
4.7.1 The working hours
“The co-ordination of administrative and physical operations is one type of
efficiency. The target is the simultaneous opening hours for all the services”
(Francou, 2003,p.26). Generally port operations (ship and transfer operation)
are open for 24 hours. Storage operation is done only during daytime from
8.00hrs to 17.00hrs. Delivery operation for FCL container runs 24hrs.
(Including special night permission), while the LCL container delivery
operation and general cargo delivery operation runs from 8.00hrs to 16hrs.
Officially there are 5.5 working days (Saturday to Wednesday and Thursday
up to 1300hrs.). Based on Table 4.13, CPA has average opening hours of 14.4
and a ratio of non co-ordinated hours of 2, which is in effect low. On the
other hand, CPA has 8.00 hours co-ordinated working time with other
organizations like banks, customs, insurance companies which are becoming
increasingly unacceptable for shipping agents, principals, freight forwarders
and shippers/ consignees who are working hard to catch up with countries
with different time zones.
Table 4.13-CPA opening hours as compared to non-co-ordinating hours
Service Opening Hours Non-co-ordinated hours Tugging/pilotage 0-24 0 Handling 0-24 0 Custom clearance 9-17 16 Delivery/receipt 9-17 16 Port Office 9-17 16 Average/24hours 14.4
Source: CPA

17
4.8 Reliability indicator The security for ships and cargoes is essential for ship-owner and shippers. CPA
renders services as bailey for goods under certain terms and conditions. Further, the
security of ship is also a burning question these days. Statistics shows that piracy has
been increasing. “26 incidents of piracy occurred in the vicinity of Chittagong Port
during 2001” (Independent, 8th June 2003). Generally, loose gears like rope, paints,
and zinc anodes are the common articles robbed by the pirates in the Bangladesh
territorial waters. In addition, pilferage within the port-protected area is also rampant.
As CFS is located inside the port-protected area, its activity is dependent on
labourers so many unregistered labourers are also employed. This militant labourers
cause many accidents, crimes and smuggling of cargo. There is no modern security
logistics at (close circuit camera, proper illumination) CPA.
4.9 Financial indicators
CPA is a self-financing organisation. After 2000 all the development projects have
been implemented from its own resources. The tariff was revised last in 1986.
Though CPA introduced cost-based tariffs, it could not be revised for a long period
due to government’s apathy on this matter. It does not receive subsidy from
government. Instead, foreign aid/loans are on lent to the CPA for repayment at the
interest rate 11%. It is not that CPA is performing well but due to its monopolistic
situation and the volume of handling is increasing successively hence, making profit.
The financial indicators are shown in Table 4.14 indicates the sound financial
position of the organization:

18
Table 4.14- Financial indicators
A. Capital Structure and liquidity ratio
1997-98 1998-99 1999-00
Debt Equity Ratio 0.31:1 0.28:1 0.19:1 Current Ratio 1.32:1 1.52:1 1.21:1 Quick Assets Ratio 1.09:1 1.20:1 0.94:1 B. Productivity Ratio Turnover of total Assets (Time) 0.16 0.16 0.16 Turnover of working Capital (Time)
9.88 6.14 12.56
Source: CPA
4.10 The information system
There is no proper MIS at CPA though it started to computerise financial accounting,
fixed asset accounting, payroll and store inventory in 1986. Computers are being
used in sheds to produce bills but without a network system. Information is to be
transferred out by diskettes. It is imperative to build a good computerised port
operation systems and computer net work systems with customs, shipping lines, bank
and freight forwarder. “As soon as the annual throughput overpasses 20,000
containers, computers should be used” (Francou & Alderton, 2003, p.28). Hence,
computerisation is imperative.
4.11 Comparison with other ports
No two ports in the world are identical, neither physical features nor political,
economic, social even technical aspects. Port comparison is an important aspect in
the competitive field of the port industry by which a port can evaluate its
performance in order to improve its overall activities. It is not only a very useful but
also indispensable tool in medium and long term planning, strategic planning, setting
marketing objectives or management control and evaluating port organization.
4.11.1 Local port
The other seaport of Bangladesh is Mongla Port Authority, which is also a
state owned service organization. The geographical location of CPA is better

19
than MPA as compared on the basis of pilotage distance from sea and
hinterland connection. Besides, at MPA, the depth of water at the jetty is
limited to 7.0 m., poor rail and road connection with Mongla Port to the
capital and north and east of the country. The working environment, working
hours, labour costs, operating cost, tariff structure, labour and political unrest
and government interference in different activities are almost identical in both
the ports. During 2002, the MPA handled 3.93 million tons of cargo and
18,684 TEU containers, which is about 20% of the cargo and about 4% of the
container handled by CPA.
4.11.2 Regional port
As Chittagong Port is located in South Asia, the comparison should be done
with the ports of this region. For this, the ports of the neighbouring country
such as India (Kolkata Port) has been chosen. The location of the Chittagong
Port is shown in the map (Appendix F).
Among all the neighbouring ports Kolkata Port can be a competitor of CPA
in near future. Kolkata Port serves the north-eastern part of India. The
geographical position indicates that it would be cost effective if the cargo
were handled at CPA and transported by road/ rail to Asam, Tripura including
West Bangal. It is said that it takes about 10-15 days takes to transport a
consignment from Kolkata to Tripura, whereas it would take only 2/3 days to
transport cargoes from Chittagong Port to Tripura. In various forums and
meeting the Indian delegates expressed their willingness to use Chittagong
port.
Kolkata and CPA are located at almost equal distance from the East-West
main route. CPA has some advantages over the Kolkata Port Trust. They are:
- CPA has shorter pilotage distance than Kolkata.

20
-Bigger and more draught vessel can be accommodated
-Good communication and shorter distance with some parts of India.
-CPA handles about 2 times more containers than Kolkata.
During 2001-2002 Kolkata Port handled 30.04 million tons of cargo
(including coastal and transhipment cargo for Nepal and Bhutan) and 190,995
TEU containers.
The performance indicators of Kolkata Port Trust for 2001-2002 are shown in
Table 4.:
Table 4.15 -Performance Indicators of Kolkata Port Trust for 2001-2002
Indicators Kolkata Dock Haldia Dock Turn around time (days) 4.71 4.01 Pre-berthing detention (days) 0.58 0.91 BOR 38.01% 74.05% Output per shipday (Tons) 2215 6207 Productivity per hook shift–Container 48TEU 32TEU*
Source: http://www.portofcalcutta./com/ Note- Ship’s crane. 4.12 Projection of container port capacity in Indian subcontinent Due to its strategic geographical location, Colombo has become the regional hub
port. It has all modern facilities for all types of vessels and cargo. As a regional
shipping centre, Chittagong and other regional ports have regular feeder services
with Colombo. The Indian ports like Mumbai, Chennai/ Madras and JNPT have
modern handling facilities but still Colombo is in the leading position. Chittagong
Port can serve only the first generation vessel and is still not equipped with proper
infrastructure and super-structure facilities to serve ships and cargo. The regional
port capacity up to 2005 as estimated by Ocean Shipping Consultants LTD. is shown
in Table 4.16.

21
Table 4.16-Future container port capacity in Indian subcontinent (000TEU)
Ports 2003 2004 2005 India 4370 4870 5370 Pakistan 1780 1780 2030 Sri Lanka 2200 2650 4650 Bangladesh 450 450 450 Percentage India 49.66 49.95 42.96 Pakistan 20.33 18.26 16.24 Sri Lanka 25.00 27.18 37.20 Bangladesh 5.11 4.63 3.60
Source: Ocean shipping consultants, 1999. 4.13 Conclusion From the analysis it is clear that the performance of CPA is low, as the average turn
around time is 6 days, grade of waiting time is more than 10%, berth worked time
ratio is 75% and equipment down time is 40%, utilization is around 45% and
availability is 59.26%. All these indicate that there is congestion the in shipping and
cargo side. Toru Shibuichi, ADB country Director for Bangladesh commented,
“Chittagong Port is heavily congested and poorly managed, and turn-around time for
a feeder vessel is 6-10 days against only 1-2 days in Singapore and Bangkok”
(Fairplay, 10th July, 2003). Though the port contributes directly and indirectly to the
economy, it also causes severe drain in the form of congestion.
Several logical conclusions can be made based on the analysis in this chapter. It is
evident that, the deployment of procured equipment, less political unrest and the
holistic approach to observing stricter working hours would improve the turn-around
time. The profound effect on the berth occupancy ratio and perceived improvements
in waiting time of CPA by 1.05 days during 2001-2002 is the attendant benefit
derived from improved work indicators.
Notwithstanding the above, it is evident from this work that positive effects on
performance through utilization of such equipment is unquestionable. From the
foregone analysis, one would also have to reckon the fact that performance at CPA
22
cannot be improved overnight unless there is a concerted effort at tackling other
service problems specially storage of general cargo and long dwell time of the
container. It is the author’s view that vertical space in storage would have to be
utilised through the adoption of a mechanised handling system as against the manual
method and high tier of stacking containers. The role of Bangladesh customs cannot
be over emphasised as well as the provision of a computerised network system that
links the entire function and port users.
In the next chapter the author will try to work out the efficiency benefit or
inefficiency cost of port operations to the economy of Bangladesh.

1
CHAPTER 5
Impact of port performance on Bangladesh economy 5.1 Introduction There is no denying the facts that Bangladesh economy heavily depends on import
and more than 80% of the international trade are transported through Chittagong
Port. The maritime dependency factor on average is 30%. Hence, any operational
improvement has certainly an impact on the ultimate consumer.
In the previous chapters various performance indicators of CPA were analysed,
which shows that the performance of CPA is far below the standard. In this chapter
the author will try to work out the cost of efficiency to the economy arising out of
CPA’s performance. For this purpose the two main indicators i.e. turn-around time of
ship and dwell time of cargo have been taken into consideration because the port
faces congestion from both shipside and cargo side.
The ship earns when it sails. In the case of liner shipping the conference recovers its
ships’ cost (for congestion) by imposing congestion surcharge and higher freight
rates quoted in conference tariffs whereas, for chartered vessels the charterer has to
pay demurrage for the delay. On the other hand, the shippers suffer through the direct
cost of delay in shipment, the loss of goodwill in his trade, documentary problems,
higher shipping charges and ultimately loss of business. At the end of the day, all
these excess costs of import shift to the final consumer. On the other hand, due to
competition the exporter has no choice but to reduce his profit margin. Hence,
import prices of the goods become high and the nation suffers through delays in
obtaining materials for industry or for development projects. The author endeavours
to work out the cost to the ship for the long turn-around time and loss of opportunity
cost due to long dwell time of cargo at CPA.

2
5.2 Efficiency benefit to ship for 2001-2002
During 2001-02 the average turn-around time was improved 1.05 days in
comparison to previous year. Hence, savings to the ship is about $15 million,
which is shown in Table 5.1:
Table 5.1-Savings to ship due to improve turn-around time (2001-2002)
Assumptions Average daily cost of ship US$9000 % of Chartered vessel 40% (623 nos.) % of Liner vessel 60% (934nos) Total ship handled during 2001-02
1557
Turn-around time in 2001-2002 5.10 days Turn-around time in 2000-2001 6.15 days Calculation Ship days saved per call (6.15-5.10)=1.05 days Savings to the Liner $9000*1.05*934=$8.80 million Savings to the Charterer $5.91 million Total Savings to ship $14.71 million i.e., $15million
5.3 Inefficiency cost to ship and cargo
5.3.1 Cost to ship
For the last five years the average turn-around time of vessel is 6 days. If
considering average turnaround time should be two days (like Bangkok)
instead of 6 days, then the ship owner could save about $56 million per year,
which is shown in Table 5.2:
Table5.2 Per year inefficiency cost to ship
Assumptions Average number of ship handled 1550 Average daily cost of ship US$9000 Average turn-around time for the last five years 6 days Calculation Ship days saved (6-2)days=4 days Total cost to ship for 4 days more per year $55.80 million
i.e. $56 million
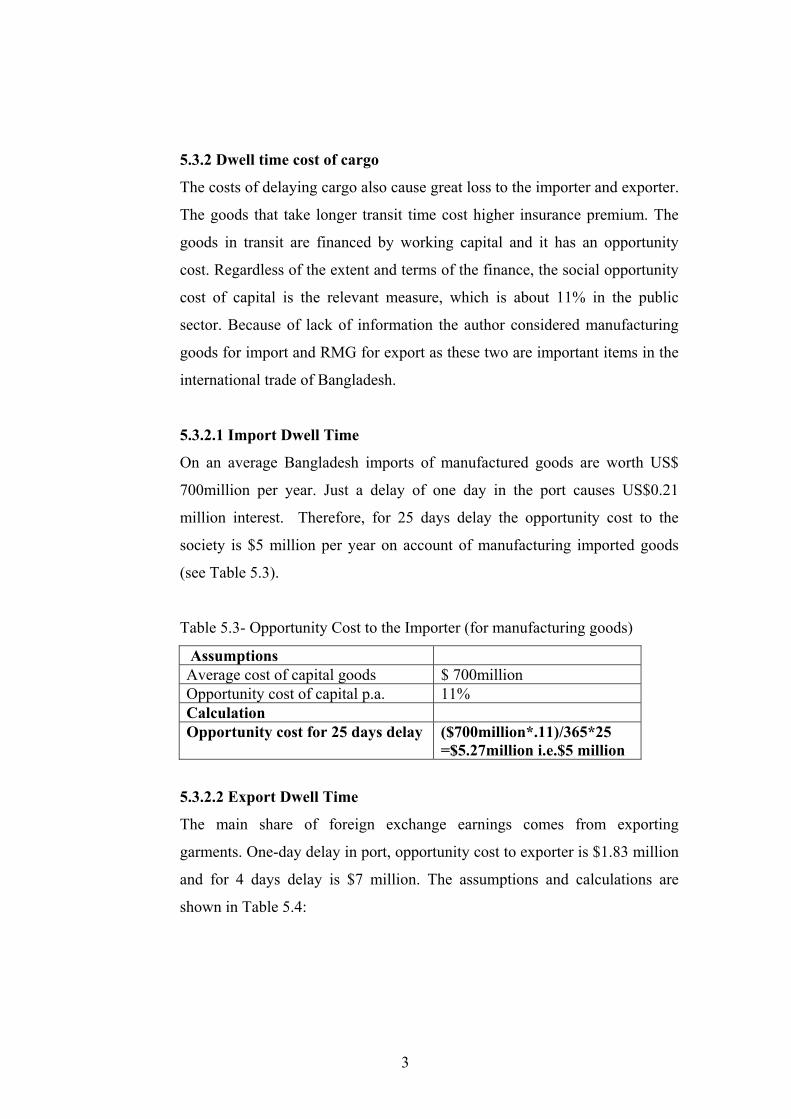
3
5.3.2 Dwell time cost of cargo
The costs of delaying cargo also cause great loss to the importer and exporter.
The goods that take longer transit time cost higher insurance premium. The
goods in transit are financed by working capital and it has an opportunity
cost. Regardless of the extent and terms of the finance, the social opportunity
cost of capital is the relevant measure, which is about 11% in the public
sector. Because of lack of information the author considered manufacturing
goods for import and RMG for export as these two are important items in the
international trade of Bangladesh.
5.3.2.1 Import Dwell Time
On an average Bangladesh imports of manufactured goods are worth US$
700million per year. Just a delay of one day in the port causes US$0.21
million interest. Therefore, for 25 days delay the opportunity cost to the
society is $5 million per year on account of manufacturing imported goods
(see Table 5.3).
Table 5.3- Opportunity Cost to the Importer (for manufacturing goods)
Assumptions Average cost of capital goods $ 700million Opportunity cost of capital p.a. 11% Calculation Opportunity cost for 25 days delay ($700million*.11)/365*25
=$5.27million i.e.$5 million
5.3.2.2 Export Dwell Time
The main share of foreign exchange earnings comes from exporting
garments. One-day delay in port, opportunity cost to exporter is $1.83 million
and for 4 days delay is $7 million. The assumptions and calculations are
shown in Table 5.4:
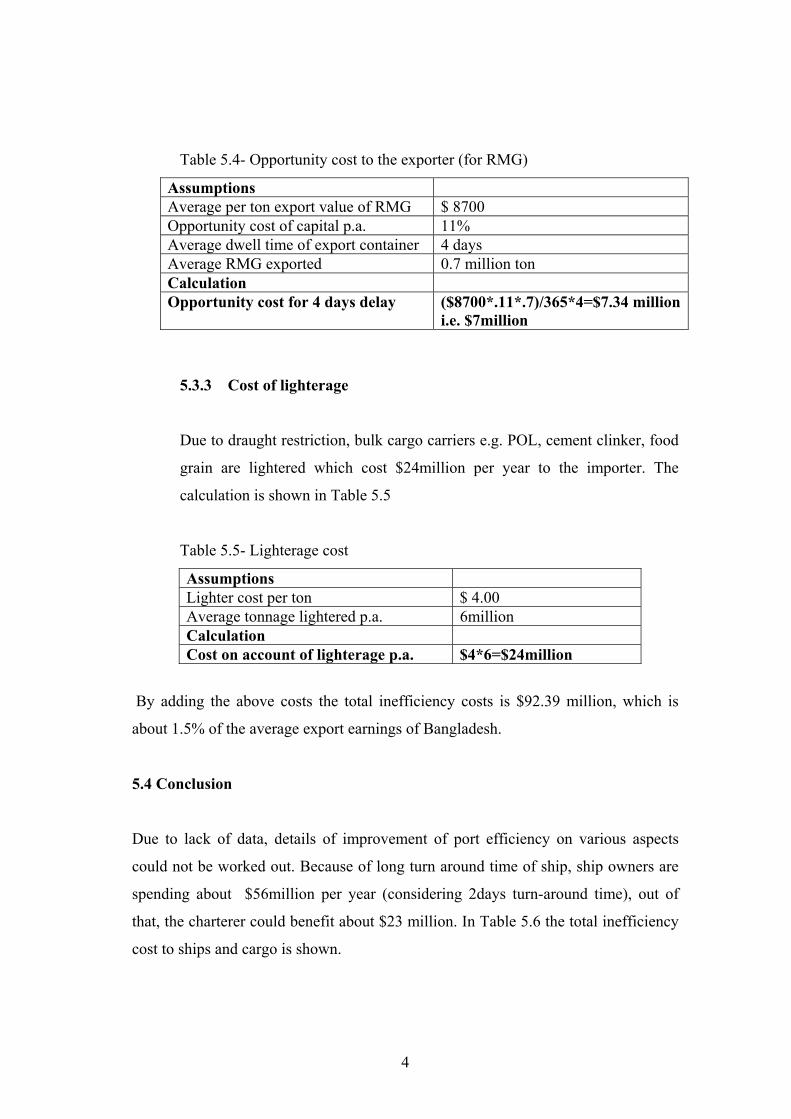
4
Table 5.4- Opportunity cost to the exporter (for RMG)
Assumptions Average per ton export value of RMG $ 8700 Opportunity cost of capital p.a. 11% Average dwell time of export container 4 days Average RMG exported 0.7 million ton Calculation Opportunity cost for 4 days delay ($8700*.11*.7)/365*4=$7.34 million
i.e. $7million
5.3.3 Cost of lighterage
Due to draught restriction, bulk cargo carriers e.g. POL, cement clinker, food
grain are lightered which cost $24million per year to the importer. The
calculation is shown in Table 5.5
Table 5.5- Lighterage cost
Assumptions Lighter cost per ton $ 4.00 Average tonnage lightered p.a. 6million Calculation Cost on account of lighterage p.a. $4*6=$24million
By adding the above costs the total inefficiency costs is $92.39 million, which is
about 1.5% of the average export earnings of Bangladesh.
5.4 Conclusion
Due to lack of data, details of improvement of port efficiency on various aspects
could not be worked out. Because of long turn around time of ship, ship owners are
spending about $56million per year (considering 2days turn-around time), out of
that, the charterer could benefit about $23 million. In Table 5.6 the total inefficiency
cost to ships and cargo is shown.

5
Table5.6- Total inefficiency cost
Cost in $(million) Cost to ship for 4 days more turn-around time at port 56 Opportunity cost to importer for 25 days dwell time 5 Opportunity cost to exporter for 4 days dwell time 7 Lighterage cost 24 Total inefficiency cost 92
Importers of manufactured goods have to spend about $5 million per year as
opportunity cost, due to long dwell time of cargo at CPA, which is caused mainly in
the absence of trade facilitation. Again due to draft limitation, bulk cargo importers
have to spend $ 24million for lighterage. Therefore, the total inefficiency cost
estimated about $92 million per year, which is about 1.5% of the average export
earning of Bangladesh.
However, during 2001-2002 an improvement of 1.05 days in turnaround time over
the previous year was achieved and the country saved about 6 million dollars only on
account of chartered ship and liner ship owner saved $9 million.
A few years back Singapore based Chittagong Feeder Trade Committee (CFTC)
imposed congestion surcharge to the extent of US$ 150 and $ 300 per twenty and
forty feet containers respectively and the country lost a few million dollars in foreign
currency for six months. World Bank Country Director for Bangladesh rightly said,
“Bangladesh export could earn about 30% more if various port inefficiencies were
removed” (Temple, 2001).
The inefficiency of the port and its impact on FOB prices of exports and imports is
not good for the economy. This stifles competition. The quantitative approach to the
cost of ship’s stay in port and the opportunity cost due to increased dwell time are
food for thought.
For the economy to improve it is the author’s view that inefficiencies arising out of
port operations would have to be checked since this will have a profound effect on
the balance of payment. In the next chapter the author will try to find the major
constraints for efficient port performance.

1
CHAPTER 6
Major constraints of efficient port performance
6.1 Introduction
In the previous chapters port operations, performance and impact on the economy
have been presented. Now in this chapter the author will try to find the reasons for
the low performance at Chittagong Port. Customs and equipment related constraints
were discussed in the previous chapter. The general constraints relating to port
performance are highlighted here.
6.2 Forces of change
The challenge of the 21st century is to face the forces of chance in the business based
on underlying port operations. The forces of change and their impact are shown in
the following figures:
Figure 6.1-Forces of change and their impact Source: Intermodal freight transportation, Muller G. 1999,p.2.
2
The influence of these forces of change has been noticed at CPA. Port users are
demanding faster handling, introduction of EDI system, and simplification of
documentation. In addition, the government is encouraging privatisation of the port.
6.3 Major constraints
The other major constraints and causes which are affecting productivity and
efficiency are grouped into three hierarchical categories such as institution/
organisational constraints, labour/ employment constraints and logistics constraints.
6.3.1 Institutional /organisational constraints
6.3.1.1 Port Autonomy
CPA is guided by the Chittagong Port Ordinance–1976. The government
appoints the Chairman. Though it is said that CPA is an autonomous
organisation, the authority cannot thoroughly exercise its power in the area of
finance, administration and development. Even for recruitment of manpower
it has to take approval from the Ministry. More than 500 posts (for civil,
mechanical, electrical and traffic department) are vacant years after years.
Especially for want of technical manpower central workshops, zoned
workshops, equipment operation including civil and electrical maintenance
work is not done properly.
The chairperson who is appointed mainly from the civil service, usually
proceeds to retirement within 2-3 years and has little experience in working
in a complex commercial organisation like the port. Hence, he has little
interest in strategic planning of the organisation and is rather prone to
carrying out day-to-day functions.
3
Misbahuddin Khan’s comment about the hindrance of Chittagong Port
development still is valid. He wrote in his book (Khan, 1990)
The present facilities and layout of the port of Chittagong would have
been different if the responsibilities for planning for its development
were given to the port administration i.e. the Commissioners for the
port of Chittagong, a statutory body established in 1888 to run and
administer the Port of Chittagong under the provisions of the Bengal
Act. IV of 1887.
6.3.1.2 Tariff
After the introduction of containerisation, CPA revised its tariffs
during 1986. It worked out a cost-based tariff. Every year it has to
procure a numbers of equipment including spares, navigational aids,
and carries out civil and electrical maintenance work. About 36% of
the revenue budget is spent for these maintenance and operation
purposes. Besides, all the projects have been /are being implemented
from its income. Two years back a revised tariff schedule was sent to
the Ministry, which is yet to be approved.
6.3.1.3 Lengthy project approval and implementation procedure
It takes on an average 3 years for approval of a project. Generally the
projects identified in the five-year plan are taken into consideration
for implementation through Annual Development Programmes. Due
to foreign exchange constraints, government has been reluctant to
permit the implementation of the project ‘Procurement of 142 nos.
container handling equipment including quay gantry crane’ during
1998 & 1999. Again during the implementation stage of the project,
every stage of work (recruitment of manpower, floating tender, tender
evaluation, issue of letter of intent etc.) is to be approved by the

4
Ministry. Due to this long and cumbersome bureaucratic procedure,
every project gets delayed and consequently project cost increases.
The project ‘Construction of two nos. multi-purpose berths with
backup facilities and procurement of cargo handling equipment
including construction and procurement of interim container handling
facilities’ started during 1982 and was completed in 1995 without
procurement of gantry cranes due to unavailability of funds; but the
rail track was constructed on the berth during 1986 and the berths
were commissioned in 1987. After long persuasion with the
government CPA prepared another project ‘Procurement of 142
numbers container handling equipment including quay gantry cranes’.
Last year a tender was floated, but CPA is yet to receive clearance
from the Ministry for offering work order to the successful bidder.
6.3.1.4 Human Resource Development
There is no human resource development concept in the true sense of
the term. The service rule, which was approved by the government in
1991, is full of discrimination. Homogenous career development is
absent in the organogram. Seniority is the main criteria for
promotion. Due to organisational block, there has been no recruitment
in some departments such as Civil Engineering in the last 21 years. A
group of experienced engineers will be retired by 2005 after serving
long 20-25 years in the same rank and thus at the same time will
create a vacuum in the hierarchy as Chief, Deputy Chief, Executive
engineer will proceed for retirement almost at the same time.
Furthermore, though CPA is a service-cum- commercial organization,
the salary structure is the same as other public administrations. In
addition, the motivation approach is almost absent in the organization
culture.

5
6.3.1.5 Training
Training is a powerful means of production of human resources. The
CPA Training Institute is under the control of the Administrative
Department, which implements the training programmes. A draft
training policy has been prepared which is yet to be approved. The
objectives of the training policy are to provide:
• Foundation training
• Refresher course
• Familiarisation training after procurement.
• Basic computer training.
Furthermore, officials are sent abroad to attend seminars and diploma/
MSc. courses in the maritime field in general and in port development
in particular.
Training is not considered as important as it should be. In most cases
investment in training is considered unproductive. During 2002 –2003
out of a 7.85 million dollar revenue budget only $ 0.003million was
allocated for training; this proves negligence of training. Training
needs assessment of the employee is rarely done. Similarly no
evaluation and feedback is done after training. There is no
remuneration system for successful trainees. Besides, skilled and
trained employees are not given preference in case of promotion or
posting. As a result, the training institute is not capable of providing
proper training to cope with the changing demand. Therefore, the
shortcomings in the training system are:
Lack of strong commitment of port management towards
training
Lack of sufficient funds
Lack of training equipment, computers etc.
Unwillingness of the employees
No Training Need Assessment system for organizing training
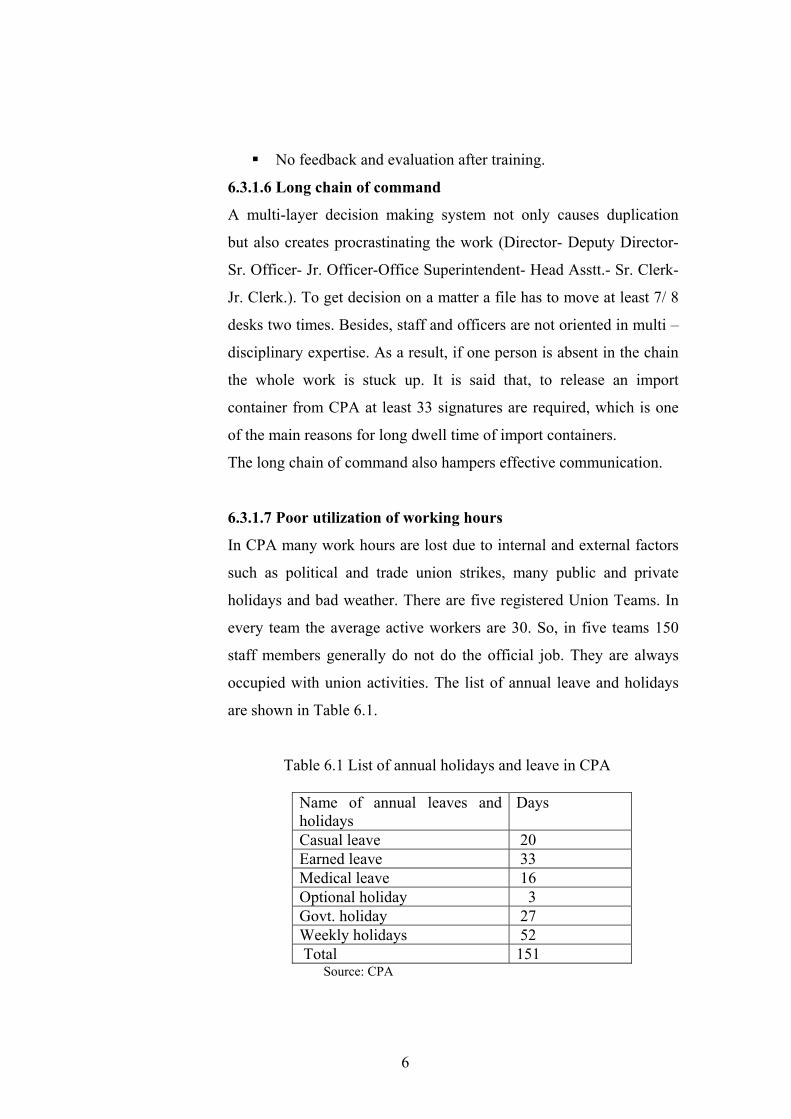
6
No feedback and evaluation after training.
6.3.1.6 Long chain of command
A multi-layer decision making system not only causes duplication
but also creates procrastinating the work (Director- Deputy Director-
Sr. Officer- Jr. Officer-Office Superintendent- Head Asstt.- Sr. Clerk-
Jr. Clerk.). To get decision on a matter a file has to move at least 7/ 8
desks two times. Besides, staff and officers are not oriented in multi –
disciplinary expertise. As a result, if one person is absent in the chain
the whole work is stuck up. It is said that, to release an import
container from CPA at least 33 signatures are required, which is one
of the main reasons for long dwell time of import containers.
The long chain of command also hampers effective communication.
6.3.1.7 Poor utilization of working hours
In CPA many work hours are lost due to internal and external factors
such as political and trade union strikes, many public and private
holidays and bad weather. There are five registered Union Teams. In
every team the average active workers are 30. So, in five teams 150
staff members generally do not do the official job. They are always
occupied with union activities. The list of annual leave and holidays
are shown in Table 6.1.
Table 6.1 List of annual holidays and leave in CPA
Name of annual leaves and holidays
Days
Casual leave 20 Earned leave 33 Medical leave 16 Optional holiday 3 Govt. holiday 27 Weekly holidays 52 Total 151
Source: CPA

7
In addition to this, due to bad weather, strike called by dock workers,
stevedores, truck owners, coaster labourers, port CBA including
political strike, the operational work of the port was stopped for 12
days in 2002, whereas 24 days in 2001 and 37 days in 2000. Loss of
huge work hours has caused poor performance.
6.3.2 Labour and employment constraint
There are numbers of white-collar workers at CPA for its day-to-day
function. The DWMB has 6200 dockworkers providing labour for on board
and on shore cargo handling. Again the stevedores employ 3000 workers
including supervisors, tally clerks and foremen. The C&F agents also employ
5000 merchant labourers to appraise and then delivered customs cleared
cargo in the sheds and yards. For not having integrated workforce among
these four sources of labour supply has resulted in mal-coordination, even
redundancy in some areas. In the absence of integrated labour groups with
conflicting interest, strikes by one group have paralysed partially of fully the
port operation from time to time. Political conflict amongst the main stream
political parties and unions being affiliated to political parties lead the port
into frequent closures due to conflicting political aims having nothing to do
with the workers or the port.
6.3.2.1 Large gang size
Despite labour saving technology, large gang size of labour remained as
before. A gang consists of 18 labourers for container cargo, 25 labourers for
bulk cargo, 50 for bagged cargo and 15 for break-bulk cargo. The
consequence of this large gang size is that the labour productivity has fallen.
Hence, neither the operation is cost effective nor the toiling workers get their
due share due to sharing wages within workers who are not actually in the
work. The average wage rate of regular dockworker is US $ 4.30 per shift and
23 duties per month are allocated. In the absence of incentive scheme for

8
increasing productivity bonus are paid informally by the stevedoring
companies for tonnage handled over the productivity level. It is said that this
speed money, is much higher than the normal wage rate and if there is less
speed money the workers adapt a go-slow policy.
6.3.3 Logistics support/physical facilities
6.3.3.1 Limitation in draught and length
Economy can be achieved by carrying the goods in larger vessels.
However, due to the restrictions of draught and length for
manoeuvring in the river Karnafuly larger and deeper vessel cannot
enter into the port and have to wait at the Outer Anchorage where
cargoes are lightered. This involves extra cost to the importer.
Again, in the absence of gantry crane containers are handled by ships
gear, which is not only time consuming but also less carrying capacity
of containers. Besides, ships’ container operation is suspended till
space is available through cargo clearance from the port. All these
factors cause longer turn –around time of ship at CPA.
6.3.3.2 Inadequate inland distribution facility
The inland distribution network has not been developed at a
compatible pace keeping with the speed of handling of
cargo/containers of the vessels at the port. No inland river port facility
has been developed to handle containers. On the other hand, there is
no proper highway to transport containers by road. Very negligible
numbers of containers are transported by road from Chittagong to
Dhaka with special permission from the organization concerned. Only
about 11% of the containers are transported by rail.

9
6.3.3.3 Stuffing and un-stuffing containers
All the LCL and about 80% FCL containers have to be stuffed and de-
stuffed within the port and the containers are to be received or
delivered in the break-bulk form. This negates the very concept of
containerisation and deprives the trade and industries that are intended
primarily for door-to-door service. This large-scale stuffing and un-
stuffing containers and receipt and delivery of contents in break-bulk
form result in engagement of large numbers of labourers and trucks
creating chaos, obstacle for free equipment movement, security
problem and above all congestion in the port.
6.3.3.4 Container handling from too many different areas, a
complex operation
In an effort to keep pace with requirements, CPA had to construct a
container yard at a different location behind the GCB area, where
space was available. This sporadic nature of the yard resulted in
increased travel time/equipment requirement and increased service
time of vessels. Consequently, the turn-around time of ships is longer.
6.3.3.5 Storage capacity
The storage capacity of containers is 16,000TEU, which is insufficient
to store the rapidly growing numbers of containers (18,000-
20,000TEU per day). The storage space problem can be ascribed to
two main reasons:
• Long dwell time of containers
• Low density of stacking containers

10
In addition to this, low tariffs for storage (first 28 days $1.5 and $3.0
for each TEU and FEU respectively) have also attracted
shippers/consignees using the port for long-term storage. On the other
hand, low stacking height (2.5 high for export, 2 high for import and
3 high for empty) demands more space. Besides, straddle carriers are
used in CCT and forklift are used in the GCB for loaded containers,
which requires more space than RTG operations.
On the other hand, break-bulk, cargoes are stored in the transit shed/
warehouse where there is no rack system. The maximum vertical
space remains unutilised though the storage utilization is about 90%.
6.3.3.6 Truck Management
On the average 3,500 trucks per day are handled at the port. The turn
around time of the truck for loading/unloading is 5-6 hours. In the port
area there is not enough space for empty trucks to wait. For picking
up cargo there is competition between the drivers to enter the port
area and thus creating congestion. Lack of co-ordination between the
gate and direct delivery/CFS operation creates a situation of
indiscipline in the confines of the port area.
6.3.3.7 Inadequacy of Management Information System
It is obvious that the importance of accurate, relevant and
comprehensive information plays a great role to obtain efficient and
effective port activities. All departments of the port have their own
system of data collection, compilation analysis and presentation
according to their objectives, leaving aside how effective it is. In the
absence of EDI, information is collected and organised manually but
is not interpreted and analysed to search and diagnose the port
performance problem. Most of the times the management takes a
decision by calling meetings and discussions with the heads of the

11
departments based on their experience. Information is mostly
collected for the sake of reports to the higher authority as a part of
day-to-day work. The problem is lack of co-ordination and feedback.
Thus, the information is only one-way flow, i.e. from down to top not
from top to down. Although all departments are interrelated and
dependent on each other, they do not usually exchange information
among themselves. As a result, there is duplication of information and
work.
6.4 Conclusion
The constraints of Chittagong Port are not different from any other developing
countries. Though CPA is an autonomous organization, it cannot exercise its power
in case of operation and development. Professor Francou rightly stated, “too high
pressures of participation of States in the management usually result in
mismanagement and inefficiency of ports” (2002, p7).
In the absence of Human Resource Management, professionalism is facing stumble
in every steps of development. Though the forces of change are obvious in port
operations the authority is yet to take strategic planning to cope with the situation.
This proves that the management is not pro-active but rather reactive and crisis
solving. Trade unions, dockworkers and customs are the stumbling stone as usual in
port operations and performance. Lack of co-ordinated and harmonious development
in the related fields, the benefit of door-to-door concept could not be fully utilized.
About 90% of the FCL containers still terminate their journey at the port. As the
GCB area is not a purpose built terminal for the containers, the operations are in a
haphazard condition over a vast area. In the absence of a trade facilitation system at
least 33 signatures are required to clear an imported consignment. Hence, the average
dwell time of containers is 25 days, which is very long.
Above all, the political influence like strike adds more inefficiency as the total
operation halts even days after days. As a consequence, congestion of ships and
cargo arises.

1
CHAPTER 7
Conclusions and Recommendations
7.1 Conclusions
The main objective of this dissertation is to evaluate the impact of any improvement
of port efficiency on the economy of Bangladesh.
The port of Chittagong is rightly termed as the ‘Gate way of Bangladesh’ as it
handles more than 80% of the country’s external trade. Statistics shows that
dependency of Bangladesh economy on foreign trade is increasing with the
development of economic activities.
CPA is providing about 23,000 employment opportunities directly and generating per
year about 50 million dollars as value added excluding the indirect and induced
impact. During 2002-03 the revenue earning of CPA is $85.10 million, which is
1.4% of the average Annual Income. In addition, 48% of its total earning is in the
form of hard currency, which is about 1.5% of the average deficit trade balance.
Thus, it contributes positively to the balance of payment.
However, the irony is that, the country is losing huge amounts due to the inefficiency
of the port. The inefficiency cost to the economy is worked out at $92 million per
year, which is about 1.5% of the average export earnings of Bangladesh.
During 2001-02 the average turn around time decreased to 5.10 days i.e. about 25
hours less than the previous year. It is calculated that the ship owners and charterers
saved about $15million due to reduction of turn around time at that period.

2
Sustainable development can be achieved by improving the transport sector
including seaport where the port must be realigned to fit the new economic strategy.
In the present millennium the port acts not only as an interface but also as a very vital
part in the supply chain management. Hence, the new economic strategy of the port
is that it should be evolved as a trade facilitator and not as income or employment
generator. For CPA, the mechanism towards the approach of facilitation has been
analysed in the previous chapters. Various conclusions have been drawn but one can
recap that an improvement in the turn around time through investment in the
necessary infrastructure, superstructure, documentation and computerization stands
as the litmus test for facilitation. The objective should be to move the nation’s
international merchandised trade as efficiently and inexpensive as possible.
7.2 Recommendations
This work cannot be completed without comments and appropriate recommendations
will serve as solutions to the problems discussed in Chapter 6. Like Chapter 6, the
recommendations enumerated below for the short term will be considered under
three headings: Institutional/organisational recommendations, labour/employment
and logistics.
7.2.1 Short-term measures
7.2.1.1 Institutional
7.2.1.1.1 Port Autonomy
As noted elsewhere in this work, port autonomy is central to efficiency. The
Ordinance of 1976, which provides the legal framework for port
administration, is almost 30 years old. Times have changed as rapid
development in the port industry has shown. Rapid response mechanisms and
ability to better orient to marketing and strategically functions of the port
demand an equally rapid response in the spheres of finance and development.
CPA would have to live up to the pace of development by adopting quick
decision-making/responsive mechanism if it wants to compete strategically.

3
In essence without a revision of the 1976 Ordinance, this cannot be achieved,
as the status quo will remain.
7.2.1.1.2 Human Resource Development
A holistic approval to Human Resource Development is needed. A system of
motivation would have to be developed. Staff needs would have to be
individualised instead of en-masse approach. Training schemes would have to
be rejuvenated and adequate budgetary allocation made. Promotion would
have to be based on merit and qualification and not necessarily seniority.
There is a need for attitudinal change and the chain of command would have
to be avoided to provide a unity of purpose i.e. team spirit. All these would
lead to an improvement of the working conditions through a multi-faceted
approach.
By giving actual autonomy the port will be managed as a profit centre,
independent from the pressure of the government. It means:
- Freedom for recruitment
- Negotiation with labourers
- To buy spares parts and equipment
- Own initiative determining the tariffs.
7.2.1.2 Labour issues and working hours
The non-working days (151 days) in a year is interesting. This means
effectively almost 50% of the days in a year are holidays and therefore
unproductive. The state/ Government holidays would have to be slashed
down through appropriate legislation. Furthermore, the member of unionised
workers in official/executive union positions is more than necessary.
Unionised workers would have to be multi- disciplinary in their skills to
prevent the creation of a vacuum in the event of absenteeism. The gang size
would have to be minimised proportionate to the task performed. This will
provide high productivity.
4
7.2.1.3 Logistics support and physical facilities
Draft restriction would demand dredging. The port would have to invest in
research and development because the modern trend is to locate the port
towards the sea to be able to accommodate larger vessels to reap economics
of scale.
The hinterland connection needs a rapid development. Road, rail and inland
waterway facilities need to be upgraded. The under developed nature of this
facility is largely responsible for the stripping of FCL containers in the port.
The creation of an ICD would need an effective infra-structural network. The
storage needs should not be over looked. The ground strength will have to be
re-constructed as well as the necessary handling equipment procured for
effective stacking. Economic tariffs would have to be imposed to facilitate a
reduction in dwell time. A concerted approach to equipment inventory and
maintenance together with other logistic requirements will help prevent the
decay.
7.2.1.3.1 Management Information System
Despite the fact that some offices are equipped with computers, this is not
enough. A network of the system is what is needed. Communication and
information flow would have to be transparent with all actors (port users)
participating fully. In this context the feedback is a forgone conclusion. The
benefits of the Electronic Data Interchange cannot be over emphasised. The
perceived advantages as regards productivity to be derived from container
tracking using electronic means are enormous.
7.2.1.3.2 Simplification of documents and customs procedure
Customs documentation and internal port procedures should be simplified by
introducing a computer system, which would help in reducing dwell time of
cargo. Scanning Machine should be installed to eliminate manual checking.

5
These would help to implement the ISPS Code. Side by side the port security
system should be modernised.
7.2.2 Long-term measures
7.2.2.1 Commercialisation
Commercialisation of the port is necessary for efficiency and invested
productivity. A change in the management system to that akin to a private
enterprise, without necessarily changing the public status of CPA, will lead to
accountability and responsibility for operational performance and financial
results. This will in effect lead to the gradual introduction of decentralised
decision making and increasing control of management over purchasing,
budgeting and hiring of skilled labourers.
Conclusion, it is clear that as a gateway to the country the contribution of CPA is not
only limited to value added but also a good source of earning foreign currency. Thus
it stimulates economic activity of the country. On the other hand, if it does not run
efficiently instead of being a contributor to the economy, it becomes a severe drain.
Hence, there is ample scope for further detailed studies and analysis of the impact on
the port performance. It is the author’s little effort to find out the performance of
CPA and its impact on the economy of the country. This study does not only help the
author to better understand how the performance of the port impinge on the economy
of the country, but also policy makers and those related to the port industry.
--------
1
REFERENCES
Alderton, P. M. (1999). Port management and operations. London, Hong Kong:
LLP.
Alderton, P.M. (1995). Sea Transport operation and economics (4th ed). London: Thomas Reed Publication Bangladesh Bank (2002). Annual Report. Retrieved on 7th July 2003 from: http://www.bangladesh-bank.org/pub/annual/ Bangladesh Bureau of Statistics (2002). 2000 statistical yearbook of Bangladesh. Bangladesh: Author. Butcher, M.J. (1989). Port performance indicators. International Cargo Handling Co-ordination Association Biennial Conference, 29th May-2nd June 1989, Stockholm (vi53-vi72). Place: ICHA. Branch, A.(1997). Elements of port operation and management. London: Chapman and Hall. Chittagong Port Authority (2002). Budget estimates of income & expenditure for 2002-2003 with revised estimates for 2001-2002. Chittagong, Bangladesh: Author. Chittagong Port Authority (1976). The Chittagong Port Authority Ordinance, 1976. Chittagong, Bangladesh: Author. Chittagong Port Authority (2003). Chittagong Port: An overview. Chittagong, Bangladesh: Author. Chittagong draws flak (2003, July10). Fairplay, p.2. Clerk, X., Dollar, D. & Micco, A. (2001). Maritime transport costs and port efficiency. Retrieved on 12th July 2003 from http://econ.worldbank.org/files/11793-wps2781.pdf. Cook, P. & Kirkpatrick, C.(1990). Macroeconomics for developing countries. New York: Harvester Wheatsheaf. Coto- Millan, Martinez-Budria(1999). An approach to the contribution of the port system in the Spanish economy. In P. Coto- Millan (Ed.), Maritime transport applied economics, Madrid: Civitas Ediciones.
2
Drewry Shipping Consultants (1997). Economic studies: Perspectives of third world port development. London: Author. Francou B. (2002). Macroeconomics. Unpublished lecture handout, World Maritime University, Malmö, Sweden. Francou, B. (2002). Impacts of Ports and Shipping on the economy. Unpublished lecture handout, World Maritime University, Malmö, Sweden.
Francou, B. (2002). Port Performance Indicators. Unpublished lecture handout, World Maritime University, Malmö, Sweden.
Francou, B. (2002). Macro-Economics. Unpublished lecture handout, World Maritime University, Malmö, Sweden. FFrraannccoouu,, BB.. && AAllddeerrttoonn,, PP..MM.. ((22000033)).. TTeecchhnniiccaall DDeevveellooppmmeenntt iinn PPoorrttss.. Unpublished lecture handout, World Maritime University, Malmö, Sweden. GGhhoosshh,, BB.. && DDee,, PP..((22000022)).. PPrroodduuccttiivviittyy,, eeffffiicciieennccyy aanndd tteecchhnnoollooggiiccaall cchhaannggee iinn IInnddiiaann ppoorrttss.. IInntteerrnnaattiioonnaall JJoouurrnnaall ooff MMaarriittiimmee EEccoonnoommiiccss,, VVooll 44,, ((pp334488--336688)).. HHaammeeddaannii,, BB..OO..((11999955)).. MMaannaaggeemmeenntt,, AAddmmiinniissttrraattiioonn aanndd OOwwnneerrsshhiipp ooff MMaajjoorr SSeeaa PPoorrttss iinn DDeevveellooppiinngg CCoouunnttrriieess,, wwiitthh SSppeecciiaall RReeffeerreennccee ttoo tthhee SSoocciioo-- EEccoonnoommiicc DDeevveellooppmmeenntt ooff IIrraann.. UUnnppuubblliisshheedd PPhhDD.. TThheessiiss,, UUnniivveerrssiittyy ooff WWaalleess CCoolllleeggee ooff CCaarrddiiffff,, UUKK.. HHeeee--SSeeookk,, BB.. ((11998877)).. TToowwaarrddss bbeetttteerr mmaannaaggeemmeenntt ooff tthhee PPoorrttss iinn KKoorreeaa-- PPaappeerr pprreesseenntteedd aatt tthhee 1155tthh IIAAPPHH CCoonnffeerreennccee ((pppp..6655--7766)).. SSeeoouull,, KKoorreeaa.. IIAAPPHH..
HHoorrcckk,, JJ.. ((22000033)).. PPoorrtt ooppeerraattiioonnss aanndd pprroodduuccttiivviittyy.. Unpublished lecture handout,
World Maritime University, Malmö, Sweden.
IInnuuee,, SS..((22000022)).. PPoorrtt aass iinnddiissppeennssaabbllee ppaarrttnneerr ooff mmaarriittiimmee ttrraannssppoorrtt.. PPaappeerr pprreesseenntteedd
aatt tthhee MMaarriittiimmee TTrraannssppoorrtt CCoommmmiitttteeee,, OOEECCDD,, PPaarriiss,, 1166tthh JJuullyy 22000022..
IIrrcchhaa,, MM..CC.. ((11999999)).. PPoorrtt ssttrraatteeggiicc ppllaannnniinngg:: CCaannaaddiiaann ppoorrtt rreeffoorrmm.. AArrttiiccllee pprreeppaarreedd
ffoorr ppoossssiibbllee ppuubblliiccaattiioonn iinn MMaarriittiimmee PPoolliiccyy aanndd MMaannaaggeemmeenntt,, JJuullyy,, 11999999..
KKhhaann,,MM.. ((11999900)).. HHiissttoorryy ooff tthhee ppoorrtt ooff CChhiittttaaggoonngg.. DDhhaakkaa.. BBaannggllaaddeesshh..
3
KKoollkkaattaa PPoorrtt TTrruusstt.. Retrieved on 6th June 2003 from:http://www.portofcalcutta.com.
KKoottlleerr,, PP.. AArrmmssttrroonngg,, GG.. SSaauunnddeerrss,,JJ.. && WWoonngg,,VV.. ((22000011)).. PPrriinncciipplleess ooff MMaarrkkeettiinngg..
HHaarrllooww;; NNeeww YYoorrkk:: FFiinnaanncciiaall TTiimmeess //PPrreeccttiiccee HHaallll..
Lipsey, R.G., Courant, P.N.& Ragan, C.T.S.(1998). Macroeconomics. Reading, MA:
Addison-Wesley.
Ma, S. (2002). Maritime Economics. Unpublished lecture handout, World Maritime University, Malmö, Sweden. MMeelleettiioouu,, MM.. ((11999988)).. IImmpprroovveedd ppoorrtt pprroodduuccttiivviittyy tthhrroouugghh aa ppaarrttnneerrsshhiipp bbeettwweeeenn hhuunnmmaann bbeeiinnggss aanndd tteecchhnnoollooggyy,, 11sstt IInntteerrnnaattiioonnaall CCoonnffeerreennccee oonn MMaarriittiimmee EEnnggiinneeeerriinngg aanndd PPoorrttss SSeepptt 11999988,, GGeennooaa,, IIttaallyy ((pp 4477--5566)).. BBoossttoonn,, MMAA:: WWIITT PPrreessss.. MMoohhaammaadd,, MM.. ((11999999)).. KKeeyynnoottee aaddddrreessss aanndd ooppeenniinngg ooff ttrraaddee eexxhhiibbiittiioonn bbyy tthhee HHoonnoouurraabbllee DDaattoo SSeerrii DDrr.. MMaahhaatthhiirr MMoohhaammaadd,, PPrriimmee MMiinniisstteerr,, MMaallaayyssiiaa.. PPrroocceeeeddiinnggss ooff tthhee 2211sstt WWoorrlldd PPoorrttss CCoonnffeerreennccee:: KKuuaallaa LLuummppuurr,, 1155--2211 MMaayy 11999999 ((pppp.. 2277--3300)).. TTookkyyoo,, JJaappaann:: IIAAPPHH.. MMuulllleerr,, GG.. ((11999999)).. IInntteerrmmooddaall ffrreeiigghhtt ttrraannssppoorraattttiioonn ((44tthh eedd)).. WWaasshhiinnggttoonn,, DDCC:: EEnnoo TTrraannssppoorrttaattiioonn FFoouunnddaattiioonn aanndd IInntteerrmmooddaall AAssssoocciiaattiioonn ooff NNoorrtthh AAmmeerriiccaa.. MMuussssoo,, EE,, BBeennaacccchhiioo,, MM..,,FFeerrrraarrii,,CC..&& HHaarraallaammbbiiddeess,, HH..EE,,((22000000)).. OOnn tthhee eeccoonnoommiicc iimmppaacctt ooff ppoorrttss::LLooccaall vvss nnaattiioonnaall ccoosstt && bbeenneeffiitt.. PPaappeerr pprreesseenntteedd aatt tthhee IInntteerrnnaattiioonnaall CCoonnffeerreennccee oonn SShhiipp aanndd SShhiippppiinngg RReesseeaarrcchh:: 1133tthh NNAAVV CCoonnggrreessss,, 22000000,, VVeenniiccee,, IIttaallyy.. Nagorski, B. (1972). Port problem in development countries: Principals of port planning and organization. Tokyo: International Association of Ports and Harbours. Ocean Shipping Consultants (1999). The World container port markets to 2012. Chertsey Survey: Author. Oram, R.B. and Baker, C.C. (1971). The efficient port. Oxford; New York: Pergamon Press. Piracy at Outer anchorage (2003, 8th June). Independent, P. 3. Roach, D.K. 1982). Improving port performance: Management of general cargo operations trainee’s workbook. Cardiff, United Kingdom: Droke Educational Associates.

4
Samuelson, P. A. & Nordhaus, W.D. (2001). Economics, (7th ed). New York; London: Irwin McGraw-Hill. Shahjan, A.S.M.(2000). Cargo handling equipment productivity analysis of the Chittagong Port Authority. Unpublished masters thesis, Malmö, Sweden, World Maritime University. Stopford, M. (1997). Maritime Economics. 2nd ed. London: Routledge. Sigma, S. (1996). An analysis of time in port for effective and efficient port operations. Unpublished masters thesis, Malmö, Sweden, World Maritime University. The World Bank (2002). Data by country: Bangladesh. Retrieved on 6th June 2003 from: http://www.worldbank.org/data/countrydata/countrydata.html UUNNCCTTAADD ((11998877)).. CCoommppuutteerriizzeedd CCoonnttaaiinneerr TTeerrmmiinnaall MMaannaaggeemmeenntt..((UUNNCCTTAADD MMoonnooggrraapphhss oonn PPoorrtt MMaannaaggeemmeenntt)) NNeeww YYoorrkk:: UUnniitteedd NNaattiioonnss.. UUNNCCTTAADD ((11998877)).. CCoonnttaaiinneerr TTeerrmmiinnaall PPaavveemmeenntt MMaannaaggeemmeenntt.. ((UUNNCCTTAADD MMoonnooggrraapphhss oonn PPoorrtt MMaannaaggeemmeenntt)).. NNeeww YYoorrkk:: UUnniitteedd NNaattiioonnss.. UUNNCCTTAADD ((11998877)).. MMeeaassuurriinngg aanndd EEvvaalluuaattiinngg PPoorrtt PPeerrffoorrmmaannccee aanndd PPrroodduuccttiivviittyy ((UUNNCCTTAADD MMoonnooggrraapphhss oonn PPoorrtt MMaannaaggeemmeenntt,, nnoo..66)).. NNeeww YYoorrkk:: UUnniitteedd NNaattiioonnss.... UNCTAD (1992). Development and improvements of ports:Tthe principals of modern port management and organization. Geneva: Author. Vleugels, R.L.M. (1969). The economic impact of ports on the regions they serve and the role of industrial development. International Association of Ports and Harbours Conference, Australia, 7th March 1969 (pp. 239-254). Tokyo: IAPH. World container port traffic league (2003). In J. Degerlund (Ed.), Containerization International Yearbook 2003 (pp. 9-12). London: Informa. World Bank port reform toolkit Module1-6 (2001). Washington, D.C. World Bank, Transport Division.

1
Appendix A
Map of Bangladesh
Source: CPA
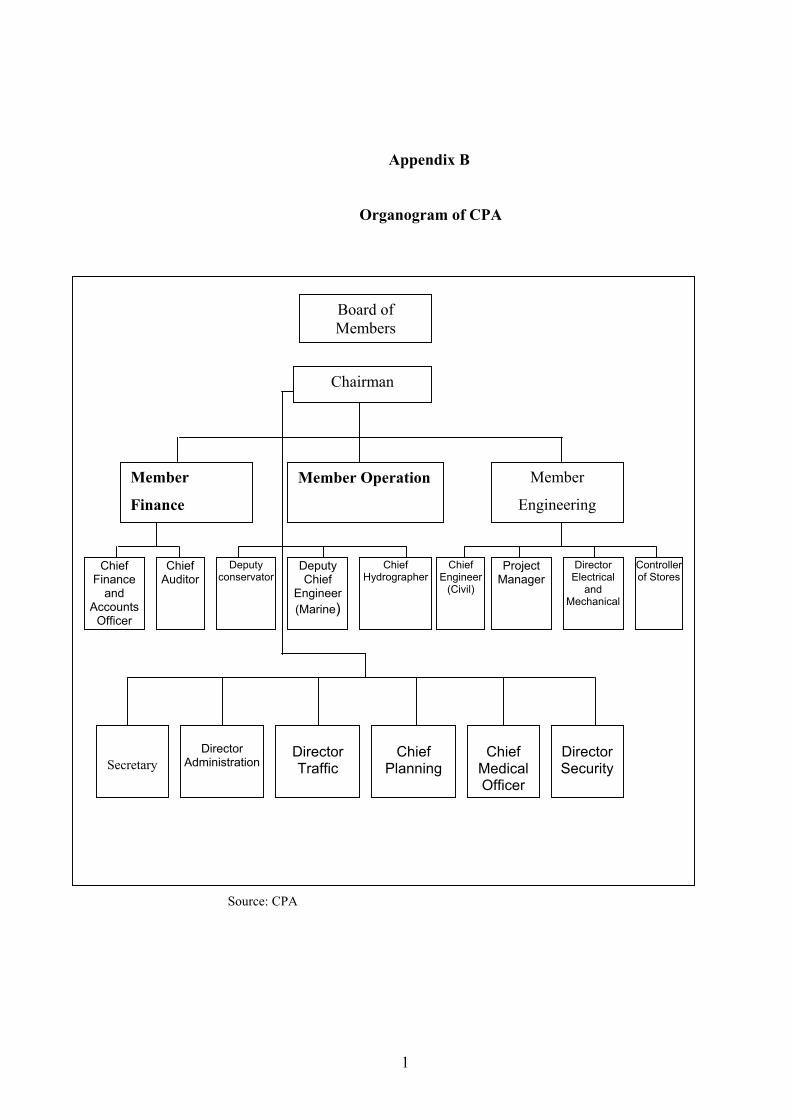
1
Appendix B
Organogram of CPA
Source: CPA
Board of Members
Member
Finance
Member
Engineering
Member Operation
Chief Finance
and Accounts
Officer
Chief Auditor
Deputy conservator
Deputy Chief
Engineer (Marine)
Chief Hydrographer
Chief Engineer
(Civil)
Project Manager
Director Electrical
and Mechanical
Controller of Stores
Chairman
Secretary
Director
Administration
Director Traffic
Chief
Planning
Chief
Medical Officer
Director Security

1
Appendix C
Details of Facilities at CPA
A. For Ocean Going Vessels
1. Jetties and Moorings:
Berths Owned and Operated by CPA: Nos.
General Cargo Berths 10
Container Berths 6
2. Specialised Berths for Bulk handling
Dolphin Oil Jetty (POL) 1
Grain Silo Jetty 1
Cement Clinker Jetty 1
TSP Jetty 1
CUFL Jetty 1
KAFCO Urea Jetty 1
Ammonia Jetty 1
3. Repair Berths
Dry Dock Jetty 2
4. River Mooring 9
B. For Inland Coasters and vessels
Concrete Jetty Berths (POL) 1
Concrete Berth (Food Grain) 1
Pontoon Berths (POL) 3
Pontoon Berth (Cement) 1
Single Point Mooring 10
Container Handling Facility
At Conventional Berths (GCB)
Holding Capacity 9657 TEU
Yard (18 nos.) 212,238 Sq. m

2
CFS (11nos) 86,168 sq. m
Container Terminal (CCT)
Holding Capacity 6408 TEU
Quay Length 450m
CFS 12,700 Sq. m
Container Storage Yard 150,000 sq. m
Reefer Points 210 (415volts) Points
Dredger (Trailing Suction Hopper Dredger)
Hopper Capacity 2500 Cubic Metres.
Tugs: A fleet of Tugs upto a maximum 3250 BHP is available

1
Appendix D
Details of on-going development projects
1. Construction Of New Mooring Container Terminal
A project for construction of a container terminal having 5 berths of
1kmlength and 22 hectors back up facilities is in progress. It is expected
to be completed by Dec. 2005. On completion of this project, the total
container handling capacity of the port would be around 1 million TEU
per year.
2. Construction of one 33 k.v Sub-station and renovation of existing 11kv
Sub-station.
3. Construction of one 16-storied tower building for port operational
services.
4. Construction of vessels and crafts: 2 Coast Guard Vesels, 2 Patrol Boat
and 2 harbour tugs.
5. Procurement of fire-fighting equipment for port fire station.
6. Comprehensive Computerisation of Chittagong Port Operation-
Consultant has been appointed.
7. Installation of Closed Circuit Television (CCTV) with fire and security
alarm to improve port security system.
Study Project
1. Institutional Strengthening of CPA in Environmental Management.
2. Engineering study for construction of 4 km Marine Driveway from Jetty
No. 1 to Shah Amanat Bridge.
3. Internal Traffic Management System for linking with Chittagong Port
Access Road.
4. Introduction of Vessel Traffic System (VTS) in port.

1
Appendix E
Details of equipment downtime, availability and utilization at Chittagong Port.
Downtime, availability and utilisation of general cargo handling
equipment in 2001-02.
Type of equipment Capacity Numbers Downtime Availability Utilization Mobile Crane 20-30 6 33% 67% 52% Mobile Crane 50 2 29% 71% 27% Forklift Truck 5 14 42% 58% 52% Forklift Truck 3 32 47% 53% 56% Forklift Truck 2.5 16 55% 45% 49% Tractor 25 16 49% 51% 38% Shore Crane 2-3 11 25% 75% 52% Shore crane 2 15 23% 77% 56%
Source:CPA
Downtime, availability and utilisation of container handling
equipment in 2001-02.
Type of equipment Capacity ton
Numbers Downtime Availability Utilization
Straddle Carrier 35 25 24% 76% 45% Reach stacker 45 3 27% 73% 62% Reach Stacker 7 9 28% 72% 63% Forklift Truck 38-42 7 45% 55% 56% Forklift Truck 32-35 2 47% 53% 52% Forklift Truck 25-28 5 45% 55% 49% Forklift Truck for empty handling
9-16 11 37% 63% 57%
Tractor 50 54 46% 54% 38% Trailer 20’-40’ 63 42% 58% 32%
Source:CPA
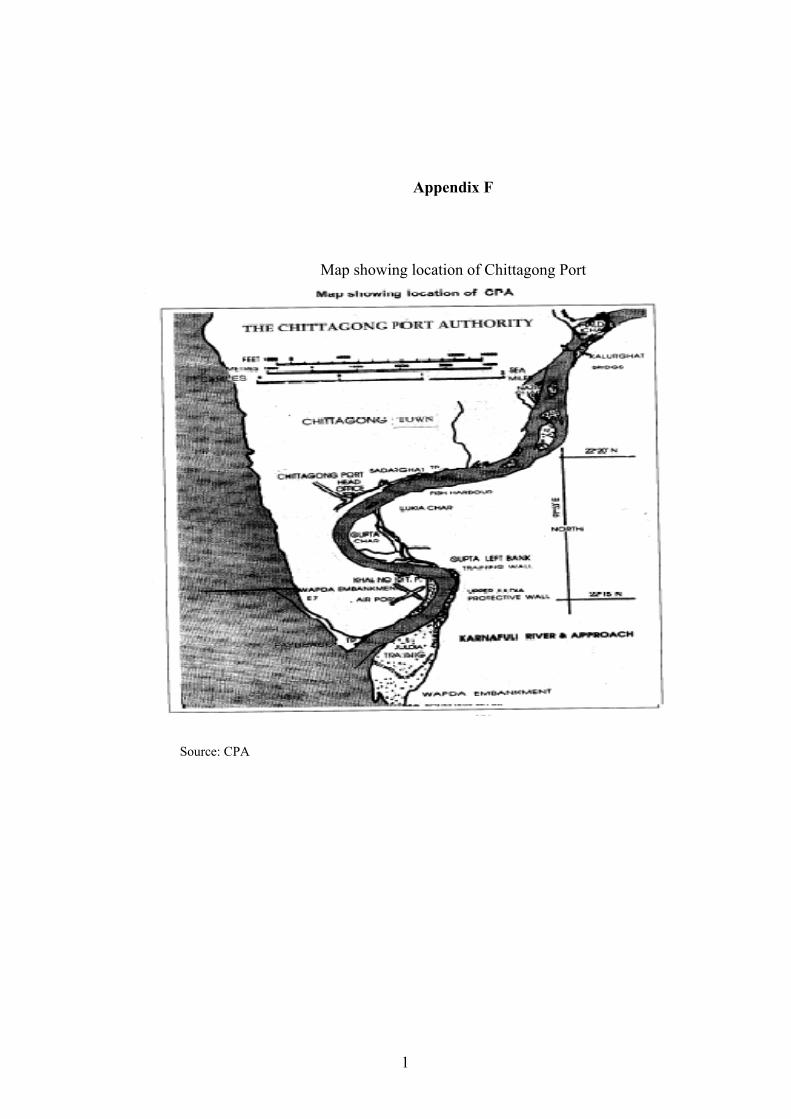
1
Appendix F
Map showing location of Chittagong Port
Source: CPA