Embed Size (px)
Citation preview
___________________________________________________________________________
2008/SOM3/EC/SEM/004 Agenda Item: 6
Regulation and Port Productivity Overview of Global Port Benchmarking - A Focus on Hong Kong and
South China Region
Submitted by: Hong Kong, China
Seminar on Best Practices in Regulation and Promotion of Efficiency in Transport
Infrastructure Facilities Lima, Peru
15-16 August 2008
2
Regulation and Port Productivity Overview of Global Port Benchmarking (A Focus on Hong Kong and South China Region) John J. Liu and T. L. Yip Department of Logistics and Maritime Studies Faculty of Business The Hong Kong Polytechnic University Hong Kong, China Background Globalization and trade liberalization in the past decades have profound impacts on port industry. Governments are increasingly realizing that, ports have become the most dynamic link in international transport networks and, as a result, inefficient ports can easily wither gains from trade liberalization and export performance. Port authorities have been trying to improve port efficiency through adopting new technologies and deregulation. The disappearance of national boundaries of port hinterlands, the increasing containerization, and the trend of deregulation force container ports to face keen competition, because of the diminishing product differentiation and government power. Competition leads to an increasing pressure on ports to control their costs, offer competitive user charges, and improve quality of services to shipping liners and shippers. A port benchmarking project is conducted to study the port productivity for major container ports in the world. The project addresses one fundamental question: what are the best practices to improve port efficiency (productivity) for a port. By collecting data from ports around the world, empirical models have been developed to compare port performance under different (regulation) scenarios. The results from this benchmarking project will be the foundation for a port to design appropriate regulatory tools. Port Benchmarking of Technical Efficiency The production and cost theories in economics makes it possible to estimate production and cost functions empirically, and thus to investigate the productivity and technology change of a port. The port production function can be written as: Port production = function (Infrastructure, Superstructure, Port characteristics). The quantity to indicate port production may be port throughputs (TEU, tonnage), ship arrivals or other outputs. The superstructure denotes cargo handling equipment, storage facilities etc. The port characteristics covers water depth, port groups, continental region etc. The findings are summarised as follows (Yan, Sun and Liu, 2008):
1. Port facility operators with deeper water terminals and larger numbers of calling liners is more efficient.
2. More terminals in a port reduce the efficiency. 3. Port groups are more efficient. 4. Ports are more efficient in the Far East Asia in general.
Several factors that may impact on the port efficiency are being addressed, e.g. Multiple outputs - the effect of port facility mix (container, bulk and tanker). We further discuss the implication of Port globalisation and Container flows Implication 1: Globalisation on ports From the port benchmarking study, ports groups are found more efficient. One of the main impacts of globalisation has been the integration of transport facilities provided by service organisations around the world. In the port sectors, there exist some of the prominent operators who provide services on a global scale.
3
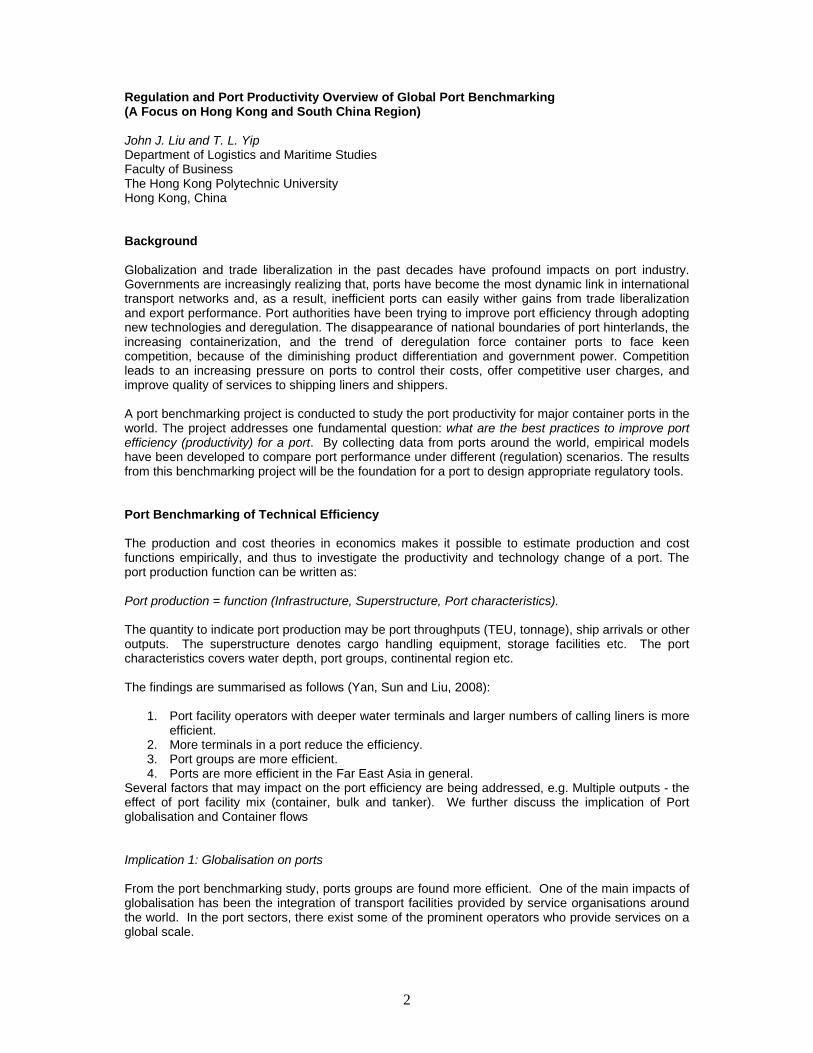
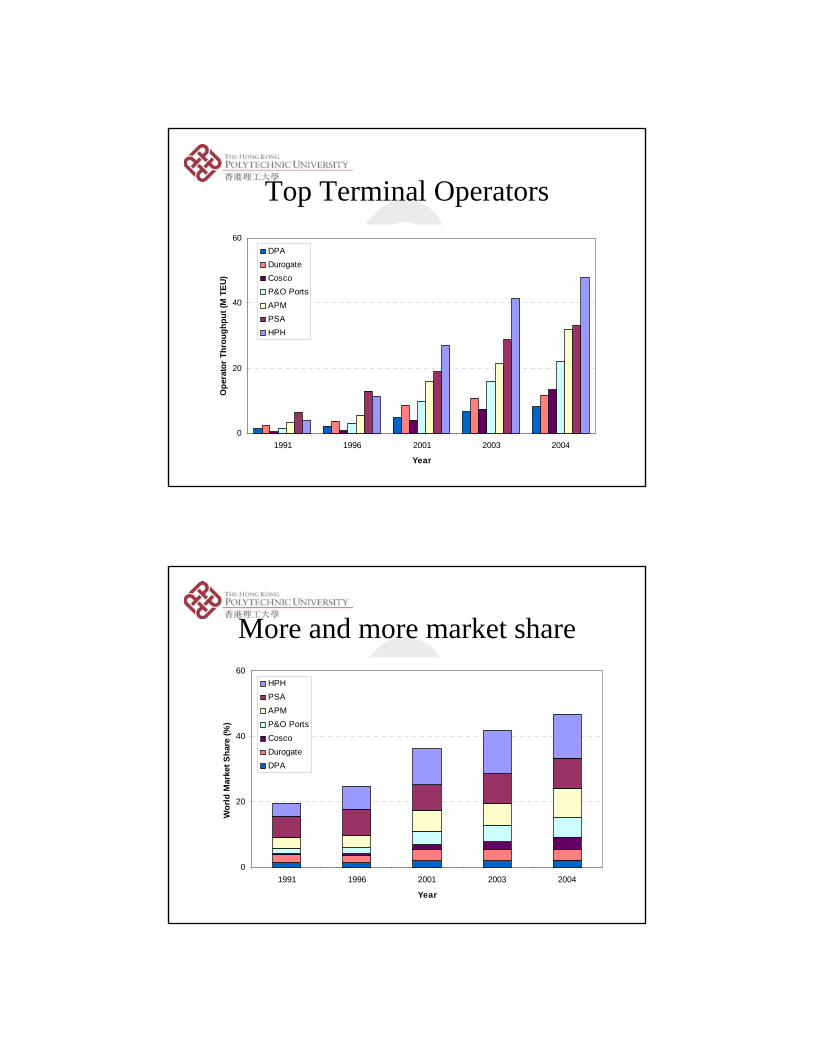
The effect of this port globalisation can be seen when some statistics are studied. Figure 1 shows the top seven container terminal operators. Hutchison Port Holdings (HPH), PSA Corporation and APM Terminals (Maersk Sealand) occupy the top 3 places since 1991. All top terminal operators have not only increased throughputs but also market share. The market share of leading operators increased from 19.6% in 1991 to 46.7% in 2004. Figure 1: Throughputs of top seven container terminal operators (ranked in 2004)
0
20
40
60
1991 1996 2001 2003 2004
Year
Ope
rato
r Th
roug
hput
(M T
EU)
DPADurogateCoscoP&O PortsAPMPSAHPH
Source: Drewry Shipping Consultants Figure 2: Market share of top seven container terminal operators
0
20
40
60
1991 1996 2001 2003 2004
Year
Wor
ld M
arke
t Sha
re (%
)
HPHPSAAPMP&O PortsCoscoDurogateDPA
Source: Drewry Shipping Consultants
4
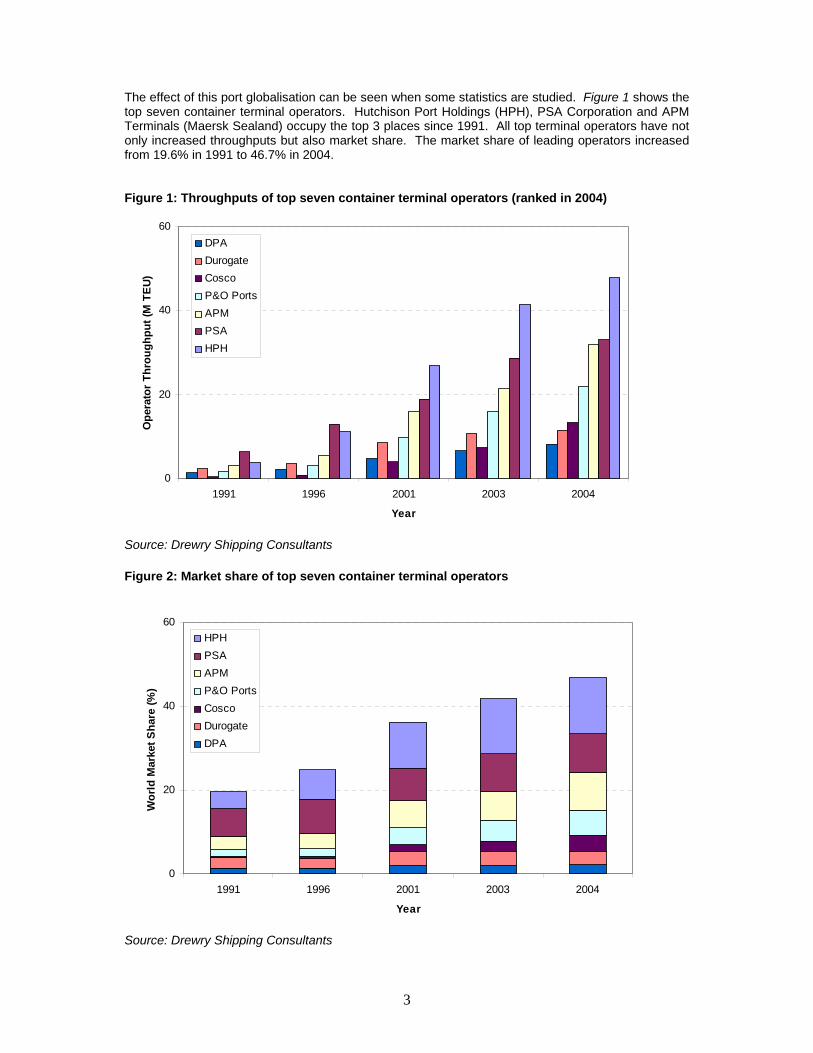
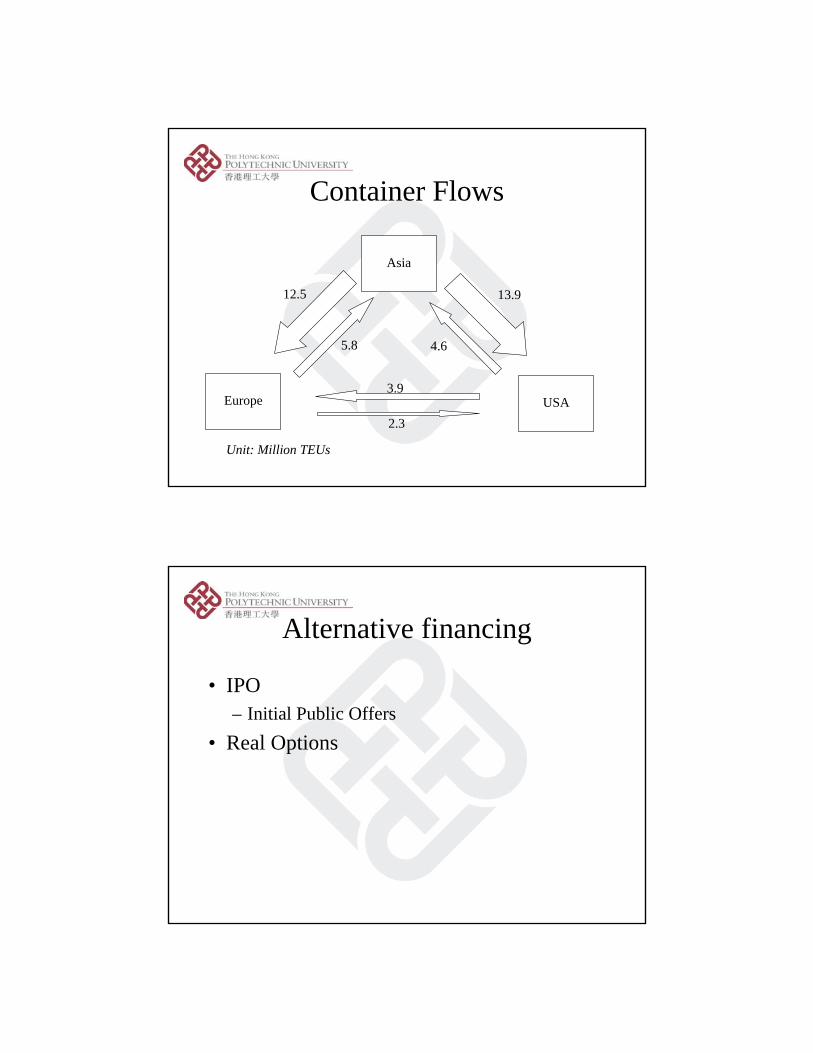
The structure of the container terminal industry has changed. Global and regional players are becoming increasingly dominant. Shipping lines have extended investment in ports. Implication 2: Asian ports are more efficient From the port benchmarking study, Asian ports groups are found more efficient compared against ports in other continents. The estimates of container flows on the three major containerised routes are illustrated in Figure 3. For the port sector, this trade pattern has resulted in 3 major effects. Firstly, terminals in Asia have to cope with the severe imbalance of trades and large volumes of empty containers have created an inventory problem. Secondly, terminals have to handle more containers than their counterparties in Europe and USA. Thirdly, terminals in the Far East attract more port investments. Figure 3: Estimated container flows on major trade routes in 2006 (Source: UNCTAD (2007). Review of Maritime Transport)
Implication 3: Ownership has little impacts on technical efficiency This is little evidence that port privatization has significantly enhanced growth. Investment in port infrastructure does not often lead to port traffic (e.g. Vancouver Fraser Port in Canada). Port privatisation is very often opposed by port labour, for examples, French Port (Lloyds List, 6 June 2008); Piraeus port of Greece (Seatrade, 2008). It is because privatisation implies restructuring, salary reduction and layoff. The government may face considerable political controversy soon after the plan of port privatization has been announced. Promoting Port Investments The port industry is by nature capitalistic, because it requires expensive infrastructure and huge capital to be completed. The government has to promote port investment so as to secure sources of funding for port projects and developments, e.g. Table 1. An appropriate financing scheme not only determine the approach for investments but also enhance a competitive advantage for port development.
Asia
Europe
USA
13.9
4.6
12.5
5.8
3.9
2.3
Unit: Million TEUs
5
One of port privatisation problems is that the port ownerships may be eventually transferred to foreign ownership that the government does not want, e.g. Dubai Ports World (DPW) intended to acquire P&O in 2006. Port privatisation may not create or improve port infrastructure and facilities to benefit the local economy (Baird and Valentine, 2007). In the past, port projects are funded or subsidised by the public sector. Today, the involvement of the private sector in the port industry has increased significantly in both developed and developing countries. However, port infrastructure projects have rarely financed by commercial banks but international lending institutions such as the World Bank, and Asian Development Bank. As the private sector involvement in port projects has increased, the World Bank (2007, p. 98) has enumerated seven elements which are shaping the nature of the private sector involvement in ports:
1. Expected yield 2. Debt / equity financing structure 3. Sponsorship 4. Legality of contracts 5. Transparency 6. Fair and open bidding procedures 7. Feasibility studies (technical, financial, economic and environmental)
The World Bank (2007) further discussed a large variety of funding schemes. The most prominent of these schemes are the various forms of “leasing” and “concession arrangements”.
1. Leasing – is a method by which an agreement is made for the right to use an asset (e.g. land, equipment) over an agreed period of time in return for payment. Payment can be a single one-off transaction or made in a series of instalments. The two dominant forms of leasing agreements are “lease contract” and “leasehold agreement”. The main methods of lease payment are ‘flat rate’, ‘minimum/maximum rate’ and ‘shared revenue’.
2. Concession arrangement – government maintains the ownership of the port land, but grants the concessionaire the right to fiancé, build and operate a facility or some equipment, for public use, for a stated period of time. The concessionaire not only covers the costs of investment but assumes all commercial risks. The major advantage of concession arrangement is to increase private financial participation in the development of the port without changing the structure of the port status.
Other private participation schemes are: management contracts (e.g. dedicated terminals), joint ventures, and BOT (build, operate, transfer) agreements (IAPH 2001; Ernst & Young 1994). An alternative financing scheme is Initial Public Offer (IPO). The liquidity of the stock exchange offer a better debt position and raise equity for future expansions, especially the currency risk (interest rate) are high (e.g. Tianjin port, Dalian port, Santos Brazil). China approach to finance port projects There are several characterise of China port policy:
1. The government (national or province) does not manage the terminals directly. 2. Foreign Direct Investment (FDI) is conducted in the form of joint venture. Foreign companies
were in effect restricted to holding less than 50% share of joint venture. 3. Foreign companies act as both investors and managers. Local authorities act as mainly
landlord of the terminals. The joint venture offers easier access to new technologies (for the benefits of China) and to new markets (in favour of foreign companies).
6
References: ADB (2000). Developing Best Practices for Promoting Private Sector Investment in Infrastructure. Manila, Philippines: Asian Development Bank. Baird, A. J. and Valentine, V.F. (2007). Port privatisation in the United Kingdom. In Devolution, Port Governance and Port Performance, Research in Transportation Economics, 17, 55-84. Ernst & Young (1998). Privatization – Investing in State-owned Enterprises Around the World. John Wiley & Sons, Inc. EU Commission (2004). Proposal for a Directive of the European Parliament and of the Council on Market Access to Port Services. Brussels. IAPH (2001). Guidelines for Port Planning and Design. Tokyo, Japan: International Association of Ports and Harbours. Liu, John J., Yip T. L. (2005) “Assessment and outlook of port competition in Greater China Region”, Asian Ports and Shipping, August 2005, Shanghai. Liu, John J., Yan J., Yip, T. L. (2007) “Competition and productivity of global container ports”. Proceedings of International Conference on Economic Development and Industrial Efficiency of East Asia, Taipei, 17 July, 2007, Section C3, pp. 1-7. Lloyd’s List (2008). Fresh wave of strikes hit French ports (6 June 2008). Seatrade (2008). Privatisation battle – The Greek government’s decision to privatise national ports is being fiercely opposed by determined dock workers. May/June 2008. WB (2007). Port Reform Toolkit, 2nd edition. Washington, DC: The World Bank. Yan, J., Sun X. and John J. Liu (2008). Assessing container operator efficiency with heterogeneous and time-varying production frontiers. Transportation Research Part B. doi: 10.1016/j.trb.2008.06.001 Yan, J., Sun X., Yip, T. L. (2006) “Efficiency analysis of global container ports with time-variant individual production frontiers”. INFORMS Annual Meeting, Pittsburgh.

7
Table 1: Examples of port privatization projects in Europe
Date Year Company Name Country Area SIC Sector
% for Sale
Value of Transaction in US$ million
Method of Sale
Market Area
01/02/1983 1983 Associated British Ports Hldgs
United Kingdom
Old Europe 4491 Transportation
Industry 51.5 33.4 PO Domestic
01/04/1984 1984 Associated British Ports Hldgs
United Kingdom
Old Europe 4491 Transportation
Industry 48.5 74.8 PO Domestic
31/01/1991 1991 Verolme Dockyard Ireland Old
Europe 4493 Transportation Industry 100 1.8 PS ------------
--
31/01/1992 1992 Tees and Hartlepool Port Authority
United Kingdom
Old Europe 4491 Transportation
Industry 100 328.23 PS --------------
11/03/1992 1992 Port of Tilbury United Kingdom
Old Europe 4493 Transportation
Industry 100 55.17 PS --------------
30/06/1992 1992 Medway Ports Authority
United Kingdom
Old Europe 4491 Transportation
Industry 100 51.2 PS --------------
17/11/1995 1995 Dundee Port Authority
United Kingdom
Old Europe 4491 Transportation
Industry 100 28.31 PS --------------
02/03/1998 1998 Mersey Docks & Harbour Co
United Kingdom
Old Europe 4491 Transportation
Industry 13.9 117.8 PO Domestic
01/01/1999 1999 Belfast Port United Kingdom
Old Europe 4491 Transportation
Industry NA 150 PO Domestic
01/08/2001 2001 Thessaloniki Port Authority Greece Old
Europe 4491 Transportation Industry 25 15 PO Domestic
26/07/2003 2003 Piraeus Port Authority Greece Old
Europe 4491 Transportation Industry 25.5 61.5 PO Domestic
Key: PO = Public offer, PS = Private sale Source: Privatization Barometer
Regulation and Port ProductivityOverview of Global Port Benchmarking
(A Focus on Hong Kong and South China Region)
John J. Liu and T.L. Yip(Hong Kong PolyU)
16 August 2008APEC Lima (Peru) 2008
APEC Seminar: Best Practices in Regulation of Ports
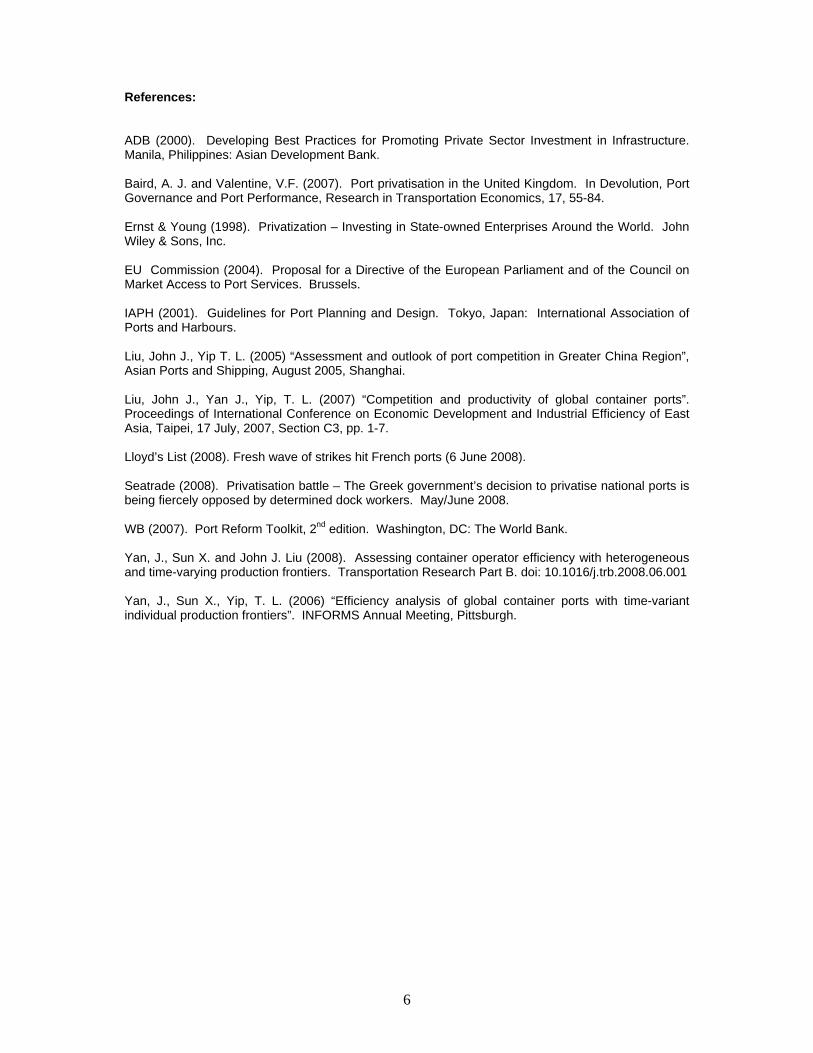
Key Factors in Port Productivity
Port technology: Output, Growth, and Innovation Input factors: Tangible (capital, labor), Intangible (usable knowledge, IT factors)Efficiency: Total factor productivity (TFP) heterogeneity (technical, political, and market) Regulation: Ownership, Legal system, Government quality, Governance system
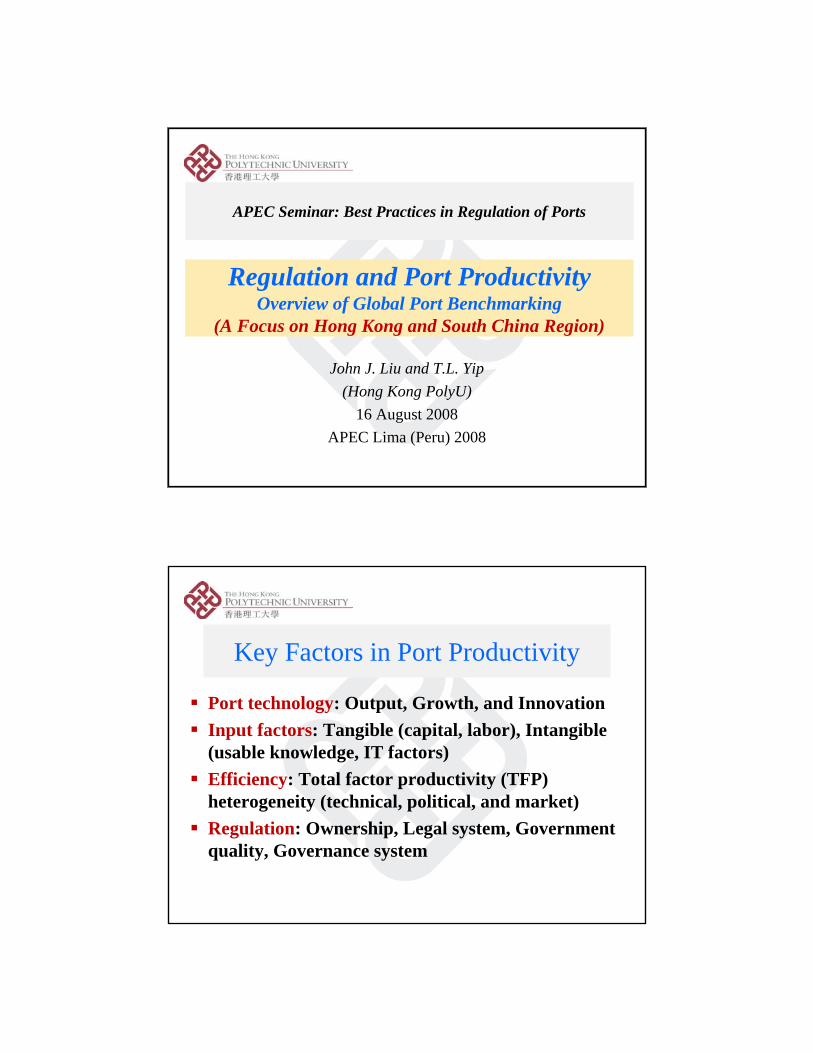
The puzzling IT-revolution: lagging and stepwise
Robert Solow (1987):``you see the computer revolution everywhere except in the productivity data''
Alan Greenspan (1996): Negative trends in measured productivity observed in many services industries seemed inconsistent with the fact that they ranked among the top computer-using industries
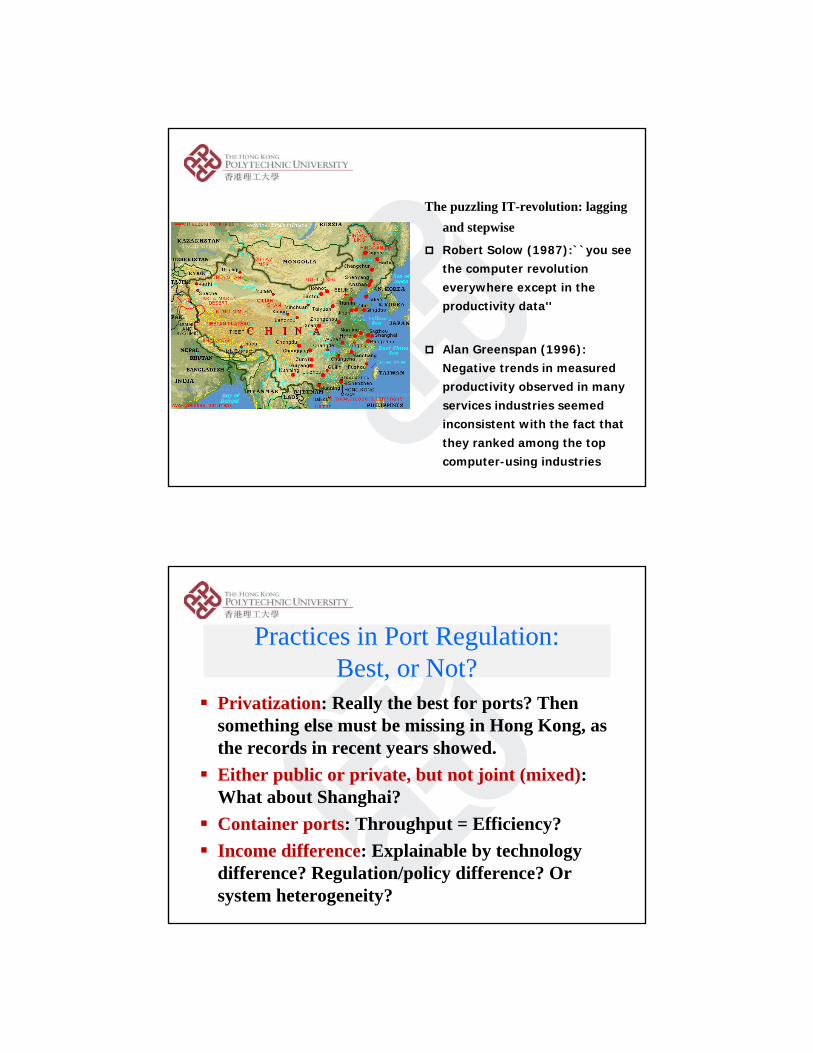
Practices in Port Regulation: Best, or Not?
Privatization: Really the best for ports? Then something else must be missing in Hong Kong, as the records in recent years showed.Either public or private, but not joint (mixed): What about Shanghai?Container ports: Throughput = Efficiency?Income difference: Explainable by technology difference? Regulation/policy difference? Or system heterogeneity?
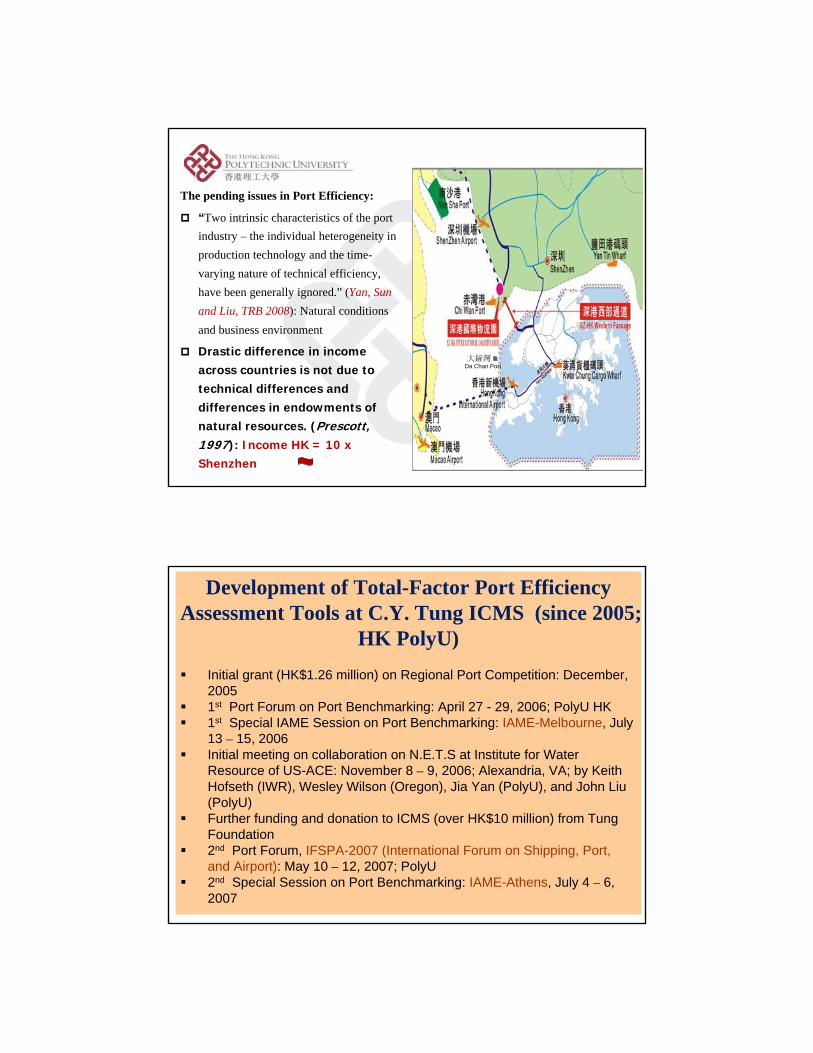
The pending issues in Port Efficiency:
“Two intrinsic characteristics of the port industry – the individual heterogeneity in production technology and the time-varying nature of technical efficiency, have been generally ignored.” (Yan, Sun and Liu, TRB 2008): Natural conditions and business environment
Drastic difference in income across countries is not due to technical differences and differences in endowments of natural resources. (Prescott, 1997): Income HK = 10 x Shenzhen
大鏟灣Da Chan Port
8/20/2008 LGT/Liu 6
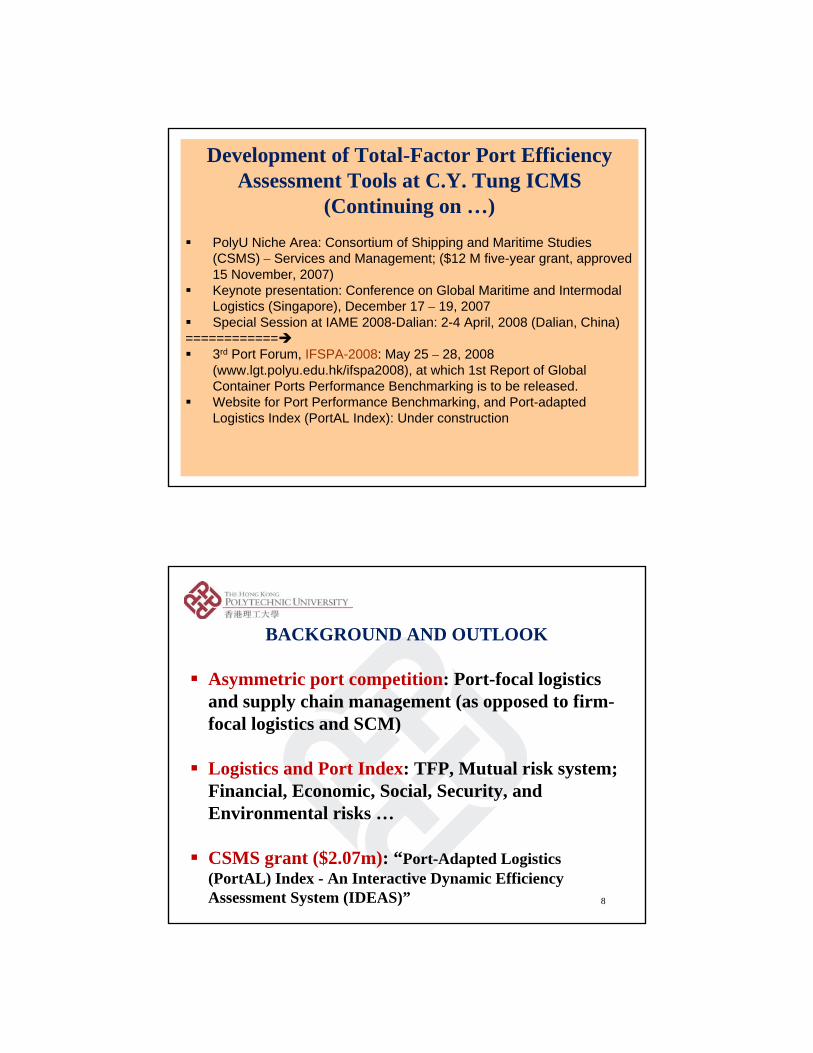
Development of Total-Factor Port Efficiency Assessment Tools at C.Y. Tung ICMS (since 2005;
HK PolyU)Initial grant (HK$1.26 million) on Regional Port Competition: December, 20051st Port Forum on Port Benchmarking: April 27 - 29, 2006; PolyU HK1st Special IAME Session on Port Benchmarking: IAME-Melbourne, July 13 – 15, 2006 Initial meeting on collaboration on N.E.T.S at Institute for Water Resource of US-ACE: November 8 – 9, 2006; Alexandria, VA; by Keith Hofseth (IWR), Wesley Wilson (Oregon), Jia Yan (PolyU), and John Liu (PolyU)Further funding and donation to ICMS (over HK$10 million) from Tung Foundation2nd Port Forum, IFSPA-2007 (International Forum on Shipping, Port, and Airport): May 10 – 12, 2007; PolyU2nd Special Session on Port Benchmarking: IAME-Athens, July 4 – 6, 2007
8/20/2008 LGT/Liu 7
Development of Total-Factor Port Efficiency Assessment Tools at C.Y. Tung ICMS
(Continuing on …)PolyU Niche Area: Consortium of Shipping and Maritime Studies (CSMS) – Services and Management; ($12 M five-year grant, approved 15 November, 2007)Keynote presentation: Conference on Global Maritime and Intermodal Logistics (Singapore), December 17 – 19, 2007Special Session at IAME 2008-Dalian: 2-4 April, 2008 (Dalian, China)
============3rd Port Forum, IFSPA-2008: May 25 – 28, 2008 (www.lgt.polyu.edu.hk/ifspa2008), at which 1st Report of Global Container Ports Performance Benchmarking is to be released.Website for Port Performance Benchmarking, and Port-adapted Logistics Index (PortAL Index): Under construction
8
BACKGROUND AND OUTLOOK
Asymmetric port competition: Port-focal logistics and supply chain management (as opposed to firm-focal logistics and SCM)
Logistics and Port Index: TFP, Mutual risk system; Financial, Economic, Social, Security, and Environmental risks …
CSMS grant ($2.07m): “Port-Adapted Logistics (PortAL) Index - An Interactive Dynamic Efficiency Assessment System (IDEAS)”
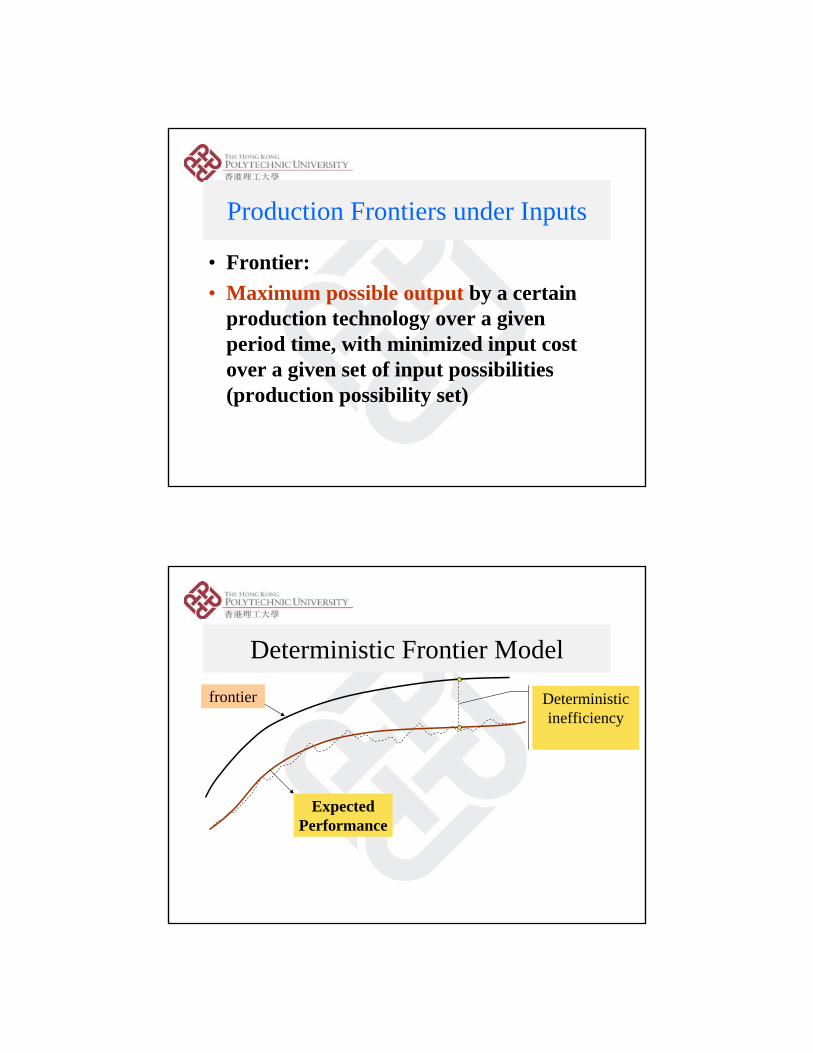
Production Frontiers under Inputs
• Frontier:• Maximum possible output by a certain
production technology over a given period time, with minimized input cost over a given set of input possibilities (production possibility set)
Deterministic Frontier Model
Deterministic inefficiency
Expected Performance
frontier
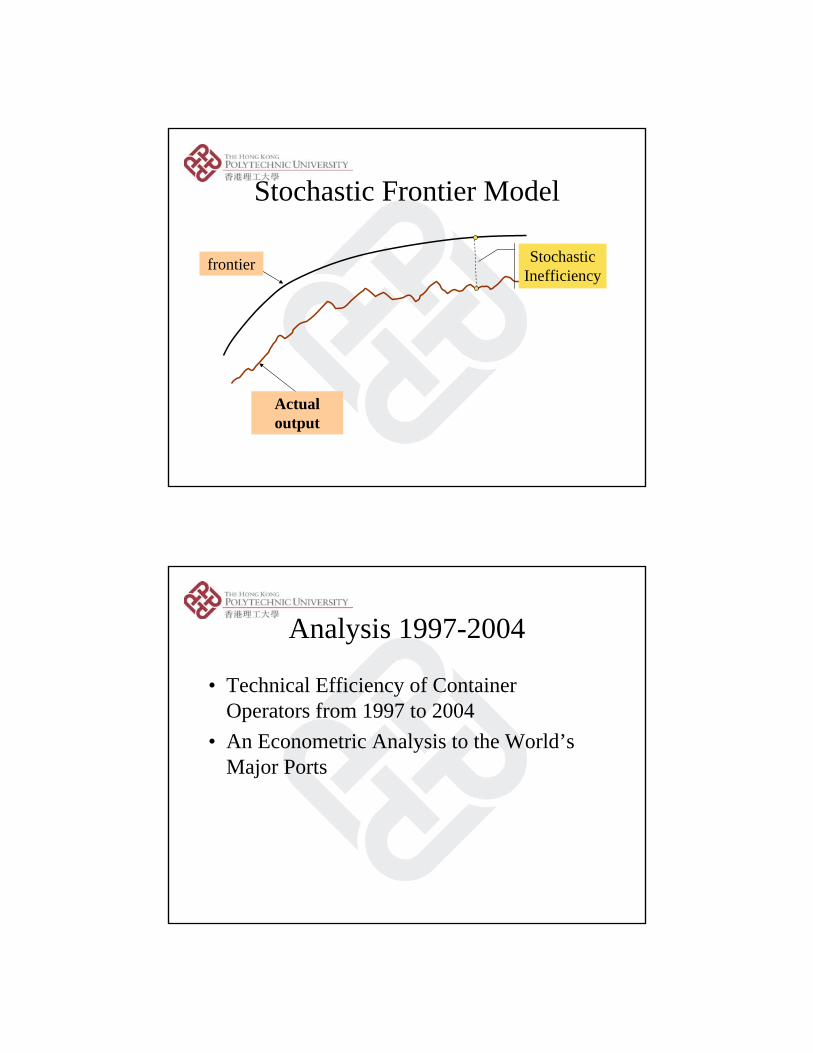
Stochastic Frontier Model
Stochastic Inefficiency
frontier
Actual output
Analysis 1997-2004
• Technical Efficiency of Container Operators from 1997 to 2004
• An Econometric Analysis to the World’s Major Ports
Objectives
• To study the production efficiency of container port industry
• To develop corresponding econometric tools
Features should be incorporated in an empirical model
• Controlling for individual heterogeneity: Clustering effects (by port, country, region, and port groups);
• Controlling for the technical change;
• Time varying efficiency and time persistence in efficiency change;
Output Variables
• 1. Container Throughput (TEUs)• 2. Cargo Throughput (tones)• 3. Vessel Arrivals/Departures• 4. Ship Turn Around Time
Input Variables• 1. Cargo handling equipments: Quay crane, Yard
crane, Mobile crane, Forklifts, etc;• 2. Terminal infrastructure: number of container
berths, Length of quay lines, Terminal area, etc;• 3. Labor inputs: Working hours, number of full-time
workers;• 4. Storage facilities: storage area, reefer points
Port characteristics• 1. Depth of Water• 2. Number of ship calls• 3. Ownership structure• 4. Number of Operators• 5. Corporate law system and many social
economic variables
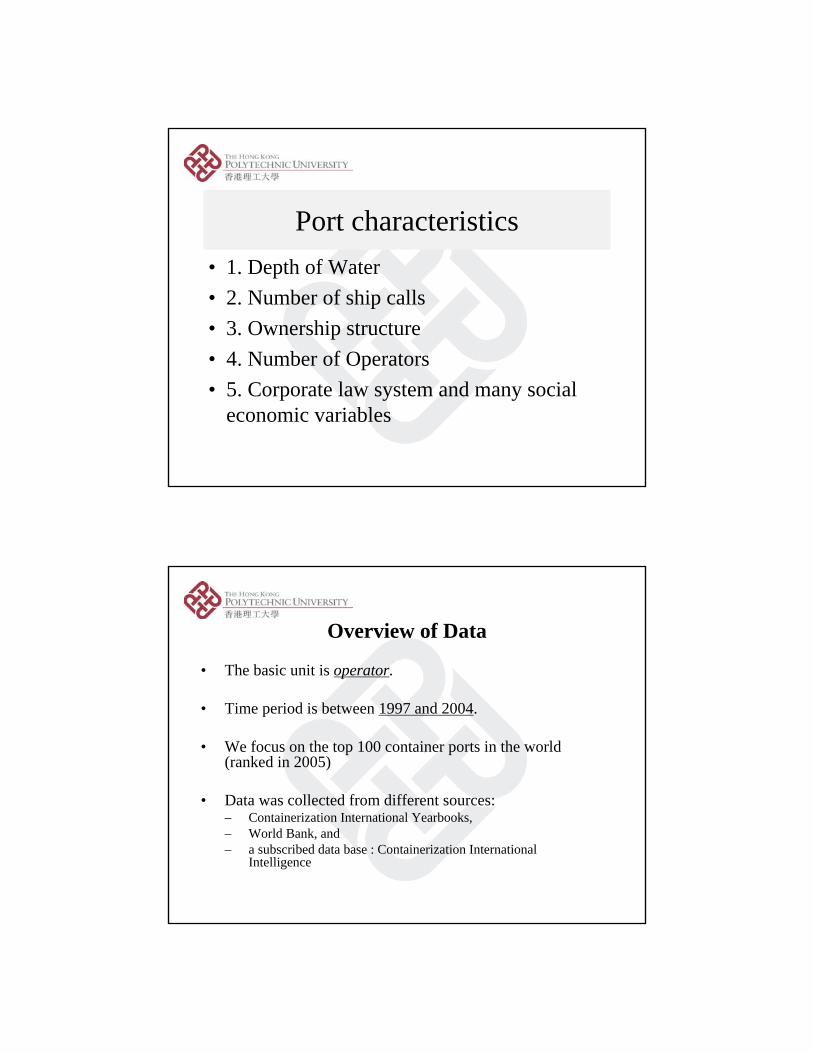
Overview of Data
• The basic unit is operator.
• Time period is between 1997 and 2004.
• We focus on the top 100 container ports in the world (ranked in 2005)
• Data was collected from different sources:– Containerization International Yearbooks, – World Bank, and – a subscribed data base : Containerization International
Intelligence
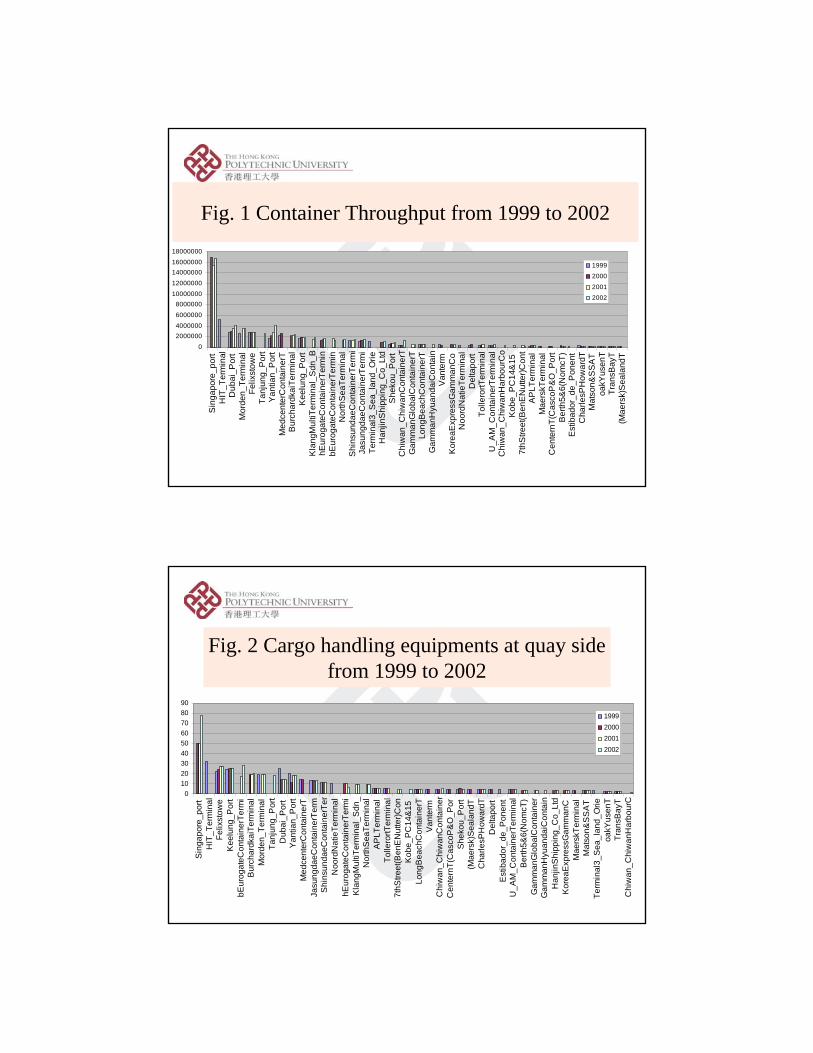
Fig. 1 Container Throughput from 1999 to 2002
0
20000004000000
6000000
800000010000000
12000000
1400000016000000
18000000
Sin
gapo
re_p
ort
HIT
_Ter
min
alD
ubai
_Por
tM
orde
n_Te
rmin
alFe
lixst
owe
Tanj
ung_
Por
tY
antia
n_P
ort
Med
cent
erC
onta
iner
TB
urch
ardk
aiTe
rmin
alK
eelu
ng_P
ort
Kla
ngM
ultiT
erm
inal
_Sdn
_BhE
urog
ateC
onta
iner
Term
inbE
urog
ateC
onta
iner
Term
inN
orth
Sea
Term
inal
Shi
nsun
daeC
onta
iner
Term
iJa
sung
daeC
onta
iner
Term
iTe
rmin
al3_
Sea
_lan
d_O
rieH
anjin
Shi
ppin
g_C
o_Lt
dS
heko
u_P
ort
Chi
wan
_Chi
wan
Con
tain
erT
Gam
man
Glo
balC
onta
iner
TLo
ngB
each
Con
tain
erT
Gam
man
Hyu
anda
iCon
tain
Van
term
Kor
eaE
xpre
ssG
amm
anC
oN
oord
Nat
ieTe
rmin
alD
elta
port
Tolle
rortT
erm
inal
U_A
M_C
onta
iner
Term
inal
Chi
wan
_Chi
wan
Har
bour
Co
Kob
e_P
C14
&15
7thS
treet
(Ben
EN
utte
r)Con
tA
PLT
erm
inal
Mae
rskT
erm
inal
Cen
tern
T(C
asco
P&
O_P
ort
Ber
th5&
6(N
omcT
)E
stib
ador
_de_
Pon
ent
Cha
rlesP
How
ardT
Mat
son&
SS
AT
oakY
usen
TTr
ansB
ayT
(Mae
rsk)
Sea
land
T
1999
2000
2001
2002
Fig. 2 Cargo handling equipments at quay side from 1999 to 2002
0102030405060708090
Sin
gapo
re_p
ort
HIT
_Ter
min
alFe
lixst
owe
Kee
lung
_Por
tbE
urog
ateC
onta
iner
Term
iB
urch
ardk
aiTe
rmin
alM
orde
n_Te
rmin
alTa
njun
g_P
ort
Dub
ai_P
ort
Yan
tian_
Por
tM
edce
nter
Con
tain
erT
Jasu
ngda
eCon
tain
erTe
rmS
hins
unda
eCon
tain
erTe
rN
oord
Nat
ieTe
rmin
alhE
urog
ateC
onta
iner
Term
iK
lang
Mul
tiTer
min
al_S
dn_
Nor
thS
eaTe
rmin
alA
PLT
erm
inal
Tolle
rortT
erm
inal
7thS
treet
(Ben
EN
utte
r)Con
Kob
e_P
C14
&15
Long
Bea
chC
onta
iner
TV
ante
rmC
hiw
an_C
hiw
anC
onta
iner
Cen
tern
T(C
asco
P&
O_P
orS
heko
u_P
ort
(Mae
rsk)
Sea
land
TC
harle
sPH
owar
dTD
elta
port
Est
ibad
or_d
e_P
onen
tU
_AM
_Con
tain
erTe
rmin
alB
erth
5&6(
Nom
cT)
Gam
man
Glo
balC
onta
iner
Gam
man
Hyu
anda
iCon
tain
Han
jinS
hipp
ing_
Co_
Ltd
Kor
eaE
xpre
ssG
amm
anC
Mae
rskT
erm
inal
Mat
son&
SS
AT
Term
inal
3_S
ea_l
and_
Orie
oakY
usen
TTr
ansB
ayT
Chi
wan
_Chi
wan
Har
bour
C
1999200020012002
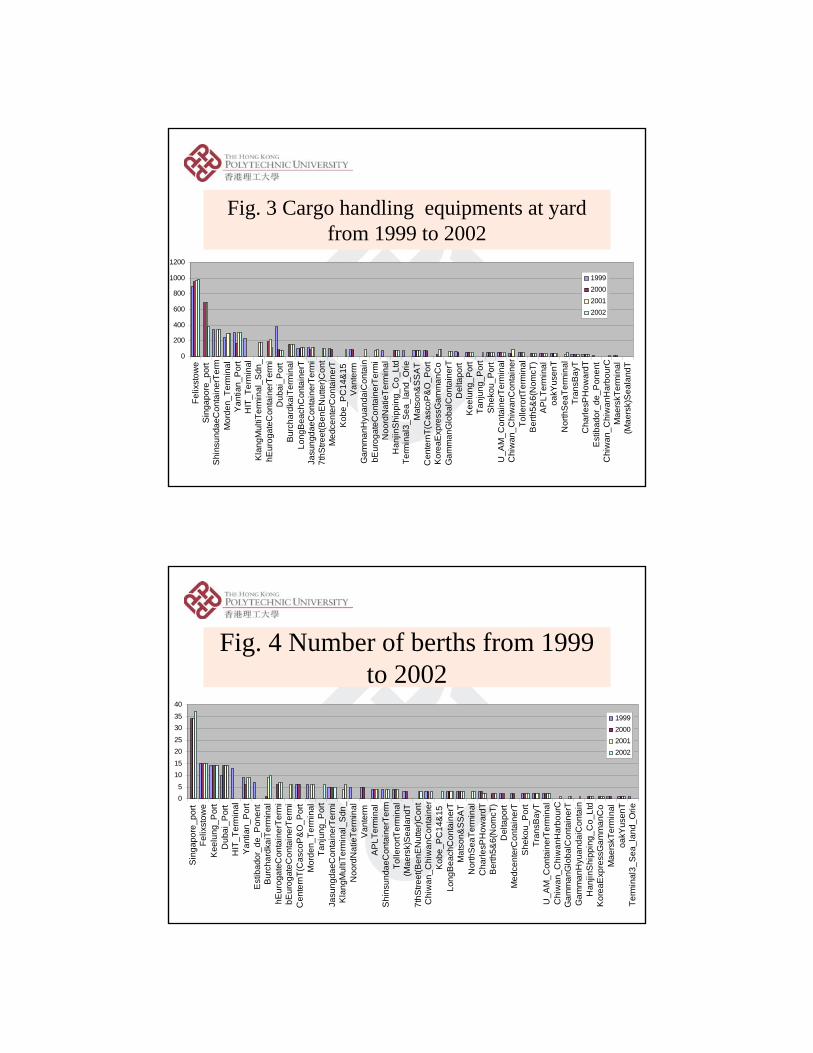
Fig. 3 Cargo handling equipments at yard from 1999 to 2002
0
200
400
600
800
1000
1200
Felix
stow
eS
inga
pore
_por
tS
hins
unda
eCon
tain
erTe
rmM
orde
n_Te
rmin
alY
antia
n_P
ort
HIT
_Ter
min
alK
lang
Mul
tiTer
min
al_S
dn_
hEur
ogat
eCon
tain
erTe
rmi
Dub
ai_P
ort
Bur
char
dkai
Term
inal
Long
Bea
chC
onta
iner
TJa
sung
daeC
onta
iner
Term
i7t
hStre
et(B
enE
Nut
ter)C
ont
Med
cent
erC
onta
iner
TK
obe_
PC
14&
15V
ante
rmG
amm
anH
yuan
daiC
onta
inbE
urog
ateC
onta
iner
Term
iN
oord
Nat
ieTe
rmin
alH
anjin
Shi
ppin
g_C
o_Lt
dTe
rmin
al3_
Sea
_lan
d_O
rieM
atso
n&S
SA
TC
ente
rnT(
Cas
coP
&O
_Por
tK
orea
Exp
ress
Gam
man
Co
Gam
man
Glo
balC
onta
iner
TD
elta
port
Kee
lung
_Por
tTa
njun
g_P
ort
She
kou_
Por
tU
_AM
_Con
tain
erTe
rmin
alC
hiw
an_C
hiw
anC
onta
iner
Tolle
rortT
erm
inal
Ber
th5&
6(N
omcT
)A
PLT
erm
inal
oakY
usen
TN
orth
Sea
Term
inal
Tran
sBay
TC
harle
sPH
owar
dTE
stib
ador
_de_
Pon
ent
Chi
wan
_Chi
wan
Har
bour
CM
aers
kTer
min
al(M
aers
k)S
eala
ndT
1999200020012002
Fig. 4 Number of berths from 1999 to 2002
05
1015
2025
3035
40
Sin
gapo
re_p
ort
Felix
stow
eK
eelu
ng_P
ort
Dub
ai_P
ort
HIT
_Ter
min
alY
antia
n_P
ort
Est
ibad
or_d
e_P
onen
tB
urch
ardk
aiTe
rmin
alhE
urog
ateC
onta
iner
Term
ibE
urog
ateC
onta
iner
Term
iC
ente
rnT(
Cas
coP
&O
_Por
tM
orde
n_Te
rmin
alTa
njun
g_P
ort
Jasu
ngda
eCon
tain
erTe
rmi
Kla
ngM
ultiT
erm
inal
_Sdn
_N
oord
Nat
ieTe
rmin
alV
ante
rmA
PLT
erm
inal
Shi
nsun
daeC
onta
iner
Term
Tolle
rortT
erm
inal
(Mae
rsk)
Sea
land
T7t
hStre
et(B
enE
Nut
ter)C
ont
Chi
wan
_Chi
wan
Con
tain
erK
obe_
PC
14&
15Lo
ngB
each
Con
tain
erT
Mat
son&
SS
AT
Nor
thS
eaTe
rmin
alC
harle
sPH
owar
dTB
erth
5&6(
Nom
cT)
Del
tapo
rtM
edce
nter
Con
tain
erT
She
kou_
Por
tTr
ansB
ayT
U_A
M_C
onta
iner
Term
inal
Chi
wan
_Chi
wan
Har
bour
CG
amm
anG
loba
lCon
tain
erT
Gam
man
Hyu
anda
iCon
tain
Han
jinS
hipp
ing_
Co_
Ltd
Kor
eaE
xpre
ssG
amm
anC
oM
aers
kTer
min
aloa
kYus
enT
Term
inal
3_S
ea_l
and_
Orie
1999200020012002
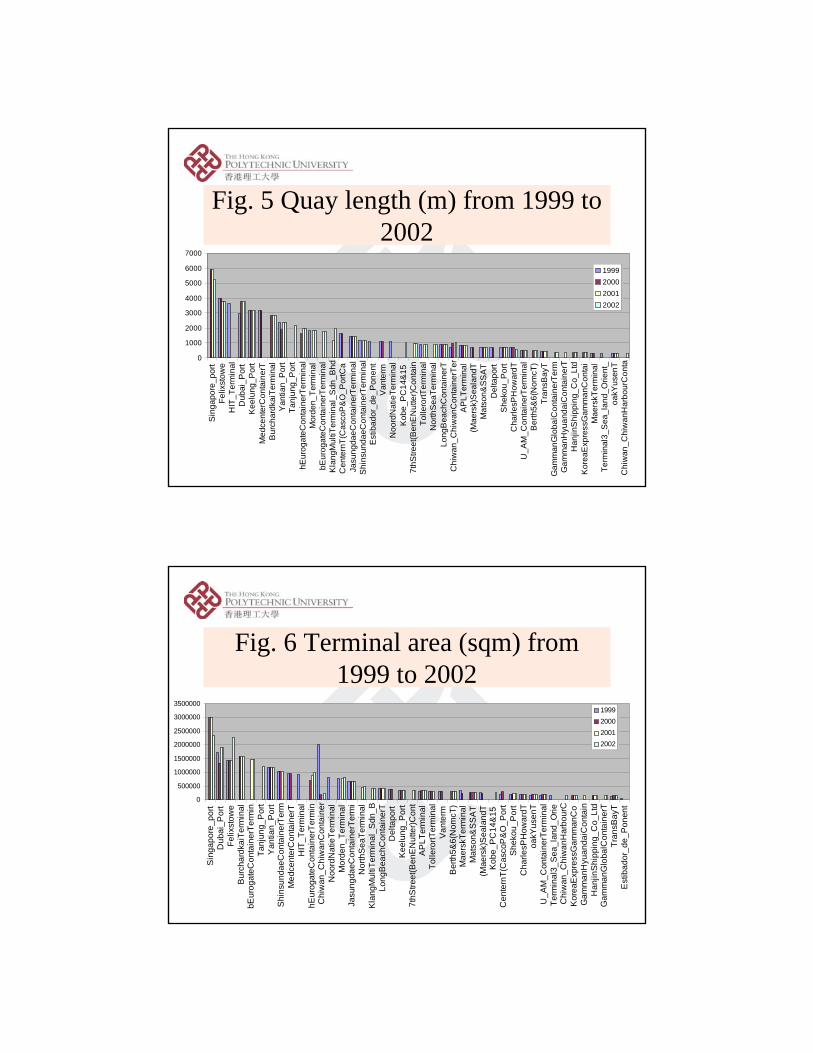
Fig. 5 Quay length (m) from 1999 to 2002
0
1000
2000
3000
4000
5000
6000
7000
Sin
gapo
re_p
ort
Felix
stow
eH
IT_T
erm
inal
Dub
ai_P
ort
Kee
lung
_Por
tM
edce
nter
Con
tain
erT
Bur
char
dkai
Term
inal
Yan
tian_
Por
tTa
njun
g_P
ort
hEur
ogat
eCon
tain
erTe
rmin
alM
orde
n_Te
rmin
albE
urog
ateC
onta
iner
Term
inal
Kla
ngM
ultiT
erm
inal
_Sdn
_Bhd
Cen
tern
T(C
asco
P&
O_P
ortC
aJa
sung
daeC
onta
iner
Term
inal
Shi
nsun
daeC
onta
iner
Term
inal
Est
ibad
or_d
e_P
onen
tV
ante
rmN
oord
Nat
ieTe
rmin
alK
obe_
PC
14&
157t
hStre
et(B
enE
Nut
ter)C
onta
inTo
llero
rtTer
min
alN
orth
Sea
Term
inal
Long
Bea
chC
onta
iner
TC
hiw
an_C
hiw
anC
onta
iner
Ter
AP
LTer
min
al(M
aers
k)S
eala
ndT
Mat
son&
SS
AT
Del
tapo
rtS
heko
u_P
ort
Cha
rlesP
How
ardT
U_A
M_C
onta
iner
Term
inal
Ber
th5&
6(N
omcT
)Tr
ansB
ayT
Gam
man
Glo
balC
onta
iner
Term
Gam
man
Hyu
anda
iCon
tain
erT
Han
jinS
hipp
ing_
Co_
Ltd
Kor
eaE
xpre
ssG
amm
anC
onta
iM
aers
kTer
min
alTe
rmin
al3_
Sea
_lan
d_O
rient
_oa
kYus
enT
Chi
wan
_Chi
wan
Har
bour
Con
ta
1999200020012002
Fig. 6 Terminal area (sqm) from 1999 to 2002
0
500000
1000000
1500000
2000000
2500000
3000000
3500000
Sin
gapo
re_p
ort
Dub
ai_P
ort
Felix
stow
eB
urch
ardk
aiTe
rmin
albE
urog
ateC
onta
iner
Term
inTa
njun
g_P
ort
Yan
tian_
Por
tS
hins
unda
eCon
tain
erTe
rmM
edce
nter
Con
tain
erT
HIT
_Ter
min
alhE
urog
ateC
onta
iner
Term
inC
hiw
an_C
hiw
anC
onta
iner
Noo
rdN
atie
Term
inal
Mor
den_
Term
inal
Jasu
ngda
eCon
tain
erTe
rmi
Nor
thS
eaTe
rmin
alK
lang
Mul
tiTer
min
al_S
dn_B
Long
Bea
chC
onta
iner
TD
elta
port
Kee
lung
_Por
t7t
hStre
et(B
enE
Nut
ter)C
ont
AP
LTer
min
alTo
llero
rtTer
min
alV
ante
rmB
erth
5&6(
Nom
cT)
Mae
rskT
erm
inal
Mat
son&
SS
AT
(Mae
rsk)
Sea
land
TK
obe_
PC
14&
15C
ente
rnT(
Cas
coP
&O
_Por
tS
heko
u_P
ort
Cha
rlesP
How
ardT
oakY
usen
TU
_AM
_Con
tain
erTe
rmin
alTe
rmin
al3_
Sea
_lan
d_O
rieC
hiw
an_C
hiw
anH
arbo
urC
Kor
eaE
xpre
ssG
amm
anC
oG
amm
anH
yuan
daiC
onta
inH
anjin
Shi
ppin
g_C
o_Lt
dG
amm
anG
loba
lCon
tain
erT
Tran
sBay
TE
stib
ador
_de_
Pon
ent
1999200020012002
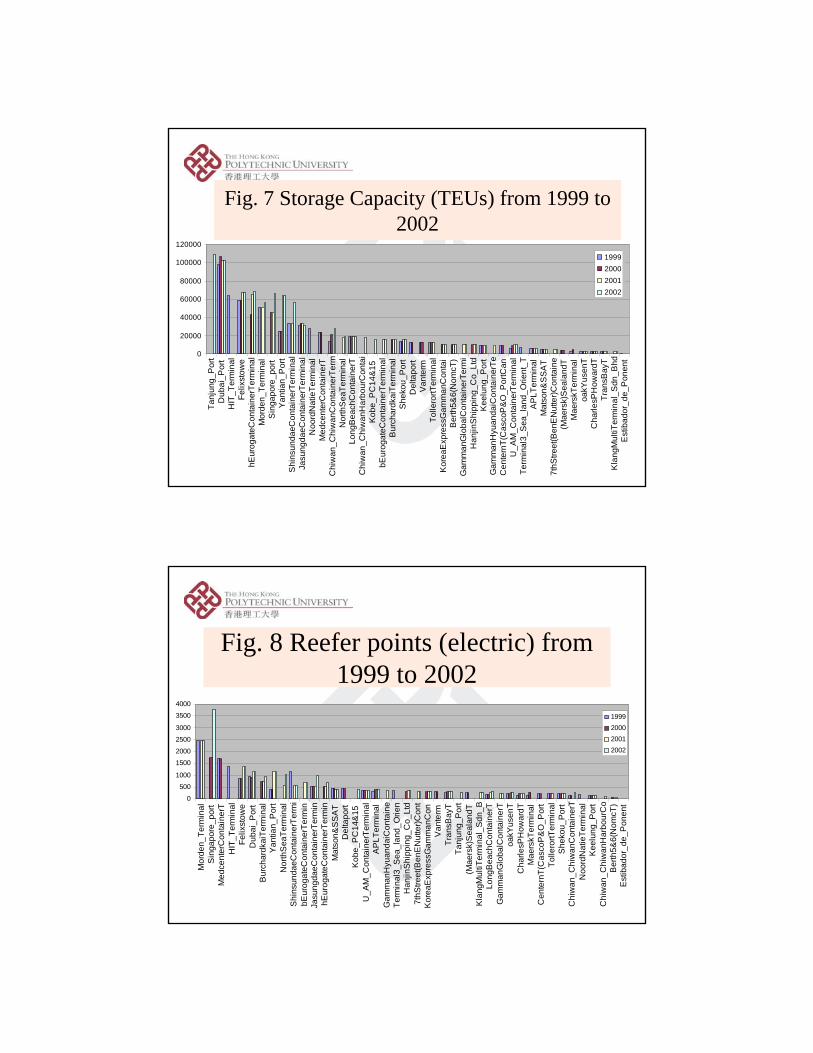
Fig. 7 Storage Capacity (TEUs) from 1999 to 2002
0
20000
40000
60000
80000
100000
120000
Tanj
ung_
Por
tD
ubai
_Por
tH
IT_T
erm
inal
Felix
stow
ehE
urog
ateC
onta
iner
Term
inal
Mor
den_
Term
inal
Sin
gapo
re_p
ort
Yan
tian_
Por
tS
hins
unda
eCon
tain
erTe
rmin
alJa
sung
daeC
onta
iner
Term
inal
Noo
rdN
atie
Term
inal
Med
cent
erC
onta
iner
TC
hiw
an_C
hiw
anC
onta
iner
Term
Nor
thS
eaTe
rmin
alLo
ngB
each
Con
tain
erT
Chi
wan
_Chi
wan
Har
bour
Con
tai
Kob
e_P
C14
&15
bEur
ogat
eCon
tain
erTe
rmin
alB
urch
ardk
aiTe
rmin
alS
heko
u_P
ort
Del
tapo
rtV
ante
rmTo
llero
rtTer
min
alK
orea
Exp
ress
Gam
man
Con
tai
Ber
th5&
6(N
omcT
)G
amm
anG
loba
lCon
tain
erTe
rmi
Han
jinS
hipp
ing_
Co_
Ltd
Kee
lung
_Por
tG
amm
anH
yuan
daiC
onta
iner
TeC
ente
rnT(
Cas
coP
&O
_Por
tCan
U_A
M_C
onta
iner
Term
inal
Term
inal
3_S
ea_l
and_
Orie
nt_T
AP
LTer
min
alM
atso
n&S
SA
T7t
hStre
et(B
enE
Nut
ter)C
onta
ine
(Mae
rsk)
Sea
land
TM
aers
kTer
min
aloa
kYus
enT
Cha
rlesP
How
ardT
Tran
sBay
TK
lang
Mul
tiTer
min
al_S
dn_B
hdE
stib
ador
_de_
Pon
ent
1999200020012002
Fig. 8 Reefer points (electric) from 1999 to 2002
0
500
1000
1500
2000
2500
3000
3500
4000
Mor
den_
Term
inal
Sin
gapo
re_p
ort
Med
cent
erC
onta
iner
TH
IT_T
erm
inal
Felix
stow
eD
ubai
_Por
tB
urch
ardk
aiTe
rmin
alY
antia
n_P
ort
Nor
thS
eaTe
rmin
alS
hins
unda
eCon
tain
erTe
rmi
bEur
ogat
eCon
tain
erTe
rmin
Jasu
ngda
eCon
tain
erTe
rmin
hEur
ogat
eCon
tain
erTe
rmin
Mat
son&
SS
AT
Del
tapo
rtK
obe_
PC
14&
15U
_AM
_Con
tain
erTe
rmin
alA
PLT
erm
inal
Gam
man
Hyu
anda
iCon
tain
eTe
rmin
al3_
Sea
_lan
d_O
rien
Han
jinS
hipp
ing_
Co_
Ltd
7thS
treet
(Ben
EN
utte
r)Con
tK
orea
Exp
ress
Gam
man
Con
Van
term
Tran
sBay
TTa
njun
g_P
ort
(Mae
rsk)
Sea
land
TK
lang
Mul
tiTer
min
al_S
dn_B
Long
Bea
chC
onta
iner
TG
amm
anG
loba
lCon
tain
erT
oakY
usen
TC
harle
sPH
owar
dTM
aers
kTer
min
alC
ente
rnT(
Cas
coP
&O
_Por
tTo
llero
rtTer
min
alS
heko
u_P
ort
Chi
wan
_Chi
wan
Con
tain
erT
Noo
rdN
atie
Term
inal
Kee
lung
_Por
tC
hiw
an_C
hiw
anH
arbo
urC
oB
erth
5&6(
Nom
cT)
Est
ibad
or_d
e_P
onen
t
1999200020012002
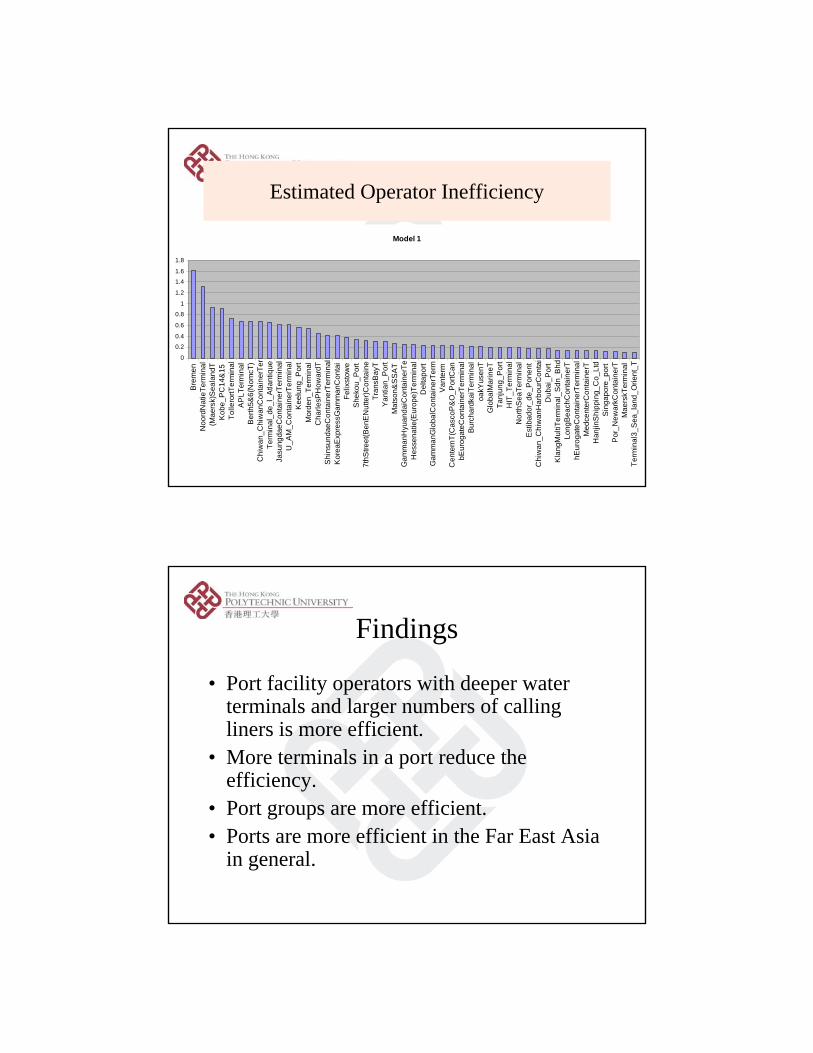
Estimated Operator Inefficiency
Model 1
0
0.2
0.4
0.6
0.8
1
1.2
1.4
1.6
1.8
Bre
men
Noo
rdN
atie
Term
inal
(Mae
rsk)
Sea
land
TK
obe_
PC
14&
15To
llero
rtTer
min
alA
PLT
erm
inal
Ber
th5&
6(N
omcT
)C
hiw
an_C
hiw
anC
onta
iner
Ter
Term
inal
_de_
l_A
tlant
ique
Jasu
ngda
eCon
tain
erTe
rmin
alU
_AM
_Con
tain
erTe
rmin
alK
eelu
ng_P
ort
Mor
den_
Term
inal
Cha
rlesP
How
ardT
Shi
nsun
daeC
onta
iner
Term
inal
Kor
eaE
xpre
ssG
amm
anC
onta
iFe
lixst
owe
She
kou_
Por
t7t
hStre
et(B
enE
Nut
ter)C
onta
ine
Tran
sBay
TY
antia
n_P
ort
Mat
son&
SS
AT
Gam
man
Hyu
anda
iCon
tain
erTe
Hes
sena
tie(E
urop
e)Te
rmin
alD
elta
port
Gam
man
Glo
balC
onta
iner
Term
Van
term
Cen
tern
T(C
asco
P&
O_P
ortC
anbE
urog
ateC
onta
iner
Term
inal
Bur
char
dkai
Term
inal
oakY
usen
TG
loba
lMar
ineT
Tanj
ung_
Por
tH
IT_T
erm
inal
Nor
thS
eaTe
rmin
alE
stib
ador
_de_
Pon
ent
Chi
wan
_Chi
wan
Har
bour
Con
tai
Dub
ai_P
ort
Kla
ngM
ultiT
erm
inal
_Sdn
_Bhd
Long
Bea
chC
onta
iner
ThE
urog
ateC
onta
iner
Term
inal
Med
cent
erC
onta
iner
TH
anjin
Shi
ppin
g_C
o_Lt
dS
inga
pore
_por
tP
or_N
ewar
kCon
tain
erT
Mae
rskT
erm
inal
Term
inal
3_S
ea_l
and_
Orie
nt_T
Findings
• Port facility operators with deeper water terminals and larger numbers of calling liners is more efficient.
• More terminals in a port reduce the efficiency.
• Port groups are more efficient.• Ports are more efficient in the Far East Asia
in general.
Top Terminal Operators
0
20
40
60
1991 1996 2001 2003 2004
Year
Ope
rato
r Thr
ough
put (
M T
EU)
DPADurogateCoscoP&O PortsAPMPSAHPH
More and more market share
0
20
40
60
1991 1996 2001 2003 2004
Year
Wor
ld M
arke
t Sha
re (%
)
HPHPSAAPMP&O PortsCoscoDurogateDPA
Container Flows
Asia
Europe USA
13.9
4.6
12.5
5.8
3.9
2.3
Unit: Million TEUs
Alternative financing
• IPO– Initial Public Offers
• Real Options
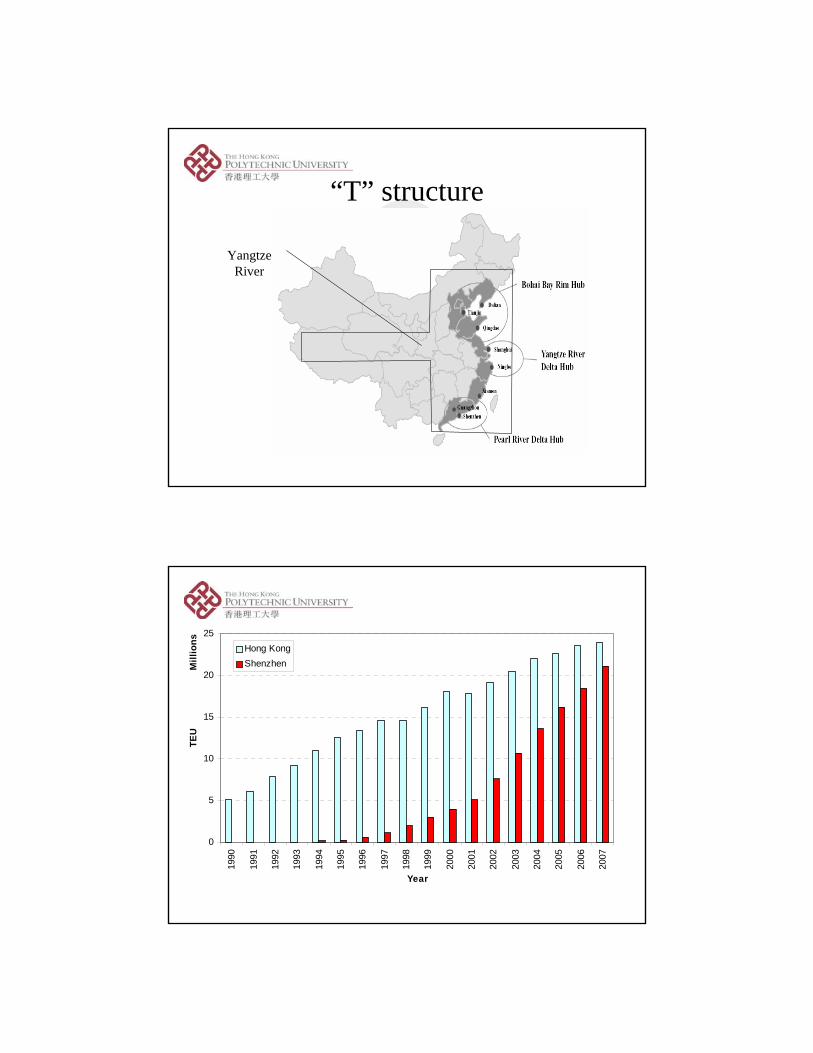
“T” structure
Yangtze River
0
5
10
15
20
25
1990
1991
1992
1993
1994
1995
1996
1997
1998
1999
2000
2001
2002
2003
2004
2005
2006
2007
Mill
ions
Year
TEU
Hong KongShenzhen
Source: Hong Kong Container Terminal Operators Association
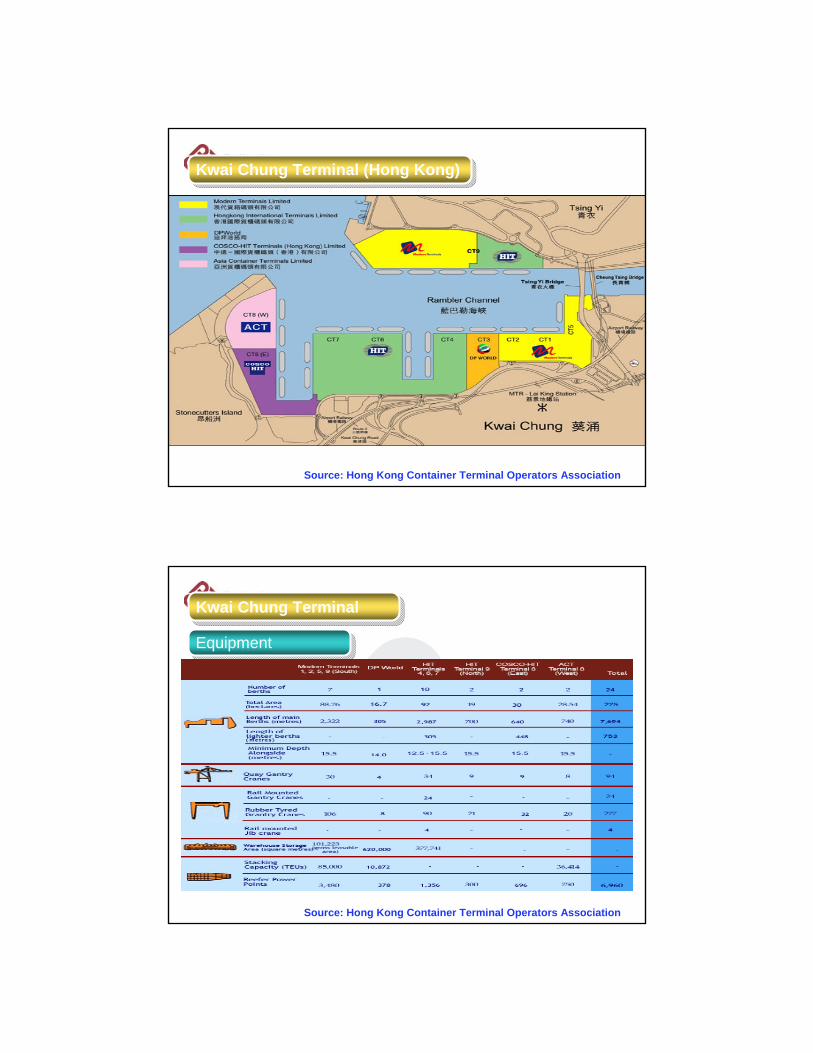
Kwai Chung Terminal (Hong Kong)Kwai Chung Terminal (Hong Kong)
Kwai Chung Terminal Kwai Chung Terminal
EquipmentEquipment
Source: Hong Kong Container Terminal Operators Association
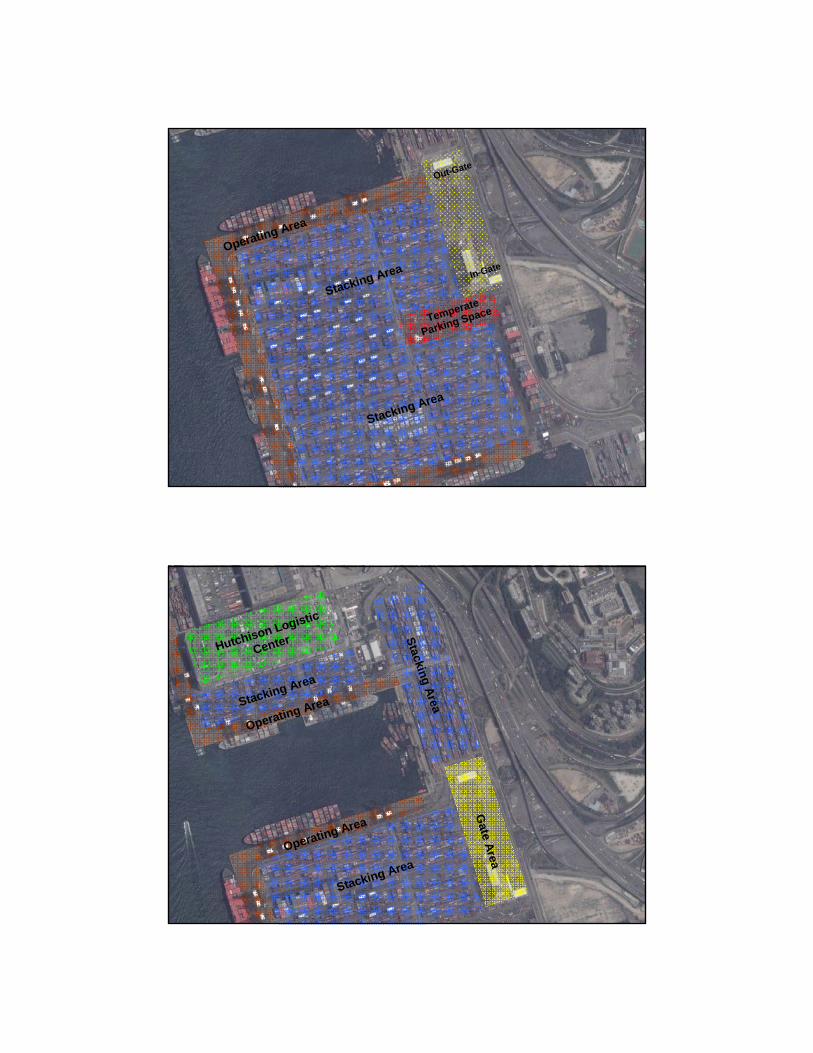
In-Gate
Out-Gate
Stacking Area
Stacking Area
Temperate
Parking Space
Operating Area
Stacking Area
Stacking Area
Hutchison Logistic
Center Stacking Area
Operating Area
Operating Area
Gate Area
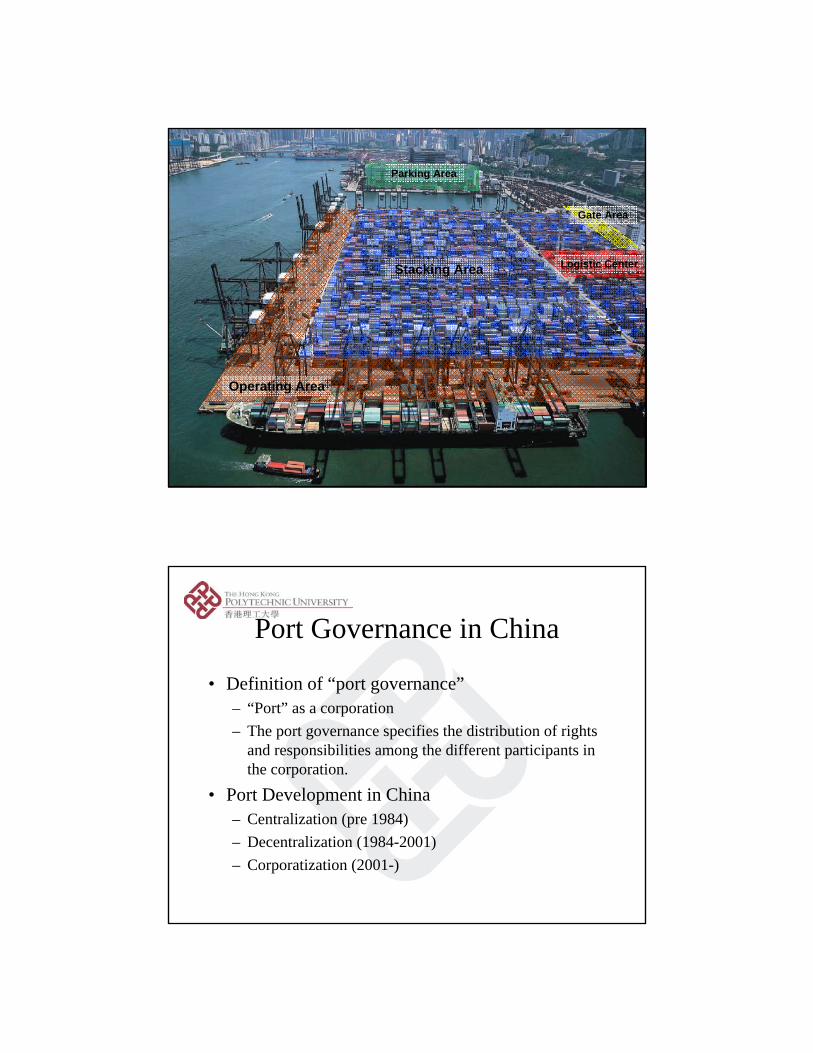
Stacking Area
Parking Area
Gate Area
Logistic Center
Operating Area
Port Governance in China
• Definition of “port governance”– “Port” as a corporation– The port governance specifies the distribution of rights
and responsibilities among the different participants in the corporation.
• Port Development in China– Centralization (pre 1984)– Decentralization (1984-2001)– Corporatization (2001-)
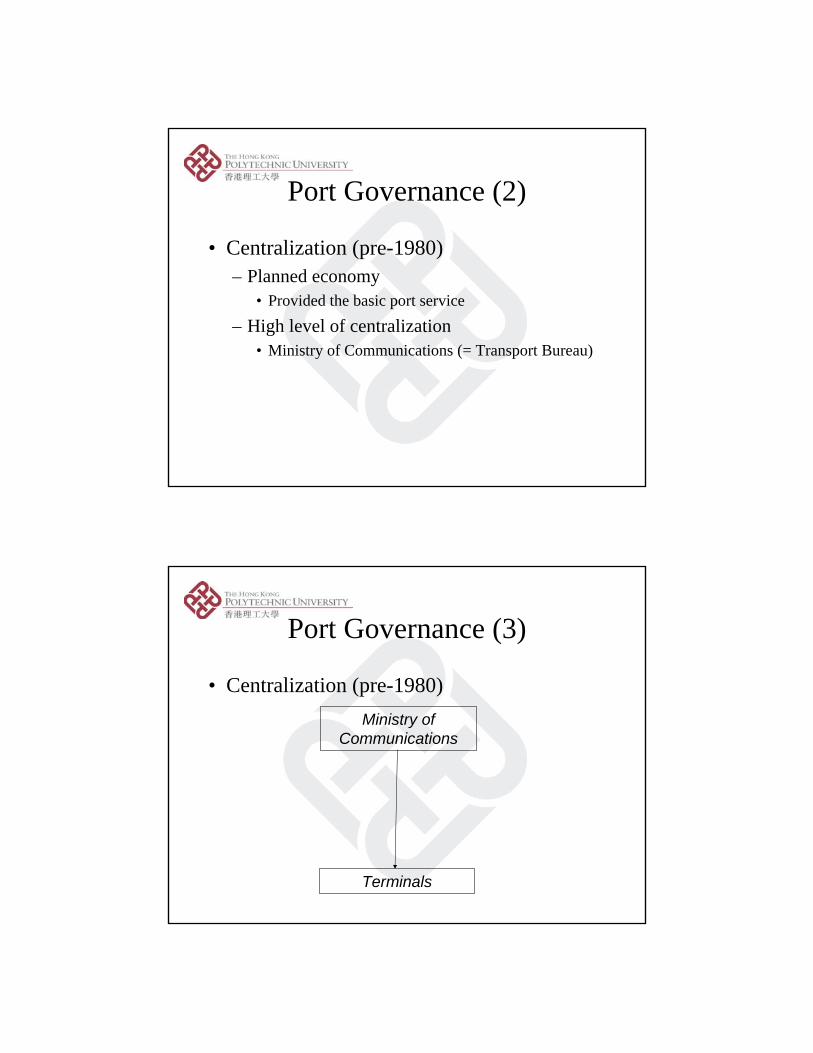
Port Governance (2)
• Centralization (pre-1980)– Planned economy
• Provided the basic port service
– High level of centralization• Ministry of Communications (= Transport Bureau)
Port Governance (3)
• Centralization (pre-1980)Ministry of
Communications
Terminals
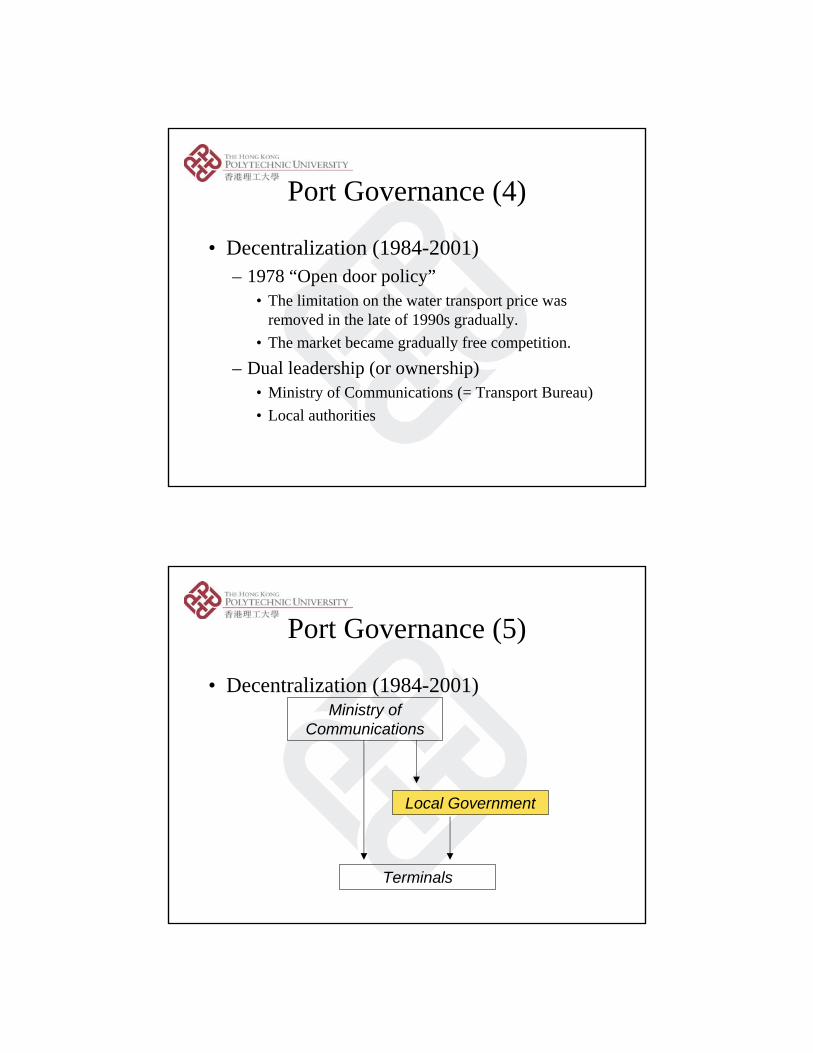
Port Governance (4)
• Decentralization (1984-2001)– 1978 “Open door policy”
• The limitation on the water transport price was removed in the late of 1990s gradually.
• The market became gradually free competition.
– Dual leadership (or ownership)• Ministry of Communications (= Transport Bureau)• Local authorities
Port Governance (5)
• Decentralization (1984-2001)Ministry of
Communications
Terminals
Local Government
Port Governance (6)
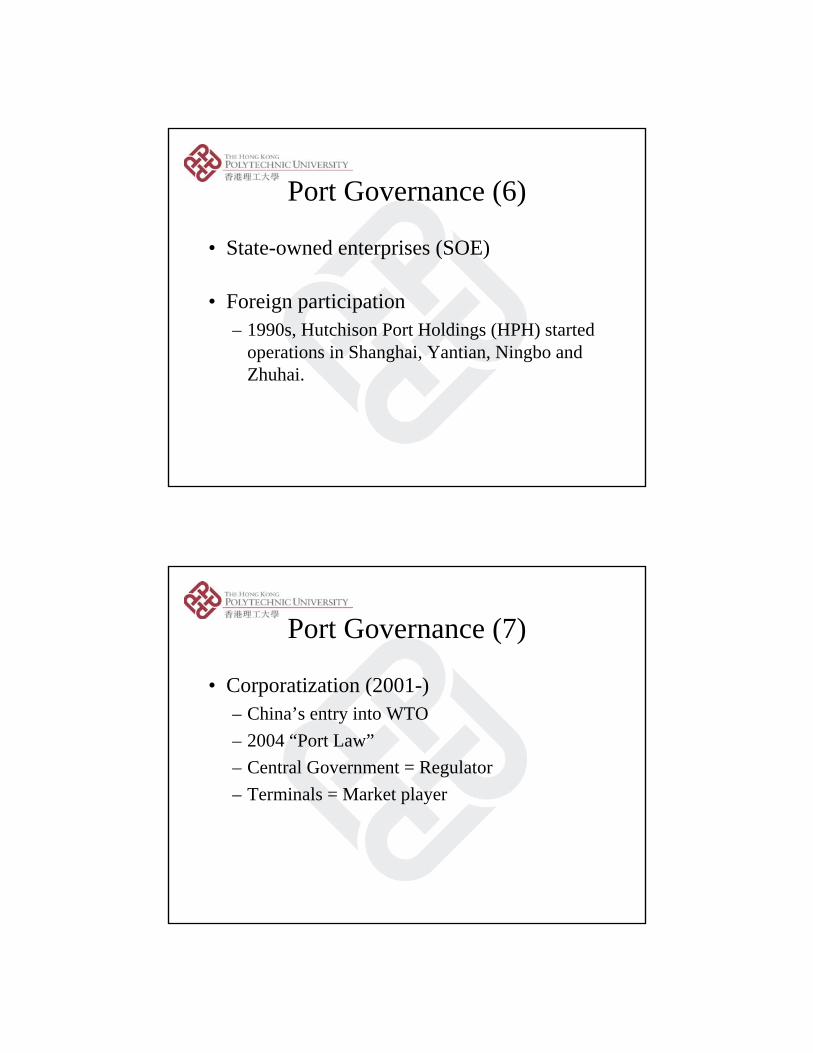
• State-owned enterprises (SOE)
• Foreign participation– 1990s, Hutchison Port Holdings (HPH) started
operations in Shanghai, Yantian, Ningbo and Zhuhai.
Port Governance (7)
• Corporatization (2001-)– China’s entry into WTO– 2004 “Port Law”– Central Government = Regulator– Terminals = Market player
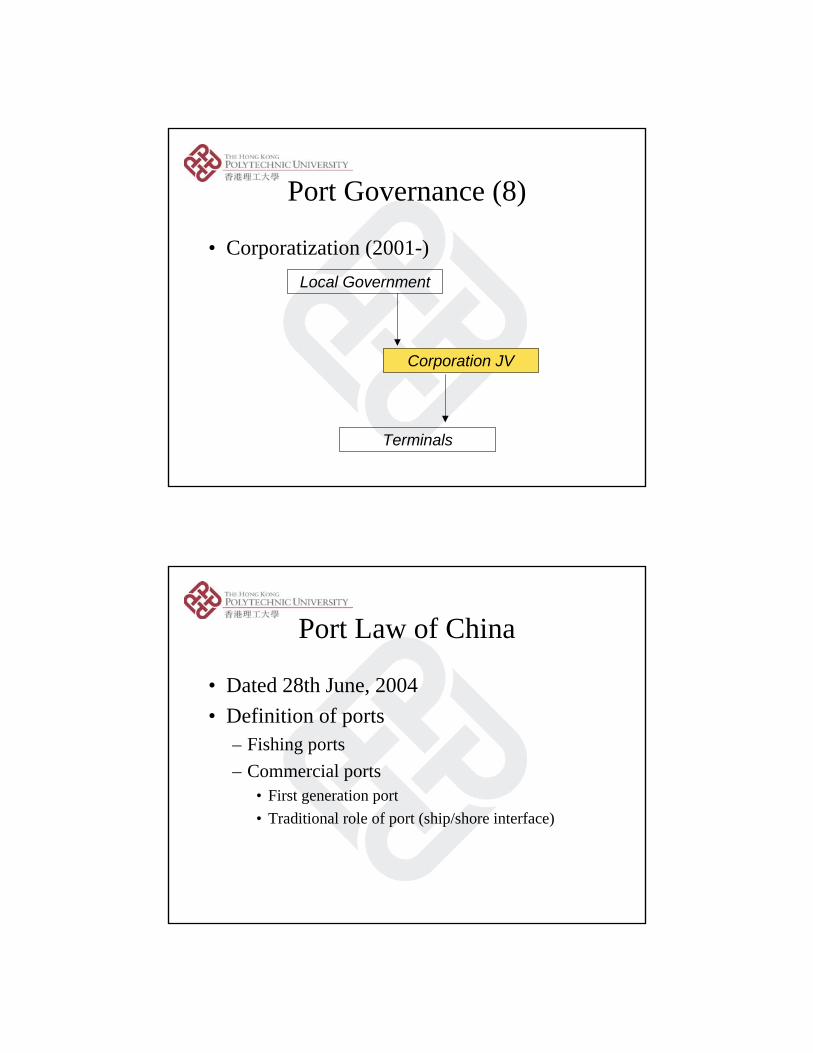
Port Governance (8)
• Corporatization (2001-)Local Government
Terminals
Corporation JV
Port Law of China
• Dated 28th June, 2004• Definition of ports
– Fishing ports– Commercial ports
• First generation port• Traditional role of port (ship/shore interface)
Port Law of China (2)
• Implications– The Chinese central government will no longer
retain any ownership of ports– The public ports will be transferred to local
government.
Ownership
• Hongkong International Terminals (HIT)– Solely owned by
• Hutchison Port Holdings (HPH)
• Yantian Port Holding– Stock No. 0000088– Joint venture of
• Hutchison Port Holdings (HPH)• Shenzhen Yantian Port Group
China Approach
• The government (national or province) does not manage the terminals directly.
• Foreign Direct Investment (FDI) is conducted in the form of joint venture. Foreign companies were in effect restricted to holding less than 50% share of joint venture.
China Approach (2)
• Foreign companies act as both investors and managers. Local authorities act as mainly landlord of the terminals.
• The joint venture offers easier access to new technologies (for the benefits of China) and to new markets (in favour of foreign companies).
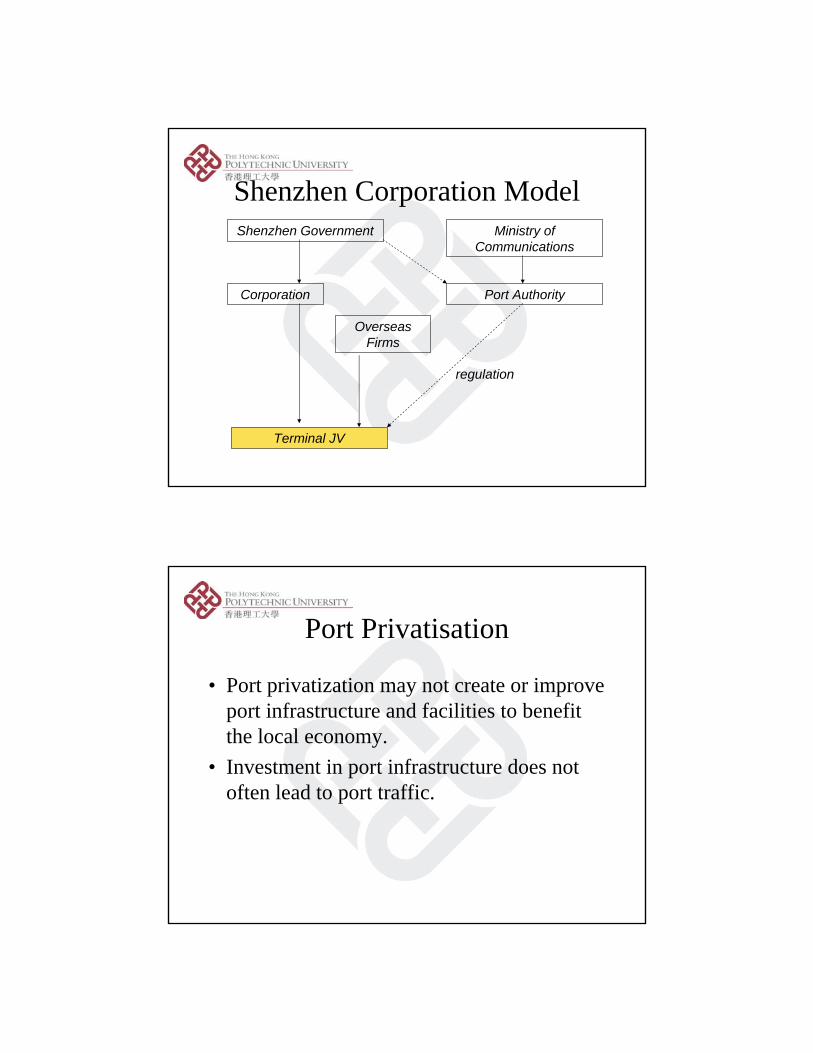
Shenzhen Corporation ModelShenzhen Government
Terminal JV
Corporation Port Authority
Ministry of Communications
Overseas Firms
regulation
Port Privatisation
• Port privatization may not create or improve port infrastructure and facilities to benefit the local economy.
• Investment in port infrastructure does not often lead to port traffic.
Summary
• The Port Benchmark Study shows that:– Global terminal operators are more efficient.– Asian ports are more efficient.– Ownership has little impacts on technical
efficiency.