Embed Size (px)
Citation preview

UNIVERSITÀ DEGLI STUDI DI MILANO
FACOLTÀ DI MEDICINA E CHIRURGIA
SCUOLA DI DOTTORATO
Medicina Molecolare
Curriculum in Medicina Molecolare delle Reazioni Immuni e
Infiammatorie
Ciclo XXV
TESI DI DOTTORATO DI RICERCA
IMMUNE MECHANISMS ASSOCIATED TO NEUROINFLAMMATION IN ALZHEIMER’S DISEASE
Settore MED/04 – Patologia Generale
Federica PIANCONE
matricola: R08685
Tutore: Ch.mo Prof. Mario CLERICI
Co-Tutore: Dott.ssa Marina SARESELLA
Coordinatore del Dottorato: Ch.mo Prof. Mario CLERICI
Anno Accademico 2011/2012

I
ABSTRACT
The etiology of Alzheimer’ s disease (AD) is still unresolved, even if it is becoming clearer that inflammation, a process associated to the onset of several neurodegenerative disorders, plays a central role in this disease. Inflammation is a key component of innate immune system. Innate immunity is a very highly conserved system that protects the host from infections in a non-specific manner. Even if this system provides a powerful response to a range of insults it must be tightly regulated: deregulation and chronic activation can have detrimental effects on the host. Chronic inflammation has been involved not only in peripheral diseases but also in neurodegenerative diseases of the central nervous system, like Alzheimer’s disease. Our working hypothesis is that inflammation plays a negative role in this pathology and that the mechanisms regulating the inflammatory responses are functional compromised in AD patients compared to Mild cognitive impairment (MCI) and to healthy controls (HC). One of the main way in which immunologic tolerance is modulated is through T regulatory cells (Treg). Our results indicate that the development of AD is associated with a reduction of circulating T reg naïve cells, the subpopulation of Treg cells endowed with the strongest suppressive ability. These quantitative changes are associated with qualitative changes, summarized as an increase of
A-specific proliferation and a reduced ability of Treg to suppress such proliferation. The analysis of the PD-1/PD-L1 pathway, which modulates the balance between inflammation and tolerance by inducing IL-10 production and apoptosis of antigen-specific cells, shows a decrease of PD-1 expressing CD4
+ T cells in AD and MCI
compared to HC as well as a decrease of PD-L1- expressing and IL-10-producing CD14
+ cells. The impairment of the PD-1/PD-L1 pathway in AD patients results in
reduced IL-10 production and diminished apoptosis of A-specific CD4+ T
lymphocytes. The central role performed by PD-1/PD-L1 pathway in inducing the
apoptosis of A-specific T cells is confirmed by the observation that apoptosis is inhibited pre-incubating lymphocytes with a PD-L1-specific blocking antibody. The analysis of lymphocytes subpopulations in AD and MCI compared to controls highlight that in AD patients not only an alteration of immunological tolerance is present but also a shift in the differentiation of T lymphocytes towards an inflammatory phenotype Th-9 and Th-17. Our results showed indeed that cytokines (IL-21, IL-23, IL-6) and transcription
factor (RORc/) involved in the differentiation of Th-17, as well as cytokines (IL-21, IL-22) produced by these cells are all augmented in AD compared to MCI and HC. Notably, IL-9, the effector cytokine produced by Th-9 cells, was significantly
increased as well in AD patients, indicating that, beside Th-17, A- specific Th-9 lymphocytes are upregulated in AD. In conclusion the impairment of the immune response, with a profound skewing favoring inflammatory and effector responses, seem to play a pivotal role in this pathology.
II
SOMMARIO
La patogenesi dell' Alzheimer (AD) non è nota, tuttavia è sempre più chiaro che l’ infiammazione, processo associato all’insorgenza di numerose malattie neurodegenerative del sistema nervoso centrale, svolga un ruolo in tale patologia. L’infiammazione è una componente chiave della risposta immunitaria innata. L’immunità innata è un sistema altamente conservato che protegge l’ospite dalle infezioni in maniera aspecifica. Sebbene questo sistema rappresenti una risposta efficace e potente agli stimoli acuti è necessario che sia finemente regolato: una deregolazione o un’attivazione cronica possono infatti avere effetti dannosi per l’ospite. L’infiammazione cronica è stata implicata non solo in malattie periferiche ma anche in malattie neurodegenerative del sistema nervoso centrale come l’Alzheimer. L’ipotesi di questo lavoro è stata che l’infiammazione rappresenti un fattore negativo per la malattia di Alzheimer e che i meccanismi che concorrono a regolare la risposta infiammatoria siano quantitativamente e funzionalmente compromessi negli AD rispetto agli MCI e HC. Uno dei meccanismi di regolazione della tolleranza immunologica è rappresentato dai linfociti Treg. I risultati presentati indicano che lo sviluppo della patologia di AD è associato ad una diminuzione del numero di Treg circolanti e in particolare della percentuale di Treg naive. Quest’alterazione quantitativa è associata ad un’alterazione qualitativa quale un’aumentata proliferazione amiloide- specifica e ad una ridotta capacità dei Treg di sopprimere tale proliferazione. L’analisi del pathway PD1-PDL1, in grado di controllare la risposta infiammatoria mediante produzione di IL-10 e induzione di apoptosi antigene-specifica, ha mostrato una diminuzione dell’espressione di PD-1 sui linfociti T CD4
+ dei pazienti
AD e MCI rispetto ai controlli sani. I risultati mostrano inoltre una diminuzione significativa della produzione di IL-10 da parte di CD14
+PD-L1
+. La down-regolazione di questi meccanismi osservata nei
pazienti AD e MCI risulta in un aumento della proliferazione dei linfociti T stimolati alla βA. Il ruolo chiave svolto dall’interazione PD-1/PD-L1 nell’indurre l’apoptosi dei
linfociti T CD4+ specifici per A è confermato dall’osservazione che l’apoptosi è
bloccata preincubando queste cellule con un anticorpo bloccante anti- PD-L1. Lo studio delle sottopopolazioni linfocitarie nelle forme di AD rispetto alla forma MCI e agli HC ha inoltre evidenziato che nei pazienti AD non solo vi è un’alterazione nei meccanismi di tolleranza immunologica ma anche uno shift nel differenziamento del linfociti T verso un fenotipo infiammatorio di tipo Th-17 e Th-9. I risultati hanno, infatti, mostrato un aumento della produzione delle citochine
infiammatorie (IL-21, IL-23, IL-6) e dei fattori di trascrizione (RORc/) coinvolti nel differenziamento dei Th-17 così come delle citochine effettrici (IL-21 e IL-22) prodotte da tali cellule nei pazienti AD rispetto agli MCI e agli HC. In particolare, IL-9, la citochina effettrice prodotta dalle Th-9, è significativamente aumentata nei pazienti AD, indicando che oltre ai Th-17 anche i Th-9 specifici per la beta-amiloide sono upregolati negli AD e Th-9 (IL-21 e IL-22). In conclusione la compromissione della risposta immunitaria, con una profonda inclinazione a favore di risposte effettrici e infiammatorie, sembra svolgere un ruolo chiave in questa patologia.

III
INDEX
1. INTRODUCTION .................................................................................... 1
1.1. The immune system ....................................................................... 1
1.2. The adaptive immunity ................................................................... 1
1.2.1. T cell subsets and functions .................................................... 2
1.2.2. CD4 lymphocytes ...................................................................... 2
1.2.2.1. Th-1 cells ......................................................................................... 2
1.2.2.2. Th-2 cells ......................................................................................... 3
1.2.2.3. Th-17 cells ....................................................................................... 3
1.2.2.4. Th-9 cells ......................................................................................... 4
1.2.2.5. Treg cells ......................................................................................... 5
1.2.3. CD8 lymphocytes ...................................................................... 7
1.2.4. B lymphocytes .......................................................................... 7
1.3. Immunologic Tolerance .................................................................. 8
1.4. The immune system in the Central Nervous System (CNS) ....... 10
1.5. The immunology of neurodegeneration ...................................... 13
1.6. Alzheimer’s Disease ..................................................................... 15
1.6.1. History ..................................................................................... 15
1.6.2. Introduction to the pathology ................................................ 16
1.6.3. Symptoms of Alzheimer’s disease ........................................ 17
1.6.4. Diagnosis of Alzheimer’s disease ......................................... 17
1.6.5. Etiology of Alzheimer’s disease ............................................ 19
1.6.5.1. Genetic ........................................................................................... 19
1.6.5.2. Epigenetic ...................................................................................... 20
1.6.5.3. The amyloid hypothesis ............................................................... 20
1.6.5.4. Tau hypothesis ............................................................................. 23
1.6.6. Therapies ................................................................................ 25
1.6.6.1. Targeting A .................................................................................. 25
1.6.6.2. Anti-tau therapies ......................................................................... 26

IV
1.6.6.3. Additional approaches ................................................................. 27
1.7. Neuroinflammation in AD .......................................................... 27
2. AIM OF THE STUDY ............................................................................ 31
3. MATERIAL AND METHODS ................................................................ 32
3.1. Flow cytometry principles ............................................................ 32
3.2. Cell sorting .................................................................................... 33
3.3. Patients and controls.................................................................... 34
3.4. Blood sample collection and cell separation .............................. 35
3.5. CFDA-SE labeling ......................................................................... 35
3.6. Stimulation of PBMC for FACS analysis ..................................... 35
3.7. Proliferation Assay ....................................................................... 35
3.8. Cell purification ............................................................................. 36
3.9. Suppression assays ..................................................................... 36
3.10. Immunofluorescent staining ...................................................... 36
3.11. Apoptosis .................................................................................... 37
3.12. Blocking assay ............................................................................ 37
3.13. Flow staining for PD-1 and FOXP3 of CD4+ CD25high T reg ...... 37
3.14. Monoclonal Abs .......................................................................... 37
3.15. Cytometric analysis .................................................................... 37
3.16. Statistical analysis ...................................................................... 38
4. RESULTS ............................................................................................. 39
4.1. Treg cells in peripheral blood of AD or MCI patients and HC .... 39
4.2. A pool-stimulated proliferation in AD, MCI and HC .................. 39
4.3. Suppression of A pool and anti-CD3-stimulated proliferation by
Treg ....................................................................................................... 40
4.4. PD-1-expressing CD4+ and CD8+ T cells in A-stimulated PBMC
.............................................................................................................. 40
4.5. PD-L1-expressing CD14+ and CD19+ cells ................................... 40
4.6. IL-10-secreting and PD-L1-expressing CD14+ and CD19+ cells . 41
4.7. A-stimulated apoptosis and proliferation .................................. 41

V
4.8. CD4+ T helper subsets in A peptides-stimulated cell cultures . 42
4.9. Cytokine-production in CD14+ cells in A-stimulated cell
cultures ................................................................................................ 42
4.10. Transcription factor-expressing CD4+ T cells in A peptide-
stimulated cell cultures ....................................................................... 43
4.11. Naïve and memory T cell subsets .............................................. 43
5. DISCUSSION........................................................................................ 44
6. CONCLUSIONS ................................................................................... 53
7. BIBLIOGRAPHY .................................................................................. 55
8. TABLES AND FIGURES ...................................................................... 83

1. INTRODUCTION
1.1. The immune system
The immune system refers to a collection of cells and proteins that function to protect the organism from foreign antigens, such as microbes (organisms such as bacteria, fungi, and parasites), viruses, cancer cells, and toxins. The immune system consists of two “lines of defense”: innate immunity and adaptive immunity. Innate immunity represents the first line of defense to an intruding pathogen. It is an antigen-independent (non-specific) defense mechanism that is used by the host immediately or within hours of encountering an antigen. The innate immune response has no immunologic memory and, therefore, it is unable to recognize or “memorize” the same pathogen should the body be exposed to it in the future. Adaptive immunity, on the other hand, is antigen-dependent and antigen-specific and, therefore, involves a lag time between exposure to the antigen and maximal response. The hallmark of adaptive immunity is the capacity for memory, which enables the host to mount a more rapid and efficient immune response upon subsequent exposure to the same antigen. Innate immunity provides the first line of defense but also direct T cells of the adaptive immunity. The primary function of innate immunity is the recruitment of immune cells to sites of infection and inflammation through the production of cytokines (small proteins involved in cell-cell communication). Cytokine production leads to the release of antibodies and other proteins and glycoproteins which activate the complement system, a biochemical cascade that functions to identify and opsonize (coat) foreign antigens, rendering them susceptible to phagocytosis (process by which cells engulf microbes and remove cell debris). The innate immune response also promotes clearance of dead cells or antibody complexes and removes foreign substances present in organs, tissues, blood and lymph. It can also activate the adaptive immune response through a process known as antigen presentation [1,2]. Innate immunity can be viewed as comprising four types of defensive barriers: anatomic (skin and mucousmembrane), physiologic (temperature, low pH and chemical mediators), endocytic and phagocytic, and inflammatory. Cells of the innate immunity are neutrophils, mononuclear phagocytes, dendritic cells (DCs), mast cells, basophils, eosinophils, natural killer (NK) cells and lymphocytes (T cells).
1.2. The adaptive immunity
Adaptive immunity has evolved to provide a broader and more finely tuned repertoire of recognition for both self- and non self-antigens. In fact, the primary function of the adaptive immune response is the recognition of specific “non-self” antigens in the presence of “self” antigens. Adaptive immunity involves a tightly regulated interplay between antigen presenting cells (APCs) and T and B-lymphocytes, which facilitate pathogen-specific immunologic effector pathways, generation of immunologic memory, and regulation of host immune homeostasis. Cells of the adaptive immune system include the effectors of cellular immune responses, the T lymphocytes, which mature in the thymus, and antibody- producing cells, the B-lymphocytes, which arise in the bone marrow. Lymphocytes

2
are highly mobile. After developing in the primary lymphoid organs (thymus and bone marrow), they traffic to secondary lymphoid organs, including lymph nodes and the spleen, which serve to capture circulating antigens from lymph and blood, respectively. Adaptive immune responses originate in these areas, often under the influence of innate immune system signals provided either directly by circulating pathogens or indirectly by pathogen-activated cutaneous or mucosal APCs migrating to the secondary lymphoid organs.
1.2.1. T cell subsets and functions
T cells elicit different effector functions in response to their activation. T cells can directly eliminate pathogens by killing infected target cells. They can function as helper cells, providing cognate (involving direct cellular contact) or cytokine signals to enhance both B- and T-cell responses, as well as causing activation of mononuclear phagocytes. Finally, T cells regulate immune responses, limiting tissue damage caused by autoreactive or unduly inflammatory immune responses. Mature T cells are activated on interaction of their T cell receptors (TCRs) with antigenic peptides complexed with major histocompatibility complex (MHC) molecules. CD8
+ T cells can interact with peptides (9-11 amino acids in length) on
almost any cell expressing MHC class I (HLA-A, HLA-B, and HLA-C). These MHC class I-restricted peptides are generally produced from proteins translated within the cell (endogenous antigens) encoded either in the host genome or by infecting viruses or other pathogens replicating intracellularly. In contrast, the TCRs of CD4
+
T cells engage peptides bearing MHC class II (HLA-DR, HLA-DQ, and HLA-DP). Unlike MHC class I expression, which is constitutive in all nucleated cells, MHC class II molecules are present on APCs and are inducible by innate immune stimuli, including ligands for Toll-like receptors (TLRs). APCs are specialized detectors of environmental antigens and danger signals (ligands for TLR and other systems of pattern-recognition receptors). T-cell activation is initiated when the TCR and associated proteins recognize a peptide/MHC complex on an APC, leading to a rapid clustering of TCR-associated molecules at the physical interface between T cells and APCs and the formation of a so called immunologic synapse [3].
1.2.2. CD4 lymphocytes
The largest group of T cells in the body is the CD4+ population. Most of these cells
serve a helper function and have been designated T helper cells (Th). Th cells play an important role in establishing and maximizing the immune response. These cells have no cytotoxic or phagocytic activity, and cannot kill infected cells or clear pathogens. However, they “mediate” the immune response by directing other cells to perform these tasks. Th cells are activated through TCR recognition of antigen bound to class II MHC molecules. Once activated, Th cells produce a range of cytokines.
1.2.2.1. Th-1 cells About 20 years ago, immunologists Robert Coffman and Tim Mossman first discovered that not every single CD4
+ Th cell has the capacity to produce the full
range of cytokines known to be in the T-cell repertoire [4]. They demonstrated two main categories of Th cells, both Th-1 and Th-2 cells, each producing (mostly) mutually exclusive panels of cytokines. Th-1 cells were characterized by their
capacity to make interferon (IFN)-, which activates the bactericidal activities of

3
macrophages, and other cytokines that induce B cells to make opsonizing (coating) and neutralizing antibodies, and IL-2 and were shown to differentiate from naive
Th-0 precursors under the influence of IL-12 and IFN- and the T-box expressed in T cells transcription factor (T-bet). Th-1 cell cytokines drive cell-mediated responses, activating mononuclear phagocytes, NK cells, and cytolytic T cells for killing of intracellular microbes and virally infected targets.
1.2.2.2. Th-2 cells Th-2 cells are producers of IL-4, IL-5, IL-10, and IL-13, which are involved in the activation and/or recruitment of immunoglobulin E (IgE) antibody-producing B cells, mast cells and eosinophils, and their development is driven by IL-4 and the transcription factor GATA-3. Th-1 cell cytokines drive cell-mediated responses, activating mononuclear phagocytes, NK cells, and cytolytic T cells for killing of intracellular microbes and virally infected targets. The Th-2 cytokine profile enhances antibody production, as well as a number of aspects of hypersensitivity and parasite-induced immune responses. Nowadays it is known that there is more plasticity to T-cell production of Th-1 and Th-2 cytokines than the constraints of the Th-1/Th-2 paradigm would suggest; thus, overlapping cytokine expression profiles are possible. In recent years, strong evidence for additional Th diversity has arisen [5].
1.2.2.3. Th-17 cells Th-17 cells were established as an independent subset of T helper cells by the identification of differentiation factors and transcription factors that are unique to Th-17 cells. Th-17 cells secrete the cytokine IL-17 [6] and were, in fact, named for this purpose. In addition to secretion of IL-17, which is now known to include a family of similar proteins (IL-17A, IL-17B, IL-17C, IL-17D, IL-17E and IL-17F), Th-17 cells secrete IL-9 [7], IL-21 [8], IL-22, IL-26, and CCL20 [9]. Th cells in general are now recognized to be able to switch patterns of cytokine production, and Th-17 cells in particular exhibit a high degree of plasticity in terms of cytokines produced, a property that is dependent on the surrounding cytokine milieu [10]. The plasticity of Th-17 cells remains an area of active investigation, and some Th-17 subsets, at least in humans, share features with Th-1 cells, suggesting a close developmental relationship between the two [11].
Th-17 differentiation requires multiple cytokines including IL-6, TGF-IL-21 and IL-
23 [12] and is dependent on the expression of the transcription factor RORc/ [13,14]. Th-17 cells play an important role in clearance of extracellular bacteria and fungi that are not adequately handled by Th-1 or Th-2 cells. Most experimental evidence to date suggests a role for IL-17 in local tissue inflammation, mainly via the induced release of pro-inflammatory cytokines and chemokines. In addition to cytokines and chemokines, IL-17 has also been shown to induce the production of other genes, including growth factors, antimicrobial peptides and MMP (matrix metalloproteinase) enzymes in epithelial cells, endothelial cells, fibroblasts, osteoblasts, macrophages and DCs [15,16]. A number of studies have shown that IL-17 induces tissue inflammation through stimulating pro-inflammatory cytokines. IL-17 also induces the production of other
pro-inflammatory cytokines, such as tumor necrosis factor (TNF)- and IL-1 [17], and in turn synergizes with them to induce a large amount of inflammatory factors.

4
In addition to contributing to inflammatory pathogenesis, IL-17 is also critical for host defence. Th-17 cells play important role also in inflammation and autoimmune diseases; accordingly, elevated levels of IL-17 were detected in several autoimmune diseases including multiple sclerosis (MS), rheumatoid arthritis (RA) and psoriasis [18]. Before the discovery of the Th-17 subset, it was considered that Th-1, Th-2 and B-cells were the main mediators of pathology in autoimmunity. Following the discovery of IL-17 and its biological functions, many studies have demonstrated that increased IL-17 expression is associated with inflammatory autoimmune diseases in either human patients or animal disease models [12,19]. Robust evidence shows that IL-17 mediates adverse effects in many autoimmune diseases such as RA, MS, systemic lupus erythematosus (SLE), inflammatory bowel disease (IBD) and psoriasis to name a few [20].
1.2.2.4. Th-9 cells Of significant importance is the recent discovery of Th-9 cells, the CD4
+ T cell
subset that produces IL-9. IL-9 has largely been regarded as a Th-2 cytokine; however, it is now known that under specific conditions, Tregs, Th-1, Th-17 and the Th-9 subset of T cells also produce IL-9. The functional diversity of Th cell subsets is chiefly based on specific cytokines, and their development from naive CD4
+ T
cells relies on distinct cytokine signals that initiate differentiation by either transactivation or repression of subset-specific transcription factors. Upon
activation by APCs in the presence of TGF- and IL-4, naive CD4+ T cells
differentiate into Th-9 cells that are characterized by expression of high amounts of IL-9, as well as IL-10. However, Th-9 cells don’t coexpress the cytokines IL-4, IL-5,
IL-13 (Th-2), IL-17a (Th-17), or IFN- (Th-1) upon activation [21,22]. And despite their ability to produce high amounts of IL-10, no regulatory properties of Th-9 cells have been described thus far [21]. Accordingly, Th-9 cells do not express subset-
determining transcription factors like T-bet (Th-1), GATA-3 (Th-2), RORc/t (Th-17), or FOXP3 (Treg cells) at levels comparable to the respective T cell subsets, indicating that Th-9 cells are an autonomous Th cell subset. As suggested by the patterns of receptor expression, IL-9 has biological effects on a number of distinct cell types. Beyond the first description as T cell or mast cell growth factor, IL-9 may affect other immune cells, as well as resident tissue cells that contribute to the development of inflammation. The role of Th-9 cells in human pathology is still controversial even if recent evidences suggest their involvement in allergic and autoimmune diseases [23,24]. Th-9 cells are pro-inflammatory, but appear to function in a broad spectrum of autoimmune diseases and allergic inflammation. Their precise function likely depends upon the tissue microenvironment and other T helper cell cytokines that are present in the inflammatory milieu. Th-9 cells contribute to inflammation in several autoimmune disease models. Th-9 cells induce inflammation in a T cell transfer colitis model [21]. Mice that received Th-9 cells only, lost weight and developed a moderate colitis. Moreover, mice that received effector T cells together with Th-9 cells developed a more severe colitis. A similar pro-inflammatory role of Th-9 cells was demonstrated in an Experimental autoimmune encephalomyelitis (EAE) model [24]. Myelin oligodendrocyte glycoprotein (MOG)-specific naive CD4
+ T cells were differentiated in vitro under Th-1, Th-2, Th-17 and
Th-9 polarizing conditions before adoptive transfer. All mice that received Th-9

5
cells developed severe EAE and lesions in the CNS. Cells in the CNS of Th-9
recipients retained IL-9 producing capacity, but also produced IFN-. Although Th-1, Th-17 and Th-9 cells induced EAE with similar severity, differences in CNS pathology suggested Th-9 cells promote inflammation through distinct mechanisms. Th-9 cells also contribute to allergic inflammation and disease. IL-9 is highly expressed in the lungs of asthmatic patients [25,26].
1.2.2.5. Treg cells Human regulatory T cells (Tregs) were first isolated from peripheral blood and characterized as CD4
+CD25
high T cells by several groups in 2001. The transcription
factor forkhead box P3 (FOXP3) is the canonical, specific marker for human Tregs and is thought to serve as the ‘master regulator’ in charge of Treg development and function. Recent studies have shown that human CD4
+FOXP3
+ T cells are not
homogeneous in gene expression, phenotype and suppressive functions, and indicate that new basis for reliable delineation of human Treg cells is required. These cells include different functional and phenotypic subpopulation. CD4
+/CD25
high/FOXP3
+ Treg cells can be sub-classified based on the surface
expression of programmed death receptor-1 (PD-1 or CD279). PD-1 can either be retained within the intracellular compartment, or it can be expressed on the surface, upon activation. Treg cells that retained PD-1 in the intracellular compartment are endowed with stronger suppressive properties and are defined as PD-1
neg [27].
Current dogma dictates that all these mechanisms of suppression mediated by Treg cells require a direct contact cell-to-cell to mediate their inhibitory activity. This has been upheld by in vitro experiments where Treg cells are unable to suppress effector T cell proliferation when the two populations are separated by a permeable membrane [28]. Several T-cell accessory molecules, such as CTLA-4 (CD152) and lymphocyte-activation gene 3 (LAG3), expressed by Tregs, and CD80 and CD86 costimulatory molecules expressed by APCs contribute to this contact-dependent suppressive mechanism [29]. Many potential suppression mechanisms of Treg cells have been hypothesized: suppression by the secretion of inhibitory cytokines, such as IL-10 and TGF-
suppression by cytolysis, through the release of perforin and granzyme A, which might induce death of T cells, monocytes and DCs, and suppression by modulation of DC maturation or function, by the interaction of CTLA-4, expressed constitutively on Treg cells, with CD80 and CD86, expressed by DCs. Many reports indicate that
cytokines such as IL-10 and TGF- are needed in vivo for mediating suppression or conditioning a suppressive milieu. Several in vivo experiments support the role of IL-10 in Treg suppression. It has recently been demonstrated that FOXP3
+ Tregs
in intestinal lamina propria or in the CNS could control colitis and EAE, respectively, by local secretion of IL-10 [30,31]. A support of the important
contribution of TGF- to Treg suppression derives from animal models, in which
natural Tregs isolated from neonatal TGF- knockout mice exhibit a normal suppressive activity in vitro and can prevent inflammatory bowel disease in vivo [32]. Tregs might kill effector cells, as another mechanism of Treg-mediated suppression. The release of perforin and granzyme A might induce death of T cells,

6
monocytes and DCs. The release of granzyme B might kill T cells and B cells in a perforin-independent and perforin- dependent way, respectively [33-35]. CD25
+CD4
+ natural Tregs constitutively express CTLA-4, whereas naive T cells
express this molecule only after activation. These results suggest several possible roles for CTLA-4 in Treg-mediated suppression. One is that CTLA-4 on Tregs might interact with the CD80 and CD86 molecules on APCs and transduce a co-stimulatory signal to Tregs (i.e. signals via both CTLA-4 and TCR might activate Tregs to exert suppression). CTLA-4 blockade therefore prevents Treg activation and, hence, attenuates suppression, causing autoimmune disease. This blockade might also enable interaction between CD28 molecules expressed by Tregs and CD80 and CD86 less competitively and, hence, more easily transduce a suppression-attenuating signal to Tregs, because strong ligation of the CD28 molecules together with TCR stimulation can abrogate Treg-mediated suppression. Another possible role of CTLA-4 for Treg function is that it might directly mediate suppression. CTLA-4 expressed on Tregs triggers induction of the enzyme indoleamine 2,3- dioxygenase (IDO) in DCs by interacting with their CD80 and CD86. IDO catalyzes the conversion of tryptophan into kynurenine and other metabolites, which have potent immunosuppressive effects in the local environment of DCs by means of cytotoxicity or possibly by inducing de novo generation of Tregs from naive CD25
-CD4
+ T cells [36].
The primary function of Treg cells was originally defined as prevention of autoimmune diseases by maintaining self-tolerance [37]. Over the years, several additional functions have been suggested and it will be important to clarify what Treg cells actually do in the immune system. Presently several functions have been proposed for Treg cells:
Prevention of autoimmune diseases by establishing and maintaining immunologic self-tolerance and immune homeostasis [37,29];
Suppression of allergy and asthma [38,39];
Induction of tolerance against dietary antigens, i.e. oral tolerance [40-42];
Induction of maternal tolerance to the fetus [43];
Suppression of pathogen-induced immunopathology [44,45];
Protection of commensal bacteria from elimination by the immune system [46];
Suppressive control against autologous tumour cells [47];
Induction of tolerance in allogeneic organ transplants [48]; Treg cells can suppress activation, proliferation and effector functions like the production of cytokines of a wide range of immune cells, including CD4
+ and CD8
+
T cells, NK and NKT cells, B cells and APCs in vitro and in vivo [49,50]. FOXP3 expressing Treg cells belong to a wide group of T cells that can suppress effector
cell responses. These regulatory T cells include IL-10 secreting TR1 cells, TGF-
producing Th-3 cells, / TCR expressing T cells and CD8+CD28
− T cells. Whereas
most of these regulatory T cells are induced or adaptive i.e. they are naïve T cells that acquire a regulatory phenotype and function upon activation in the periphery under particular situations such as particular antigenic stimulation or particular cytokine milieus, FOXP3
+ Treg cells are naturally occurring regulatory T cells that
are developmentally programmed under the control of the transcription factor FOXP3 in the thymus [51]. As a consequence, loss of Treg function appears to be a fundamental factor in autoimmunity [52].

7
1.2.3. CD8 lymphocytes
CD8+ T cells represent a major fraction of circulating T cells and act to remove both
cells harboring intracellular pathogens, including viruses and transformed cells. Because CD8 serves as a co-receptor for MHC class I CD8
+ T cells primarily
recognize antigenic peptides derived from cytosolic proteins. Cytolytic T lymphocytes (CTLs) kill target host cells in a contact-dependent mechanism. Recognition of foreign cytosolic peptides of the target cell in the context of host MHC class I by the CTL TCR leads to the formation of a conjugate with an immunologic synapse. Within minutes, the CTL activates apoptotic cell death in the target cell. This process is mediated by rapid mobilization of CTL granules to the synapse followed by fusion of granule membranes with the target cell plasma membrane and exocytosis of granule contents, including granzymes and perforin. The granzymes are serine proteases that target a number of proteins in the host cell, leading to activation of apoptosis. In a parallel proapoptotic pathway, TCR activation in the immune synapse drives expression of Fas ligand on the CTL. This in turn engages Fas (CD95) on the target cell membrane, again triggering apoptosis.
1.2.4. B lymphocytes
Adaptive humoral immunity is mediated by antibodies produced by plasma cells that develop from B cells under the direction of signals received from T cells and other cells, such as dendritic cells. B cells arise from hemopoietic stem cells in the bone marrow. Unlike T cells, B cells can recognize free antigen directly, without the need for APCs. The principal function of B cells is the production of antibodies against foreign antigens [1]. Several subpopulations of B cells in peripheral blood can be distinguished based on surface-marker expression. The second phase of B-cell development occurs after encounter with antigen and activation and is called the antigen-dependent phase. Some antigens elicit antibody formation in the absence of T cells, and are called T-independent (TI) antigens. Certain molecules, such as some plant lectins (eg, pokeweed mitogen), are alone capable of inducing proliferation and antibody production from mature B cells. These are called TI type 1 antigens [53]. Some macromolecules, such as polymerized proteins or polysaccharides, possess repeating molecular patterns that can interact with multiple immunoglobulin receptors on the cell surface and cross-link them. This might deliver a partially activating signal that can progress to memory or plasma cell development with only the additional signals provided by cytokines or other cell contacts provided by dendritic cells [54]. These are called TI type 2 antigens. In many cases the antigens themselves might also provide more than one activating signal because some might interact with other receptor systems, such as TLR [55]. The vast majority of antibody responses to proteins and glycoproteins require participation of T cells, and these antigens are called T dependent. Mature B cells recirculate through secondary lymphoid organs, including lymph nodes, the spleen, and mucosal-associated lymphoid tissues. Antigens complexed to varying to degrees with IgM, IgG, and complement might be carried on the surfaces of specialized macrophages, follicular dendritic cells, or even B cells themselves, all of which have receptors for IgG Fc and complement fragments. Antigen presented on these surfaces can stimulate B cells through immunoglobulin receptor cross-linking, expression of other interacting surface molecules, and cytokine secretion. B

8
cells require two principal types of signals to become activated. Signal one is delivered by cross-linking of the immunoglobulin receptor, as described above. This cross-linking leads to activation of intracellular signaling pathways that render the cell capable of interacting with T cells and thereby receiving signal two. B cells are active as APCs and express peptides along with MHC class II on their surface. These peptides can arise from processed antigen that was internalized after binding to the B-cell surface immunoglobulin receptor. When the B cell contacts a CD4
+ T cell specific for such a peptide with self-MHC class II and having
been previously activated by an APC, the T cell is able to provide cognate (direct cellular contact) help and activate the B cell for further differentiation into memory cells or plasma cells. The activated B cells enter one of two pathways. Either they immediately become short-lived plasma cells secreting low-affinity antibody without somatic mutation, or they enter a follicle to establish a germinal center (GC)[56].
In
the germinal center B cells can change from the production of IgM and IgD to other isotypes, such as IgG, IgA, and IgE. This process, called class- switching, occurs through a mechanism of gene rearrangement [1].
1.3. Immunologic Tolerance
The immune system must balance the need to maintain a diverse repertoire of lymphocytes to be able to fight infection with the need to maintain tolerance to self-proteins. Immunologic tolerance is defined as unresponsiveness to an antigen that is induced by previous exposure to that antigen. Tolerance to self-antigens is a fundamental property of the immune system. Self-tolerance may be induced as a consequence of immature self-reactive lymphocytes recognizing self-antigens, called central tolerance, or in peripheral sites as a result of mature self- reactive lymphocytes encountering self-antigens under particular conditions, called peripheral tolerance. Central tolerance is established in the thymus by the elimination of autoreactive thymocytes that display a TCR with high affinity for self-peptide/MHC complexes [57]. Despite the relative efficiency of clonal deletion not all tissue-specific antigens are expressed in the thymus and thus a small proportion of autoreactive T cells can escape thymic deletion, complete their maturation and enter the peripheral circulation. The immune system has multiple checkpoints in place to limit the activation and expansion of these autoreactive cells in the periphery [58]. The last decade has led to an improved understanding of some of these checkpoints involved in peripheral regulation of the immune response. In the periphery the immune system has a range of mechanisms available that control the fate of autoreactive T cells, including immune privilege, immune ignorance, activation-induced cell death, clonal anergy, and immune suppression-mediated byTreg cells [29,59,60]. Anergy is a process that occurs when a T cell encounters its proper peptide under one of these particular conditions. A first condition is that the cell expressing the peptide on its surface is a non-professional APC. This cell type may possess the MHC niche for the peptide, which is therefore recognized by the TCR, but lacks the so-called co-stimulatory molecules, such as CD80 and CD86, which are able to provide an activatory signal to the T helper cell through their interaction with CD28. In the absence of this costimulatory signal, the T helper cell not only does not undergo activation, rather becomes unable to be activated even when it re-

9
encounters the same peptide on the surface of professional APCs equipped with costimulatory molecules [61]. Another possibility is that peptide recognition by the T helper cells is followed by an interaction of the co-stimulatory molecules CD80 and CD86 with the suppressive cytotoxic T lymphocyte associated antigen CTLA-4, instead of the activating CD28, molecule on the surface of the T helper cell. Under both these conditions, the T helper cell does not die and becomes functionally inactive. Deletion is another mechanism of peripheral tolerance of mature T cells, which is based on their apoptotic cell death [62]. This usually happens when T cells encounter high antigen concentrations or they are heavily activated. This process is known as “activation-induced cell death” (AICD) and is mediated through the high expression of the surface molecule Fas (CD95), as well as its ligand (FasL or CD95L). The interaction between Fas and of its ligand on the surface of the proliferating T helper cells activates the cascade of caspase enzymes that ends with the apoptotic cell death [63]. The third mechanism of peripheral T-cell tolerance is represented by immune suppression achieved by Treg cells. Regulation through inhibitory molecules like PD-1 plays a critical role in the delicate balance between effective immunity and self-tolerance. PD-1 (CD279) is a member of the CD28 superfamily of immunoreceptors involved in regulating cell activation. PD-1 is a 55 KDa type 1 transmembrane protein that is upregulated on T cells, B cells, and some myeloid cells upon activation. Signaling
through PD-1 limits T cell function, including IFN- production and proliferation [64-66]. PD-1 is an immunoglobulin (Ig) superfamily member that has an N-terminal IgV-like domain, an approximately 20 amino acid stalk separating the IgV-like domain from the plasma membrane, a transmembrane domain, and a cytoplasmic domain with an immunoreceptor tyrosine-based inhibitory motif (ITIM) and an immunoreceptor tyrosine-based switch motif (ITSM). The protein tyrosine phosphatases SHP-1 and SHP-2 can bind to the ITSM sequence in the PD-1 cytoplasmic tail. Binding of the ITSM by SHP-1 or SHP-2 results in the dephosphorylation of proximal signaling molecules and augmentation of phosphatases and tensin homolog (PTEN) expression. This effectively attenuates the activation of the phosphatidylinositol 3-kinases (PI3K) and protein kinase B (Akt), which are key for glucose transport and glycolysis, so PD-1-mediated inhibition of these signaling molecules can hamper cell bioenergetics, resulting in decreased T-cell proliferation, survival, protein synthesis, and IL-2 production. PD-1 is expressed during thymic development and interacts with at least two ligands, programmed death-ligand 1 (PD-L1, CD274) and another closely related molecule, PD-L2 (CD273) [67-69]. PD-L1 was identified by searching for homologs of B7-1 (CD80) and B7-2 (CD86), the two ligands for CTLA-4 and CD28. The expression patterns of PD-L1 and PD-L2 are somewhat distinct. PD-L1 is expressed on T cells, B cells, DCs and macrophages, as well as several non-hematopoietic cell types including vascular endothelial cells, pancreatic islets, astrocytes, and keratinocytes [70]. PD-L2, on the other hand, is expressed exclusively on DCs and monocytes [71]. The PD-1 ligands, PD-L1 and PD-L2, are constitutively expressed in peripheral tissue sites during homeostasis and become elevated in response to tissue insult and inflammation.

10
The costimulatory pathway consisting of PD-1 and its ligands, PD-L1 and PD-L2, delivers inhibitory signals that regulate the balance among T-cell activation, tolerance, and immune-mediated tissue damage [70,72-74]. This pathway exerts critical inhibitory functions in the setting of persistent antigenic stimulation such as during encounter of self-antigens, chronic viral infections, and tumors [70]. This pathway has a central role in regulating the interplay between host defenses aimed at eradicating microbial pathogens and tumors as well as microbial and tumor strategies that evolved to resist immune responses. The PD-1/PD-L1 pathway contributes directly to T-cell exhaustion and lack of viral control during chronic infections [75] as well as the suppressive tumor microenvironment [76]. This pathway controls multiple tolerance checkpoints that prevent autoimmunity. To provide a context for these studies, we first introduce PD-1 and its ligands and discuss the roles of Tregs in peripheral tolerance and autoimmunity. PD-1/PD-L1 interactions result in the up-regulation of IL-10 production, reduction of T cell proliferation and the induction of apoptosis of antigen- specific cells [64,69, 77]; thus they play a substantial role in regulating autoreactive T cells that are specific for tissue-restricted self-antigens. PD-L1 and PD-1 are both expressed on CD4
+CD25
+ T cells. The compartmentalization of PD-1 allows to discriminate
between two Treg sub-population: Raimondi and colleagues observed that 90% of Treg (positive for the nuclear transcription factor FOXP3 and able to inhibit naive T cell proliferation), isolated from the spleens or lymph nodes of normal mice, did not express significant levels of the inhibitory receptor PD-1 on their surface, but retained PD-1 inside the cell. An identical phenotype was also identified for human resting CD4
+CD25
high T cells isolated from peripheral blood of healthy volunteers.
By contrast, activated T cells expressed high levels of surface PD-1 that paralleled up-regulation of CD25 during effector cell expansion [27].
1.4. The immune system in the Central Nervous System (CNS)
Several features make the brain’s immune system different: the presence of the Blood-Brain Barrier (BBB), a minimal number of T cells, limited numbers of cells which constitutively express MHC class I and MHC class II and therefore have limited ability to trigger T cell responses, and the lack of a lymphatic system. In addition, it is argued that microglia, even when activate, are poor APC [78]. However, the continuous sampling of the tissue by microglia ensures constant monitoring, and the ability of these cells to respond to any threat to homeostasis, has led to the acceptance that there is a continuing low-level inflammatory activity in the CNS which is primarily concerned with repair. A range of insults including genetic, autoimmune, infectious, or neurodegenerative diseases and cancer may affect tissues of the CNS, such as the brain, optic nerves, and spinal cord. The immune system is involved in the pathogenesis of many of these diseases, either by causing tissue damage or alternatively by responding to disease and contributing to repair. In contrast to other tissues, damage caused by immune pathology in the CNS can be irreparable. The nervous and immune systems have, therefore, coevolved to permit effective immune surveillance while limiting immune pathology. The parenchyma of the normal brain and spinal cord has a limited capacity for antigen processing and presentation, since it contains few professional APCs and neurons only express MHC under exceptional conditions [79]. The immune

11
response is also delayed since lymphocytes have to be activated before they can cross the BBB [80], and even then this transmigration process is arduous. Once lymphocytes have been activated, microglia, the innate immune cells of the CNS, further respond to inflammation by upregulation of immunoregulatory molecules including B7-H1 [81] and IDO [82], while neurons protect themselves by secreting
TGF- upon contact with activated lymphocytes [83]. The non-inflamed brain is protected by vascular endothelium at the BBB and by glia limitans, formed from parenchymal basement membrane and astrocytic foot processes. Nevertheless, CSF from individuals with no inflammatory neurological disease contains about 150,000 T lymphocytes [84]. The T cells in human CSF are mainly effector memory (CD45RA
-, CD27
+, L-selectin
high), and the majority is CD4
positive [85]. This phenotype permits trafficking through extralymphoid tissue as well as subsequent return to the lymphatic system via high-endothelial venules.
Activated lymphocytes make formal contact with the BBB via 4-integrin and endothelial VCAM-1 [86] and cross the barrier by diapedesis. This is a difficult process, especially in the non-inflamed CNS, although entry to the leptomeningeal compartment can occur more readily in a P-selectin- dependent manner [87]. Even then, entry to the CNS parenchyma is dependent on further encounter with cognate antigen. If antigen is seen, then the immune cells mount an inflammatory response, draw other immune cells into the specific site, and then collectively breech the glia limitans to infiltrate the parenchyma. Lymphocyte migration into and within the CNS is regulated by chemokines and their receptors. The BBB plays a key role in modulating entry of solutes and ions into the CNS and, although migration of cells appears to be controlled to a significant extent by expression of chemokines and adhesion molecules and their receptors, infiltration of circulating cells occurs during chronic neuroinflammation when release of inflammatory mediators from activated microglia increases BBB permeability [88]. Without concomitant inflammation, CD4
+ migration outside of
blood vessels is constrained to pathways that run along their axes [89] and is different from the random motility of CD8
+ cells [89-91]. This confinement is
regulated by the interaction of the chemoattractant CXCL12 with the receptor CXCR4, expressed on the surface of lymphocytes. The migration of leukocytes into the CNS may be modulated by sequestration of CXCL12 by other receptors, or by the physical redistribution of CXCL12 that occurs in MS and the disease model EAE [90,91]. In addition, blockade of CXCR4 allows CD4 T cells to escape from their perivascular containment and penetrate deeper into brain parenchyma [89,90]. Collectively these mechanisms ensure that immunosurveillance within the normal CNS occurs at a slower pace than in the periphery and is biased to recently activated CD4
+ cells with a phenotype that allows them to traffic back to secondary
lymphoid tissue once they leave the nervous system. However, immune surveillance of the CNS is a critical mechanism, as illustrated recently by the observation of complications associated with antibody therapies for MS that block this process. Although it is fundamentally different from the peripheral immune system in many respects, the immune system of the CNS robustly defends the integrity of the tissue and is vital for the maintenance of homeostasis. Dysregulation of the mechanisms that control inflammatory activity is the most likely cause of pathological inflammation and the consequent neurodegeneration.

12
The reparative function of the immune response occurs under non-pathological conditions but also in response to insults, infection, injury and inflammation and it could be compromised with age, resulting in neurodegeneration and chronic neuroinflammation. The brain also protects itself by maintenance of an immunosuppressive environment, due to soluble factors released by neurons and astrocytes, but also as a consequence of neuronal expression of immunosuppressive proteins like CD200, CD47, CD22 and fractalkine (CX3CL1), which interacts with its receptor on microglia and maintains microglia in a quiescent state. Released soluble factors which downregulate immune responses include
neurotrophins, anti-inflammatory cytokines like TGF- (which downregulates endothelial expression of adhesion molecules required to allow entry of peripheral cells into the brain), and anti-inflammatory prostaglandins. Many of these unique features are broken down by chronic inflammation. Predictably T cell infiltration has been found in CNS tissues of Parkinson’s Disease (PD) patients [92], where evidence of neuroinflammation is accompanied by increased BBB permeability [93] and similar correlative changes are found following ischemic insult and with age [88] and bacterial and viral infections [94].
BBB permeability is also increased by amyloid-beta (A) [95] and consequently the presence of T cells in brain as well as increased T cell reactivity have been reported in patients with Alzheimer’s disease (AD) [96]. Interestingly T cells obtained from AD patients express increased CXCR2 and macrophage inflammatory protein-1a (MIP-1a), which enhance T cell migration into brain [97,98]. The presence of T cells in the brain has the capacity to profoundly affect glial function. Microglial cells are considered to be the immune effector cells in the CNS, belonging to the mononuclear phagocytic system. Microglial cells constitute about 10% of adult CNS cell population and represent the innate immune system of the brain. They generate an antigen-non-specific response to injury and diverse endogenous and exogenous stimuli. Microglial cells constitute the first barrier and immune sentinels, being distributed through brain parenchyma continuously for sensing their microenvironment and producing pro- and anti-inflammatory cytokines. Microglia predominate in gray matter, with the highest concentration in hippocampus and substantia nigra [99,100]. They express proteins characteristic of professional phagocytes and immune cell members such as complement components and their receptors, MHC glycoproteins, and scavenger receptors. Microglial cell populations are heterogeneous within different regions of the brain [101]. Resident microglia, the innate immune system occupants of the CNS, are one of two populations of myeloid immune cells (the other being monocyte derived macrophages) that are activated under a neurodegenerative milieu. Under physiological conditions, microglia is engaged in immune surveillance and host defense [102]. These cells are particularly sensitive to changes in their microenvironment and readily become activated in response to infection, trauma, disease and tumors. Once activated, microglia mainly operates as scavenger cells, producing a wide spectrum of molecules that are essential for the elimination of invading pathogens and the clearance of toxic factors (such as the aggregated misfolded proteins found in AD) and cellular debris. Moreover, these cells, under pathological conditions and in their semiquiescent state, produce a myriad of factors (including neurotrophic, growth and neural survival factors) that are pivotal

13
for tissue maintenance, repair and renewal [102]. The second population of myeloid derived cells found in the CNS is the infiltrating monocyte- derived macrophages, which, under pathological conditions, are recruited in the CNS, infiltrate the brain parenchyma from the circulatury system and differentiate in macrophages. Summarizing, two populations of microglia can be distinguished. One, which is short-lived and frequently replaced from circulating monocyte-macrophages sources, is concentrated in perivascular and some specific parenchyma regions. The second population, which is long-lived, is resident and abundant in all the CNS parenchyma [103,104]. Microglial cells that are basally quiescent are characterized by a small cell body and ramified processes. When activated in response to many stimuli, they undergo morphological changes that include enlargement of the cell body and shortening of cellular processes. Besides, microglial cells response is characterized by phagocytosis, T-helper cell Th-2 induction and by secretion of IL-4, IL-10 and TGF-
. Th-2-activated cells produce IL-4, IL-6, IL-10 and IL-13, cytokines that promote humoral immune responses and down-regulate Th-1-mediated responses, inhibiting numerous macrophage inflammatory functions [105]. The activated state of microglial cells, far from a single phenotype, represents a continuum change from innate to adaptive activation with the expression of different cytokines and cytokine receptors that modulate T cell response [105]. In activated state, microglial cells up regulate the expression of different cell surface activation antigens, pattern recognition receptors (PRRs), produce cytokines and secrete short-lived potentially cytotoxic species such as nitric oxide (NO) and reactive oxygen species (ROS) [106]. Glial activation results in diverse functional effects including proliferation, up-regulation of active molecules, release of cytokines and growth factors, phagocytic transformation and production of NO and ROS. Whereas early stages of an inflammatory response can protect neurons [107], chronic inflammation and the subsequent activation of microglia become detrimental [108-110]. Chronically primed microglia exhibit more rapid induction and an exaggerated pro-inflammatory cytokine release, enhancing for example sickness behaviour induced by lipopolysaccharide (LPS), and suggesting that aging microglia are over-responsive [111-113].
1.5. The immunology of neurodegeneration
Despite intensive study over the past three decades, neurodegenerative diseases remain insufficiently understood, precluding rational design of therapeutic interventions that can reverse or even arrest the progressive loss of neurological function. Several theories investigating the causes of neurodegenerative diseases have been formulating such as those involving a central role for protein misfolding, mitochondrial dysfunction, oxidative damage to lipids, proteins and nucleic acids, excitotoxicity, and transcriptional dysregulation. Neurodegeneration ultimately targets neurons and can range from damage to synapses or neurites to cell death. Once a danger signal is detected, neurons can activate intracellular defense mechanisms and can alert neighboring cells via cell-cell interactions or the release of signaling proteins, neurotransmitters, and other messengers. When neurons send out distress signals, there is a strong response from CNS-resident immune cells such as microglia. What is most confusing about this response is that rather

14
than helping the injured neurons, more often than not microglia seems to harm or kill neurons. The observation that all neurodegenerative diseases are associated with activated innate immune cells have led inflammation to be considered as a promising therapeutic target for Alzheimer’s Disease and other neurodegenerative conditions [114]. Most of neurodegenerative diseases are, infact, characterized by glial activation, which is responsible for chronic inflammation observed in these diseases. The altered activation state of glia, particularly microglia, is an indicator of chronic immune activation and of the reduced ability of the brain’s immune system to restore homeostasis. Activated microglia produces several neurotoxic molecules,
including ROS, glutamate, and inflammatory cytokines, such as TNF and IL-1, which differentially induce neurotoxicity. Chronic neuroinflammation can lead to cell dysfunction triggering a self-perpetuating cycle of damaging events driving pathogenic processes and consequently neurodegeneration. Degenerating cells, particularly neurons, are an integral part of this self-destructive cycle releasing danger-associated molecular patterns (DAMPs), like ATP and high mobility group protein 1 (HMGB-1), and these, by interacting with toll-like receptors and other pathogen recognition receptors (PRRs), trigger inflammatory changes. Other DAMPs include
aggregated, modified or misfolded proteins for instance amyloid-, tau and -synuclein, which accumulate in Alzheimer’s disease and/ or Parkinson’s disease. Although inflammation may not typically represent an initiating factor in neurodegenerative disease, there is emerging evidence in animal models that sustained inflammatory responses involving microglia and astrocytes contribute to disease progression. Chronic microglial production of pro-inflammatory cytokines including interleukins
(IL-1 and IL-6), TNF-, and IFN- has received considerable attention for its role in neurodegenerative disorders. A number of pathologic events, including altered neuronal function, injury, infection ischemia, and inflammation, can activate microglia. This activation results in a transition in microglial morphology to an ameboid state facilitating the migration of these cells to the site of insult [115]. Microglial response to CNS pathology also results in initiation of a number of immune functions including phagocytosis, antigen processing and presentation, and production of both cytotoxic and neurotrophic factors [115,116]. Microglial actions may be dependent on the nature of the activating stimulus. Stimulation of microglia with LPS, amyloid protein, and
high concentrations of IFN-determines the release of several mediator of cytotoxity including reactive oxygen and nitrogen species, arachidonic acid metabolites (eicosanoids), excitotoxic glutamate, quinolic acid, and histamine [117].
Alternatively, exposure to IL-4 and low levels of IFN- lead to microglial release of neurotrophic factors including nerve growth factor (NGF), brain derived neurotrophic factor (BDNF), and neurotrophin-4/5 (NT-4/5) [118]. While short-term microglial activity is generally accepted to serve a neuroprotective role, chronic activation has been implicated as a potential mechanism in neurodegenerative disorders. A special emphasis has recently been placed on
microglial release of pro-inflammatory cytokines including IL-1, IL-6, TNF-, and
IFN- and their roles in neuronal degeneration.

15
It is important to note, however, that microglia are not the sole producers of cytokines following CNS insult. Astrocytes have also been implicated in the generation of pro-inflammatory mediators involved in neurodegenerative disorders [119]. While this neuroinflammatory response may be beneficial for clearing infection and initiating tissue repair mechanisms, if left unresolved, it exposes sensitive neurons to elevated levels of potentially toxic molecules, leading to bystander injury. In fact, there is mounting evidence that chronic neuroinflammation plays a critical role in the pathoetiology of various neurodegenerative diseases including Alzheimer's disease, multiple sclerosis, and Parkinson's disease [105,120, 115]. Astrocytes are the most abundant glial cell in the in the central nervous system and play multiple roles in organizing and maintaining brain structure and function [121]. Although activated astrocytes provide neuroprotection by the release of neurotrophic factors, they also participate in inflammatory reactions expressing pro-inflammatory molecules, such as cytokines and chemokines [122,123]. Hence, if astrocytes malfunction, the result can be disturbances in homeostasis that could potentiate neurodegenerative diseases, including AD. Indeed, these cells tend to
localize around fibrillar amyloid plaques, suggesting that A deposition is a potent trigger of astroglial activation in the AD brain.
1.6. Alzheimer’s Disease
1.6.1. History
The first AD case was described in 1907. Since then, major developments and findings mark the history of AD research in the general context of amyloid associated disorders. The term “amyloid” was first introduced by Virchow in 1854 to describe the macroscopic abnormalities associated with clinical symptoms, which appeared to represent the amylaceous constituents of plants upon staining with iodine. Five years later, Friedreich and Kekule suggested that amyloid is a protein rather than starch according to the high nitrogen content. The plaques in the AD brain were first described in 1898; the aniline dye Congo red facilitated specific discrimination from non-amyloid plaques in 1922. In 1907, Alois Alzheimer’s lecture about the first case of the fatal progressive dementia including extracellular plaque and intraneuronal NFT pathology did not receive special attention, although as a psychiatrist he was a pioneer at this time by associating pathological changes with dementia symptoms. Alzheimer’s colleague, Kraepelin, finally gave the disease its official name in 1910. Amyloid fibrils from tissue were first visualized by electron microscopy in 1959. X
ray diffraction studies of isolated fibrils in 1968 revealed the so-called cross structure as a common motif [131]. In the 1970s, the availability of amino acid analysis and protein sequencing tools revealed that each amyloidosis is linked to a specific protein [132].
In 1984, A was identified as the major component of plaques from AD and Down syndrome patients [133]. Tau had already been described in 1975 as an essential protein for microtubule assembly [134], but it was not until one year after the
identification of A that it was identified as the NFT forming protein. The corresponding MAPT gene was cloned in 1988 [135], again one year after the
amyloid- protein precursor (APP) gene containing the A sequence was cloned from chromosome 21 [136].

16
1.6.2. Introduction to the pathology
Alzheimer’s disease (AD) is a highly debilitating neurodegenerative disorder that afflicts million of people and has reached in our society an enormous impact. The number of patients increases every year and recent projections predict 65 millions of AD worldwide by 2030. AD is the most common form of dementia, accounting for 60-80% of all cases (2010 Alzheimer’s disease facts and figures, 2010) and affecting people aged 85 or older with an incidence of 25-50% [124]. Dementia is caused by various diseases and conditions that result in damaged brain cells or connections between brain cells. When making a diagnosis of dementia, physicians commonly refer to the criteria given in the Diagnostic and Statistical Manual of Mental Disorders, Fourth Edition (DSM-IV) [125]. To meet DSM-IV criteria for dementia, the following are required: symptoms must include decline in memory and decline in at least one of the following cognitive abilities:
Ability to generate coherent speech or understand spoken or written language;
Ability to recognize or identify objects, assuming intact sensory function;
Ability to execute motor activities, assuming intact motor abilities, sensory function, and comprehension of the required task;
Ability to think abstractly, make sound judgments, and plan and carry out complex tasks. The decline in cognitive abilities must be severe enough to interfere with daily life. It is important for a physician to determine the cause of memory loss or other dementia-like symptoms. Some symptoms can be reversed if they are caused by treatable conditions such as depression, delirium, drug interaction, thyroid problems, excess use of alcohol, or certain vitamin deficiencies. When dementia is not caused by treatable conditions, a physician must conduct further assessments to identify the form of dementia that is causing symptoms. Different types of dementia are associated with distinct symptom patterns and distinguishing microscopic brain abnormalities. Although AD is the most common type of dementia, increasing evidence from long-term observational and autopsy studies indicates that many people with dementia have brain abnormalities associated with more than one type of dementia. AD was first identified more than 100 years ago, but research into its symptoms, causes, risk factors, and treatment has only gained momentum in the last 30 years. Although research has revealed a great deal about AD, with the exception of certain inherited forms of the disease, the cause or causes of AD remain unknown. As yet, neither a satisfying therapy nor a preventative cure is available. Furthermore, AD can only be precisely diagnosed post-mortem on a neuropathological basis, the so called Braak stages classify the progress of the disease [126]. AD is one of about 40 identified amyloidoses, whose main pathological hallmark is the aberrant deposition of amyloid fibrils in various tissues. Each of these diseases involves a specific protein and clinical profile, among them Parkinson’s disease, the prion diseases, diabetes type II, Huntington’s disease, and amyotrophic lateral sclerosis [127].

17
1.6.3. Symptoms of Alzheimer’s disease
AD can affect different people in different ways, but the most common symptom pattern begins with gradually worsening difficulty in remembering new information. This is because disruption of brain cell function usually begins in regions involved in forming new memories. As damage spreads, individuals experience other difficulties. The following are warning signs of AD:
Memory loss that disrupts daily life;
Challenges in planning or solving problems;
Difficulty completing familiar tasks at home, at work, or at leisure;
Confusion with time or place;
Trouble understanding visual images and spatial relationships;
New problems with words in speaking or writing;
Misplacing things and losing the ability to retrace steps;
Decreased or poor judgment;
Withdrawal from work or social activities;
Changes in mood and personality. Individuals progress from mild AD to moderate and severe disease at different rates. As the disease progresses the individual’s cognitive and functional abilities decline. In advanced AD, people need help with basic activities of daily living (ADLs), including bathing, dressing, using the bathroom, and eating. Those in the final stages of the disease lose their ability to communicate, fail to recognize loved ones, and become bed-bound and reliant on around-the-clock care. The inability in late-stage AD to move around can make a person more vulnerable to infections, including pneumonia. AD is ultimately fatal, and AD-related pneumonia is often the cause. Although families generally prefer to keep the person with AD at home as long as possible, most people with the disease eventually move into a nursing home or another residence where around-the-clock professional care is available [128].
1.6.4. Diagnosis of Alzheimer’s disease
In 2011, the National Institute on Aging (NIA) and the Alzheimer’s Association recommended new diagnostic criteria and guidelines for AD. The new criteria and guidelines update, refine, and broaden guidelines published in 1984 by the Alzheimer’s Association and the National Institute of Neurological Disorders and Stroke. The new criteria and guidelines result from work that began in 2009, when more than 40 AD researchers and clinicians from around the globe began an in-depth review of the 1984 criteria to decide how they might be improved by incorporating scientific advances from the past 3 decades. It is important to note that these are recommended criteria and guidelines. More research is needed, especially biomarker research, before the new criteria and guidelines can be used in clinical settings, such as in a doctor’s office. The new criteria differ from the original one, based chiefly on a doctor’s clinical judgment about the cause of a patient’s symptoms, taking into account reports from the patient, family members, and friend, results of cognitive testing and general neurological assessment, in two main aspects:

18
Identification of three stages of AD with the first occurring before symptoms such as memory loss develop and before the affection of one’s abilities to carry out everyday activities;
Inclusion of biomarker tests such as levels of certain proteins in fluids (e.g.
levels of tau and amyloid- in the cerebrospinal fluid and blood). The three stages of AD identified in the new criteria and guidelines are preclinical AD, mild cognitive impairment (MCI) due to AD, and dementia due to AD. These stages are different from the stages now used to describe AD, i.e. mild/early stage, moderate/mid stage, or severe/late stage. The new criteria propose that AD begins before the mild/early stage and that new technologies have the potential to identify AD-related brain changes that occur before mild/early stage disease. When these very early changes in the brain are identified, an individual diagnosed using the new criteria would be said to have preclinical AD or MCI due to AD. The third stage of the new criteria, dementia due to AD, encompasses all stages of AD as described today, from mild/early stage to severe/late stage. In the preclinical AD stage individuals have measurable changes in the brain, cerebrospinal fluid, and/or blood biomarkers that indicate the earliest signs of disease even if they have not yet developed symptoms such as memory loss. This preclinical or presymptomatic stage reflects current thinking that AD begins creating changes in the brain as many as 20 years before symptoms occur. Although the new criteria and guidelines identify preclinical disease as a stage of AD, they do not establish diagnostic criteria that doctors can use now. Rather, they state that additional biomarker research is needed before this stage of AD can be diagnosed. Individuals with MCI have mild, but measurable, changes in thinking abilities that are noticeable to the person affected and to family members and friends, but that do not affect the individual’s ability to carry out everyday activities. Studies indicate that as many as 10% to 20% of people aged 65 years have MCI. It is estimated that as many as 15% of people whose MCI symptoms cause them enough concern to contact their doctor’s office for an examination go on to develop dementia each year. From this estimate, nearly half of all people who have visited a doctor about MCI symptoms will develop dementia in 3 or 4 years [129]. This estimate is higher than for individuals, whose MCI is identified through community sampling (and not as a result of a visit to a doctor because of cognitive concerns). For these individuals, the rate of progression may reach 10% per year [130]. Further cognitive decline is more likely among individuals whose MCI involves memory problems than in those whose MCI does not involve memory problems. Over 1 year, most individuals with MCI who are identified through community sampling remain cognitively stable. Some, primarily those without memory problems, experience an improvement in cognition or revert to normal cognitive status. It is unclear why some people with MCI develop dementia and others do not. When an individual with MCI goes on to develop dementia, many scientists believe the MCI is actually an early stage of the particular form of dementia, rather than a separate condition. The new criteria and guidelines recommend biomarker testing for people with MCI to learn whether they have brain changes that put them at high risk of developing AD or other dementias. If it can be shown that changes in the brain, cerebrospinal fluid, and/or blood are caused by physiological processes associated with AD the new criteria and guidelines recommend a diagnosis of MCI due to AD. Before

19
doctors can make such a diagnosis, however, researchers must prove that the biomarker tests accurately indicate risk. Dementia due to AD is characterized by memory, thinking, and behavioural symptoms that impair a person’s ability to function in daily life and that are caused by AD-related processes. Current medical guidelines do not recommend that primary care physicians perform routine assessment for cognitive impairment or dementia in their patients, unless a patient exhibits obvious signs or symptoms of cognitive impairment.
1.6.5. Etiology of Alzheimer’s disease
The etiology of Alzheimer’s disease (AD), a condition characterized by progressive dementia with gradual loss of cognitive function, is still unresolved. During several decades, most research advances in Alzheimer’s disease were concentrated on the activity of neuronal cells. However in the past few years an increase set of evidence has converged on the major role of glial cells and alterations in their function, in the pathway toward neurodegeneration. There is growing evidence that indicate an involvement of the immune system and neuroinflammatory processes such as an increase of proinflammatory cytokines and activation of microglia and changes or defects in immune response in the blood of these subjects. Inflammation is a key component of an innate immune response. Innate immunity is a highly conserved system that protects the host from infectious and injury in a relative non-specific manner. It provides the first line of defence by recognizing pathogen-associated microbial patterns and inducing key co-stimulatory molecules and cytokines, which activate the mechanisms of the adaptive immunity. A multitude of factors are implicated in the response such as cytokines, the complement system, acute phase reactants and various cellular elements. While this system is an effective and potent response to acute challenges, it is imperative that it be tightly regulated over the longer term. Dysregulation and chronic activation can have detrimental effects on the host. The cause of AD is not clear, but ongoing research has identified a number of commonly accepted risk factors including genetic, biological and environmental factors.
1.6.5.1. Genetic Aging is the most important known non-genetic risk factor for late-onset AD. Potential environmental risk factors include head injury, low educational levels, hyperlipidemia, hypertension, homocysteinemia, diabetes mellitus, and obesity [137-140]. However several of these associations remain controversial. Combination of one or more of these environmental risk factors with Apolipoprotein E4 (APOE4) may further increase the risk for late-onset AD and age-reated decline [141]. AD cases can be divided into two main subtypes based on the age of onset: the (sporadic) late-onset AD (LOAD), characterized by disease manifestation at ages above 65 years, and early-onset (familial) AD (EOFAD), which occurs from 30 years to 65 years. The early-onset familial forms of AD have an autosomal dominant inheritance linked to 3 genes: amyloid precursor protein (APP), presenilin-1 (PS-1), and presenilin-2 (PS-2), whereas the most common sporadic form of AD, which occurs after the age of 60, has thus far been consistently, across numerous studies, associated with only one gene, the APOE gene.

20
Mutations in three genes, APP, PS-1 and PS-2, cause early onset (<60 years) autosomal dominant AD [142], which probably accounts for less than 1% of AD cases [143]. The mutations affect APP processing, leading to altered production of
different A peptides and, thus, their relative ratios. Down’s syndrome patient carrying an extra copy of chromosome 21, on which APP gene resides, develop early-onset dementia with pathological hallmarks of AD in their brains [144] consistent with the idea that over-expression of APP cause early-onset AD. In strong support to this idea, duplication of the APP gene alone leads to early-onset AD [145]. Moreover increased APP gene expression caused by genetic variations in the promoter sequence may be a risk factor for late-onset AD, with levels of APP expression correlating inversely with age of disease onset. While EOFAD is caused by rare and highly penetrant mutations in three genes the genetics of LOAD in more complex. Increasing age is the major risk factor for LOAD. In addition, APOE gene on chromosome 19 has been demonstrated to represent a major genetic risk factor.
In 2003, the first A vaccination trial was eventually performed [147]. However, due to the occurrence of meningoencephalitis in some of AD patients, this initial trial had to be suspended. Apolipoprotein E4 (APOE4) has been genetically linked to late-onset (>60 years) familial and sporadic AD, which accounts for most AD cases, and has a gene-dose effect on increasing the risk and lowering the age of onset of the disease [148]. All well-conducted genome-wide association studies on late-onset AD from different populations around the world identified APOE4 as the top late-onset AD gene with extremely high confidence [142]. The lifetime risk estimate of developing AD for individuals with two copies of the APOE4 allele (~2% of the population) is the ~60% by the age of 85, and for those with one copy of the APOE4 allele (~25% of the population) ~30%. In comparison, the lifetime risk of AD for those with two copies of APOE3 allele is ~10% by the age of 85 years. Thus, APOE4 should be considered a major gene, with semidominant inheritance, for late-onset of AD [149]. Genome-wide association studies also identified other genes that modulate the risk of late-onset of AD, including CLU, CR1, PICALM, BIN1, SORL1, GAB2, ABCA7, MS4A4/MS4A6E, CD2AP, CD33, EPHA1 and HLA-DRB1/5 [142]. However, the relative contribution of these genes to AD is modest as compared to apoE4.
1.6.5.2. Epigenetic Epigenetics refers to modifications in gene expression that are influenced by DNA methylation and/or chromatin structure, RNA editing, and RNA interference without any changes in DNA sequences [150]. Epigenetic mechanisms may play a role in AD pathogenesis [151]. Studies on post-mortem brain samples and peripheral leukocytes, as well as transgenic animal models, have shown that aging and AD are associated with epigenetic dysregulation at various levels, including abnormal DNA methylation and histone modifications. Although it is unclear whether the epigenetic changes observed in AD represent a cause or a consequence of the disease, twin studies support the notion that epigenetic mechanisms modulate AD risk [152].
1.6.5.3. The amyloid hypothesis The major pathological hallmarks in the brain of AD patients, in addition to nerve
and synapse loss, are y the accumulation of amyloid- peptide into amyloid

21
plaques in the extracellular brain parenchyma and the formation of neurofibrillary tangles (NFT) inside neurons, as a result of the abnormal phosphorylation of the microtubules-associated tau- protein. Although tau is normally considered an intracellular protein, tau aggregates, named “ghost tangles”, are observed in the extracellular space [153] and tau peptide is readily detected in the cerebrospinal fluid of patients [154]. These lesions occur in brain regions involved in learning and memory, i.e. the hippocampus, the amygdala, and in the association cortices of the frontal, temporal
and parietal lobes. Further A accumulation is observed in the small blood vessels of the meninges and cerebral cortex, also termed cerebral amyloid angiopathy [155].
The amyloid hypothesis, formulated in the early 1990s [156,157], is based on the
observation that A peptides accumulate into senile plaques; these lesions occur in brain regions involved in learning and memory, i.e. the hippocampus, the amigdala, and in the association cortices of the frontal, temporal and parietal lobes. Further
the accumulation of A is observed in the small blood vessels of meninges and cerebral cortex, also termed cerebral amyloid angiopathy. Such accumulation is held responsible for neurodegeneration [158]. Post-mortem examination of the brain of AD patients typically reveals a loss of synapses, and damage to neuritis associated with the plaques, which suggests that Aβ damages synapses and neurites. AD brains also exhibit a number of pathologic abnormalities including a loss of synapses, reactive gliosis, microglial activation, and neuroinflammation [159].
A is generated as a normal product of the metabolism of the amyloid- protein
precursor (APP), which is thought to be involved in neuronal growth, survival and
post-injury repair [160]. Mature A PP is metabolized by two competing pathways:
the -secretase pathway that generates sAPP and C83 and the -secretase
pathway that generates sAPP and C99. C99 is a substrare for -secretase
generating A [161,162]. In the brain, A is produced mainly in various cellular compartments of neurons, but has also been detected in glial cells and astrocytes
[163]. In vivo, A variants with lengths of 38-43 amino acids, differing in their C-
terminus, are produced due to differential cleavage of APP by secretase, following a mechanism termed regulated intramembrane proteolysis [164]. The most
abundant variants are A1-40 and the more amyloidogenic A1-42, with an approximate ratio of 10:1. APP is ubiquitously expressed, and cells possess the enzymatic machinery required not only to produce it but also to degrade it, suggesting that the production
of A from APP may serve a normal biological role. A PP is found mainly at the plasma membrane, but also in the trans-Golgi network, the endoplasmic reticulum, and at endosomal, lysosomal and mithocondrial membranes [165]. Different
isoforms of A PP with lengths of 695-770 amino acid residues exist. The
physiological function of A PP and its metabolic products are subject to intensive
research. A PP knockout mice are viable but have been shown to display synaptic, learning and memory deficits. The number of functional synapses
generally seems to be modulated by A PP in a dose-dependent manner. A PP

22
has been shown to be important for the regulation of neuronal survival, neurite outgrowth, synaptic plasticity and cell adhesion [166].
Amyloidogenic processing of A PP involves sequential cleavage by -secretase
(also termed BACE1) and -secretase. Upon -secretase cleavage, the
extracellular sAPP segment is released and the remaining C terminal C99
fragment can be further processed by -secretase, producing A and AICD, or by caspases to release the neurotoxic peptide C31 [167]. AICD can translocate to the nucleus, where it regulates gene expression and potentially induces production of
apoptotic proteins [168]. Although a pathogenic role for A is generally accepted, the mechanisms remain poorly understood.
Central to A hypothesis of AD is that disease progression is the result of an
increase A burden in affected areas of the brain. Equally important to the total A
load however is the aggregation state in which A is present. Initially produced as a
soluble 4 kDa peptide, the amyloidogenic A readily interacts with other A molecules to progressively form a wide range of oligomers and soluble aggregates.
Continued amyloidogenesis gives rise to the high molecular weight insoluble A fibrils that are present within amyloid deposits of the AD brain. Amyloidogenesis is common to several proteins associated with degenerative disease, indicating that the mechanisms of degeneration may share some commonality with the respect to the proteins’ amyloidogenic properties [169].
A have also been shown to activate microglia and induce the production of
inflammatory mediators such as NO, ROS, TNF-, Interleukins (IL-1, IL-6, IL-18), and prostaglandins (e.g., Prostaglandin E2 [PGE2]), that promote neuronal death
[170]. These lines of evidence suggest that A accumulation directly contributes to neuronal damage and/or indirectly contribute to activation of inflammatory systems, leading to progression of AD. Significant amyloid deposition is a characteristic feature of all patients with Alzheimer’s disease; however, it is also present in many normal adults and in Mild Cognitive Impairment at a level higher than normal older adults and it is a strong predictive factor in conversion to AD [171]. Until the development of the amyloid-sensitive ligands, there have been a variety of other techniques used to measure amyloid plaque accumulation, including methods that indirectly estimated levels of
brain amyloid plaques from Alevels in plasma or cerebral spinal fluid (CSF).
Postmortem studies, previously the only method examining Ahave found that 25-
30% of individuals with no clinical symptoms of dementia have levels of Aequal to
the diagnostic level for AD [171]. In addition to measuring Alevels in the CSF,
more recently Adeposits have become measureable using PET and radiotracer
ligands that bind to the aggregated fibrillar form of A. The three most common
ligands in use to image Adeposition with PET are the 11C-labeled PET tracer 6-OH-BTA alzo known as Pittsburgh compound B or PIB [172], the 18F-labeled tracer FDDNP [173] and 18Florbetapir, also known as 18F-AV-45 [174]. While none of these compounds are FDA approved for clinical use, these amyloid imaging agents have been received with great interest in the research community and are in use in a number of clinical trials. The FDA has already approved the use of all three compounds as biomarkers to test the mechanisms of several putative amyloid lowering drugs [175].

23
Less is known about the role of A in normal aging compared to the literature examining memory impairment or dementia. However, a few studies have measured amyloid deposition with respect to normal aging and the findings indicate the presence of deposits in frontal, cingulate, and parietal areas, with primary sensory/visual areas relatively protected from amyloid deposition. Studies with normal aging adult samples consistently report that approximately 20 to 30% of healthy older controls show significant amyloid deposition [176]. This finding led to many questions. One is whether cognitively normal subjects with elevated amyloid, as measured by PIB, display any subtle cognitive changes compared to their amyloid-negative counterparts. Thus far, the data have been mixed. Results from different studies are controversial. A couple of studies did not detect significant cognitive differences between healthy controls with and without increased levels of PIB binding [177,178]. However, Pike and colleagues reported that PIB uptake correlated with episodic memory performance [179]. Given the relatively small numbers of subjects in these studies and the potential for individual variability in cognitive performance, it is perhaps not surprising that these results have been somewhat inconsistent. Interestingly, in another study PIB PET scans were performed in a group of healthy elderly individuals who had been followed with psychometric testing for up to 10 years prior to the study [180]. This group was then divided into subjects who displayed some degree of cognitive decline over that period versus those who did not. Overall, the decliners were much more likely to display elevated PIB uptake, which suggests that the term “asymptomatic” may be relative. Along these lines, a recent report found evidence of cortical thinning in cognitively normal elderly with elevated PIB binding supporting the notion that despite being classified as normal, these individuals are already beginning to display neurodegenerative brain changes [181]. The existing evidence seems to suggest that amyloid is a critical initiating event in a cascade of events that ultimately leads to cognitive decline. Because amyloid deposition is putatively the first event in this negative cascade, many normal old adults harbor amyloid burden but behave within normal cognitive limits [182].
1.6.5.4. Tau hypothesis Another explanation, the tau hypothesis, is supported by the observation that tau hyperphosphorylation constitute a common feature explaining the alteration of the signalling pathways seen in degenerating neurons [183]. Neuroinflammatory processes and the activation of the immune system are present in AD; these
processes are related to amyloid- containing plaques, [184,185] and are characterized as an increase of proinflammatory cytokines and as the activation of microglia in the AD brain [170]. The tau protein was initially identified from isolated brain microtubules as a microtubule-associated protein (MAP). Subsequent in vitro analysis and studies in cultured cells then suggest that the tau protein facilitates assembly and stabilization of microtubule polymers. It has been suggested that alterations in the amount or conformation of tau, as well as other modifications to this protein, could have pathological effects. These modifications provoke disorders known as tauopathies [186], of which Alzheimer’s disease is the most prevalent. Tauopathies are

24
neurodegenerative diseases in which neurodegeneration is associated with the presence of phosphorylated or/and aggregated tau. The development of tau pathology in AD correlates with the neurodegeneration found during the progression of the disease [187], which also correlates with the appearance of phosphorylated tau [188]. In addition, an inverse relationship has been found in damaged regions between the number of extracellular NFT ghost tangles and the number of surviving cells [189]. This observation suggests that neurons containing NFT could degenerate and release their intracellular NFT into the extracellular environment [153], which may be toxic for the surrounding neurons [190]. An excess of tau protein could inhibit the trafficking of vesicles and organelles in neurons [191]. As several data concerning the toxicity of phosphorylated tau suggest, phospho-tau can sequester some other brain MAPs, producing disorganization of microtubule network that might be toxic to a neuron [192,193]. The addition of recombinant tau protein to cultured neuronal cells produces an increase in intracellular calcium that could lead to neuron degeneration. As indicated above it has been suggested that endogenous intracellular tau may be released to the extracellular space upon neuron degeneration, where it could be toxic to other neurons [153]. Although it has been postulated that the presence of tau in the extracellular space is due to neuron degeneration, the presence of extracellular tau could be due to other causes. For example it might be exocytosed by cells, as indicated for the prion protein [194]. Indeed, intraneuronal transfer of tau protein between neurons in situ has been recently described, suggesting that N-terminal region of tau is required for tau secretion [195]. The increase of intracellular calcium induced by tau is caused by its interaction with M1 and M3 muscarinic receptors expressed by neurons [196]. As a result of neuronal death, oligomeric forms and tau filaments are released to the extracellular environment, contributing to activation of microglial cells and stimulating the deleterious cycle leading to neurodegeneration and neuroinflammation. Neuroinflammation plays a fundamental role in the progression of Alzheimer’s disease and other tauopathies. It is well documented that extracellular aggregates
of amyloid-, which senile plaques are consisted of, are considered responsible for initiating the non-immune mediated chronic inflammatory response manifested by
activated microglia and astrocytes. Amyloid-deposits attract microglia and activated them to produce acute-phase proteins, complement compounds and chemokines. Activated microglia are also present around neurofibrillary tangles at early as well as later stages of tangle formation [197]. Further it has been demonstrated that microglia activation was also correlated with tau burden in other human tauopathies [198,199]. In a rat model of tauopathy it has been demonstrated that neurodegenerative lesions caused by human truncated tau promote inflammatory response manifested by upregulation of immune molecules (CD11a,b, CD18, CD4, CD45, and CD68) and morphological activation of microglia cells. In the transgenic rat brain neurofibrillary lesions and axonal degeneration were closely associated with the distribution of reactive microglia and macrophage, differently involved in the grey and white matter lesions: while activated microglia cells prevail in the grey matter lesions, macrophages were dominant in the white matter lesions. Activation of microglia is characterized by proliferation, migration to the site of injury, morphological characteristics, immunophenotypical (upregulation of innate immune cell surface receptors) and
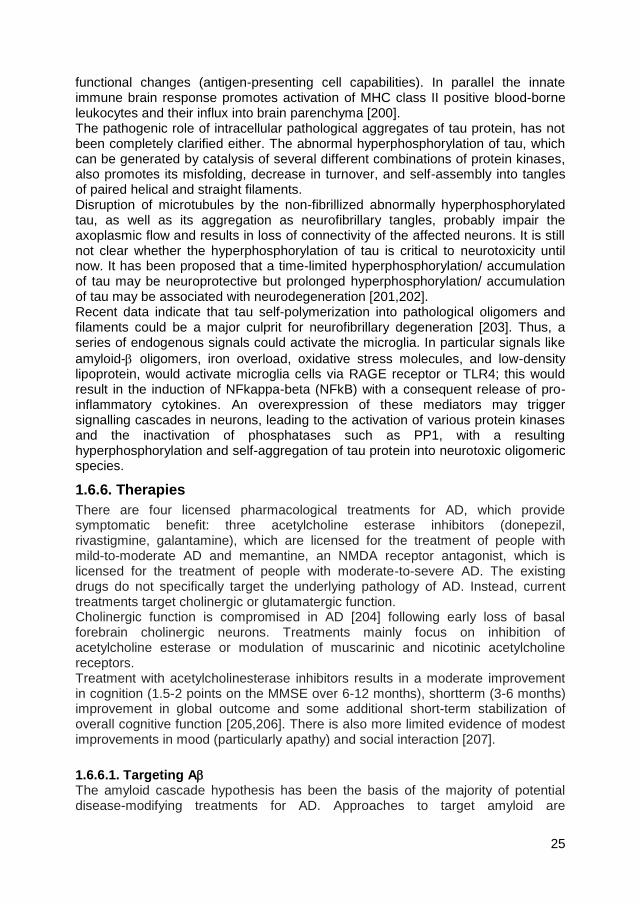
25
functional changes (antigen-presenting cell capabilities). In parallel the innate immune brain response promotes activation of MHC class II positive blood-borne leukocytes and their influx into brain parenchyma [200]. The pathogenic role of intracellular pathological aggregates of tau protein, has not been completely clarified either. The abnormal hyperphosphorylation of tau, which can be generated by catalysis of several different combinations of protein kinases, also promotes its misfolding, decrease in turnover, and self-assembly into tangles of paired helical and straight filaments. Disruption of microtubules by the non-fibrillized abnormally hyperphosphorylated tau, as well as its aggregation as neurofibrillary tangles, probably impair the axoplasmic flow and results in loss of connectivity of the affected neurons. It is still not clear whether the hyperphosphorylation of tau is critical to neurotoxicity until now. It has been proposed that a time-limited hyperphosphorylation/ accumulation of tau may be neuroprotective but prolonged hyperphosphorylation/ accumulation of tau may be associated with neurodegeneration [201,202]. Recent data indicate that tau self-polymerization into pathological oligomers and filaments could be a major culprit for neurofibrillary degeneration [203]. Thus, a series of endogenous signals could activate the microglia. In particular signals like
amyloid- oligomers, iron overload, oxidative stress molecules, and low-density lipoprotein, would activate microglia cells via RAGE receptor or TLR4; this would result in the induction of NFkappa-beta (NFkB) with a consequent release of pro-inflammatory cytokines. An overexpression of these mediators may trigger signalling cascades in neurons, leading to the activation of various protein kinases and the inactivation of phosphatases such as PP1, with a resulting hyperphosphorylation and self-aggregation of tau protein into neurotoxic oligomeric species.
1.6.6. Therapies
There are four licensed pharmacological treatments for AD, which provide symptomatic benefit: three acetylcholine esterase inhibitors (donepezil, rivastigmine, galantamine), which are licensed for the treatment of people with mild-to-moderate AD and memantine, an NMDA receptor antagonist, which is licensed for the treatment of people with moderate-to-severe AD. The existing drugs do not specifically target the underlying pathology of AD. Instead, current treatments target cholinergic or glutamatergic function. Cholinergic function is compromised in AD [204] following early loss of basal forebrain cholinergic neurons. Treatments mainly focus on inhibition of acetylcholine esterase or modulation of muscarinic and nicotinic acetylcholine receptors. Treatment with acetylcholinesterase inhibitors results in a moderate improvement in cognition (1.5-2 points on the MMSE over 6-12 months), shortterm (3-6 months) improvement in global outcome and some additional short-term stabilization of overall cognitive function [205,206]. There is also more limited evidence of modest improvements in mood (particularly apathy) and social interaction [207].
1.6.6.1. Targeting A
The amyloid cascade hypothesis has been the basis of the majority of potential disease-modifying treatments for AD. Approaches to target amyloid are

26
characterized within three main strategies: treatments to reduce A (and/or A 1-
42) production, approaches to promote clearance of A and treatments to reduce
A aggregation.
The primary approach to treatments to reduce the production of A is through
targeting the AP proteolytic process performed by secretases to alter the A 1- 40/
A 1-42 ratios. This has involved either inhibiting or modifying -, - and -
secretase to shift the process toward production of A1-40. Although - and -secretase inhibition could be a promising way to achieve this, there are significant barriers to overcome. One of the main difficulties is to designe an inhibitor that will
retain the ability to cross the blood brain barrier. In addition, both - and -secretases are active against numerous substrates, which raise the risk of causing significant adverse effects with a non-specific inhibitor [208].
Techniques to promote removal of A from the brain have focused on immunization as a therapeutic strategy. Proposed mechanisms include targeting of
either soluble or aggregated A through antibody binding, phagocytosis or direct extraction by plasma antibodies.
Initial approaches based on immunization with A fragments performed extremely well in transgenic mouse models but showed less promise in humans [209]. The
most promising of these, AN-1792 (QS-21) resulted in significant A -antibody titers in patients with mild-moderate AD in Phase II trials. Post-mortem analysis on long-term follow-up also confirmed that the therapy had resulted in significant
reduction in A burden in the brain. However, there was no evidence of any clinical benefit and the trial was stopped due to patients developing aseptic meningoencephalitis, thought to have been induced by cytotoxic T-cell activation [210]. Immunization strategy has focused on two main techniques, either intravenous delivery of immunoglobulins (IVIg) from healthy donors or infusion of monoclonal or
polyclonal anti- A antibodies. Monoclonal antibody therapies currently in trials include bapineuzumab (AAB-001), solanezumab (LY-2062430), PF-04360365, GSK-933776, R-1450 (RO-4909832) and MABT-5102A, of which bapineuzumab and solanezumab are now in Phase III RCTs. Solanezumab is designed to target
soluble A, drawing on evidence that these species of A confer the highest toxicity. It has performed well in trials to date [211].
Current literature supports the hypothesis that small soluble A oligomers are responsible for neurotoxicity and synaptotoxicity in AD [164,212]. Drug development has, therefore, focused on identifying compounds to inhibit
aggregation or to specifically target oligomeric forms of A. This raises similar challenges in toxicity and blood brain barrier penetration as are encountered with secretase inhibitors. However, all the trials were halted for treatment groups receiving high doses due to significant adverse effects.
1.6.6.2. Anti-tau therapies Treatments to target tauopathy in AD have received far less attention than amyloid therapies, and only one treatment has been taken to Phase III trial. Immunotherapy
Inhibition of glycogen synthase kinase (GSK) 3 has been hypothesized as a promising approach since GSK-3 is a key enzyme in tau phosphorylation.

27
However, a Phase III trial with the anticonvulsant sodium valproate showed no benefit and an increase in AD progression and mortality [213].
1.6.6.3. Additional approaches In an effort to improve neuronal function, a number of treatments have been proposed. This includes therapeutic approaches based on evidence for the role of trophic factors such as nerve growth factors (NGF). Several innovative approaches are also in development and evaluation, including delivery of genetic factors to boost NGF production via a viral vector (CERE 100) and techniques using cutting-edge nanotechnology, which have shown promise in animal models [214].
Additional approaches to AD treatment have also been explored as routes to prevent pathological processes although progress in these areas has been limited. These areas include mitochondrial dysfunction, trophic factor depletion, loss of synaptic plasticity, inflammation and hypertension [215]. Because there is plenty of evidence for oxidative damage, inflammation and mitochondrial impairments in AD [216,217], several attempts have been made to slow disease progression with antioxidants [218], anti-inflammatory drugs [219], or putative mitochondrial protectors. The rationale for these approaches is based on animal studies, epidemiological evidence and in some cases very preliminary studies in people with AD and/or other dementias.
1.7. Neuroinflammation in AD
Inflammation is a key component of an innate immune response. Innate immunity is a highly conserved system that protects the host from infectious and injury in a relatively non- specific manner. Sustained inflammation resulting in tissue pathology implies persistence of an inflammatory stimulus or a failure in normal resolution mechanisms. A persistent stimulus may result from environmental factors or the formation of endogenous factors (e.g. protein aggregates) that are perceived by the immune system as “stranger” or “danger” signals. Inflammatory responses reestabilished feed-forward loops may overwhelm normal resolution mechanisms. Although some inflammatory stimuli induce beneficial effects (e.g. phagocytosis of debris and apoptotic cells) and inflammation is linked to tissue repair processes, uncontrolled inflammation may result in production of neurotoxic factors that amplify underlying disease states. A multitude of factors are involved in the overall response such as cytokines, the component system, acute phase reactants and various cellular elements, which in concert mount a powerful action. Dysregulation and chronic activation can have detrimental effects for the host by extending focal damage into nearby healthy tissue, a process termed “bystander damage”. Controlling and reducing the damaging properties of inflammation have proven to be useful in the therapy of a number of peripheral disorders such as atherosclerosis and rheumatoid arthritis. Chronic inflammation has been implicated not only in diseases of the periphery, but also in the central nervous system in neurodegenerative disorders such as Alzheimer’s disease, Parkinson’s disease (PD) and amyotrophic lateral sclerosis (ALS).

28
Evidence of an inflammatory response in AD includes changes in microglia morphology, from ramified (resting) to ameboid (active), and astrogliosis, manifested by an increase in the number, size, and motility of astrocytes,
surrounding and enveloping the A senile plaques [220,221]. Compared to those found in the non-demented brain, these microglia express higher levels of a number of cell surface proteins, including the major histocompatibility complex II cell surface glygcoprotein. In addition, a variety of
other cell surface proteins are upregulated on activated microglia neighboring A plaques. Microglia surrounding plaques stain positive for activation markers and
proinflammatory mediators, including MHC class II, COX-2, MCP-1, TNF-, IL-1, and IL-6 [170]. MCP-1 is known to induce chemotaxis of astrocytes around senile plaques [221]. In addition, elevated levels of chemokines and cytokines and their
receptors, including, IL-1, CXCR2, CCR3, CCR5, and TGF- have been reported in post-mortem AD brains [222]. Microglia surrounding plaques have also been shown to proliferate, contributing to their accumulation at the plaque periphery [220,221]. Some aspects of the microglial inflammatory response represent positive influences with respect to AD
pathogenesis, such as phagocytosis, which may participate in the removal of A from the brain. Inhibition of microglial activity protects the brain from inflammatory lesions [223]. Collateral injury is mediated by inflammatory factors that are either neurotoxic themselves or attract the migration of leucocytes into the affected area, which, in turn, propagate a detrimental inflammatory environment. In most organs inflammation leads to collateral injury, which is typically reversible, given the inherent regenerative capacity of that tissue. However, in the brain the stakes are higher. The consequence of collateral injury in the CNS is irreversible neuronal loss and atrophy due to two specific circumstances: first, the outstanding susceptibility of neurons to cell death mediated by molecules generated during the respiratory burst of an innate immune response [224,225] and second, regenerative failure of the brain as the combined consequence of molecular inhibitors of axonal growth [226,227] as well as limited repopulation by resident neuronal precursors [228]. Expression of inflammatory mediators has been demonstrated in affected brain regions [99]. Some pharmacological inhibitors and modulators of inflammation, such as nonsteroidal anti-inflammatory drugs (NSAIDs), have been shown to exert protective effects in several epidemological studies as well as in animal models of neurodegenerative disease [229,230]. Age-related dysfunction of microglial cells can be a significant cause underlying age-related neurodegenerative diseases such as AD [231]. Microglia display several morphological changes, which are pronounced with aging. Senescent dystrophic microglial cells show decreased arborization and beading of their processes [232,233] and abnormal cytoplasmic structures [232,234]. Senescent like microglia colocalize with neurodegenerating neuronal cells and show functional deterioration, including a high incidence of clumping, particularly in white matter [235]. It is especially interesting that senescent dystrophic microglial cells precede the appearance of tau neuropathology [233]. Microglia also show progressive replicative senescence characterized by an increased microglial proliferation in

29
response to nerve injury [236] and inflammatory hyper responsiveness as a function of age [237]. The role of microglia in Alzheimer disease has not been solved. Microglia can be
neuroprotective by phagocytosing amyloid-, but the activation of microglia and the secretion of neurotoxins may also cause neurodegeneration. Notably, in vitro studies using human cultured microglia have shown that aggregated amyloid-beta peptide could result in the activation of such microglia, inducing a proinflammatory status [238]. Activated microglia and reactive astrocytes localize in the proximity of fibrillar plaques, and initially, the phagocytic microglia engulfs and degrades
amyloid-. Nevertheless, chronically activated microglia releases chemokines and
a cascade of pro-inflammatory cytokines- notably IL-10, IL-6, TNF-. Microglia also
expresses receptors for advanced glycation and products that bind amyloid-, thereby amplifying the generation of cytokines, glutamate, and nitric oxide. Importantly, the levels of pro-inflammatory cytokines are dependent on the magnitude of plaque burden in the AD brain [239] and it has been suggested that
the inflammatory response facilitates the production and deposition of A [170,239]. In the past few years, it has become evident that the innate immune system and, in particular, pattern recognition receptors (PRRs) such as Toll-like receptors (TLRs) play a major role in infectious but also in non-infectious CNS diseases. Activation of TLRs expressed in microglia leads to oligodendrocyte and neuronal injury [240,241]. There is clear evidence that TLR4 can trigger amyloid-beta induced activation of murine microglia and human monocytes [242]. Interestingly, TLR2 was also shown to be an important signalling receptor in neuroinflammation, especially in brain injury [243].
TLRs are demonstrated to mediate microglial activation and clearance of A from the brain [242,244]. In addition to CD14 and TLRs functioning in microglial
activation, CD14 functions in the recognition and clearance of A- damaged neurons [245]. Thus, the innate immune system is truly a double-edged sword. It
has been proposed that at low A concentrations corresponding to those observed in the brain of early/middle stage AD, CD14 and TLRs may activate microglia
promoting phagocytic clearance of A, whereas at higher A concentrations corresponding to those at late stage AD, microglial activation through CD14 and the TLRs results in production of neurotoxins as well, thereby damaging surrounding neurons [244] and killing these damaged neurons. The recognition of the involvement of TLRs and their co-receptors in AD pathogenesis suggests that they may be an appropriate target for therapeutic intervention within the disease. Peripheral blood macrophages from AD patients were also found to be less effective in phagocyting amyloid-beta, and monocytes were impaired when differentiating into macrophages [246]. The mechanism of microglial accumulation into normal or Alzheimer disease is not established. In normal adult brain a limited number of mononuclear phagocytes are continuously recruited into the brain where they may differentiate into parenchymal microglia. The role of chemokines and their receptors in the recruitment and retention of microglia in normal and Alzheimer disease brains is not known either. Mononuclear

30
phagocytes (CD16-), including microglia, express several chemokine receptors such as CCR2. Monocyte chemotactic protein-1 (MCP-1), the main CCR2 chemokine ligand, is upregulated in brains of AD patients [247]. CCR2 mediates the accumulation of mononuclear phagocytes from bone marrow at sites of inflammation. CCR2 deficiency accelerates early disease progression and markedly impairs microglial accumulation in a transgenic model of Alzheimer disease [248]. From a mouse model has emerged that resident monocytes, blood monocytes and NK cells (CD16
+ in humans) express high levels of CX3CR1 which, upon
interaction with CX3CL1 facilitates extravasation into non-inflamed tissues where these cells give rise to specialized cell types. These finding suggest that CD16
+
and CD16- monocytes are recruited into different anatomic sites under constitutive or inflammatory conditions and play distinct roles in immunity and disease pathogenesis.

31
2. AIM OF THE STUDY
It is now clear that immune responses do occur in the CNS, can be driven by endogenous (glial) and/or exogenous (peripheral leukocytes) sources, and can play either a protective or a pathological role [249]. Peripheral monocyte/macrophage recruitment in CNS could restrict amyloid- beta plaques [250]. In this context is noteworthy to underline that activated endothelium and microglia can present amyloid-beta peptides to T cells, thus inducing an adaptive immune response. Whether the arrival of T-cells is beneficial or detrimental is not understood. However, certainly in the case of massive T-cell response (for instance in amyloid-beta vaccine-related meningoencephalitis), the effects seem to overwhelmingly negative. T cells are activated and display memory phenotype in AD patients; these cells can be detected both in the periphery and as infiltrates in the brain [96]. Upon antigen stimulation, peripheral CD4
+ naive T cells can differentiate into
different subsets characterized by different signalling pathways of activation, transcription factors expression, cytokine production profiles and effectors
functions. Th-1 cells secrete IL-2, IL-12, IFN-, and TNF-, promoting cellular immune responses against intracellular pathogens and viruses. Th-2 cells produce IL-4, IL-5, IL-6, IL-10 and IL-13 and mostly mediate protection against extracellular
pathogens. Th-17 cells produce IL-17, TNF-, IL-21, and IL-22 and play a pivotal role in protection against extracellular pathogens and fungi, besides being involved in tissue inflammation or autoimmune disease. In this context immune-mediated tolerance could play an important role in AD-associated neuroinflammation. One of the main way in which this process is modulated is the reciprocal balance between two molecules present on the surface of immune and non-immune cells: programmed death 1 (PD-1)/ programmed death 1 ligand-1 (PD-L1). PD-1 is expressed on activated T-cells and can bind PD-L1, which is constitutively present on monocytes and can be induced on activated T cells [70]. This interaction results in the up-regulation of IL-10 production, reduction of T cells proliferation [67,77,64], and induction of apoptosis of antigen-specific cells. This pathway thus plays a pivotal role in tolerizing and destroying self antigens-specific cells, therefore preventing autoimmunity. A major unresolved question is whether inhibition of these responses will be safe and effective means of reversing and slowing the course of disease. To effectively address this question it will be necessary to learn more about how inflammatory responses are induced within the central nervous system and the mechanisms by which these responses ultimately contribute to the pathology. Objectives of this study are to assess the role of innate and adaptive immune responses in the onset and the progression of neuroinflammation-associated AD. In particular, we plan to analyze a number of potentially interesting biomarkers to verify their possible role as prognostic markers and as markers predicting the long-term disease evolution and as new tools in therapeutic strategies. To realize this
goal we will analyze A-stimulated peripheral blood mononuclear cells (PBMC) isolated from blood samples of AD and MCI patients; results will be compared to those obtained in age, sex matched control group (HC) without dementia.

32
3. MATERIAL AND METHODS
3.1. Flow cytometry principles
Flow cytometry is a technique for making rapid measurements on particles or cells (including nuclei, microorganisms, chromosome preparations, and latex beads) as they flow in a fluid stream one by one. Physical properties, such as size (represented by forward angle light scatter) and internal complexity (represented by right-angle scatter) can resolve certain cell populations. Flow cytometry is employed in cell counting, sorting, biomarker detection and protein engineering as it allows simultaneous multiparametric analysis of the physical and/or chemical characteristics of up to thousands of particles per second. A beam of light (usually laser light) of a single wavelenght is directed onto a hydrodynamically-focused stream of liquid. A number of detectors are aimed at the point where the stream passes through the light beam: one in line with the light beam (Forward Scatter or FSC) and several perpendicular to it (Side Scatter or SSC) and one or more fluorescence detectors. Each suspended particle from 0.2 to 150 micrometers passing through the beam scatters the ray, and fluorescent chemicals found in the particle or attached to the particle may be excited into emitting light at a longer wavelength than the light source. Scattered and emitted light from cells and particles are converted to electrical pulses by optical detectors. This combination of scattered and fluorescent light is picked up by the detectors, and, by analysing fluctuations in brightness at each detector (one for each fluorescent emission peak), it is then possible to derive various types of information about the physical and chemical structure of each individual particle. FSC correlates with the cell volume and SSC depends on the inner complexity of the particle (i.e., shape of the nucelus, the amount and type of cytoplasmic granules or the membrane roughness). This is because the light is scattered off of the internal components of the cell. A flow cytometer has five main components: a flow cell - liquid stream (sheath fluid), which carries and aligns the cells so that they pass single file through the light beam for sensing;
a measuring system - commonly used are measurement of impedance (or conductivity) and optical systems - lamps (mercury, xenon);
high-power water-cooled lasers (argon, krypton, dye laser); low-power air-cooled lasers (argon-488 nm, red-HeNe-633 nm, green-HeNe, HeCd-UV); diode lasers (blue, green, red, violet) resulting in light signals;
a detector and Analogue-to-Digital Conversion (ADC) system - which generates FSC and SSC as well as fluorescence signals from light into electrical signals that can be processed by a computer an amplification system, linear or logarithim;
a computer for analysis of the signals. A wide range of fluorophores can be used as labels in flow cytometry. Fluorophores, or simply "fluors", are typically attached to an antibody that recognises a target feature on or in the cell; they may also be attached to a chemical entity with affinity for the cell membrane or another cellular structure. Each fluorophore has a characteristic peak excitation and emission wavelength, and the emission spectra often overlap. Consequently, the combination of labels which can be used depends on the wavelength of the lamp(s) or laser(s) used to excite the fluorochromes and on the detectors available.

33
The most commonly used fluorophores are fluorescein (FITC), phycoerythrin (PE), Phycoerythrin-Cyanin-5 (PC5), Phycoerythrin-Cyanin-7 (PC7), energy coupled dye (ECD), propidium iodide (PI), ethidium bromide (EtBr), allophycocyanin (APC). Fluorescence measurements taken at different wavelengths can provide quantitative and qualitative data about fluorochrome-labeled cell surface receptors or intracellular molecules such as DNA and cytokines. Flow cytometers use separate fluorescence (FL-) channels to detect light emitted. The number of detectors will vary according to the machine and its manufacturer. Detectors are either silicon photodiodes or photomultiplier tubes (PMTs). Silicon photodiodes are usually used to measure forward scatter when the signal is strong. PMTs are more sensitive instruments and are ideal for scatter and fluorescence readings. The specificity of detection is controlled by optical filters, which block certain wavelengths while transmitting (passing) others. There are three major filter types. ‘Long pass’ filters allow through light above a cut-off wavelength, ‘short pass’ permit light below a cut-off wavelength and ‘band pass’ transmit light within a specified narrow range of wavelengths (termed a band width). All these filters block light by absorption. When a filter is placed at a 45
o angle to the oncoming light it becomes a dichroic
filter/mirror. As the name suggests, this type of filter performs two functions, first, to pass specified wavelengths in the forward direction and, second, to deflect blocked light at a 90
o angle. To detect multiple signals simultaneously, the precise choice
and order of optical filters will be an important consideration.
3.2. Cell sorting
Fluorescence-activated cell sorting (FACS) is a specialized type of flow cytometry. It provides a method for separating physically (sort) a heterogeneous mixture of biological cells into two or more containers, one cell at a time, based upon the specific light scattering and fluorescent characteristics of each cell. It provides fast, objective and quantitative recording of fluorescent signals from individual cells as well as physical separation of cells of particular interest. The cell suspension is entrained in the centre of a narrow, rapidly flowing stream of liquid. The flow is arranged so that there is a large separation between cells relative to their diameter. The majority of instruments use electrostatic deflection of droplets for the sorting of cells. A vibrating mechanism causes the stream of cells to break into individual droplets. The system is adjusted so that there is a low probability of more than one cell per droplet. Just before the stream breaks into droplets, the flow passes through a fluorescence measuring station where the fluorescent character of interest of each cell is measured. An electrical charging ring is placed just at the point where the stream breaks into droplets. A charge is placed on the ring based on the immediately prior fluorescence intensity measurement, and the opposite charge is trapped on the droplet as it breaks from the stream. The charged droplets then fall through an electrostatic deflection system that diverts droplets into containers based upon their charge. In some systems, the charge is applied directly to the stream, and the droplet breaking off retains charge of the same sign as the stream. The stream is then returned to neutral after the droplet breaks off.

34
3.3. Patients and controls
One-hundred-and-twelve elderly Italian individuals were enrolled in the study: 38 patients had a diagnosis of AD, 34 patients had a diagnosis of MCI, 40 individuals were healthy. The clinical diagnosis of AD was performed by the Neurology Department of Don Gnocchi Foundation in Milan, Italy, according to NINCDS-ADRDA work group criteria [251] and DMS IV-R [125]. The mean age of AD patients (17 males and 21 females) was 77.14 years (age range 59-81 years). All patients underwent complete medical and neurological evaluation, laboratory analysis, CT scan or MRI, and other investigations, when necessary (e.g. EEG, SPET scan, CSF examination, etc.), to exclude reversible causes of dementia. Neuropsychological evaluation and psychometric assessment was performed with a Neuropsychological Battery including Mini-Mental State Examination (MMSE) [252], Digit Span Forward and Backward, Logical Memory and Paired Associated Words Tests, Token Test, Supra Span Corsi Block Tapping Test, Verbal Fluency Tasks, Raven Colored Matrices, the Rey Complex Figure, Clinical Dementia Rating Scale (CDR) [253] and the Hachinski Ischemic Scale. Thirty-five patients were late and three early AD onsets; all cases were sporadic. MMSE and CDR scales were used to assess the severity of dementia. AD patients were divided into three subgroups:
Mild dementia (MMSE= 20-28; CDR= 0,5-1; N= 17; mean age: 74.22 + 1.8 years; mean MMSE values: 23.4 + 1.5);
Moderate dementia (MMSE= 15-19; CDR= 2; N= 13; mean age: 78.51 + 1.2 years; mean MMSE values: 17.7 + 1.3);
Severe dementia (MMSE= 0-14; CDR= 3; N= 8; mean age: 79.2 + 1.4 years; mean MMSE values: 7.4 + 1.3). Blood count, urine analysis, blood chemistry screen, serum folate, B12 levels, and thyroid functions tests were normal in all patients and none of them suffered from malnutrition or vitamin deficiency syndromes. MCI patients were selected among subjects who came to our Memory Disorders Outpatients Service for the diagnostic evaluation of memory complaints without difficulties in daily activities. The diagnosis of MCI was based on the unanimously adopted criteria proposed by Petersen [129] as follows:
Reported cognitive decline,
Impaired cognitive function,
Eessentially normal functional activities, and
Exclusion of dementia. The mean age of MCI patients (18 males and 16 females) was 75.86 years (age range 59-83). All subjects received a thorough clinical history, neurological examination, laboratory test, and brain MRI to exclude hydrocephalus, intracranial mass, infarcts, moderate to severe non-specific white matter disease and reversible causes of cognitive impairment. Patients with structural abnormalities that could impair cognitive function, other than cerebrovascular lesions, were excluded. No MCI patient received cholinesterase inhibitor or anticholinergic treatment. Every patient was followed up with annual brain MRI and routine laboratory tests, and re-evaluated approximately every 6 months with neurological examination and a battery of neuropsychological tests and scales.

35
Forty healthy elderly subjects, age- and sex-matched with the patient (healthy controls; HC), were enrolled as well. These individuals were selected according to the SENIEUR protocol for immuno-gerontological studies of European Community’s Control Action Programme on Aging [254,255] and were either unrelated healthy spouses of AD and MCI patients or healthy volunteers. The cognitive status of HC was assessed by administration of MMSE (score for inclusion as normal control subjects > 28). All individuals enrolled in the study, and their relatives when appropriate, provided written informed consent according to a protocol approved by a local ethics committee of the Don C. Gnocchi Foundation before admission to the study.
3.4. Blood sample collection and cell separation
Whole blood was collected by venopuncture in Vacutainer tubes containing ethylenediaminetetraacetic acid (EDTA) (Becton Dickinson & Co., Rutherford, NJ, USA). Peripheral blood mononuclear cells (PBMCs), consisting of T lymphocytes, B lymphocytes, monocytes and natural killer cells, were separated on lymphocyte separation medium (Fycoll-Hypaque, Organon Teknika Corp., Durham, NC, USA) and washed twice in PBS; viable leukocytes were determined using a Scepter
TM
Handheld Automated Cell Counter (Millipore, MA, USA).
3.5. CFDA-SE labeling
PBMC resuspended at 107 /ml in PBS were added to an equal volume of 5 M of
5-6 carboxyfluorescein diacetate succimidyl ester (CFSE) (Molecular Probe, Eugene, OR) in PBS and mixed for 10 minutes at room temperature. This procedure has a labeling efficiency exceeding 99%, and cells remain labeled for at least 10 days during tissue culture [256]. CFSE reacts with secondary amino of intracellular proteins providing a uniform fluorescent label. Upon cell division a CFSE
high cell (high fluorescence intensity) will lose half of its CFSE fluorescence
intensity (CFSElow
) resulting in populations of daughter cells (proliferating cells), which can be visualized by flow cytometry.
3.6. Stimulation of PBMC for FACS analysis
10 x 106
PBMC were cultured in 10ml of RPMI-1640 supplemented with 10% AB serum and stimulated with either non-immunogenic peptides [257] or with a pool of
three different A peptides: 1-40, 1-16, and 1-35 (10 g/ml)(Sigma, St.Louis, MO, USA) at 37° C in a humidified 5% CO2 atmosphere for 24 hours. These fragments
are largely present in cerebral deposits of A-protein in senile plaques, induce inflammatory mediators [251,258,170] and circulate in plasma and CSF [259,260].
For cytokine analyses, 10 g/ml Brefeldin A (Sigma-Aldrich) was added to the cell
cultures during the last 6 h of stimulation to block protein secretion.
3.7. Proliferation Assay
CFSE-labeled cells were washed twice and resuspended at 3x10⁶ cells/ml in
polystyrene tissue culture tubes containing 1 ml RPMI-1640 medium supplemented with 10% AB serum. Cells were then stimulated with either non-immunogenic
peptides [257] or with a pool of three different fragments of amyloid- (A)-protein:
36
fragment 1-40, fragment 1-16 and fragment 1-35 (10g/ml)(Sigma, St.Louis, MO, USA) at 37° C in a humidified 5% CO2 atmosphere for 5 days. Cells were subsequently harvested and washed twice in PBS. Surface staining for CD3, CD4 and CD8 was performed for 30 minutes at 4°C, finally cells were washed in PBS and fixed in 1% paraformaldehyde. Proliferation in non-immunogenic peptides- stimulated samples was considered to be the background value. The ∆ Proliferating Fraction (PF) was calculated by subtracting background proliferation from the antigen-specific proliferation. Stimulation indexes (SI) were calculated by dividing antigen-induced proliferation by background proliferation. Both a ∆ PF > 1% and an SI > 2.0 were required to classify a response as positive [261].
3.8. Cell purification
CD4+ T cells were isolated using a negative CD4
+ T cell isolation kit (EasySep,
StemCell Technologies, Grenoble, France). CD4+ CD25
high (Treg) and
CD4+CD25
neg (Tresp) cells were separated using the ALTRA EPICS cell sorter
(Beckman-Coulter). Freshly isolated CD4+ T cells were stained for 40 min at 4° C
with human CD25-specific PC-5 labeled antibodies. Sort gates were restricted to the CD4
+ CD25
high (CD4
+CD25
++) and CD4
+CD25
neg.
3.9. Suppression assays
CD4+ and CD4
+CD25
neg cells were labeled with 1 M of CFSE.
1x10⁵ autologous mytomicin-C treated (25g/ml) PBMC plus 2x10
4 CD4
+CD25
- in
absence/presence of 2x10⁴ CD4
+ CD25
high Treg were resuspended in 200 l RPMI
1640 medium and stimulated with coated anti-CD3 (10g/ml) or with the A
peptide pool (10g/ml). Cultures were set up as duplicates in U-bottom wells (COSTAR, Cambridge, MA, USA) and incubated at 37° C in a humidified atmosphere with 5% CO2. After 5 days cells were harvested and the CFSE signal of gated lymphocytes was analyzed by flow cytometry. The suppressive capacity of Treg towards responder cells in coculture (Tresp-Treg ratio 1:1) was expressed as the relative inhibition of the percentage of CFSE
low
cells (proliferating [100x (1- %CFSElow
CD4+CD25
- in coculture/ %CFSE
low
CD4+CD25
- T cells alone)] for CFSE based measurement of proliferation.
3.10. Immunofluorescent staining
PBMCs, previously stimulated with either non-immunogenic peptides or with a pool
of A peptides, were washed in PBS and stained with anti- CD3, -CD4, -CD8, -CD14, -CD19, -CD25, -PD-L1 (B7-H1), -PD-1, -CCR7, -CD45RA mAbs for 30
min
at 4°C in the dark. For the analysis of proliferation and of cytokine-secreting cells PBMCs were washed once again in PBS and treated with FIX and PERM (FIX & PERM Cell Permeabilization kits; eBioscience San Diego, CA, USA), fixed for 10
min in fixation medium (100l) then washed and resuspended in 100l of permeabilization medium with mAbs against the following antibodies: anti- Ki-67, -
FOXP3, -RORc/, -T-bet, - GATA-3, - NFkB, -NFATc1, or with anti-IFN-,-IL-4, -
IL-6, -IL-9, -IL-10, -IL-12, -IL-17, -IL-21, -IL-22, -IL-23, and anti-TGF- mAbs.

37
3.11. Apoptosis
After being stained with CD4-, CD8- and PD-1-specific mAbs for 30 minutes at 4°C in the dark, PBMC were resuspend in ice-cold 1X Binding Buffer (Beckman-
Coulter, Fullerton, CA, USA) plus 10 l of Annexin V and 20 l of 7-AAD viability
Dye for 15 minutes on ice in the dark. Cells were then resuspended in 400l of 1X Binding Buffer and analyzed by flow-cytometry. Using a DNA specific viability dye, like the 7-AAD makes possible the distinction between early apoptotic and the late apoptotic or necrotic cells.
3.12. Blocking assay
Anti-PD-1 or anti-PD-L1 (10g/ml) mAbs were added to cell cultures together with
the A fragments and left throughout the stimulation period; Annexin V expression was evaluated at the end of such period. Mouse IgG1 isotype control antibodies
were used in A -stimulated cell cultures.
3.13. Flow staining for PD-1 and FOXP3 of CD4+ CD25high T reg
Freshly isolated, PBMC were washed and incubated with CD4-, CD25-, and PD-1-specific monoclonal antibodies for 30 min at 4°C. PBMC were then washed and the intracellular costaining of PD-1 and FOXP3 was conducted using the FOXP3 staining protocol (eBioscience). Intracellular or surface costaining of PD-1 and intracellular FOXP3 was performed on CD4
+CD25
high
(CD4+CD25
++) gated T cell by flow cytometry.
3.14. Monoclonal Abs
The monoclonal antibodies used in this study for PBMC stimulation or labelling are shown in Table 1.
3.15. Cytometric analysis
Analyses were performed using a Beckman-Coulter Cytomics FC-500 flow cytometer equipped with a single 15 mW argon ion laser
operating at 488 nm and
interfaced with CXP Software 2.1. Two hundred thousand lymphocyte-monocytes were acquired and gated on CD3, CD4, CD8, CD14, CD19 or CD25 expression and side scatter properties. Green
florescence from FITC (FL1) was collected through a 525-nm bandpass filter,
orange-red fluorescence from PE (FL2) was collected through a 575-nm bandpass
filter, deep-red fluorescence from PC5 (FL4) was collected through a 670-nm
bandpass filter, and blue fluorescence from PC7 (FL5) was collected through a
770-nm bandpass filters. Data were collected using linear amplifiers for forward
and side scatter and logarithmic amplifiers for FL1, FL2, FL4 and FL5.
Samples
were first run using isotype control or single fluorochrome-stained preparations for
color compensation. Rainbow Calibration Particles (Spherotec, Inc. Lake Forest, IL) were used to standardize flow-cytometry results in samples obtained over time.

38
3.16. Statistical analysis
Quantitative data were not normally distributed (Shapiro-Wilk test) and are thus summarized as median and Interquartile Range (IQR; 25° and 75° percentile). Comparisons between groups were analyzed to evaluate immunological differences. Kruskal-Wallis analysis of variance was performed for each variable; Comparisons among the different groups were made using a two-tailed Mann-Whitney test performed for independent samples. Data analysis was performed using the SPSS statistical package (SPSS Inc. Chicago, Illinois, USA).

39
4. RESULTS
4.1. Treg cells in peripheral blood of AD or MCI patients and HC
Treg cells (CD4+/CD25
high/FOXP3
+) can be classified into two different
subpopulations, naïve and activated, on the basis of the cytoplasmic or expression of the PD-1 protein, respectively. We examined these three populations, CD4
+/CD25
high/FOXP3
+ (Treg), CD4
+/CD25
high/FOXP3
+/PD-1
+
(activated Treg), and CD4+/CD25
high/FOXP3
+/PD-1
neg (naïve Treg) in the
blood of all MCI and AD patients, comparing the results with those of 30 age-matched healthy controls (HC). Representative results are presented in
Figure 1. Results showed that CD4
+/CD25
high/FOXP3
+ were significantly increased in
patients with a diagnosis of either MCI (median percentage= 1.5%) or AD (median percentage= 1%) compared to HC (median percentage= 0.01%; p< 0.001 in both cases), but no differences were observed between the two groups of patients. Activated CD4
+/CD25
high/FOXP3
+/PD-1
+ Treg lymphocytes were increased in both
MCI (median percentage= 0.05%) and AD patients (median percentage= 0.2%) compared to HC (median percentage= 0.01%; p= 0.01 and p< 0.001 respectively), a significant higher percentage was observed in AD compared to MCI (p= 0.02). In contrast with these results, CD4
+/CD25
high/FOXP3
+/PD-1
neg (naïve) Treg cells
were significantly augmented in MCI patients alone (median percentage= 1.9 %). This increase was highly significant compared to both HC individuals (median percentages= 0.01%; p<0.001) and patients with a diagnosis of full-blown AD (median percentage= 0.03%; p=0.006) (Figure 2). These results suggest that the increase of naïve Treg cells, the regulatory T lymphocytes endowed with the strongest suppressive abilities, is an immunological feature that characterizes MCI individuals, distinguishing them from patients with full-blown AD.
4.2. A pool-stimulated proliferation in AD, MCI and HC
A accumulation is strongly suspected to activate microglia and astrocytes mediating inflammation, a process suggested to be at the basis of neuronal
damage in AD. A-stimulated proliferation was measured in all the subjects enrolled in the study. To this end, peripheral blood cells of AD, MCI, and HC individuals were stimulated
with either a pool of A immunogenic peptides or with a pool of non-immunogenic (control) peptides. Cell division was subsequently evaluated using CFSE staining.
Results indicated that the Apool-stimulated proliferation of CD4+ T lymphocytes,
expressed as a stimulation index (S.I.), was significantly augmented in AD (S.I. median value= 2.5) compared to MCI patients (S.I.=0.02; p=0.007), with the lowest values being observed in HC (S.I.=0.01; p<0.001 vs. AD).

40
A pool-stimulated S.I. of CD8+ T lymphocytes were similarly greatly increased in
AD compared to MCI patients and HC (S.I.: AD=2.0; MCI= 0.01; HC=0.01). This difference was statistically significant when AD patients were compared to HC (p<0.001)(Figure 3). No proliferation was observed by cells of any of the groups enrolled in the study upon stimulation with the pool of non-immunogenic control peptides.
4.3. Suppression of A pool and anti-CD3-stimulated proliferation by Treg
The ability of Treg to suppress the proliferation of antigen- and anti-CD3-stimulated proliferation was analyzed in both groups of patients enrolled in the study compared to those obtained in HC. CD4
+CD25
high Treg cells were isolated from
freshly drawn peripheral blood, (PD-1-based sorting is not technically possible) and Treg-depleted cells were stimulated with either the pool of immunogenic
Apeptides or with anti-CD3. Treg were then added back in a 1:1 ratio of Tresp/Treg lymphocytes.
Results obtained upon stimulating cells with the pool of immunogenic Apeptides indicated that the suppressive ability of CD4
+CD25
high Treg cells on activated cells
was significantly higher in MCI (median percentage = 40%) compared to AD (21%; p= 0.04). These values were significantly higher also compared to those observed
in HC, in whom the stimulation of peripheral blood with the pool of immunogenic A
peptides did not elicit the generation of A-specific Teffector cells (p< 0.001 in both cases). Finally, results obtained in anti-CD3-stimulated cell cultures showed an augmented suppression activity of CD4
+CD25
high Treg on activated cells in AD (median
percentage = 50%) compared to MCI (19%) patients and HC (25%); these differences did not reach statistical significance. These results are presented in Figure 4.
4.4. PD-1-expressing CD4+ and CD8+ T cells in A-stimulated PBMC
A-stimulated lymphocytes were analyzed in PBMC isolated from the peripheral
blood of all patients and controls. Results showed that A-stimulated and PD-1-expressing CD4
+ T lymphocytes were significantly decreased in AD and MCI
patients compared to controls (p= 0.01 and p=0.009, respectively); an analogous trend, that nevertheless did not reach statistical significance, was observed for PD-1-expressing CD8
+ T lymphocytes (Figure 5).
In contrast with these results, PD-1 mean fluorescence intensity (MFI) was similar on CD4
+ and CD8
+ T lymphocytes of AD, MCI, and HC individuals (Table 2).
4.5. PD-L1-expressing CD14+ and CD19+ cells
PD-1 on T lymphocytes binds PD-L1 on the surface of APC. Since we detected a decreased expression of PD-1 on T cells of AD and MCI patients we next analyzed
PD-L1 expression on APC (CD19+ and CD14
+) in A-stimulated-PBMC of all the
patients enrolled in the study. Results showed that, whereas the percentage of PD-
41
L1-expressing CD14+ and CD19
+ cells was similar in patients and controls, PD-L1
MFI was significantly decreased in CD14+ APC of AD and MCI individuals
compared to controls (p=0.008 and p=0.005 respectively)(Figure 6)(Table 2).
4.6. IL-10-secreting and PD-L1-expressing CD14+ and CD19+ cells
The interaction between PD-1 and PD-L1 results in IL-10 production. Since previous results had indicated that fewer PD-1-expressing CD4
+ T lymphocytes
can engage reduced amounts of PD-L1 on CD14+ APC in AD and MCI, we
expected to observe a reduced production of IL-10 by the interaction of the cells of
these patients. Actually, data showed that A-stimulated and IL-10-secreting CD14
+ cells were significantly decreased in AD and MCI compared to HC (p=0.03
and p=0.01 respectively), as we expected (Figure 7). We next analyzed IL-10 production in CD14
+/PD-L1
+ and in CD19
+/PD-L1
+ gated
populations, i.e. we quantified IL-10 producing cells in response to A within the pool of PD-L1-expressing CD14
+ and CD19
+ APC. Results showed that IL-10
producing CD14+PD-L1
+ cells were significantly decreased as well in AD and MCI
patients compared to controls (p=0.02 and p=0.03 respectively)(Figure 8).
4.7. A-stimulated apoptosis and proliferation
The interaction between PD-1 and PD-L1 results in the apoptosis of antigen-
specific cells. We analyzed this parameter by evaluating A-stimulated and Annexin V-expressing, as well as PD-1- and Annexin V-co-expressing T lymphocytes in all the individuals enrolled in the study.
Results indicated that Annexin V-positive CD4+ A-specific T lymphocytes were
reduced in AD and MCI compared to HC (p= 0.03 in both cases). A-specific- Annexin V- and PD-1-co-expressing CD4
+ T lymphocytes were significantly
reduced as well in AD and MCI patients compared to controls (p= 0.04 in both cases), indicating that these pathologies are associated with diminished amounts
of A-specific CD4+ T cells that undergo apoptosis (Figure 9).
As A-specific CD4+ T lymphocytes of AD and MCI patients are less susceptible to
apoptosis it is reasonable to expect that these cells would proliferate more upon in
vitro stimulation with A- peptides. This was indeed the case as the fraction of A- specific Ki67
+ CD4
+ T lymphocytes was significantly higher in AD and MCI patients
compared to controls (p=0.02 and p=0.006 respectively)(Figure 10).
Finally, to confirm that the apoptosis of A-specific T cells is mediated by the PD-1/PD-L1 interaction, we performed a blocking assay pre-incubating lymphocytes with a PD-L1-specific blocking antibody. Results showed that impeding the PD-1/PD-L1 interaction results in a significant reduction of Annexin V-expressing lymphocytes, thus supporting the pivotal role played by the PD-1/PD-L1 loop in
inducing the apoptosis of A-specific T cells (p= 0.04 in both cases). These results are presented in Figure 11.

42
4.8. CD4+ T helper subsets in A peptides-stimulated cell cultures
PBMC obtained from 38 AD and 34 MCI patients as well as from 40 age-and-sex-
matched HC were stimulated in vitro with A-peptides. Cytofluorimetric analyses
were used to detect the percentage of CD4+T lymphocytes producing IFN, IL-4,
IL-9, IL-17, IL-21 and IL-22 at the end of the culture period. Results showed that, whereas most cytokine-producing CD4
+ T helper subsets
were similar in MCI and HC, A-stimulated IL-9-, IL-21- and IL-22- producing CD4+
lymphocytes were significantly augmented in AD patients (vs HC p<0.001 p=0.007,
and p=0.009 respectively)(Figure 12). Notably, the MFI of A-stimulated CD4+ T
cells producing IL-21, IL-22, and IL-9 was significantly increased as well in AD patients (Table 4). Thus, IL-21 and IL-22- cytokines produced by Th-17 cells- as well as IL-9, a cytokine generated by Th-9 lymphocytes, were significantly released in AD patients
upon in vitro stimulation of cells with A-peptides.
These results suggest that in this disease the A-specific immune response is skewed favoring the differentiation of the inflammation-associated Th-17 and Th-9 subsets of T cells.
4.9. Cytokine-production in CD14+ cells in A-stimulated cell cultures
Multiple cell types mediate the immune response. To approach the in vivo situation
we examined cytokine-expressing CD14+ monocyte/macrophages in A-peptide-
stimulated cell cultures. Results indicated that IL-6- and IL-23-producing CD14+
cells were significantly augmented in AD patients compared to HC (p=0.01 and p=0.004 respectively); IL-23-producing cells were augmented in MCI individuals as well even if this difference did not reach statistical significance. Notably, IL-10 producing CD14
+ cells as well as the MFI of these cells were significantly reduced
both in AD and MCI patients compared to HC (Figure 13) (Table 4). Finally, IL-12-
producing cells (IL-12 drives differentiation toward the Th-1 lineage) and TGF- producing monocytes were comparable in all individuals. Monocyte/macrophages-produced IL-6 and IL-23 stimulate the differentiation and stabilization of naïve CD4
+ T cells toward the Th-17 pathway. Thus, both cytokines
eliciting the generation of Th-17 lymphocytes and those produced by such lymphocytes were increased in AD patients. Importantly, the Th-17-supported inflammatory milieu detected in AD was not counterbalanced by IL-10, a cytokine endowed with potent anti-inflammatory properties, whose production is reduced in cells of AD patients. The observation that IL-10 generation was decreased in MCI as well, in the absence of an increased activity of Th-17 and Th-9 cells, suggests that increased production of pro-inflammatory cytokines, rather that reduced
generation of anti-inflammatory cytokines characterizes A- specific immune response in AD.

43
4.10. Transcription factor-expressing CD4+ T cells in A peptide- stimulated cell cultures
Distinct transcription factors (TF) are activated during the differentiation of Th cells into different functional subsets. We analyzed the know TF in all the individuals
enrolled in the study. Results showed that both RORc/ and NFATc1, TF involved in the differentiation of naïve cells toward the Th-17 lineage and preferentially expressed by memory T lymphocytes, respectively, were significantly increased in AD patients compared to HC (p=0.01 for both); the MFI for these two TF was significantly augmented as well in AD individuals (Table 4). These results confirm that the Th-17 differentiation machinery (differentiating cytokines, Th-17-produced cytokines, TF) is up- regulated in AD.
RORc/, but not NFATc1, was increased in A-stimulated CD4+ T cells of MCI as
well compared to HC (p=0.03). Notably GATA-3, a TF involved in the differentiation of Th-2 cells, was also significantly augmented in MCI individuals alone compared to AD (p=0.01 vs. AD; p= 0.004 vs. HC). Th-2 cells play an anti-inflammatory role, these results therefore seem to indicate that in MCI an immune mechanism that obstacles Th-17-mediated inflammation is present; this mechanism is lost in AD. Finally, T-bet-expressing cells (T-bet is the Th-1-associated TF) were comparable in all individuals tested. These results are presented in Figure 14.
4.11. Naïve and memory T cell subsets
Antigen-stimulated T lymphocytes mature into distinct memory phenotypes. To investigate such phenotypes we measured naïve, central memory (CM), effector memory (EM), and terminally differentiated (TD) CD4
+ T lymphocytes in the
peripheral blood of all the individuals enrolled in the study. The percentage of all cells was similar in unstimulated cultures; a much more interesting pattern was
observed when PBMC were stimulated in vitro with A-peptides. To summarize: naïve (CCR7
+/CD45RA
+) and CM (CCR7
+/CD45RA
neg) CD4
+ T
lymphocytes were decreased whereas EM (CCR7neg
/CD45RAneg
) and TD (CCR7
neg/CD45RA
+) CD4
+ T lymphocytes were augmented in AD and MCI
compared to HC. Results are presented in Table 3.

44
5. DISCUSSION
The etiology of Alzheimer’s disease (AD), a condition characterized by progressive dementia with gradual loss of cognitive function, is still unresolved but increasingly evidence indicate an involvement of the immune system and neuroinflammatory processes such as an increase of proinflammatory cytokines, activation of microglia and changes or defects in immune responses in the pathology. A multitude of factors are implicated in immune response such as cytokines, the complement system, acute phase reactants and cellular elements. While this system is an effective and potent response to acute challenges, it is imperative that it be tightly regulated over the longer term. Dysregulation and chronic activation can have detrimental effects on the host. T cells are activated and display memory phenotype in AD patients; these cells can be detected both in the periphery and as infiltrates in the brain [96], suggesting that an activation of the immune response is present in AD. It is still ill-understood if these cells play a beneficial or a detrimental role in the disease. Nevertheless the observations that: 1) therapeutic approaches based on the use of anti-inflammatory drug are mildly effective in this disease, and 2) amyloid-beta immunization could result in meningoencephalitis in humans favour the interpretation that neuroinflammation plays a pathogenic role in the disease. Specifically, a breakdown of peripheral tolerance could lead to an activation of autoreactive lymphocytes like CD4
+ Th-1, Th-17 and Th-9 cells which may
contribute to neuroinflammation progression [24]. In this context, suppressive mechanisms mediated by Treg cells [262] and inhibitory mechanisms mediated by PD-1/PD-L1 pathways [70] play a remarkable role in immunological tolerance maintaining. Recent data has led to a ready distinction of two populations of Treg cells: naïve Treg cells, which retain PD-1 in intracellular compartments, and activated Treg cells, which coexpress surface CD25 and PD-1 (activated Treg). Moreover, Treg translocate PD-1 to the cell surface when stimulated via the TCR [27]. This allows ready distinction of two populations endowed with different suppressive capacities: CD4
+/CD25
high/FOXP3
+/PD-1
neg naïve Treg cells, provided with stronger
suppressed properties, and CD4+/CD25
high/FOXP3
+/PD-1
+ activated Treg cells [27].
Thus we examined these Treg cells subsets in patients with a diagnosis of either MCI or AD; results herein indicate that development of AD is associated with lower quantities of circulating Treg cells, and, in particular with reduced percentages of naïve Treg. These quantitative alterations are associated with qualitative changes,
summarized as an increased amyloid- specific proliferation and a reduced ability of Treg to suppress such proliferation. These results, together with the preliminary observation that the lowest percentages of all subpopulations of Treg cells are seen in patients with severe AD, lend support to the inflammatory origin of AD and suggest that alterations in Treg lymphocytes play a pivotal role in the inflammation associated with AD. The brain is an immunologically privileged site (a “sanctuary”) protected and isolated from organism’s immune reaction by the BBB (blood-brain barrier). BBB is a complex cellular gate, which regulates tightly the transport of ions, solutes and cells into and from the central nervous system.

45
The term “reactive gliosis” has been used to describe immune activation of glial cells, including microglia and astrocytes, which exist in a quiescent (resting) state in the healthy CNS. Following neural insult, these cells become activated and undergo hypertrophy accompanied by increased expression of cell surface immune antigens. Concomitantly, both activated microglia and astrocytes synthesize and release a myriad of pro-inflammatory cytokines, chemokines, complement proteins, proteinases, and reactive oxygen species. While this neuroinflammatory response may be beneficial for clearing infection and initiating tissue repair mechanisms, if left unresolved, it exposes sensitive neurons to elevated levels of potentially toxic molecules, leading to bystander injury. In fact, there is mounting evidence that chronic neuroinflammation plays a critical role in the pathoetiology of various neurodegenerative diseases including AD, MS, and PD [105,115,120,170,263,264]. In addition to CNS endogenous immunity, discrete populations of exogenous, peripherally derived immune cells can traffic to the CNS, particularly during disease states. Normally lymphocytes are able to pass BBB, but physiologically they are not numerous in normal brain. Lymphocyte migration into and within the CNS is regulated by chemokines and their receptors. Disruption of the integrity of BBB, as result of multiple microtrauma, microvascular pathology (as cerebrovascular pathology is often associated to AD) and inflammation, can increase permeability of BBB, leading to the abolition of the immunological privilege of the CNS. To date, such evidence points mainly at an association between various dementia forms and disruption of the BBB. During chronic neuroinflammation the release of inflammatory mediators from activated microglia increases BBB permeability [88]. The observations that: 1) immune cells continuously re-circulate throughout the body; and 2) immune cells migrate across the blood-brain barrier (BBB), and the BBB is permeable to cytokines, seem to support to our results, conducted in peripheral blood. So we can hypothesize that the link between T-cells and AD “passes” through BBB, meaning that their migration is a result of BBB dysregulation and impairment [265,266].
Ahas been shown to activate microglia and astrocytes and stimulate them to act as immunological mediators [267,268]. A variety of other cell surface proteins are
upregulated on activated microglia neighboring A plaques. Microglia surrounding plaques release cytotoxic molecules such as NO, oxygen radicals, proteases,
proinflammatory cytokines, including IL-1, TNF and IL6, and expresses MHCI, MHCII, CD40 and adhesion molecules [170]. In this context, the up-regulation of IL-
1 enhances blood brain barrier (BBB) permeability facilitating leukocytes infiltration [269]. Immune responses thus do occur in CNS and can be driven by endogenous (microglia and astrocytes) and/or exogenous (peripheral leukocytes) sources and can serve either productive or pathological roles [249]. Peripheral
monocyte/macrophage recruitment in CNS could limit -amyloid plaques [249,250,
263]; in addiction activated endothelium or microglia can present A peptides to T cells inducing adaptive immune response [105,270]. Whether the arrival of T-cells is beneficial or detrimental is ill understood. However
in the case of massive T-cell response (for instance in A vaccine-related meningoencephalitis), the effects seem to overwhelmingly negative.

46
Treg cells have convincingly been shown to modulate immune reactivity and inflammation, and quantitative/ qualitative alterations of such cells result in the honing of inflammation, favoring autoimmune processes. Treg are still relatively unexplored in AD. A recent paper showed an increase of such cells (identified as FOXP3 expressing lymphocytes) in AD and in older healthy controls; the authors also reported an increased ability of Treg cells of AD patients to suppress mitogen-stimulated proliferation in vitro [271]. These data, thus, suggest that the frequency of Treg increases with age and is accompanied by a stronger suppressive activity. Our data confirm an increase of Treg cells (identified as CD4
+CD25
++FOXP3
+) in AD but are in partial disagreement with
those of Rosenkranz et al., since this increase does not involve PD-1neg
Treg lymphocyte (naïve Treg), the cells with the highest functional activity, that are diminished in AD. Moreover, our results do not confirm that Treg cells are increased in older healthy individuals, as we detected a decrease of such cells in such individuals. Notably, other authors [272] reported a decreased percentage of CD4
+CD25
high cells in AD compared to older controls and an increase of these cells
was observed in healthy elderly groups [273]. The apparent discrepancy between these data and the ones herein is explained by the fact that we identified Treg cells by different and more specific markers. Additionally, the age range of our healthy control was higher than that of the individuals studied in Larbi A et al., 2009. Suppression assay provided data of Treg cells functional activity. We observed a
significant increase of Treg mediated-suppression of A specific proliferation in MCI and AD compared to HC. This result could be seen either as protective or as a harmful response, contributing to disease progression. The latter hypothesis is less credible because Treg mediated suppression is decreased in AD compared to MCI, suggesting an association between disease worsening and decrease of Treg
suppressive capacity. The previous observation that CD8+CD28
neg lymphocytes,
cells known to have a suppressor/regulatory function resulting in T helper unresponsiveness [274], are also significantly reduced in AD patients, further supports the concept that a generalized impairment of the suppressor/ regulatory ability of T lymphocytes is present in AD.
Results from the analysis of amyloid--specific proliferation in all the groups of
individuals enrolled in the study indicate that amyloid--specific proliferation is
significantly higher in AD compared to MCI patients; the in vitro amyloid- peptides stimulated- generation of effector T cells was also greatly increased in AD
individuals. Interestingly, the observation that no amyloid--specific effector cells were elicited in healthy controls suggests that normal aging is clearly distinct from MCI, underlining the hypothesis that individuals with MCI are much more similar to AD patients than they are to age-matched healthy controls.
The suppressive ability of Treg on amyloid-peptides-stimulated proliferation was also significantly reduced in AD compared to MCI individuals. Notably, as sorting of PD-1
neg cells is not technically
possible, suppression was measured using
CD4+CD25
high cells isolated from
freshly drawn blood; as a consequence we did not
formally measure the suppressive capacity of PD-1
neg Treg cells. Nevertheless,
the
observation that the percentages of PD-1neg
Treg cells are significantly different in
MCI, AD, and HC individuals allows the speculation that the different suppressive
abilities we observed are secondary to the diverse percentages of PD-1
neg Treg
cells detected in each one of these subpopulations.

47
The data herein indicate that Treg cells, and in particular, PD-1neg
Treg cells might play an important role in the pathogenesis of AD: loss of such cells and of their functional ability is associated with development of AD. Treg cells mediate their effect via two complementary mechanisms: IL-10-mediated functional impairment of immune cells and induction of apoptosis of such cells. In
this light it is interesting to notice that: 1) amyloid--stimulated IL-10 production has been shown to be reduced in AD compared to healthy individuals [255] and 2) particular SNP of the IL-10 gene associated with low IL-10 production are significantly over expressed in AD [275]. In this context it has become interesting to evaluate PD-1-mediated apoptosis of
amyloid--specific cells in patients with a diagnosis of either MCI or AD. The interaction between PD-1 and PD-L1 dampens immune responses, limiting
inflammation. Data herein indicate that, upon A-stimulation, PD-1 expression is significantly reduced in CD4
+ T cells of AD and MCI patients compared to HC. Low
levels of PD-1 can bind low quantities of PD-L1 molecules on the surface of CD14+
APC. This leads to a reduced production of -stimulated IL-10, an increased
proliferation of A-stimulated T lymphocytes, and a reduced susceptibility of such T lymphocytes to apoptosis. To summarize, data herein demonstrate that an inflammatory milieu is present in MCI and AD and provide a molecular explanation for the generation of such milieu. Since the interaction between PD-1 with PD-L1 can negatively regulate autoreactive T- and B-cells and plays a pivotal role in the maintenance of tolerance, it is conceivable that an imbalance between positive and negative signals may contribute to the onset of a variety of autoimmune diseases [276]. Recent data show that the ligation of PD-L1 by naïve T lymphocytes limits effector cells responses and prevents the triggering of immune-mediated tissue damage [70,277,278,]. This is achieved through two complementary mechanisms: the generation of IL-10, a powerful anti-inflammatory cytokine, and the limitation of the proliferation of antigen-specific cells, possibly via the triggering of apoptosis of such cells. In fact, PD-1 is abundantly expressed in diseases associated with increased IL-10 generation such as lung, ovary, and colon carcinoma [279] and HIV infection [280]. In this context it is important to underline that decreases in IL-10 production have been described in AD patients, in whom the IL-10 gene SNPs associated with higher production of this cytokine are also less frequently detected [281]. Notably, increases in IL-10 have been described in non-demented healthy elderly individuals [282], and a particular genotype resulting in higher levels of IL-10 was found to be associated with longevity [283]. IL-10 dampens immune responses and suppresses antigen-stimulated proliferation; together with the induction of apoptosis of antigen-specific cells these PD-1/PD-L1-mediated mechanisms play essential roles in modulating positive and negative selection in the thymus [284] and in the protection of immune privileged sites, such as the placenta [285] and the eye, from immune responses [286]. The down-regulation of these mechanisms seen in MCI and AD result in an
increased proliferation of A-stimulated T lymphocytes, as these cells are neither induced to undergo apoptosis, nor anergized by IL-10. The pivotal role played by the PD-1/PD-L1 interaction in inducing the apoptosis of
A-specific CD4+ T lymphocytes is confirmed by the observation that apoptosis is
blocked by pre-incubation of these cells with an anti-PD-L1 antibody. The net result

48
of the down-regulation of the PD-1/PD-L1 pathway seen in AD and MCI is an
increased percentage of A-specific CD4+ T cells that proliferate vigorously; in vivo
this is associated with neuroinflammation, and is likely to be a negative factor in the pathogenesis of MCI and AD. Notably, no differences were seen when MCI and AD patients were compared, suggesting that similar immunologic abnormalities are present in both conditions, and that both conditions are different from the situation present in healthy aging individuals. Because some, but not all MCI will progress to AD, these data suggest that inflammation is a necessary first step associated with the appearance of cognitive impairment, but inflammation alone is not sufficient to cause AD. In particular, the systemic inflammation observed in this pathology seems to play an important role in recruiting monocyte derived blood cells in the CNS in attempt to dampen neuroinflammation; treatment with anti-inflammatory drugs could lead to a down-modulation of such recruitment [287]. The mechanism used by monocytes to suppress local inflammation could rely on the activation of inhibitory pathways, including the one described herein that rotates around the PD-1/PD-L1 axis and is at least partially mediated by IL-10 production. The fact that data herein stem from analyses performed in peripheral blood lymphocytes and not in cells circulating in the cerebro-spinal fluid (CSF) could apparently weaken our results. CSF examination in our patients was performed only when necessary to exclude reversible causes of dementia. Nevertheless, the observations that: 1) immune cells continuously re-circulate throughout the body, 2) immune cells migrate across the blood-brain barrier (BBB), and 3) the BBB is permeable to cytokines, seem to by-pass such criticism, lending support to our results. Recent studies have observed that myelin basic protein-specific and PD-1-expressing
T lymphocytes, as well as PD-L1-expressing CD19
+ cells are
significantly reduced during the acute phase of relapsing-remitting multiple sclerosis (MS) patients, another neurological disease characterized by extensive inflammation [288]. It was shown that, beside PD-L1, PD-1 could bind a second protein, PD-L2, on the surface on non-T cells [289], but, whereas PD-L1 is constitutively expressed on a wide range of hematopoietic and non-hematopoietic cells, PD-L2 is exclusively expressed in DC, macrophages and mast cells [71]; thus did not analyze the expression of PD-L2 in our patients. Both CD14
+ monocyte/macrophages and CD19
+ B cells are professional APC; both
cells can optimally stimulate T lymphocytes-mediated immune responses. Whereas the impairment in PD-L1 expression mostly involves CD19
+ cells in MS, the CD14
+
population plays the leading role in AD and MCI. This observation is interesting given the significant role played by these cells in AD and MCI. Thus, the recruitment of peripheral CD14
+ cells in the CNS was suggested to be an attempt
to hamper the generation of amyloid- plaques [263] and, together with endothelial
and microglia cells, CD14+ cells were shown to present A peptides to T cells
inducing adaptive immune response within the CNS [105,269,290]. Within this
milieu, the activation of A- specific inhibitory mechanism by monocytes expressing PD-L1 and producing IL-10 would result in the dampening of neuroinflammation. This pathway seems to be defective in AD and MCI patients. Evidence for the presence of immune activation in the peripheral blood and in the CNS of AD patients are accumulating [96,291]. Infiltration of peripheral blood cells into the normal brain is usually very low. A number of CNS disorders, brain injury, or systemic infections [292] is accompanied

49
by infiltration of the brain by peripheral monocytes, macrophages, or T lymphocytes. To better define the functional and phenotypic profiles of T lymphocytes in AD we analyzed cytokines, transcription factors, and post-thymic differentiation pathways comparing results obtained in AD to those of MCI and HC. To measure antigen-
specific responses we stimulated cells with A peptides, the protein whose deposition triggers neuroinflammation and initiates the pathogenesis of AD. Results herein show that, whereas neither Th-1-associated TF nor cytokines are up regulated in AD, the activity of the molecular and protein machinery associated with the differentiation of Th-17 lymphocytes, as well as cytokines produced by these cells, is increased in AD but not in MCI. Thus, monocyte/macrophages (MM)-
producing IL-6 and IL-23, the number of RORc/-expressing cells, and the production of IL-21 and IL-22, were all augmented in AD compared to MCI and HC. Notably, IL-9, the effector cytokine produced by Th-9 lymphocytes, was significantly increased as well in AD patients alone, indicating that, beside Th-17,
A-specific Th-9 lymphocytes are upregulated in AD. Finally, A-specific, late stage differentiated, effector CD4
+ T lymphocytes were significantly increased in AD
patients. AD-associated neuroinflammation can be therefore summarized as being characterized by a complex impairment of the immune response, with a profound skewing favoring inflammatory and effector responses. Compared to the massive alterations seen in AD, the situation observed in MCI
individuals is only marginally altered. Thus, in MCI, A-specific late stage effector CD4
+ T lymphocytes accumulate and the only cytokine alteration seen is a
decrease in IL-10 production, also present in AD, that is nevertheless not accompanied by an increased generation of pro-inflammatory cytokines. Whereas
the activity of both RORc/ and NFATc1 was augmented in AD, that of RORc/ alone was increased in MCI individuals. In these subjects an increased activity of GATA-3, the TF associated with Th-2 differentiation, was also observed. In MCI, thus: 1) Th-17 cells are not activated (the production of IL-6, IL-23, and IL-21 is not
increased) even in the presence of an accumulation of RORc/; and 2) IL-10 production by MM is reduced even if GATA-3 is increased. These puzzling results
suggest alternate hypothesis. Thus: 1) RORc/ activation could result in the production of Th-17-associated cytokines and neuroinflammation only if GATA-3 is not activated as well, or, alternatively, 2) neuroinflammation could only develop in the presence of an upregulation of both Th-17 and Th-9. These data also suggest that the late stage differentiated effector lymphocytes that accumulate in MCI and in AD could be qualitatively different in these two conditions because the cytokine milieu in MCI is characterized by low amounts of IL-21 and IL-9 and/or alternatively, because NFATc1 is not increased in these patients. Recent studies have demonstrated that naive CD4
+ T cells contain minimal levels
of NFATc1 whereas accumulation of this NFATc1 in CD4+ memory T cells was
demonstrated to optimize cytokine gene expression, the situation observed in a
memory immune response [293]. The higher percentage of A-stimulated and NFATc1-expressing CD4
+ observed in AD patients, together with the increase of
IL-21, IL-22, and IL-9, and the skewing toward more differentiated (EM and TD)
subpopulations of CD4+ T lymphocytes, thus supports the idea that a chronic A-
mediated stimulation of immune responses is present in AD.

50
Taken together these results indicate that MCI individuals are much more similar to HC that to AD patients; these data also suggest that the immunological difference between MCI and AD resides in the lack of activation of Th-17 and Th-9 T cells subsets seen in MCI individuals. Thus increased inflammation together with a decreased production of the anti-inflammatory cytokine IL-10 is associated with AD. IL-10 is an anti-inflammatory cytokine that inhibits the production of pro-
inflammatory cytokines such as IL-6 and TNF-. In IL-10 gene-deficient mice, an overproduction of inflammatory cytokines and the development of chronic inflammatory diseases have been noted [294]. The anti-inflammatory cytokine IL-10 may reduce inflammation in brain [295] by suppressing the expression and production of inflammatory cytokines and their receptors. An imbalance of pro-inflammatory cytokines and anti-inflammatory cytokines may therefore be an important phenomenon in AD. In this context it is important to underline that decreases in IL-10 production have been described in AD patients, in whom the IL-10 gene SNPs associated with higher production of this cytokine are also less frequently detected [281]. Higher levels of IL-10 have also been observed to have a protective effect in animal models of AD [296] and attenuation of Alzheimer’s disease-like pathology following immunotherapy in murine models is associated with increased levels of IL-10 [297]. Data herein nevertheless indicate that decreased production of IL-10 by itself does not associate with AD: an inflammatory milieu is necessary. The presence of an inflammatory milieu in AD patients was confirmed by the observation that IL-6- and IL-23- producing MM were significantly increased in AD patients. These cytokines are involved in the differentiation, maintenance and stabilization of Th-17 cells, respectively. IL-6 is increased in plasma of patients with AD [298] and is expressed in brain cortical plaques [299,300]. Interleukin-23 was shown to enhance the pathogenic potential of myelin-specific T cells in the induction of autoimmune encephalomyelitis [301]. IL-23 is a potent inflammatory cytokine also known to enhance the generation of IL-17 by Th-17 cells and to maintain the expression of IL-17 in activated Th-17 cells [302]. IL-17 production was not augmented in our patients in the face of an increased generation of IL-23; this confusing result could be explained by the observation that, whether the expression of the lineage-specific transcription factor
RORc/leads to Th-17 lineage commitment [13], the population of cells designated as Th-17 is not homogeneous. Th-17 cells comprise a wide spectrum with a range of effector phenotypes. Although these cells collectively produce characteristic Th-17 cytokines, not all cytokines are produced by each individual cell in the population but different “functional Th-17 subsets” can prevail. Th-17 cells in particular exhibit a high degree of plasticity in terms of cytokines produced, a property that is dependent on the surrounding cytokine milieu in which they develop [303]. Our results indicate an activation of Th-17 in AD, as an enhanced expression of
RORc/ was seen in these patients; these cells produced high amounts of IL-21, a cytokine that enhances the effector phase of T-cells responses associated to inflammation and tissue damage [304], but not of IL-17. These results seem to indicate that a subset of non-IL-17-producing Th-17 cells that specializes in the generation of IL-21 and IL-22 plays a role in AD.
51
Moreover, TGF- a cytokine that, together with IL-6, is considered to be a factor
responsible for initiating the Th-17 differentiation, was not increased in A- stimulated CD14
+ cells of AD patients. Recent studies have showed that Th-17
cells derived in the presence of IL-23 can occur in the absence of TGF- post-mort [305]. These ‘alternative’ Th-17 cells, differentiated in the presence of IL-6, IL-1b and IL-23, possess a different expression profile in terms of cytokines, transcription
factors and surface molecules. When ‘classical’ Th-17 cells, induced by TGF- plus IL-6, were compared to the alternatively induced Th-17 cells, the ‘alternative’ Th-17 cells were more pathogenic. Th-17 cells cannot be defined using a narrow schematic, but that there is a wide spectrum of Th-17 phenotypes with differences in their cytokine production and effector functions. The cytokine environment largely determines the expression of a network of different transcription factors that in turn determine the cytokines that are produced by Th-17 cells. The presence of a multifactorial inflammatory milieu in AD was further confirmed by the observation that IL-9 was significantly augmented as well in AD patients. This cytokine defines the recently identified subset of Th-9 cells, a distinct population of helper/effector T cells that promote tissue inflammation [21]. Th-9 cells do not express any well-defined transcription factors like T-bet, GATA-3,
RORc/, and FOXP3, emphasizing that Th-9 cells are different from Th-1, Th-17, and Treg populations.
Th-9 lymphocytes differentiate in the presence of IL-4 and TGF-, and are identified by their ability to produce IL-9. These cells were suggested to stem from a reprogramming of Th-2 lymphocytes [306,307], to be a unique subset of T effector cells [21,22], or, alternatively, to be adaptive Treg cells [83]. Although the role of Th-9 cells in human pathology is still under debate, recent evidence suggest that they can be involved in allergic and autoimmune phenomena [18]. IL-9 could be either inflammatory or regulatory, depending on the context and the source of the producing cells [308,22] as it influences both Th-17 cell differentiation and Treg suppressive activity via the interaction with STAT3 and STAT5 respectively [309,310]. Thus, by simultaneously activating STAT3 and STAT5, IL-9 influences the balance between Th-17/Tregs and the development of the immune responses in vivo. Recent results indicating a reduction of Treg cells and an impairment of their activity in AD patients [272] seem to indicate that such balance is altered in favour of Th-17 in AD patients.
Post-thymic T lymphocyte maturation of A-specific lymphocytes was also clearly skewed in AD and MCI. Thus, effector memory (EM) and terminally differentiated (TD) lymphocytes were increased in both groups of patients compared to HC. EM cells differentiate from central memory (CM) cells in the presence of antigen and cytokines such as IL-7; if the antigenic load is high, EM differentiate into TD: terminal effector cells [311]. The situation seen in AD and MCI can therefore be
summarized as follows: 1) higher concentrations of A induce the differentiation of naïve cells into CM; 2) the continuous presence of an elevated antigenic load induces the further differentiation of CM into EM and TD. Notably, the increased expression of NFATc1 seen in AD but not in MCI would stabilize the cytokine secretion by these cells that characterizes AD individuals. Recent data show
increased quantities of antigen presenting cells expressing MHC class II- A

52
complexes in murine models of AD [306]; it will be interesting to verify if a similar phenomenon can be detected in AD and MCI patients: this could justify the
accumulation of A-specific late stage memory cells seen in these conditions. Data herein shed light on the nature of AD-associated neuroinflammation driven by Th-17 and Th-9 cells. A better understanding of the complexity of this phenomenon could facilitate the search for novel therapeutic strategies.

53
6. CONCLUSIONS
Neuroinflammation is a complex process that has both beneficial aspects in maintenance of brain homeostasis and injury resolution, but also can be detrimental if sustained chronically, over years and decades. In the latter case the activated brain immune pathways can cause debilitation or death to otherwise healthy tissue collateral to sites of injury or histological insult (e.g., amyloid plaques and NFTs in the case of AD). Despite early epidemiological evidence that chronic use of non-steroidal anti-inflammatory drugs diminished the risk for AD, clinical intervention trials have thus far failed to slow disease progression or provide convincing evidence of symptomatic improvements in patients with early or moderate AD. To clarify the role of neuroinflammatory processes suggested to be associated with Alzheimer’s Disease we performed extensive immunophenotypic and functional analysis of amyloid-beta stimulated PBMCs in patients with a diagnosis of AD compared to MCI and aged-matched healthy individual. Our results indicate that the development of AD is associated with a reduction of circulating T reg naïve cells, the subpopulation of Treg cells endowed with the strongest suppressive ability. These quantitative changes are associated with qualitative changes,
summarized as an increase of A-specific proliferation and a reduced ability of T reg to suppress such proliferation. In order to understand the regulation of the balance between inflammation and tolerance in AD we studied the PD-1/PD-L1 pathway, which modulates the balance between inflammation and tolerance by inducing IL-10 production and apoptosis of antigen-specific cells. A significant decrease of percentage of amyloid-beta specific and PD-1 expressing T cells, as well as of PD-L1- expressing and IL-10-producing CD14
+ cells was
observed in AD and MCI patients compared to HC. Results showed an impairment of the PD-1/PD-L1 pathway in AD patients, which results in reduced IL-10
production and diminished apoptosis of A-specific CD4+ T lymphocytes.
The analysis of lymphocytes subpopulations in AD and MCI compared to controls highlighted that in AD patients not only an alteration of immunological tolerance is present but also a shift in the differentiation of T lymphocytes towards an inflammatory phenotype Th-9 and Th-17. Our results showed indeed that cytokines (IL-21, IL-23, IL-6) and transcription
factor (RORc/) involved in the differentiaton of Th-17, as well as cytokines (IL-21, IL-22) produced by these cells are all augmented in AD compared to MCI and HC. Notably, IL-9, the effector cytokine produced by Th-9 cells, was significantly
increased as well in AD patients, indicating that, beside Th-17, A- specific Th-9 lymphocytes are upregulated in AD. This is accompanied by a shift in post- thymic differentiation pathways favoring the accumulation of differentiated, effector T lymphocytes. The dysregulation of immune tolerance observed in AD patients as the defect in PD-1/PDL-1 inhibitory pathway mechanism and the Treg suppression impairment
leads to a strong activation of A- specific T cell immune response. These finding enrich and in part clarify the complex phenomena that orchestrate AD-associated neuroinflammation. In conclusion the impairment of the immune response, with a profound skewing favoring inflammatory and effector responses seem to play a

54
pivotal role in this pathology. Immunomodulatory approaches direct to restore immune tolerance could be envisioned as a way to design new therapeutic strategies in delaying progression of disease. In this context, the administration of adiponectin (ADN), an adipocytokine with anti-inflammatory properties produced by adipose tissues, has been demostrated to induce immune tolerance in mice. In particular ADN up-regulates PD-L1 expression on DC that, in turn, expands/induces the differentiation of CD4
+T cells towards
regulatory T cell subpopulation. Future studies, evaluating the role of adiponectin in restoring the mechanism of immune tolerance in Alzheimer’s Disease patients, could allow a better definition of early prognostic biomarker leading to novel therapeutic strategies.

55
7. BIBLIOGRAPHY
1. Bonilla F.A., Oettgen H.C., “Adaptive immunity”, J Allergy Clin Immunol, Vol. 125, no. 2 (Suppl 2), 2010, pp. S33-40. 2. Turvey S.E., Broide D.H., “Innate immunity”, J Allergy Clin Immunol, Vol. 125, no. 2, 2010, pp. 24-32. 3. Dustin M.L., ”The cellular context of T cell signalling”, Immunity, Vol. 30, no. 4, 2009, pp. 482-492. 4. Mosmann T.R., Cherwinski H., Bond M.W., Giedlin M.A., Coffman R.L., “Two types of murine helper T cell clone. I. Definition according to profiles of lymphokine activities and secreted proteins”, J Immunol, Vol. 136, no. 7, 1986, pp. 2348-2357. 5. Steinman L., “A brief history of T(H)17, the first major revision in the T(H)1/T(H)2 hypothesis of the T cell-mediated tissue damage”, Nat Med, Vol. 13, no. 2, 2007, pp. 139-145. 6. Park H., Li Z., Yang X.O., Chang S.H., Nurieva R., Wang Y.H., Hood L., Zhu Z., Tian Q., Dong C., “A distinct lineage of CD4 T cells regulates tissue inflammation by producing interleukin 17”, Nat Immunol, Vol. 6, no. 11, 2005, pp. 1133-1141. 7. Beriou G., Bradshaw E.M., Lozano E., Costantino C.M., Hastings W.D., Orban T., Elyaman W., Khoury S.J., Kuchroo V.K., Baecher-Allan C., Hafler D.A., “TGF-beta induces IL-9 production from human Th17 cells”, J Immunol, Vol. 185, no. 1, 2010, pp. 46-54. 8. Nurieva R., Yang X.O., Martinez G., Zhang Y., Panopoulos A.D., Ma L., Schluns K., Tian Q., Watowich S.S., Jetten A.M., Dong C., “Essential autocrine regulation by IL-21 in the generation of inflammatory T cells”, Nature, Vol. 448, no, 7152, 2007, pp. 480-483. 9. Wilson N.J., Boniface K., Chan J.R., McKenzie B.S., Blumenschein W.M., Mattson J.D., Basham B., Smith K., Chen T., Morel F., Lecron J.C., Kastelein R.A., Cua D.J., McClanahan T.K., Bowman E.P., de Waal Malefyt R., “Development, cytokine profile and function of human interleukin 17-producing helper T cells”, Nat Immunol, Vol. 8, no. 9, 2007, pp. 950-957. 10. Zhu J., Paul W.E., “Heterogeneity and plasticity of T helper cells”, Cell Res, Vol. 20, no. 1, 2010, pp. 4-12. 11. Annunziato F., Cosmi L., Santarlasci V., Maggi L., Liotta F., Mazzinghi B., Parente E., Filì L., Ferri S., Frosali F., Giudici F., Romagnani P., Parronchi P., Tonelli F., Maggi E., Romagnani S., “Phenotypic and functional features of human Th17 cells”, J Exp Med, Vol. 204, no. 8, 2007, pp. 1849-1861.

56
12. Miossec P., Korn T., Kuchroo V.K., “Interleukin-17 and type 17 helper T cells”, N Engl J Med, Vol. 361, no. 9, 2009, pp. 888-898. 13. Ivanov I.I., McKenzie B.S., Zhou L., Tadokoro C.E., Lepelley A., Lafaille J.J., Cua D.J., Littman D.R., “The orphan nuclear receptor RORγt directs the differentiation program of proinflammatory IL-17+ T helper cells”, Cell, Vol. 126, no. 6, 2006, pp. 1121-1133. 14. Yang X.O., Pappu B.P., Nurieva R., Akimzhanov A., Kang H.S., Chung Y., Ma L., Shah B., Panapoulos A.D., Schluns K.S., Watowich S.S., Tian Q., Jetten A.M., Dong C., “T helper 17 lineage differentiation is programmed by orphan nuclear receptors RORα and RORγ”, Immunity, Vol. 28, no. 1, 2008, pp. 29-39. 15. Xu S., Cao X., “Interleukin-17 and its expanding biological functions”, Cell Mol Immunol, Vol. 7, no. 3, 2010, pp. 164-174. 16. Kolls J.K., Lindén A., “Interleukin-17 family members and inflammation”, Immunity, Vol. 21, no. 4, 2004, pp. 467-476. 17. Jovanovic D.V., Di Battista J.A., Martel-Pelletier J., Jolicoeur F.C., He Y., Zhang M., Mineau F., Pelletier J.P., “IL-17 stimulates the production and expression of proinflammatory cytokines, IL-beta and TNF-alpha, by human macrophages”, J Immunol, Vol. 160, no. 7, 1998, pp. 3513-3521. 18. Jäger A., Kuchroo V.K., “Effector and regulatory T-cell subsets in autoimmunity and tissue inflammation”, Scand J Immunol, Vol. 72, no. 3, 2010, pp. 173-184. 19. Qian Y., Kang Z., Liu C., Li X., “IL-17 signaling in host defense and inflammatory diseases”, Cell Mol Immunol, Vol. 7, no. 5, 2010, pp. 328-333. 20. Zhu S., Qian Y., “IL-17/IL-17 receptor system in autoimmune disease: mechanisms and therapeutic potential”, Clin Sci, Vol. 122, no. 11, 2012, pp. 487-511. 21. Dardalhon V., Awasthi A., Kwon H., Galileos G., Gao W., Sobel R.A., Mitsdoerffer M., Strom T.B., Elyaman W., Ho I.C., Khoury S., Oukka M., Kuchroo B.V., “IL-4 inhibits TGF-beta-induced Foxp3+ T cells and, together with TGF-beta, generates IL-9+ IL-10+ Foxp3(-) effector T cells”, Nat Immunol, Vol. 9, no. 12, 2008, pp.1347-1355. 22. Veldhoen M., Uyttenhove C., van Snick J., Helmby H., Westendorf A., Buer J., Martin B., Wilhelm C., Stockinger B., “Transforming growth factor-beta ‘‘reprograms’’ the differentiation of T helper 2 cells and promotes an interleukin 9-producing subset”, Nat Immunol, Vol. 9, no. 12, 2008, pp. 1341-1346. 23. Soroosh P., Doherty T.A., “Th9 and allergic disease”, Immunology, Vol. 127, no. 4, 2009, pp. 450-458.

57
24. Jäger A., Dardalhon V., Sobel R.A., Bettelli E., Kuchroo V.K., “Th1, Th17, and Th9 effector cells induce experimental autoimmune encephalomyelitis with different pathological phenotypes”, J Immunol, Vol. 183, no. 11, 2009, pp. 7169-7177. 25. Erpenbeck V.J., Hohlfeld J.M., Volkmann B., Hagenberg A., Geldmacher H., Braun A., Krug N., “Segmental allergen challenge in patients with atopic asthma leads to increased IL-9 expression in bronchoalveolar lavage fluid lymphocytes”, J Allergy Clin Immunol, Vol. 111, no. 6, 2003, pp. 1319-1327. 26. Shimbara A., Christodoulopoulos P., Soussi-Gounni A., Olivenstein R., Nakamura Y., Levitt R.C., Nicolaides N.C., Holroyd K.J., Tsicopoulos A., Lafitte J.J., Wallaert B., Hamid Q.A., “IL-9 and its receptor in allergic and non allergic lung disease: increased expression in asthma”, J Allergy Clin Immunol, Vol. 105, no. 1, 2000, pp. 108-115. 27. Raimondi G., Shufesky W.J., Tokita D., Morelli A.E., Thomson A.W., “Regulated compartmentalization of programmed cell death-1 discriminates CD4+CD25+ resting regulatory T cells from activated T cells”, J Immunol, Vol. 176, no. 5, 2006, pp. 2808-2816. 28. Takahashi T., Kuniyasu Y., Toda M., Sakaguchi N., Itoh M., Iwata M., Shimizu J., Sakaguchi S., “Immunologic self-tolerance maintained by CD25+CD4+ naturally anergic and suppressive T cells: induction of autoimmune disease by breaking their anergic/suppressive state”, Int Immunol, Vol. 10, no. 12, 1998, pp. 1969-1980. 29. Sakaguchi S., “Naturally arising CD4+ regulatory T cells for immunologic self-tolerance and negative control of immune responses”, Annu Rev Immunol, Vol. 22,no. 22, 2004, pp. 531–562. 30. McGeachy M.J., Stephens L.A., Anderton S.M., “Natural recovery and protection from autoimmune encephalomyelitis: contribution of CD4+CD25+ regulatory cells within the central nervous system”, J Immunol, Vol. 175, no. 5, 2005, pp. 3025-3032. 31. Uhlig H.H., Coombes J., Mottet C., Izcue A., Thompson C., Fanger A., Tannapfel A., Fontenot J.D., Ramsdell F., Powrie F., “Characterization of Foxp3+CD4+CD25+ and IL-10-secreting CD4+CD25+ T cells during cure of colitis”, J Immunol, Vol. 177, no. 9, 2006, pp. 5852-5860. 32. Huber S., Schra C., Lehr H.A., Mann A., Schmitt S., Becker C., Protschka M., Galle P.R., Neurath M.F., Blessing M., “Cutting edge: TGF-beta signaling is required for the in vivo expansion and immunosuppressive capacity of regulatory CD4+CD25+ T cells”, J Immunol, Vol. 173, no. 11, pp. 6526-6531. 33. Gondek D.C., Lu L.F., Quezada S.A., Sakaguchi S., Noelle R.J., “Cutting edge: contact-mediated suppression by CD4+CD25+ regulatory cells involves a granzyme B-dependent, perforin-independent mechanism”, J Immunol, Vol. 174, no. 4, 2005, pp. 1783-1786.

58
34. Grossman W.J., Verbsky J.W., Barchet W., Colonna M., Atkinson J.P., Ley T.J., “Human T regulatory cells can use the perforin pathway to cause autologous target cell death”, Immunity, Vol. 21, no. 4, 2004, pp. 589-601. 35. Zhao D.M., Thornton A.M., DiPaolo R.J., Shevach E.M., “Activated CD4+CD25+ T cells selectively kill B lymphocytes”, Blood, Vol. 107, no. 10, 2006, pp. 3925-3932. 36. Fallarino F., Grohmann U., You S., McGrath B.C., Cavener D.R., Vacca C., Orabona C., Bianchi R., Belladonna M.L., Volpi C., Santamaria P., Fioretti M.C., Puccetti P., “The combined effects of tryptophan starvation and tryptophan catabolites down-regulate T cell receptor zeta-chain and induce a regulatory phenotype in naive T cells”, J Immunol, Vol. 176, no. 11, 2006, pp. 6752-6761. 37. Sakaguchi S., Sakaguchi N., Asano M., Itoh M., Toda M., “Immunologic self-tolerance maintained by activated T cells expressing IL-2 receptor alpha-chains (CD25). Breakdown of a single mechanism of self-tolerance causes various autoimmune diseases”, J Immunol, Vol. 155, no. 3, 1995, pp. 1151-1164. 38. Akbari O., Freeman G.J., Meyer E.H., Greenfield E.A., Chang T.T., Sharpe A.H., Berry G., DeKruyff R.H., Umetsu D.T., “Antigen-specific regulatory T cells develop via the ICOS-ICOS- ligand pathway and inhibit allergen-induced airway hyperreactivity”, Nat Med, Vol. 8, no. 9, 2002, pp. 1024-1032. 39. Chatila T.A., “Role of regulatory T cells in human diseases”, J Allergy Clin Immunol, Vol. 116, no. 5, 2005, pp. 949-959. 40. Chen Y., Kuchroo V.K., Inobe J., Hafler D.A., Weiner H.L., “Regulatory T cell clones induced by oral tolerance: suppression of autoimmune encephalomyelitis”, Science, Vol. 265, no. 5176, 1994, pp. 1237-1240. 41. Weiner H.L., “Oral tolerance: immune mechanisms and treatment of autoimmune diseases”, Immunol Today, Vol. 18, no. 7, 1997, pp. 335-343. 42. Zhang X., Izikson L., Liu L., Weiner H.L., “Activation of CD25 (+) CD4 (+) regulatory T cells by oral antigen administration”, J Immunol, Vol. 167, no. 8, 2001, pp. 4245-4253. 43. Zenclussen A.C., “Regulatory T cells in pregnancy”, Springer Semin Immunopathol, Vol. 28, no. 1, 2006, pp. 31-39. 44. Hori S., Carvalho T.L., Demengeot J., “CD25+ CD4+ regulatory T cells suppress CD4+ T cell-mediated pulmonary hyperinflammation driven by Pneumocystis carinii in immunodeficient mice”, Eur J Immunol, Vol. 32, no. 5, 2002, pp. 1282-1291. 45. Kullberg M.C., Jankovic D., Gorelick P.L., Caspar P., Letterio J.J., Cheever A.W., Sher A., “Bacteria-triggered CD4 (+) T regulatory cells suppress Helicobacter hepaticus-induced colitis”, J Exp Med, Vol. 196, no. 4, 2002, pp. 505-515.

59
46. Mills K.H., “Regulatory T cells: friend or foe in immunity to infection?”, Nat Rev Immunol, Vol. 4, no. 11, 2004, pp. 841-855. 47. Baecher-Allan C., Anderson D.E., “Regulatory cells and human cancer”, Semin Cancer Biol, Vol. 16, no. 2, 2006, pp. 98-105. 48. Battaglia M., Roncarolo M.G., “Induction of transplantation tolerance via regulatory T cells”, Inflamm Allergy Drug Targets, Vol. 5, no. 3, 2006, pp. 157-165. 49. Langier S., Sade K., Kivity S., “Regulatory T cells: the suppressor arm of the immune system”, Autoimmun Rev, Vol. 10, no. 2, 2010, pp. 112-115. 50. Miyara M., Sakaguchi S., “Natural regulatory T cells: mechanisms of suppression”, Trends Mol Med, Vol. 13, no. 3, 2007, pp. 108-116. 51. Sakaguchi S., Yamaguchi T., Nomura T., Ono M., “Regulatory T cells and immune tolerance”, Cell, Vol. 133, no. 5, 2008, pp. 775-787. 52. Hori S., Takahashi T., Sakaguchi S., “Control of autoimmunity by naturally arising regulatory CD4+ T cells”, Adv Immunol, Vol. 81, 2003, pp. 331-371. 53. Richards S., Watanabe C., Santos L., Craxton A., Clark E.A., “Regulation of B-cell entry into the cell cycle”, Immunol Rev, Vol. 224, 2008, pp.183-200. 54. Vos Q., Lees A., Wu Z.Q., Snapper C.M., Mond J.J., “B-cell activation by T-cell- independent type 2 antigens as an integral part of the humoral immune response to pathogenic microorganisms”, Immunol Rev, Vol. 176, 2000, pp. 154-170. 55. He B., Qiao X., Cerutti A., “CpG DNA induces IgG class switch DNA recombination by activating human B cells through an innate pathway that requires TLR9 and cooperates with IL-10”, J Immunol, Vol. 173, no. 7, 2004, pp. 4479-4491. 56. Allen C.D., Okada T., Cyster J.G., “Germinal-center organization and cellular dynamics”, Immunity, Vol. 27, no. 2, 2007, pp. 190-202. 57. Goodnow C.C., Sprent J., Fazekas de St Groth B., Vinuesa C.G., “Cellular and genetic mechanisms of self tolerance and autoimmunity”, Nature, Vol. 435, no. 7042, 2005, pp. 590-597. 58. Von Boehmer H., Melchers F., “Checkpoints in lymphocyte development and autoimmune disease”, Nature Immunology, Vol. 11, no. 1, 2010, pp. 14-20. 59. Mathis D., Benoist C., “Back to central tolerance”, Immunity, Vol. 20, no. 5, 2004, pp. 509-516. 60. Schwartz R.H., “T cell anergy”, Ann Rev of Immunol, Vol. 21, 2003, pp. 305-334.

60
61. Powell J.D., “The induction and maintenance of T cell anergy”, Clin Immunol, Vol. 120, no. 3, 2006, pp. 239-246. 62. Asnagli H., Murphy K.M., “Stability and commitment in T helper cell development”, Curr Opin Immunol, Vol. 13, no. 2, 2002, pp. 242-247. 63. Juo P., Kuo C.J., Yuan J., Blenis J., “Essential requirement for caspase-8/FLICE in the initiation of the Fas-induced apoptotic cascade”, Curr Biol, Vol. 8, no. 18, 1998, pp. 1001-1008. 64. Freeman G.J., Long A.J., Iwai Y., Bourque K., Chernova T., Nishimura H., Fitz L.J., Malenkovich N., Okazaki T., Byrne M.C., Horton H.F., Fouser L., Carter L., Ling V., Bowman M.R., Carreno B.M., Collins M., Wood C.R., Honjo T., “Engagement of the PD-1 immuno inhibitory receptor by a novel B7 family member leads to negative regulation of lymphocyte activation”, J Exp Med, Vol. 192, no. 7, pp. 1027-1034. 65. Sandner S.E., Clarkson M.R., Salama A.D., Sanchez-Fueyo A., Domenig C., Habicht A., Najafian N., Yagita H., Azuma M., Turka L.A., Sayegh M.H., “Role of the programmed death-1 pathway in regulation of alloimmune responses in vivo”, J Immunol, Vol. 174, no. 6, 2005, pp. 3408-3415. 66. Parry R.V., Chemnitz J.M., Frauwirth K.A., Lanfranco A.R., Braunstein I., Kobayashi S.V., Linsley P.S., Thompson C.B., Riley J.L., “CTLA-4 and PD-1 receptors inhibit T-cell activation by distinct mechanisms”, Mol Cell Biol, Vol. 25, no. 21, 2005, pp. 9543-9553. 67. Dong H., Zhu G., Tamada K., Chen L., “B7-H1 a third member of the B7 family, co-stimulates T-cell proliferation and interleukin-10 secretion”, Nat Med, Vol. 5, no. 12, 1999, pp. 1365-1369. 68. Ishida M., Iwai Y., Tanaka Y., Okazaki T., Freeman G.J., Minato N., Honjo T., “Differential expression of PD-L1 and PD-L2, ligands for an inhibitory receptor PD-1, in the cells of lymphohematopoietic tissues”, Immunol Lett, Vol. 84, no. 1, 2002, pp. 57-62. 69. Latchman Y., Wood C.R., Chernova T., Chaudhary D., Borde M., Chernova I., Iwai Y., Long A.J., Brown J.A., Nunes R., Greenfield E.A., Bourque K., Boussiotis V.A., Carter L.L., Carreno B.M., Malenkovich N., Nishimura H., Okazaki T., Honjo T., Sharpe A.H., Freeman G.J., “PD-L2 is a second ligand for PD-1 and inhibits T cell activation”, Nat Immunol, Vol. 2, no. 3, 2001, pp. 261-268. 70. Sharpe A.H., Wherry E.J., Ahmed R., Freeman G.J., “The function of programmed cell death 1 and its ligands in regulating autoimmunity and infection”, Nat Immunol, Vol. 8, no. 3, 2007, pp. 239-245. 71. Zhong X., Tumang J.R., Gao W., Bai C., Rothstein T.L., “PD-L2 expression extends beyond dendritic cells/macrophages to B1 cells enriched for

61
V(H)11/V(H)12 and phosphatidylcholine binding”, Eur J Immunol, Vol. 37, no. 9, 2007, pp. 2405-2410. 72. Nurieva R.I., Liu X., Dong C., “Yin-Yang of costimulation: crucial controls of immune tolerance and function”, Immunol Rev, Vol., 229, no. 1, 2009, pp. 88-100. 73. Okazaki T., Honjo T., “PD-1 and PD-1 ligands: from discovery to clinical application”, Int Immunol, Vol. 19, no. 7, 2007, pp. 813-824. 74. Francisco L.M., Sage P.T., Sharpe A.H., “The PD-1 pathway in tolerance and autoimmunity”, Immunol Rev, Vol. 236, 2010, pp. 219-242. 75. Crawford A., Wherry E.J., “The diversity of costimulatory and inhibitory receptor pathways and the regulation of antiviral T cell responses”, Curr Opin Immunol, Vol. 21, no. 2, 2009, pp. 179-186. 76. Driessens G., Kline J., Gajewski T.F., “Costimulatory and coinhibitory receptors in anti-tumor immunity”, Immunol Rev, Vol. 229, no. 1, 2009, pp. 126-144. 77. Wang S., Zhu G., Chapoval A.I., Dong H., Tamada K., Ni J., Chen L., “Costimulation of T cells by B7-H2, a B7-like molecule that binds ICOS”, Blood, Vol. 96, no. 8, 2000, pp. 2808-2813. 78. Rivest S., “Regulation of innate immune responses in the brain”, Nat Rev Immunol, Vol. 9, no. 6, 2009, pp. 429-439. 79. Neumann H., Cavalie A., Jenne D.E., Wekerle H., “Induction of MHC class I genes in neurons”, Science, Vol. 269, no. 5223, 1995, pp. 549-552. 80. Wekerle H., Linington C., Lassmann H., Meyermann R., “Cellular immune reactivity within the CNS”, Trends Neurosci, Vol. 9, 1986, pp. 271-277. 81. Magnus T., Schreiner B., Korn T., Jack C., Guo H., Antel J., Ifergan I., Chen L., Bischof F., Bar-Or A., Wiendl H., “Microglial expression of the B7 family member B7 homolog 1 confers strong immune inhibition: implications for immune responses and autoimmunity in the CNS”, J Neurosci, Vol. 25, no. 10, 2005, pp. 2537-2546. 82. Kwidzinski E., Bunse J., Aktas O., Richter D., Mutlu L., Zipp F., Nitsch R., Bechmann I., “Indolamine 2,3-dioxygenase is expressed in the CNS and down-regulates autoimmune inflammation”, Faseb J, Vol. 19, no. 10, 2005, pp. 1347-1349. 83. Liu Y., Teige I., Birnir B., Issazadeh-Navikas S., “Neuron- mediated generation of regulatory T cells from encephalitogenic T cells suppresses EAE”, Nat Med, Vol. 12, no. 5, 2006, pp. 518-525. 84. Engelhardt B., Ransohoff R.M., “The ins and outs of T-lymphocyte trafficking to the CNS: anatomical sites and molecular mechanisms”, Trends Immunol, Vol. 26, no. 9, 2005, pp. 485-495.

62
85. Kivisäkk P., Mahad D.J., Callahan M.K., Trebst C., Tucky B., Wei T., Wu L., Baekkevold E.S., Lassmann H., Staugaitis S.M., Campbell J.J., Ransohoff R.M., “Human cerebrospinal fluid central memory CD4+ T cells: evidence for trafficking through choroid plexus and meninges via P-selectin”, Proc Natl Acad Sci U S A, Vol. 100, no. 14, 2003, pp. 8389-8394. 86. Yednock T.A., Cannon C., Fritz L.C., Sanchez-Madrid F., Steinman L., Karin N., “Prevention of experimental autoimmune encephalomyelitis by antibodies against alpha 4 beta 1 integrin”, Nature, Vol. 356, no. 6364, 1992, pp. 63-66. 87. Carrithers M.D., Visintin I., Kang S.J., Janeway C.A. Jr., “Differential adhesion molecule requirements for immune surveillance and inflammatory recruitment”, Brain, Vol. 123, no. 6, 2000, pp. 1092-1101. 88. Popescu B.O., Toescu E.C., Popescu L.M., Bajenaru O., Muresanu D.F., Schultzberg M., Bogdanovic N., “Blood-brain barrier alterations in ageing and dementia”, J Neurol Sci, Vol. 283, no. 1-2, 2009, pp. 99-106. 89. Siffrin V., Brandt A.U., Radbruch H., Herz J., Boldakowa N., Leuenberger T., Werr J., Hahner A., Schulze-Topphoff U., Nitsch R., Zipp F., “Differential immune cell dynamics in the CNS cause CD4+ T cell compartmentalization”, Brain, Vol. 132, no. 5, 2009, pp. 1247-1258. 90. McCandless E.E., Wang Q., Woerner B.M., Harper J.M., Klein R.S., “CXCL12 limits inflammation by localizing mononuclear infiltrates to the perivascular space during experimental autoimmune encephalomyelitis”, J Immunol, Vol. 177, no. 11, 2006, pp. 8053-8064. 91. McCandless E.E., Zhang B., Diamond M.S., Klein R.S., “CXCR4 antagonism increases T cell trafficking in the central nervous system and improves survival from West Nile virus encephalitis”, Proc Natl Acad Sci U S A, Vol.105, no. 32, 2008, pp. 11270-11275. 92. Stone D.K., Reynolds A.D., Mosley R.L., Gendelman H.E., “Innate and adaptive immunity for the pathobiology of Parkinson’s disease”, Antioxid Redox Signal, Vol. 11, no. 9, 2009, pp. 2151-2166. 93. Desai B.S., Monahan A.J., Carvey P.M., Hendey B., “Blood-brain barrier pathology in Alzheimer’s and Parkinson’s disease: implications for drug therapy”, Cell Transplant, Vol. 16, no. 3, 2007, pp. 285-299. 94. Stamatovic S.M., Keep R.F., Andjelkovic A.V., “Brain endothelial cell-cell junctions: how to ‘‘open’’ the blood brain barrier”, Curr Neuropharmacol, Vol. 6, no. 3, 2008, pp. 176-192. 95. Mackic J.B., Weiss M.H., Miao W., Kirkman E., Ghiso J., Calero M., Bading J., Frangione B., Zlokovic B.V., “Cerebrovascular accumulation and increased blood-brain barrier permeability to circulating Alzheimer’s amyloid beta peptide in aged

63
squirrel monkey with cerebral amyloid angiopathy”, J Neurochem, Vol. 70, no. 1, 1998, pp. 210-215. 96. Togo T., Akiyama H., Iseki E., Kondo H., Ikeda K., Kato M., Oda T., Tsuchiya K., Kosaka K., “Occurrence of T cells in the brain of Alzheimer’s disease and other neurological diseases”, J Neuroimmunol, Vol. 124, no. 1-2, 2002, pp. 83-92. 97. Liu Y.J., Guo D.W., Tian L., Shang D.S., Zhao W.D., Li B., Fang W.G., Zhu L., Chen Y.H., “Peripheral T cells derived from Alzheimer’s disease patients overexpress CXCR2 contributing to its transendothelial migration, which is microglial TNF-alpha-dependent”, Neurobiol Aging, Vol. 31, no. 2, 2010, pp. 175-188. 98. Man S.M., Ma Y.R., Shang D.S., Zhao W.D., Li B., Guo D.W., Fang W.G., Zhu L., Chen Y.H., “Peripheral T cells overexpress MIP-1alpha to enhance its transendothelial migration in Alzheimer’s disease”, Neurobiol Aging, Vol. 28, no. 4, 2007, pp. 485-496. 99. McGeer E.G., McGeer P.L., ”Brain inflammation in Alzheimer disease and the therapeutic implications”, Curr Pharm Des, Vol. 5, no. 10, 1999, pp. 821-836. 100. Lawson L.J., Perry V.H., Dri P., Gordon S., “Heterogeneity in the distribution and morphology of microglia in the normal adult mouse brain”, Neuroscience, Vol. 39, no. 1, 1990, pp. 151-170. 101. Carson M.J., Bilousova T.V., Puntambekar S.S., Melchior B., Doose J.M., Ethell I.M., “A rose by any other name? The potential consequences of microglial heterogeneity during CNS health and disease”, Neurotherapeutics, Vol. 4, no. 4, 2007, pp. 571-579. 102. Hanisch U.K., Kettenmann H., “Microglia: active sensor and versatile effector cells in the normal and pathologic brain”, Nat Neurosci, Vol. 10, no. 11, 2007, pp. 1387-1394. 103. Kennedy D.W., Abkowitz J.L., “Kinetics of central nervous system microglial and macrophage engraftment: analysis using a transgenic bone marrow transplantation model”, Blood, Vol. 90, no. 3, 1997, pp. 986-993. 104. Vallieres L., Sawchenko P.E., “Bone marrow-derived cells that populate the adult mouse brain preserve their hematopoietic identity”, J Neurosci, Vol. 23, no. 12, 2003, pp. 5197-5207. 105. Town T., Nikolic V., Tan J., “The microglial ‘‘activation’’ continuum: from innate to adaptive responses”, J Neuroinflammation, Vol. 2, no. 24, 2005. 106. Meda L., Baron P., Scarlato G., “Glial activation in Alzheimer’s disease: the role of Abeta and its associated proteins”, Neurobiol Aging, Vol. 22, no. 6, 2001, pp. 885-893.

64
107. Wyss-Coray T., Yan F., Lin A.H., Lambris J.D., Alexander J.J., Quigg R.J., Masliah E., “Prominent neurodegeneration and increased plaque formation in complement-inhibited Alzheimer’s mice”, Proc Natl Acad Sci U S A, Vol. 99, no. 16, 2002, pp. 10837-10842. 108. Prinz M., Kann O., Draheim H.J., Schumann R.R., Kettenmann H., Webwer J.R., Hanisch U.K., “Microglial activation by components of gram-positive and –negative bacteria: distinct and common routes to the induction of ion channels and cytokines”, J Neuropathol Exp Neurol, Vol. 58, no. 10, 1999, pp. 1078-1089. 109. Schubert P., Morino T., Miyazaki H., Ogata T., Nakamura Y., Marchini C., Ferroni S., “Cascading glia reactions: a common pathomechanism and its differentiated control by cyclic nucleotide signalling”, Ann N Y Acad Sci, Vol. 903, 2000, pp. 24-33. 110. Hanisch U.K., ”Microglia as a source and target of cytokines”, Glia, Vol. 40, no. 2, 2002, pp. 140-155. 111. Godbout J.P., Chen J., Abraham J., Richwine A.F., Berg B.M., Kelley K.W., Johnson R.W., “Exaggerated neuroinflammation and sickness ost-mort in aged mice following activation of the peripheral innate immune system”, FASEB J, Vol. 19, no. 10, 2005, pp. 1329-1331. 112. Dilger R.N., Johnson R.W., “Aging, microglial cell priming, and the discordant central inflammatory response to signals from the peripheral immune system”, J Leukoc Biol, Vol. 84, no. 4, 2008, pp. 932-939. 113. Sparkman N.L., Johnson R.W., “Neuroinflammation associated with aging sensitizes the brain to the effects of infection or stress”, Neuroimmunomodulation, Vol. 15, no. 4-6, 2008, pp. 323-330. 114. McGeer P.L., McGeer E., Rogers J., Sibley J., “Anti-inflammatory drugs and Alzheimer disease”, Lancet, Vol. 335, no. 8696, 1990, pp. 1037. 115. Dheen S.T., Kaur C., Ling E.A., “Microglial activation and its implications in the brain diseases”, Curr Med Chem, Vol. 14, no. 11, 2007, pp. 1189-1197. 116. Walter L., Neumann H., “Role of microglia in neuronal degeneration and regeneration”, Semin Immunopathol, Vol. 31, no. 4, 2009, pp. 513-525. 117. Nakajima K., Kohsaka S., “Microglia: activation and their significance in the central nervous system”, J Biochem, Vol. 130, no. 2, 2001, pp. 169-175. 118. Butovsky O., Ziv Y., Schwartz A., Landa G., Talpalar A.E., Pluchino S., Martino G., Schwartz M., “Microglia activated by IL-4 or IFN-gamma differentially induce neurogenesis and oligodendrogenesis from adult stem/progenitor cells”, Mol Cell Neurosci, Vol. 31, no. 1, 2006, pp. 149-160.

65
119. Li C., Zhao R., Gao K., Wei Z., Yin M.Y., Lau L.T., Chui D., Hoi Yu A.C., “Astrocytes: implications for neuroinflammatory pathogenesis of Alzheimer’s disease”, Curr Alzheimer Res, Vol. 8, no. 1, 2011, pp. 67-80. 120. Town T., Tan J., Flavell R.A., Mullan M., “T-cells in Alzheimer’s disease”, Neuromolecular Med, Vol. 7, no. 3, 2005, pp. 255-264. 121. Maragakis N.J., Rothstein J.D., “Mechanisms of disease: astrocytes in neurodegenerative disease”, Nat Clin Pract Neurol, Vol. 2, no. 12, 2006, pp. 679-689. 122. Farina C., Aloisi F., Meinl E., “Astrocytes are active players in cerebral innate immunity”, Trends Immunol, Vol. 28, no. 3, 2007, pp. 138-145. 123. Stadelmann C., Kerschensteiner M., Misgeld T., Bruck W., Hohlfeld R., Lassmann H., “BDNF and gp145trkB in multiple sclerosis brain lesions: neuroprotective interactions between immune and neuronal cells?”, Brain, Vol. 125, no. 1, 2002, pp. 75-85. 124. Barten D.M., Albright C.F., “Therapeutic strategies for Alzheimer’s disease”, Mol Neurobiol, Vol. 37, no. 2-3, 2008, pp. 171-186. 125. American Psychiatric Association, Diagnostic and Statistical Manual of Mental Disorders DSM-IV-R, 1994. 126. Braak H., Braak E., Bohl J., “Staging of Alzheimer related-cortical destruction”, Eur Neurol, Vol. 33, no. 6, 1993, pp. 403-408. 127. Chiti F., Dobson C.M., “Protein misfolding, functional amyloid, and human disease”, Annu Rev Biochem, Vol. 75, 2006, pp. 333-366. 128. 2011 Alzheimer’s disease facts and figures (2011). Alzheimer’s & Dementia; 7: 208-244. 129. Petersen R.C., “Mild cognitive impairment as a diagnostic entity”, J Intern Med, Vol. 256, no. 3, 2004, pp. 183-194. 130. Manly J.J., Tang M.X., Schupf N., Stern Y., Vonsattel J.P., Mayeux R., “Frequency and course of mild cognitive impairment in a multiethnic community”, Ann Neurol, Vol. 63, no. 4, 2008, pp. 494-506. 131. Finder V.H., “Alzheimer’s Disease: a general introduction and pathomechanism”, J Alzheimer Dis, Vol. 22, Suppl. 3, 2010, pp. 5-19. 132. Glenner G.G., Terry W., Harada M., Isersky C., Page D., “Amyloid fibril proteins: proof of homology with immunoglobulin light chains by sequence analyses”, Science, Vol. 172, no. 3988, 1971, pp. 1150-1151.

66
133. Glenner G.G., Wong C.W., “Alzheimer’s disease and Down’s syndrome: sharing of a unique cerebrovascular amyloid fibril protein”, Biochem Biophys Res Commun, Vol. 122, no. 3, 1984, pp. 1131-1135. 134. Weingarten M.D., Lockwood A.H., Hwo S.Y., Kirschner M.W., “A protein factor essential for microtubule assembly”, Proc Natl Acad Sci U S A, Vol. 72, no. 5, 1975, pp. 1858-1862. 135. Goedert M., Wischik C.M., Crowther R.A., Walker J.E., Klug A., “Cloning and sequencing of the cDNA encoding a core protein of the paired helical filament of Alzheimer disease: identification as the microtubule associated protein tau”, Proc Natl Acad Sci U S A, Vol. 85, no. 11, 1988, pp. 4051- 4055. 136. Kang J., Lemaire H.G., Unterbeck A., Salbaum J.M., Masters C.L., Grzeschik K.H., Multhaup G., Beyreuther K., Müller-Hill B., “The precursor of Alzheimer’s disease amyloid A4 protein resembles a cell surface receptor”, Nature, Vol. 325, no. 6106, 1987, pp. 733-736. 137. Rosendorff C., Beeri M.S., Silverman J.M., “Cardiovascular risk factors for Alzheimer’s disease”. Am J Geriatr Cardiol, Vol. 16, no. 2, 2007, pp. 143-149. 138. Sharp E.S., Gatz M., “Relationship between education and dementia: an updated systematic review”, Alzheimer Dis Assoc Disord, Vol. 25, no. 4, 2011, pp. 289-304. 139. Van Den Heuvel C., Thornton E., Vink R., “Traumatic brain injury and Alzheimer’s disease: a review”, Prog Brain Res, Vol. 161, 2007, pp. 303-316. 140. Uryu K., Laurer H., Mcintosh T., Pratico D., Martinez D., Leight S., Lee V.M., Trojanowski J.Q., “Ripetitive mild brain trauma accelerates Abeta deposition, lipid peroxidation, and cognitive impairment in a transgenic mouse model of Alzheimer amyloidosis”, J Neurosci, Vol. 22, no. 2, 2002, pp. 446-454. 141. Caselli R.J., Dueck A.C., Locke D.E., Sabbagh M.N., Ahern G.L., Rapcsak S.Z., Baxter L.C., Yaari R., Woodruff B.K., Hoffman-Snyder C., Rademakers R., Findley S., Reiman E.M., “Cerebrovascular risk factors and preclinical memory decline in healthy APOE ε4 homozygotes”, Neurology, Vol. 76, no. 12, 2011, pp. 1078-1084. 142. Bertram L., Lill C.M., Tanzi R.E., “The genetics of Alzheimer disease: back to the future”, Neuron, Vol. 68, no. 2, 2010, pp. 270-281. 143. Campion D., Dumanchin C., Hannequin D., Dubois B., Belliard S., Puel M., Thomas-Anterion C., Michon A., Martin C., Charbonnier F., Raux G., Camuzat A., Penet C., Mesnage V., Martinez M., Clerget-Darpoux F., Brice A., Frebourg T., “Early-onset autosomal dominant Alzheimer disease: prevalence, genetic heterogeneity, and mutation spectrum”, Am J Hum Genet, Vol. 65, no. 3, 1999, pp. 664-670.

67
144. Millan Sanchez M., Heyn S.N., Das D., Moghadam S., Martin K.J., Salehi A., “Neurobiological elements of cognitive dysfunction in Down Syndrome: exploring the role of APP”, Biol Psychiatry, Vol. 71, no. 5, 2011, pp. 403-409. 145. Rovelet-Lecrux A., Hannequin D., Raux G., Le Meur N., Laquerriere A., Vital A., Dumanchin C., Feuillette S., Brice A., Vercelletto M., Dubas F, Frebourg T., Campion D., “APP locus duplication causes autosomal dominant early-onset Alzheimer disease with cerebral amyloid angiopathy”, Nat Genet, Vol. 38, no. 1, 2006, pp. 24-26. 146. Brouwers N., Sleegers K., Engelborghs S., Bogaerts V., Serneels S., Kamali K., Corsmit E., De Leenheir E., Martin J.J., De Deyn P.P., Van Broeckhoven C., Theuns J., “Genetic risk and transcriptional variability of amyloid precursor protein in Alzheimer’s disease”, Brain, Vol. 129, no. 11, 2006, pp. 2984-2991. 147. Hock C., Konietzko U., Streffer J.R., Tracy J., Signorell A., Muller Tillmanns B., Lemke U., Henke K., Moritz E., Garcia E., Wollmer M.A., Umbricht D., de Quervain D.J., Hofmann M., Maddalena A., Papassotiropoulos A., Nitsch R.M., “Antibodies against beta amyloid slow cognitive decline in Alzheimer’s disease”, Neuron, Vol. 38, no. 4, 2003, pp. 547-554. 148. Corder E.H., Saunders A.M., Strittmatter W.J., Schmechel D.E., Gaskell P.C., Small G.W., Roses A.D., Haines J.L., Pericak-Vance M.A., “Gene dose of apolipoprotein E type 4 allele and the risk of Alzheimer’s disease in late onset families”, Science, Vol. 261, no. 5123,1993, pp. 921-923. 149. Genin E., Hannequin D., Wallon D., Sleegers K., Hiltunen M., Combarros O., Bullido M.J., Engelborghs S., De Deyn P., Berr C., Pasquier F., Dubois B., Tognoni G., Fiévet N., Brouwers N., Bettens K., Arosio B., Coto E., Del Zompo M., Mateo I., Epelbaum J., Frank-Garcia A., Helisalmi S., Porcellini E., Pilotto A., Forti P., Ferri R., Scarpini E., Siciliano G., Solfrizzi V., Sorbi S., Spalletta G., Valdivieso F., Vepsäläinen S., Alvarez V., Bosco P., Mancuso M., Panza F., Nacmias B., Bossù P., Hanon O., Piccardi P., Annoni G., Seripa D., Galimberti D., Licastro F., Soininen H., Dartigues J.F., Kamboh M.I., Van Broeckhoven C., Lambert J.C., Amouyel P., Campion D., “APOE and Alzheimer disease: a major gene with semi-dominant inheritance”, Mol Psychiatry, Vol. 16, no. 9, 2011, pp. 903-907. 150. Bird A., “DNA methylation patterns and epigenetic memory”, Genes Dev, Vol. 16, no. 6, 2002, pp. 6-21. 151. Day J.J., Sweatt J.D., “Epigenetic mechanisms in cognition”, Neuron, Vol. 70, no. 5, 2011, pp. 813-829. 152. Chouliaras L., Rutten B.P., Kenis G., Peerbooms O., Visser P.J., Verhey F., van Os J., Steinbusch H.W., van den Hove D.L., “Epigenetic regulation in the pathophysiology of Alzheimer’s disease”, Prog Neurobiol, Vol. 90, no. 4, 2010, pp. 498-510.

68
153. Gomez-Ramos A., Diaz-Hernandez M., Cuadros R., Hernandez F., Avila J., “Extracellular tau is toxic to neuronal cells”, FEBS letters, Vol. 580, no. 20, 2006, pp. 4842-4850. 154. Ravaglia S., Bini P., Sinforiani E., Franciotta D., Zardini E., Tosca P., Moglia A., Costa A., “Cerebrospinal fluid levels of tau phosphorylated at threonine 181 in patients with Alzheimer’s disease and vascular dementia”, Neurol Sci, Vol. 29, no. 6, 2008, pp. 417-423. 155. Dickson D.W., Crystal H.A., Bevona C., Honer W., Vincent I., Davies P., “Correlations of synaptic and pathological markers with cognition of the elderly”, Neurobiol Aging, Vol. 16, no. 3, 1995, pp. 285-298. 156. Hardy J.A., Higgins G.A., “Alzheimer’s disease: the amyloid cascade hypothesis”, Science, Vol. 256, no. 5054, 1992, pp. 184-185. 157. Selkoe D.J., “The molecular pathology of Alzheimer’s disease”, Neuron, Vol. 6, no. 4, 1991, pp. 487-498. 158. Crouch P.J., Harding S.M., White A.R., Camakaris J., Bush A.I., Masters C.L., “Mechanisms of A beta mediated neurodegeneration in Alzheimer’s disease”, Int J Biochem Cell Biol, Vol. 40, no. 2, 2008, pp. 181-198. 159. Praticò D., Trojanowski J.Q., “Inflammatory hypothesis: novel mechanisms of Alzheimer’s neurodegeneration and new therapeutic targets?”, Neurobiol Aging, Vol. 21, no. 3, 2000, pp. 441-445. 160. Turner P.R., O’ Connor K., Tate W.P., Abraham W.C., “Roles of amyloid precursors protein and its fragments in regulating neural activity, plasticity and memory”, Prog Neurobiol, Vol. 70, no. 1, 2003, pp. 1-32. 161. De Strooper B., Vassar R., Golde T., “The secretases: enzymes with therapeutic potential in Alzheimer disease”, Nat Rev Neurol, Vol. 6, no. 2, 2010, pp. 99-107. 162. Haass C., Selkoe D.J., “Cellular processing of beta amyloid precursor protein and the genesis of amyloid beta peptide”, Cell, Vol. 75, no. 6, 1993, pp. 1039-1042. 163. Li M., Chen L., Lee D.H., Yu L.C., Zhang Y., “The role of intracellular amyloid beta in Alzheimer’s disease”, Prog Neurobiol, Vol. 83, no. 3, 2007, pp. 131-139. 164. Haass C., Selkoe D.J., “Soluble protein oligomers in neurodegeneration: lessons from the Alzheimer’s amyloid beta-peptide”, Nat Rev Mol Cell Biol, Vol. 8, no. 2, 2007, pp. 101-112. 165. LaFerla F.M., Green K.N., Oddo S., “Intracellular amyloid-beta in Alzheimer’s disease”, Nat Rev Neurosci, Vol. 8, no. 7, 2007, pp. 499-509.

69
166. Mattson M.P., “Cellular actions of beta amyloid precursor protein and its soluble and fibrillogenic derivatives”, Physiol Rev, Vol. 77, no. 4, 1997, pp. 1081-1132. 167. Lu D.C., Rabizadeh S., Chandra S., Shayya R.F., Ellerby L.M., Ye X., Salvesen G.S., Koo E.H., Bredesen D.E., “A second cytotoxic proteolytic peptide derived from amyloid beta protein precursor”, Nat Med, Vol. 6, no. 4, 2000, pp. 397-404. 168. Leissring M.A., Murphy M.P., Mead T.R., Akbari Y., Sugarman M.C., Jannatipour M., Anliker B., Muller U., Saftig P., De Strooper B., Wolfe M.S., Golde T.E., LaFerla F.M., “A physiologic ost-morte role for the gamma secretase derived intracellular fragment of APP”, Proc Natl Acad Sci U S A, Vol. 99, no. 7, 2002, pp. 4697-4702. 169. Glabe C.G., Kayed R., “Common structure and toxic function of amyloid oligomers implies a common mechanism of pathogenesis”, Neurology, Vol. 66, no. 2 (Suppl 1), 2006, pp. 74-78. 170. Akiyama H., Barger S., Barnum S., Bradt B., Bauer J., Cole G.M., Cooper N.R., Eikelenboom P., Emmerling M., Fiebich B.L., Finch C.E., Frautschy S., Griffin W.S., Hampel H., Hull M., Landreth G., Lue L., Mrak R., Mackenzie I.R., McGeer P.L., O’Banion M.K., Pachter J., Pasinetti G., Plata-Salaman C., Rogers J., Rydel R., Shen Y., Streit W., Strohmeyer R., Tooyoma I., Van Muiswinkel F.L., Veerhuis R., Walker D., Webster S., Wegrzyniak B., Wenk G., Wyss-Coray T., “Inflammation in Alzheimer’s disease”, Neurobiol Aging, Vol. 21, no. 3, 2000, pp. 383-421. 171. Katzman R., Terry R., DeTeresa R., Brown T., Davies P., Fuld P., Renbing X., Peck A., “Clinical, pathological and neurochemical changes in dementia: a subgroup with preserved mental status and numerous neocortical plaques”, Ann Neurol, Vol. 23, no. 2, 1988, pp. 138-144. 172. Klunk W.E., Engler H., Nordberg A., Wang Y., Blomqvist G., Holt D.P., Bergström M., Savitcheva I., Huang G.F., Estrada S., Ausén B., Debnath M.L., Barletta J., Price J.C., Sandell J., Lopresti B.J., Wal A., Koivisto P., Antoni G., Mathis C., Langström B., “Alzheimer’s disease with Pittsburgh Compound-B”, Ann of Neurol, Vol. 55, no. 3, 2004, pp. 306-319. 173. Shoghi-Jadid K., Small G.W., Agdeppa E.D., Kepe V., Ercoli L.M., Siddarth P., Read S., Satyamurthy N., Petric A., Huang S.C., Barrio J.R., “Localization of neurofibrillary tangles and beta-amyloid plaques in the brains of living patients with Alzheimer disease”, Am J Geriatr Psychiatry, Vol. 10, no. 1, 2002, pp. 24-35. 174. Camus V., Payoux P., Barré L., Desgranges B., Voisin T., Tauber C., La Joie R., Tafani M., Hommet C., Chételat G., Mondon K., de La Sayette V., Cottier J.P., Beaufils E., Ribeiro M.J., Gissot V., Vierron E., Vercouillie J., Vellas B., Eustache F., Guilloteau D., “Using PET with 18F-AV-45 (florbetapir) to quantify brain amyloid load in a clinical environment”, Eur J Nucl Med Mol Imaging, Vol. 39, no. 4, 2012, pp. 621-631.

70
175. Skovronsky D., “Use of eINDs for evaluation of multiple related PET amyloid plaque imaging agents”, J Nuclear Med, Vol. 49, no. 6, 2008, pp. 47N-48N. 176. Rodrigue K.M., Kennedy K.M., Park D.C., “Beta-Amyloid Deposition and the Aging Brain”, Neuropsychol Rev, Vol. 19, no. 4, 2009, pp. 436-450. 177. Jack C.R. Jr., Lowe V.J., Senjem M.L., Weigand S.D., Kemp B.J., Shiung M.M., Knopman D.S., Boeve B.F., Klunk W.E., Mathis C.A., Petersen R.C., “11C PiB and structural MRI provide complementary information in imaging of Alzheimer’s disease and amnestic mild cognitive impairment”, Brain, Vol. 131, no. 3, 2008, pp. 665-680. 178. Aizenstein H.J., Nebes R.D., Saxton J.A., Price J.C., Mathis C.A., Tsopelas N.D., Ziolko S.K., James J.A., Snitz B.E., Houck P.R., Bi W., Cohen A.D., Lopresti B.J., DeKosky S.T., Halligan E.M., Klunk W.E., “Frequent amyloid deposition without significant cognitive impairment among the elderly”, Arch Neurol, Vol.65, no.11, 2008, pp. 1509-1517. 179. Pike K.E., Savage G., Villemagne V.L., Ng S., Moss S.A., Maruff P., Mathis C.A., Klunk W.E., Masters C.L., Rowe C.C., “Beta-amyloid imaging and memory in non-demented individuals: evidence for preclinical Alzheimer’s disease”, Brain, Vol. 130, no. 11, 2007, pp. 2837-2844. 180. Villemagne V.L., Pike K.E., Darby D., Maruff P., Savage G., Ng S., Ackermann U., Cowie T.F., Currie J., Chan S.G., Jones G., Tochon-Danguy H., O’Keefe G., Masters C.L., Rowe C.C., “Abeta deposits in older non-demented individuals with cognitive decline are indicative of preclinical Alzheimer’s disease”, Neuropsychologia, Vol. 46, no. 6, 2008, pp. 1688-1697. 181. Dickerson B.C., Bakkour A., Salat D.H., Feczko E., Pacheco J., Greve D.N., Grodstein F., Wright C.I., Blacker D., Rosas H.D., Sperling R.A., Atri A., Growdon J.H., Hyman B.T., Morris J.C., Fischi B., Bruckner R.L., “The cortical signature of Alzheimer’s disease: regionally specific cortical thinning relates to symptom severity in very mild to mild AD dementia and is detectable in asymptomatic amyloid-positive individuals”, Cereb Cortex, Vol. 19, no. 3, 2009, pp. 497-510. 182. Wolk D.A., Klunk W.E., “Update on Amyloid Imaging: From Healthy Aging to Alzheimer’s Disease”, Curr Neurol Neurosci Rep, Vol. 9, no. 5, 2009, pp. 345-352. 183. Rojo L.E., Fernàndez J.A., Maccioni A.A., Jimenez J.M., Maccioni R.B., “Neuroinflammation: Implications for the pathogenesis and molecular diagnosis of Alzheimer’s disease”, Arch Med Res, Vol. 39, no. 1, 2008, pp. 1-16. 184. McGeer E.G., McGeer P.L., “Inflammatory processes in Alzheimer’s disease”, Prog Neuropsychopharmacol Biol Psychiatry, Vol. 27, no. 5, 2003, pp. 741-7489. 185. Xiang Z., Haroutunian V., Ho L., Purohit D., Pasinetti G.M., “Microglia activation in the brain as inflammatory biomarker of Alzheimer’s disease

71
neuropathology and clinical dementia”, Dis Markers, Vol. 22, no. 1-2, 2006, pp. 95-102. 186. Hernandez F., Avila J., “Tauopathies”, Cell Mol Life Sci, Vol. 64, no. 17, 2007, pp. 2219-2233. 187. Braak H., Braak E., “Neuropathological stageing of Alzheimer-related changes”, Acta Neuropathol, Vol. 82, no. 4, 1991, pp. 239-259. 188. Delacourte A., David J., Sergeant N., Buee L., Wattez A., Vermersch P., Ghozali F., Fallet-Bianco C., Pasquier F., Lebert F., Petit H., Di Menza C., “The biochemical pathway of neurofibrillary degeneration in aging and Alzheimer’s disease”, Neurology, Vol. 52, no. 6, 1999, pp. 1158-1165. 189. Cras P., Smith M.A., Richey P.L., Siedlak S.L., Mulvihill P., Perry G., “Extracellular neurofibrillary tangles reflect neuronal loss and provide further evidence of extensive protein cross-linking in Alzheimer disease”, Acta neuropathol, Vol. 89, no. 4, 1995, pp. 291-295. 190. Avila J., “Intracellular and extracellular tau”, Front Neurosci, Vol. 4, no. 49, 2010. 191. Stamer K., Vogel R., Thies E., Mandelkow E., Mandelkow E.M., “Tau blocks traffic of organelles, neurofilaments, and APP vesicles in neurons and enhances oxidative stress”, J Cell Biol, Vol. 156, no. 6, 2002, pp. 1051-1063. 192. Alonso A.C., Li B., Grundke-Iqbal I., Iqbal K., “Polymerization of hyperphosphorylated tau into filaments eliminates its inhibitory activity”, Proc Natl Acad Sci U S A, Vol. 103, no. 23, 2006, pp. 8864-8869. 193. Alonso A.D., Grundke-Iqbal I., Barra H.S., Iqbal K., “Abnormal phosphorylation of tau and the mechanism of Alzheimer neurofibrillary degeneration: sequestration of microtubule-associated protein 1 and 2 and the disassembly of microtubules by the abnormal tau”, Proc Natl Acad Sci U S A, Vol. 94, no. 1, 1997, pp. 298-303. 194. Fevrier B., Vilette D., Archer F., Loew D., Faigle W., Vidal M., Laude H., Raposo G., “Cells release prions in association with exosome”, Proc Natl Acad Sci USA, Vol. 101, no. 26, 2004, pp. 9683-9688. 195. Kim W., Lee S., Jung C., Ahmed A., Lee G., Hall G.F., “Interneuronal transfer of human tau between Lamprey central neurons in situ”, J Alzheimers Dis, Vol. 19, no. 2, 2010, pp. 647-664. 196. Gomez-Ramos A., Diaz-Hernandez M., Rubio A., Miras-Portugal M.T., Avila J., “Extracellular tau promotes intracellular calcium increase through M1 and M3 muscarinic receptors in neuronal cells”, Mol Cell Neurosci, Vol. 37, no. 4, 2008, pp. 673-681.

72
197. Mrak R.E., Griffin W.S., “Glia and their cytokines in progression of neurodegeneration”, Neurobiol Aging, Vol. 26, no. 3, 2005, pp. 349-354. 198. Schwab C., Steele J.C., McGeer P.L., “Neurofibrillary tangles of Guam Parkinson dementia are associated with reactive microglia and complement proteins”, Brain Res, Vol. 707, no. 2, 1996, pp. 196-205. 199. Imamura K., Sawada M., Osaki N., Naito H., Iwata N., Ishihara R., Takeuchi T., Shibayama H., “Activation mechanism of brain microglia in patients with diffuse neurofibrillary tangles with calcification: a comparison with Alzheimer disease”, Alzheimer Dis Assoc Disord, Vol.15, no. 1, 2001, pp. 45-50. 200. Zilka N., Stozicka Z., Kovac A., Pilipcinec E., Bugos O., Novak M., “Human misfolded truncated tau protein promotes activation of microglia and leukocyte infiltration in the transgenic rat model of tauopathy”, J Neuroimmunol, Vol. 209, no. 1-2, 2009, pp. 16-25. 201. Zhang Y., Tian Q., Zhang Q., Zhou X., Liu S., Wang J.Z., “Hyperphosphorylation of microtubule-associated tau protein plays a dual role in neurodegeneration and neuroprotection”, Pathophysiology, Vol. 16, no. 4, 2009, pp. 311-316. 202. Li H.L., Wang H.H., Liu S.J., Deng Y.Q., Zhang Y.J., Tian Q., Wang X.C., Chen X.Q., Yang Y., Zhang J.Y., Wang Q., Xu H., Liao F.F., Wang J.Z., “Phosphorylation of tau antagonizes apoptosis by stabilizing beta-catenin, a mechanism involved in Alzheimer’s degeneration”, Proc Natl Acad Sci U S A, Vol. 104, no. 9, 2007, pp. 3591-3596. 203. Morales I., Farìas G., Maccioni R.B., “Neuroimmunomodulation in the pathogenesis of Alzheimer’s disease”, Neuroimmunomodulation, Vol. 17, no. 3, 2010, pp. 202-204. 204. Perry E.K., Perry R.H., Blessed G., Tomlinson G., “Necropsy evidence of central cholinergic deficits in senile dementia”, Lancet, Vol. 309, 1977, pp. 189. 205. Loy C., Schneider L., “Galantamine for Alzheimer’s disease and mild cognitive impairment”, Cochrane Database Syst Rev, Vol. 1, 2006, pp. CD001747. 206. Birks J., Harvey R.J., “Donepezil for dementia due to Alzheimer’s disease”, Cochrane Database of Syst Rev, Vol. 25, no. 1, 2006, pp. CD001190. 207. Rodda J., Morgan S., Walker Z., “Are cholinesterase inhibitors effective in the management of the behavioral and psychological symptoms of dementia in Alzheimer’s disease? A systematic review of randomized, placebo-controlled trials of donepezil, rivastigmine and galantamine”, Int Psychogeriatr, Vol. 21,no. 5, 2009, pp.813-824. 208. Tomita T., “Secretase inhibitors and modulators for Alzheimer’s disease treatment”, Expert Rev Neurother, Vol. 9, no. 5, 2009, pp. 661-679.

73
209. Gilman S., Koller M., Black R.S., Jenkins L., Griffith S.G., Fox N.C., Eisner L., Kirby L., Rovira M.B., Forette F., Orgogozo J.M., “Clinical effects of abeta immunization (AN1792) in patients with AD in an interrupted trial”, Neurology, Vol. 64, no. 9, 2005; pp. 1553-1562. 210. Holmes C., Boche D., Wilkinson D., Yadegarfar G., Hopkins V., Bayer A., Jones R.W., Bullock R., Love S., Neal J.W., Zotova E., Nicoll J.A., “Long-term effects of Abeta42 immunisation in Alzheimer’s disease: follow-up of a randomised, placebo-controlled phase I trial”, Lancet, Vol. 372, no. 9634, 2008, pp. 216-223. 211. Siemers E.R., Friedrich S., Dean R.A., et al. “Safety and biomarker effects of solanezumab in patients with Alzheimer’s Disease”, Alzheimers Dement , Vol. 8, no. 4, 2012, pp. 261-271. 212. Shankar G.M., Li S., Mehta T.H., Garcia-Munoz A., Shepardson N.E., Smith I., Brett F.M., Farrell M.A., Rowan M.J., Lemere C.A., Regan C.M., Walsh D.M., Sabatini B.L., Selkoe D.J., “Amyloid-beta protein ost-mo isolated directly from Alzheimer’s brains impair synaptic plasticity and memory”, Nat Med, Vol. 14, no. 8, 2008, pp. 837-842. 213. Tariot P.N., Schneider L.S., Cummings J., Thomas R.G., Raman R., Jakimovich L.J., Loy R., Bartocci B., Fleisher A., Ismail M.S., Porsteinsson A., Weiner M., Jack C.R.Jr., Thal L., Aisen P.S., Alzheimer’s Disease Cooperative Study Group, “Chronic divalproex sodium to attenuate agitation and clinical progression of Alzheimer disease”, Arch Gen Psychiatry, Vol. 68, no. 8, 2011, pp. 853-861. 214. Kurakhmaeva K.B., Djindjikhashvili I.A., Petrov V.E., Balabanyan V.U., Voronina T.A., Trofimov S.S., Kreuter J., Gelperina S., Begley D., Alyautdin R.N., “Brain targeting of nerve growth factor using poly (butylcyanoacrylate) nanoparticles”, J Drug Target, Vol. 17, no. 8, 2009, 564-574. 215. Hemming M.L., Selkoe D.J., Farris W., “Effects of prolonged angiotensin-converting enzyme inhibitor treatment on amyloid beta-protein metabolism in mouse models of Alzheimer disease”, Neurobiol Dis, Vol. 26, no. 1, 2007, pp. 273-28. 216. Galimberti D., Scarpini., “Inflammation and oxidative damage in Alzheimer’s disease: friend or foe?” Front Biosci, Vol. 3, 2011, pp. 252-266. 217. Perry V.H., Nicoll J.A., Holmes C., “Microglia in neurodegenerative disease”, Nat Rev Neurol, Vol. 6, no. 4, 2010, pp. 193-201. 218. Lee H.P., Zhu X., Casadesus G., Castellani R.J., Nunomura A., Smith M.A., Lee H.G., Perry G., “Antioxidant approaches for the treatment of Alzheimer’s disease”, Expert Rev Neurother, Vol. 10, no. 7, 2010, pp. 1201-1208.

74
219. Cole G.M., Frautschy S.A., “Mechanisms of action of non-steroidal anti-inflammatory drugs for the prevention of Alzheimer’s disease”, CNS Neurol Disord Drug Targets, Vol. 9, no. 2, 2010, pp. 140-148. 220. Bornemann K., Wiederhold K., Pauli C., Ermini F., Stalder M., Schnell L., Sommer B., Jucker M., Staufenbiel M., “Abeta-induced inflammatory processes in microglial cells of APP23 transgenic mice”, Am J Pathol, Vol. 158, no. 1, 2001, pp. 63-73. 221. Bolmont T., Haiss F., Eicke D., Radde R., Mathis C., Klunk W., Kohsaka S., Jucker M., Calhoun M., “Dynamics of the microglial/amyloid interaction indicate a role in plaque maintenance”, J Neurosci, Vol. 28, no. 16, 2008, pp. 4283-4292. 222. Cartier L., Hartley O., Dubois-Dauphin M., Krause K.H., “Chemokine receptors in the central nervous system: role in brain inflammation and neurodegenerative diseases”, Brain Res, Vol. 48, no. 1, 2005, pp. 16-42. 223. Heppner F.L., Greter M., Marino D., Falsig J., Raivich G., Hovelmeyer N., Waisman A., Rulicke T., Prinz M., Priller J., “Experimental autoimmune encephalomyelitis repressed by microglial paralysis”, Nat Med, Vol. 11, no. 2, 2005, pp. 146-152. 224. Boje K.M., Arora P.K., “Microglial-produced nitric oxide and reactive nitrogen oxides mediate neuronal cell death”, Brain Res, Vol. 587, no. 2, 1992, pp. 250-256. 225. Chao C.C., Hu S., Molitor T.W., Shaskan E.G., Peterson P.K., “Activated microglia mediate neuronal cell injury via a nitric oxide mechanism”, J Immunol, Vol. 149, no. 8, 1992, pp. 2736-2741. 226. Fournier A.E., Strittmatter S.M., “Regenerating nerves follow the road more travelled”, Nat Neurosci, Vol. 5, no. 9, 2002, pp. 821-822. 227. Goldberg J.L., Barres B.A., “The relationship between neuronal survival and regeneration”, Annu Rev Neurosci, Vol. 23, 2000, pp. 579-612. 228. Björklund A., Lindvall O., “Self-repair in the brain”, Nature, Vol. 405, no. 6789, 2000, pp. 892-895. 229. Klegeris A., McGeer P.L., “Non- steoroidal anti-inflammatory drugs (NSAIDs) and other anti-inflammatory agents in the treatment of neurodegenerative disease”, Curr Alzheimer Res, Vol. 2, no. 3, 2005, pp. 355-365. 230. McGeer P.L., McGeer E.G., “NSAIDs and Alzheimer disease: epidemiological, animal model and clinical studies”, Neurobiol Aging, Vol. 28, no. 5, 2007, pp. 639-647. 231. von Bernhardi R., “Glial cell dysregulation: a new perspective on Alzheimer disease”, Neurotox Res, Vol. 12, no. 4, 2007, pp. 215-232.

75
232. Streit W.J., Sammons N.W., Kuhns A.J., Sparks D.L., “Dystrophic microglia in the aging human brain”, Glia, Vol. 45, no. 2, 2004, pp. 208-212. 233. Streit W.J., Braak H., Xue Q.S., Bechmann I., “Dystrophic (senescent) rather than activated microglial cells are associated with tau pathology and likely precede neurodegeneration in Alzheimer’s disease”, Acta Neuropathol, Vol. 118, no. 4, 2009, pp. 475-485. 234. Conde J.R., Streit W.J., “Microglia in the aging brain”, J Neuropathol Exp Neurol, Vol. 65, no. 3, 2006, pp. 199-203. 235. Perry V.H., Matyszak M.K., Fearn S., “Altered antigen expression of microglia in the aged rodent CNS”, Glia, Vol. 7, no. 1, 1993, pp. 60-67. 236. Conde J.R., Streit W.J., “Effect of aging on the microglial response to peripheral nerve injury”, Neurobiol Aging, Vol. 27, no. 10, 2006, pp. 1451-1461. 237. Streit W.J., “Microglia and neuroprotection: implications for Alzheimer’s disease”, Brain Res Brain Res, Vol. 48, no. 2, 2005, pp. 234-239. 238. Walker D.G., Link J., Lue L.F., Dalsing-Hernandez J.E., Boyes B.E., “Gene expression changes by amyloid-beta peptide- stimulated human ost-mortem rain microglia identify activation of multiple inflammatory processe”, J Leukoc Biol, Vol. 79, no. 3, 2006, pp. 596-610. 239. Patel N., Paris D., Mathura V., Quadros A., Crawford F., Mullan M., “Inflammatory cytokine levels correlate with amyloid load in transgenic mouse models of Alzheimer’s disease”, J Neuroinflammation, Vol. 2, no. 1, 2005, pp. 9. 240. Lehnardt S., Lachance C., Patrizi S., Lefebvre S., Follett P.L., Jensen F.E., Rosenberg P.A., Volpe J.J., Vartanian T., “The toll-like receptor TLR4 is necessary for lipopolysaccharide-induced oligodendrocyte injury in the CNS”, J Neurosci, Vol. 22, no. 7, 2002, pp. 2478-2486. 241. Lehnardt S., Massillon L., Follett P., Jensen F.E., Ratan R., Rosenberg P.A., Volpe J.J., Vartanian T., “Activation of innate immunity in the CNS triggers neurodegeneration through a Toll-like receptor 4-dependent pathway”, Proc Natl Acad Sci U S A, Vol. 100, no. 14, 2003, pp. 8514-8519. 242. Walter S., Letiembre M., Liu Y., Heine H., Penke B., Hao W., Bode B., Manietta N., Walter J., Shulz-Shaffer, Fassebender K., “Role of the Toll-like receptor 4 in neuroinflammation in Alzheimer’s disease”, Cell Physiol Biochem, Vol. 20, no. 6, 2007, pp. 947-956. 243. Babcock A.A., Wirenfeldt M., Holm T., Nielsen H.H., Dissing-Olesen L., Toft-Hansen H., Millward J.M., Landmann R., Rivest S., Finsen B., Owens T., “Toll-like receptor 2 signaling in response to brain injury, an innate bridge to neuroinflammation”, J Neurosci, Vol. 26, no. 49, 2006, pp.12826-12837.

76
244. Udan M., Ajit D., Crouse N., Nichols M., “Toll-like receptors 2 and 4 mediate Aβ (1-42) activation of the innate immune response in a human monocytic cell line”, J Neurochemistry, Vol. 104, no. 2, 2008, pp. 524-533. 245. Bate C., Veerhuis R., Eikelenboom P., Williams A., “Microglia kill amyloid-beta1-42 damaged neurons by a CD14-dependent process”, Neuroreport, Vol. 15, no. 9, 2004, pp. 1427-1430. 246. Fiala M., Lin J., Ringman J., Kermani-Arab V., Tsao G., Patel A., Lossinsky A.S., Graves M.C., Gustavson A., Sayre J., Sofroni E., Suarez T., Chiappelli F., Bernard G., “Ineffective phagocytosis of amyloid-beta by macrophages of Alzheimer’s disease patients”, J Alzheimers Dis, Vol. 7, no. 3, 2005, pp. 221-232. 247. Ishizuka K., Rimura T., Igata-yi R., Katsuragi S., Takamatsu J., Miyakawa T., “Identification of monocyte chemoattractant protein-1 in senile plaques and reactive microglia of Alzheimer’s disease”, Psychiatry Clin Neurosci, Vol. 51, no. 3, 1997, pp. 135-138. 248. El Khoury J., Toft M., Hickman S.E., Means T.K., Tereda K., Geula C., Luster A.D., “Ccr2 deficiency impairs microglia accumulation and accelerates progression of Alzheimer-like disease”, Nat Med, Vol. 13, no. 4, 2007, pp. 432-438. 249. Rezai-Zadeh K., Gate D., Town T., “CNS infiltration of peripheral immune cells: D-Day for neurodegenerative disease?”, J Neuroimmune Pharmacol, Vol. 4, no. 4, 2009, pp. 462-475. 250. Hawkes C.A., McLaurin J., “Selective targeting of perivascular macrophages for clearance of beta-amyloid in cerebral amyloid angiopathy”, Proc Natl Acad Sci U S A, Vol. 106, no. 4, 2009, pp. 1261-1266. 251. McKhann G., Drachman D., Folstein M., Katzman R., Price D., Stadlan E.M., “Clinical diagnosis of Alzheimer’s Disease: report of the NINCDS-ADRDA Work Group under the auspices of Department of Health and Human Service Task Force on Alzheimer’s Disease”, Neurology, Vol. 34, no. 7, 1984, pp. 939-944. 252. Folstein M.F., Folstein S.E., McHugh P.R., ““Mini-mental state”. A practical method for grading the cognitive state of patients for the clinicians”, J Psychiat Res, Vol. 12, no. 3, 1975, pp. 189-198. 253. Hughes C.P., Berg L., Danziger W.L., Coben L.A., Martin R.L., “A new clinical scale for staging of dementia”, Br J Psychiatry, Vol. 140, 1982, pp. 566-572. 254. Ligthart G.J., Corberand J.X., Fournier C., Galanaud P., Hijmans W., Kennes B., Müller-Hermelink H.K., Steinmann G.G., “Admission criteria for immunogerontological studies in man: the SENIEUR protocol”, Mech Ageing Dev, Vol. 28, no. 1, 1984, pp. 47-55.

77
255. Speciale L., Calabrese E., Saresella M., Tinelli C., Mariani C., Sanvito L., Longhi R., Ferrante P., “Lymphocyte subset patterns and cytokines production in Alzheimer’s disease patients”, Neurbiol Aging, Vol. 28, no. 8, 2007, pp. 1163-1169. 256. Lyons A.B., “Analysing cell division in vivo and in vitro using flow cytometric measurement of CFSE dye dilution”, J Immunol Methods, Vol. 243, no. 1-2-, 2000, pp. 147-154. 257. Saresella M., Marventano I., Guerini F.R., Zanzottera M., Delbue S., Marchioni E., Macerati R., Longhi R., Ferrante P., Clerici M., “Myelin Basic Protein-Specific T Lymphocytes Proliferation and Programmed Cell Death in Demyelinating Diseases”, Clin Imm, Vol. 129, no. 3, 2008, pp. 509-517. 258. Gitter B.D., Cox L.M., Rydel L.E., May P.C., “Amyloid beta peptide potentiates cytokine secretion by interleukin-1 beta-activated human astrocytoma cells”, Proc Natl Acad Sci U S A, Vol. 92, no. 23, 1995, pp. 10738-10741. 259. Shoji M., Kanai M., “Cerebrospinal fluid Abeta40 and Abeta42: Natural course and clinical usefulness”, J Alzheimers Dis, Vol. 3, no. 3, 2001, pp. 313-321. 260. Strazielle N., Ghersi-Egea J.F., Ghiso J., Dehouck M.P., Frangione B., Patlak C., Fenstermacher J., Gorevic P., “In vitro evidence that beta-amyloid peptide 1-40 diffuses across the blood-brain barrier and affects its permeability”, J Neuropathol Exp Neurol, Vol. 59, no. 1, 2000, pp. 29-38. 261. Crawford M.P., Yan S.X., Ortega S.B., Mehta R.S., Hewitt R.E., Price D.A., Stastny P., Douek D.C., Koup R.A., Racke M.K., Karandikar N.J., “High prevalence of autoreactive, neuroantigen-specific CD8+ T cells in multiple sclerosis revealed by novel flow cytometric assay”, Blood, Vol. 103, no. 11, 2004, pp. 4222-4231. 262. Fehérvari Z., Sakaguchi S., “CD4+ Tregs and immune control”, J Clin Invest, Vol. 114, no. 9, 2004, pp. 1209-1217. 263. Kim Y.S., Joh T.H., “Microglia, major player in the brain inflammation: their roles in the pathogenesis of Parkinson’s disease”, Exp Mol Med, Vol. 38, no. 4, 2006, pp. 333-347. 264. Town T., Laouar Y., Pittenger C., Mori T., Szekely C.A., Tan J., Duman R.S., Flavell R.A., “Blocking TGF-beta- Smad2/ 3 innate immune signaling mitigates Alzheimer-like pathology”, Nat Med, Vol. 14, no. 6, 2008, pp. 681-687. 265. Mattila K.M., Pirttila T., Blennow K., Wallin A., Viitanen M., Frey H., “Altered blood- brain-barrier function in Alzheimer’s disease?”, Acta Neurol Scand, Vol. 89, no. 3, 1994, pp. 192-198. 266. Vugler A., Lawrence J., Walsh J., Carr A., Gias C., Semo M., Ahmado A., da Cruz L., Andrews P., Coffey P., “Embryonic stem cells and retinal repair”, Mech Dev, Vol. 124, no. 11-12, 2007, pp. 807-829.
78
267. Speciale L., Ruzzante S., Calabrese E., Saresella M., Taramelli D., Mariani C., Bava L., Longhi R., Ferrante P., “1-40 β-amyloid protein fragment modulates the expression of CD44 and CD71 on the astrocytoma cell line in the presence of IL-1β and TNFα”, J Cell Physiol, Vol. 196, no. 1, 2003, pp. 190-195. 268. Lynch M.A., “The multifaceted profile of activated microglia”, Mol Neurobiol, Vol. 40, no. 2, 2009, pp. 139-156. 269. Shaftel S.S., Carlson T.J., Olschowka J.A., Kyrkanides S., Matousek S.B., O’Banion M.K., “Chronic interleukin1beta expression in mouse brain leads to leukocyte infiltration and neutrophilin dependent blood brain barrier permeability without overt neurodegeneration”, J Neurosci, Vol. 27, no. 35, 2007, pp. 9301-9309. 270. Tan J., Town T., Mullan M., “CD40-CD40L interaction in Alzheimer’s disease”, Curr Opin Pharmacol, Vol. 2, no. 4, 2002, pp. 445-451. 271. Rosenkranz D., Weyer S., Tolosa E., Gaenslen A., Berg D., Leyhe T., Gasser T., Stoltze L., “Higher frequency of regulatory T cells in the elderly and increased suppressive activity in neurodegeneration”, J Neuroimmunol, Vol. 188, no. 1-2, 2007, pp. 117-127. 272. Larbi A., Pawelec G., Witkowski J.M., Schipper H.M., Derhovanessian E., Goldeck D., Fulop T., “Dramatic shifts in circulating CD4 but not CD8 T cell subsets in mild Alzheimer’s disease”, J Alzheimers Dis, Vol. 17, no. 1, 2009, pp. 91-103. 273. Bryl E., Witkowski J.M., “Decreased proliferative capability of CD4 (+) cells of elderly people is associated with faster loss of activation related antigens and accumulation of regulatory T cells”, Exp Gerontol, Vol. 39, no. 4, 2004, pp. 587-595. 274. Cortesini R., LeMaoult J., Ciubotariu R., Cortesini N.S., “CD8+CD28−T suppressor cells and the induction of antigen specific, antigen presenting cell mediated suppression of Th reactivity”, Immunol Rev, Vol. 182, 2001, pp. 201-206. 275. Suciu-Foca N., Manavalan J.S., Scotto L., Kim-Schulze S., Galluzzo S., Naiyer A.J., Fan J., Vlad G., Cortesini R., “Molecular characterization of allospecific T suppressor and tolerogenic dendritic cells: review”, Int Immunopharmacol, Vol. 5, no. 1, 2005, pp. 7-11. 276. Saresella M., Rainone V., Al-Daghri N.M., Clerici M., Trabattoni D., “The PD-1/PD-L1 pathway in human pathology”, Curr Mol Med, Vol. 12, no. 3, 2012, pp. 259-67. 277. Keir M.E., Francisco L.M., Sharpe A.H., “PD-1 and its ligands in T-cell immunity”, Curr Opin Immunol, Vol. 19, no. 3, 2007, pp. 309-314. 278. Selenko-Gebauer N., Majdic O., Szekeres A., Höfler G., Guthann E., Korthäuer U., Zlabinger G., Steinberger P., Pickl W.F., Stockinger H., Knapp W.,

79
Stöckl J., “B7-H1 (programmed death-1 ligand) on dendritic cells is involved in the induction and maintenance of T cell anergy”, J immunol, Vol. 170, no. 7, 2003, pp. 3637-3644. 279. Dong H., Chen L., “B7-H1 pathway and its role in the evasion of tumor immunity”, J Mol Med, Vol. 81, no. 5, 2003, pp. 281-287. 280. Trabattoni D., Saresella M., Biasin M., Boasso A., Piacentini L., Ferrante P., Dong H., Maserati R., Shearer G.M., Chen L., Clerici M., “B7-H1 is up-regulated in HIV infection and is a novel surrogate marker of disease progression”, Blood, Vol. 101, no. 7, 2003, pp. 2514-2520. 281. Ma S.L., Tang N.L., Lam L.C., Chiu H.F., “The association between promoter polymorphism of the interleukin-10 gene and Alzheimer’s disease”, Neurobiol Aging, Vol. 26, no. 7, 2005, pp. 1005-1010. 282. Castle S.C., Uyemura K., Crawford W., Wong W., Klaustermeyer W.B., Makinodan T., “Age-related impaired proliferation of peripheral blood mononuclear cells is associated with an increase in both IL-10 and IL-12”, Exp Gerontol, Vol. 34, no. 2, 1999, pp. 243-252. 283. Lio D., Scola L., Crivello A., Colonna-Romano G., Candore G., Bonafè M., Cavallone L., Franceschi C., Caruso C., “Gender specific association between -1082 IL-10 promoter polymorphism and longevity”, Genes Immun, Vol. 3, no. 1, 2002, pp. 30-33. 284. Keir M.E., Latchman Y.E., Freeman G.J., Sharpe A.H., “Programmed death-1 (PD-1): PD-ligand 1 interactions inhibit TCR-mediated positive selection of thymocytes”, J Immunol, Vol. 175, no. 11, 2005, pp. 7372-7379. 285. Guleria I., Khosroshahi A., Ansari M.J., Habicht A., Azuma M., Yagita H., Noelle R.J., Coyle A., Mellor A.L., Khoury S.J., Sayegh M.H., “A critical role for the programmed death ligand 1 in fetomaternal tolerance”, J Exp Med, Vol. 202, no. 2, 2005, pp. 231-237. 286. Hori J., Wang M., Miyashita M., Tanemoto K., Takahashi H., Takemori T., Okumura K., Yagita H., Azuma M., “B7-H1-induced apoptosis as a mechanism of immune privilege of corneal allografts”, J Immunol, Vol. 177, no. 9, 2006, pp. 5928-5935. 287. Schwartz M., Shechter R., “Systemic inflammatory cells fight off neurodegenerative disease”, Nat Rev Neurol, Vol. 6, no. 7, 2010, pp. 405-410. 288. Trabattoni D., Saresella M., Pacei M., Marventano I., Mendozzi L., Rovaris M., Caputo D., Borelli M., Clerici M., “Costimulatory pathways in multiple sclerosis: Distinctive expression of PD-1 and PD-L1 in patients with different patterns of disease”, J Immunol, Vol. 183, no. 8, 2009, pp. 4984-4993.

80
289. Liang S.C., Latchman Y.E., Buhlmann J.E., Tomczak M.F., Horwitz B.H., Freeman G.J., Sharpe A.H., “Regulation of PD-1, PD-L1, and PD-L2 expression during normal and autoimmune responses”, Eur J Immunol, Vol. 33, no. 10, 2003, pp. 2706-2716. 290. Tan J., Town T., Suo Z., Wu Y., Song S., Kundtz A., Kroeger J., Humphrey J., Crawford F., Mullan M., “Induction of CD40 on human endothelial cells by Alzheimer’s beta-amyloid peptides”, Brain Res Bull, Vol. 50, no. 2, 1999, pp. 143-148. 291. Lombardi V.R., Garcia M., Rey L., Cacabelos R., “Characterization of cytokine production, screening of lymphocyte subset patterns and in vitro apoptosis in healthy and Alzheimer’s Disease (AD) individuals”, J Neuroimmunol, Vol. 97, no. 1-2, 1999, pp. 163-171. 292. D’Mello C., Le T., Swain M.G., “Cerebral microglia recruit monocytes into the brain in response to tumor necrosis factor alpha signaling during peripheral organ inflammation”, J Neurosci, Vol. 29, no. 7, 2009, pp. 2089-2102. 293. Dienz O., Eaton S.M., Krahl T.J., Diehl S., Charland C., Dodge J., Swain S.L., Budd R.C., Haynes L., Rincon M., “Accumulation of NFAT mediates IL-2 expression in memory, but not naïve, CD4+ T cells”, Proc Natl Acad Sci U S A, Vol. 104, no. 17, 2007, pp. 7175-7180. 294. Chaudhry A., Samstein R.M., Treuting P., Liang Y., Pils M.C., Heinrich J.M., Jack R.S., Wunderlich F.T., Brüning J.C., Müller W., Rudensky A.Y., “Interleukin-10 signaling in regulatory T cells is required for suppression of Th17 cell-mediated inflammation”, Immunity, Vol. 34, no. 4, 2011, pp. 566-578. 295. Strle K., Zhou J.H., Shen W.H., Broussard S.R., Johnson R.W., Freund G.G., Dantzer R., Kelley K.W., “Interleukin-10 in the brain”, Crit Rev Immunol, Vol. 21, no. 5, 2011, pp. 427-449. 296. Qian L., Hong J.S., Flood P.M., “Role of microglia in inflammation-mediated degeneration of dopaminergic neurons: neuroprotective effect of interleukin 10”, J Neural Transm Suppl, Vol. 70, 2006, pp. 367-371. 297. Bermejo P., Martin-Aragon S., Benedi J., Susin C., Felici E., Gil P., Ribera J.M., Villar A.M., “Differences of peripheral inflammatory markers between mild cognitive impairment and Alzheimer’s disease”, Immunol Lett, Vol. 117, no. 2, 2008, pp. 198-202. 298. Koronyo-Hamaoui M., Ko M.K., Koronyo Y., Azoulay D., Seksenyan A., Kunis G., Pham M., Bakhsheshian J., Rogeri P., Black K.L., Farkas D.L., Schwartz M., “Attenuation of AD-like neuropathology by harnessing peripheral immune cells: local elevation of IL-10 and MMP-9”, J Neurochem, Vol. 111, no. 6, 2009, pp. 1409-1424.

81
299. Bauer J., Strauss S., Schreiter-Gasser U., Ganter U., Schlegel P., Witt I., Yolk B., Berger M., “Interleukin-6 and alpha-2-macroglobulin indicate an acute-phase state in Alzheimer’s disease cortices”, FEBS Lett, Vol. 285, no. 1, 1991, pp. 111-114. 300. Strauss S., Bauer J., Ganter U., Jonas U., Berger M., Volk B., “Detection of interleukin-6 and alpha 2-macroglobulin immunoreactivity in cortex and hippocampus of Alzheimer’s disease patients”, Lab Invest, Vol. 66, no. 2, 1992, pp. 223-230. 301. Langrish C.L., Chen Y., Blumenschein W.M., Mattson J., Basham B., Sedgwick J.D., McClanahan T., Kastelein R.A., Cua D.J., “IL-23 drives a pathogenic T cell population that induces autoimmune inflammation”, J Exp Med, Vol. 201, no. 2, 2005, pp. 233-240. 302. McGeachy M.J., Bak-Jensen K.S., Chen Y., Tato C.M., Blumenschein W., McClanahan T., Cua D.J., “TGF-beta and IL-6 drive the production of IL-17 and IL-10 by T cells and restrain T(H)-17 cell-mediated pathology”, Nat Immunol, Vol. 8, no. 12, 2007, pp. 1390-1397. 303. Spolski R., Leonard W.J., “Cytokine mediators of Th-17 function”, Eur J Immunol, Vol. 39, no. 3, 2009, pp. 658-661. 304. Monteleone G., Pallone F., MacDonald T.T., “Interleukin-21: a critical regulator of the balance between effector and regulatory T-cell responses”, Trends Immunol, Vol. 29, no. 6, 2008, pp. 290-294. 305. Ghoreschi K., Laurence A., Yang X.P., Tato C.M., McGeachy M.J., Konkel J.E., Ramos H.L., Wei L., Davidson T.S., Bouladoux N., Grainger J.R., Chen Q., Kanno Y., Watford W.T., Sun H.W., Eberl G., Shevach E.M., Belkaid Y., Cua D.J., Chen W., O’Shea J.J., “Generation of pathogenic T(H)17 cells in the absence of TGF- Nature, Vol. 467, no. 7318, 2010, pp. 967-971. 306. Townsend J.M., Fallon G.P., Matthews J.D., Smith P., Jolin E.H., McKenzie N.A., “IL-9-deficient mice establish fundamental roles for IL-9 in pulmonary mastocytosis and goblet cell hyperplasia but not T cell development”, Immunity, Vol. 13, no. 4, 2000, pp. 573-583. 307. Forbes E.E., Groschwitz K., Abonia J.P., Brandt E.B., Cohen E., Blanchard C., Ahrens R., Seidu L., McKenzie A., Strait R., Finkelman F.D., Foster P.S., Matthaei K.I., Rothenberg M.E., Hogan S.P., “IL-9- and mast cell-mediated intestinal permeability predisposes to oral antigen hypersensitivity”, J Exp Med, Vol. 205, no. 4, 2008, pp. 897-913. 308. Elyaman W., Bradshaw E.M., Uyttenhove C., Dardalhon V., Awasthi A., Imitola J., Bettelli E., Oukka M., van Snick J., Renauld J.C., Kuchroo V.K., Khoury S.J., “IL-9 induces differentiation of TH-17 cells and enhances function of FoxP3+ natural regulatory T cells”, Proc Natl Acad Sci U S A, Vol. 106, no. 31, 2009, pp. 12885-12890.

82
309. Demoulin J.B., Uyttenhove C., Van Roost E., DeLestre B., Donckers D., Van Snick J., Renauld J.C., “A single tyrosine of the interleukin-9 (IL-9) receptor is required for STAT activation, antiapoptotic activity, and growth regulation by IL-9”, Mol Cell Biol, Vol. 16, no. 9, 1996, pp. 4710-4716. 310. Demoulin J.B., Van Roost E., Stevens M., Groner B., Renauld J.C., “Distinct roles for STAT1, STAT3, and STAT5 in differentiation gene induction and apoptosis inhibition by interleukin-9”, J Biol Chem, Vol. 274, no. 36, 1999, pp. 25855-25861. 311. Schenal M., Lo Caputo S., Fasano F., Vichi F., Saresella M., Pierotti P., Villa M.L., Mazzotta F., Trabattoni D., Clerici M., “Distinct patterns of HIV-specific memory T lymphocytes in HIV-exposed uninfected individuals and in HIV-infected patients”, AIDS, Vol. 19, no. 7, 2005, pp. 653-661.

83
8. TABLES AND FIGURES
Table 1
mAbs clone isotype source company fluorescence
AV IgG1k mouse Beckman-Coulter FITC
BDNF 35909 IgG1 mouse R&D Systems PE
CCR7 3D12 IgG2a,k rat BD PE
CD14 RM052 IgG2b mouse Beckman-Coulter PC5 or FITC
CD19 J3.119 IgG1 mouse Beckman-Coulter PC5
CD25 B1.49.9 IgG2a mouse Beckman-Coulter ECD
CD3 UCHT1 IgG1 mouse Beckman-Coulter PE
CD4 SFCI12T4D11 IgG1 mouse Beckman-Coulter PC7
CD45RA MEM56 IgG2b mouse Caltag Laboratories FITC
CD8 SFCI21Thy2D3 IgG1 mouse Beckman-Coulter PC5
FOXP3 PCH101 IgG2a,k mouse eBioscience FITC
GATA3 TWAY IgG2b,k rat eBioscience PE
IFN 4S.B3 IgG1k mouse eBioscience PC5
IL-10 JES9D7 IgG1 mouse eBioscience PE
IL-12 27537 IgG1 mouse R&D Systems FITC
IL-17 BL168 IgG1k mouse Biolegend FITC
IL-21 3A3-N2 IgG1 mouse eBioscience PE
IL-22 142928 IgG1 mouse R&D Systems PE
IL-23 C11.5 IgG1k mouse Biolegend PE
IL-4 MP4-25D2 IgG1k rat eBioscience FITC
IL-6 1936 IgG2b mouse R&D Systems FITC
IL-9 MH9A4 IgG2b,k mouse Biolegend PE
Ki67 B56 IgG1k mouse BD FITC
NFATc H-10 IgG1 mouse Santa Cruz Biotech PE
NFkB C-5 IgG2a mouse Santa Cruz Biotech FITC
PD-1 MIH4 IgG1 mouse eBioscience PE
PD-L1 MIH1 IgG1 mouse eBioscience PC7
RORc/ AFJS-9 IgG2a rat eBioscience PE
Tbet 39D IgG1 mouse eBioscience PE
TGF 9016 IgG1 mouse R&D Systems PE
Table 1 Monoclonal antibodies used in this study.

84
Table 2
MEDIAN MFI (Interquartile range)
AD MCI HC p-value
CD4+/PD-1+ 15 (5-21) 14 (5-20) 19 (17-21) n.s.
CD8+/PD-1+ 0 (0.0-0.0) 0 (0.0-0.0) 0 (0.0-0.0) n.s.
CD14+/PD-L1+ 30 (26-42)* 20 (13-28)** 60 (55-61)*,**
p=0,008* p=0,005**
CD19+/PD-L1+ 0 (0.0-0.0) 0 (0.0-0.0) 0 (0.0-0.0) n.s.
Table 2 MFI of PD-1 on A stimulated CD4+ and CD8
+ T lymphocytes and of PD-
L1 on CD14+ and CD19
+ cells of patients with a diagnosis of either AD, MCI and
HC. PD-1 and PD-L1 MFI values were calculated on MFI- positive cells. Medians, interquartile ranges and statistical values are shown. n.s.= not significant. Table 3
AD MCI HC p-value
CD4+/CCR7
+/45RA
+
(naive) 1.4
(0.2-9.3)* 2.2
(1-2.6)** 12.1
(8.2-16.9)*,**
p=0.03* p=0.01**
CD4+/CCR7
+/45RA
neg
(central memory) 17.1
(12.3-34.6)* 11
(6.1-11.8)** 38.1
(38-41.2)*,**
p=0.04* p<0.001**
CD4+/CCR7
neg/45RA
neg
(effector memory) 68.6
(53.7-79.2)* 73
(68.5-86.1)** 35.7
(30.3-47)*,**
p=0.01* p=0.002**
CD4+/CCR7
neg/45RA
+
(terminally differentiated)
4.6 (2.2-5.5)*
9 (2.4-14)**
1 (0.1-2.7)*
,**
p=0.01* p=0.04**
Table 3 A- stimulated subsets of CD4+ T lymphocytes in patients with a
diagnosis of AD or MCI and in HC; medians, interquartile ranges and statistical values are shown.

85
Table 4
MEDIAN MFI (Interquartile range)
AD MCI HC p-value
CD4+/T-bet 15 (12.7-18.2) 15 (12-18.5) 12.5 (12-16.75) n.s.
CD4+/RORc/ 31 (23.5-40.2)* 14 (13.5-18)** 0.0 (0.0-12)*,**
p=0.01* p=0.08**
CD4+/GATA-3 5 (0.0-15)** 21 (8.5-20)**,* 6 (0.0-13)*
p=0.02* p=0.03**
CD4+/NFATc 5 (0.0-20.5)* 0.0 (0.0-16) 0.0 (0.0-12)* p=0.04*
CD4+/NFkb 0.0 (0.0-15) 0.0 (0.0-13) 0.0 (0.0-12) n.s.
CD4+/IFN 0.0 (0.0-12) 0.0 (0.0-18) 0.0 (0.0-11.5) n.s.
CD4+/IL-9 23 (20-25)*,** 15 (9-15.7)** 13 (0.0-15)*
p=0.02* p=0.01**
CD4+/IL-17 0.0 (0.0-15) 0.0 (0.0-17) 0.0 (0.0-12) n.s.
CD4+/IL-21 12 (0.0-23)* 0.0 (0.0-17) 0.0 (0.0-9)* p=0.02*
CD4+/IL-22 22 (15-26.5)* 14 (12-22)** 15 (0.0-15)*,**
p=0.001* p=0.03**
CD4+/IL-4 0.0 (0.0-10) 0.0 (0.0-13) 15 (0.0-15) n.s.
CD14+/TGF 42 (26.2-62.5) 21 (0.0-39) 29 (18-38.5) n.s.
CD14+/IL-12p35
7.5 (0.0-20) 0.0 (0.0-16.7) 13.5 (0.0-22.7) n.s.
CD14+/IL-23 0.0 (0.0-20) 0.0 (0.0-25) 18.5 (9-25.2) n.s.
CD14+/IL-6 30.5 (17.2-41.2) 22 (15-36) 28 (16.7-34.5) n.s.
CD14+/IL-10 6 (0.0-18.5)* 12 (2.7-18.7)** 39 (33-48.5)*,**
p<0.001* p<0.001**
Table 4 MFI of transcription factor and cytokines in A- stimulated CD4+ T
lymphocytes or CD14+ cells of patients with AD or MCI and in HC. MFI values
were calculated on MFI- positive cells. Medians, interquartile ranges and statistical values are shown. n.s.= not significant.

86
Figure 1 Data observed in a representative MCI patient are shown. A) Expression of CD25
high T lymphocytes on CD4
+ cells. B) Expression of
intracellular FOXP3; cells gated on CD4+. C) Intracellular co-expression of PD-1
(PD-1neg
cells) and FOXP3, gated on CD4+CD25
high, representing naïve Treg
subpopulation. D) Co-expression of surface PD-1 (PD-1+ cells) and intracellular
FOXP3, gated on CD4+CD25
high, representing activated Treg cells. E) Surface
expression of PD-1 (PD-1+ cells), gated on CD4
+CD25
high cells. F) Intracellular
expression of PD-1 (PD-1neg
cells), gated on CD4+CD25
high cells. In panels E-F
the percentage of positive cells is indicated above the bar.

87
Figure 2 Regulatory T cells (CD4+CD25
highFOXP3
+)(A), PD-1
+ Treg lymphocytes
(CD4+CD25
highFOXP3
+PD-1
+)(B) and PD-1
neg Treg lymphocytes
(CD4+CD25
highFOXP3
+PD-1
neg)(C) in peripheral blood of patients affected by
Alzheimer’s Disease (AD), Mild Cognitive Impairment (MCI) and in healthy controls (HC). The boxes stretch from the 25
th to the 75
th percentile; the lines across the
boxes indicate the median values; the lines stretching from the boxes indicate extreme values. Statistical significance is shown.
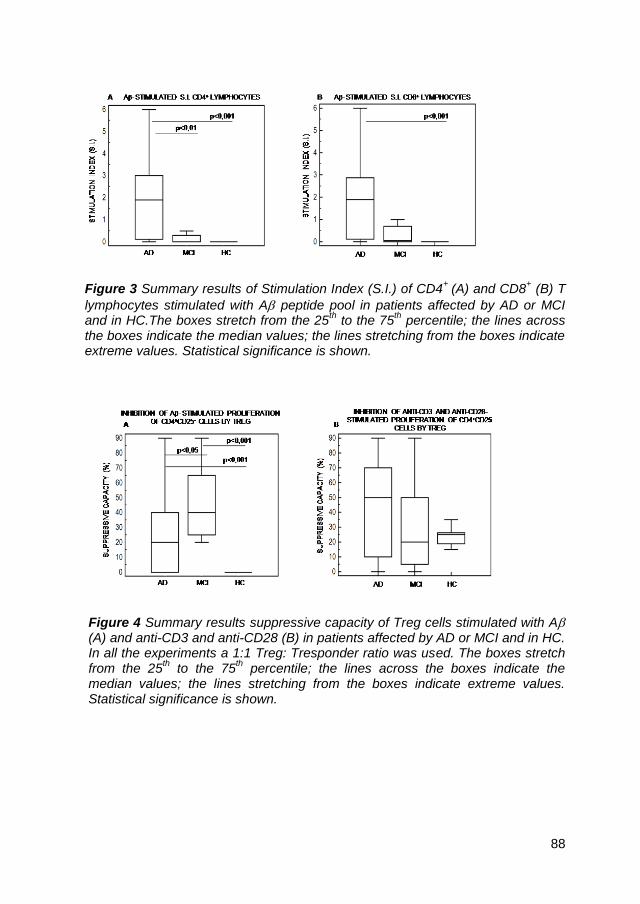
88
Figure 3 Summary results of Stimulation Index (S.I.) of CD4+
(A) and CD8+ (B) T
lymphocytes stimulated with A peptide pool in patients affected by AD or MCI and in HC.The boxes stretch from the 25
th to the 75
th percentile; the lines across
the boxes indicate the median values; the lines stretching from the boxes indicate extreme values. Statistical significance is shown.
Figure 4 Summary results suppressive capacity of Treg cells stimulated with A (A) and anti-CD3 and anti-CD28 (B) in patients affected by AD or MCI and in HC. In all the experiments a 1:1 Treg: Tresponder ratio was used. The boxes stretch from the 25
th to the 75
th percentile; the lines across the boxes indicate the
median values; the lines stretching from the boxes indicate extreme values. Statistical significance is shown.

89
Figure 5 Summary results of PD-1-expressing CD4+
T lymphocytes (A) and
representative dotplots of PD-1- expressing CD4+ T lymphocytes in A-
stimulated PBMCs of AD, MCI and HC are shown. In panel A the boxes stretch from the 25
th to the 75
th percentile; the lines across the boxes indicate the
median values; the lines stretching from the boxes indicate extreme values. Statistical significance is shown. In the upper right corner of dotplots (B) the percentage of CD4
+PD-1
+ is presented.

90
Figure 6 Representative results of PD-L1 expressing A- stimulated CD14+ cells
in AD, MCI and HC.

91
Figure 7 Summary results of IL-10-producing CD14+ cells (A) and representative
dotplots of IL-10- producing CD14+ cells in A- stimulated PBMCs of AD, MCI
and HC are shown. In panel A the boxes stretch from the 25th to the 75
th
percentile; the lines across the boxes indicate the median values; the lines stretching from the boxes indicate extreme values. Statistical significance is shown. In the upper right corner of dotplots (B) the percentage of CD14
+IL-10
+ is
presented.

92
Figure 8 Summary results of IL-10-producing and PD-L1- expressing CD14
+
cells (A) and representative dotplots of IL-10- producing and PD-L1- expressing
CD14+ cells in A- stimulated PBMCs of AD, MCI and HC are shown. In panel A
the boxes stretch from the 25th to the 75
th percentile; the lines across the boxes
indicate the median values; the lines stretching from the boxes indicate extreme values. Statistical significance is shown. In the upper right corner of dotplots (B) the percentage of CD14
+PD-L1
+IL-10
+ is presented.

93
Figure 9 Summary results of Annexin V- expressing (A) and Annexin V and PD-
1 coexpressing (B) CD4+ T lymphocytes in A stimulated PBMCs of AD, MCI
and HC are presented. Representative dotplots of Annexin V and PD-1
coexpressing CD4+ T lymphocytes in A- stimulated PBMCs of AD, MCI and HC
are shown. In panel A and B the boxes stretch from the 25th to the 75
th
percentile; the lines across the boxes indicate the median values; the lines stretching from the boxes indicate extreme values. Statistical significance is shown. In the upper right corner of dotplots (C) the percentage of CD4
+AV
+PD-1
+
is presented.

94
Figure 10 Summary results of Ki67- expressing (A) and representative dotplots
of Ki67- expressing (B) CD4+ T lymphocytes in A stimulated PBMCs of AD, MCI
and HC are presented. In panel A the boxes stretch from the 25th to the 75
th
percentile; the lines across the boxes indicate the median values; the lines stretching from the boxes indicate extreme values. Statistical significance is shown. In the upper right corner of dotplots (B) the percentage of CD4
+Ki67
+ is
presented.
Figure 11 Blockade of the PD-1-PD-L1 pathway. Median percentage of A-stimulated apoptotic CD4
+ T cells coexpressing PD-1 and AV, after blockade with
anti-PD-L1 specific antibody and after isotype matched control antibody (IgG) in AD, MCI and HC.

95
Figure 12 Summary results (A) and representative dotplots (B) of IL-9-, IL-21-,
IL-22- expressing A-stimulated CD4+ T lymphocytes of AD, MCI and HC. In panel A the boxes stretch from the 25
th to the 75
th percentile; the lines across the
boxes indicate the median values; the lines stretching from the boxes indicate extreme values. Statistical significance is shown. In the upper right corner of dotplots (B) the percentage of CD4
+IL-9
+, CD4
+IL-21
+, CD4
+IL-22
+ is presented.

96
Figure 13 Summary results (A) and representative dotplots (B) of IL-23-, IL-6-,
IL-10- producing A-stimulated CD14+ cells of AD, MCI and HC. In panel A the
boxes stretch from the 25th to the 75
th percentile; the lines across the boxes
indicate the median values; the lines stretching from the boxes indicate extreme values. Statistical significance is shown. In the upper right corner of dotplots (B) the percentage of CD14
+IL-23
+, CD14
+IL-6
+, CD14
+IL-10
+ is presented.
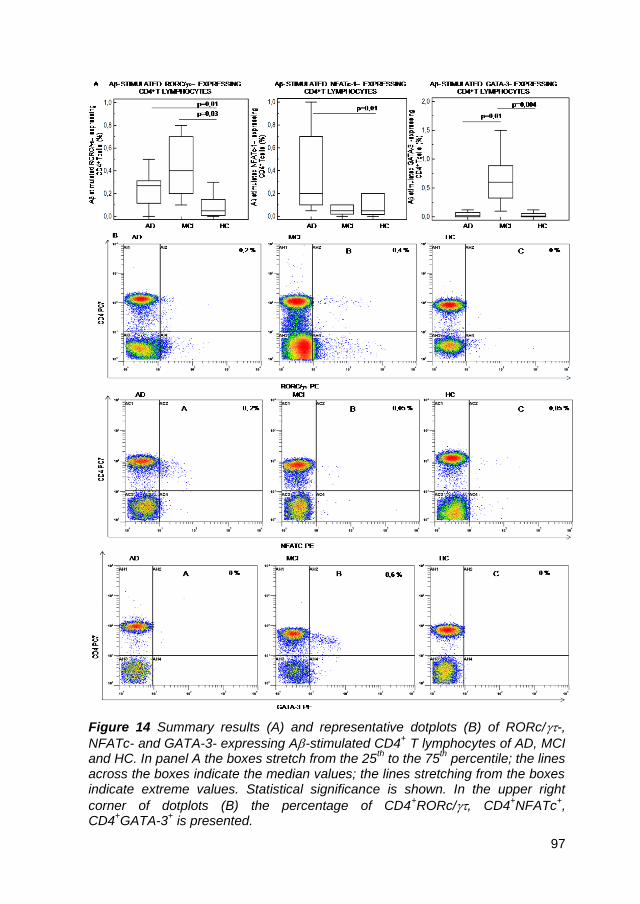
97
Figure 14 Summary results (A) and representative dotplots (B) of RORc/-,
NFATc- and GATA-3- expressing A-stimulated CD4+ T lymphocytes of AD, MCI
and HC. In panel A the boxes stretch from the 25th to the 75
th percentile; the lines
across the boxes indicate the median values; the lines stretching from the boxes indicate extreme values. Statistical significance is shown. In the upper right
corner of dotplots (B) the percentage of CD4+RORc/, CD4
+NFATc
+,
CD4+GATA-3
+ is presented.