Embed Size (px)
Citation preview
Immersive Visualization to Help Image Classification Education
Ronei M. de Moraes, Liliane S. Machado, Bruno B. Gnecco and Marcio C. Cabral
Abstract ? This paper describes a virtual reality system to digital image processing education. We developed two versions of an immersive and interactive tool to teach image classification subject. The first one run on PC/Linux platform and was designed for individual studies. The second version was developed to run in a Digital CAVE like /Unix platform allowing full immersion and collective observation. Index Terms ? Image Classification Education, Virtual Reality, Digital CAVE like systems.
I. INTRODUCTION
In general, Digital Image Processing education in Brazil involves the fields of transformations, filtering, restoration and segmentation. Some subjects in these fields include interdisciplinary topics as photography concepts, colors theory and mathematical morphology [9], what makes the learning process difficult even for postgraduate students. In order to make possible identify image elements, image interpretation and classification classes have been added to digital image processing education, too. Because the image classification techniques are very heterogeneous, is difficult to teach in a single subject, concepts that depend on advanced mathematical and statistical basis. As example, we can mention classifiers based on statistical discriminated multivariate principles [2] that use Linear Algebra. The same way, there are classifiers based on Neural Networks, using biologic concepts of the human neuron [24]. Others classifiers use principles of the classical or fuzzy logic [17] and expert systems to execute the classification. At this point, is possible to observe the difficulty to teach image classification topics without a good knowledge of several and necessary concepts by the students. Virtual Reality Systems can bring the students near of the study object and can assist the basic sciences education. This approach is already used to teach Geometry in Augmented Reality Systems [12]. In Statistics, the interpretation and data analysis can be done interactively in full-immersion systems CAVE like allowing the students to manipulate and understand complex data sets [22]. Manuscript received on December 15, 2001. (Deadline date). Ronei M. de Moraes, Statistics Department - CCEN - Federal University of Paraíba, Cidade Universitária s/n CEP 58.051-900 João Pessoa – PB - Brazil, tel.: +55 83 216-7075, [email protected]; Liliane S. Machado, Bruno B. Gnecco, Marcio C. Cabral Laboratory of Integrating Systems - Politecnic School - University of São Paulo, Av. Prof. Luciano Gualberto, 158. Trav.3. CEP: 05508-900 - São Paulo - SP - Brazil, tel.: +55 11 3818-5676, {liliane, brunobg, mcabral}@lsi.usp.br.
This paper proposes the utilization of Virtual Reality Systems to help the teaching of statistical concepts and to help the teaching of spatial functioning of image classifiers. The goal of the system presented is bring the students/users near of the problem universe, placing them inside abstract mathematical dimensions and allowing them to visualize the statistical data sets used in the process of an image classification.
II. IMAGE CLASSIFICATION
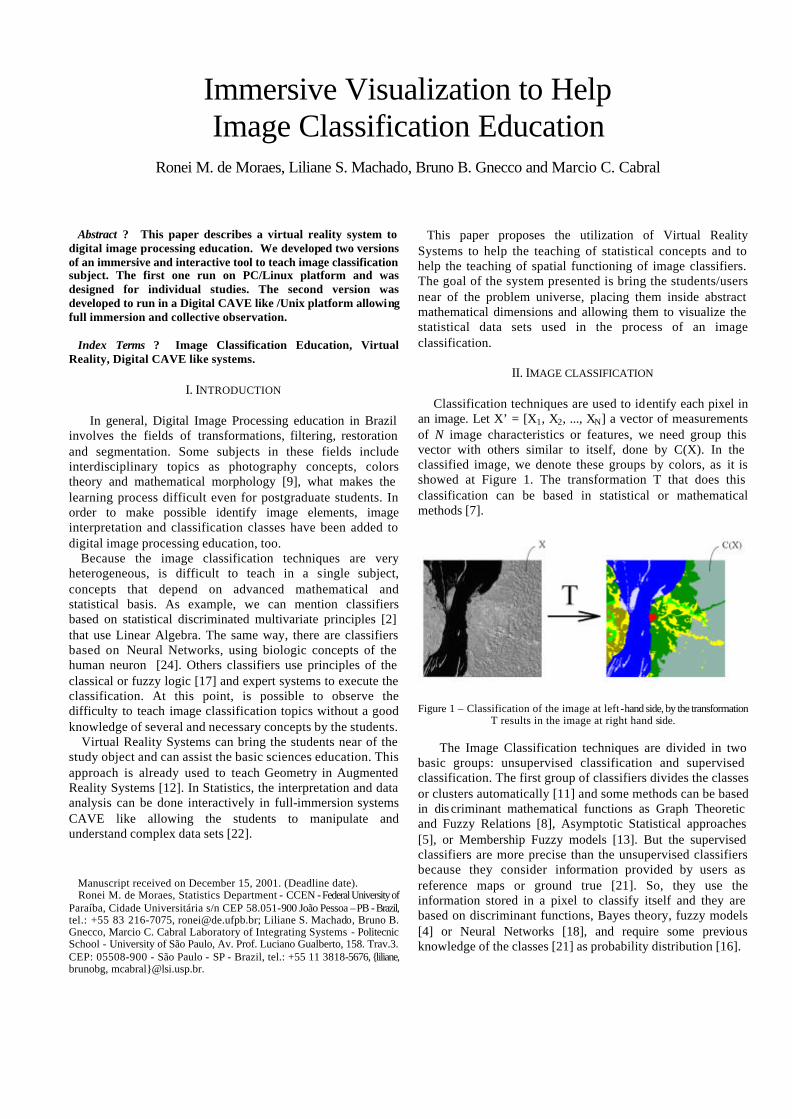
Classification techniques are used to identify each pixel in an image. Let X’ = [X1, X2, ..., XN] a vector of measurements of N image characteristics or features, we need group this vector with others similar to itself, done by C(X). In the classified image, we denote these groups by colors, as it is showed at Figure 1. The transformation T that does this classification can be based in statistical or mathematical methods [7].
Figure 1 – Classification of the image at left -hand side, by the transformation
T results in the image at right hand side. The Image Classification techniques are divided in two basic groups: unsupervised classification and supervised classification. The first group of classifiers divides the classes or clusters automatically [11] and some methods can be based in dis criminant mathematical functions as Graph Theoretic and Fuzzy Relations [8], Asymptotic Statistical approaches [5], or Membership Fuzzy models [13]. But the supervised classifiers are more precise than the unsupervised classifiers because they consider information provided by users as reference maps or ground true [21]. So, they use the information stored in a pixel to classify itself and they are based on discriminant functions, Bayes theory, fuzzy models [4] or Neural Networks [18], and require some previous knowledge of the classes [21] as probability distribution [16].

A. Unsupervised classifiers Unsupervised classification is a method where the algorithm by itself looks for classes in a given image through clustering, what means, trying to group similar pixels or dividing groups of different pixels. The users should only provide to the algorithm the number of classes desired or another criterion to make the cluster be considered mathematically stable. The result of this method is an image with not-identified classes and the user should name these classes as best as he can. A very didactic unsupervised method is the hierarchic cluster [15, 20] where a pre-defined number of classes is not necessary. This algorithm starts taking each pixel as a cluster and all the distances among the pixels are calculated and stored in a distance matrix. In a second step the nearest neighbor are united in a new cluster. For this new cluster, a center is calculated to be the representative point and will be used to recalculate the distances. The method is finished when all the pixels are reunited in only one cluster of pixels. In general, the results are presented in a dendogram [11] and then the user can decide the final number of classes of the image and give names to them. In a formal approach, the hierarchic cluster method is repetitive and can start from the assumption that each image point is a class and grouping these points by similarity. Generally, the similarity is given by the Euclidean Distance (1) [11]:
where N is the dimension of spectral components or features. A way to verify clusters quality is the residual sum of squares (SQE), given by (2) [11]:
In spite of be mathematically simple, the difficulty in unsupervised classifiers learning is comprehend the N-dimensional characteristic of spectral components or features. Another difficulty pointed out by students is how to understand distances in the multidimensional space. B. Supervised classifiers Supervised classifiers are methods where the user interacts with the algorithm given it information as classes quantity and samples of knew areas for each class in the image. These samples are used to train the classifier. The algorithm should classify each image pixel by a discriminant function generated from the information given by user. The K-NN classifier (K-Nearest Neighbor) is a non-parametric supervised classifier where a pixel is associated to a class depending on the K neighbor number of points,
determined by a distance criterion, of this class [7]. The Euclidean distance is a usual method to determine this distance. In a formal approach, feature vectors of pixels for each class c, c = 1, ..., C , into an image are obtained in the training. For a given pixel, with feature vector X, the classifier K-NN looks for the K feature vectors nearest the training data. From the K feature vectors of the neighborhood pixel to be classified is verified the class pertinent to the majority k, k=0, ..., K; of the neighborhood points. The only free parameter of the classifier in the K-neighbor number to be searched, and that is fixed by the user. The classifier rule is: xi ? c*: c* = arg maxc IcK(xi), (3) where IcK is a function that counts points of the c class among the K-neighbors on the X neighborhood, with contra-domain in a {0,...,K} integer set [11]. Since to find the nearest K-neighbors for each point to be classified is computationally expensive, a variation of this algorithm is used. It consists on the selection of points inside a hyper-sphere with ray R, and for each class counts the points inside the hyper-sphere. One problem observed is that because R is decided empirically by the user, sometimes may exist hyper-spheres without any point. As in the unsupervised classifier, the difficulty to teach the supervised classifiers is to comprehend the features space and understand the distances in a multidimensional space.
III. VIRTUAL REALITY SYSTEMS TO SUPPORT LEARNING In a very near future, students will use virtual reality systems to simulate and visualize data interactively in a personalized environment [23]. The main goal in actual research systems is allow interactive visualization in immersive or semi-immersive environments, placing users and objects together and facilitating the comprehension. These systems are especially important in Mathematical Sciences and topics depending on Algebra and Geometry where abstract concepts can be visualized. In Statistics, the comprehension of multivariate data can be more difficult to learn because there are many dimensions involved. So, the immersion sensation offered by virtual reality systems in graphics observation is very favorable [1]. The same way, the use of CAVE like systems [6] in the visualization of very large data sets and collaborative work is very suitable too [10]. Arns et al. [1] compared people sensibility in the identification of some multivariate statistical data structures in the XGobi desktop system [25] and in the C2, a 4-side CAVE like system from the Iowa University, where the images are projected in the floor and three walls. The Arns research concluded that most of the people felt more comfortable interacting with the desktop system. But, the identification of data structures was more accurate in the C2 than in the desktop system. Probably it occurs because the CAVE like system provided a stereoscopic visualization in a 3D environment.
(1)
(2)
There is great expectation about geographic limitation decrease with the use of distance learning applications. Through distance learning, schools and universities will be responsible by a large number of students and it will require staff and tools to support the learning process [26], including the use of immersive systems. However, nowadays the use of Virtual Reality is limited by its high costs of computational systems and devices. CAVE like systems are very expensive too, and these costs include the necessity of high-speed networks with ATM connections to a good performance in applications using audio and video [19]. Tactile devices are not very popular or standard, but new ways of interactions using gesture or voice commands [14] are in research. In these kind of interaction the user action is not restrict what could make Virtual Reality applications much more popular in a short time. Low-cost and full-immersive CAVE like systems have been in the focus of well succeeded researches [3].
IV. VISUALIZATION SYSTEMS TO SUPPORT LEARNING Looking for solutions for image classifiers education and keeping in mind the costs of immersive technologies, we
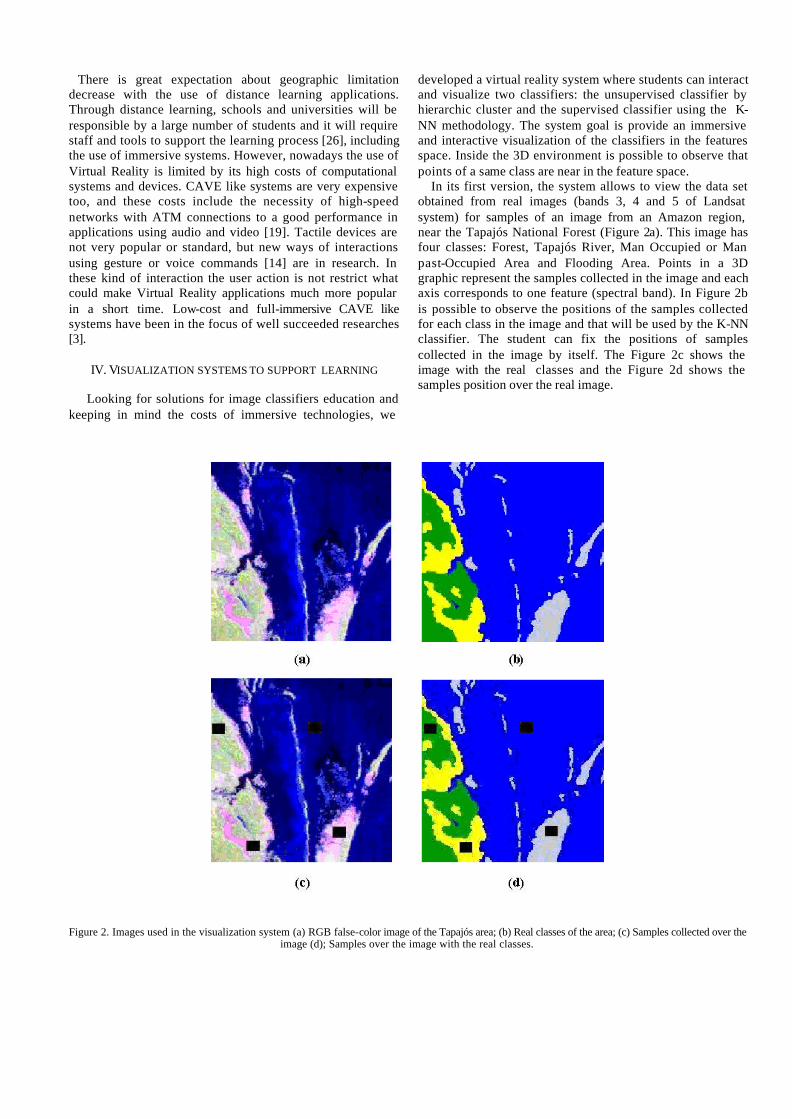
developed a virtual reality system where students can interact and visualize two classifiers: the unsupervised classifier by hierarchic cluster and the supervised classifier using the K-NN methodology. The system goal is provide an immersive and interactive visualization of the classifiers in the features space. Inside the 3D environment is possible to observe that points of a same class are near in the feature space. In its first version, the system allows to view the data set obtained from real images (bands 3, 4 and 5 of Landsat system) for samples of an image from an Amazon region, near the Tapajós National Forest (Figure 2a). This image has four classes: Forest, Tapajós River, Man Occupied or Man past-Occupied Area and Flooding Area. Points in a 3D graphic represent the samples collected in the image and each axis corresponds to one feature (spectral band). In Figure 2b is possible to observe the positions of the samples collected for each class in the image and that will be used by the K-NN classifier. The student can fix the positions of samples collected in the image by itself. The Figure 2c shows the image with the real classes and the Figure 2d shows the samples position over the real image.
Figure 2. Images used in the visualization system (a) RGB false-color image of the Tapajós area; (b) Real classes of the area; (c) Samples collected over the image (d); Samples over the image with the real classes.

In Figure 3, the x, y and z-axis represent each spectral band of the image, and the points represent the sample values in these bands. The colors green, blue, yellow and gray represent, respectively, the sample values of the points in the classes Forest, Tapajós River, Man Occupied or Man past-Occupied Area, and Flooding Area. Two versions of the systems were proposed. The first one was developed to run on desktop systems in PC/Linux platforms and the second one was developed to run in full-immersion systems – CAVE like – in SGI/Unix platforms. To the desktop systems, the program developed is a simplified version and used APIs OpenGL™ and the GLUT (GL Utility Tool), giving the possibility of its use in PCs/GNU-Linux. In this case, the user can interact using an ordinary mouse.
Figure 3 – The 4 samples in the 3D space and the classes encapsulated can
be seen in the immersive environment. To use the system in a full-immersive environment, like the CAVERNA Digital, a CAVE like system of the LSI-USP in Brazil, some libraries are necessary to allow the access to the projectors. It will make possible to render different points of view. One example of this kind of library is the CAVElib [27], used by us to replace some GLUT functions for the graphic exhibition. One advantage of the CAVElib is the existence of automatic functions to generate stereoscopy, observed by the user wearing shutter glasses. The interaction is possible using a 3-D mouse, a wireless keyboard or a
motion tracker, and allows six degrees of freedom actions (translate and rotate). Figure 4 shows the system running on the 5-side CAVERNA Digital at LSI/USP. This full-immersive environment is adequate for classes in Digital Image Processing subjects.
Figure 4 – The system in use at the CAVERNA Digital of LSI/USP.
V. FINAL CONCLUSIONS AND FUTURE WORKS In this paper we propose the use of Virtual Reality Systems to help the learning of statistical conceptions and spatial functioning of image classifiers, as the feature space and the distances in a multidimensional space. We presented a system that insert the users in mathematical dimensions allowing the visualization of the statistical data sets used to classify an image. This system has two versions: one that can be easily used individually by students in PC/Linux computers and another one to full-immersion environments, where students can have a better comprehension of the feature space and a better understanding of the distances in the multidimensional space. In this second version we used the UNIX operational system in a SGI platform, to run the system in the CAVERNA Digital, a CAVE like system of LSI/USP in Brazil. To run the system developed in full-immersion environments (CAVE like) we needed libraries to access the many projectors and to generate the multiple points of view with stereoscopy. At LSI/USP is being developed a library to allow the use of a CAVE like system based on a PC/Linux cluster [28]. However, at this time we are using the CAVElib to replace the GLUT used in the desktop version. In a near future, we intend to finalize a version to run in the CAVERNA Digital controlled by the PC/Linux cluster in developing at LSI/USP. This version should incorporate others image classifiers available in literature. After that, the system will be converted in a educational and interactive video to support image classifiers and we intend to generate two versions for this video: one for desktop systems and another one for CAVE like systems.

REFERENCES [1] L. Arns, D. Cook, and C. Cruz-Neira, “The Benefits of Statistical
Visualization in an Immersive Environment”. Proceedings of IEEE Virtual Reality, pp. 88-95, 1999.
[2] M. P. F. Baridó, Uma comparação entre diferentes métodos multivariados de classificação. Dissertação de Mestrado - Instituto de Matemática - UFRJ - Rio de Janeiro, 1989, 189 pp.
[3] D. Bennett, et al.; “A Low Cost Commodity Based System for Group Viewing of 3D Images”. In Proceedings of Visualization Development Environments, Princeton, 2000.
[4] J. C. Bezdek, S. K. Chuah and D. Leep, “Generalized k-Nearest Neighbor Rules”. Fuzzy Sets and Systems, 18: 237-256, 1986.
[5] D. B. Cooper and J. H. Freeman,. ''On the Asymptotic Improvement in the Outcome of Supervised Learning Provided by Additional Nonsupervised Learning''. IEEE Transactions on Computers, vol.19, n.11, november, 1970.
[6] C. Cruz-Neira, et al., “The CAVE: audio visual experience automatic virtual environment”. Communications of ACM, 35: 64-72, 1992.
[7] R. O. Duda and P. E. Hart, Pattern Classification and Scene Analysis. New York: John Wiley and Sons, 1973.
[8] J. C. Dunn, “A Graph Theoretic Analysis of Pattern Classification via Tamura's Fuzzy Relations”'. IEEE Trans. Syst. Man. Cybern., vol SMC-4, pp. 310-313, 1974.
[9] R. C. Gonzales and R. E. Woods, Processamento Digital de Imagens. Ed. Edgard Blücher, 2000.
[10] J. Hardin and J. Ziebarth, “Digital Technology and its Impact on Education. 2000”. [on line] http://www.ed.gov/Technology/Futures/ , maio de 2001.
[11] R. A. Johnson and D. W. Wichern, Applied Multivariate Statistical Analysis. Prentice-Hall Inc., 1982.
[12] H. Kaufmann, D. Schmalstieg and M. Wagner, “Construct3D: A Virtual Reality Application for Mathematics and Geometry Education”. Institute of Computer Graphics and Algorithms, Vienna University of Technology, Technical Report TR-186-2-00-16, June 2000.
[13] J. T. Kent and K. V. Mardia, “'Spatial Classification Using Fuzzy Membership Models”. IEEE Transactions on Pattern Analysis and Machine Intelligence, vol.10, n.5, pp. 659-671, September, 1988.
[14] J. LaViola, "MSVT: A Virtual Reality-Based Multimodal Scientific Visualization Tool", In Proceedings of the Third IASTED International Conference on Computer Graphics and Imaging, pp. 1-7, November 2000.
[15] P. M. Mather, Computer Processing of Remotely-Sensed Images. An Introduction. John Wiley and Sons: Chichester, 1987.
[16] R. M. Moraes, Implementação de um sistema contextual de classificação de imagens orbitais compatível com o sistema SITIM. Dissertação de Mestrado, UFPb, 1992, 100 pp.
[17] R. M. Moraes, A Fuzzy Expert Systems Architecture for Image Classification Using Mathematical Morphology Operators. PhD Thesis. INPE, São José dos Campos, Br, 1998 [in Portuguese].
[18] M. T. Mustavi, et al., “On the Generalization Ability of Neural Network Classifiers”. IEEE Trans. on Patt. Anal. and Mach. Intel. 16, pp. 659-663, 1994.
[19] T. Plagemann and V. Goebel, “Experiences with the Electronic Classroom - QoS Issues in an Advanced Teaching and Research Facility”. In Proceedings, Workshop on Future Trends in Distributed Computing Systems IEEE FTDCS’97, 1997.
[20] J. A. Richards, Remote Sensing Digital Image Analysis - An Introduction. Berlin, Springer-Verlag, 1995.
[21] H. V. Säebo, et al., Contextual Classification of Remotly Sensed Data : Statistical Methods and Development of a System - Report n.768 - Norwegian Computing Center - Oslo – 1985.
[22] N. Sawant, et al., “The Tele-Immersive Data Explorer: A Distributed Architecture for Collaborat ive Interactive Visualization of Large Data-sets”, 4th International Immersive Projection Technology Workshop, Ames, Iowa, 2000.
[23] J. Schnepf, et al., “Closing the Gap in Distance Learning: Computer-Supported, Participative, Media-Rich Education”. Education Technology Review, pp. 19-25, Autumn/Winter, 1994.
[24] P. K. Simpson, Artificial Neural Systems. Pergamon Press, New York, 1990.
[25] D. F. Swayne, D. Cook, and A. Buja, “Xgobi: Interactive Synamic Graphics in the X Window System”. Journal of Computa tional and Graphical Statistics, 1998.
[26] K. Synnes, et alli., Net-based Learning for the Next Millenium. Lule: Research Report 1999-05 Lule University of Technology, Sweden, 1999.
[27] http://www.vrco.com/ [28] J. A. Zuffo, et al., “Caverna Digital - Sistema de Multiprojeção
Estereoscópico Baseado em Aglomerados de PCs para Aplicações Imersivas em Realidade Virtual”, 4th SBC Symposium on Virtual Reality, Florianópolis, SC, Brasil, pp. 139-147, 2001.