Embed Size (px)
Citation preview
1227
47 Immersive Visualization for the Geological Sciences
William R. Sherman, Gary L. Kinsland, Christoph W. Borst, Eric Whiting, Jurgen P. Schulze, Philip Weber, Albert Y.M. Lin, Aashish Chaudhary, Simon Su, and Daniel S. Coming
AQ1
Contents
47.1 Introduction........................................................................................................................ 122847.2 CommonGeologyDataTypes............................................................................................ 1229
47.2.1 TerrainElevationData............................................................................................ 123047.2.2 SatelliteImagery..................................................................................................... 123047.2.3 2DFields(e.g.,GravityandMagnetism)................................................................ 123147.2.4 3DMaterialPropertyData(TomogramVolumes)................................................. 123347.2.5 Ground-PenetratingRadar(GPR)Data.................................................................. 123347.2.6 WellLogData......................................................................................................... 123347.2.7 VectorGeometryObjectswithAttributes.............................................................. 123447.2.8 BreadcrumbTrail.................................................................................................... 123447.2.9 PointCloudData..................................................................................................... 1234
47.3 GeologyVisualization........................................................................................................ 123447.3.1 RelevantIssuesinGeologyVisualization.............................................................. 123547.3.2 ApplyingStandardVisualizationTechniquestoGeology..................................... 123547.3.3 VisualizationTechniquesforGeology................................................................... 123647.3.4 TemporalData........................................................................................................ 123747.3.5 BenefitstoGeologicVisualizationfromtheImmersiveInterface......................... 1237
47.4 ExemplarApplicationsandLessonsLearned.................................................................... 123847.4.1 ApplicationsforExplorationofTerrains,AssociatedGeophysicalData,
andWellLogsattheUniversityofLouisianaatLafayette.................................... 123947.4.1.1 RenderingandInteractionforTerrainInterpretation.............................. 123947.4.1.2 WellLogVisualization............................................................................124047.4.1.3 3DLensImmersiveInterfaceTechnique................................................. 1241
47.4.2 LidarViewer:AnImmersivePointCloudVisualizationTool................................ 124347.4.2.1 VisualizationTechniques.........................................................................124447.4.2.2 ImmersiveInterfaceTechniques.............................................................. 124547.4.2.3 IdahoNationalLaboratoryLidarViewerWorkflow.................................124647.4.2.4 OutcomesandLessons............................................................................1246
47.4.3 VisualizationofMultimodalGeophysicalSurveyData......................................... 124747.4.3.1 VisualizationTechniques.........................................................................124847.4.3.2 ImmersiveVisualizationApplication...................................................... 124947.4.3.3 BenefitsDerived....................................................................................... 1251
47.4.4 DRILancasterSandDuneLayers.......................................................................... 125247.4.4.1 VisualizationTechniques......................................................................... 1253
K14855_C047.indd 1227 3/19/2014 5:55:17 PM
1228 Handbook of Virtual Environments: Design, Implementation, and Applications
47.1 IntroduCtIon
Onecharacteristicofgeologistsistheirabilitytothinkin3D.Whetherthisabilityisdevelopedastheyadvanceasgeologistsor theyweredrawntogeologybecause theypossessed thisability isanopenquestion.However,experiencedgeologistspossessthisabilitytosuchadegreethattwoormoregeologistsmayverballycommunicateaboutacomplex3D,real-worldproblem—eachofthembuildingandmodifyinga3Dimageintheirmindastheyreceiveinformationfromtheothers.Theycanverballyquerytheimageofanotherandasagroupmayactuallychangeperspectiveinthevirtual/mental3Dimage.Thatis,theyarecapableofagreeingtolookatthe3Dproblemfromdif-ferentpositionsinspace…ortime.Theyoftenneedtotracethedevelopmentofaparticulargeologicsituationthroughgeologictime.Thegroupiscapableofcomingtoconsensusandrunningaverysimilar3Dmovieintheirindividualminds.Thismovieistweakedbyevidentialoropinioninputfromthoseinvolved,developingacauseandeffect–basedplausibleexplanationofthepresentgeo-logicalsituation.Similarly,thegroupmayrunthismovieintothefuturetomakepredictions.Usingimmersive tools for visualizing the data is, therefore, both natural and powerful for geologists.Immersive3Dcomputergraphicstechnologiesaretoolsthatcombineanintuitive3Dviewingenvi-ronmentwitheasilylearnedinteractionmechanisms.Theseadvanced3Dtoolsrepresentanaturaloperatingplatformforgeologistswhoofnecessitymustthinkin3D.
Thefollowingstatementmaybeatautology;however,itisworthspecificallystatingforitsrel-evancetotheuseofimmersivevisualization:“Allinterpretationoccursinthemind.”Thespecificpointisthatbeforeinterpretationcanproceed,informationmustgetintothemind.Intheexampleearlier,theinformationiscommunicatedverbally.Inmanyothercases,informationentersthemindvisually.Often,thisinformationisintheformof2Dimages.Inthemind,2Dimagesfromsev-eraldifferentperspectivesandatdifferentscalesareoften(inthecaseofgeologists…veryoften)constructedinto3Dspaces.These3Dspaces,then,arethebasisformakinginterpretations.Whilegeologistsarequitegoodatassembling3Dspacesfromvariousinputformats,itismoreefficienttohavetheinformationenterthemindasalreadycorrectlyconstructed3Dimages.Thisisonegreatadvantageofimmersivevisualizationforgeologists.
Anotheradvantageistheabilityofoneorseveralgeologiststofreelymoveaboutinthe3Dvol-ume.Theeffectonthegeologistofbeingimmersedintheirdataissimilartobeinginthefieldwherecuriositydrivesmovement,inspection,andanalysis.Togeoscientists,thistypeofinteractionisoftenintuitive—if,whileinthefield,thegeoscientistwantstolookatsomefeaturethathasarousedcuri-osity,heorshesimplywalksoverthereandlooksatit(aspartoftheeducationandexperience,mostgeoscientistshavehadsomefieldwork).Contrastthiswithwhathappensinmanyotherenviron-mentswhereintheinvestigatormustmakedecisions,consciouslyorunconsciously,relatedtoeffortversusreward.Thatis,decisionsmustbemadeastowhetherinvestigationofthecuriousfeatureisworththeeffortofgatheringtheadditionaldatanecessarytoreachaconclusion.Ofcourse,inthisprocess,theconclusionisestimated,perhapsincorrectly,andcomparedtothecost.Onememberofourteam(Kinsland)experiencedthisfirsthand:hehadwrittenandpublishedapaperusing2Drep-resentationsofaerialtopographiclightdetectionandranging(LIDAR)datatointerprettheevolutionofaparticularriver.Later,hehaspresentedtheLIDARdataimpressively,allowinghimtomove,interact,andcontinuouslyqueryastolatitude,longitude,andelevation.Withinjustafewminutesofmindlesslybutcuriouslymovingaboutinthedatahesaid,“Ihavetowriteanotherpaper.Ihavefoundanalternativeexplanation.”Hehadpouredoverthe2Ddataformanymonthsbeforehewrotetheoriginalpaper.Lessthan20minofwalkingwithinthedata,asifhewereinthefield,resultedin
AQ2
47.4.4.2 ImmersiveInterfaceTechniques.............................................................. 125347.4.4.3 OutcomesandLessons............................................................................ 1253
47.5 Benefits............................................................................................................................... 125547.6 FutureandConclusion........................................................................................................ 1256References.................................................................................................................................... 1257
K14855_C047.indd 1228 3/19/2014 5:55:17 PM
1229Immersive Visualization for the Geological Sciences
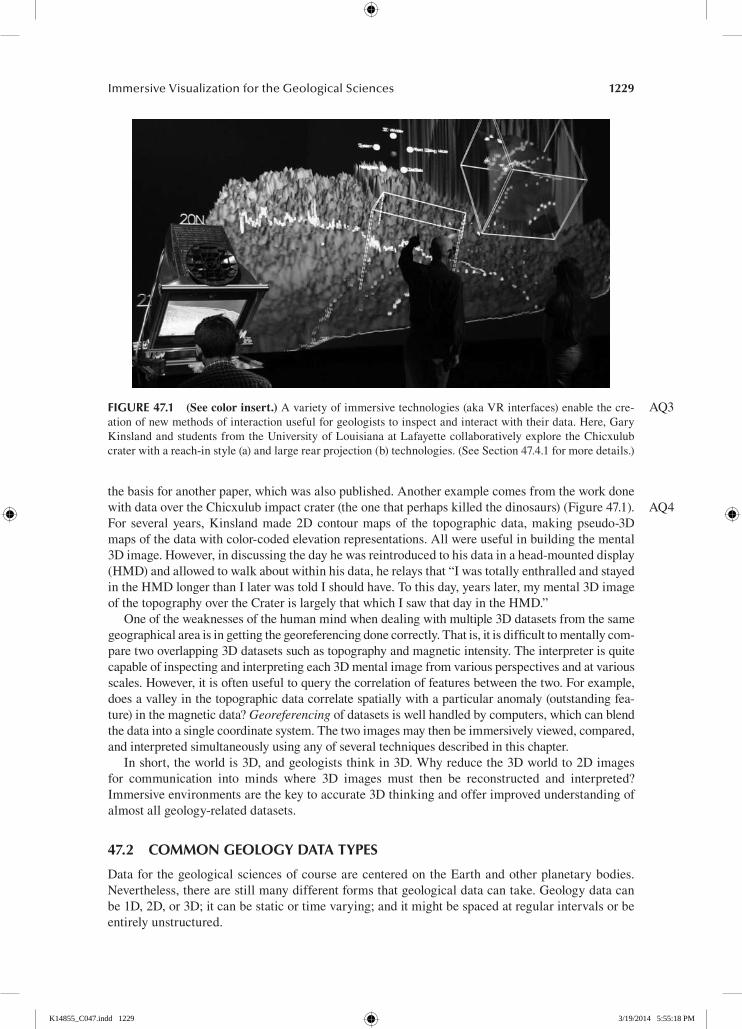
thebasisforanotherpaper,whichwasalsopublished.AnotherexamplecomesfromtheworkdonewithdataovertheChicxulubimpactcrater(theonethatperhapskilledthedinosaurs)(Figure47.1).For severalyears,Kinslandmade2Dcontourmapsof the topographicdata,makingpseudo-3Dmapsofthedatawithcolor-codedelevationrepresentations.Allwereusefulinbuildingthemental3Dimage.However,indiscussingthedayhewasreintroducedtohisdatainahead-mounteddisplay(HMD)andallowedtowalkaboutwithinhisdata,herelaysthat“IwastotallyenthralledandstayedintheHMDlongerthanIlaterwastoldIshouldhave.To this day,yearslater,mymental3DimageofthetopographyovertheCraterislargelythatwhichIsawthatdayintheHMD.”
Oneoftheweaknessesofthehumanmindwhendealingwithmultiple3Ddatasetsfromthesamegeographicalareaisingettingthegeoreferencingdonecorrectly.Thatis,itisdifficulttomentallycom-paretwooverlapping3Ddatasetssuchastopographyandmagneticintensity.Theinterpreterisquitecapableofinspectingandinterpretingeach3Dmentalimagefromvariousperspectivesandatvariousscales.However,itisoftenusefultoquerythecorrelationoffeaturesbetweenthetwo.For example,doesavalleyinthetopographicdatacorrelatespatiallywithaparticularanomaly(outstandingfea-ture)inthemagneticdata?Georeferencingofdatasetsiswellhandledbycomputers,whichcanblendthedataintoasinglecoordinatesystem.Thetwoimagesmaythenbeimmersivelyviewed,compared,andinterpretedsimultaneouslyusinganyofseveraltechniquesdescribedinthischapter.
Inshort,theworldis3D,andgeologiststhinkin3D.Whyreducethe3Dworldto2Dimagesfor communication into minds where 3D images must then be reconstructed and interpreted?Immersiveenvironmentsarethekeytoaccurate3Dthinkingandofferimprovedunderstandingofalmostallgeology-relateddatasets.
47.2 Common GeoloGy data types
DataforthegeologicalsciencesofcoursearecenteredontheEarthandotherplanetarybodies.Nevertheless,therearestillmanydifferentformsthatgeologicaldatacantake.Geologydatacanbe1D,2D,or3D;itcanbestaticortimevarying;anditmightbespacedatregularintervalsorbeentirelyunstructured.
AQ4
FIGure 47.1 (See color insert.)Avarietyofimmersivetechnologies(akaVRinterfaces)enablethecre-ationofnewmethodsofinteractionusefulforgeologiststoinspectandinteractwiththeirdata.Here,GaryKinslandandstudentsfromtheUniversityofLouisianaatLafayettecollaborativelyexploretheChicxulubcraterwithareach-instyle(a)andlargerearprojection(b)technologies.(SeeSection47.4.1formoredetails.)
AQ3
K14855_C047.indd 1229 3/19/2014 5:55:18 PM
1230 Handbook of Virtual Environments: Design, Implementation, and Applications
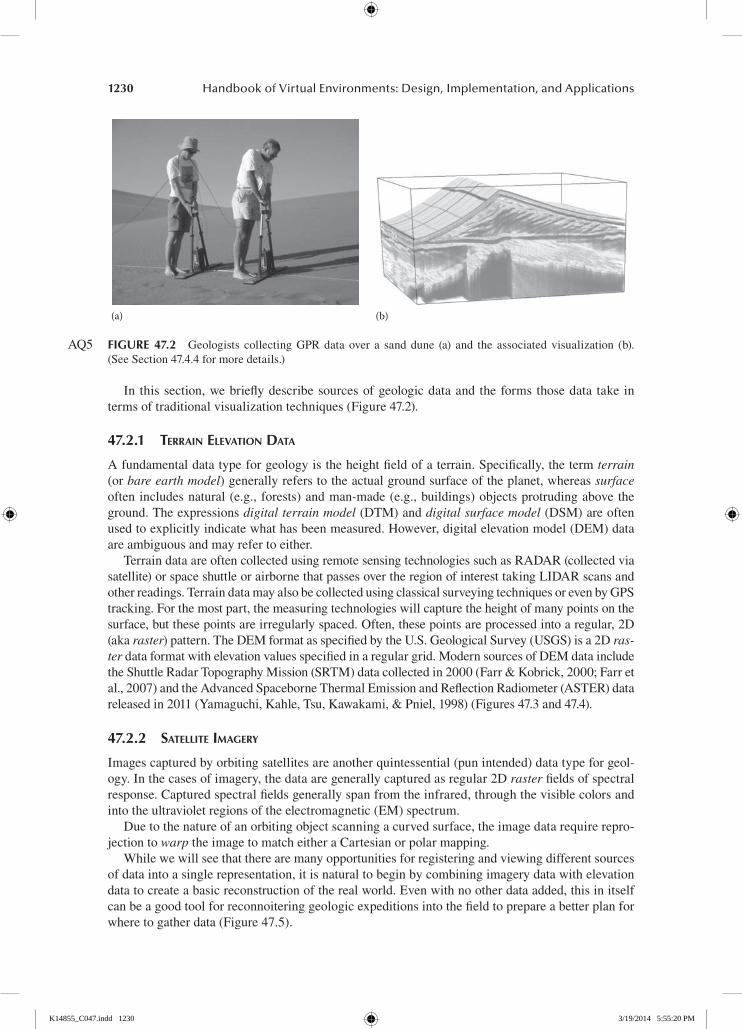
In thissection,webrieflydescribesourcesofgeologicdataand theforms thosedata take intermsoftraditionalvisualizationtechniques(Figure47.2).
47.2.1 Terrain elevaTion DaTa
Afundamentaldatatypeforgeologyistheheightfieldofaterrain.Specifically,thetermterrain(orbare earth model)generallyreferstotheactualgroundsurfaceoftheplanet,whereassurfaceoftenincludesnatural(e.g.,forests)andman-made(e.g.,buildings)objectsprotrudingabovetheground.Theexpressionsdigital terrain model(DTM)anddigital surface model(DSM)areoftenusedtoexplicitlyindicatewhathasbeenmeasured.However,digitalelevationmodel(DEM)dataareambiguousandmayrefertoeither.
TerraindataareoftencollectedusingremotesensingtechnologiessuchasRADAR(collectedviasatellite)orspaceshuttleorairbornethatpassesovertheregionofinteresttakingLIDARscansandotherreadings.TerraindatamayalsobecollectedusingclassicalsurveyingtechniquesorevenbyGPStracking.Forthemostpart,themeasuringtechnologieswillcapturetheheightofmanypointsonthesurface,butthesepointsareirregularlyspaced.Often,thesepointsareprocessedintoaregular,2D(akaraster)pattern.TheDEMformatasspecifiedbytheU.S.GeologicalSurvey(USGS)isa2Dras-terdataformatwithelevationvaluesspecifiedinaregulargrid.ModernsourcesofDEMdataincludetheShuttleRadarTopographyMission(SRTM)datacollectedin2000(Farr&Kobrick,2000;Farretal.,2007)andtheAdvancedSpaceborneThermalEmissionandReflectionRadiometer(ASTER)datareleasedin2011(Yamaguchi,Kahle,Tsu,Kawakami,&Pniel,1998)(Figures47.3and47.4).
47.2.2 SaTelliTe imagery
Imagescapturedbyorbitingsatellitesareanotherquintessential(punintended)datatypeforgeol-ogy.Inthecasesofimagery,thedataaregenerallycapturedasregular2Drasterfieldsofspectralresponse.Capturedspectralfieldsgenerallyspanfromtheinfrared,throughthevisiblecolorsandintotheultravioletregionsoftheelectromagnetic(EM)spectrum.
Duetothenatureofanorbitingobjectscanningacurvedsurface,theimagedatarequirerepro-jectiontowarptheimagetomatcheitheraCartesianorpolarmapping.
Whilewewillseethattherearemanyopportunitiesforregisteringandviewingdifferentsourcesofdataintoasinglerepresentation,itisnaturaltobeginbycombiningimagerydatawithelevationdatatocreateabasicreconstructionoftherealworld.Evenwithnootherdataadded,thisinitselfcanbeagoodtoolforreconnoiteringgeologicexpeditionsintothefieldtoprepareabetterplanforwheretogatherdata(Figure47.5).
(a) (b)
FIGure 47.2 Geologists collectingGPRdataover a sanddune (a) and the associatedvisualization (b).(See Section47.4.4formoredetails.)
AQ5
K14855_C047.indd 1230 3/19/2014 5:55:20 PM
1231Immersive Visualization for the Geological Sciences
47.2.3 2D FielDS (e.g., graviTy anD magneTiSm)
Inadditiontotheobviousterrain-heightdata,orevenspectralimagery,thatcorrespondwithlati-tudeandlongitude,thereareotherfieldsthatmaptothe2Dsurfaceoftheplanet.Thesedatamaybecollectedasaninputstreamrecordedbyamovingcraftsuchasanairplaneorboat,ortheymaybecollectedonthesurfacebymovingmeasurementequipmenttoareasofinterest.Twofieldsofparticularinteresttogeologyaregravityandmagnetism.
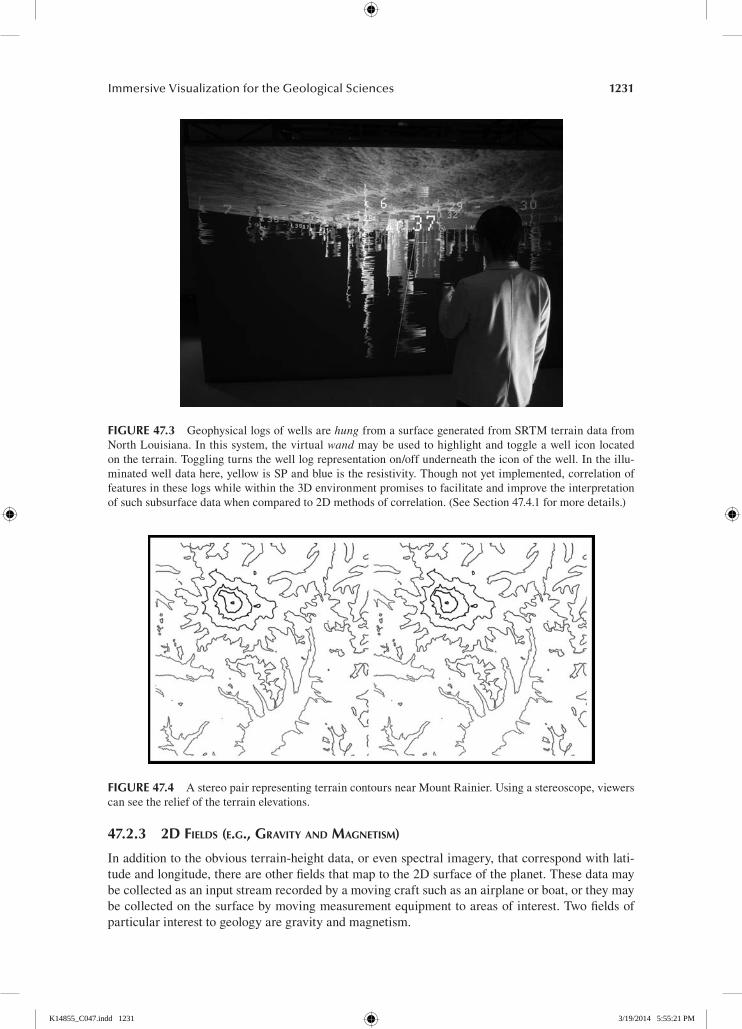
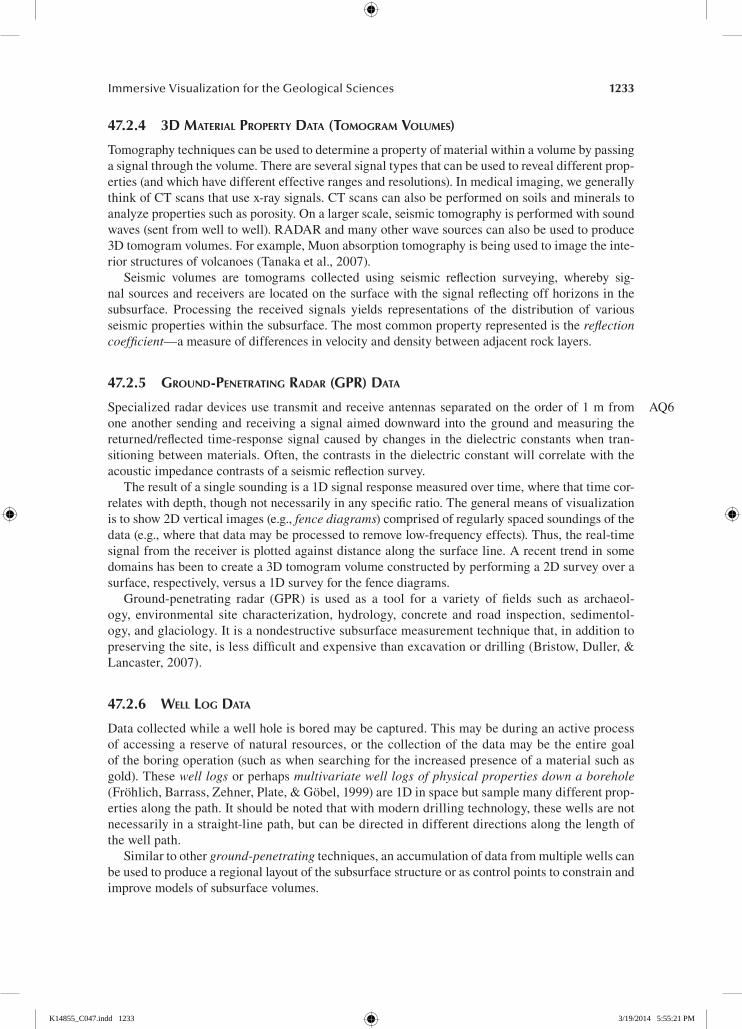
FIGure 47.3 GeophysicallogsofwellsarehungfromasurfacegeneratedfromSRTMterraindatafromNorthLouisiana.Inthissystem,thevirtualwandmaybeusedtohighlightandtoggleawelliconlocatedontheterrain.Togglingturnsthewelllogrepresentationon/offunderneaththeiconofthewell.Intheillu-minatedwelldatahere,yellowisSPandblueistheresistivity.Thoughnotyetimplemented,correlationoffeaturesintheselogswhilewithinthe3Denvironmentpromisestofacilitateandimprovetheinterpretationofsuchsubsurfacedatawhencomparedto2Dmethodsofcorrelation.(SeeSection47.4.1formoredetails.)
FIGure 47.4 AstereopairrepresentingterraincontoursnearMountRainier.Usingastereoscope,viewerscanseethereliefoftheterrainelevations.
K14855_C047.indd 1231 3/19/2014 5:55:21 PM
1232 Handbook of Virtual Environments: Design, Implementation, and Applications
Magneticdataaretypicallycollectedthroughairborneinstrumentsflowninapatternovertheregionof interest (suchas theChicxulubcraterpresentedearlier).Airbornecollectionofgravitydata,however, lackssufficientprecisiontobeusefulfordetailedanalysis.Thus,gravitydataaremoretypicallycollectedbylaboriouslymovingmeasurementinstrumentsonthesurfacefromloca-tiontolocation.Theirregularlysampleddatamaythenbeinterpolatedintoaregularrasterformatmoreconvenientforsomevisualizationtechniques—forexample,usingtheKriginginterpolationtechniqueasdoneinthecasestudyinSection47.4.1.
Eachofthese,andother,fields(e.g.,radioactivity,resistivity,chemical,heatflow)isinterpretedbasedonknowledgeoftheregionalgeologyofthesurveyandthelikelytypesofsubsurfacemateri-als,whichwouldleadtoanomaliesinthedata.Anomaliesareareasofthedatathathavevaluesdis-tinctfromtheirsurroundings—implyingthatinthesubsurface,therearematerialsthataredistinctfromtheirsurroundings(Figure47.6).
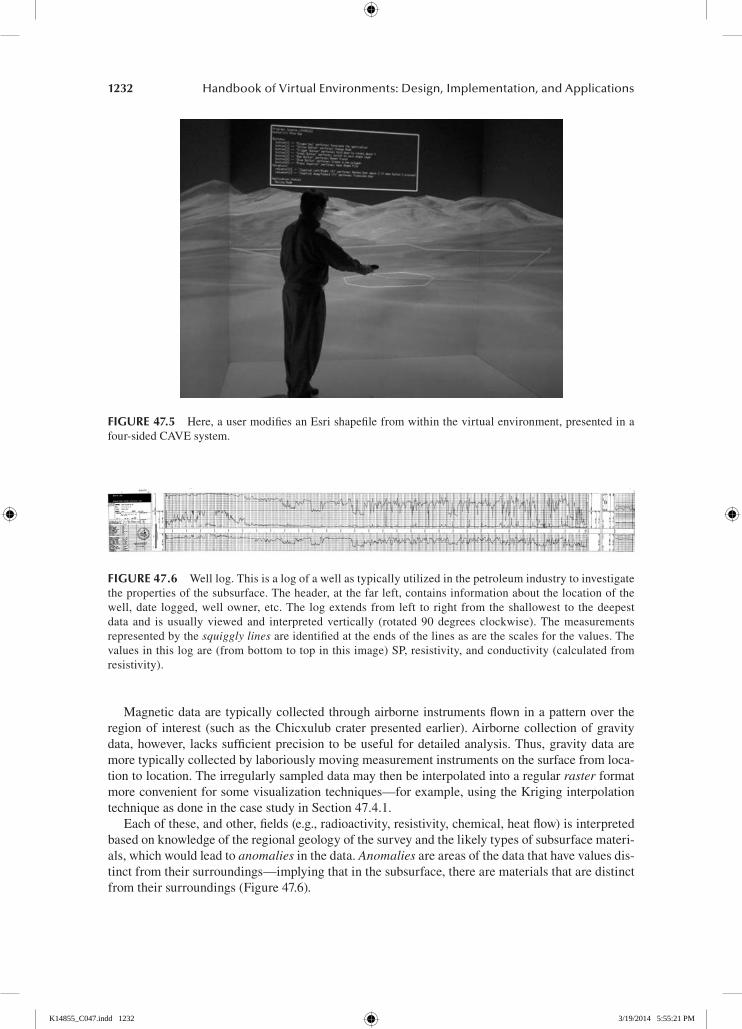
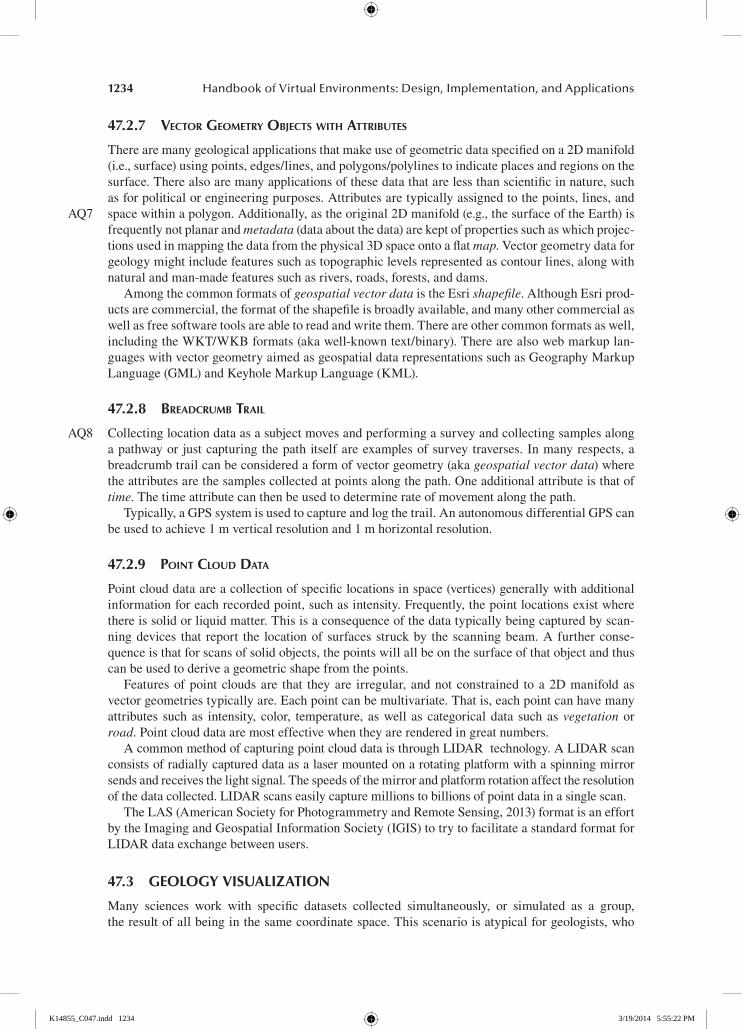
FIGure 47.5 Here,ausermodifiesanEsrishapefilefromwithinthevirtualenvironment,presentedinafour-sidedCAVEsystem.
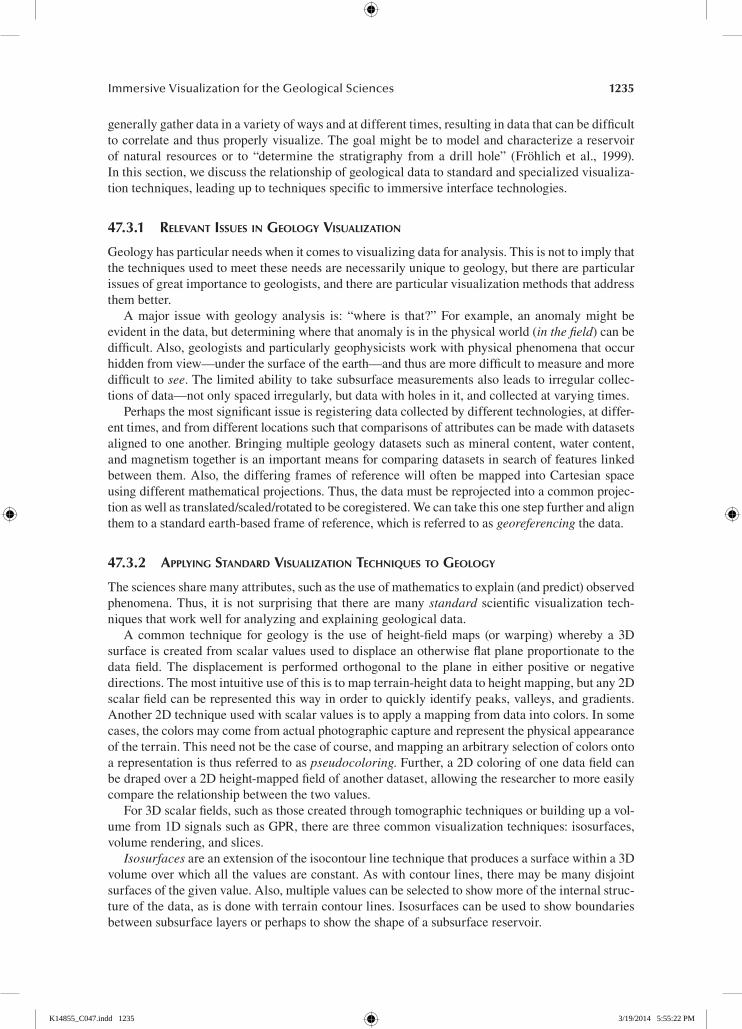
FIGure 47.6 Welllog.Thisisalogofawellastypicallyutilizedinthepetroleumindustrytoinvestigatethepropertiesofthesubsurface.Theheader,atthefarleft,containsinformationaboutthelocationofthewell,date logged,wellowner,etc.The logextendsfromleft torightfromtheshallowest to thedeepestdataand isusuallyviewedand interpretedvertically (rotated90degreesclockwise).Themeasurementsrepresentedbythesquiggly linesareidentifiedattheendsofthelinesasarethescalesforthevalues.Thevaluesinthislogare(frombottomtotopinthisimage)SP,resistivity,andconductivity(calculatedfromresistivity).
K14855_C047.indd 1232 3/19/2014 5:55:21 PM
1233Immersive Visualization for the Geological Sciences
47.2.4 3D maTerial ProPerTy DaTa (Tomogram volumeS)
Tomographytechniquescanbeusedtodetermineapropertyofmaterialwithinavolumebypassingasignalthroughthevolume.Thereareseveralsignaltypesthatcanbeusedtorevealdifferentprop-erties(andwhichhavedifferenteffectiverangesandresolutions).Inmedicalimaging,wegenerallythinkofCTscansthatusex-raysignals.CTscanscanalsobeperformedonsoilsandmineralstoanalyzepropertiessuchasporosity.Onalargerscale,seismictomographyisperformedwithsoundwaves(sentfromwelltowell).RADARandmanyotherwavesourcescanalsobeusedtoproduce3Dtomogramvolumes.Forexample,Muonabsorptiontomographyisbeingusedtoimagetheinte-riorstructuresofvolcanoes(Tanakaetal.,2007).
Seismic volumes are tomograms collected using seismic reflection surveying, whereby sig-nalsourcesandreceiversarelocatedonthesurfacewiththesignalreflectingoffhorizonsinthesubsurface. Processing the received signals yields representations of the distribution of variousseismicpropertieswithinthesubsurface.Themostcommonpropertyrepresentedisthereflection coefficient—ameasureofdifferencesinvelocityanddensitybetweenadjacentrocklayers.
47.2.5 grounD-PeneTraTing raDar (gPr) DaTa
Specializedradardevicesusetransmitandreceiveantennasseparatedontheorderof1mfromoneanothersendingandreceivingasignalaimeddownwardintothegroundandmeasuringthereturned/reflected time-responsesignalcausedbychanges in thedielectricconstantswhen tran-sitioningbetweenmaterials.Often,thecontrastsinthedielectricconstantwillcorrelatewiththeacousticimpedancecontrastsofaseismicreflectionsurvey.
Theresultofasinglesoundingisa1Dsignalresponsemeasuredovertime,wherethattimecor-relateswithdepth,thoughnotnecessarilyinanyspecificratio.Thegeneralmeansofvisualizationistoshow2Dverticalimages(e.g.,fence diagrams)comprisedofregularlyspacedsoundingsofthedata(e.g.,wherethatdatamaybeprocessedtoremovelow-frequencyeffects).Thus,thereal-timesignalfromthereceiverisplottedagainstdistancealongthesurfaceline.Arecenttrendinsomedomainshasbeentocreatea3Dtomogramvolumeconstructedbyperforminga2Dsurveyoverasurface,respectively,versusa1Dsurveyforthefencediagrams.
Ground-penetrating radar (GPR) is used as a tool for a variety of fields such as archaeol-ogy, environmental site characterization,hydrology, concrete and road inspection, sedimentol-ogy,andglaciology.Itisanondestructivesubsurfacemeasurementtechniquethat,inadditiontopreservingthesite,islessdifficultandexpensivethanexcavationordrilling(Bristow,Duller,&Lancaster,2007).
47.2.6 Well log DaTa
Datacollectedwhileawellholeisboredmaybecaptured.Thismaybeduringanactiveprocessofaccessingareserveofnaturalresources,orthecollectionofthedatamaybetheentiregoaloftheboringoperation(suchaswhensearchingfortheincreasedpresenceofamaterialsuchasgold).Thesewell logsorperhapsmultivariate well logs of physical properties down a borehole(Fröhlich,Barrass,Zehner,Plate,&Göbel,1999)are1Dinspacebutsamplemanydifferentprop-ertiesalongthepath.Itshouldbenotedthatwithmoderndrillingtechnology,thesewellsarenotnecessarilyinastraight-linepath,butcanbedirectedindifferentdirectionsalongthelengthofthewellpath.
Similartootherground-penetratingtechniques,anaccumulationofdatafrommultiplewellscanbeusedtoproducearegionallayoutofthesubsurfacestructureorascontrolpointstoconstrainandimprovemodelsofsubsurfacevolumes.
AQ6
K14855_C047.indd 1233 3/19/2014 5:55:21 PM
1234 Handbook of Virtual Environments: Design, Implementation, and Applications
47.2.7 vecTor geomeTry objecTS WiTh aTTribuTeS
Therearemanygeologicalapplicationsthatmakeuseofgeometricdataspecifiedona2Dmanifold(i.e.,surface)usingpoints,edges/lines,andpolygons/polylinestoindicateplacesandregionsonthesurface.Therealsoaremanyapplicationsofthesedatathatarelessthanscientificinnature,suchasforpoliticalorengineeringpurposes.Attributesaretypicallyassignedtothepoints,lines,andspacewithinapolygon.Additionally,astheoriginal2Dmanifold(e.g.,thesurfaceoftheEarth)isfrequentlynotplanarandmetadata(dataaboutthedata)arekeptofpropertiessuchaswhichprojec-tionsusedinmappingthedatafromthephysical3Dspaceontoaflatmap.Vectorgeometrydataforgeologymightincludefeaturessuchastopographiclevelsrepresentedascontourlines,alongwithnaturalandman-madefeaturessuchasrivers,roads,forests,anddams.
Amongthecommonformatsofgeospatial vector dataistheEsrishapefile.AlthoughEsriprod-uctsarecommercial,theformatoftheshapefileisbroadlyavailable,andmanyothercommercialaswellasfreesoftwaretoolsareabletoreadandwritethem.Thereareothercommonformatsaswell,includingtheWKT/WKBformats(akawell-knowntext/binary).Therearealsowebmarkuplan-guageswithvectorgeometryaimedasgeospatialdatarepresentationssuchasGeographyMarkupLanguage(GML)andKeyholeMarkupLanguage(KML).
47.2.8 breaDcrumb Trail
Collectinglocationdataasasubjectmovesandperformingasurveyandcollectingsamplesalongapathwayor justcapturingthepathitselfareexamplesofsurveytraverses.Inmanyrespects,abreadcrumbtrailcanbeconsideredaformofvectorgeometry(akageospatial vector data)wheretheattributesarethesamplescollectedatpointsalongthepath.Oneadditionalattributeisthatoftime.Thetimeattributecanthenbeusedtodeterminerateofmovementalongthepath.
Typically,aGPSsystemisusedtocaptureandlogthetrail.AnautonomousdifferentialGPScanbeusedtoachieve1mverticalresolutionand1mhorizontalresolution.
47.2.9 PoinT clouD DaTa
Pointclouddataareacollectionofspecificlocationsinspace(vertices)generallywithadditionalinformationforeachrecordedpoint,suchasintensity.Frequently,thepointlocationsexistwherethereissolidorliquidmatter.Thisisaconsequenceofthedatatypicallybeingcapturedbyscan-ningdevices that report the locationof surfaces struckby thescanningbeam.Afurtherconse-quenceisthatforscansofsolidobjects,thepointswillallbeonthesurfaceofthatobjectandthuscanbeusedtoderiveageometricshapefromthepoints.
Featuresofpointcloudsare that theyare irregular,andnotconstrained toa2Dmanifoldasvectorgeometriestypicallyare.Eachpointcanbemultivariate.Thatis,eachpointcanhavemanyattributes suchas intensity, color, temperature, aswell ascategoricaldata suchasvegetation orroad.Pointclouddataaremosteffectivewhentheyarerenderedingreatnumbers.
AcommonmethodofcapturingpointclouddataisthroughLIDAR technology.ALIDARscanconsistsofradiallycaptureddataasalasermountedonarotatingplatformwithaspinningmirrorsendsandreceivesthelightsignal.Thespeedsofthemirrorandplatformrotationaffecttheresolutionofthedatacollected.LIDARscanseasilycapturemillionstobillionsofpointdatainasinglescan.
TheLAS(AmericanSocietyforPhotogrammetryandRemoteSensing,2013)formatisaneffortbytheImagingandGeospatialInformationSociety(IGIS)totrytofacilitateastandardformatforLIDARdataexchangebetweenusers.
47.3 GeoloGy VIsualIzatIon
Many sciences work with specific datasets collected simultaneously, or simulated as a group,theresultofallbeinginthesamecoordinatespace.Thisscenarioisatypicalforgeologists,who
AQ7
AQ8
K14855_C047.indd 1234 3/19/2014 5:55:22 PM
1235Immersive Visualization for the Geological Sciences
generallygatherdatainavarietyofwaysandatdifferenttimes,resultingindatathatcanbedifficulttocorrelateandthusproperlyvisualize.Thegoalmightbetomodelandcharacterizeareservoirof natural resourcesor to “determine the stratigraphy fromadrill hole” (Fröhlich et al., 1999).Inthissection,wediscusstherelationshipofgeologicaldatatostandardandspecializedvisualiza-tiontechniques,leadinguptotechniquesspecifictoimmersiveinterfacetechnologies.
47.3.1 relevanT iSSueS in geology viSualizaTion
Geologyhasparticularneedswhenitcomestovisualizingdataforanalysis.Thisisnottoimplythatthetechniquesusedtomeettheseneedsarenecessarilyuniquetogeology,butthereareparticularissuesofgreatimportancetogeologists,andthereareparticularvisualizationmethodsthataddressthembetter.
Amajor issuewithgeology analysis is: “where is that?”For example, an anomalymightbeevidentinthedata,butdeterminingwherethatanomalyisinthephysicalworld(in the field)canbedifficult.Also,geologistsandparticularlygeophysicistsworkwithphysicalphenomenathatoccurhiddenfromview—underthesurfaceoftheearth—andthusaremoredifficulttomeasureandmoredifficulttosee.Thelimitedabilitytotakesubsurfacemeasurementsalsoleadstoirregularcollec-tionsofdata—notonlyspacedirregularly,butdatawithholesinit,andcollectedatvaryingtimes.
Perhapsthemostsignificantissueisregisteringdatacollectedbydifferenttechnologies,atdiffer-enttimes,andfromdifferentlocationssuchthatcomparisonsofattributescanbemadewithdatasetsalignedtooneanother.Bringingmultiplegeologydatasetssuchasmineralcontent,watercontent,andmagnetismtogetherisanimportantmeansforcomparingdatasetsinsearchoffeatureslinkedbetweenthem.Also, thedifferingframesofreferencewilloftenbemappedintoCartesianspaceusingdifferentmathematicalprojections.Thus,thedatamustbereprojectedintoacommonprojec-tionaswellastranslated/scaled/rotatedtobecoregistered.Wecantakethisonestepfurtherandalignthemtoastandardearth-basedframeofreference,whichisreferredtoasgeoreferencingthedata.
47.3.2 aPPlying STanDarD viSualizaTion TechniqueS To geology
Thesciencessharemanyattributes,suchastheuseofmathematicstoexplain(andpredict)observedphenomena.Thus, it isnotsurprising that therearemanystandard scientificvisualization tech-niquesthatworkwellforanalyzingandexplaininggeologicaldata.
Acommon technique forgeology is theuseofheight-fieldmaps (orwarping)wherebya3Dsurfaceiscreatedfromscalarvaluesusedtodisplaceanotherwiseflatplaneproportionatetothedata field. The displacement is performed orthogonal to the plane in either positive or negativedirections.Themostintuitiveuseofthisistomapterrain-heightdatatoheightmapping,butany2Dscalarfieldcanberepresentedthiswayinordertoquicklyidentifypeaks,valleys,andgradients.Another2Dtechniqueusedwithscalarvaluesistoapplyamappingfromdataintocolors.Insomecases,thecolorsmaycomefromactualphotographiccaptureandrepresentthephysicalappearanceoftheterrain.Thisneednotbethecaseofcourse,andmappinganarbitraryselectionofcolorsontoarepresentationisthusreferredtoaspseudocoloring.Further,a2Dcoloringofonedatafieldcanbedrapedovera2Dheight-mappedfieldofanotherdataset,allowingtheresearchertomoreeasilycomparetherelationshipbetweenthetwovalues.
For3Dscalarfields,suchasthosecreatedthroughtomographictechniquesorbuildingupavol-umefrom1DsignalssuchasGPR,therearethreecommonvisualizationtechniques:isosurfaces,volumerendering,andslices.
Isosurfacesareanextensionoftheisocontourlinetechniquethatproducesasurfacewithina3Dvolumeoverwhichallthevaluesareconstant.Aswithcontourlines,theremaybemanydisjointsurfacesofthegivenvalue.Also,multiplevaluescanbeselectedtoshowmoreoftheinternalstruc-tureofthedata,asisdonewithterraincontourlines.Isosurfacescanbeusedtoshowboundariesbetweensubsurfacelayersorperhapstoshowtheshapeofasubsurfacereservoir.
K14855_C047.indd 1235 3/19/2014 5:55:22 PM
1236 Handbook of Virtual Environments: Design, Implementation, and Applications
Volume rendering is an alternative 3D visualization technique that can be used to see mul-tiplefeatureswithinavolume.Asopposedto isosurfaces,wherethe3Ddataareconvertedintosolidstructureswithinthevolume,volumerenderingtreatsthedataasanebulouscloud.Theviewthrough thecloud containscolorsbasedon thevaluesalong the lineof sight.Colorsaswellasopacitiesaremappedontospecificdatavalues.Thisisreferredtoasthetransfer function.Throughtheuseofpartialopaqueness(i.e.,partialtransparency),particularvalueswithinthedatacanbehighlightedtodifferingdegrees,whichthusleadtothenebulous-stylerendering.
Reducing the volume to specific slices through it is another way to peer into a 3D volume.A commonvisualizationmethodistoslicethroughoneofthecardinalplanes(i.e.,orthogonaltooneoftheprimaryaxes).Aslightlymorecomplexalgorithmcanbeusedtoslicethroughthedataatanyangle.Ineithercase,ininteractivevisualizations,theuserisgenerallygiventheopportunitytomovetheslicearound,givingabetterperceptionoftheentiredataset.Amethodmorespecifictogeologyvisualizationistotakeaslicealongatraverse(seeSection47.3.3).
Pointclouddatacanbeconvertedintogeometricshapeswithtechniquessuchasalpha shape and Delaunay triangulation(Edelsbrunner&Mucke,1994).Butwithmodernhardwarerenderingcapabilities,amorecommonmethodhasbecometosimplyrenderall,oralargesubsetof,thepointsthemselves.Eachpointmaybecoloredbyanyoftheassociatedmultivariatedata(actualcolor,timeofflight,classification,etc.).
Thecoloringtechniquediscussedearlierwiththe2Dvisualizationtechniquescanequallybeappliedto1Dand3Dscalarfieldsaswell.Thechoiceofhowtomapvaluesintocolorsisaveryimportantone,thoughalltoooften,adefaultrainbowcolormappingisused.Poorchoiceoncolor mappingcandisguiseimportantfeaturesorcreatetheappearanceofaninterestingphenomenonthatdoesn’texist(Rogowitz&Trenish,1998).
Therepresentationofvectordatasuchasfromfloworgradientfieldscanbedoneinahandfulofways,affectedbywhetherthefieldisinsteadystateorchangesovertime.Acommonandeasytocomprehendflowfieldrepresentationismoving particlesthatarereleasedfromstrategiclocationsandadvectedthroughthefield.Streamlinesandstreaklinesrepresentthepathsthatparticlesfollowovertimeorpathsofparticlesthatareinfinitelyfast.Line interval convolution(LIC)isatechniquethatshowstheentiretyofasteady-stateflowfieldbywarpingawhitenoisetexture.TheLICtech-niqueworksbestasa2Dtechnique(perhapsona2Dslicethrougha3Dfield),whereastheothertechniquesworkequallywellfor3Ddata.
47.3.3 viSualizaTion TechniqueS For geology
Thenatureofgeologicalphenomenontakingplacebelowtheplanet’ssurface(thoughsometimesmadevisiblethroughgeologicorhumanactivity)isprimarilyreflectedbymeansofdatacollectionandthensubsequentlyhowtolinksubsurfacevisualizationstorecognizablesurfacelandmarks.
Giventhatsomefeaturesofaplanet’sgeologyarereflectedin the topographyof thesurface,anearlyvisualizationtechniquewastheuseofisocontour linesdrawnatregularintervalstogivebothaquantitativemeasureoftheheightoftheterrainaswellasaqualitativeviewofthegradi-entofthesurface.Thiswasalsoextendedtobeanearlyuseofstereoscopicdataanalysisthroughthecreationofstereo-pairtopographiccontourmaps(Blee,1940;Gay,1971)andbeforethataerialphotography(Bagley,1917;MacLeod,1919).(Althoughtheuseofstereotoviewterrainfeatureshassincebecomecommonplace,theuseofstandard[flat]topographic contour and terrain mapsremainsprevalent.)
Thevector geometry objects with attributedatadiscussedinSection47.2.7alsoleadtospecificvisualizationtechniquesthatcanbethoughtofascartographicinnature.Differentpolygonalshaperegionsmightbecoloreddifferentlybasedonvegetation,landuse,orgeologicera.
ThenatureofwelllogorGPRdata(atleastwhenlookingatasingletransmissionandreturn)mapseasilyintorepresentationsofthedataasasignalsimilarinnaturetotherecordingofasingleseismictrace—a1D needle vibration movement plotted over time.Ofcourse,forwelllogorGPR
AQ9
K14855_C047.indd 1236 3/19/2014 5:55:22 PM
1237Immersive Visualization for the Geological Sciences
data, the data are sensory responses plotted over depth. The 3D nature of the measured objectbeginstobecomeapparentthroughmultipleplotsofwelllogsorGPRrecordings.
Fence diagrams,whichare2Ddataslicestakenalongasurfacetraverse,areageologicalvisual-izationtechniquethatisusedtoviewsubsurfacedatathatcutsacrossanimportantterrainfeature.AsmentionedearlierinSection47.3.2,fencediagramsaresimilartosomestandardslicevisual-izationtechniquesusedinotherfieldsofresearch.Becauseweknowthatdataoneithersideoftheslicewillgenerallybesimilartothesliceitself,itallowstheresearchertomakeoverallconclusionsregardingtheneighboringgeologicmaterial.
Techniquesthatcut awaypartofthesolidrepresentationoftheplanet’ssurfaceareclearlyveryimportant when working with data measured from beneath the terrain surface. Similar to howsomemedicalvisualizationsmight showanotherwisecompleteexternalviewofaperson,withcertainlayersofskin,muscle,etc.,removedtoshowtheinternalorgansinaparticularlocation,thesamecanbedonefortheEarthorothercelestialbody.Wecanstripawaythetopsoiltoseewhat’sbeneath.Oftentheedgesoftheholecreatedbythecutawaywillthemselvesshowsubsurfacedata,usingtheslicetechniquesdescribedearlier.Theninternally,techniquessuchasisosurfacesorvol-umerenderingmightshowreservoirformationsormineralcontent.
47.3.4 TemPoral DaTa
Whileit’seasytojumptotheconclusionthatthetimescaleofgeologicprocesseslimitstheneedfordatasetsinvolvingmorethanasingletimestep,thisisofcoursenotthecase.Forstarters,therearegeologicevents thathappen inhuman-scale time:activevolcanicactivity,earthquakeshifts,landslides,aswellasslowererosiveactivitiestonamefour.Furthermore,thereareunboundedareasinwhichgeologicprocessesmightbecomputationallysimulated,allowingforthepredictionofhowlandmasses,etc.,changeinmuchlargertimescales.Smallsimulationsmighthavehundredsoftimesteps,andgivensufficientcomputeresources,thousandsormoretimestepsmightbeproduced.
Wethinkoftime-lapsemoviesasoneswhereslowlychangingphenomenaarebroughttolifethroughlong-intervalphotographypresentedbackinrapidsuccession.In thisway,wecanmoreeasilyseebehaviorandflowthatwasdifficulttoperceiveatrealtime.Likewise,geologicandotherscientificdatacanbecollectedovertimewithlargetimeintervalsbetweencollections,andthesedatacanbeviewedinrapidpresentation.Twoareaswherethisismorecommoninthegeologicsciencesareintime-lapse seismic survey dataandmultipleLIDARcapturesusedfordetectingandmeasuringchangessuchasbeforeandafterearthquakesandlandslides.TheapplicationinthecasestudyinSection47.4.2(LidarViewer)isfrequentlyusedwithjustthistypeofdata.
Butingeology,evenstaticdatarepresentchangeovertime.Depositedsedimentsbuiltupoverlongperiodsoftimeformingundergroundrocklayersandotherphenomena.Workingthroughthelayers,geologistsdrawconclusions,whichthenallowthecreationoftemporalmodelsofgeologi-calactivity.OnesuchexampleishighlightedinthecasestudyinSection47.4.4wherethechangesin sand dunes are analyzed through an application with an immersive interface and tools thatspecificallymakeuseof the6-DOF inputsaffordedby that interface.Similarly,archaeologistsgenerallycorrelatethedepthinwhichanartifactisfoundwithincreaseinageasexemplifiedinSection47.4.3.
47.3.5 beneFiTS To geologic viSualizaTion From The immerSive inTerFace
Therearebothgeneralandspecificwaysinwhichimmersivetechnologiescanbenefitthevisualiza-tionofscientificdata.Someofthegeneralbenefitsderivemerelyfromtheaccidentalpropertiesofageneralimmersivesystem:substantialcomputepoweranddisplaysizeandresolution,whereasthebenefitofperspectiverenderingisspecificallypartofthenatureofimmersivesystems.
Perspectiverenderingiswhatmakesimmersivesystems(virtualreality[VR])unique.Itisthemeansbywhich,whenanimmersedviewermovestheirhead,theworldrespondsasthoughitwere
AQ10
K14855_C047.indd 1237 3/19/2014 5:55:22 PM
1238 Handbook of Virtual Environments: Design, Implementation, and Applications
actuallytherebeforethem.Thisfeatureprovidesimprovedperceptionoftherelationshipbetweenobjectsbasedonthatabilityofmovingone’sheadtoseetheworldfromanewperspective.
Mostimmersivedisplaysystemshavealargerfield of regardthanatypicaldesktoporlaptopdisplay.Thefieldofregardisameasureofhowmanydirectionsyoucanlooktoseethevirtualworld.Largerscreens,multiplescreens,andscreensthatfollowyouaretypicalwaysofincreas-ingthefield.Increasedfieldofregardbenefitsvisualizationtoolsbyprovidingmorerealestatetoplacethedata.Geologicallyscaledsimulationscanoftengeneratelargedatasets,andhavingtheabilitytoputasmuchdatainspaceaspossiblecanbehelpful.Relatedtothat,whenfocusedonaparticularphenomenon,itcanbehelpfultoseeitinitslargercontext.Thelargescreenspaceallows for the larger contextwhile placing important details in front and center, especially forhigher-resolutionsystems.Ontheotherhand,whensurroundingtheuserwithdata,itcanbecomedifficultforthemtofindtheuserinterface.Somesystemsthereforeallowtheusertocontroltheplacementoftheinterface,aswiththeLidarViewerapplicationinSection47.4.2.Anothersolu-tionistouseaninterfacethatisalwaysfrontandcenterwhensummoned,suchastheradialmenudiscussedinSection47.4.1.
Theotheraccidentalbenefitofusingimmersivesystemsistheincreasedcomputationandren-deringcapabilitiesthatareoftenincludedaspartoftheintegratedsolution.Thus,moredatacanbeheldinmemory,processed,andrenderedthanwithatypicallaptopordesktopcomputer.
Thereareamyriadofspecificuserinterfacefeaturesthatcanbeaddedtoanimmersiveapplica-tion.Atthispoint,therehasbeenonlyminimalcoalescencearoundcommonuserinterfacetech-niquesorlibraries.Thisstewofinterfacesisnotnecessarilyagoodthinginthelongrun,butasthestillquitenascenttechnologyevolves,thisflexibilityprovidesopportunitiesfornewandquiteuseful innovations.Someof these innovativeuser interfacesarediscussed in thecasestudiesofSection47.4.InSection47.4.1,theuseof3D magic lensesisdemonstratedasameanstocorrelateinformationfromdifferingbutspatiallyoverlappingdatasets.InSection47.4.2,ahandheldpaintingoperationisprovidedinordertoquickly,yetspecifically,selectpointsthatbelongtoaparticulargrouping.InSection47.4.4,avirtual Brunton compasswascreatedtomimictheutilityoftherealarticlebutappliedwithinthevirtualworld.
47.4 exemplar applICatIons and lessons learned
As immersive technologies began maturing in the late 1990s, opportunities for visualizationresearchers toworkwithgeologistsbegan tomaterialize.Twogoodexampleswerereportedatthe1999conferenceonvisualizationhostedbytheIEEE(InstituteofElectricalandElectronicsEngineers).TheseexamplesincludeworkbyFröhlichetal.(1999),whichprovidedauniqueinter-faceforgeologiststoviewseismicvolumes,andwelllogsusingisosurface,andslice-planetech-niques controlled by a newly created 6-DOF input device dubbed the Cube-Mouse. The otherrelatedprojectfromthe1999visualizationconferenceisbyWinkler,Bosquet,Cavin,andPaul(1999)wheretheyextendedanexistinggeosciencevisualizationprogramtoworkinanimmer-sive display system. Experimentation continued in the first decade of the new millennium asexemplifiedbyaboreholedrillingplanningapplication(Dorn,Touysinhthiphonexay,Bradley,&Jamieson,2001),aswellastheuseofGPRtoconstructanundergroundantcolonynetworkbasedontheboundarybetweensoilandairunderthesurface(LaFayette,Parke,Pierce,Nakamura,&Simpson,2008).
Inthesubsectionsthatfollow,wewilltakeaquicklookatfourapplicationsthatmakeuseofimmersivetechnologiestoassist intheprocessofgaininginsight intodataaboveandbelowtheplanetarysurface.Theseapplicationswerewrittenincollaborationwithresearchgeologistswhowereseekingbetterwaystounderstandtheirdata.Ingeneral,we’llgivealittlebackgroundinfor-mation,discussthevisualizationtechniquesused,presentthespecificwaysimmersivetechnologieswereused,anddiscusssomeofthebenefitsandotheroutcomesoftheproject.
K14855_C047.indd 1238 3/19/2014 5:55:22 PM
1239Immersive Visualization for the Geological Sciences
47.4.1 aPPlicaTionS For exPloraTion oF TerrainS, aSSociaTeD geoPhySical DaTa, anD Well logS aT The univerSiTy oF louiSiana aT laFayeTTe
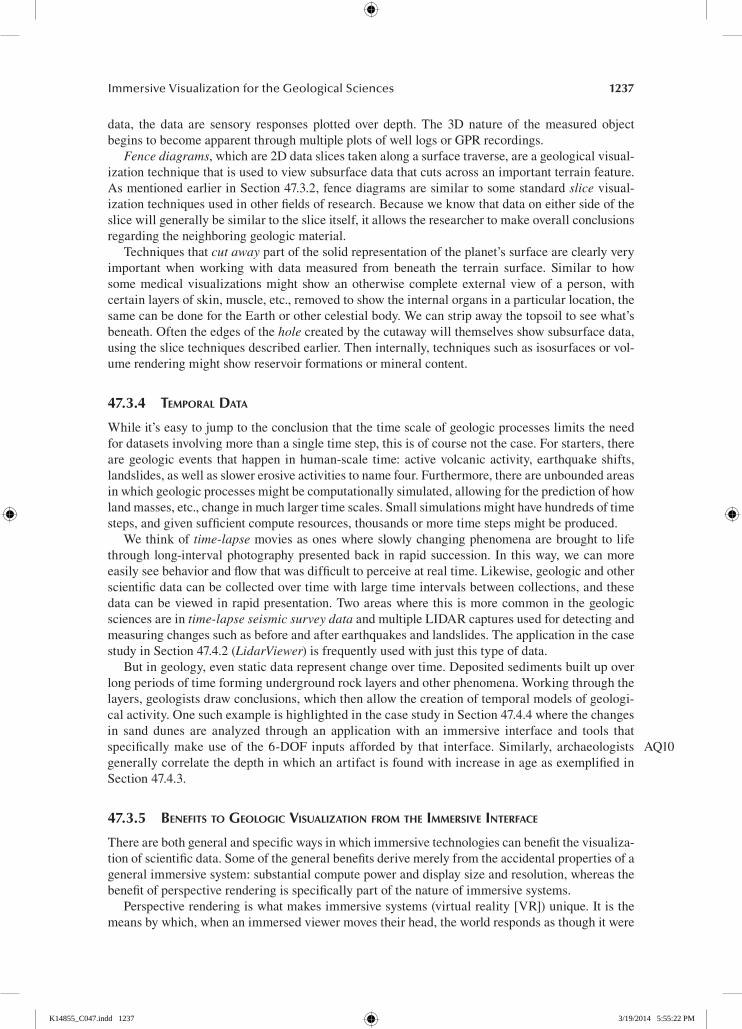
BorstandKinslandappliedVRenvironments toexploregeosciencedatasets including(1)acol-lectionof3DdatasetsovertheChicxulubimpactcrater—forexample,BorstandKinsland(2005);(2)dataforinsightintowaterdrainageintheLafayette,Louisianaregion(Kinsland,Borst,Best,&Baiyya,2007);and(3)welllogdatafromtheNorthLouisianaCoalbedMethanedatabase—forexample, Kinsland, Borst, Tiesel, and Bishop (2008). They visualized these datasets in HMDs,single-wallstereoscopicprojectiondisplayswithtrackedviewpoint,aCAVE-likedisplay,areach-in-style fishtank display (a desktop display that provides a haptic stylus tool in a fishtank-sizeddisplayvolume),andalow-cost3DTV-basedenvironment.ThesystemshavebeenusedbothforgeologicalinvestigationsbyKinslandandcolleaguesaswellasforeducationalpurposesingeologyclasses(seeFigure47.7).
47.4.1.1 rendering and Interaction for terrain InterpretationGraphicalrenderinganddisplayofthesedatasetsforVRwasrelativelysimplecomparedtosup-portinguserinteraction.Earlyversionsofthesystemsachievedreal-timerenderingwithmeshtil-ingandculling,carefuluseofgraphicscardfeatures,andreduced-resolutionmeshestexturedwithcolorsandshadingfromhigher-resolutionversions.ToolkitssuchasOpenSceneGraph(Wang&Qian, 2010) andVRJuggler (Bierbaumet al., 2001)provided commongraphicsoperations andaccess to standardVRdevices inaportablemanner (withextensionsnecessary for thefishtankdevices).Toolkitsfor3Dinteractionand3Dinteractiontechniques,ingeneral,arelessdeveloped,leadingtotrade-offsbetweeninterfacequalityanddevelopmenttime.Forgeneralsystemcontrol,
AQ11
FIGure 47.7 UsersviewingChicxulubcraterdata.Twodisplaysareshown:alargeprojectiondisplayattheLouisianaImmersiveTechnologiesEnterprise(LITE)andafishtankdisplay(left)thatallowsausertoreachintoa3Dvolumewithahapticstylusunderamirror.ThetwosystemswerenetworkedforademonstrationattheGulfCoastAssociationofGeologicalSocieties(GCAGS)2006geologyconvention.Twomovableboxesarevisibleinthemaindisplay:oneselectsasourceregionofthemainmesh,andtheothershowsasecondarydatasetfromthatsourceregion.Aradialmenucanbeseennearthetopcenter.Annotativemarksofvariouscolorsappear,arrangedalongconcentricarcsnearthestandingusers.
K14855_C047.indd 1239 3/19/2014 5:55:23 PM
1240 Handbook of Virtual Environments: Design, Implementation, and Applications
amenutoolkitwasdevelopedasacompromisebetweennaïveinterfaces(e.g.,functionsmappedtomanybuttons)andspecialized3Dinteractiontechniques(e.g.,directorwidget-basedmanipulationofobjects).Userstudiesoftheray-basedmenuinteractionsupporttheuseoflargeradiallayouts,contextuallocationofmenusatobjectsofinterest,andautomaticscalingforconstantprojectedsize(Das&Borst,2010a,2010b).Contextuallocationcancausemenuplacementbehindotherobjects,sothemenuswererenderedinawaythatreveals themthroughoccludingobjects,withreducedintensity.
Theability todirectlymove through thedatawithnaturalnavigation techniques isofprimeimportance for data exploration. Kinsland notes a personal affinity for navigation with naturalmovement(headmotionandwalking)inHMDandCAVEdisplays.Thisisaugmentedwithwand-based flying, grab the world, and scaling interactions to provide a greater range of movement.Unconstrainednavigationcanleadtouncomfortableviews,especiallywhenobjectsaretooclosetotheviewer,wherestereoscopicimagesaredifficulttofuse.Thus,whentheuserwantstoseealoca-tionontheterraininmoredetail,itcanbebettertoscaleupthesceneaboutthepointofinterestthantoflycloser.Thedifferenceisnotalwaysclearto,oradequatelycontrolledby,users—especiallythosenotaccustomedtostereoscopicviewing.Insingle-sideddisplays,rangingfromsmall-scalefishtankdisplaystolargerprojectionwalls,gooddistanceanddatasetorientationcanbemaintainedwithcenter of workspace–styleconstraints(Wareetal.,2001).InBorstandKinsland’ssystems,thisisachievedinpartbyaconstrainedgrabwheretranslationsareconstrainedtolateralslidinginaworkspace-centereddataset-alignedcoordinateframeandrotationsareconstrainedtofitanazimuthelevationmodelforthecenteredframe.
Withagoodnavigationalschemeinplace,thenextfeatureofimportanceistheabilitytoplaceandadjustannotativemarkers.IntheimpactcraterandLIDARterrainsystems,usersplaceandeditmarkersonsurfacestoannotateinterestingfeatures.Theapproachvarieddependingondis-play type. Ina single-walldisplay, themarkingandeditingusually involved ray-basedpointingat targets. InearlierCAVEandHMDimplementations,usersmoved theirhand (wand)directlyovertargetstodropmarkersinplace.Theray-basedmanipulationrequireslessnavigation,astheusercanbefurtherfromthetarget,butitislesspreciseatagivendatasetscaleduetofundamen-talproblemsoftheimprecisionoflong-rangeraypointing.Inthefishtankdisplayconfiguration,annotationscanbemoresophisticatedandpreciselyplaced:itspen-liketoolhasstablemechanicaltrackingandcanbeusedtodrawdirectlyondatasets.Thepenalsosupportsforcefeedbackthatallowsuserstofeelvirtualsurfaces.Itwasshownthattheforcefeedbackimprovesperformanceofuserstracingpathsonterrains,particularlywhenpathsfollowterrainfeaturesratherthancrossoverbumps(Raghupathy&Borst,2012).Researcherspreviouslysuggestedvariouswaysforforcefeed-backtoaidinteractioningeoscience-typeapplications—forexample,Harding,Kakadiaris,Casey,andLoftin(2002)andKomerskaandWare(2004).Forexample,forcecuescouldsupportpointorterrainediting,menuselection,andinteractive3Dwidgets.Othershavediscussedvariousbenefitsoffishtankconfigurationsoverfully immersivedisplays(Demiralp,Jackson,Karelitz,Zhang,&Laidlaw,2006;Mulder&Boschker,2004).Theyhaverelativelylow-costandspacerequirements,highangularresolution,and(forthereach-inapproach)afocalplanesuitedtohand-basedinterac-tionswithvisualizedobjects.
47.4.1.2 Well log VisualizationInthewelllogvisualizationsystem,usersviewverticalplotsofresistivityandspontaneouspoten-tial(SP)underaterrainandcanselectaplotorwelltomovemarkersalongitsaxis.Alloranysubsetofthewelllogsmaybedisplayedsimultaneously.Theirverticalscaleisadjustablesothattheusermightinvestigatethesignaturesoftheindividuallogsorofaselectionoflogsatvariousscalestohighlightfeatures.Correlationmarkersthatweredeterminedforeachwellinaseparate2Dsystemarealsodisplayedinthissystem.
Thissystem,asitis,servestoconvey3Drelationshipsofthewellsinawaythatpseudo-3Dren-deringsmaynot.Wheninsidethedata,ageologistfeelsmoreasiftheyareviewingandinterpreting
K14855_C047.indd 1240 3/19/2014 5:55:23 PM
1241Immersive Visualization for the Geological Sciences
fromwithintheearth.Ifmanywelllogsarevisiblesimultaneouslyatvariousdepths,thestereo-scopicvisualsmayhelpdisambiguateoverlappingplots.Beingabletooverviewmultiplewelllogscanbehelpfulfordeterminingsubsurfacestructures,lithologies,fluidcontents,faults,etc.,basedonplotfeaturesacrosswelllogs.Inthefuture,segmentsofmultiplewellscouldbeselected,moved,andscaledforcomparison(correlation).Correlationpointsmarkedonmultiplewellscouldinflu-enceacomputer-generated3Dsurfaceorvolumeinterpolated/extrapolatedthroughoutthedatasettoaidfurtherinvestigation(thistypeofinterpreter/computerinteractioniscommoninpackagesthataidinterpretationofseismicdatavolumes).VRwouldhelppreserve,correct,andmaintainconstantvisibilitybetweengeospatialrelationshipsoffeatures,reducingmentaltransformationsbetween2Dphysicalimagesand3Dmentalimages.
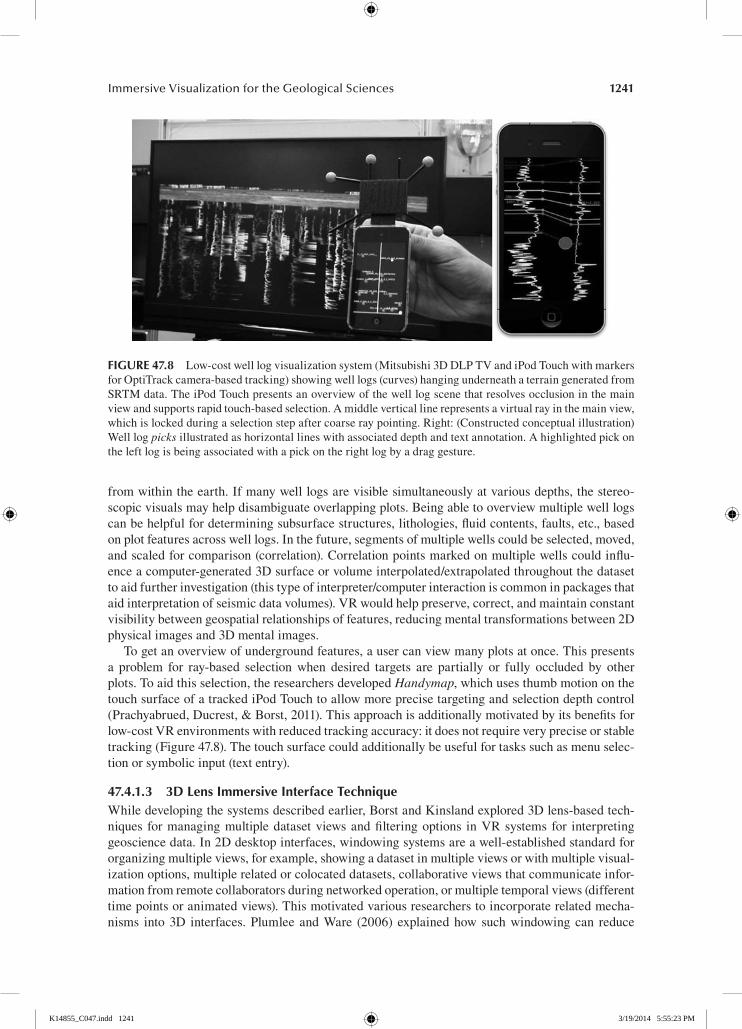
Togetanoverviewofundergroundfeatures,ausercanviewmanyplotsatonce.Thispresentsa problem for ray-based selection when desired targets are partially or fully occluded by otherplots.Toaidthisselection,theresearchersdevelopedHandymap,whichusesthumbmotiononthetouchsurfaceofatrackediPodTouchtoallowmoreprecisetargetingandselectiondepthcontrol(Prachyabrued,Ducrest,&Borst,2011).Thisapproachisadditionallymotivatedbyitsbenefitsforlow-costVRenvironmentswithreducedtrackingaccuracy:itdoesnotrequireverypreciseorstabletracking(Figure47.8).Thetouchsurfacecouldadditionallybeusefulfortaskssuchasmenuselec-tionorsymbolicinput(textentry).
47.4.1.3 3d lens Immersive Interface techniqueWhiledevelopingthesystemsdescribedearlier,BorstandKinslandexplored3Dlens-basedtech-niques formanagingmultipledatasetviewsandfilteringoptions inVRsystems for interpretinggeosciencedata.In2Ddesktopinterfaces,windowingsystemsareawell-establishedstandardfororganizingmultipleviews,forexample,showingadatasetinmultipleviewsorwithmultiplevisual-izationoptions,multiplerelatedorcolocateddatasets,collaborativeviewsthatcommunicateinfor-mationfromremotecollaboratorsduringnetworkedoperation,ormultipletemporalviews(differenttimepointsoranimatedviews).Thismotivatedvariousresearcherstoincorporaterelatedmecha-nisms into3D interfaces.PlumleeandWare (2006)explainedhowsuchwindowingcan reduce
FIGure 47.8 Low-costwelllogvisualizationsystem(Mitsubishi3DDLPTVandiPodTouchwithmarkersforOptiTrackcamera-basedtracking)showingwelllogs(curves)hangingunderneathaterraingeneratedfromSRTMdata.TheiPodTouchpresentsanoverviewofthewelllogscenethatresolvesocclusioninthemainviewandsupportsrapidtouch-basedselection.Amiddleverticallinerepresentsavirtualrayinthemainview,whichislockedduringaselectionstepaftercoarseraypointing.Right:(Constructedconceptualillustration)Welllogpicksillustratedashorizontallineswithassociateddepthandtextannotation.Ahighlightedpickontheleftlogisbeingassociatedwithapickontherightlogbyadraggesture.
K14855_C047.indd 1241 3/19/2014 5:55:23 PM
1242 Handbook of Virtual Environments: Design, Implementation, and Applications
errorsrelatedtovisualworkingmemorylimitswhencomparedtoalternativenavigationtechniquessuchaszooming.
Somebasicapproachestowindowinginstereoscopic3Denvironmentsincludeplacing2D-stylewindowsinto3Dspaces—forexample,Task Gallery (Robertson,etal.,2000)—orusingportal-likewindowsintoother3DscenesorviewsaswiththeSEAMSproject(Schmalstieg&Schaufler,1999) or tunnel windows (Kiyokawa & Takemura, 2005). Another approach is Itoh et al.’s 3DWorldBottles, which are containers for separate scenes that are each drawn on their containersurface(Itoh,Ohigashi,&Tanaka,2006).WorldBottlessupportsoperationssuchastransportingobjectsbetweenbottlesandtransportingusersintobottles.
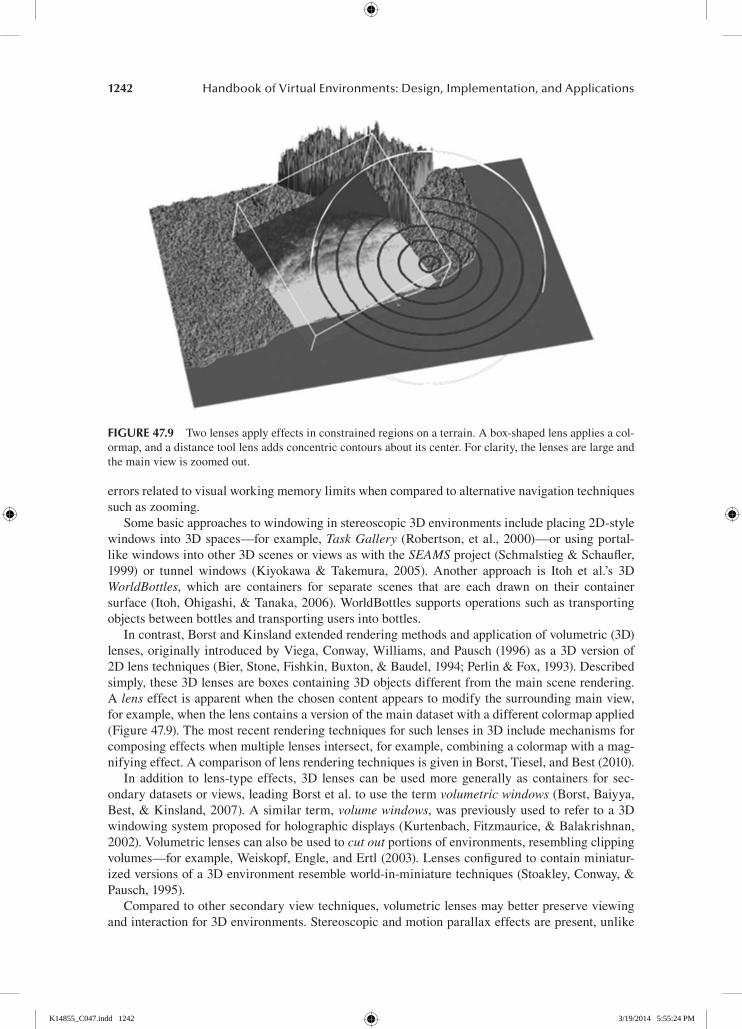
Incontrast,BorstandKinslandextendedrenderingmethodsandapplicationofvolumetric(3D)lenses,originallyintroducedbyViega,Conway,Williams,andPausch(1996)asa3Dversionof2Dlenstechniques(Bier,Stone,Fishkin,Buxton,&Baudel,1994;Perlin&Fox,1993).Describedsimply,these3Dlensesareboxescontaining3Dobjectsdifferentfromthemainscenerendering.Alenseffectisapparentwhenthechosencontentappearstomodifythesurroundingmainview,forexample,whenthelenscontainsaversionofthemaindatasetwithadifferentcolormapapplied(Figure47.9).Themostrecentrenderingtechniquesforsuchlensesin3Dincludemechanismsforcomposingeffectswhenmultiplelensesintersect,forexample,combiningacolormapwithamag-nifyingeffect.AcomparisonoflensrenderingtechniquesisgiveninBorst,Tiesel,andBest(2010).
Inaddition to lens-typeeffects, 3D lenses canbeusedmoregenerally as containers for sec-ondarydatasetsorviews,leadingBorstetal.tousethetermvolumetric windows(Borst,Baiyya,Best,&Kinsland,2007).Asimilarterm,volume windows,waspreviouslyusedtorefertoa3Dwindowingsystemproposedforholographicdisplays(Kurtenbach,Fitzmaurice,&Balakrishnan,2002).Volumetriclensescanalsobeusedtocut outportionsofenvironments,resemblingclippingvolumes—forexample,Weiskopf,Engle,andErtl(2003).Lensesconfiguredtocontainminiatur-izedversionsofa3Denvironmentresembleworld-in-miniaturetechniques(Stoakley,Conway,&Pausch,1995).
Comparedtoothersecondaryviewtechniques,volumetriclensesmaybetterpreserveviewingandinteractionfor3Denvironments.Stereoscopicandmotionparallaxeffectsarepresent,unlike
FIGure 47.9 Twolensesapplyeffectsinconstrainedregionsonaterrain.Abox-shapedlensappliesacol-ormap,andadistancetoollensaddsconcentriccontoursaboutitscenter.Forclarity,thelensesarelargeandthemainviewiszoomedout.
K14855_C047.indd 1242 3/19/2014 5:55:24 PM
1243Immersive Visualization for the Geological Sciences
for2D-in-3Dwindows.Comparedtoportalsorflatlensesin3D,avolumetriclensviewcanbemorestablebecause thesamedataset region isaffectedby(contained in) the lens regardlessofview-point.RaghupathyandBorst(2011)explainedthatthissimplifiesplacementofsecondaryviewsinaterrain-markingapplication.Theydemonstratedperformanceandsubjectiveimprovementswithaboxviewcomparedtoportal-ormirror-typeviewsinasmall-scaleVRenvironmentfordrawingon terrains.Theirevaluationalsounderscores the importanceofdirect interaction in secondaryviews:usersshouldbeabletoannotatevisualizedfeaturesdirectlyinsecondaryviewsratherthanusethemonlyasavisualguidewhileannotatinginamainview.
BorstandKinslandinitiallyapplied3Dlensestodealwithmultipledatasetsoverasingleregion.Kinsland’sgeologyresearchtaskwastomarkextremaandridges(e.g.,lowpointsfromlimestonesinkholes)onaterrainandcheckforcorrespondingfeaturesinagravitydatasurface.Interpretivemarks placed on one dataset were projected to the other to help check consistency of features.Priortoincorporatingmultipleviews,muchtimewasspentswitchingbetweendatasets,manipulat-ingviewpoints,andtogglingfilteringoptions.Forexample,toexamineminima,Kinslandappliedlarge-magnitude negative scale or flipped a mesh upside down to view the bottom. Long andrepeatedsequencesofsuchmanipulationsoccurredasKinslandsoughtthebestmarkerplacement.Alenssystemwasaddedthatalloweduserstosee throughonedatasettoanotherwithalens,grabandmovecopiesofdatasetregionsinboxestoarrangemultipleviewsinthescene,changefilteringandviewoptionsinlensesindividually,andreachintoanyofthelensestoplaceoradjustannotativemarks.Basedoninformalobservations,therewassometimespentsettingupthelensviews,butduringconsistencychecking,thissubsequentlyreducedtheswitchingandmanipulationofdatasets.Theabilitytofine-tuneannotativemarkswasenhancedbecausetheusercouldimmediatelyreachintoanyofmultipleviewstoadjustmarkers.Kinslandnotesthatseeing throughonemeshtoanotherinamovablelenssupportscomparisonbetweendatasetswithlittleoveralldistractionorfocusshift:thelensboxcanbemovedbackandforthwhiletheuserremainsfocusedontheareaofinterestandthesurroundingcontextislargelypreserved.
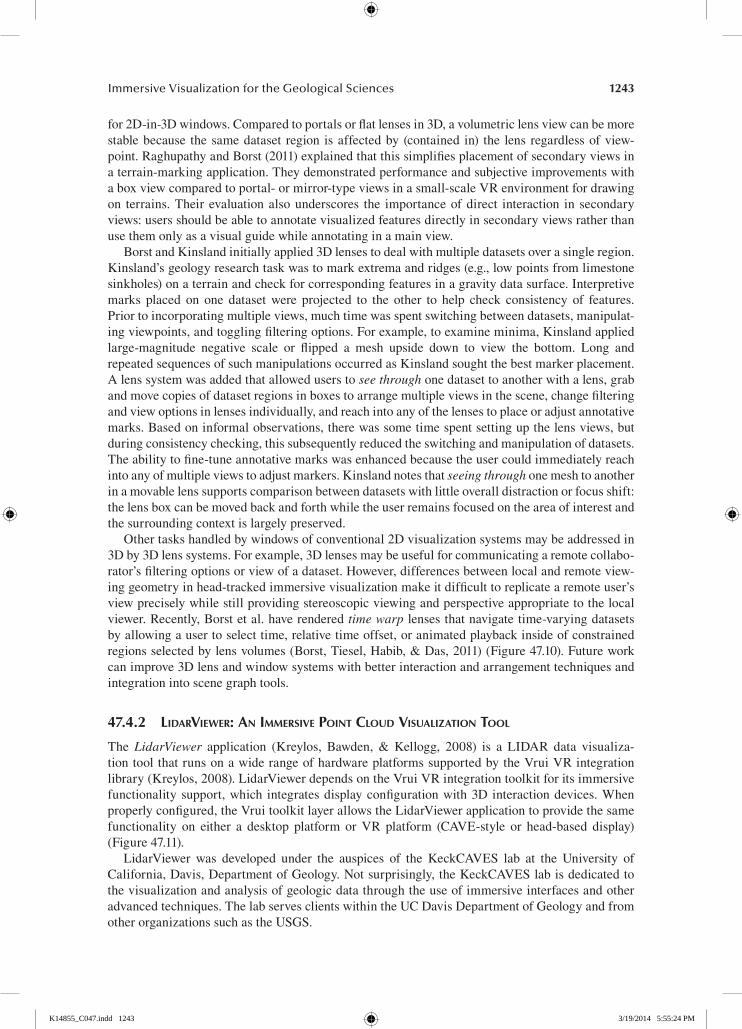
Othertaskshandledbywindowsofconventional2Dvisualizationsystemsmaybeaddressedin3Dby3Dlenssystems.Forexample,3Dlensesmaybeusefulforcommunicatingaremotecollabo-rator’sfilteringoptionsorviewofadataset.However,differencesbetweenlocalandremoteview-inggeometryinhead-trackedimmersivevisualizationmakeitdifficulttoreplicatearemoteuser’sviewpreciselywhilestillprovidingstereoscopicviewingandperspectiveappropriatetothelocalviewer.Recently,Borstetal.haverenderedtime warplensesthatnavigatetime-varyingdatasetsbyallowingausertoselecttime,relativetimeoffset,oranimatedplaybackinsideofconstrainedregionsselectedbylensvolumes(Borst,Tiesel,Habib,&Das,2011)(Figure47.10).Futureworkcanimprove3Dlensandwindowsystemswithbetterinteractionandarrangementtechniquesandintegrationintoscenegraphtools.
47.4.2 liDarvieWer: an immerSive PoinT clouD viSualizaTion Tool
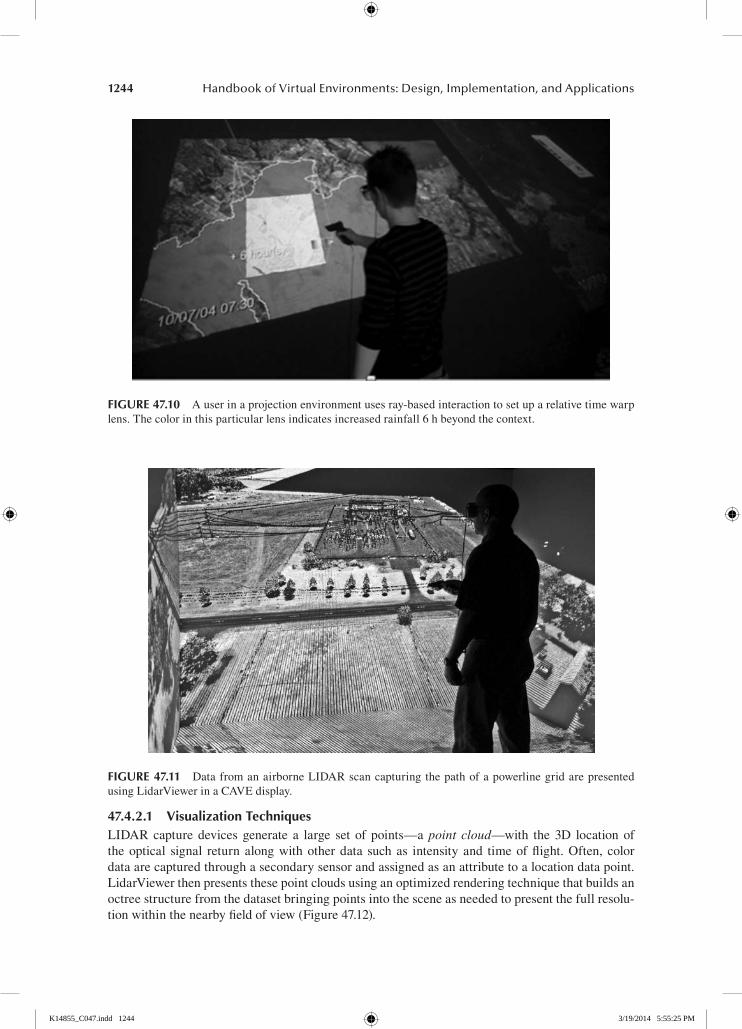
The LidarViewer application (Kreylos, Bawden, & Kellogg, 2008) is a LIDAR data visualiza-tiontoolthatrunsonawiderangeofhardwareplatformssupportedbytheVruiVRintegrationlibrary(Kreylos,2008).LidarViewerdependsontheVruiVRintegrationtoolkitforitsimmersivefunctionalitysupport,which integratesdisplayconfigurationwith3Dinteractiondevices.Whenproperlyconfigured,theVruitoolkitlayerallowstheLidarViewerapplicationtoprovidethesamefunctionality on either a desktop platform or VR platform (CAVE-style or head-based display)(Figure47.11).
LidarViewer was developed under the auspices of the KeckCAVES lab at the University ofCalifornia,Davis,DepartmentofGeology.Notsurprisingly,theKeckCAVESlabisdedicatedtothevisualizationandanalysisofgeologicdatathroughtheuseofimmersiveinterfacesandotheradvancedtechniques.ThelabservesclientswithintheUCDavisDepartmentofGeologyandfromotherorganizationssuchastheUSGS.
K14855_C047.indd 1243 3/19/2014 5:55:24 PM
1244 Handbook of Virtual Environments: Design, Implementation, and Applications
47.4.2.1 Visualization techniquesLIDAR capture devices generate a large set of points—a point cloud—with the 3D location oftheoptical signal returnalongwithotherdata suchas intensity and timeofflight.Often, colordataarecapturedthroughasecondarysensorandassignedasanattributetoalocationdatapoint.LidarViewerthenpresentsthesepointcloudsusinganoptimizedrenderingtechniquethatbuildsanoctreestructurefromthedatasetbringingpointsintothesceneasneededtopresentthefullresolu-tionwithinthenearbyfieldofview(Figure47.12).
FIGure 47.10 Auserinaprojectionenvironmentusesray-basedinteractiontosetuparelativetimewarplens.Thecolorinthisparticularlensindicatesincreasedrainfall6hbeyondthecontext.
FIGure 47.11 DatafromanairborneLIDARscancapturingthepathofapowerlinegridarepresentedusingLidarViewerinaCAVEdisplay.
K14855_C047.indd 1244 3/19/2014 5:55:25 PM
1245Immersive Visualization for the Geological Sciences
Withthedataloadedandvisibleinthe3Dimmersiveenvironment,theusercanselectasubsetofdatapoints,determinethedistancebetweenpointsorplanes,aswellasperformreal-time3Dnaviga-tionthroughthedataset.Thesedatainteractionandvisualizationtechniquesprovidetheuserwithatrueimmersiveexperience.Theuservisualizesthedataasthoughactuallypresentinthelocationwherethedatawerecollected,therebyprovidingtheuserwithinsightintotheirdatanototherwisepossible.
Inpreparationforusingtheimmersivedatavisualizationtool,LidarViewerprovidesapairofdataconversionandpreprocessingutilities.TheLidarPreprocessorutilitycomeswithdozensofoptionaldirectivesandconvertsastandardLIDARdataformatintoabinaryformatsuitablefortheoctreerenderingalgorithm.DataprocessedintoLidarViewerformatcanbefurtherenhancedwiththeLidarIlluminatorutility.TheprimaryenhancementperformedbyLidarIlluminatoristhecalculationofnormalsforeachofthepointsinthecloud.ThenormaldatacanthenbeusedbytheLidarViewerrenderingalgorithmtoproduceimprovedlightingeffects.
Menus within LidarViewer enable the user to control shading and other rendering options.Shadingoptionsincluderenderingpointsattheirgivenintensitylevel,usinganyRGBvaluesthatmayhavebeenassignedtothepointsorapseudosunreflectionmodelthatmakesiteasiertoseesurfacefeaturessuchas roughness.Pointscanalsobecoloredbasedon theirdistanceaboveanassignedgroundplane.Additionally,thenumberandsizeofthepointscanbecontrolledinordertobalancebetweenrenderingqualityandrenderingspeed.
47.4.2.2 Immersive Interface techniquesWrittenwiththeVruiVRlibrary,LidarViewerinheritsseveralstandardVruiinteractionmodes,includingabuilt-inmenuingsystem,whichincludesachoiceofmethodsfornavigatingthroughtheworld.TheVruimenusandwidgetsaredesignedtoworkreasonablywellinconfigurationsrangingfromadesktopworkstationuptolarge-scaleCAVEimmersivesystems.LidarViewerusesthemenusystemtobringupdialogcontrolsforshadingandothereffects,butLidarVieweralsohasinterac-tionspecifictoolsthatmakeuseoftheimmersiveinterface.
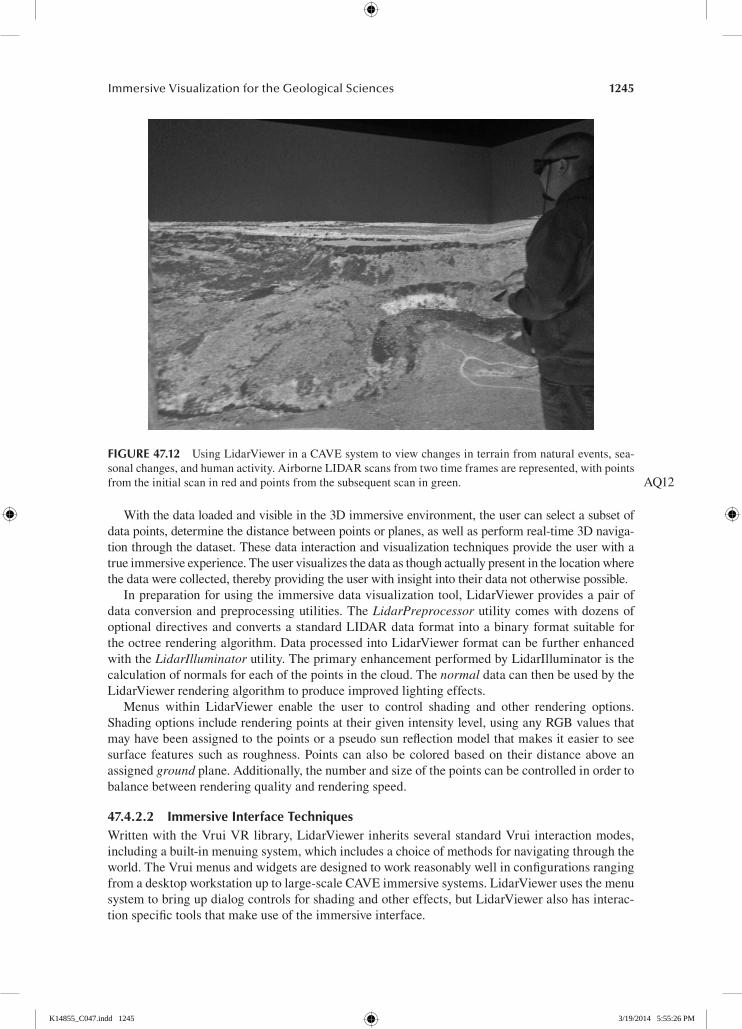
FIGure 47.12 UsingLidarViewerinaCAVEsystemtoviewchangesinterrainfromnaturalevents,sea-sonalchanges,andhumanactivity.AirborneLIDARscansfromtwotimeframesarerepresented,withpointsfromtheinitialscaninredandpointsfromthesubsequentscaningreen. AQ12
K14855_C047.indd 1245 3/19/2014 5:55:26 PM
1246 Handbook of Virtual Environments: Design, Implementation, and Applications
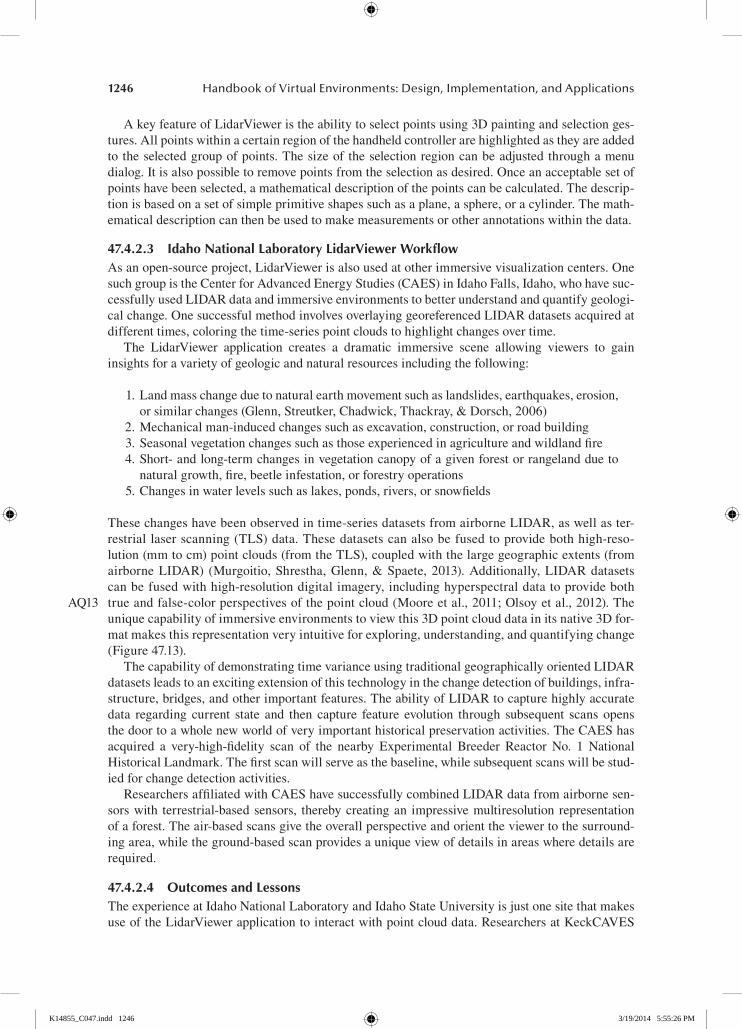
AkeyfeatureofLidarVieweristheabilitytoselectpointsusing3Dpaintingandselectionges-tures.Allpointswithinacertainregionofthehandheldcontrollerarehighlightedastheyareaddedtotheselectedgroupofpoints.Thesizeoftheselectionregioncanbeadjustedthroughamenudialog.Itisalsopossibletoremovepointsfromtheselectionasdesired.Onceanacceptablesetofpointshavebeenselected,amathematicaldescriptionofthepointscanbecalculated.Thedescrip-tionisbasedonasetofsimpleprimitiveshapessuchasaplane,asphere,oracylinder.Themath-ematicaldescriptioncanthenbeusedtomakemeasurementsorotherannotationswithinthedata.
47.4.2.3 Idaho national laboratory lidarViewer WorkflowAsanopen-sourceproject,LidarViewerisalsousedatotherimmersivevisualizationcenters.OnesuchgroupistheCenterforAdvancedEnergyStudies(CAES)inIdahoFalls,Idaho,whohavesuc-cessfullyusedLIDARdataandimmersiveenvironmentstobetterunderstandandquantifygeologi-calchange.OnesuccessfulmethodinvolvesoverlayinggeoreferencedLIDARdatasetsacquiredatdifferenttimes,coloringthetime-seriespointcloudstohighlightchangesovertime.
The LidarViewer application creates a dramatic immersive scene allowing viewers to gaininsightsforavarietyofgeologicandnaturalresourcesincludingthefollowing:
1.Landmasschangeduetonaturalearthmovementsuchaslandslides,earthquakes,erosion,orsimilarchanges(Glenn,Streutker,Chadwick,Thackray,&Dorsch,2006)
2.Mechanicalman-inducedchangessuchasexcavation,construction,orroadbuilding 3.Seasonalvegetationchangessuchasthoseexperiencedinagricultureandwildlandfire 4.Short-andlong-termchangesinvegetationcanopyofagivenforestorrangelanddueto
naturalgrowth,fire,beetleinfestation,orforestryoperations 5.Changesinwaterlevelssuchaslakes,ponds,rivers,orsnowfields
Thesechangeshavebeenobservedintime-seriesdatasetsfromairborneLIDAR,aswellaster-restriallaserscanning(TLS)data.Thesedatasetscanalsobefusedtoprovidebothhigh-reso-lution(mmtocm)pointclouds(fromtheTLS),coupledwiththelargegeographicextents(fromairborneLIDAR) (Murgoitio,Shrestha,Glenn,&Spaete,2013).Additionally,LIDARdatasetscanbefusedwithhigh-resolutiondigitalimagery,includinghyperspectraldatatoprovidebothtrueandfalse-colorperspectivesofthepointcloud(Mooreetal.,2011;Olsoyetal.,2012).Theuniquecapabilityofimmersiveenvironmentstoviewthis3Dpointclouddatainitsnative3Dfor-matmakesthisrepresentationveryintuitiveforexploring,understanding,andquantifyingchange(Figure47.13).
ThecapabilityofdemonstratingtimevarianceusingtraditionalgeographicallyorientedLIDARdatasetsleadstoanexcitingextensionofthistechnologyinthechangedetectionofbuildings,infra-structure,bridges,andotherimportantfeatures.TheabilityofLIDARtocapturehighlyaccuratedata regarding current state and then capture feature evolution through subsequent scans opensthedoortoawholenewworldofveryimportanthistoricalpreservationactivities.TheCAEShasacquired a very-high-fidelity scan of the nearby Experimental Breeder Reactor No. 1 NationalHistoricalLandmark.Thefirstscanwillserveasthebaseline,whilesubsequentscanswillbestud-iedforchangedetectionactivities.
ResearchersaffiliatedwithCAEShavesuccessfullycombinedLIDARdatafromairbornesen-sorswith terrestrial-basedsensors, therebycreatingan impressivemultiresolution representationofaforest.Theair-basedscansgivetheoverallperspectiveandorienttheviewertothesurround-ingarea,whiletheground-basedscanprovidesauniqueviewofdetailsinareaswheredetailsarerequired.
47.4.2.4 outcomes and lessonsTheexperienceatIdahoNationalLaboratoryandIdahoStateUniversityisjustonesitethatmakesuseoftheLidarViewerapplicationtointeractwithpointclouddata.ResearchersatKeckCAVES
AQ13
K14855_C047.indd 1246 3/19/2014 5:55:26 PM
1247Immersive Visualization for the Geological Sciences
andtheUSGShaveanalyzedandmeasuredphenomenonsuchastheshiftcausedbyearthquakeactivity or the movement of structures whose foundations have been compromised by landslideactivity.
Inthecaseofearthquakeanalysis,asitealongtheSanAndreasFaultforwhichLIDARscanshadbeentakenbothbeforeandafteralargeearthquakeallowedscientiststocalculatebeforeandaftermeasurementsofvarioussurfacefeatures(Gold,Cowgill,Kreylos,&Gold,2012).Intheland-slideusagecase,ahousewithmuchofthefoundationwashedawaywasmeasuredfromthesamelocationonadailybasis,andbydeterminingthemathematicaldescriptionof thenearwall, themovementofthehousecouldbedeterminedtomillimeteraccuracy(Kreylosetal.,2006).
Theabilitytovisit,orrevisit,sitesofinterestinandofitselfisagreatbenefittothegeologistwhoselaboratorycanbeanywhereontheplanet,includingsitesthatcanbeexpensiveandother-wiseimpracticaltovisitonarecurringbasis.Thus,theabilitytovirtuallyvisitthesesiteswithcon-siderabledetailisagreatboon.Andwhilemeasurementscanbedirectlyobtainedwhileinthefield,theabilitytotakethemintheimmersiveenvironmentisfareasier(giventhatit’spossibletoflyorrescaletheworld)andalsocanbemoreaccuratethroughtheassistanceofbasingmeasurementsonalargecollectionofpoints.Consequently,LidarViewerisnotjustforrevisitinggeologicalandothersites,butcanbebetterthanthosevisitsbyallowingthevisitortotakemoremeasurements,explorethesitefaster,andleavebehindannotationsofintriguingdiscoveries.
47.4.3 viSualizaTion oF mulTimoDal geoPhySical Survey DaTa
Recognizingthatgeophysicalexplorationproduceslargeamountsofdata,generatedbyavarietyofacquisitiondevices,ateamofarchaeologistsandcomputerscientistsattheCaliforniaInstituteforTelecommunicationsandInformationTechnology(CALIT2)createdaprojecttofuseaerialandsat-elliteimageryandelevation;infrared,magnetic,andEMsurfacedata;GPR;photographsofartifactsandman-madestructures;andadatabasewithinformationaboutfoundartifacts(suchas3Dloca-tion,type,radiocarbondates,andpictures;Linetal.,2011).Someoftheacquireddatawerefurther
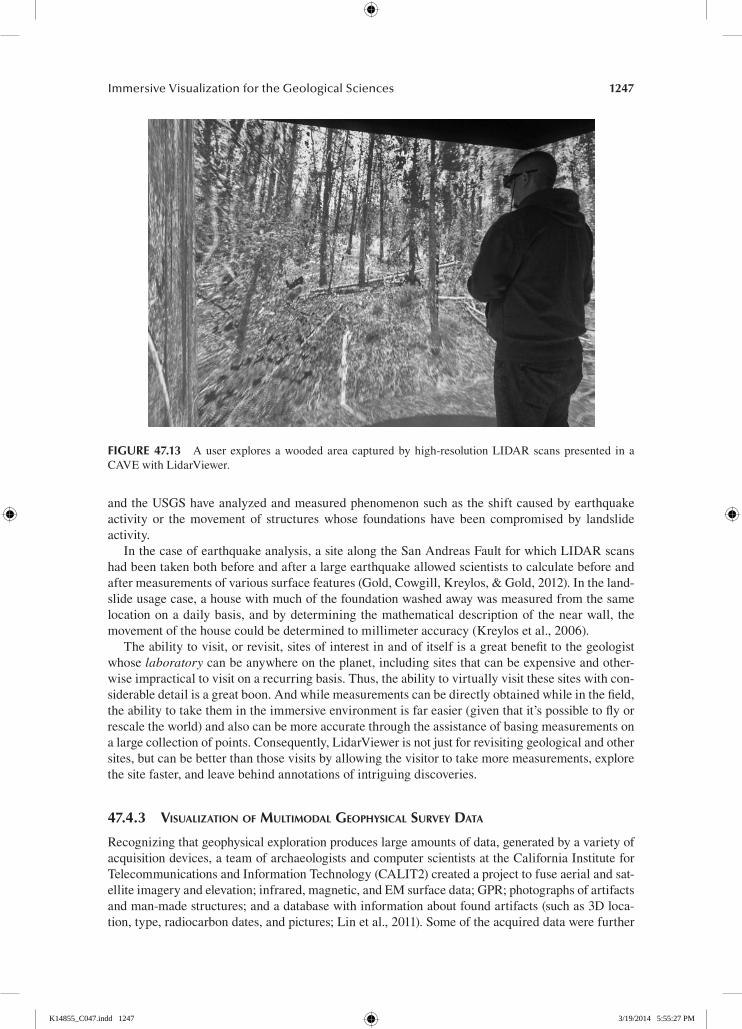
FIGure 47.13 Auserexploresawoodedareacapturedbyhigh-resolutionLIDARscanspresented inaCAVEwithLidarViewer.
K14855_C047.indd 1247 3/19/2014 5:55:27 PM
1248 Handbook of Virtual Environments: Design, Implementation, and Applications
processed into derived data products: extensive image sets of 3D structures on the ground havebeenprocessedwithastructure-from-motion(SfM)algorithm(UniversityofWashington’sBundler;Snavely,Seitz,&Szeliski,2006)toderiveacolored3Dpointcloudofthestructure,and3Dmodelswerecreatedmanuallyforstructuresthatnolongerexistbutareassumedtohaveexistedinthepast.
Archaeologistscanoftenverifytheirhypothesesbydiggingupwhattheybelievetobeburiedsomewhere.ThisprincipledoesnotholdforCALIT2’sarchaeologistsworkinginMongoliatofindGenghisKhan’stombandotherhistoricalsites,becausetheMongoliangovernmentdoesnotallowthemtoexcavate.Thismeansthattheyhavetorelyentirelyonwhatisreadilyaccessiblefromthesurfaceanddatathatcanbeacquiredaboutsubsurfaceobjects.
TheStarCAVE(DeFantietal.,2009)atCALIT2isa34-megapixelimmersiveVRsystemandauniquetoolforarchaeologists,becauseitallowsthemtonotonlyvisitasiteofinterestonanothercontinentwithout traveling to itbutalso toshowall theavailabledataabout thesite in itsgeo-spatiallycorrectlocations.ThegoalofthiseffortistoexploretheuseoftheStarCAVEtoenablenoninvasivevirtual excavationthroughthe3DVRreconstructionofgeophysicalsurveydataofanarchaeologicalsitethathasbeeninvestigatedsinceJuly2010asacomponentoftheValleyoftheKhansproject,anoninvasiveremotesensingsurveyforburialsitesinNorthernMongolia.
Forthearchaeologists,workingwiththisVRtoolgivesthemtheuniqueabilitytoviewnotonlyaspatiallycorrectvisualizationoftheirdatabutalsoonethatfusesallthedatatypestheygenerate.Thisisbecausenooff-the-shelftoolsexistthatsolvethisproblemforthem.Understandingspatialcorrelationsbetweenthemultitudeofdatatypesthearchaeologistscollectiskeytomakingnewdiscoveries.
Therearenooff-the-shelfsolutionsforVRsystems,whichcandisplayallofthedatatypesthissystemsupports.AEGISEasy3D(AegisInstruments,2013)supportsGPRdatabutdoesnotruninaCAVE.ExistingGPRvisualizationsoftwareforVR,suchasBillenetal.(2008),doesnotallowpointvisualizationwiththedatapointsfollowingtheterrainunderwhichtheyarelocated(neededforapreciseanalysisofthedata).CommercialtoolssuchasEON’ssoftwaresuite(EONReality,2013)orVTK(Kitware,Inc.VTK,2013)arenotflexibleenoughtosupportallthedatatypesandvisualizationmodes,withtherequiredscalabilityduetothesizeofthedata.
47.4.3.1 Visualization techniquesThegeneralideaofthevisualizationtoolistodisplayallthedataintheirrespectivelocationsonavirtualreconstructionofthesiteofinterest.Inordertodisplaygeospatialdatacorrectlyonater-rainmap,wehadtogetaccurateterrainheight.ThiswasdonebyprocessingtheheightdatafromaTrimbleVXSpatialStationtotessellateaterrainsurface.Thisprovidedaterrainelevationasthemissingcoordinateforthe3Ddisplayofanydatasetarrays.Onevisualizationmode(Hill)showstheterrainwithaheightmaponit,whereaterrainheightiscolorcodedontothesurface.
Magnetic(Aitken,1958;Becker,1995)andEM(Fröhlich&Lancaster,1986;Tabbagh,1986)conductivityare2Ddatatypes,astheyresultinsurfacemapsofvariationsoftheirrespectivephysi-calproperties.Amagneticsurveyisapassivedetectionofcontrastsinthemagneticpropertiesofdiffering materials, whereas EM measures the conductivity and magnetic susceptibility of soil.A deriveddatatypeisbasedonthedensityofartifactsfoundin3×3mgridcellsaroundthesur-veyedsite,definedbythelocationsofmeasurementprobes,anddisplayedasafalsecolormapontheterrain.Ineachcase,asuitablecolorgradientisusedtomapthedatavaluestocolors.
GPR(Goodman,Nishimura,&Rogers,1995;Novo,Grasmueck,Viggiano,&Lorenzo,2008)andelectricalresistivitytomography(ERT)(DOE,2000)generate3Ddataarrays.GPRtransmitsanEMpulseandmeasuresareflectedsignalthatisdependentuponthedielectricpropertiesofsub-surfacematerial.ERTderivessubsurfacestructuresofresistivematerialsfromelectricalmeasure-mentsmadebyelectrodes.Thearchaeologistsusea1mgridfortheelectrodes.Notethatthedepthinformationinbothdataarraysisfordistancefromthesurface,whichmeansthatneighboringdatasampleswiththesamedepthvaluearenotnormallyonthesameplanebutfollowthecurvatureoftheterrain.
K14855_C047.indd 1248 3/19/2014 5:55:27 PM
1249Immersive Visualization for the Geological Sciences
Anotherimportantdatatypeusedinthisworkisphotographs.Picturesoftheprobesandtheirsurroundingareasaredisplayedonthegroundintheirrespectivelocations.Locationsofthevariousartifactsthatwerefoundintheareaarerepresentedasblueorredcubes.Theredcubesrepresentartifactsthathavebeenradiocarbondated(withdatesshownabovethecube).Bothtypesofcubescanbeclickedon,whichwilldisplayapictureoftheartifactinawindowfloatinginfrontoftheuser.
TwooftheobjectsatthesiteweredigitizedwithanSfMapproach:manyoverlappingphoto-graphs were taken from different viewing angles, and then the Bundler algorithm analyzed thepicturesandcomputedthecamerapositionstheyweretakenfromin3Dspace(Snavelyetal.,2006).ThisallowedthePMVS2algorithm(Furukawa&Ponce,2009)tocalculateadense,coloredpointcloudindicatingthegeometryofthedigitizedobject.Oneoftheseobjectsisacollectionofbricksfoundontheground;theotherisamodernshrinebuiltbylocalresidents.Thelatterservesmoreasalandmarkthantounderstandhistory.
Finally,a3DmodelingtoolwasusedtocreateatypicaltemplefromtheYuanDynasty,whichexistedatthesitearoundthetimetheradiocarbondatesindicate.Thetemplewasplacedandori-entedonaparticularlydensecollectionofbricksandsubsurfacematerialtoindicatethatthisisthelikelylocationofsuchastructure.
47.4.3.2 Immersive Visualization applicationThisimmersivevisualizationtoolwasimplementedasaplug-infortheVRmiddlewaresoftwareCalVR(Schulze,Prudhomme,Weber,&Defanti,2013).CalVRisbasedontheOpenSceneGraphAPI(Wang&Qian,2010)andrunsonLinux-basedvisualizationclusters.
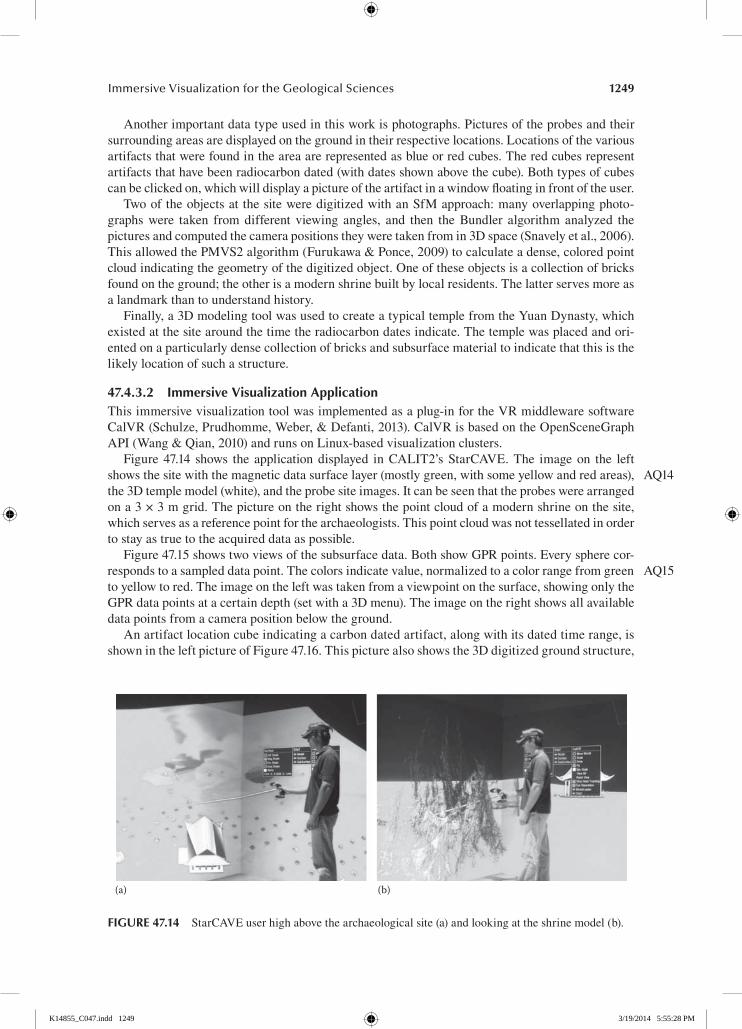
Figure47.14 shows the applicationdisplayed inCALIT2’sStarCAVE.The imageon the leftshowsthesitewiththemagneticdatasurfacelayer(mostlygreen,withsomeyellowandredareas),the3Dtemplemodel(white),andtheprobesiteimages.Itcanbeseenthattheprobeswerearrangedona3×3mgrid.Thepictureontherightshowsthepointcloudofamodernshrineonthesite,whichservesasareferencepointforthearchaeologists.Thispointcloudwasnottessellatedinordertostayastruetotheacquireddataaspossible.
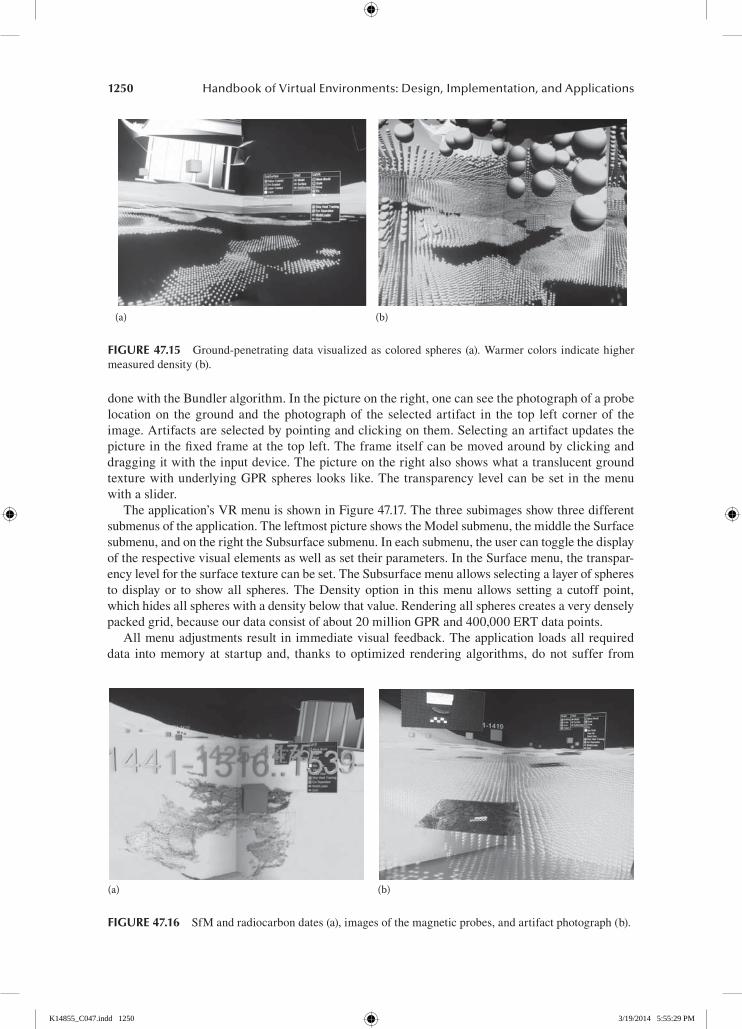
Figure47.15showstwoviewsofthesubsurfacedata.BothshowGPRpoints.Everyspherecor-respondstoasampleddatapoint.Thecolorsindicatevalue,normalizedtoacolorrangefromgreentoyellowtored.Theimageontheleftwastakenfromaviewpointonthesurface,showingonlytheGPRdatapointsatacertaindepth(setwitha3Dmenu).Theimageontherightshowsallavailabledatapointsfromacamerapositionbelowtheground.
Anartifactlocationcubeindicatingacarbondatedartifact,alongwithitsdatedtimerange,isshownintheleftpictureofFigure47.16.Thispicturealsoshowsthe3Ddigitizedgroundstructure,
AQ14
AQ15
(a) (b)
FIGure 47.14 StarCAVEuserhighabovethearchaeologicalsite(a)andlookingattheshrinemodel(b).
K14855_C047.indd 1249 3/19/2014 5:55:28 PM
1250 Handbook of Virtual Environments: Design, Implementation, and Applications
donewiththeBundleralgorithm.Inthepictureontheright,onecanseethephotographofaprobelocationon thegroundand thephotographof the selectedartifact in the top leftcornerof theimage.Artifactsareselectedbypointingandclickingonthem.Selectinganartifactupdatesthepictureinthefixedframeatthetopleft.Theframeitselfcanbemovedaroundbyclickinganddraggingitwiththeinputdevice.ThepictureontherightalsoshowswhatatranslucentgroundtexturewithunderlyingGPRsphereslookslike.Thetransparencylevelcanbesetinthemenuwithaslider.
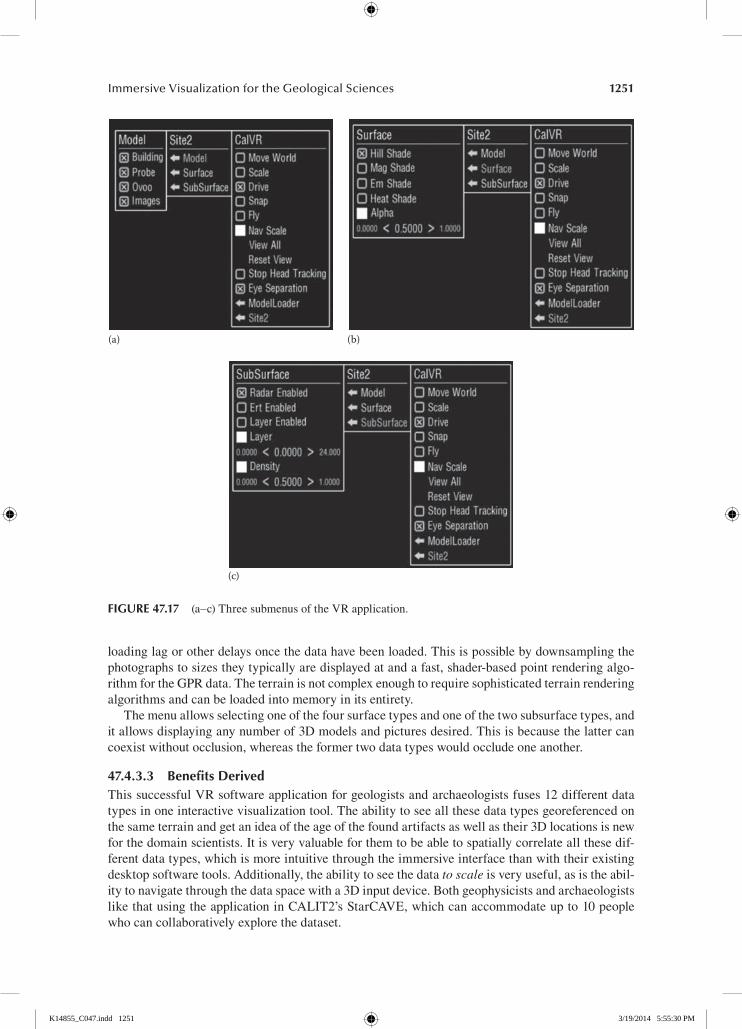
Theapplication’sVRmenuisshowninFigure47.17.Thethreesubimagesshowthreedifferentsubmenusoftheapplication.TheleftmostpictureshowstheModelsubmenu,themiddletheSurfacesubmenu,andontherighttheSubsurfacesubmenu.Ineachsubmenu,theusercantogglethedisplayoftherespectivevisualelementsaswellassettheirparameters.IntheSurfacemenu,thetranspar-encylevelforthesurfacetexturecanbeset.TheSubsurfacemenuallowsselectingalayerofspherestodisplayor toshowall spheres.TheDensityoption in thismenuallowssettingacutoffpoint,whichhidesallsphereswithadensitybelowthatvalue.Renderingallspherescreatesaverydenselypackedgrid,becauseourdataconsistofabout20millionGPRand400,000ERTdatapoints.
Allmenuadjustmentsresultinimmediatevisualfeedback.Theapplicationloadsallrequireddata intomemory at startup and, thanks tooptimized rendering algorithms,donot suffer from
(b)(a)
FIGure 47.15 Ground-penetratingdatavisualizedascoloredspheres(a).Warmercolorsindicatehighermeasureddensity(b).
(b)(a)
FIGure 47.16 SfMandradiocarbondates(a),imagesofthemagneticprobes,andartifactphotograph(b).
K14855_C047.indd 1250 3/19/2014 5:55:29 PM
1251Immersive Visualization for the Geological Sciences
loadinglagorotherdelaysoncethedatahavebeenloaded.Thisispossiblebydownsamplingthephotographstosizestheytypicallyaredisplayedatandafast,shader-basedpointrenderingalgo-rithmfortheGPRdata.Theterrainisnotcomplexenoughtorequiresophisticatedterrainrenderingalgorithmsandcanbeloadedintomemoryinitsentirety.
Themenuallowsselectingoneofthefoursurfacetypesandoneofthetwosubsurfacetypes,anditallowsdisplayinganynumberof3Dmodelsandpicturesdesired.Thisisbecausethelattercancoexistwithoutocclusion,whereastheformertwodatatypeswouldoccludeoneanother.
47.4.3.3 Benefits derivedThissuccessfulVRsoftwareapplicationforgeologistsandarchaeologistsfuses12differentdatatypesinoneinteractivevisualizationtool.Theabilitytoseeallthesedatatypesgeoreferencedonthesameterrainandgetanideaoftheageofthefoundartifactsaswellastheir3Dlocationsisnewforthedomainscientists.Itisveryvaluableforthemtobeabletospatiallycorrelateallthesedif-ferentdatatypes,whichismoreintuitivethroughtheimmersiveinterfacethanwiththeirexistingdesktopsoftwaretools.Additionally,theabilitytoseethedatato scaleisveryuseful,asistheabil-itytonavigatethroughthedataspacewitha3Dinputdevice.BothgeophysicistsandarchaeologistslikethatusingtheapplicationinCALIT2’sStarCAVE,whichcanaccommodateupto10peoplewhocancollaborativelyexplorethedataset.
(a) (b)
(c)
FIGure 47.17 (a–c)ThreesubmenusoftheVRapplication.
K14855_C047.indd 1251 3/19/2014 5:55:30 PM
1252 Handbook of Virtual Environments: Design, Implementation, and Applications
Futuregoalsforthisapplicationaretosupportadditionaldatatypes,suchasLIDARpointdata,anddatasets that are larger than the sizeof thecomputers’RAM.Thiswill require integratingexistingout-of-coreapproaches,whichcouldperhapsbeimprovedbyoptimizingspatialaccessformultipledifferentdatatypes.
47.4.4 Dri lancaSTer SanD Dune layerS
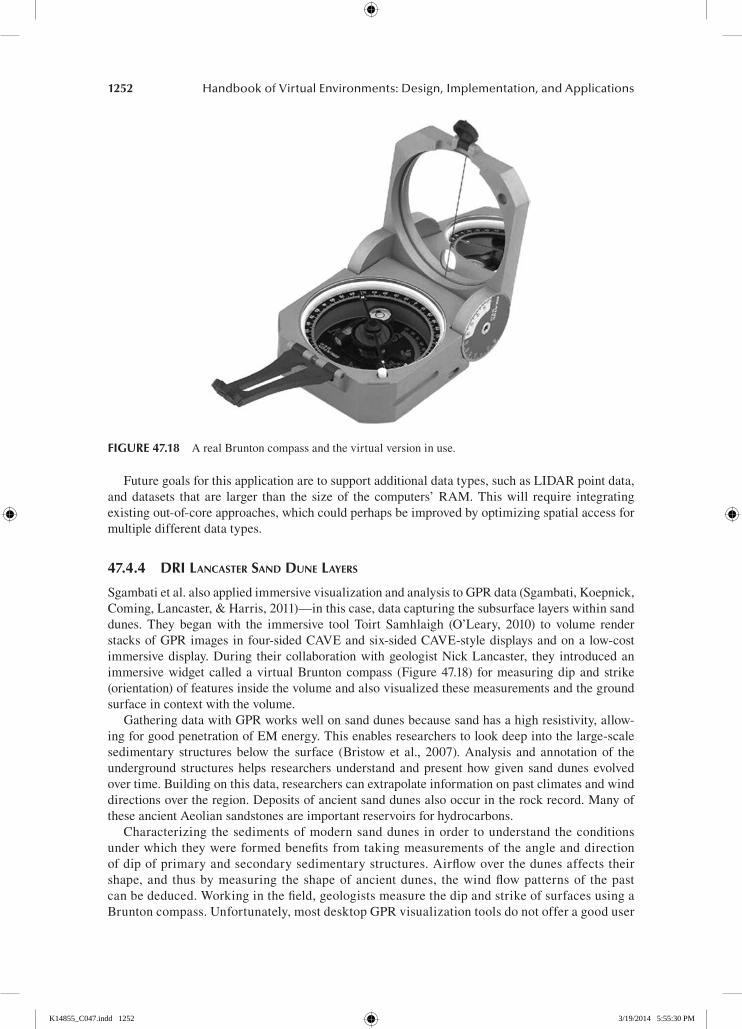
Sgambatietal.alsoappliedimmersivevisualizationandanalysistoGPRdata(Sgambati,Koepnick,Coming,Lancaster,&Harris,2011)—inthiscase,datacapturingthesubsurfacelayerswithinsanddunes. They began with the immersive tool Toirt Samhlaigh (O’Leary, 2010) to volume renderstacksofGPRimagesinfour-sidedCAVEandsix-sidedCAVE-styledisplaysandonalow-costimmersivedisplay.During theircollaborationwithgeologistNickLancaster, they introducedanimmersivewidgetcalledavirtualBruntoncompass (Figure47.18) formeasuringdipandstrike(orientation)offeaturesinsidethevolumeandalsovisualizedthesemeasurementsandthegroundsurfaceincontextwiththevolume.
GatheringdatawithGPRworkswellonsanddunesbecausesandhasahighresistivity,allow-ingforgoodpenetrationofEMenergy.Thisenablesresearcherstolookdeepintothelarge-scalesedimentary structuresbelow the surface (Bristowet al., 2007).Analysis andannotationof theundergroundstructureshelps researchersunderstandandpresenthowgivensanddunesevolvedovertime.Buildingonthisdata,researcherscanextrapolateinformationonpastclimatesandwinddirectionsovertheregion.Depositsofancientsanddunesalsooccurintherockrecord.ManyoftheseancientAeoliansandstonesareimportantreservoirsforhydrocarbons.
Characterizingthesedimentsofmodernsanddunesinordertounderstandtheconditionsunderwhichtheywereformedbenefitsfromtakingmeasurementsoftheangleanddirectionofdipofprimaryandsecondarysedimentarystructures.Airflowoverthedunesaffectstheirshape,and thusbymeasuring theshapeofancientdunes, thewindflowpatternsof thepastcanbededuced.Workinginthefield,geologistsmeasurethedipandstrikeofsurfacesusingaBruntoncompass.Unfortunately,mostdesktopGPRvisualizationtoolsdonotofferagooduser
FIGure 47.18 ArealBruntoncompassandthevirtualversioninuse.
K14855_C047.indd 1252 3/19/2014 5:55:30 PM
1253Immersive Visualization for the Geological Sciences
interfaceallowingthegeologist,accomplishedintheuseofarealBruntoncompass,totransferthisskilltousingavirtualversionofthetool.
47.4.4.1 Visualization techniquesTheproject team leveragedToirtSamhlaigh for its immersivevolumevisualizationcapabilities.Theycreateda3D tomogramvolumeof thedata fromthestackof2Dsubsurfacecross-sectionimages from theGPR(seealsoFigure47.19andSection47.2.5).Workingwith the3Dvolume,thegeologist(Lancaster)manipulatedthevisualizationcontrolstohighlightfeaturesofscientificsignificance—thatis,hemanipulatedthetransferfunctions,lightingparameters,andsliceplane’spositionstobestviewthedata.Asemitransparentgroundsurfaceprovidescontext.Finally,thevir-tualBruntoncompasstoolwasaddedtoallowmeasurementandannotationofthedip/strikeacrossthedata.Thesemarkingsthenprovidedavisualizationofthenonuniformvectorfield,indicatingdirectionwithaconepointinginthedirectionofthesteepestgradient.
47.4.4.2 Immersive Interface techniquesLeveragingtheToirtSamhlaighimmersivevolume-renderingtool,theprojectteamhadafirmfoot-ingonwhichtoaddfeaturesspecificallyforvisualizationofGPR-sourceddatavolumes.AddressingtheshortcomingofmostdesktopGPRvisualizationtools,thevirtualBruntoncompasswasaddedtoenableuserstoefficientlyandpreciselymeasuredipandstrikeoffeatures.Theinterfacecom-prisesavirtualplane,withadynamicdipline,attachedtoa6-DOFwandthattheuseralignswithfeaturestomeasureorientation.Withoneclickandasmallhandmotion,theuseralignsthenextmeasurementand,withasecondclick,savesthatmeasurement.Thecollectionofallthedipandstrikemeasurementsisthensavedforoff-line(onthedesktop)analysis(Figure47.20).
47.4.4.3 outcomes and lessonsLancaster,thegeologistontheproject,statedthatthis“applicationimprovescurrenttoolsusedbyresearchersorpractitionerswhoare interested in thesedatasets.”He tested thisapplication inahigh-resolution(1920×1920)six-sidedCAVE-likedisplay,onastandardresolution(1050×1050)four-sidedCAVE,ona low-cost3DTV-based immersivedisplay(67″with1080pusingchecker-boardstereo)similartotheIQ-Station(Sherman,O’Leary,Whiting,Grover,&Wernert,2010),andonastandardnonimmersive(mouseandkeyboardonly)computer.Allwereusableforbasicvisu-alizationanddataexploration.The6-DOFinteractionofferedbytheimmersivedisplaysdemon-stratedanadvantageoverthemouse/keyboardinterfaceintheinteractiveuseofthevirtualBrunton
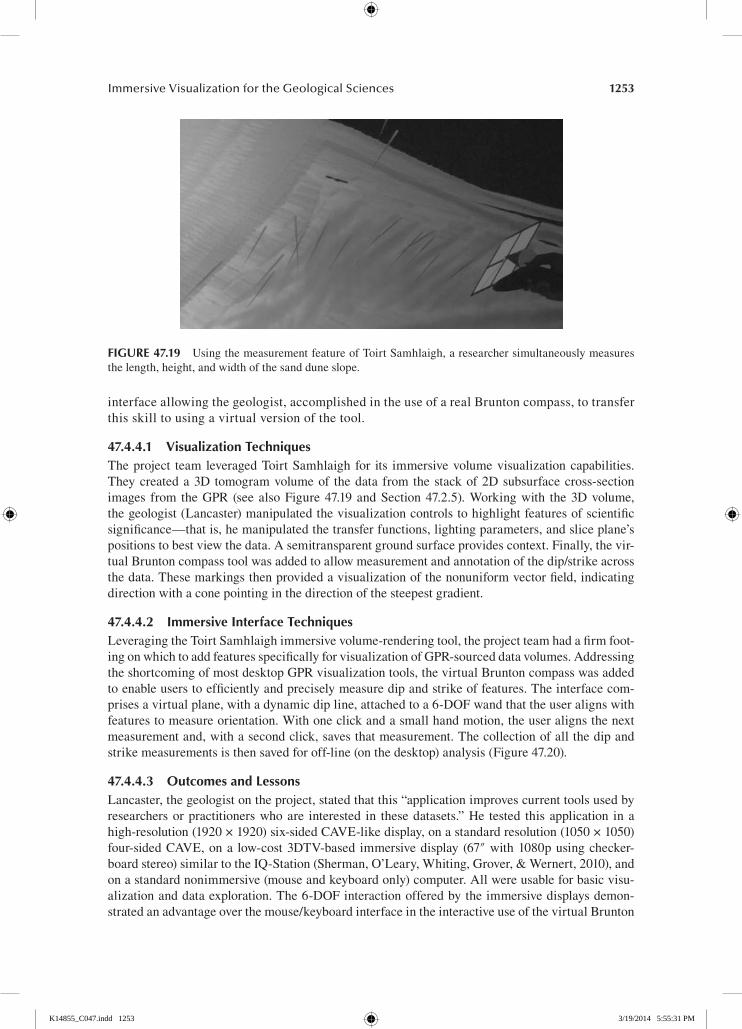
FIGure 47.19 UsingthemeasurementfeatureofToirtSamhlaigh,aresearchersimultaneouslymeasuresthelength,height,andwidthofthesandduneslope.
K14855_C047.indd 1253 3/19/2014 5:55:31 PM
1254 Handbook of Virtual Environments: Design, Implementation, and Applications
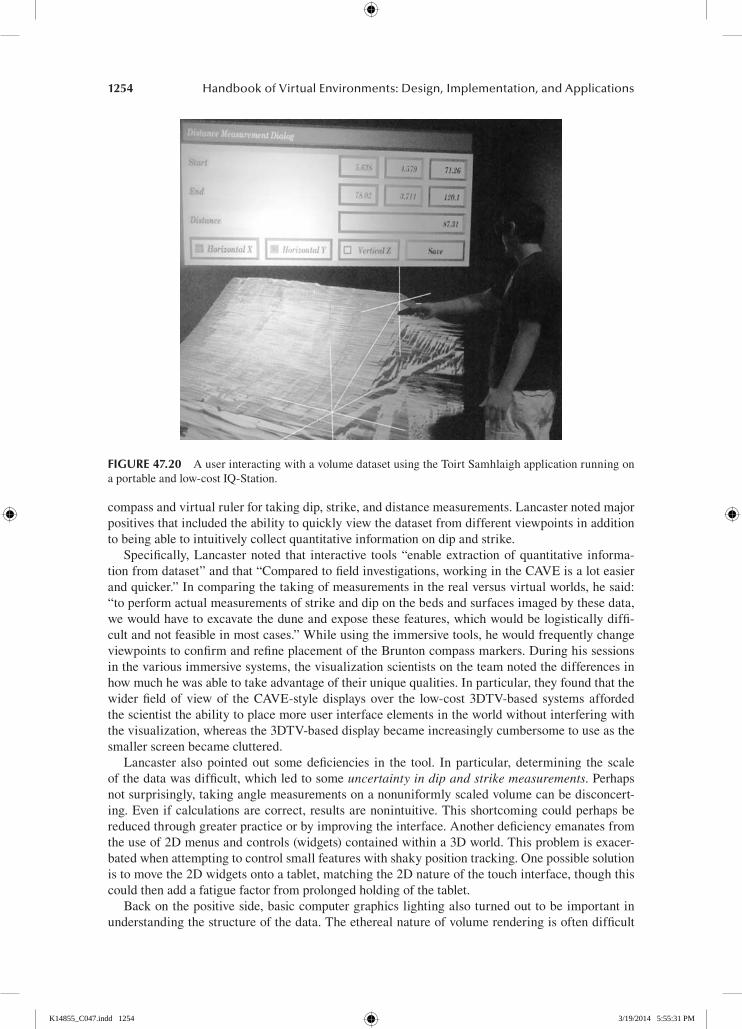
compassandvirtualrulerfortakingdip,strike,anddistancemeasurements.Lancasternotedmajorpositivesthatincludedtheabilitytoquicklyviewthedatasetfromdifferentviewpointsinadditiontobeingabletointuitivelycollectquantitativeinformationondipandstrike.
Specifically,Lancasternoted that interactive tools“enableextractionofquantitative informa-tionfromdataset”andthat“Comparedtofieldinvestigations,workingintheCAVEisaloteasierandquicker.”Incomparingthetakingofmeasurementsintherealversusvirtualworlds,hesaid:“toperformactualmeasurementsofstrikeanddiponthebedsandsurfacesimagedbythesedata,wewouldhavetoexcavatetheduneandexposethesefeatures,whichwouldbelogisticallydiffi-cultandnotfeasibleinmostcases.”Whileusingtheimmersivetools,hewouldfrequentlychangeviewpointstoconfirmandrefineplacementoftheBruntoncompassmarkers.Duringhissessionsinthevariousimmersivesystems,thevisualizationscientistsontheteamnotedthedifferencesinhowmuchhewasabletotakeadvantageoftheiruniquequalities.Inparticular,theyfoundthatthewiderfieldofviewof theCAVE-styledisplaysover the low-cost3DTV-based systemsaffordedthescientisttheabilitytoplacemoreuserinterfaceelementsintheworldwithoutinterferingwiththevisualization,whereasthe3DTV-baseddisplaybecameincreasinglycumbersometouseasthesmallerscreenbecamecluttered.
Lancaster alsopointedout somedeficiencies in the tool. Inparticular, determining the scaleofthedatawasdifficult,whichledtosomeuncertainty in dip and strike measurements.Perhapsnotsurprisingly,takinganglemeasurementsonanonuniformlyscaledvolumecanbedisconcert-ing.Evenifcalculationsarecorrect,resultsarenonintuitive.Thisshortcomingcouldperhapsbereducedthroughgreaterpracticeorbyimprovingtheinterface.Anotherdeficiencyemanatesfromtheuseof2Dmenusandcontrols(widgets)containedwithina3Dworld.Thisproblemisexacer-batedwhenattemptingtocontrolsmallfeatureswithshakypositiontracking.Onepossiblesolutionistomovethe2Dwidgetsontoatablet,matchingthe2Dnatureofthetouchinterface,thoughthiscouldthenaddafatiguefactorfromprolongedholdingofthetablet.
Backonthepositiveside,basiccomputergraphicslightingalsoturnedouttobeimportantinunderstandingthestructureofthedata.Theetherealnatureofvolumerenderingisoftendifficult
FIGure 47.20 AuserinteractingwithavolumedatasetusingtheToirtSamhlaighapplicationrunningonaportableandlow-costIQ-Station.
K14855_C047.indd 1254 3/19/2014 5:55:31 PM
1255Immersive Visualization for the Geological Sciences
tofuseandreducestheeffectivenessofstereoscopicrendering.Motionparallaxisstillhelpful,butthroughtheuseofGPUlightingeffects,featureswithinthevolumecancometolifemore,provid-ingsomehooksthatthebraincanconnectwith,andmakethe3Dobjectmorecompelling.Also,themanipulationoflightingparametersinandofitselfcanprovidestructuralcuesasshadingonsurfaceschanges.
Contrastedagainst thedifficultyofmanipulating2Dwidgets ina3Dspace,usingthe6-DOFpositiontrackingtoplaceandorientthevirtualBruntoncompassprovedtobeaverybigwin.Buteven some of the 2D interfaces provided benefits not available in other tools. In particular, theGaussiantransferfunctioneditorofToirtSamhlaighwasmucheasiertousethanthestandardpiece-wiselineartransferfunctioneditor.ThisbenefitresultsfromtheuniqueGaussiancurveeditorthatrequiresfewerpreciseselectionactionsbytheusertoobtainadesiredcurve.SlidingtheGaussianaroundbyitscenterprovidesaquickwaytoexploreanewdatasetforsalientfeatures.
OnefeatureoftheimmersiveGPRvisualizationtoolthatisnotsplashy,butcrucial,isthebasicabilitytosaveandrestorethestateofthevisualization.Notonlydoesthisallowtheresearchertoreturntoworkwheretheyleftoff,butthisalsoallowsthemtosaveaparticularlyinterestingsce-nariotosharewithcolleagues.
Overall,thegeologistfoundgreatbenefitfromtheGPRvisualizationtool,whichwasbasedonavolumevisualizationapplicationwithspecificextensionsforgeologyvisualization,includingavirtualBruntoncompasswidgetwithnatural6-DOFmanipulations.Inanecdotalcomparisonsofvariousdisplaytypes,thevisualizationresearchersnotehowtheincreasedrealestateofafour-orsix-sidedCAVEdisplayprovidedthespaceneededtoplacecontrolswithoutinterferingwiththedatarepresentations.
47.5 BeneFIts
While not universal, there are demonstrable benefits from the use of immersive technology inmanyareas,includingthevisualizationandanalysisofscientificdatafromthegeologicalsciences.Butdemonstrablebenefitsarenotasufficientcriterionindeterminingwhetheranewimmersivevisualizationprogramortoolwillpaydividends.Eventhemostproventoolmustovercomethehurdle of breaking into the regular workflow of the researcher. For larger immersive displays,thisproblemisexacerbatedbythedistancetheresearchermusttraveltomakeuseofthesystem.Smallerimmersivesystemscanbeavailableinthelab,andwhiletheirbenefitsmayfallbetweendesktopandlocation-basedimmersivesystems,proximitytotheresearchcanmakethemmuchmorevaluable.
Asinglefavorableanecdoteindicatesthatanimmersivesystemcanbeuseful,andtherearesev-eralsuchanecdotes,somediscussedinSection47.4.Forexample,inSection47.4.1,within20mininaCAVEsystem,geologistKinslanddiscoveredsomethingnewindatahehadbeenporingover.InSection47.4.2,researcherswereabletoexplorethatwhichcouldnototherwisebeexplored—hiddendataunderthesurfaceatasiteforwhichdiggingwasprohibited.Alsotheyfoundthatseeingtheirdataat scalewasmuchmoreusefulthanviewingasmallmodelonacomputerdesktop.InSection47.4.3,theLidarViewerapplicationhasbeenshowntobevaluableforseveralresearchersinitsabilitytonaturallyselectagroupofpointsandthenmeasurethemprecisely.AndinSection47.4.4,theimmersiveinterfacewashelpfulthroughthenaturalplacementtechniquesusedtoanno-tatethedip/strikewithinthesubsurfacedata,whichalsowasfromasitethatwouldhavebeentoobig(anddeep)todig.
Butbeyondanecdotes,thereisalsoexperimentalevidencethatdemonstratesadvantagesinusingimmersive technologies forscientificvisualization. In the realmofgeosciences,Gruchallaetal.demonstratedanimprovedabilityinnavigatingthroughacomplexwell-pathlandscape(Gruchalla,2004).Inthewiderfieldofimmersivevisualization,Prabhat’sexperimentonanalyzingfluidflowthrough a heart found immersive technologies provided increased performance over desktoptools (Prabhat,Forsberg,Katzourin,Wharton,&Slater,2008),andBradyetal.described tasks AQ16
K14855_C047.indd 1255 3/19/2014 5:55:32 PM
1256 Handbook of Virtual Environments: Design, Implementation, and Applications
(following indistinctfibersthroughvolumedata)foundtobenearlyimpossibletoperformonthedesktopweredoableinaCAVEdisplay(Bradyetal.,1995).
Ofcourse,therearefieldsrelatedtothegeosciencesintheirneedtovisualizedatawithinthecontextofthephysicalworldthatalsobenefitfromtheseandsimilarimmersivetools.Archaeologyhasalreadybeenmentioned,plusotherareassuchascommunityplanning,whichhasbeenusedattheCAESfacilityusingthesameLidarViewertooldescribedinSection47.4.2.
Thebenefitsarenotautomatic,however—purchasinganewCAVEisnotsufficienttoguaranteegreatresults.Acquiringthehardwareisonlypartoftheprocess.Thereisgoodsoftwareavailable,butnottoanoverwhelmingdegree,andexpertiseisrequiredtogetthesoftwareinstalled,config-ured,andputtouse.Insomecases,therewon’tbeasoftwarepackagethatdirectlymeetsthescien-tists’needs,andsocustomsoftwarewillbeneeded,requiringmoreexpertiseaswellasmoretime.Andthenonceagain,onlyifthehurdlestousearelowenough,willscientistsbefullyengaged.
TheobservationofMarshallMcLuhan“I wouldn’t have seen it if I hadn’t believed it”servesasanothercautionaryconsideration.Theabilitytovaryscales(e.g.,humanversuscontinental)orselecthowdataarefilteredoffersthepossibilitytoseefeaturesthataren’tobviousinthefieldorwhenobservingtheunfiltereddata.Buttoavoidperceivingwhatisn’tthere,itisalsoimportanttogobacktothefieldortotheunfiltereddata.Forexample,asubtlefaultwhosearealextentisn’tvisibleinthefieldbecomesidentifiableasafaultbyitshorizontalformandextentinLIDARdataviewedimmersively.Backinthefield,thesubtletopographycanbeconfirmedtoclearlyidentifyafault.
In theend,VRisamediumthatcanassistoursearchfordetails revealing thenatureofourplanet.Aswepointedout in the introduction,mostgeology is intrinsically3D.Interpretingandcommunicatingabout3Ddataisthusmosteffectively(quickest,mostaccurate,etc.)donein3D,physicallyimmersive,viewing.Whilegeologistshavelearnedhowtointerpret2Drepresentationsinto3D,bypresentingthedatadirectlyinthreelivingdimensions,itbecomeseasierforthemindto ingest.Wealso largelyavoid thepitfallsofpreconceptions thatcanunintentionallycloud theinterpretation.
47.6 Future and ConClusIon
Interestandexcitementaroundimmersivetechnologies—Virtual Reality!—ebbsandflowsoverthecourseoftime.Ingeneral,ithasfollowedthetypicalpatternoftheGartner’stechnologyhypecurve(Fenn,1995)inthatafteraninitialspark,therewashugeinterestandmediaexposure,surpassingtheaccomplishedmeritofthetime.ForVR,thispeak of inflated expectationsoccurredinthemid-1990s.Followingthat,duringthetrough of disillusionment,thependulumgenerallyswingstoofartothenegative,andmanygiveuponthetechnology.Thosewhocontinueandotherswhograduallyjointheeffortmayperseverethroughtheslope of enlightenment,perhapstoeventuallyreachtheplateau of productivity.
Presently,wecanconsiderthetechnologyofimmersiveinterfaces(VR)tobesomewhereontheslope of enlightenmentwithvaluegraduallybeingdemonstratedtomoreandmoreusers.Thatdoesnotmeanthat therearenot thosewhotest thetechnologyandfindit insufficientfor theirneeds,forthatisthenatureofalltechnology.Butweareseeinganincreasingnumberofscientificresearcherswhohavefoundvalueinimmersivetechnologies,severalinfieldsrelatedtogeologicresearch.
Onetrendbolsteringimmersivetechnologiesistheincreasingavailabilityofneededtechnolo-giesthroughconsumerchannels.Mostprominently,theavailabilityof3Dtelevisiondisplayshasmadetheprospectsofbuildingalow-costimmersivesystempossible.Theubiquitousnatureof3Daccelerationinjustabouteverycomputingdeviceenablesinterestingvirtualworlds,andthelastmajorpieceofthepuzzleispositiontracking,whichcanrangefromhomebrewusingWii™remotecontrols or PlayStation Move™ controllers to professional tracking systems costing one or twoordersofmagnitudemore.Butevenprofessionalsystemsaresignificantlylessexpensiveandper-formbetterthanwhatwasavailableadecadeago.Integratingalow-costimmersivesystemcanbe
K14855_C047.indd 1256 3/19/2014 5:55:32 PM
1257Immersive Visualization for the Geological Sciences
doneonanindividualorsmallgroupbasis,buttherearebenefitstobegainedbyworkingtogetherinacommunity.TheIQ-Station(Shermanetal.,2010)projectisonesucheffortwherebyanopenrecipefor thehardwareisprovidedandrefined, takingintoaccount thechangingavailabilityofconsumerproducts(IQ-StationConsortium,2013).
Anotherprecursortowiderusageofimmersivetechnologiesforvisualizationaswellasotherusescomesfromthegrowthofend-usersoftwarethatisquicklyusable.Thisgrowthcanbefosteredintwoways.Onewayisthroughtheadoptionofimmersive,orVR,optionstoexistingvisualizationsoftware—particularlysoftwarethatisalreadyinusebytheusercommunity.SomeexamplesofvisualizationtoolsthatprovidethisoptionincludethecommercialpackagesAvizo(VisualizationSciencesGroup,2013)andEnsight(ComputationalEngineeringInternational,Inc.,2013),aswellasopentoolssuchasParaView(Kitware,Inc.ParaView,2013).
Theotherprimarywaytospurgrowthistoprovideauserinterfacethatisnotonlyeasytousebutwidelyadopted.When there is inconsistencybetweenhow touse immersivesoftware tools,thenmoreeffortisrequiredforenduserstobecomefamiliarandfluentwitheachtool.Consistencyallowsuserstoquicklymovebetweenapplications,andwhentoolsbecomeavailablewithneededfeatures,userscanreadilyjumptothenew(andprobablyimproved)tool.Thisabilitytokeepontheforefrontofsoftwaretechnologywillbetterholdtheinterestofthosewhousethetechnologybecauseithelpsthemimprovetheirresearch.
The ebb and flow in the amount of usage and attention garnered by immersive technologieswilllikelycontinue.Butevennow,overall,theevidencesuggeststhatthereisvalueinimmersivesystemsbenefitingmanyinthescientificcommunities,includingthegeologicalsciences.Weantici-patethatasproliferationofthetechnologycontinuestospread,theaudiencewillgrowsteadily,thehardwareandsoftwaresystemswillimprove,andsomewillbeavailableready-to-userightfromthetimeofpurchase.
All these advances, coupled with the ascension of new scientists with technology usage,engrainedintheirlives,lookingtotakeadvantageofanytechnologythatprovidesdividends,andwecanexpectusageofimmersivetechnologiesinthegeosciencesoverthecomingyearstobeevenmorefruitful.
reFerenCes
AegisInstruments.(2013).Easy 3D-GPR visualization software.RetrievedAugust1,2013,fromhttp://www.aegis-instruments.com/products/brochures/easy-3d-gpr.html
Aitken,M.J.(1958).Magneticprospecting:I—ThewaterNewtonsurvey.Archaeometry, 1,24–29.American Society for Photogrammetry and Remote Sensing (ASPRS). (2013). LASer (LAS) file format
exchange activities. RetrievedAugust 1, 2013, fromhttp://asprs.org/Committee-General/LASer-LAS-File-Format-Exchange-Activities.html
Bagley,J.W.(1917).The use of the panoramic camera in topographic surveying: With notes on the appli-cation of photogrammetry to aerial surveys (U.S. Geological Survey Bulletin #657). Washington,DC: GovernmentPrintingOffice.
Becker, H. (1995). From nanotesla to picotesla—A new window for magnetic prospecting in archaeology.Archaeological Prospection, 2,217–228.
Bier,E.A.,Stone,M.C.,Fishkin,K.,Buxton,W.,&Baudel,T.(1994).Ataxonomyofsee-throughtools.InACM CHI(pp.358–364).
Bierbaum,A.,Just,C.,Hartling,P.,Meinert,K.,Baker,A.,&Cruz-Neira,C.(2001).VRjuggler:Avirtualplatformforvirtualrealityapplicationdevelopment.InVR ’01 Proceedings of the Virtual Reality 2001 Conference(p.89).
Billen,M.,Kreylos,O.,Hamann,B.,Jadamec,M.,Kellogg,L.Staadt,O.,&Sumner,D.(2008,September).A geoscienceperspectiveonimmersive3Dgriddeddatavisualization.Computers & Geosciences, 34(9),1056–1072.
Blee,H.H.(1940).Thirddimensionmaps.Military Engineer, 32,187–190.Borst,C.W.&Kinsland,G.L.(2005).Visualization and interpretation of 3-D geological and geophysical data
in heterogeneous virtual reality displays: Examples from the Chicxulub impact crater.PaperpresentedattheTransactions:GulfCoastAssociationofGeologicalSocieties(Vol.55),NewOrleans,LA.
AQ17
K14855_C047.indd 1257 3/19/2014 5:55:32 PM
1258 Handbook of Virtual Environments: Design, Implementation, and Applications
Borst,C.W.,Baiyya,V.B.,Best,C.M.,&Kinsland,G.L.(2007).Volumetricwindows:Applicationtointer-pretationofscientificdata,shader-basedrenderingmethod,andperformanceevaluation. InThe 2007 International Conference on Computer Graphics and Virtual Reality(pp.72–78).
Borst,C.W.,Tiesel,J.-P.,&Best,C.M.(2010,May/June).Real-timerenderingmethodandperformanceeval-uationofcomposable3DlensesforinteractiveVR.IEEE Transactions on Visualization and Computer Graphics, 16(3),394–410.
Borst,C.W.,Tiesel,J.-P.,Habib,E.,&Das,K.(2011).Single-passcomposable3Dlensrenderingandspa-tiotemporal3Dlenses.IEEE Transactions on Visualization and Computer Graphics, 17(9),1259–1272.
Brady,R.,Pixton,J.,Baxter,G.,Moran,P.,Potter,C.S.,Carragher,B.,&Belmont,A.(1995,October).Crumbs:Avirtualenvironmenttrackingtoolforbiological imaging.In1995 Proceedings of IEEE Biomedical Visualization(pp.18–25).
Bristow, C., Duller, G., & Lancaster, N. (2007).Age and dynamics of linear dunes in the Namib Desert.Geology, 6(35),555–558.
ComputationalEngineeringInternational,Inc.(CEI).(2013).Ensight virtual reality.RetrievedAugust1,2013,fromhttp://www.ceisoftware.com/virtual-reality-vr
Das,K.,&Borst,C.W.(2010a).Anevaluationofmenupropertiesandpointingtechniquesinaprojection-basedVRenvironment.InIEEE 3D User Interfaces (3DUI)(pp.47–50).
Das,K.,&Borst,C.W.(2010b).VRmenus:Investigationofdistance,size,auto-scale,andray-castingvs.pointer-attached-to-menu.InISVC (Visual Computing)(pp.719–728).
DeFanti, T.A., Dawe, G., Sandin, D. J., Schulze, J. P., Otto, P., Girado, J., … Rao, R. (2009, February).TheStarCAVE, a third-generation CAVE and virtual reality OptIPortal. Future Generation Computer Systems, 25(2),169–178,Elsevier.
Demiralp,C.,Jackson,C.D.,Karelitz,D.B.,Zhang,S.,&Laidlaw,D.H.(2006).CAVEandFishtankvir-tual-realitydisplays:Aqualitativeandquantitativecomparison.IEEE Transactions on Visualization and Computer Graphics, 12(3),323–330.
DOE: U.S. Department of Energy, Offices of Environmental Management and Science and Technology.(2000, June).Electrical resistance tomography for subsurface imaging(InnovativeTechnologySummaryReport,DOE/EM-0538).
Dorn,G.,Touysinhthiphonexay,K.,Bradley,J.,&Jamieson,A.(2001).Immersive3-Dvisualizationappliedtodrillingplanning.The Leading Edge, 12(20),1389–1392.
Edelsbrunner,H.,&Mucke,E.P.(1994).Three-dimensionalalphashapes.ACM Transactions on Graphics (TOG), 13(1),43–72.
EONReality,Inc.(2013).Experience more with virtual reality.RetrievedAugust1,2013,fromhttp://www.eonreality
Farr,T.G.,&Kobrick,M.(2000).ShuttleRadarTopographyMissionproducesawealthofdata.American Geophysical Union EOS, 81,583–585.
Farr,T.G.,Rosen,P.A.,Caro,E.,Crippen,R.,Duren,R.,Hensley,S.,…Alsdorf,D.(2007).TheShuttleRadarTopographyMission.Reviews of Geophysics, 45,RG2004.doi:10.1029/2005RG000183.
Fenn,J.(1995).When to leap on the hype cycle(GartnerID:SPA-ATA-305).Fröhlich, B., & Lancaster, A. (1986). Electromagnetic surveying in current Middle Eastern archaeology:
Applicationandevaluation.Geophysics, 51,1414–1425.Fröhlich,B.,Barrass,S.,Zehner,B.,Plate,J.,&Göbel,M.(1999).Exploringgeo-scientificdata invirtual
environments.InProceedings of IEEE Visualization ’99(pp.169–173).Furukawa,Y.,&Ponce,J.(2009).Accurate,dense,androbustmulti-viewstereopsis.InIEEE Transactions on
Pattern Analysis and Machine Intelligence.Gay,S.P.(1971).Morphologicalstudyofgeophysicalmapsbyviewinginthreedimensions.Leading Edge
(Journal), 36,396–414,Tulsa,OK,ISSN:1070-485X,04/1971.Glenn, N., Streutker, D., Chadwick, D., Thackray, G., & Dorsch, S. (2006). Analysis of LiDAR-derived
topographic information for characterizing and differentiating landslide morphology and activity.Geomorphology, 73(1),131–148.
Gold,P.O.,Cowgill,E.,Kreylos,O.,&Gold,R.D.(2012).Aterrestriallidar-basedworkflowfordeterminingthree-dimensionalslipvectorsandassociateduncertainties.Geosphere, 8(2),431–442.
Goodman,D.,Nishimura,Y.,&Rogers,J.(1995).GPRtimeslicesinarchaeologicalprospection.Archaeological Prospection, 2,85–89.
Gruchalla,K. (2004, March). Immersive well-path editing: Investigating the added value of immersion. InIEEE Proceedings of 2004 Virtual Reality(pp.157–164).
Harding,C.,Kakadiaris,I.A.,Casey,J.F.,&Loftin,R.B.(2002).Amulti-sensorysystemfortheinvestigationofgeoscientificdata.Computers & Graphics, 26(2),259–269.
AQ18
AQ19
AQ20
AQ21
K14855_C047.indd 1258 3/19/2014 5:55:32 PM
1259Immersive Visualization for the Geological Sciences
IQ-Station Consortium. (2013). Open-recipe low-cost immersive display. RetrievedAugust 1, 2013, fromhttp://iq-station.org
Itoh,M.,Ohigashi,M.,&Tanaka,Y.(2006).WorldMirrorandWorldBottle:Componentsforinteractionbetweenmultiplespaces ina3Dvirtualenvironment. InIEEE Tenth International Conference on Information Visualization, 2006 (IV, 2006)(pp.53–61).
Kinsland,G.L.,Borst,C.W.,Best,C.M.,&Baiyya,V.B.(2007).Geomorphology and Holocene Fluvial Depositional History in the Mississippi River Valley near Lafayette, Louisiana: Interpretations of LIDAR data performed in 3D virtual reality. Paper presented at the Gulf Coast Association of GeologicalSocieties2007Convention.
Kinsland,G.L.,Borst,C.W.,Tiesel,J.P.,&Bishop,C.E.(2008).Imagingdigitalwell logsin3Dvirtualreality:InvestigationofnorthernLouisianaWilcoxfluvial/coalstrataforcoalbednaturalgas.Gulf Coast Association of Geological Societies Transactions, 58,517–524.
Kitware, Inc. (2013). ParaView/users guide/CAVE display. Retrieved August 1, 2013, from http://www.paraview.org/Wiki/ParaView/Users_Guide/CAVE_Display
Kitware,Inc.(2013).“VTK—The visualization toolkit” software.RetrievedAugust1,2013,fromhttp://www.vtk.orgKiyokawa,K.,&Takemura,H.(2005).Atunnelwindowanditsvariations:Seamlessteleportationtechniques
inavirtualenvironment.HCI International.Komerska,R.,&Ware,C.(2004).Hapticstate–surfaceinteractions.IEEE Computer Graphics and Applications,
24(6),52–59.Kreylos,O.(2008).Environment-independentVRdevelopment. InBebis,G.etal. (Eds.),Lecture Notes in
Computer Science (LNCS): Vol. 5358. 2008 Proceedings of the International Symposium on Visual Computing (ISVC),Part I (p.901).Berlin,Germany:Springer-Verlag.
Kreylos,O.,Bawden,G.,Bernardin,T.,Billen,M.I.,Cowgill,E.S.,Gold,R.D.,…Sumner,D.Y.(2006).Enablingscientificworkflowsinvirtualreality.InProceedings of the 2006 ACM International Conference on Virtual Reality Continuum and Its Applications(pp.155–162).
Kreylos,O.,Bawden,G.W.,&Kellogg,L.H.(2008).ImmersivevisualizationandanalysisofLiDARdata.InBebis,G. et al. (Eds.),Lecture Notes in Computer Science (LNCS): Vol. 5358.2008 Proceedings of the International Symposium on Visual Computing (ISVC), Part I(pp.846–855).Berlin,Germany:Springer-Verlag.
Kurtenbach,G.,Fitzmaurice,G.,&Balakrishnan,R.(2002).Volumemanagementsystemforvolumetricdis-plays.U.S.Patentapplication10/183,966.
LaFayette,C.,Parke,F. I.,Pierce,C. J.,Nakamura,T.,&Simpson,L. (2008).Atta texana leafcuttingantcolony:Aviewunderground.InACM SIGGRAPH 2008 Talks(Vol.53,p.1).
Lin,A.Y.-M.,Novo,A.,Weber,P.P.,Morelli,G.,Goodman,D.,&Schulze,J.P.(2011).Avirtualexcavation:Combining3Dimmersivevirtualrealityandgeophysicalsurveying.InBebis,G.etal.(Eds.),Lecture Notes in Computer Science (LNCS): Vol.6939.2011 Proceedings of the International Symposium on Visual Computing (ISVC), Part II(pp.229–238).Berlin,Germany:Springer-Verlag.
MacLeod,M.N.(1919,June).Mappingfromairphotographs.The Geographical Journal, 53(6),382–396.http://www.jstor.org/stable/1780414
Moore, C., Gertman, V., Olsoy, P., Mitchell, J., Glenn, N., Joshi,A., … Lee, R. (2011, December 5–9).Discovering new methods of data fusion, visualization, and analysis in 3D immersive environments for hyperspectral and laser altimetry data.SanFrancisco,CA:AmericanGeophysicalUnion.
Mulder,J.D.,&Boschker,B.R.(2004).AmodularsystemforcollaborativedesktopVR/ARwithasharedworkspace.InIEEE Proceedings of 2004 Virtual Reality(pp.75–82).
Murgoitio, J.,Shrestha,R.,Glenn,N.,&Spaete,L. (2013).AirborneLiDARand terrestrial laser scanningderived vegetation obstruction factors for visibility models. Transactions in GIS, 18(1), 147–160.doi:10.1111/tgis.12022.
Novo,A.,Grasmueck,M.,Viggiano,D.,&Lorenzo,H.(2008).3DGPRinarchaeology:Whatcanbegainedfromdensedataacquisitionandprocessing.Twelfth International Conference on Ground Penetrating Radar,Birmingham,U.K.
O’Leary,P.(2010).“Toirt-Samhlaigh” software.Retrievedfromhttp://code.google.com/p/toirt-samhlaigh/Olsoy,P.,Gertman,V.,Glenn,N.,Joshi,A.,Mitchell,J.,Whiting,E.,…Spaete,L.(2012,March).Interactive
exploration and data fusion of multimodal remote sensing data. In ASPRS Annual Conference(pp.19–23).Sacramento,CA.
Perlin, K., & Fox, D. (1993). Pad:An alternative approach to the computer interface. In Proceedings of SIGGRAPH 1993(pp.57–64).
Plumlee,M.,&Ware,C.(2006).Zoomingversusmultiplewindowinterfaces:Cognitivecostsofvisualcom-parisons.ACM Transactions on Computer-Human Interaction, 13(2),179–209.
AQ22
AQ23
AQ24
AQ25
K14855_C047.indd 1259 3/19/2014 5:55:32 PM
1260 Handbook of Virtual Environments: Design, Implementation, and Applications
Prabhat,Forsberg,A.,Katzourin,M.,Wharton,K.,&Slater,M.(2008).Acomparativestudyofdesktop,fish-tank,andcavesystemsfortheexplorationofvolumerenderedconfocaldatasets.IEEE Transactions on Visualization and Computer Graphics, 14,551–563.
Prachyabrued,M.,Ducrest,D.,&Borst,C.W.(2011).Handymap:AselectioninterfaceforclutteredVRenvi-ronmentsusingatrackedhand-heldtouchdevice.InBebis,G.etal.(Eds.),Lecture Notes in Computer Science (LNCS): Vol. 6939. 2011 Proceedings of the International Symposium on Visual Computing (ISVC), Part II(pp.45–54).Berlin,Germany:Springer-Verlag.
Raghupathy,P.B.,&Borst,C.W.(2011).InvestigationofsecondaryviewsinamultimodalVRenvironment:3Dlenses,windows,andmirrors.InBebis,G.etal.(Eds.),Lecture Notes in Computer Science (LNCS): Vol. 6939.2011 Proceedings of the International Symposium on Visual Computing (ISVC), Part II(pp. 180–189).Berlin,Germany:Springer-Verlag.
Raghupathy,P.B.,&Borst,C.W.(2012).Forcefeedbackandvisualconstraintfordrawingonaterrain:Pathtype,viewcomplexity,andpseudohapticeffect.In3DUI 2012(pp.157–158).
Robertson,G.,vanDantzich,M.,Robbins,D.,Czerwinki,M.,Hinckley,K.,Risden,K.,…Gorokhovsky,V.(2000).Thetaskmanager:A3Dwindowmanager.InCHI(pp.494–501).
Rogowitz, B. E., & Trenish, L.A. (1998). Why should engineers and scientists be worried about color?Retrievedfromhttp://www.research.ibm.com/people/lloydt/color/color.HTM
Schmalstieg,D.,&Schaufler,G.(1999).SewingworldstogetherwithSEAMs:Amechanismtoconstructcom-plexvirtualenvironments.Presence: Teleoperators and Virtual Environments, 8(4),449–461.
Sgambati,M.R.,Koepnick,S.,Coming,D.S.,Lancaster,N.,&Harris,F.C.Jr.(2011).Immersivevisualiza-tionandanalysisofgroundpenetratingradardata.InBebis,G.etal.(Eds.), Lecture Notes in Computer Science (LNCS): Vol. 6939. 2011 Proceedings of the International Symposium on Visual Computing (ISVC), Part II(pp.33–44).Berlin,Germany:Springer-Verlag.
Sherman,W.R.,O’Leary,P.,Whiting,E.T.,Grover,S.,&Wernert,E.A.(2010).IQ-Station:Alowcostpor-table immersiveenvironment. InBebis,G.etal. (Eds.), Lecture Notes in Computer Science (LNCS): Vol. 6454.2010 Proceedings of the International Symposium on Visual Computing (ISVC), Part II(pp.361–372).Berlin,Germany:Springer-Verlag.
Schulze,J.P.,Prudhomme,A.,Weber,P.,&DeFanti,T.A.(2013,March4).CalVR:Anadvancedopensourcevirtual reality software framework. InProceedings of SPIE 8649, The Engineering Reality of Virtual Reality 2013(pp.864–902).doi:10.1117/12.2005241
Snavely, N., Seitz, S. M., & Szeliski, R. (2006). Photo tourism: Exploring image collections in 3D. ACM Transactions on Graphics (Proceedings of SIGGRAPH 2006).
Stoakley,R.,Conway,M.,&Pausch,R. (1995).Virtual realityonaWIM:Interactiveworlds inminiature.In ACM CHI(pp.265–272).
Tabbagh,A.(1986).Applicationsandadvantagesoftheslingramelectromagneticmethodforarchaeologicalprospecting.Geophysics, 51,576–584.
Tanaka,H.K.M.,Nakano,T.,Takahashi,S.,Yoshida,J.,Takeo,M.,Oikawa,J.,…Niwa,K.(2007,November).Highresolutionimagingintheinhomogeneouscrustwithcosmic-raymuonradiography:Thedensitystructure below the volcanic crater floor of Mt.Asama, Japan, Earth and Planetary Science Letters, 263(1–2),15,104–113.http://dx.doi.org/10.1016/j.epsl.2007.09.001
Viega,J.,Conway,M.J.,Williams,G.,&Pausch,R.(1996).3Dmagiclenses.InACM UIST(pp.51–58).VisualizationSciencesGroup(VSG).(2013).Avizo extensions.RetrievedAugust1,2013,fromhttp://www.
vsg3d.com/avizo/extensionsWang,R.,&Qian,X.(2010,December).OpenSceneGraph 3.0: Beginner’s Guide.PacktPublishing,ISBN:
1849512825.Ware,C.,Plumlee,M.,Arsenault,R.,Mayer,L.A.,Smith,S.,&House,D.(2001).GeoZui3d:Datafusionfor
interpretingoceanographicdata.InOceans 2001(pp.1960–1964).Weiskopf,D.,Engel,K.,&Ertl,T.(2003).Interactiveclippingtechniquesfortexture-basedvolumevisualiza-
tionandvolumeshading.IEEE Transactions on Visualization and Computer Graphics, 9(3),298–312.Winkler,C.,Bosquet,F.,Cavin,X.,&Paul,J.C.(1999,October).Designandimplementationofanimmersive
geosciencetoolkit(casestudy).InIEEE Proceedings of Visualization ’99(pp.429–432).IEEEComputerSocietyPress.
Yamaguchi,Y.,Kahle,A.B.,Tsu,H.,Kawakami,T.,&Pniel,M.(1998).OverviewofAdvancedSpaceborneThermalEmissionandReflectionRadiometer(ASTER).IEEE Transactions on Geoscience and Remote Sensing, 36(4),1062–1071.
AQ26
AQ27
K14855_C047.indd 1260 3/19/2014 5:55:32 PM
autHor QuerIes
[AQ1] PleasecheckwhetherthecitationsforFigures47.1through47.6,47.11through47.13,47.19,and47.20areappropriate.
[AQ2] Pleasecheckifedittothesentencestarting“Togeoscientists,this....”isokay.[AQ3] ArtworkofFigures47.1and47.7aresame.Pleasecheck.[AQ4] PleaseconfirmtheinsertedcitationforFigures47.1–47.6,7.11–7.13,and7.20.[AQ5] PleaseconfirmtheinsertedpartlabelsinthecaptionofFigure47.2.[AQ6] Pleasecheckifedittothesentencestarting“Specializedradardevices…”isokay. [AQ7] Pleasecheckthesentencestarting“Additionally,astheoriginal....”forcompleteness.[AQ8] Pleasecheckifedittothesentencestarting“Collectinglocationdata....”isokay.[AQ9] Pleasecheckifedittothesentencestarting“Streamlinesandstreaklines....”isokay.[AQ10] Pleaseprovidetheexpansionof“6-DOF,”ifappropriate.[AQ11] Pleaseconfirmtheidentifiedheadlevels.[AQ12] PleasecheckthementionofcolorinFigure47.12.[AQ13] PleasenotethattheyearinMooreetal.(2012)ischangedasperlist.[AQ14] Pleasecheckthementionofcolorinthesentencestarting“Theimageon....” [AQ15] Pleasecheckthementionofcolorinthesentencestarting“Thecolorsindicate....” [AQ16] Prabhat(2008)hasbeenchangedtoPrabhatetal.(2008)asperthereferencelist.Please
check.[AQ17] Pleaseprovideeditorgroupandpublisherdetailsforthefollowingreferences:Bieretal.
(1994), Bierbaum et al. (2001), Borst et al. (2007), Brady et al. (1995), Das and Borst(2010a,b),Fröhlichetal.(1999),Gruchalla(2004),Itohetal.(2006),Kreylosetal.(2006),LaFayetteetal.(2008),MulderandBoschker(2004),PerlinandFox(1993),RaghupathyandBorst(2012),Robertsonetal.(2000),Sgambatietal.(2011),Shermanetal.(2010),Schulzeetal.(2013),Stoakleyetal.(1995),Viegaetal.(1996),Wareetal.(2001).
[AQ18] Please provide publisher details and also confirm the inserted report number for DOE(2000).
[AQ19] PleaseprovidepublisherdetailsforFenn(1995).[AQ20] PleaseprovidevolumenumberandpagerangeforFurukawaandPonce(2009).[AQ21] PleaseconfirmtheinsertedvolumenumberandpagerangeforGay(1971).Alsoconfirm
journaltitleforthesame.[AQ22] Please provide location for Kinsland et al. (2007), Kiyokawa and Takemura (2005),
Murgoitioetal.(2013),Schulzeetal.(2006),WangandQian(2010).[AQ23] PleaseconfirmtheeditmadetoKreylos(2008),Kreylosetal.(2008),Linetal.(2011),
Prachyabruedetal.(2011).[AQ24] PleaseprovidepublisherdetailsforKurtenbachetal.(2002),ifapplicable.[AQ25] PleaseprovidepublishernameandeditorgroupforOlsoyetal.(2012).[AQ26] PleaseprovideinitialsforPrabhat.[AQ27] PleaseprovideeditorgroupandlocationforWinkleretal.(1999).
K14855_C047.indd 1261 3/19/2014 5:55:32 PM