Embed Size (px)
Citation preview

First Opinion
An ARF Research Review of Integration Marketing & Communications Limited’s
Market ContactAudit TM Metrics Significance Assessment Methodology
William A. Cook, Ph.D. Sr. V.P., Research & Standards
April 16, 2008

2
INTRODUCTION
Following the 2007 ARF Research Review of the Integration Marketing & Communications Limited’s (“Integration™”) Market ContactAudit™ methodology (MCA™), ARF was requested to review the methodology Integration™ had developed to assess the magnitude of key MCA™ metrics and the differences observed among them.
The purpose of the MCA™ methodology is to provide clients with increased marketing communications accountability by measuring the effectiveness of a brand’s marketing communications from the consumer’s perspective. MCA™ is designed to quantify how successfully a brand engages with consumers across media channels by measuring the degree to which they recall connecting with it through contacts (or “touch points”), factored by each contacts’ influence. Over 500 MCA™ audits have been conducted covering some 183 categories, 60 markets and in 25 languages. For a comprehensive review of the MCA™ methodology, the reader is referred to the 2007 First Opinion Review which can be downloaded from the ARF web site, http://www.theARF.org/assets/research-reviews.
The purpose of this review is:
1. To review the metrics and the Integration™ methodology for estimating their stability, and consequently the statistical significance of the differences among selected metrics, in the context of ARF guidelines.
2. To render an opinion of the adequacy of the methodology to meet the stated objectives, both in theory and in practice, insofar as that practice has been represented to the ARF by Integration.
The ARF opinion is based on the years of experience of the ARF staff and the body of ARF principles and guidelines currently available.
MCA™ OBJECTIVES
As outlined in Integration’s literature1, the objective of the MCA™ approach is to provide clients with increased marketing communications accountability by giving them means to audit the effectiveness of any brand’s marketing activation plan within a given category. The MCA™ approach quantifies how consumers experience brands and yields metrics with which to assess and manage brand experience across media. Through the MCA™, Integration provides marketers with a common currency, the Brand Experience Points™ (BEPs™), to compare the clout and the cost-efficiency of the different communication channels or contacts. The contacts measured by the MCA™ include traditional media channels, but may extend well beyond that to include word of mouth, one-to-one dialogue, branded websites, sponsored events, in-store, packaging, samples, etc., depending on what consumers indicate in the qualitative phase are relevant for the category under study.

3
The decision to focus on contacts rests on two key assumptions: 1.) it is more useful to measure what consumers perceive, rather than what they receive, and 2.) the consumer’s mind is the true integrator of marketing communications elements.

4
Contacts are measured and reported on individually, in addition to being summarized in terms of BEPs™. Contacts also affect the quality of the brand encounter. The fact that the majority of marketing spend is in the area of media contacts adds to the importance of managing them well. In addition, it is of growing importance that we measure branding influences that lie beyond the traditional marketing mix – from Street Theater to ads on wrapped building exteriors, or city buses. By providing an integrated system of measurement, MCA™ enables marketers to manage their contacts and messages holistically, in terms of the total brand experience including content, contacts and context. Conducted properly, the MCA™ can enable marketers to evaluate which of the brand’s marcom activities are effectively contributing, need improvement or should be reconsidered.
THE MCA™ PROCESS
The MCA™ process was the focus of the 2007 First Opinion Review of the MCA™ methodology. An overview of the process and a methodological summary are given in Appendix 2 of this document.
MCA™ is an integral part of a larger Integration Brand Experience™ Strategy Process. The process enables marketers to translate MCA indicators into Brand Experience strategies that both increase Brand Experience effectiveness and efficiency.
The Integration Brand Experience™ Strategy Process has been shown to contribute to successful marketing communications most when it is integrated into the larger business planning process. For example, see the map of the Integration MeTHOD™ Management Process in Appendix 1.
Insights into how various contacts contribute to a brand’s strengths and weaknesses are readily communicated by displays that combine simple metrics such as the CCF and the Number of Associations the brand has.

5

6
METRICS SIGNIFICANCE ASSESSMENT METHODOLOGY
Estimating Context Clout Factor Confidence Intervals and Significance Levels. Integration obtained expert consultation on the use of bootstrapping to provide variance estimates on which to base confidence intervals and significance levels for CCFs™.
Three measures are summarized into a single indicator for the capacity of a contact to influence consumer attitudes towards brands in a given category, the Contact Clout Factor™(CCF™):
1) Rational – the degree to which a contact effectively conveys information
2) Attractiveness – its ability to build an emotional bond, and
3) Power – its capacity to change attitudes and behavior.
ARF OPINION
The ARF staff reviewed thoroughly the recommendations of Dr. Colleen Kelly at the Statistical Consulting Center, San Diego State University and found them well-grounded and usefully translated into a computation procedure for Integration™ and their clients.
We concur with Dr. Kelly that the bootstrap resampling procedure is a useful computational method by which to estimate standard errors or confidence intervals when no closed form formula exists for the standard errors, as is the case with the CCF™. We would even add that given the lack of evidence of bias in the sampling or measurement methods associated with the CCF™, the bootstrapping method can be considered quite robust here.
Bootstrapping as a variance estimation procedure typically does not address variability that can result from measurement or sampling bias, and, consequently, should be used with restraint in situations where bias may exist. Based on the findings of the 2007 First Opinion Review of the MCA™ methodology, we judge that the likelihood of biased sampling or measurement is negligible in measurement of the CCF™.
Estimating Confidence Intervals and Significance Levels for Number of Associations. May Kanounji, Research Analytst, Integration
Estimating Confidence Intervals and Significance Levels for Brand Experience Shares. To obtain a method for the estimation of the variance of the BES™, Integration sought the expert consultation of Duane Steffey, Ph.D., Sr. Managing Scientist, at Exponent Failure Analysis Associates. The ARF staff has carefully reviewed Dr. Steffey’s paper and the references on which he founds is recommendation.
ARF OPINION
The best estimate of the variance of the sum of a set of random variables is fairly well known to be the sum of the variances of those random variables. The estimate of the product of a pair of random variables is less well known, and Dr.

7
Steffey’s application of the work of Rice (1999) provides a useful solution for estimating the variance of the BES. We wish to point out that there is a limit to the validity of Dr. Steffey’s assumption that the sampling distribution of BEP will be approximately a normal distribution based on the “law of large numbers” or Central Limit Theorem. The number of associations question is only asked of those individuals who have indicated that a given contact is relevant to the category to them, hence the number of observations contributing to the association sample means can be small for small share brands and for infrequently cited contacts. We recommend not using the normal approximation where the number of association measures obtained is less than 30.
POLICIES AND POSITIONS OF MCA™ STAKEHOLDERS
Integration is an employee owned research and consulting firm with registered offices in Nicosia, Cyprus and Singapore and representatives in Frankfurt, London, New York, Paris, and San Diego. The Chairman is Eric Fredericks and the CEO is Oscar Jamhouri. Integration, founded in 1994, is an international consultancy firm dedicated to developing tools and processes to measure and improve the effectiveness of Integrated Marketing & Communications. Its core product is the Market ContactAudit™ (MCA™) methodology which has been conducted in over 500 audits covering 183 categories, 60 markets and 25 languages.
Integration’s Market ContactAudit™ provides the measurement platform for successful integrated marketing and communications. By category and market, it identifies the most influential and differentiating means to connect to consumers; it also highlights the strengths, weaknesses, opportunities and threats of a brand's marketing activities relative to competition.
STeP™ develops software programs that enhance the operational performance of the group's tools and processes. Computer assisted reading, reporting and brand experience planning modules minimize the time needed for analysis and strategy development, and allows customers to concentrate resources on marketing execution.
IMC-ACADeMY™ empowers customers to extend MCA™-based brand experience planning disciplines and accountability throughout their marketing and sales organizations. The transfer of know-how takes place via the web or standard face to face workshops
MeTHOD consultants coach clients' organizations to (a) introduce accountability and establish best practices across all marketing activities and (b) integrate the marketing & communications function in the business planning process.

8
Integration is proud to have established global alliances with the following multinational organizations:
• Mediacom. Since August 2005
• ARC. Since November 2004
• Mediaedge: cia. Since April 2004
• TBWA. Since February 2004
• OMD. Since July 2003
• MPG (Media Planning Group). Since May 2003
• Dentsu Inc. Since April 2003
• StarcomMediaVest Group (SMG). Since December 2002
• Zenithoptimedia. Since January 2002
• Video Research Ltd. Since January 2005 (Syndicated MCA™ in Japan only)
• Universal McCann. Since January 2006
9
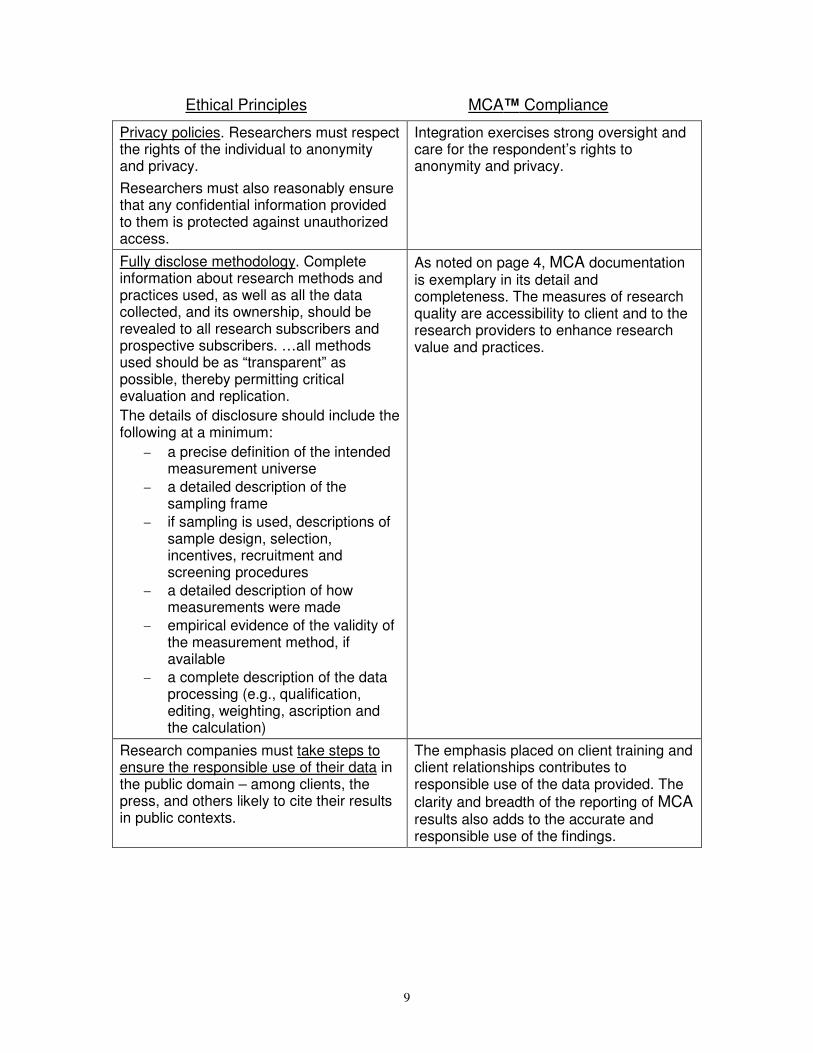
Ethical Principles MCA™ Compliance
Privacy policies. Researchers must respect the rights of the individual to anonymity and privacy.
Researchers must also reasonably ensure that any confidential information provided to them is protected against unauthorized access.
Integration exercises strong oversight and care for the respondent’s rights to anonymity and privacy.
Fully disclose methodology. Complete information about research methods and practices used, as well as all the data collected, and its ownership, should be revealed to all research subscribers and prospective subscribers. …all methods used should be as “transparent” as possible, thereby permitting critical evaluation and replication.
The details of disclosure should include the following at a minimum:
− a precise definition of the intended measurement universe
− a detailed description of the sampling frame
− if sampling is used, descriptions of sample design, selection, incentives, recruitment and screening procedures
− a detailed description of how measurements were made
− empirical evidence of the validity of the measurement method, if available
− a complete description of the data processing (e.g., qualification, editing, weighting, ascription and the calculation)
As noted on page 4, MCA documentation is exemplary in its detail and completeness. The measures of research quality are accessibility to client and to the research providers to enhance research value and practices.
Research companies must take steps to ensure the responsible use of their data in the public domain – among clients, the press, and others likely to cite their results in public contexts.
The emphasis placed on client training and client relationships contributes to responsible use of the data provided. The clarity and breadth of the reporting of MCA results also adds to the accurate and responsible use of the findings.
10
SUMMARY
The pursuit of a consumer-focused system of Brand Contact measurement has resulted in a consistent research methodology that has provided actionable guidance for managing the investment in the brand contacts and the resulting Brand Experience in hundreds of MCA™ studies in dozens of countries and categories.
In a period in which managements have sought to reduce costs while improving performance, systematic, disciplined approaches have been achieved in many areas of business, but less so in marketing than in many other areas. With the application of consumer-led, but rigorous, approaches such as MCA™ marketers and researchers can increase the productivity of their efforts, and the demonstrable results to document those contributions.
These steps taken by Integration to provide solid quantitative estimates of the variance of their metrics are very constructive and will be successful to the degree that clear simple documentation is provided to clients, as has been done for the basic MCA methodology.
REFERENCES
1. Integration’s Brand Experience Handbook © 2002 - 2006 2. Market ContactAudit (MCA), Brand Experience Points (BEP), Contact
Clout Factor (CCF), Brand Experience Shares (BES), IMC-ACADeMY™ , STeP™, MeTHOD™ and Integration are trademarks of Integration Marketing & Communications Limited who is the owner of all rights to the Market ContactAudit (MCA) methodology.

11
APPENDIX 1
Integration also offers the MeTHOD™ Management Process. Using MCA metrics as an input, the deliverables of MeTHOD are designed to answer higher level key business question such as "How does the Brand convert BES relative to Market Share?" and "What is the return on the marketing dollar?"
MeTHOD is a knowledge transfer product consisting of a detailed process handbook, a set of knowledge transfer workshops, and automation software (AutoMeTHOD) that allows clients to autonomously manage their marketing functions. Its objective is to improve marketing accountability by providing a set of business indicators based on MCA combined with financial information. MeTHOD includes several innovative elements, including the application of Activity Based Costing (ABC) to marketing and "Line-of-Sight" (LOS) dashboards (LOS indicates transparency of meaning in marketing performance to all stakeholders vertically across management levels, and horizontally across business functions). Additionally, MeTHOD contains tools necessary for successful change implementation, business process management and communication among others.
Source : Integration
ACCOUNTABILITY CHAMPION

12
APPENDIX 2
Project Initiation. Typically, MCA™ projects are initiated with the participation of a cross-functional team including senior managers, category and brand planners, marcom experts, researchers, sales and POS experts, and financial experts. Members of the project team are presented with a comprehensive training session on the philosophy and rationale for measuring and managing marcom through a Brand Experience system. The qualitative and quantitative phases of MCA™ are fully presented and related to the objectives of the project and to the resulting metrics.
In addition to the materials provided in the initial face-to-face sessions, online tutoring sessions are made available by Integration, and their use is encouraged, particularly for new members added to the project team subsequently.
Detailed instruction manuals are available in hardcopy and in the online system for every phase of the MCA™ project. Since the Integration clientele are typically global marketing companies, the materials are available in the English, Spanish, and Chinese (Mandarin) languages.
The client contributes a “wish list” of prospective client and competitive brands to be studied and a “wish list” of potential contact points. To insure that the MCA™ quantitative research maximizes consumer input, the actual list of brands and contact points employed there are selected on the basis of a set of focus group sessions. The client “wish list” serves as input to those groups, but often the consumers add to that list, or offer alternative ways of describing them, which is important to the success of the quantitative research.
Integration also obtains from the client the details on the market information sought, and reviews with the client the sample size and characteristics, and the design of the quantitative survey. A template customized to the needs of the client is then developed to ensure that the specifications of the study are fully and accurately communicated.
Qualitative. The primary objective of this phase is to define the universe of potential contacts in the language of the consumer. The “wish list” developed by the brand planners is refined and redefined by the consumer input. With their input, Integration and the brand planners select a final list of up to 35 contacts and 18 competing brands from the consumer’s perspective. The carefully structured qualitative research employed as part of the MCA™ process is key to the design of the survey and impacts the resulting quantitative analysis.
The number of group sessions which are conducted depends on the number of customer segments involved, but usually is between 2 and 4 group sessions. For example, loyal buyers versus promotion-driven, or special-occasion buyers might be interviewed separately.
Integration provides a detailed guide for the group sessions and a check list to ensure that the objectives of each session are met, and to evaluate the quality of the session.

13
Survey Design. The first objective of this phase is to measure the intrinsic value of each contact for a given category. The second objective is to assess the perceived experience level for each brand audited through measuring the brand-contact associations.
The four resulting exercises are completed by consumers in 25 minutes or less and are not laborious. The surveys are conducted by face-to-face interview, by mail or via web or web-TV survey. The sample size is 500 or more and is a function of the number of segments and the size of the brands under study.
Measures. Each contact is measured on three dimensions:
1) Rational – the degree to which a contact effectively conveys information
2) Attractiveness – its ability to build an emotional bond, and
3) Power – its capacity to change attitudes and behavior.
These three measures are summarized to a single indicator for the capacity of a contact to influence consumer attitudes towards brands in a given category, the Contact Clout Factor™(CCF™).
The consumer is next asked to indicate whether he/she associates each brand with each of the contacts. Based on the number of brands each consumer associates with each contact, an association weight is calculated for each contact.

14
For each brand an overall indicator of Brand Experience is obtained by adding up across all the contacts the CCF weighted by the number of associations the brand had with that contact resulting in the Brand Experience Points™ (BEP™) measure. Averaging the BEP™ over all of the brands produces the Brand Experience Share™ (BES™) metric which has been shown to be significantly correlated with
Market Share. Analysis Constructs. The analyses of the findings are tailored to address key marketing questions. The questions of the client are related to an array of MCA™ indicators which provide a basis for Brand Experience management.
Source : Integration2
The marketing questions addressed by the MCA™ findings include such issues as:
Brand Experience (BE) Status What is the brand overall performance vs. competition?
Category Learning What are the key contacts in the category?
• To influence • To differentiate
What’s the minimum BE weight to achieve visibility?
Brand Learning What’s the profile of Brand Experience? What are the Brand’s Strengths and Weaknesses? What are the Brand’s Opportunities and Threats?
Bra
nd E
fficie
ncy
Learn
ings
Highlight opportunities to improve
efficiency
Performance vs. comparable
brands in a given contact?
Competitive cost per
BEP benchmarks9
Identify contact activities where
contribution per $ is eroding
What are the cost of BEPs per
contact?
Internal Costs per
BEP8
Evaluate overall marcomms
efficiency
Is the brand’s Return in Brand
Experience improving?Cost per 1% BES7
Fix the mixWhat are the brand
Opportunities and Threats?
Brand-Contacts
Credits & Deficits6
Bra
nd
Effe
ctive
ness
Learn
ings
Ca
tegory L
earn
ings
Assess reasons for brand success
and possible future gains
What are the brand Strengths
and Weaknesses?
Brand Experience
Points (BEP)5
Evaluate overall marcoms
effectiveness
How is the brand performing
vs. competition?
Brand Experience
Shares (BES)4
Avoid spending money
ineffectively
What is needed to achieve
visibility in the category?Threshold Scores3
Use the right contacts to
differentiate the brandWhat does the category do?
Most / Least
Associations Index2
Use the right contacts to improve
effectiveness
What are the most influential
contacts?
Contact Clout Factor
(CCF)1
ActionsLearningsIndicators
Bra
nd E
fficie
ncy
Learn
ings
Highlight opportunities to improve
efficiency
Performance vs. comparable
brands in a given contact?
Competitive cost per
BEP benchmarks9
Identify contact activities where
contribution per $ is eroding
What are the cost of BEPs per
contact?
Internal Costs per
BEP8
Evaluate overall marcomms
efficiency
Is the brand’s Return in Brand
Experience improving?Cost per 1% BES7
Fix the mixWhat are the brand
Opportunities and Threats?
Brand-Contacts
Credits & Deficits6
Bra
nd
Effe
ctive
ness
Learn
ings
Ca
tegory L
earn
ings
Assess reasons for brand success
and possible future gains
What are the brand Strengths
and Weaknesses?
Brand Experience
Points (BEP)5
Evaluate overall marcoms
effectiveness
How is the brand performing
vs. competition?
Brand Experience
Shares (BES)4
Avoid spending money
ineffectively
What is needed to achieve
visibility in the category?Threshold Scores3
Use the right contacts to
differentiate the brandWhat does the category do?
Most / Least
Associations Index2
Use the right contacts to improve
effectiveness
What are the most influential
contacts?
Contact Clout Factor
(CCF)1
ActionsLearningsIndicators

15
Cost efficiency Learning How is the brand performing vs. competitors? What’s the ROI per contact and for the total marketing spend?

16
APPENDIX 3a
Bootstrapped Confidence Intervals of Context Clout Factors
Source: Dr. Colleen Kelly, Statistical Consulting Center, San Diego State University Objective:
To estimate confidence intervals for marketing Context Clout Factors (CCFs) with a bootstrap procedure.
Description of Bootstrap procedure:
The bootstrap resampling procedure is a useful computational method to estimate standard errors or confidence intervals when no closed form formula exists for the standard errors, or when the distribution of the statistics is unknown. The bootstrap procedure takes advantage of recent increases in computing power to simulate the distribution of the statistics of interest. The simulated distribution is then used to calculate standard errors or confidence intervals. The performance of bootstrap confidence intervals has been extensively studied (Efron and Tibshirani, 1993): they have been shown to perform well in a variety of situations, particularly when they are bias and acceleration adjusted (as described below).
Efron and Tibshirani (1993) describe the bootstrap procedure as “a data-based simulation method for statistical inference” and coined the name from the phrase “to pull oneself up by one’s bootstrap” (p. 5). The phrase is “widely thought to be based on one of the eighteenth century Adventures of Baron Munchausen by Rudolph Erich Raspe. (The Baron had fallen to the bottom of a deep lake. Just when it looked like all was lost, he thought to pick himself up by his own bootstraps.)”
The key concept in bootstrap sampling is that the observed data is a random sample x = (x1, x2, . . . , xn) from an unknown probability distribution F. Using this observed data, we can estimate the unknown distribution with the empirical distribution
function F that puts probability 1/n on each of the observed values xi, i=1, 2, . . . , n. The empirical distribution function can then be used to simulate other data sets from this distribution, and the simulated data sets are used to estimate standard errors and confidence intervals of relevant parameters. Specifically, a bootstrap sample x*, is defined
to be a random sample of size n from the empirical distribution F , which is equivalent to drawing a sample of size n, with replacement, from the observed data x = (x1, x2, . . . , xn). The bootstrap sample, (x1
*, x2*, . . , xn
*), then consists of elements of the original data set (x1, x2, . . . , xn), some appear zero times, some appear once, some appear twice, etc.
Bootstrapped Confidence Intervals
There are several different methods for constructing confidence intervals using bootstrap resampling. Here we describe the standard intervals, the percentile-based bootstrap intervals, and the bias-corrected and accelerated intervals (BCa). Efron and Tibshirani (1993) note that the BCa confidence intervals perform the best across a variety of situations. However, we first describe the standard confidence intervals, since they are the simplest to understand.
Standard intervals:
Standard intervals assume that the statistic of interest (ie. the CCF scores) have a normal distribution. If this assumption is satisfied, a 90% confidence interval for the true CCF score is:

17
( ˆ θ − z.05s,ˆ θ + z.95s)
where ˆ θ is the estimated CCF score, s is the standard error of ˆ θ , z.05 and z.95 are the 5% and 95% quantiles of the normal distribution. Here the only unknown quantity is the standard error of the estimated CCF score.
To calculate a bootstrap estimate of the standard error of the CCF, many (hundreds) bootstrap samples are taken and the CCF scores are calculated for each. The standard deviation of the bootstrapped CCFs is used as an estimate of the standard error of the CCF. Specifically, the following steps are followed.
1. Select B independent bootstrap samples x*1, x*2, . . ., x*B, each consisting of n data values (n is the original sample size) drawn with replacement from x.
2. Evaluate the bootstrapped CCF corresponding to each bootstrap sample,
θ *b = s (x*b) b=1,2, . . . , B.
3. Estimate the standard error with the sample standard deviation of the B bootstrapped CCFs
ˆ s B
=
ˆ θ ∗b−θ ∗( )
2
b=1
B
∑
B −1
where θ ∗ =
ˆ θ *b
b=1
B
∑B
is the mean of the bootstrapped CCFs.
Percentile Confidence Intervals:
The percentile confidence interval is a simple method that does not assume any particular distribution for the CCFs (unfortunately, it is not as accurate as the more complex BCa method described next). A larger number of bootstrap samples are necessary for this method (thousands, rather than hundreds). Suppose that 3000 bootstrap resampled data sets x*1, x*2, . . . , x*3000 are generated, and 3000 bootstrapped
CCFs are calculated θ *1, θ *2 , . . . , θ *3000 (one for each bootstrapped data set). The 90% percentile interval is defined by the 5% and 95% percentiles of the empirical distribution of the bootstrapped CCFs, or the 3000x5%=150th largest and 3000x95%=2850th largest bootstrapped CCFs:
90% Confidence interval for CCF = [θ *(150), θ *(2850)]
where θ *(150) and θ *(2850) refer to the ordered bootstrapped CCFs – they are the 150th and
2850th largest values, respectively.
The BCa Method:
The BCa method is an improved version of the percentile method, the abbreviation standing for bias-corrected and accelerated. The BCa intervals are a substantial improvement over the percentile method in both theory and practice (Efron and Tibshirani 1993). Like the percentile confidence interval, the BCa interval endpoints are also given by percentiles of the bootstrap distribution. The BCa intervals, however, do not use the standard 5% and 95% percentiles (for a 90% confidence interval), but adjust these percentiles for bias and acceleration in the bootstrapped empirical distribution.
Specifically, let ˆ θ *(Bα ) indicate the B x αth percentile (ie. the Bxth largest
bootstrapped value) of B bootstrapped CCF values θ *1, θ *2, . . . , θ *B. The percentiles
used in the BCa method depend on two numbers, a and ˆ c , called the acceleration and the bias-correction. The 90% BCa confidence interval, is given by

18
90% Confidence interval for CCF = (θ *(Bα1), θ *(Bα2)),
where α1 = Φ ˆ c +ˆ c + z.05
1− ˆ a ( ˆ c + z.05)
, α2 = Φ ˆ c +
ˆ c + z.95
1− ˆ a ( ˆ c + z.95)
, Ф(x) is the standard normal
cumulative distribution function, and z.05 and z.95 are the 5% and 95% quantiles of the normal distribution. The bias-correction ˆ c measures the median bias and is calculated as
the proportion of bootstrapped CCFs less than the original CCF estimate θ :
ˆ c = Φ−1 #{ ˆ θ ∗b
< ˆ θ }
B
,
where Ф-1(x) indicates the inverse function of a standard normal cumulative distribution function. The bias correction measures the median bias of the bootstrapped empirical distribution, that is, the discrepancy between the median of the bootstrapped CCFs and the estimated CCF. The acceleration measures the rate of change of the standard error on a normalized scale and is calculated as:
ˆ a =k
6skew(θ)
where skew() is the skew of the jackknifed CCF values and k is a constant. For simplicity, we calculate the skew of the bootstrapped CCF values, since it should be very close to that of the jackknifed values. The BCa method of constructing confidence intervals is transformation respecting and is second order accurate, in other words, the probability of the confidence interval covering the true parameter is 90% + C/n, where C is a constant and n is the sample size of the data. This means that the errors in coverage approach zero at a rate of 1/n. The standard and percentile methods are first order accurate, meaning that their errors in
coverage approach zero at a rate of 1 n .
Application: CCFs for Cigarettes:

19
CCFs and 95% Confidence Intervals
0
10
20
30
40
50
60
70
80
90
0 5 10 15 20 25 30 35
Ordered contacts
Series1
Figure 1: CCFs and 95% Confidence Intervals for Cigarette Contacts
Ordered Contacts 95% Confidence
Interval
10 Recommended by friends/family 83.44 85.24 ** 4 Lady promoter offering the brand for free 79.23 81.27 8 Brand shared in a social function or meeting 78.00 80.14 ** 26 Promo personnel in big stores/supermarkets that induce
brand switching/trial 72.04 74.28 24 Package displayed in the stores selling cigarettes 71.01 73.41 ** 29 Free giveaways with logo of the cigarettes brands (e.g.
T-shirts, cigarette lighters, umbrellas…) 68.37 70.81 6 Lady promoter selling the brand 67.86 70.38 13 Magazine ad 67.08 69.63 31 Sponsorship of motor sports (e.g.F1/F2/F3, motorcycle
rally) 66.56 69.17 22 Free Sampling in hotel, restaurants, café 66.56 69.14 ** 16 Out-of-home ad (billboards, city formats, pillars) 64.57 67.14 9 Press article in magazines and newspaper 64.55 67.18 20 Brand related materials (ashtrays, etc) at restaurants and
coffee chains 64.19 66.75 33 Sponsorship of sports events (e.g. football, golf, street
soccer etc.) 63.09 65.86 11 Big boards on the stations and in the passage of metro
stations 63.10 65.76 ** 25 Promotional materials by the brand in stores selling
cigarettes (counter, display, leaflets, posters, dispensers) 60.21 63.00

20
28 Special limited-edition package whose design is different from the ordinary, sold in limited quantity for a limited period 59.47 62.23
21 Lightbox, brand signage, floating display, etc. at nightclubs and bars 59.03 61.83
18 Small posters inside metro wagons 58.51 61.27 7 Seeing a peer smoking the brand 58.33 61.16 23 Indoor ads (Plasma TV screens, radio, light boxes,
indoor monitors) 57.04 59.97 1 Branded gears and items that you can buy (e.g. watch
collection, clothing collection…) 55.36 58.31 32 Sponsorship of pub games (pool / fooseball /darts/ etc.) 54.54 57.70 ** 17 Signs on sales staffs vehicle 52.00 55.18 14 Newspapers ad 51.66 54.92 30 Product/brand appearing in movies 49.75 53.04 15 On-line ad of price notice through internet 49.30 52.61 ** 19 Website about activities by the brand (formula one,
rallies, extreme sports, etc…) 46.65 50.11 12 In flight materials – including duty free catalogues/airline
magazines 46.10 49.80 27 Shop display in duty free 45.64 49.29 ** 2 E-mail - Event notice 38.73 42.66 ** 3 Letters received via the post 34.41 38.46 ** 5 Mobile phone SMS message received from the brand 30.07 34.07
** Significantly different from next largest CCF.
21
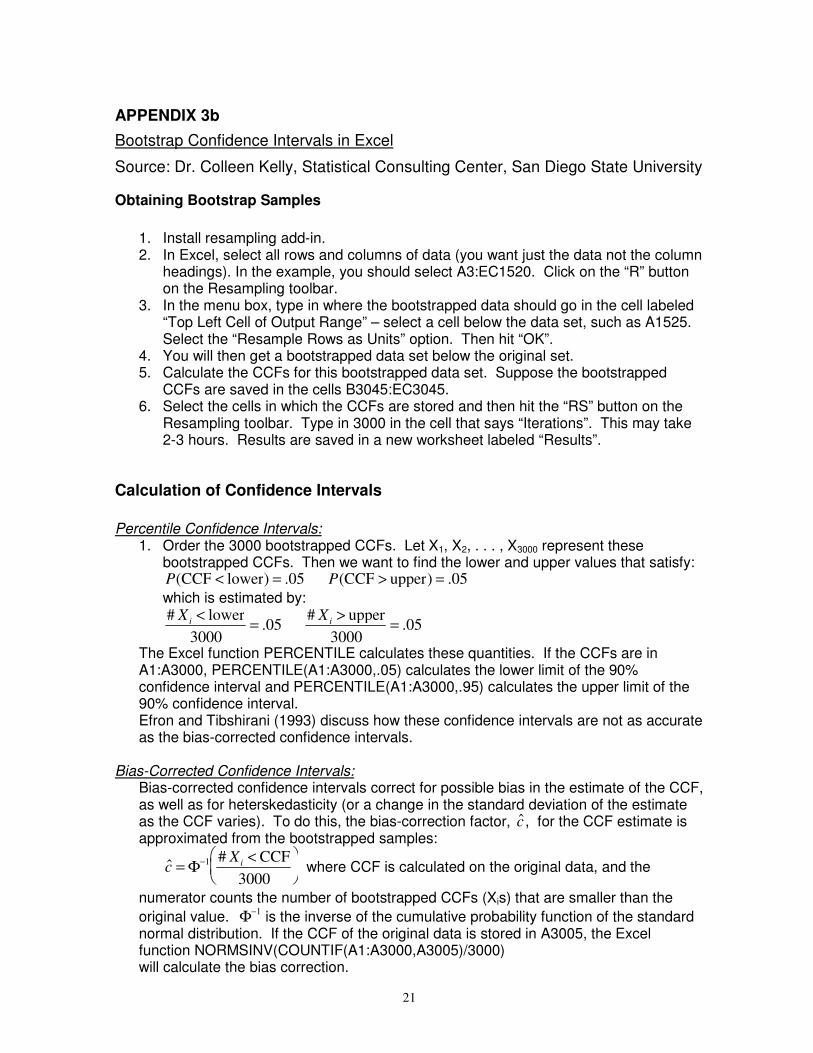
APPENDIX 3b
Bootstrap Confidence Intervals in Excel
Source: Dr. Colleen Kelly, Statistical Consulting Center, San Diego State University
Obtaining Bootstrap Samples
1. Install resampling add-in. 2. In Excel, select all rows and columns of data (you want just the data not the column
headings). In the example, you should select A3:EC1520. Click on the “R” button on the Resampling toolbar.
3. In the menu box, type in where the bootstrapped data should go in the cell labeled “Top Left Cell of Output Range” – select a cell below the data set, such as A1525. Select the “Resample Rows as Units” option. Then hit “OK”.
4. You will then get a bootstrapped data set below the original set. 5. Calculate the CCFs for this bootstrapped data set. Suppose the bootstrapped
CCFs are saved in the cells B3045:EC3045. 6. Select the cells in which the CCFs are stored and then hit the “RS” button on the
Resampling toolbar. Type in 3000 in the cell that says “Iterations”. This may take 2-3 hours. Results are saved in a new worksheet labeled “Results”.
Calculation of Confidence Intervals
Percentile Confidence Intervals:
1. Order the 3000 bootstrapped CCFs. Let X1, X2, . . . , X3000 represent these bootstrapped CCFs. Then we want to find the lower and upper values that satisfy: P(CCF < lower) = .05 P(CCF > upper) = .05
which is estimated by: # X
i< lower
3000= .05
# Xi> upper
3000= .05
The Excel function PERCENTILE calculates these quantities. If the CCFs are in A1:A3000, PERCENTILE(A1:A3000,.05) calculates the lower limit of the 90% confidence interval and PERCENTILE(A1:A3000,.95) calculates the upper limit of the 90% confidence interval. Efron and Tibshirani (1993) discuss how these confidence intervals are not as accurate as the bias-corrected confidence intervals.
Bias-Corrected Confidence Intervals: Bias-corrected confidence intervals correct for possible bias in the estimate of the CCF, as well as for heterskedasticity (or a change in the standard deviation of the estimate as the CCF varies). To do this, the bias-correction factor, ˆ c , for the CCF estimate is approximated from the bootstrapped samples:
ˆ c = Φ−1 # X
i< CCF
3000
where CCF is calculated on the original data, and the
numerator counts the number of bootstrapped CCFs (Xis) that are smaller than the
original value. Φ−1 is the inverse of the cumulative probability function of the standard
normal distribution. If the CCF of the original data is stored in A3005, the Excel function NORMSINV(COUNTIF(A1:A3000,A3005)/3000)
will calculate the bias correction.
22
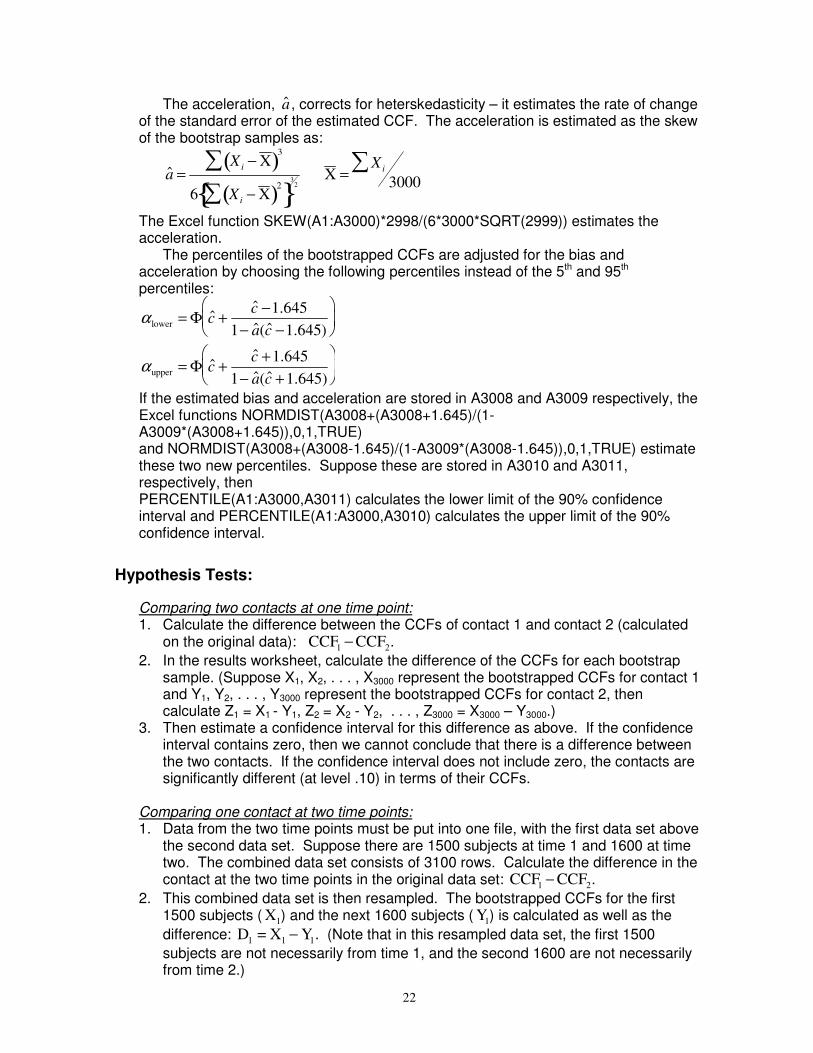
The acceleration, ˆ a , corrects for heterskedasticity – it estimates the rate of change of the standard error of the estimated CCF. The acceleration is estimated as the skew of the bootstrap samples as:
ˆ a =X
i− X ( )
3
∑
6 Xi− X ( )
2
∑{ }3
2X =
Xi∑3000
The Excel function SKEW(A1:A3000)*2998/(6*3000*SQRT(2999)) estimates the acceleration.
The percentiles of the bootstrapped CCFs are adjusted for the bias and acceleration by choosing the following percentiles instead of the 5th and 95th percentiles:
α lower = Φ ˆ c +ˆ c −1.645
1− ˆ a ( ˆ c −1.645)
αupper = Φ ˆ c +ˆ c +1.645
1− ˆ a ( ˆ c +1.645)
If the estimated bias and acceleration are stored in A3008 and A3009 respectively, the Excel functions NORMDIST(A3008+(A3008+1.645)/(1-A3009*(A3008+1.645)),0,1,TRUE) and NORMDIST(A3008+(A3008-1.645)/(1-A3009*(A3008-1.645)),0,1,TRUE) estimate these two new percentiles. Suppose these are stored in A3010 and A3011, respectively, then PERCENTILE(A1:A3000,A3011) calculates the lower limit of the 90% confidence interval and PERCENTILE(A1:A3000,A3010) calculates the upper limit of the 90% confidence interval.
Hypothesis Tests:
Comparing two contacts at one time point: 1. Calculate the difference between the CCFs of contact 1 and contact 2 (calculated
on the original data): CCF1 − CCF2.
2. In the results worksheet, calculate the difference of the CCFs for each bootstrap sample. (Suppose X1, X2, . . . , X3000 represent the bootstrapped CCFs for contact 1 and Y1, Y2, . . . , Y3000 represent the bootstrapped CCFs for contact 2, then calculate Z1 = X1 - Y1, Z2 = X2 - Y2, . . . , Z3000 = X3000 – Y3000.)
3. Then estimate a confidence interval for this difference as above. If the confidence interval contains zero, then we cannot conclude that there is a difference between the two contacts. If the confidence interval does not include zero, the contacts are significantly different (at level .10) in terms of their CCFs.
Comparing one contact at two time points: 1. Data from the two time points must be put into one file, with the first data set above
the second data set. Suppose there are 1500 subjects at time 1 and 1600 at time two. The combined data set consists of 3100 rows. Calculate the difference in the contact at the two time points in the original data set: CCF1 − CCF2.
2. This combined data set is then resampled. The bootstrapped CCFs for the first 1500 subjects ( X1) and the next 1600 subjects ( Y1) is calculated as well as the
difference: D1 = X1 − Y1. (Note that in this resampled data set, the first 1500
subjects are not necessarily from time 1, and the second 1600 are not necessarily from time 2.)

23
3. Construct 3000 bootstrap samples and store the 3000 bootstrapped differences D1, D2, …, D3000. The p-value to test for a change over time is the proportion of bootstrapped differences that are greater than the difference calculated on the original data set:
p − value =# D
i> CCF1 - CCF2( )
3000
Reference: Efron, B. and Tibshirani, R.J. (1993). An Introduction to the Bootstrap, Chapman & Hall, London.

24
APPENDIX 4
Calculation of Confidence Bounds for Brand Experience Shares
Source: Duane Steffey, Ph.D., Sr. Managing Scientist, Exponent Failure Analysis Associate

25
APPENDIX 5
Calculation of Confidence Bounds for Brand Experience Shares
Source: Duane Steffey, Ph.D., Sr. Managing Scientist, Exponent Failure Analysis Associates

26

27

28