Embed Size (px)
Citation preview
II/Summer 2003
HEALTH SYSTEM WATCH Supplement of the journal Soziale Sicherheit (Social Security) by
the Institute for Advanced Studies/Institut für höhere Studien IHS
HealthEcon, edited by the Hauptverband der österreichischen
Sozialversicherungsträger (Federation of Austrian Social Security
Institutions)
Resource consumption in the EU: Drug consumption pushes health expenditure growth
Focus: Per-case flat rates in the ambulatory care sector
Maria M. Hofmarcher, Monika Riedel, Gerald Röhrling*
Resource consumption In the EU the overall creation of value seems to go hand in hand with high expenditure on inpatient care. Nevertheless the growth of inpatient care expenditure has been curbed due to the reforms carried out in the course of the last decade, which were targeted to this very sector. Expenditure on ambulatory care grew below average throughout the EU. Austria is an exception, combining a high expenditure level and high growth rates. Still, private households’ expenses on family physician and specialist care have shown the most considerable growth. Between 1990 and 2000 in almost all countries the expenditure on pharmaceuticals increased clearly sharper than the Gross Domestic Product, which brought about a considerable increase in the expenditure share. The Austrian pharmaceuticals market is characterised by particularly marked growth. It has to be pointed out, yet, that expenses on drugs are assumed to converge, which might lead to a further expenditure increase in Austria. The share of expenditures on pharmaceuticals in percent of total expenditure on health continues to be clearly below the EU average.
Per-case flat rates Whereas at present per-case flat rates in the ambulatory care sector are rather rare they are planned to be introduced with specialist primary care providers in Germany. For the time being they are only applied in isolated cases and in quasi-hospital or hospital-near environments. In a German pilot experiment on selected surgical operations carried out in doctors offices only three in eleven types of surgery substituted inpatient procedures, and some of them were still performed in hospitals‘ out-patient departments. With only one single surgery type overall expenses (with practising physicians and hospitals) could be reduced. With certain surgery types expenditure even went up. These experiences show the difficulty in selecting medical operations and in laying down an incentive-based remuneration system. In Sweden the enlargement of the DRG scheme for outpatient departments has been prepared, but not implemented yet. In two Austrian states per-case flat rates are already being applied in hospitals‘ outpatient departments; due to the short time they have been used and due to the differences in data collection systems a steering effect induced by them could not be observed yet.
*Translation: Martina Szucsich

HEALTH SYSTEM WATCH 2/2003 2
Drug consumption pushes health expenditure growth
Inpatient care, outpatient care, pharmaceuticals and medical products utilise approximately three
quarters of total EU health expenses. This chapter aims at analysing the growth dynamics of these
expenditure components in the period between 1990 and 2000.
In the fields of pharmaceuticals and inpatient care more data are available than in other sectors. As
for primary care, international data sets lack certain data, since in some EU states, including Austria,
calculations do not (yet) follow the OECD standards1.
The analysis presented here is therefore restricted to thos e EU countries that have complete data
sets available. For Denmark, Germany, Finland, France, Italy and the Netherlands both time series
and recent data are available. For Austria we computed the expenditure series from the data sources
available2. The table below depicts the expenditure components used for Austria, their shares in
2000 and the indices of the base years 1990 and 1995, respectively.
Table 1: Expenditure components in Austria in 2000
Type of service Nominal in Euro
shares Index 1995=100
Index 1990=100
Expenditure on inpatient care 7.238.874.700 - 117 165
Expenditure on outpatient care 5,021,391,140 100.0 123 187 Expenditure by health insurance providers 3,140,621,280 62.5 117 172 Physician care and equivalent services 2,457,716,765 48.9 120 177 Dental services 491,293,213 9.8 112 158 Dentures 191,611,302 3.8 100 157 Expenditure by private households 1,880,769,860 37.5 132 219 Physician services 972,667,929 19.4 139 231 Dental services 908,101,931 18.1 125 208
Expenditure on pharmaceuticals and medical products
3,040,949,878 100.0 157 230
Expenditure by health insurance providers* 2,170,794,968 71.4 176 257 (Prescription) drugs 1,968,056,147 64.7 179 275 Substitute remedies and medication 202,738,821 6.7 151 158 Expenditure by private households 870,154,910 28.6 123 182 Pharmaceutical products 504,361,123 16.6 121 170 Other medical products 81,604,054 2.7 157 220 Therapeutic appliances and equipment 284,189,733 9.3 120 198
* including 20 percent turnover tax since 1997.
Source: HVSV; Statistik Austria; IHS HealthEcon calculations 2003.
1 Cf. also the discussion on the comparability of health expenditures presented in Health System Watch I-2003 (www.ihs.ac.at) and the annexed tables A1 to A3. Note that tables A2 and A3 of the present issue contain only expenses on family physicians and on pharmaceuticals. 2 Note that tables A2 and A3 of the present issue contain only expenses on family physicians and pharmaceuticals. 2 All expenditure as published by Statistik Austria in April 2003 for the period between 1995 and 2002. For the period from 1990 to 1995 the health care expenditure data according to OECD Health Data 2002 were used.

HEALTH SYSTEM WATCH 2/2003 3
The broad delineation agreed on by the OECD Secretariat turned out to be necessary, since data
availability increases with the level of aggregation. Moreover it provides for comparisons between
different countries. In 2000, 62 percent of the EU population lived in the seven countries selected
(EU-7), generating 66 percent of the EU-wide GDP and consuming 71 percent of the EU-wide health
care expenditure.
“High income” seems to cause inpatient expenditure...
The per-capita Gross Domestic Product (GDP) is a crude measure of a country‘s purchasing power
and an appropriate yardstick for comparing health care expenses. In 2000 the weighted EU-7
average GDP – adjusted in terms of differences in purchasing power - amounted to US$ 25,694. In
table 2 the countries are ranked according to per-capita income. With the exception of France the
richest countries turn out to register the highest expenses on inpatient care. Per-capita expenditure
on inpatient care in Austria ranked fourth, while Austrian per-capita income ranked third,
outperforming the weighted EU average by six percent, amounting to slightly more than US$ 27,000.
Table 2: Gross Domestic Product and health care expenditure according to type of service,
2000
Per capita, US$ PPP In percent of GDP GDP Rank Inpatient
care Rank Out-
patient care
Rank Medical products
Rank Inpatient care
Out-patient
care
Medical products
Denmark 29,050 1 1,294 1 609 2 281 7 4.5 2.1 1.0 Netherlands 27,675 2 1,105 2 331 7 333 5 4.0 1.2 1.2 Austria 27,151 3 950 4 659 1 399 4 3.5 2.4 1.5 Germany 25,936 4 855 6 545 4 519 2 3.3 2.1 2.0 Italy 25,206 5 860 5 602 3 459 3 3.4 2.4 1.8 Finland 25,078 6 663 7 506 6 309 6 2.6 2.0 1.2 France 24,847 7 1,005 3 528 5 560 1 4.0 2.1 2.3 EU-7 25,694 920 545 488 3.6 2.1 1.9
Source: OECD Health Data, August 2002; HVSV and Statistik Austria; IHS HealthEcon calculations 2003.
…which does not guarantee an economical use of outpatient services.
In Austria per-capita expenditure on outpatient services is very high. Outperforming the weighted
average of the EU-7 per-capita expenditure on outpatient care by 20 percent, it tops the ranking of
the selected countries. Denmark and Italy follow on ranks two and three. In the Netherlands
specialist care is predominantly provided within the hospital sector, which seems to cause the high
expenditure on inpatient care observed there and brings about the lowest per-capita expenditure on
outpatient care. With only half the value observed in Austria, they bring up the rear.

HEALTH SYSTEM WATCH 2/2003 4
More “tranquillisers” with low incomes...
France and Italy are known as countries with a comparatively high drug consumption, which
contributes to the high per-capita expenses on medical products including pharmaceuticals. This
pattern is inversely proportional to the per-capita income: The per-capita GDP is lowest in France,
Italy ranks fifth. Germany occupies the second place in terms of per-capita expenditure on medical
products and the fourth place in terms of per-capita GDP.
...or “cost push inflation”
In the EU-7 countries the increase in the real per-capita expenditure on medical products is clearly
above the growth of real per-capita GDP and in most cases also above the growth of the real per-
capita expenses on other fields of service (cf. figure 1). In most countries the pharmaceuticals sector
has been in the focus of health policy for some time. The dynamics of the pharmaceuticals sector
generally reflects technical progress in medicine: While the number of new chemical substances
entering the market has decreased since the 1960s3, the number of drugs that enhance the quality of
life has increased4. The improvement of the quality of life is however not necessarily depicted by the
real development of pharmaceuticals expenses, since commonly used price indices are not (yet)
capturing certain quality aspects. Austria’s wholesale price index, for example, has shown a
continuous price decline since the 80s. On the other hand, between 1980 and 2001 prices
(expenditure per prescription) increased more considerably as compared to per-capita prescriptions.
Although this problem applies to the entire health care sector, it seems to play a particularly
important role in the pharmaceutical provision.
3 Scherer F.M., The Pharmaceutical Industry, In: Culyer A.J., J.P. Newhouse, (Ed) Handbook of Health Economics, Vol. 1, Ch. 25, pp. 1298-1332, Elsevier 2000. 4 Lichtenberg, F.R., Are The Benefits Of Newer Drugs Worth Their Cost? Evidence From The 1996 MEPS, Health Affairs (September/October 2001): 241-51 Lichtenberg, F.R., S.Virabhak, PHARMACEUTICAL EMBODIED TECHNICAL PROGRESS,LONGEVITY, AND QUALITY OF LIFE: DRUGS AS “EQUIPMENT FOR YOUR HEALTH” National Bureau of Economic Research Working Paper 9351, http://www.nber.org/papers/w9351: 5.5.2003

HEALTH SYSTEM WATCH 2/2003 5
Figure 1: Average annual per-capita growth 1990 – 2000, at 1995‘s GDP prices, in percent
Notes: Values for medical products in Austria include the value added tax since 1997 Growth rates for Germany: 1992-2000: New health expenditure calculation 2001
Source: OECD Health Data, August 2002; HVSV and Statistik Austria for Austria; IHS HealthEcon calculations 2003.
...or both The measures of curbing the expenditure growth in the inpatient sector that were carried out in the
last decade have obviously been more successful than measures applied in the pharmaceuticals
sector. The annual average growth of real per-capita expenditures on inpatient care are either equal
or even below that of the real per capita GDP of the respective country. Only Germany and to some
extent also Austria deviate from this pattern. The reason why expenditure on pharmaceuticals
increased more sharply than other expenses is the increasing real consumption combined with even
more sharply increasing costs per prescription – which seems paradoxical in the light of an overall
downward trend in prices. As for Austria this can be explained by a shift in the demand towards more
costly products. Moreover, certain new, innovative and therefore expensive drugs are not included in
the basket for pharmaceutical price index calculations. It can be assumed that this is also the case in
other countries.
-2
-1
0
1
2
3
4
5
6
7
8
Netherlands Denmark Austria Finland Italy France Germany EU7
Gross Domestic Product
Total Health Expenditure
Expenditure on inpatient care
Expenditure on outpatient care
Expenditure on pharmaceuticals and medical products
HEALTH SYSTEM WATCH 2/2003 6
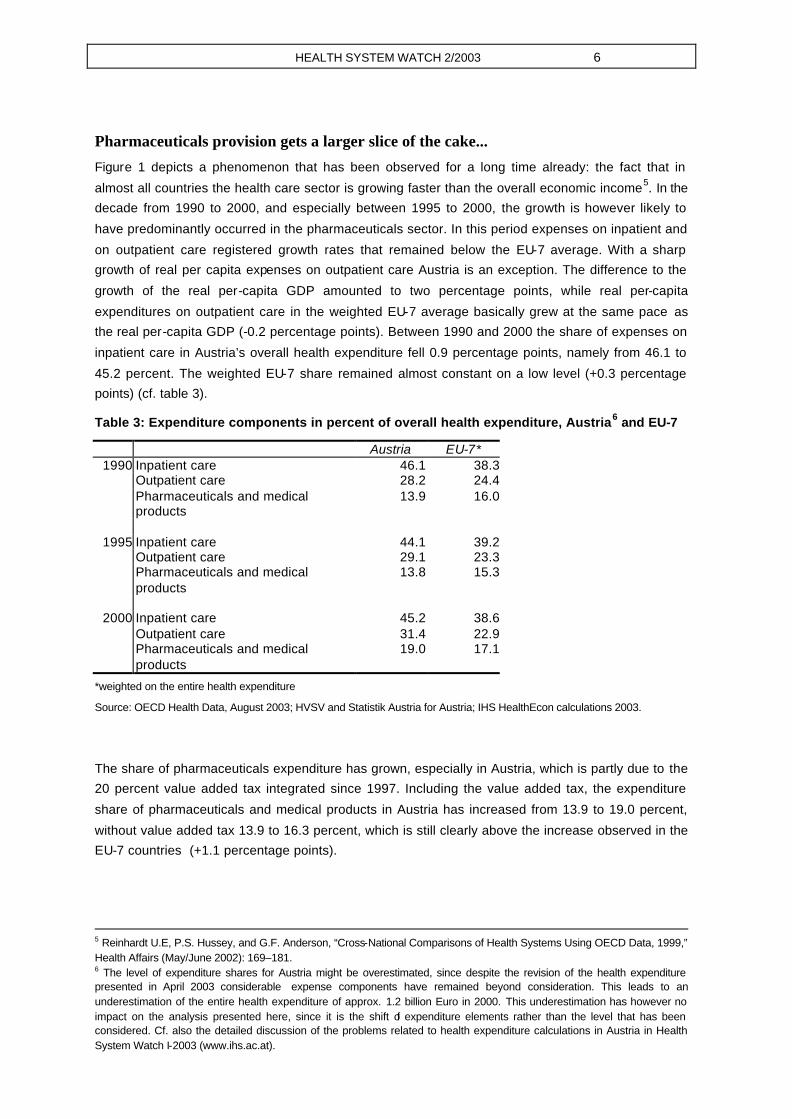
Pharmaceuticals provision gets a larger slice of the cake...
Figure 1 depicts a phenomenon that has been observed for a long time already: the fact that in
almost all countries the health care sector is growing faster than the overall economic income5. In the
decade from 1990 to 2000, and especially between 1995 to 2000, the growth is however likely to
have predominantly occurred in the pharmaceuticals sector. In this period expenses on inpatient and
on outpatient care registered growth rates that remained below the EU-7 average. With a sharp
growth of real per capita expenses on outpatient care Austria is an exception. The difference to the
growth of the real per-capita GDP amounted to two percentage points, while real per-capita
expenditures on outpatient care in the weighted EU-7 average basically grew at the same pace as
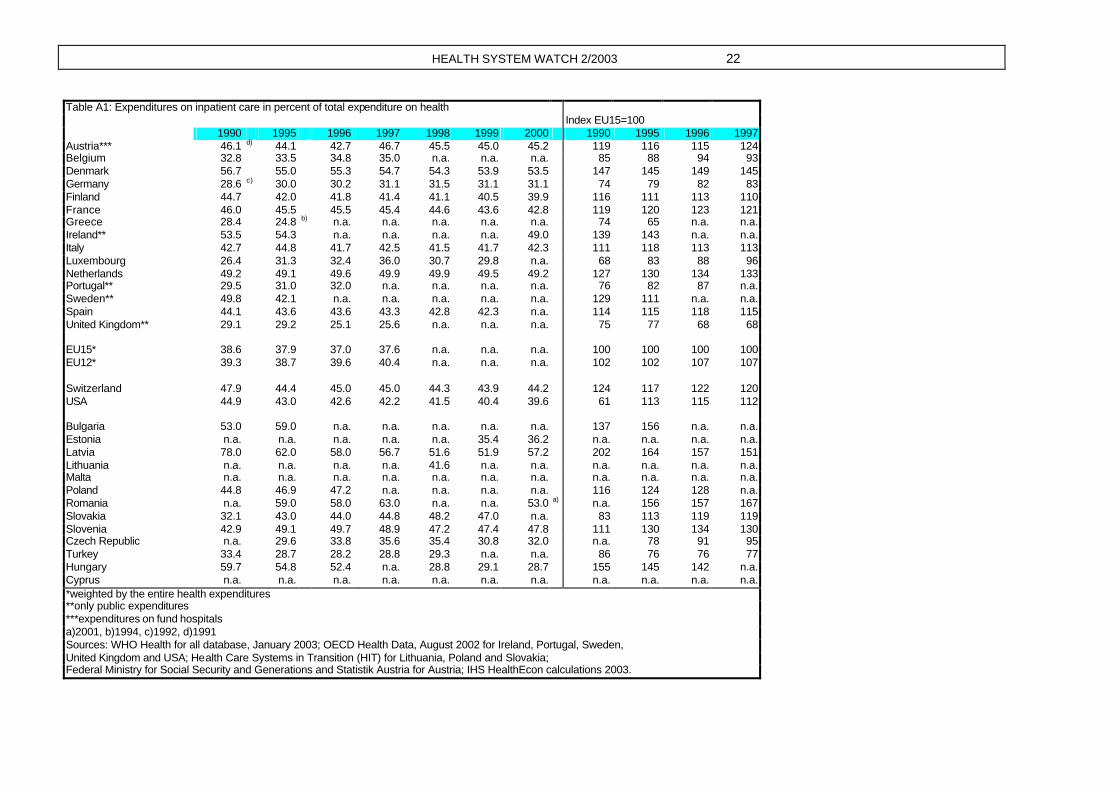
the real per-capita GDP (-0.2 percentage points). Between 1990 and 2000 the share of expenses on
inpatient care in Austria’s overall health expenditure fell 0.9 percentage points, namely from 46.1 to
45.2 percent. The weighted EU-7 share remained almost constant on a low level (+0.3 percentage
points) (cf. table 3).
Table 3: Expenditure components in percent of overall health expenditure, Austria6 and EU-7
Austria EU-7* 1990 Inpatient care 46.1 38.3
Outpatient care 28.2 24.4 Pharmaceuticals and medical products
13.9 16.0
1995 Inpatient care 44.1 39.2
Outpatient care 29.1 23.3 Pharmaceuticals and medical products
13.8 15.3
2000 Inpatient care 45.2 38.6
Outpatient care 31.4 22.9 Pharmaceuticals and medical products
19.0 17.1
*weighted on the entire health expenditure
Source: OECD Health Data, August 2003; HVSV and Statistik Austria for Austria; IHS HealthEcon calculations 2003.
The share of pharmaceuticals expenditure has grown, especially in Austria, which is partly due to the
20 percent value added tax integrated since 1997. Including the value added tax, the expenditure
share of pharmaceuticals and medical products in Austria has increased from 13.9 to 19.0 percent,
without value added tax 13.9 to 16.3 percent, which is still clearly above the increase observed in the
EU-7 countries (+1.1 percentage points).
5 Reinhardt U.E, P.S. Hussey, and G.F. Anderson, “Cross-National Comparisons of Health Systems Using OECD Data, 1999,” Health Affairs (May/June 2002): 169–181. 6 The level of expenditure shares for Austria might be overestimated, since despite the revision of the health expenditure presented in April 2003 considerable expense components have remained beyond consideration. This leads to an underestimation of the entire health expenditure of approx. 1.2 billion Euro in 2000. This underestimation has however no impact on the analysis presented here, since it is the shift of expenditure elements rather than the level that has been considered. Cf. also the detailed discussion of the problems related to health expenditure calculations in Austria in Health System Watch I-2003 (www.ihs.ac.at).

HEALTH SYSTEM WATCH 2/2003 7
...and Austria converges towards the EU...
Between 1990 and 2000 the share of expenses on pharmaceuticals in the entire health expenditure
increased from 10.7 percent to 15.4 percent (cf. table A2). Nevertheless the share of
pharmaceuticals expenses in Austria still falls clearly below the weighted EU average. The dynamical
growth of the provision with medical products and services in Austria shows the possible trend
towards a convergence of health expenditures: In countries with low expenditure levels in 1990 real
per-capita expenditures tend to show higher growth rates between 1990 and 2000. In the EU-7
countries the correlation coefficient between the levels of per-capita expenses on pharmaceuticals in
1990 and the real growth rates between 1990 and 2000 amounted to –0.63 (p=0.13). In all other
fields of service this negative correlation can be observed, too, but by far not to such an extent.
...where the outpatient sector increases moderately.
Due to the below-average growth rates in the decade from 1990 to 2000 the share outpatient care
took in the expenditure in the EU-7 slightly decreased from 24.4 percent to 22.9 percent. In Austria
the development was different: In 2000 the expenditure share for outpatient services (including
dental care) amounted to 31.4 percent, which was three percentage points more than in 1990.
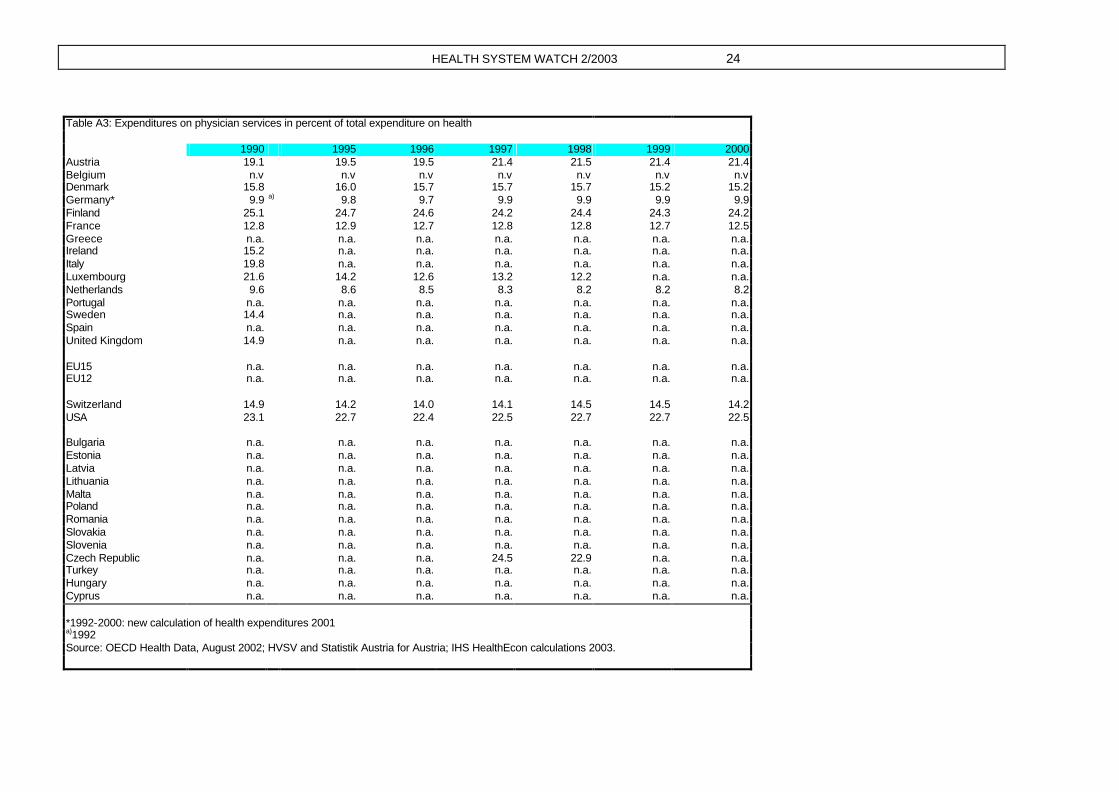
Family physician and specialist care alone accounted for 21.4 percent of the health expenditure in
2000, which was 2.3 percentage points above the share observed in 1990 (cf. table A3). Private
households finance more than one third of the outpatient services in Austria (cf. table 1). The
dynamic development of outpatient care is predominantly due to the clearly sharper increase in
private expenses on specialist and dentist care, with specialist and other physician services
experiencing a particularly increased demand.
Does high income lead to a lower number of general practitioners...
Countries with high per-capita incomes are not necessarily provided with a high number of
physicians. Denmark and the Netherlands have the lowest density of general practitioners in the EU-
7 countries, while ranking first and second, respectively, in terms of income (cf. table 2 and figure 2).
Finland and France show high densities of general practitioners and low per-capita incomes.

HEALTH SYSTEM WATCH 2/2003 8
Figure 2: Physician, dentist and pharmacist density 2000.
*1999
Source: WHO Health for all database, January 2003; IHS HealthEcon calculations 2003.
In Austria, too, high expenditure on outpatient care does not seem to go hand in hand with a high
physician density7.
The literature indicates that there is a ten-years‘ delay between per-capita income and physician
density and that the relation between physician density and per-capita income is a positive one8. In
the countries we selected no positive correlation between the present physician density and past
incomes can be observed. On the contrary, we have found a negative correlation: The higher the
per-capita GDP, the lower the physician density (correlation coefficient – 0.69 (p=0.08)). A reason for
this result might be the fact that our selection of countries is biased, since in social health insurance
countries like in Germany, France, the Netherlands and Austria physician supply is largely self-
regulated, and remuneration is mostly a fee-for-service scheme (cf. table 4). Combining the high
level of self-regulation with the fee for service scheme might lead to above-average physician
incomes if market participation is restricted to a certain extent9.
...or do fewer physicians attend more patients?
Furthermore, in our country sample we observe that states with low physician densities show high
rates of utilization. In the EU-7 6.3 physician visits are made per capita and year. There is however a
slightly negative correlation between the frequency of utilising physician services and the density of
general practitioners (correlation coefficient –0,27 (p=0,57)). With 6.7 visits, utilisation in Austria
7 All practising physicians without dentists and physicians in training. 8 Cooper, R.A. et al, “Economic and Demographic Trends Signal an Impending Physician Shortage, “Health Affairs (Jan/Feb 2002): 140-154 9 As for Austria it can be assumed that physicians most certainly have the highest income in the group of the self -employed. Cf. report of the Court of Audit on incomes - Einkommen 1/2002, Vienna.
0
1
2
3
4
5
6
Italy
*
Ger
man
y
Fra
nce
Net
herla
nds
Den
mar
k
Aus
tria
Finl
and
Finl
and
Fra
nce
Aus
tria
Ger
man
y
Italy
Den
mar
k
Net
herla
nds
Den
mar
k*
Finl
and
Ger
man
y
Fra
nce
Italy
Net
herla
nds
Aus
tria
Finl
and
Italy
*
Fra
nce
Ger
man
y
Aus
tria
Den
mar
k
Net
herla
nds
Physicians per 1000inhabitants
General practitioners per1000 inhabitants
Dentists per 1000inhabitants
Pharmacists per 1000inhabitants
EU 7 average
EU 15 average

HEALTH SYSTEM WATCH 2/2003 9
exceeds the population-weighted EU share by 7 percent. The density of general practitioners (1.3
per 1,000 persons) is 17 percent higher (cf. figure 2). The European Community Household Panel
(ECHP)10 allows for an investigation of the frequency of service consumption in the course of time
and differentiated in terms of socio-economic criteria.
The demand for physician services increases less sharply than expenditure
In 2000 women visited a general practitioner 5.8 times on average, men 4.6 times. As compared to
1995 the frequency of visiting a physician increased 10 percent with women and 13 percent with
men (cf. figure 3).
Figure 3: Physician visits in Austria
Source: European Community Household Panel (ECHP), IHS HealthEcon calculations 2003.
10 The European Community Household Panel (ECHP) is a panel survey on the living and income situation in 14 EU-countries. In Austria 4,646 persons participated both in 1995‘s and 2000‘s wave of the survey. The questions asked to analyse the health care sector were the following: 1. “How often did you consult a general practitioner during the past 12 months?“ 2. “How often did you consult a specialist physician during the past 12 months?“ 3. “How often did you consult a dentist during the past 12 months?“
0
1
2
3
4
5
6
7
Generalpractitioners
Specialists Dentists Generalpractitioners
Specialists Dentists
Male Female
1995
2000

HEALTH SYSTEM WATCH 2/2003 10
In the same period the increase in private expenses on physician services (+39 percent) was clearly
above the entire increase in expenses on physician services (+20 percent). Specialist physicians
were considerably less often contacted. Notwithstanding, the frequency of visiting a specialist has
increased more sharply than that of visiting a general practitioner (+25 percent with men and
women) since 1995. The gap in the frequencies of physician contacts between men and women is
quite constant. Both women and men see their family physicians approximately twice as often as
specialists. Dentists are consulted 1.4 times a year. Although since 1995 the cases of consulting
dentists have decreased both with men (-13 percent) and women (-19 percent), the nominal
expenses of health insurers on dentist services went up 12 percent between 1995 and 2000,
expenditure on dentures remained constant. In 2000 private households spent 25 percent more on
dentist care than in 1995.
The outpatient sector in Austria is growing more dynamically than that of the EU-7 (cf. also table 3).
This seems however not to be the shift “from inpatient to outpatient” aimed at by health policy, since
the demand observed in the inpatient sector is still as high as it used to be (cf. table A4 and also A1).
In addition to that the growing utilisation of outpatient services along with even more sharply
increasing expenditures suggests that private households are increasingly financing family physician
and specialist services by their current income, which has consequently become an important
income source for physicians.
This development is important with regard to the current discussion on new user charges, since the
latter might increase the patients’ incentive for consulting their physician of choice/non-contract
physicians instead of contract physicians. Furthermore the results of the household panel show that
women see family physicians and specialists much more often than men do. User charges per
physician visit would consequently affect especially women. In the light of the sustained income
differences between men and women11 this consequence must especially be borne in mind. This is
why we consider rethinking the existing contract regulations (selective contracting and harmonising
remuneration schemes across sickness funds as well as contractual features) as a superior
approach to maintain and further enlarge fair access to family physician and specialist care.
The following chapter deals with forms of remunerating physicians in the ambulatory sector and tries
to answer the question whether there are countries that already use per-case flat rates as financing
instruments for general practitioners and specialist care.
11 Bericht über die Soziale Lage 2001 – 2002, Analysen und Ressortaktivitäten, BMSG (Report on the social situation 2001-2002, analyses and departmental activities, Federal Ministry for Social Security and Generations), Vienna 2002.

HEALTH SYSTEM WATCH 2/2003 11
Focus: Per-case flat rates in the outpatient sector
There are three basic types of physician’s remuneration schemes, namely salary, per-capita flat rates and fee-for-service remuneration (cf. table 4). Most countries have mixtures of these three types. These basic schemes provide for different incentives for and partly also against an economical use
of resources 12. At present per-case flat rates are hardly used in the outpatient sector. We are only aware of some individual cases, and even there they occur in a quasi-hospital or hospital-near environment; moreover they are not exhaustive, appearing for example in a pilot experiment on
outpatient surgery in Schleswig-Holstein13, in a model planned for Sweden14 and in Austria within the hospital outpatient departments of Tyrol and Lower Austria. The new tariff structure in the Swiss health care sector, too, whose first part is to be tested from the beginning of May 2003 on after
lengthy preparations, contains no more than a declaration of intent to settle especially frequent diagnoses via outpatient per-case flat rates in the future15.
12 cf. Health System Watch 2/2002 and the references quoted there (www.ihs.ac.at). 13 Gerber I, Rotering C, Ambulante Fallpauschalen: Ergebnisse eines Modellversuches in Schleswig-Holstein, In: Arnold, Litsch, Schellschmidt (eds.), Krankenhaus -Report 2000: Vergütungsreform mit DRGs, Schattauer. 14 Mats Fernström, Development of a DRG system for outpatient procedures (NordDRG-O), Casemix vol 4, no 1, March 31, 2002 and Mats Fernström, A common Nordic version of NordDRG-O for One-day care. Final report from the project group for NordDRG-O, mimeo, 2003. 15 SUVA, Tarmed – die neue Tarifstruktur tritt in Kraft. Der erste Schritt zum einheitlichen Arzttarif, Bern/Luzern, Pressemitteilung December 16, 2002

HEALTH SYSTEM WATCH 2/2003 12
Table 4: Remunerations schemes of general practitioners and specialists in selected countries
Source/year remuneration type – general practitioners remuneration type - specialists Austria HIT 2001 Mix system: Per-case flat rate per quarter and fee for service same
Belgium HIT 2000 fee for service same
Denmark HIT 2001 Mix system: per-capita flat rate (1/3) and fee for service (2/3) fee for service
Germany HIT 2000 fee for service (point system) same
Finland HIT 2001; Mossialos/ Le Grand 1999
General practitioners (40%): Mix system: salary (60%), per-capita flat rate (20%), fee for service (15%) and local grants (5%) other physicians (60%): salary and fee for service
Specialists in hospitals: salary, in private practices: fee for service
France EOHCS 2002 fee for service same
Greece HIT 1996 salary same
Ireland Mossialos/ Le Grand 1999
per-capita flat rate (dependent of sex, age and distance between the patient’s residence and the physician’s practice) plus additional remuneration for certain procedures
-
Italy HIT 2001 Mix system: per-capita flat rate, fee for service and induced cost-based refund component Only the same for paediatricians; specialists in hospitals: salary
Luxembourg Mossialos/ Le Grand 1999
fee for service same
Netherlands EOHCS 2002; OECD 2003
per-capita flat rate (fee for service for privately insured patients and civil servants) fee for service
Portugal HIT 1999 salary (mix system is planned) fee for service
Sweden OECD 2003, HiT 2001
salary, since 1994 partly per-capita flat rates and increments same
Spain OECD 2003, HiT 2000
salary. As provided by the system before 1984 per-capita flat rates are still applied with approximately 19% of the patients
same
United Kingdom OECD 2003, HiT 1999
per-capita flat rate plus increments for special procedures salary
Switzerland HiT 2000 p.68 fee for service , HMOs mostly salaries, but 2 HMOs apply success-oriented payment with guaranteed minimum salary
fee for service
Norway OECD 2003, HiT 2000
salary (30-40% of income) plus fee for service for contract physicians same
USA OECD 2003 in Managed Care systems predominantly per-capita flat rates (appr. 90% of persons insured) fee for service
Sources: European Observatory on Health Care Systems (EOHCS), Health care systems in eight countries: trends and challenges, April 2002. Health Care Systems in Transition (HiT), various reports from the respective countries; OECD, Health care systems: lessons from the reform experience, ECO/CPE/WP1(2003)4; Mossialos E, Le Grand J: Health Care and Cost Containment in the European Union, Ashgate,/Aldershot, 1999.

HEALTH SYSTEM WATCH 2/2003 13
The German minister of health had planned to launch a bill on a health reform in May 2003. With
respect to ‘further development of the system of remunerating physicians – incentives for better and more economic treatment‘, the intention is to design the remuneration scheme of general practitioners on the basis of patient’s needs and the scheme of specialists on per-case flat rates 16.
No details have been given on the planned system of per-case flat rates so far17. The reform might take points of criticism and suggestions presented in the board of experts’ opinion as orientation18. According to the proposals made there, specialist physicians are to receive a combination of per-
case flat rates, fee for service scheme and an outcome-oriented part. It is to cover the entire treatment costs for all patients. The fee for service scheme is to be paid for special diagnosis and therapy procedures that can be provided by both specialists and hospitals19.
In the light of the increasing international interest in a remuneration scheme for outpatient services
that is based on per-case flat rates it seems to be worth collecting and analysing existing experiences in order to contrast them with other remuneration systems.
Remuneration schemes pursue different aims
In the past years a number of countries have introduced per-case flat rate systems in the inpatient sector (for an overview cf. Rochell, Roeder 200020). The countries had quite differing aims when they
introduced them. Next to applying them for hospital financing, often linked to the aim of containing costs, per-case flat rates are also used for hospital comparisons and quality assurance. Literally the most frequently applied versions, the Diagnosis Related Groups or DRGs, mean per-case flat rates
that are based on equal diagnoses and not necessarily on equal treatment methods. The basic idea is to offer service providers incentives to treat a diseases by using as little resources as possible instead of trying to carry out as many treatment units as possible – as it might be the case with a fee
for service system. When aiming at an overall optimal resource allocation it is consequently not advisable to reimburse different service providers treating patients with the same diagnosis differently. In other words, aiming at completely exhausting their efficiency potential, per-case flat
rates should not stop at institutional borders.
In Austria an extension of the remuneration system for inpatient services to outpatient departments of hospitals has repeatedly been urged21 and is at present one of the focus subjects of the further development of the procedures and diagnosis oriented hospital financing system
16 http://www.bundesregierung.de, 03/04/03. 17 The glossary of health policy related terms of the German SPD group in the Bundestag does not contain much more information, either: A per-case flat rate is a lump sum refunding all physician services of one treatment case when concluded. In the case of per-case flat rates the entire remuneration is calculated by multiplying the number of all treatment cases with the lump sum. In this reimbursement system the health insurer bear the morbidity risk and the financial consequences of developments in risk structure of the insured. The physicians bear the risk of quantities treated, i.e. the additional or reduced cost per treatment case. http:// www.spdfraktion.de/pa/ag/gesundheit/glossar.pdf [12/4/03] 18Sachverständigenrat für die konzertierte Aktion im Gesundheitswesen, Finanzierung, Nutzerorientierung und Qualität, Gutachten 2003. 19 Detlef Haffke, Niedersächsisches Ärzteblatt 1/03 http://www.haeverlag.de [8/4/03] 20 Rochell B, Roeder N, DRG-basierte Entgeltsysteme in Europa, In: Arnold, Litsch, Schellschmidt (eds.), Krankenhaus-Report 2000: Vergütungsreform mit DRGs, Schattauer. 21 Austrian Court of Audit, Wahrnehmungsbericht des Rechnungshofs über die Reform des Gesundheitswesens und der Krankenanstaltenfinanzierung, July 12, 2000 and Stepan A., Sommersguter-Reichmann M (2001): Analyse des neuen Leistungsorientierten Krankenanstalten-Finanzierungssystems in Österreich. Working paper, Vienna University of Technology / Donau University Krems / Karl-Franzens University Graz

HEALTH SYSTEM WATCH 2/2003 14
(“LKF“ system)22. It has to be pointed out, yet, that the Austrian LKF system only partly
corresponds to the ideal of a diagnosis-group based system, as the term procedures oriented suggests. When looking at the LKF’s algorithm resulting from the division of the groups it can be seen that only one branch is based on diagnosis groups, while the other one consists of single-
procedure groups (and consequently services rather than diagnoses). This differentiation is not purely academic, since both reimbursement forms, namely per-case flat rates and fee for service remuneration, exert different incentives on the service providers. Moreover, per-case flat rates are
generally considered to be more efficient 23.
Per-case flat rates are in some isolated cases used for outpatients
Design of the pilot experiment Schleswig-Holstein 24...
In Schleswig-Holstein a pilot experiment for a group of 20 selected operations was carried out over
several years. In the course of this experiment per-case flat rates were developed and used, aiming
at promoting outpatient surgery where medically appropriate, thereby aiming at substituting inpatient
care by equivalent outpatient procedures. Another aim was to achieve cost savings for treating those
cases. To maintain quality the flat rates developed and applied in the experiment could only be
utilised by medical practices that performed an annual minimum number of surgeries. Hospitals were
explicitly excluded. In this respect the German experiment is fundamentally different from the
Swedish and Austrian models to be discussed below, which focus on outpatient treatment of patients
in hospitals.
The definition and new calculation of the per-case flat rates of the German pilot experiment was cost-
oriented. Some major differences from the calculation of inpatient flat rates were observed: New
modules were introduced, sometimes new settlement rates for the cost types of certain modules
were created, cost types such as investment costs were included into the calculation, and some
items used for calculating inpatient rates were excluded. The design of the per-case flat rates aimed
at containing both personal cost and cost of materials .
Although the pilot experiment covered only 20 types of surgery the latter account for the
considerable substitution potential of 22.4 percent of all inpatient surgery cases. In order to prevent
insignificant results originating from a low number of cases the programme was restricted to 11
frequent operations, which however account for more than 90 percent of all cases within the 20
operations selected.
...and its results The flat rates agreed upon are above the rate that was applied to practising physicians before
and that resulted from the uniform assessment standard (EBM). This financial incitement
22 Embacher G., Schneider R. (2002), The Austrian Procedures and Diagnosis Oriented Hospital Financing System, Proceedings of the 18th Patient Classification Systems/Europe Conference, Innsbruck/Austria, October 2-5, 2002 23 Hsiao W.C., Roberts M.J., Berman P.A., Reich M.R.: Getting Health Reform Right, Harvard University, October 2000 24 Gerber I, Rotering C, Ambulante Fallpauschalen: Ergebnisse eines Modellversuches in Schleswig-Holstein, In: Arnold, Litsch, Schellschmidt (eds.), Krankenhaus -Report 2000: Vergütungsreform mit DRGs, Schattauer.

HEALTH SYSTEM WATCH 2/2003 15
therefore brought about an increase in services provided by contract physicians: 896 operations
or 13.5 percent more than the number registered in the period of comparison. Approximately one
third of this increase originated in physicians’ practices that did not participate in the experiment:
Since participation required a minimum number of operations, the authors of the study suppose
that these practices pursued the aim of being included into the model contract. With respect to
the entire range of services provided there was only a less than three percent (minus 513 cases)
quantitative reduction of the inpatient cases. .
If outpatient care provided by hospitals is combined with inpatient care, the substitution volume
amounts to no more than 168 operations or 0.8 percent. The decline in cases being treated on an
inpatient basis was only partly due to a shift towards medical practices. What was also influential
was an increased number of outpatient operations in the hospital, which were not considered in
the framework of the model contract. Physician activi ties in private hospitals, on the other hand,
seem to have resulted in a certain shift from the hospital towards office-based surgery.
Sum totalno savings can be registered with the operations observed. There is evidence that
hospital service provision (outpatient and inpatient) declined, but the increase in costs for contract
physicians was more than the double. The higher remuneration of model procedures and the
increase in the number of cases of contract physicians seem to have over-compensated the
lower costs in the inpatient sector. Looking at single procedures reveals a more differentiated
picture. With only one model procedure (abrasion of the uterus) savings could be observed,
although this procedure seems to have shifted both to hospitals’ outpatient departments and to
contract physicians, and not predominantly to the latter. In the case of cataract surgery, on the
other hand, operations shifted to the physicians’ practices, with the overall number of cases
remaining constant. Nevertheless no financial savings were made, since the model physicians
settled not only the additional, but all of the cases of cataract surgery in the model via the flat
rate, which was approximately 400 DM (205 Euro) above the former EBM refund per case. With
respect to other operations either no shift towards the ambulatory sector occurred or ambulatory
procedures increased more sharply than inpatient ones. As in the case of cataract treatment the
changed (=increased) reimbursement of contract physicians tends to cause a more than
proportional increase in expenses if no substitution takes place.
This observation leads the authors of the study to the conclusion that the strict separation
between ambulatory and inpatient sectors, as it is obviously also practised in Germany,
counteracts a quantitative and especially a financial substitution. They recommend a cross-sector
promotion of outpatient surgery; hospitals should be integrated into the corresponding contract as
practising service providers are. Furthermore they point out that the definition of the diagnosis
and the therapy is not the only decisive criterion when it comes to carrying out an operation on an
outpatient basis. What in fact is important in their opinion is to bear also in mind the patient’s
family and social environment and to negotiate outpatient elements of an operation with
integrated service providers.
The paper does not deal with the question to what extent the results depended on the amount of the
(now higher) remuneration level in the pilot experiment. It thereby leaves open whether the agreed
HEALTH SYSTEM WATCH 2/2003 16
fee might have been too high in single cases. This would be the case if between the EBM level and
the one actually agreed upon in the pilot experiment a physician fee level existed that was high
enough to offer incentives for a shift to the outpatient sector (since all cases of the same diagnosis
are reimbursed by this fee, also those that would never have been considered for an outpatient
treatment), but low enough to restrain the increase in the entire costs for outpatient services to the
savings made in the inpatient sector. Still, it is exactly the heterogeneous results and unanswered
questions that depict how difficult it is to use per-case flat rates as a steering tool.
DRGNord-O: Per-case flat rates for day clinic procedures in Sweden25 A model developed in Sweden has a completely different aim. It focuses especially on day-clinic and
endoscopic procedures in hospitals. For the Nordic countries including Sweden the system
NordDRG was developed already in the 90s, taking the American DRG scheme as a baseline.
Although this system is designed for the inpatient sector, it is in some county councils also applied to
the outpatient sector, especially for same-day surgery. According to Sweden’s experiences same-day
surgery procedures are in 50 – 60 percent of the cases well described by the DRGs for the inpatient
sector, namely in the case of operations. As for the remaining cases the application of NordDRG is
hardly efficient. This is why the development of an adapted version, NordDRG-O (O for outpatient),
for the outpatient sector was agreed upon. This scheme is to be applied both for outpatient and
inpatient one-day patients. Since the aim was to depict day clinic services, all DRGs that did not
comprise any procedures were excluded, reducing the number of DRGs to about the half. In the past
only with 0.10 percent of the outpatient cases complications or comorbidities were observed, which
were therefore considered irrelevant to the outpatient sector and not paid attention to in the
development of NordDRG-O. This further reduced the number of DRGs. DRGs that are
predominantly or exclusively appointed to outpatient cases today were on the other hand maintained.
This was intended to prevent the need for adaptations to arise as soon as technical progress allows
for an outpatient treatment.
The Swedish experts reckon that it will be impossible to reach complete compatibility between
inpatient and outpatient DRGs. While cases involving surgery are to be coded identically in both
settings, it is often factors that are irrelevant to the inpatient context that are decisive for
outpatient cases. The differing relevance predominantly arises from the different complexity and
the resulting cost differences between inpatient and outpatient sectors. In the outpatient setting
various factors can cause cost differences and correspondingly lead to a different encoding, while
the same cost differences are negligible for inpatient treatment, since the average costs are much
higher there.
This is why some new groups were introduced into NordDRG-O, predominantly for endoscopic
cases and DRGs without procedures. Although endoscopic procedures do not belong to surgery,
they should be considered in any case because of their frequency and costs. A classification
according to inpatient DRGs was considered inappropriate for the day-clinic sector, since no surgery
is involved there. Finally 18 new DRGs for outpatient endoscopic treatments were developed. DRGs
25 This section is based on information provided in Fernström, op. cit.
HEALTH SYSTEM WATCH 2/2003 17
without procedures were united according to medical, conservative criteria as well as the logic of the
original NordDRG system.
The project group was to present the final report relevant for the development of NordDRG-O in
spring 2003. This implies that the system had not been implemented when this issue was published,
and no experiences could be gained yet.
Results for Austria are not available yet
In two Austrian states per-case flat rate systems for the outpatient departments of public hospitals
have been in use, namely in Tyrol since the introduction of the LKF system and since 1999 also in
Lower Austria.
In Tyrol, for example, 12.5 percent – after a series of deductions – of total hospital outlays are provided for remuneration in the outpatient sector, for the inpatient sector it is 82 percent and for additional costs 5.5 percent. In line with the rule for the inpatient sector the means for the
outpatient sector are distributed among the public hospitals according to the number of outpatient credit points that are relevant to the fund. The actual remuneration per credit point is calculated retrospectively. Single fields of procedures are subject to weighting; the weighing factor for the
Innsbruck university hospitals amounts to 1.2, for all other public hospitals to 1.026. The catalogue of outpatient services comprises various procedures such as MR, CT, conventional and interventional radiology, laboratory analyses, dialyses, endoscopies, radiotherapy, dental
treatments, psychotherapy and psychodiagnosis or therapies in the fields of physiotherapy, logopaedics and ergotherapy 27 .
At present the experience gained from the two federal states do not allow any conclusions on incentive effects of the per-case flat rate system in the outpatient sector yet. Firstly, no obvious
differences in the development patterns can be observed, cf. figures 4 and 5. Secondly, there are still differences in data quality and collection in the field of hospitals’ outpatient departments which regard both case and frequency statistics and cost data. Since interdependencies with the care provided by
practising physicians can be expected, it is reasonable to consider these two settings together. When comparing the development of the number of cases of both settings between Tyrol28 and Austria no considerable differences in growth rates can be observed, neither in terms of quantity nor quality. In
the second and third LKF years higher growth rates of cases were registered than in the two previous or the two following years both with practising physicians and outpatient departments of public hospitals. This is not necessarily a real effect, but might rather represent only the fact that
registration of outpatient cases has become more exact after a transition period in the first LKF year as a consequence of an Austria-wide change in the remuneration system. On the other hand this does not explain the parallel increase in cases with practising physicians. This increase, in turn, can
at least for the year 1998 be considered independently from the developments in the outpatient
26 Richtlinien des Tiroler Krankenanstaltenfinanzierungsfonds für das Jahr 2003, tkf_richtlinien2003_beschluss.pdf, http://www.tirol.gv.at/themen/gesundheit/krankenanstalten/downloads.shtml [04/04/2003] 27 Erfassung der Ambulanzleistungen für die Krankenanstalten-Statistik und die Abrechnung mit dem Tiroler Krankenanstaltenfinanzierungsfonds, lkf_amb2003.xls, http://www.tirol.gv.at/themen/gesundheit/krankenanstalten/downloads.shtml [04/04/2003] 28 The values for Lower Austria are not presented here since the introduction took place even later, which means conclusions have to be drawn even more carefully.

HEALTH SYSTEM WATCH 2/2003 18
sector: The introduction of a user charge for health insurance vouchers led to a temporary decline in
physician visits in 1997, which flattened out however after a few quarters. Moreover, former consumption behaviour seems to have prevailed in consecutive periods and we observe even a short-term catch-up effect.
Figure 4: Annual growth rates of outpatient cases, Tyrol, in percent
Source: Federal Ministry for Social Security and Generations, IHS HealthEcon calculations 2003.
Figure 5: Annual growth rates of outpatient cases, Austria without Tyrol and Lower Austria, in
percent
Source: Federal Ministry for Social Security and Generations, IHS HealthEcon calculations 2003.
-2
-1
0
1
2
3
4
5
6
95-96 96-97 97-98 98-99 99-00 00-01
Practising physicians
Outpatient departmentsof public hospitals
-2
-1
0
1
2
3
4
5
6
95-96 96-97 97-98 98-99 99-00 00-01
Practising physicians
Outpatient departmentsof public hospitals

HEALTH SYSTEM WATCH 2/2003 19
Why do per-case flat rates not yet exist in primary care ?
As far as we know there is no country to reimburse practising health care providers with per-case flat rates. The reasons might be the following:
Ø A diagnosis and thus the necessary treatment often require the co-operation between
several medical and non-medical specialists. In primary care these people usually do not work in the same place. If remuneration is a per-case flat rate scheme, the financial flows between the suppliers have to be regulated, too. This is easier within an economic entity
such as a hospital or a multidisciplinary group practice than it is within a network of co-operating, but separately accounting suppliers, as it is the case in the primary-care sectors of many countries including Austria. The co-operation between various professions, such as
therapeutic staff and physicians, necessitates additional co-ordination. In a heterogeneous structure of suppliers already the definition of a treatment case is no longer a trivial task29. It becomes all the more difficult if it is linked to a cost-oriented flat rate on the basis of which
the involved suppliers are remunerated..
Ø The development and maintenance of DRG systems is more complicated than that of a fee for service scheme30 and even more complicated than that of a per-capita lump sum or
salary scheme. The calculation of DRG flat rates not only requires statistics on the (efficient) resource consumption per service, but also the definition of a standard treatment or a typical patient career. Since the hospital sector is in general more cost intensive than the primary
care sector – cf. annex tables A1-A3 - , the effort seems more justified there. This argument is corroborated by the fact that the fee per diagnosis in primary care is on the average lower than in the inpatient sector. Still there seem to be great variations between physician fees, as
the differentiation between acute and chronic outpatient cases suggests.
In its recent annual expertise the German expert board repeated their claim for a mixed remuneration scheme for physicians 31, a claim they already expressed in their expertise of 1997. This system aims at combining the fee components in a way so as to make the respective
disincentives act against each other: When assuming that physicians react to economic incentives based on the remuneration scheme by changing their practice style, salaries and per-capita flat rates must generally go hand in hand with under-provision and remunerating single-procedures with over-
provision. Diagnosis-oriented per-case flat rates might consequently constitute a mix of a fee for service scheme and per-capita flat rate, leading to service provision between the two extremes. This combination of refund remuneration forms has the benefit of reducing the above mentioned
difficulties, since per-case flat rates no longer have to cover the entire treatment costs per case (for there is a basic refund). That is to say the flat rates can be aggregated more tightly and therefore be administrated more easily. The problem of cross-supplier cases is thereby reduced, too, although not
solved.
29 Cf. Health System Watch 4/2001(www.ihs.ac.at). 30 This becomes clear when considering the fact that numerous insurance providers – not to mention countries – have their own single procedure-based system, while in most countries variants of the same DRG systems are applied, if and when a per-case flat rate system is used in the first place.. 31 Sachverständigenrat für die konzertierte Aktion im Gesundheitswesen, Finanzierung, Nutzerorientierung und Qualität, Gutachten 2003, page 528-529

HEALTH SYSTEM WATCH 2/2003 20
... and what does the trend say?
When comparing the health care reforms of several developed countries certain phases can be
observed32. The first wave of reforms aimed at improving the access to health care or to open it for
wide parts of the population in the first place. With an increasing range of services the impression
was created that the lack in regulation favoured an inefficient use of resources in the health care
sector. In the course of the second reform wave the focus was therefore shifted from service
extension to cost containment. The predominant tools of budget controls and rationalisation however
basically did not improve the incentives for a more efficient use of available resources, making the
financial pressure go up again after about a decade of low expenditure increases.
In the third wave of reforms health policy targeted at offering incentives to all participants for a more
efficient behaviour, often involving features of competition33. Especially the Managed Care revolution
influenced the suppliers’ forms of remuneration. A series of methods, from selective contracting to
per-capita flat rates and more carefully negotiated prices, was applied. Accumulated inefficiencies of
the previous years obviously left enough room of action for managed care measures to allow for
expenditure increases without considerably impairing the outcome34. Elements of competition were
not only introduced as competition between insurance providers (e.g. Germany, Netherlands), but
also between service providers35. As for the role and remuneration of practising physicians the British
fundholders have to be mentioned. Fundholders are general practitioners who purchase, for
example, certain surgical services or pharmaceuticals with the budget available from the patients
registered with them. In some cases they are able to negotiate the prices themselves. The incentive
for an efficient purchase of services consists in the opportunity to reinvest earnings created into their
practice. The success of this model consisted in the low hospital charges for fundholders as well as
in short waiting periods for their patients36. The system is being further developed. Under the Labour
government, for example, similarly structured primary care groups substituted the fundholders. By
2004 Primary Care Trusts (England) and Local Health Groups (Wales) are to become the major
purchasers of health care services 37.
32 David M Cutler, Equality, Efficiency, and Market Fundamentals: The Dynamics of International Medical-Care Reform, Journal of Economic Literature vol XL, September 2002, 881-906. 33 Cutler 2002, op.cit, S. 903. 34 The direct competition between suppliers is considered more successful than the indirect competition via insurance providers, which is based on the expectation that, under the pressure of competition, insurance providers conclude efficiency enhancing contracts with the service providers. Cf. Richard Saltman, The Western European Experience with Health Care Reform, April 2002, http://www.who.dk/observatory/Studies/20021223_2, [25/04/03] 35 R Miller, H Luft, Does Managed Care lead to better or worse quality of care? Health Affairs 16:5, 1997, 7-25 und Cutler 2002, op.cit. 36 Cutler, 2002, op.cit. 37 European Observatory on Health Care Systems, Health care systems in eight countries: trends and challenges, April 2002.

HEALTH SYSTEM WATCH 2/2003 21
Table 5: Reforms of physician remuneration in the G7 countries
country introdution measure
Canada 1984 Physicians have to accept the government payment as entire
payment
Germany 1977 Upper limit of expenditures: global budget for physician
associations
1993 Prescription drug budgets for physicians
1997 Physicians‘ budgets for practices
France 1979 Tightening/enhanced control of the tariff structure
1996 Increased control of expenditures
Italy 1992, 1999 Transition from fee for service to a mixed scheme
Japan early 80s Tightening/enhanced control of the tariff structure
U.K. late 40s Salaries introduced into NHS
1990 GPs can become fundholders (per-capita flat rates)
1998 Primary Care Groups substitute fundholders
U.S. 1992 Fee schedule for physicians (RBRVS in Medicare)
Source: adapted after Cutler (2002).
HEALTH SYSTEM WATCH 2/2003 22
Table A1: Expenditures on inpatient care in percent of total expenditure on health Index EU15=100 1990 1995 1996 1997 1998 1999 2000 1990 1995 1996 1997 Austria*** 46.1 d) 44.1 42.7 46.7 45.5 45.0 45.2 119 116 115 124 Belgium 32.8 33.5 34.8 35.0 n.a. n.a. n.a. 85 88 94 93 Denmark 56.7 55.0 55.3 54.7 54.3 53.9 53.5 147 145 149 145 Germany 28.6 c) 30.0 30.2 31.1 31.5 31.1 31.1 74 79 82 83 Finland 44.7 42.0 41.8 41.4 41.1 40.5 39.9 116 111 113 110 France 46.0 45.5 45.5 45.4 44.6 43.6 42.8 119 120 123 121 Greece 28.4 24.8 b) n.a. n.a. n.a. n.a. n.a. 74 65 n.a. n.a. Ireland** 53.5 54.3 n.a. n.a. n.a. n.a. 49.0 139 143 n.a. n.a. Italy 42.7 44.8 41.7 42.5 41.5 41.7 42.3 111 118 113 113 Luxembourg 26.4 31.3 32.4 36.0 30.7 29.8 n.a. 68 83 88 96 Netherlands 49.2 49.1 49.6 49.9 49.9 49.5 49.2 127 130 134 133 Portugal** 29.5 31.0 32.0 n.a. n.a. n.a. n.a. 76 82 87 n.a. Sweden** 49.8 42.1 n.a. n.a. n.a. n.a. n.a. 129 111 n.a. n.a. Spain 44.1 43.6 43.6 43.3 42.8 42.3 n.a. 114 115 118 115 United Kingdom** 29.1 29.2 25.1 25.6 n.a. n.a. n.a. 75 77 68 68 EU15* 38.6 37.9 37.0 37.6 n.a. n.a. n.a. 100 100 100 100 EU12* 39.3 38.7 39.6 40.4 n.a. n.a. n.a. 102 102 107 107 Switzerland 47.9 44.4 45.0 45.0 44.3 43.9 44.2 124 117 122 120 USA 44.9 43.0 42.6 42.2 41.5 40.4 39.6 61 113 115 112 Bulgaria 53.0 59.0 n.a. n.a. n.a. n.a. n.a. 137 156 n.a. n.a. Estonia n.a. n.a. n.a. n.a. n.a. 35.4 36.2 n.a. n.a. n.a. n.a. Latvia 78.0 62.0 58.0 56.7 51.6 51.9 57.2 202 164 157 151 Lithuania n.a. n.a. n.a. n.a. 41.6 n.a. n.a. n.a. n.a. n.a. n.a. Malta n.a. n.a. n.a. n.a. n.a. n.a. n.a. n.a. n.a. n.a. n.a. Poland 44.8 46.9 47.2 n.a. n.a. n.a. n.a. 116 124 128 n.a. Romania n.a. 59.0 58.0 63.0 n.a. n.a. 53.0 a) n.a. 156 157 167 Slovakia 32.1 43.0 44.0 44.8 48.2 47.0 n.a. 83 113 119 119 Slovenia 42.9 49.1 49.7 48.9 47.2 47.4 47.8 111 130 134 130 Czech Republic n.a. 29.6 33.8 35.6 35.4 30.8 32.0 n.a. 78 91 95 Turkey 33.4 28.7 28.2 28.8 29.3 n.a. n.a. 86 76 76 77 Hungary 59.7 54.8 52.4 n.a. 28.8 29.1 28.7 155 145 142 n.a. Cyprus n.a. n.a. n.a. n.a. n.a. n.a. n.a. n.a. n.a. n.a. n.a. *weighted by the entire health expenditures **only public expenditures ***expenditures on fund hospitals a)2001, b)1994, c)1992, d)1991 Sources: WHO Health for all database, January 2003; OECD Health Data, August 2002 for Ireland, Portugal, Sweden, United Kingdom and USA; Health Care Systems in Transition (HIT) for Lithuania, Poland and Slovakia; Federal Ministry for Social Security and Generations and Statistik Austria for Austria; IHS HealthEcon calculations 2003.

HEALTH SYSTEM WATCH 2/2003 23
Table A2: Expenditures on pharmaceuticals in percent of total expenditure on health Index EU15=100
1990 1995 1996 1997 1998 1999 2000 1990 1995 1996 1997 1998 1999 Austria 10.7 10.8 10.7 13.6 14.3 15.3 15.4 68 69 68 85 89 90 Belgium 15.5 16.3 15.6 16.3 n.a. n.a. n.a. 99 105 100 102 n.a. n.a. Denmark 7.5 9.1 8.9 9.0 9.2 9.0 9.2 48 59 57 56 57 53 Germany 14.7 a) 12.5 12.6 12.7 13.2 13.5 13.6 93 81 81 80 82 80 Finland 9.4 14.0 14.4 14.8 14.6 15.1 15.5 60 90 92 93 90 89 France 16.8 17.5 17.5 17.9 18.5 19.2 20.1 107 113 112 112 114 113 Greece 14.5 17.3 17.9 17.1 14.0 15.8 18.4 92 112 114 107 87 93 Ireland 11.3 9.7 9.6 9.3 9.7 9.9 9.6 72 63 61 58 60 58 Italy 21.2 20.9 21.1 21.3 21.8 22.2 22.6 135 135 135 133 135 131 Luxembourg 14.9 12.0 11.5 12.6 12.3 11.7 n.a. 95 77 73 79 76 69 Netherlands 9.6 11.0 11.0 11.0 11.4 11.6 11.8 61 71 70 69 71 68 Portugal 24.9 23.2 23.6 23.5 23.5 n.a. n.a. 158 150 151 147 145 n.a. Sweden 8.0 12.5 12.9 12.8 n.a. n.a. n.a. 51 81 82 80 n.a. n.a. Spain 17.8 17.7 18.2 19.0 n.a. n.a. n.a. 113 114 116 119 n.a. n.a. United Kingdom 13.5 15.3 15.6 15.9 n.a. n.a. n.a. 86 99 100 100 n.a. n.a. EU15* 15.7 15.5 15.6 16.0 16.2 17.0 n.a. 100 100 100 100 100 100 EU12* 16.5 15.7 15.9 16.2 16.3 17.2 n.a. 105 101 101 101 101 101 Switzerland 10.2 10.0 10.0 10.3 10.2 10.5 10.7 65 64 64 65 63 62 USA 9.2 8.9 9.2 9.7 10.3 11.3 12.0 58 57 59 61 64 67 Bulgaria 12.3 17.4 23.5 23.4 23.8 n.a. n.a. 78 112 150 147 147 n.a. Estonia n.a. n.a. 17.0 17.0 18.7 19.4 22.3 n.a. n.a. 109 107 116 114 Latvia n.a. n.a. n.a. n.a. n.a. n.a. n.a. n.a. n.a. n.a. n.a. n.a. n.a. Lithuania n.a. n.a. n.a. n.a. n.a. n.a. n.a. n.a. n.a. n.a. n.a. n.a. n.a. Malta 16.0 15.0 15.0 22.0 n.a. n.a. n.a. 102 97 96 138 n.a. n.a. Poland 12.6 15.6 8.9 n.a. n.a. n.a. n.a. 80 101 57 n.a. n.a. n.a. Romania 11.0 17.0 19.0 17.0 20.0 n.a. n.a. 70 110 121 107 124 n.a. Slovakia 16.8 28.0 30.1 29.7 28.7 28.3 n.a. 107 181 192 186 178 167 Slovenia 10.4 18.9 17.4 17.9 18.9 19.0 19.6 66 122 111 112 117 112 Czech Republic 21.0 25.6 25.5 25.3 25.5 26.5 25.2 134 165 163 159 158 156 Turkey 20.5 30.1 26.3 27.8 34.7 n.a. n.a. 130 194 168 174 215 n.a. Hungary 5.0 24.1 24.8 24.8 32.7 32.1 33.2 32 155 158 155 202 189 Cyprus n.a. n.a. n.a. n.a. n.a. n.a. n.a. n.a. n.a. n.a. n.a. n.a. n.a. a)1992 *weighted by the entire health expenditures Sources: WHO Health for all database, January 2003; Oecd Health Data, August 2002 for the USA; Health Care Systems in Transition (HIT) for Bulgaria, Malta, Polen and Slovakia; HVSV and Statistik Austria for Austria; IHS HealthEcon calculations 2003.
HEALTH SYSTEM WATCH 2/2003 24
Table A3: Expenditures on physician services in percent of total expenditure on health 1990 1995 1996 1997 1998 1999 2000 Austria 19.1 19.5 19.5 21.4 21.5 21.4 21.4 Belgium n.v n.v n.v n.v n.v n.v n.v Denmark 15.8 16.0 15.7 15.7 15.7 15.2 15.2 Germany* 9.9 a) 9.8 9.7 9.9 9.9 9.9 9.9 Finland 25.1 24.7 24.6 24.2 24.4 24.3 24.2 France 12.8 12.9 12.7 12.8 12.8 12.7 12.5 Greece n.a. n.a. n.a. n.a. n.a. n.a. n.a. Ireland 15.2 n.a. n.a. n.a. n.a. n.a. n.a. Italy 19.8 n.a. n.a. n.a. n.a. n.a. n.a. Luxembourg 21.6 14.2 12.6 13.2 12.2 n.a. n.a. Netherlands 9.6 8.6 8.5 8.3 8.2 8.2 8.2 Portugal n.a. n.a. n.a. n.a. n.a. n.a. n.a. Sweden 14.4 n.a. n.a. n.a. n.a. n.a. n.a. Spain n.a. n.a. n.a. n.a. n.a. n.a. n.a. United Kingdom 14.9 n.a. n.a. n.a. n.a. n.a. n.a. EU15 n.a. n.a. n.a. n.a. n.a. n.a. n.a. EU12 n.a. n.a. n.a. n.a. n.a. n.a. n.a. Switzerland 14.9 14.2 14.0 14.1 14.5 14.5 14.2 USA 23.1 22.7 22.4 22.5 22.7 22.7 22.5 Bulgaria n.a. n.a. n.a. n.a. n.a. n.a. n.a. Estonia n.a. n.a. n.a. n.a. n.a. n.a. n.a. Latvia n.a. n.a. n.a. n.a. n.a. n.a. n.a. Lithuania n.a. n.a. n.a. n.a. n.a. n.a. n.a. Malta n.a. n.a. n.a. n.a. n.a. n.a. n.a. Poland n.a. n.a. n.a. n.a. n.a. n.a. n.a. Romania n.a. n.a. n.a. n.a. n.a. n.a. n.a. Slovakia n.a. n.a. n.a. n.a. n.a. n.a. n.a. Slovenia n.a. n.a. n.a. n.a. n.a. n.a. n.a. Czech Republic n.a. n.a. n.a. 24.5 22.9 n.a. n.a. Turkey n.a. n.a. n.a. n.a. n.a. n.a. n.a. Hungary n.a. n.a. n.a. n.a. n.a. n.a. n.a. Cyprus n.a. n.a. n.a. n.a. n.a. n.a. n.a. *1992-2000: new calculation of health expenditures 2001 a)1992 Source: OECD Health Data, August 2002; HVSV and Statistik Austria for Austria; IHS HealthEcon calculations 2003.

HEALTH SYSTEM WATCH 2/2003 25
Table A4: Characteristics of health care provision, 2000 or most recent year available
Admission, rate
per 100 inhabitants.
Average length of stay in days
Cases treated/bed Physicians per 1,000 inhabitants
Dentists per 1,000 inhabitants
Pharmacists per 1,000 inhabitants
Nursing staff per 1,000 inhabitants
Per-capita physician visits
Austria 29.2 7.6 43.9 3.1 0.5 0.6 5.8 6.7
Belgium 19.7 b) 11.4 b) 38.1 c) 4.1 0.7 b) 1.4 b) 10.8 d) 7.4
Denmark 19.4 6.6 57.2 a) 3.2 a) 1.0 a) 0.5 13.5 a) 7.0 b)
Germany 23.5 11.9 30.8 3.6 0.8 0.6 9.3 6.5 d)
Finland 26.7 10.3 30.8 e) 3.1 0.9 1.5 21.8 4.3
France 23.0 a) 10.8 c) 48.9 a) 3.3 0.7 1.0 6.7 6.5 d)
Greece 15.4 b) 8.3 b) 36.1 c) 4.4 a) 1.2 a) n.a. 2.6 h) n.v
Ireland 14.8 7.4 47.6 2.2 0.5 0.8 16.8 n.v
Italy 16.5 7.6 36.2 b) 5.7 a) 0.6 1.0 a) n.a. 6.0 a)
Luxembourg 19.4 f) 15.3 d) n.a. 2.5 0.6 0.7 7.6 2.8 b)
Netherlands 9.4 12.9 26.8 3.2 0.5 0.2 13.0 5.9
Portugal 12.0 b) 9.0 b) 37.8 b) 3.2 0.4 0.8 3.7 3.4 b)
Sweden 16.5 6.4 42.0 d) 2.9 a) 1.5 c) 0.6 8.4 a) 2.8 c)
Spain 11.5 c) 9.6 d) 36.5 c) 3.3 0.4 0.8 3.7 n.a.
United Kingdom 15.1 b) 9.8 d) 50.0 1.6 g) 0.4 h) 0.6 h) n.a. 5.4 b)
EU 15* 18.4 10.0 39.6 3.5 0.6 0.8 7.9 6.0
EU 12* 19.1 10.2 37.1 3.9 0.6 0.8 7.8 6.2
Switzerland 16.9 b) 13.0 21.5 j) 3.5 0.5 0.6 7.8 j) 11.0 h)
USA 12.4 7.0 a) 40.1 2.8 a) 0.6 a) 0.7 d) 8.3 a) 5.8 d)
Bulgaria 15.4 11.5 21.1 a) 3.4 0.8 0.1 4.7 5.4 a)
Estonia 20.4 9.2 28.2 a) 3.2 0.7 0.6 6.3 6.7
Latvia 22.1 11.4 25.4 a) 3.2 0.5 n.v 5.2 4.8
Lithuania 24.7 11.2 28.1 a) 4.0 0.7 0.6 8.0 6.3
Malta 20.2 c) 4.6 c) n.a. 2.7 0.4 1.9 3.7 n.a.
Poland 15.5 8.9 26.1 a) 2.2 0.3 0.6 5.3 j) 5.4
Romania 22.4 8.9 n.a. 1.9 0.2 0.1 4.0 5.1
Slovakia 19.9 10.2 30.0 3.2 0.5 0.4 7.5 15.7
Slovenia 16.8 8.6 30.9 a) 2.2 0.6 0.4 7.0 6.8
Czech Republic 20.0 11.6 31.3 3.4 0.6 0.5 9.2 14.8
Turkey 7.8 5.9 37.6 1.2 0.2 0.4 2.4 2.4
Hungary 25.6 8.9 34.6 3.6 a) 0.6 a) 0.5 2.8 21.8
Cyprus n.a. n.a. n.a. n.a. n.a. n.v n.v n.a.
Beitritt13* 14.8 8.2 32.1 2.1 0.4 0.4 4.2 6.1
MOEL10* 19.2 9.6 27.8 2.6 0.4 0.4 5.4 8.5
a)1999, b)1998, c)1997, d)1996, e)1995, f)1994, g)1993, h)1992, i)1991, j)1990; *weighted by population 2000.
Sources: WHO Health for all database, January 2003; OECD Health Data, August 2002 for cases per bed and all classification figures for the USA; IHS HealthEcon calculations 2003.

HEALTH SYSTEM WATCH 2/2003 26