Embed Size (px)
Citation preview
III. Appendices Appendix 1a - Training Chart
IM P RO V ING N U R SING H O M E C U LT U R E Specia l Study
P erson Directed C are 23 Q IO s recruit
5 -10 N ursing H om es from their s tate
W orkforce R etention 8 C orporations
& 2 State Triads (Q IO , State A ASH A & AH C A)
recruit 10-12 nursing hom es
Training
Q IO 4 S ess ions
N u rs ing Hom e S ess ions
Training
C orp s 4 S ess ions
N H S ess ion s
1 year S ep tem b er 2 0 0 4– A u g us t 20 05
1 year A u g us t 2 00 4 -O ctob er 2 0 0 5
5 2 1
O utco m es C on gre ss
Improving Nursing Home Culture Final Report 72
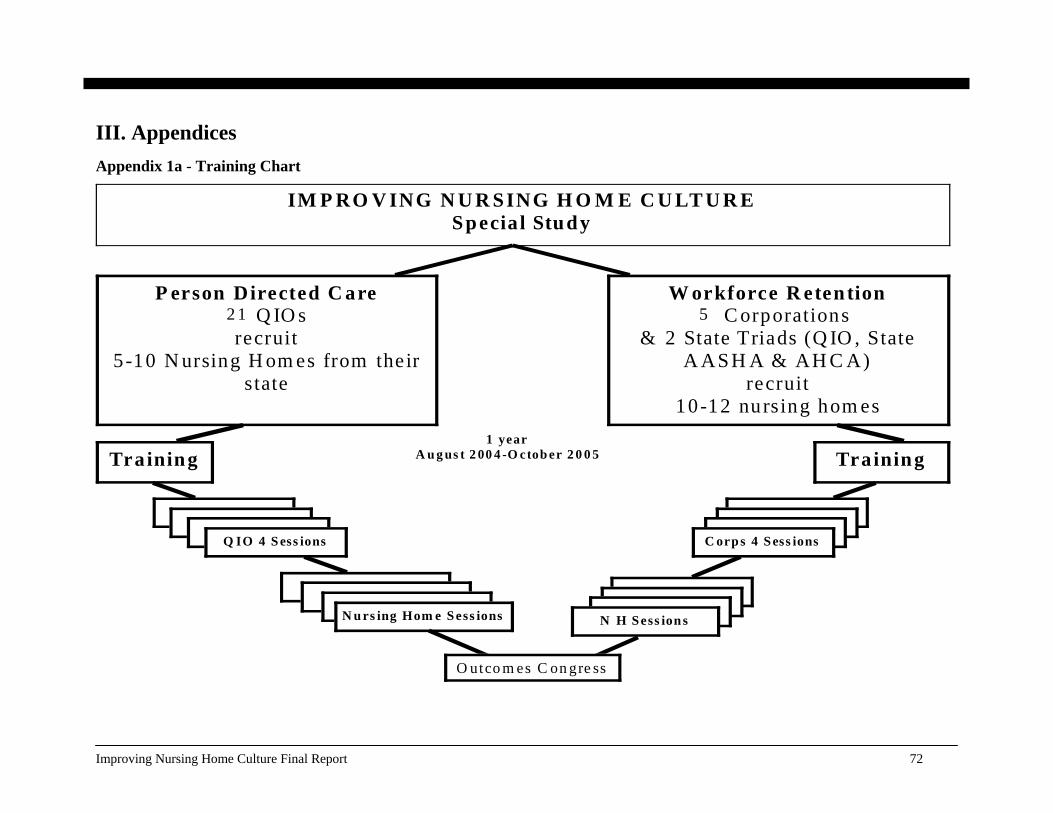
Appendix 1b – PDC Training Calendar
Improving Nursing Home Culture Final Report 73
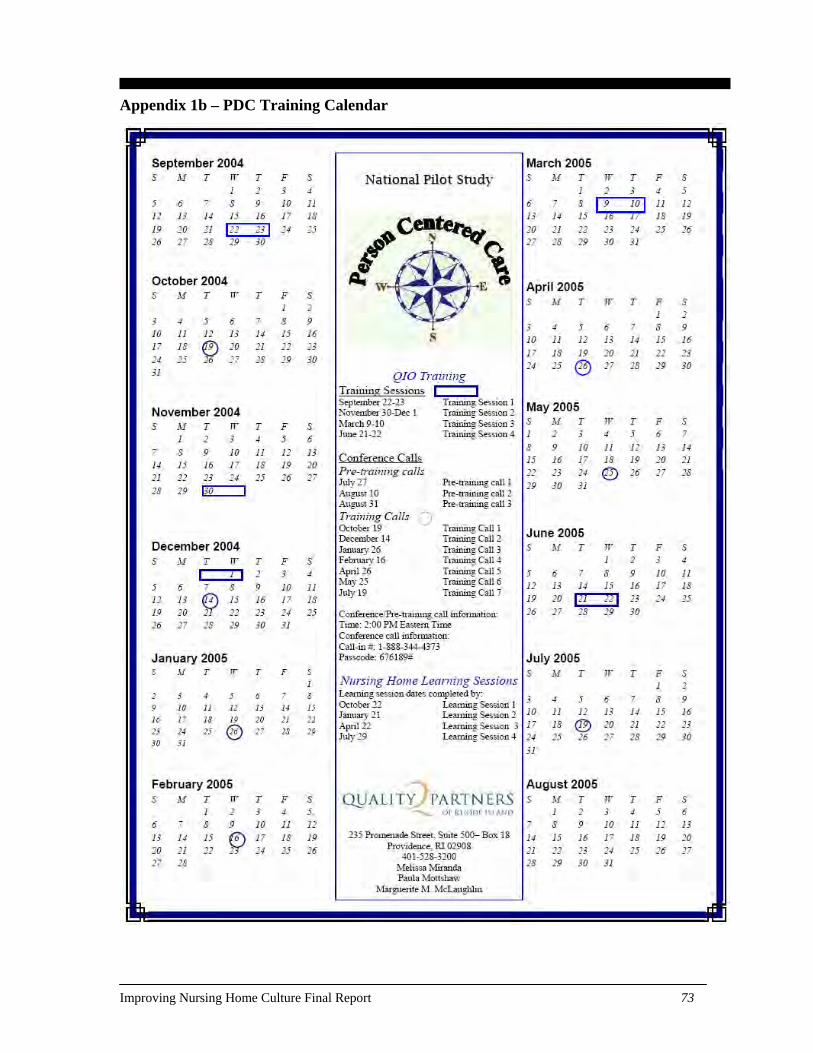
Appendix 1c – WFR Training Calendar
Improving Nursing Home Culture Final Report 74
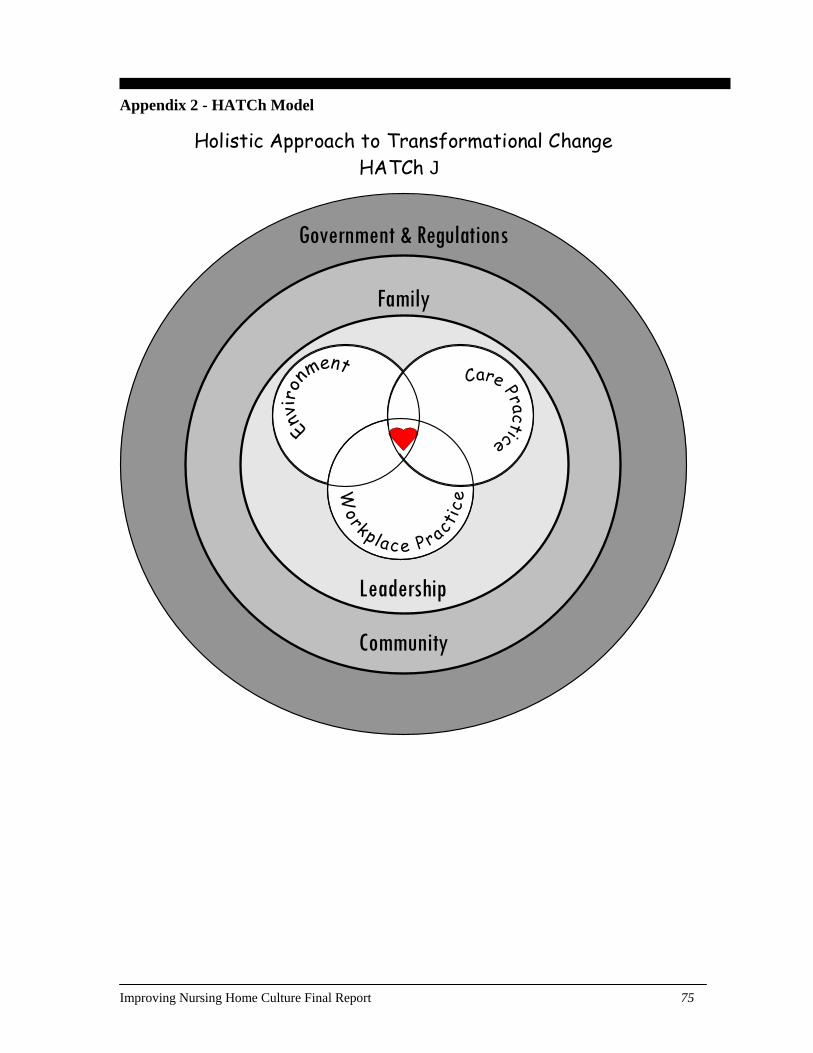
Appendix 2 - HATCh Model
Holistic Approach to Transformational Change HATCh J
Leadership
Government & Regulations
Community
Family
Improving Nursing Home Culture Final Report 75
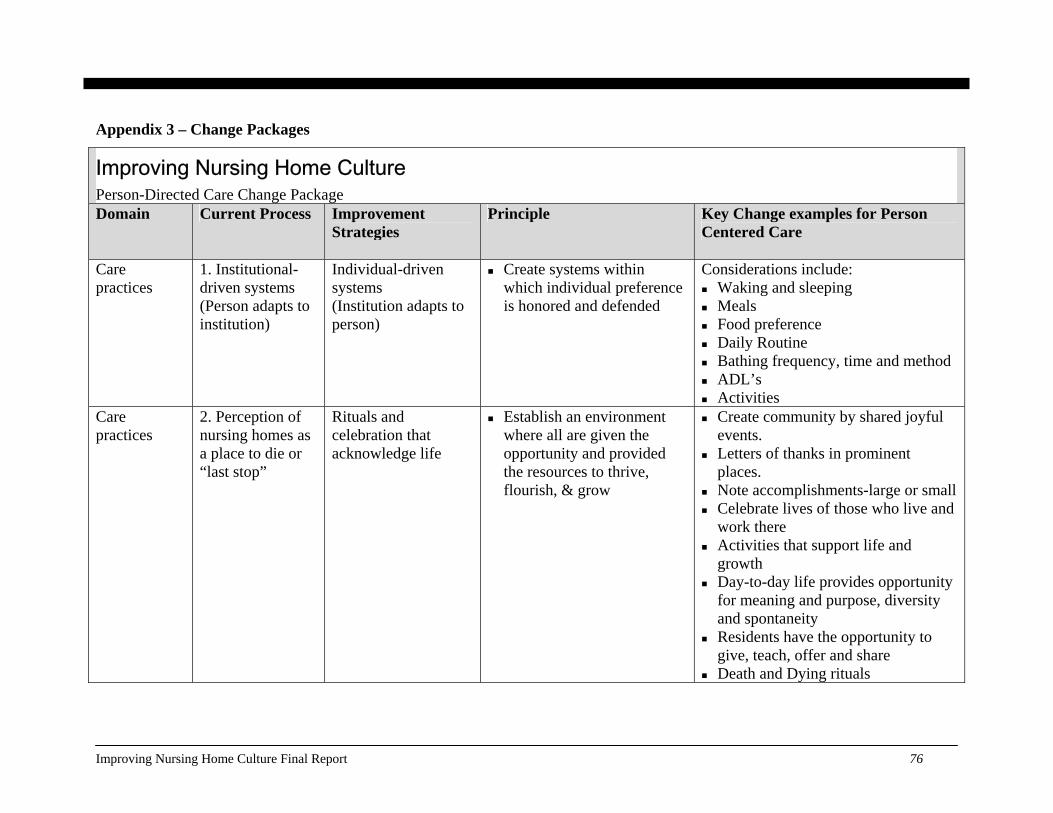
Appendix 3 – Change Packages
Improving Nursing Home Culture Person-Directed Care Change Package Domain Current Process Improvement
Strategies Principle Key Change examples for Person
Centered Care
Care practices
1. Institutional-driven systems (Person adapts to institution)
Individual-driven systems (Institution adapts to person)
Create systems within which individual preference is honored and defended
Considerations include: Waking and sleeping Meals Food preference Daily Routine Bathing frequency, time and method ADL’s Activities
Care practices
2. Perception of nursing homes as a place to die or “last stop”
Rituals and celebration that acknowledge life
Establish an environment where all are given the opportunity and provided the resources to thrive, flourish, & grow
Create community by shared joyful events.
Letters of thanks in prominent places.
Note accomplishments-large or small Celebrate lives of those who live and
work there Activities that support life and
growth Day-to-day life provides opportunity
for meaning and purpose, diversity and spontaneity
Residents have the opportunity to give, teach, offer and share
Death and Dying rituals
Improving Nursing Home Culture Final Report 76
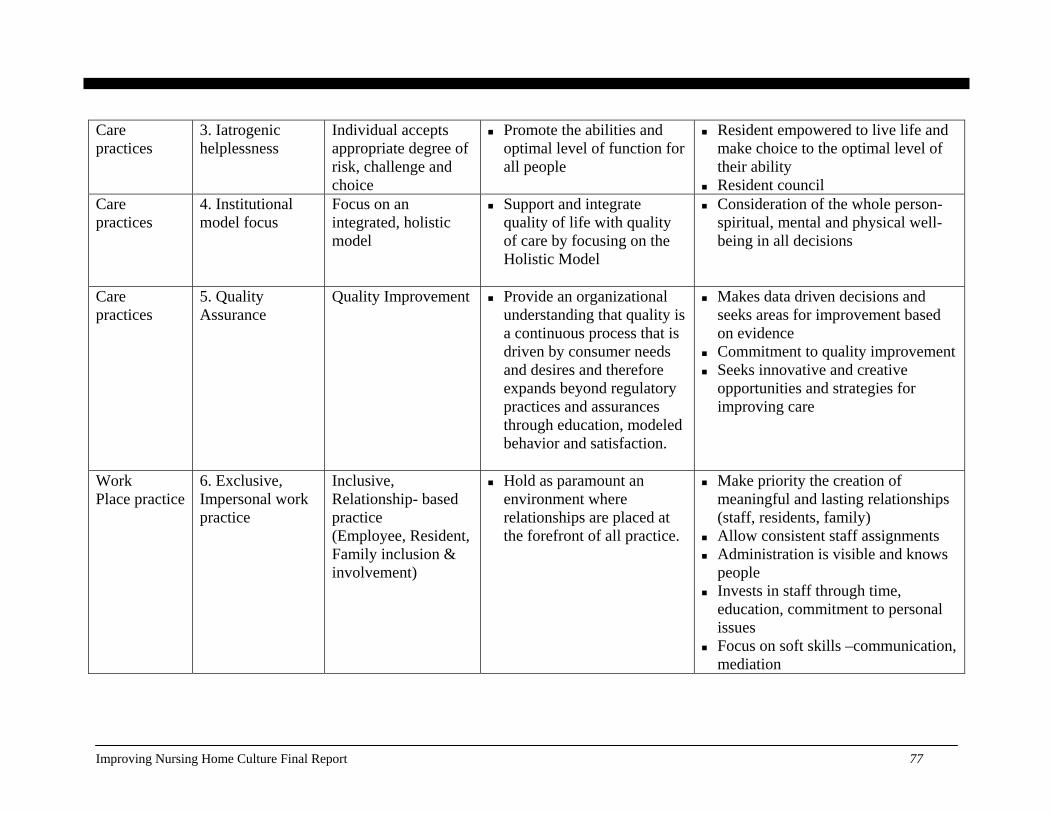
Care practices
3. Iatrogenic helplessness
Individual accepts appropriate degree of risk, challenge and choice
Promote the abilities and optimal level of function for all people
Resident empowered to live life and make choice to the optimal level of their ability
Resident council Care practices
4. Institutional model focus
Focus on an integrated, holistic model
Support and integrate quality of life with quality of care by focusing on the Holistic Model
Consideration of the whole person-spiritual, mental and physical well-being in all decisions
Care practices
5. Quality Assurance
Quality Improvement Provide an organizational understanding that quality is a continuous process that is driven by consumer needs and desires and therefore expands beyond regulatory practices and assurances through education, modeled behavior and satisfaction.
Makes data driven decisions and seeks areas for improvement based on evidence
Commitment to quality improvement Seeks innovative and creative
opportunities and strategies for improving care
Work Place practice
6. Exclusive, Impersonal work practice
Inclusive, Relationship- based practice (Employee, Resident, Family inclusion & involvement)
Hold as paramount an environment where relationships are placed at the forefront of all practice.
Make priority the creation of meaningful and lasting relationships (staff, residents, family)
Allow consistent staff assignments Administration is visible and knows
people Invests in staff through time,
education, commitment to personal issues
Focus on soft skills –communication, mediation
Improving Nursing Home Culture Final Report 77

Work Place practice
7. Authoritarian change process
Empowered, informed integrated change process
Seek to create opportunities where individuals are given the opportunity to better the home and their lives by offering their voice to make empowered decisions, take greater responsibility and provide their thoughts & ideas
Create committee and team driven change processes
Promote an environment where individuals are empowered to make decisions
Establish self-managed work teams Support a setting where the
opportunity to better the facility and individuals lives is held in high regard
Create opportunities for individuals to lead and take greater responsibility
Work Place practice
8. Segregated departments
Integrated work teams that influence care
Formulate integrated teams that will guide the organization into the best possible care, work and environmental practice
Learning circles Task force Change Agent teams Integrated Care Team: Nursing
Assistants generate the basis of care plan and function as equals on the care plan team
Inclusive decision making process (staff, residents, family)
Work Place practice
9. Insular change resistant organization
Open, sharing/learning community
Resolve to be a learning, sharing community
Uses creative processes to develop new ideas for care
Explores and shares best practice Teaches and leads others within the
NH community Provides training, learning skill
building opportunities Utilizes and implements effective
feedback loops
Improving Nursing Home Culture Final Report 78
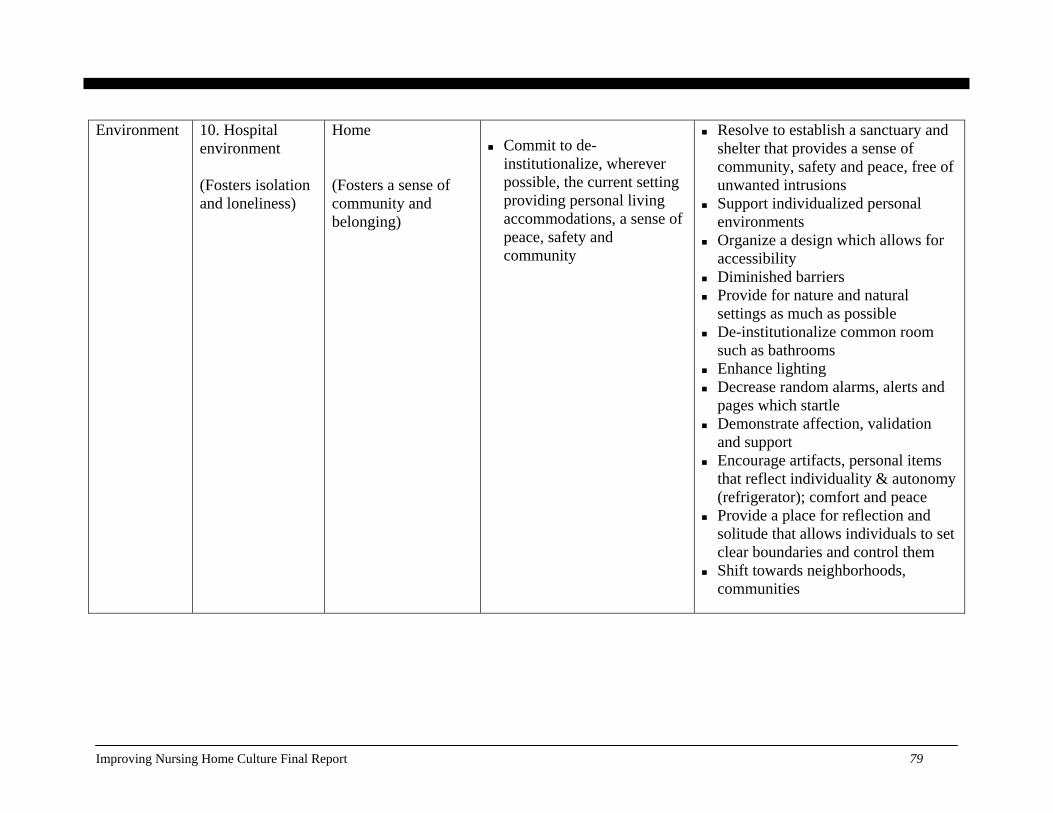
Environment 10. Hospitalenvironment (Fosters isolation and loneliness)
Home (Fosters a sense of community and belonging)
Commit to de-
institutionalize, wherever possible, the current setting providing personal living accommodations, a sense of peace, safety and community
Resolve to establish a sanctuary and shelter that provides a sense of community, safety and peace, free of unwanted intrusions
Support individualized personal environments
Organize a design which allows for accessibility
Diminished barriers Provide for nature and natural
settings as much as possible De-institutionalize common room
such as bathrooms Enhance lighting Decrease random alarms, alerts and
pages which startle Demonstrate affection, validation
and support Encourage artifacts, personal items
that reflect individuality & autonomy (refrigerator); comfort and peace
Provide a place for reflection and solitude that allows individuals to set clear boundaries and control them
Shift towards neighborhoods, communities
Improving Nursing Home Culture Final Report 79
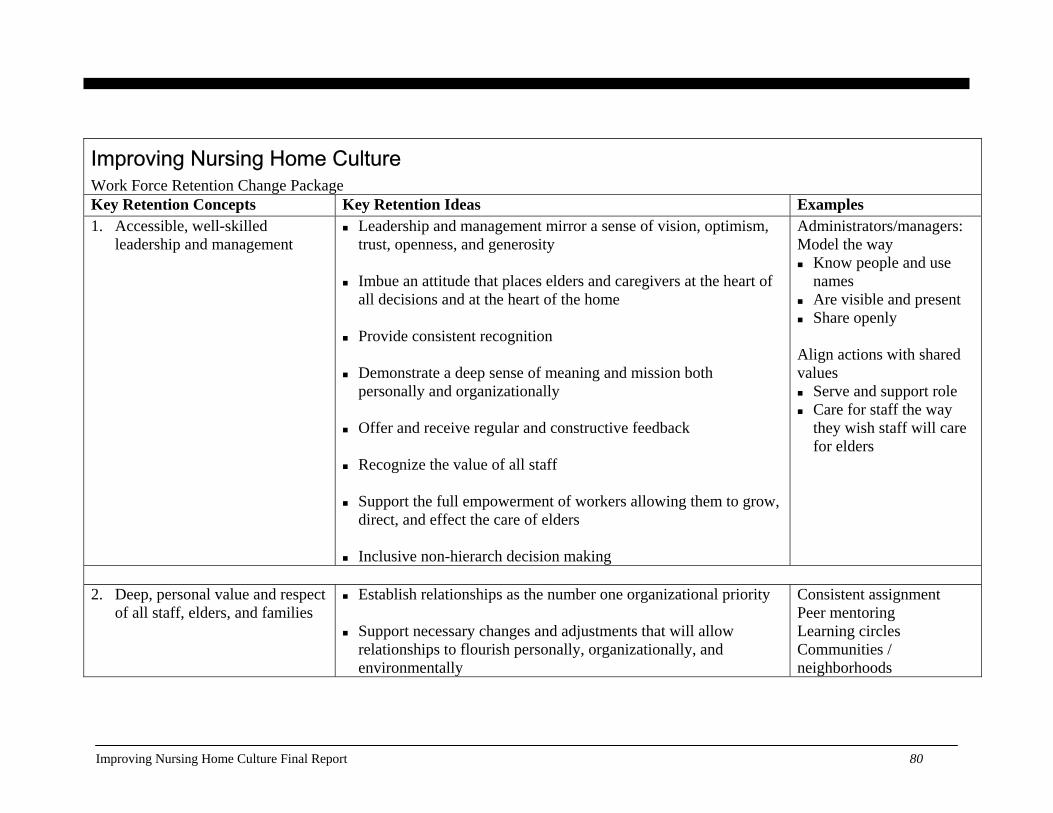
Improving Nursing Home Culture Work Force Retention Change Package Key Retention Concepts Key Retention Ideas Examples 1. Accessible, well-skilled
leadership and management
Leadership and management mirror a sense of vision, optimism, trust, openness, and generosity
Imbue an attitude that places elders and caregivers at the heart of
all decisions and at the heart of the home Provide consistent recognition
Demonstrate a deep sense of meaning and mission both
personally and organizationally Offer and receive regular and constructive feedback
Recognize the value of all staff
Support the full empowerment of workers allowing them to grow,
direct, and effect the care of elders Inclusive non-hierarch decision making
Administrators/managers: Model the way Know people and use
names Are visible and present Share openly
Align actions with shared values Serve and support role Care for staff the way
they wish staff will care for elders
2. Deep, personal value and respect
of all staff, elders, and families Establish relationships as the number one organizational priority
Support necessary changes and adjustments that will allow
relationships to flourish personally, organizationally, and environmentally
Consistent assignment Peer mentoring Learning circles Communities / neighborhoods
Improving Nursing Home Culture Final Report 80

Improving Nursing Home Culture Work Force Retention Change Package Key Retention Concepts Key Retention Ideas Examples
Include elders, caregivers, and families in developing avenues for
relationship building Create openness within the organization for the personal needs,
personal accomplishments, personal tragedies of all
Family council In-house social services for staff Social support for staff’s needs Short-term loans Ways of welcoming new families, staff, and residents Community mourning
3. Basic, high performance human
resource policies Wages /Benefits:
Health insurance Paid-time off Retirement plan Cafeteria plan Longevity bonuses Attendance bonuses Sick-leave bank Education and tuition reimbursement
Life skills at all levels:
Communication Mediation Negotiation Problem solving
Team leader positions Attendance at gatherings, workshops, conferences and meetings
Improving Nursing Home Culture Final Report 81
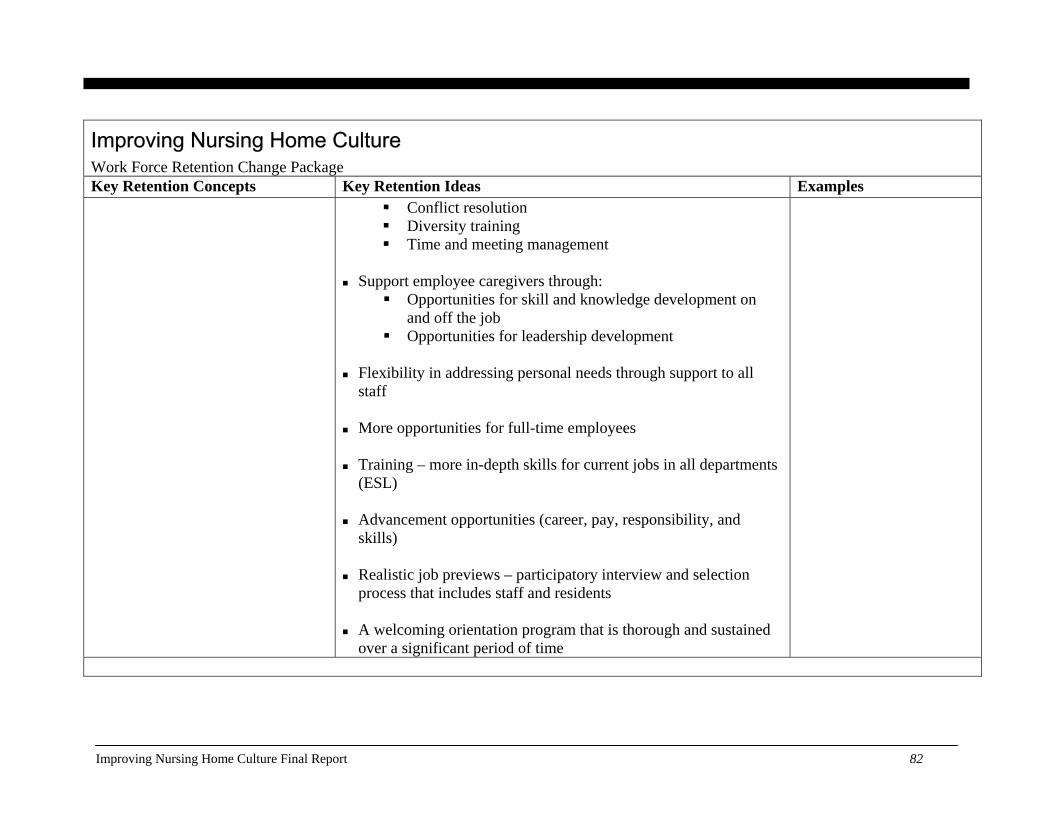
Improving Nursing Home Culture Work Force Retention Change Package Key Retention Concepts Key Retention Ideas Examples
Conflict resolution Diversity training Time and meeting management
Support employee caregivers through:
Opportunities for skill and knowledge development on and off the job
Opportunities for leadership development
Flexibility in addressing personal needs through support to all staff
More opportunities for full-time employees
Training – more in-depth skills for current jobs in all departments
(ESL) Advancement opportunities (career, pay, responsibility, and
skills) Realistic job previews – participatory interview and selection
process that includes staff and residents A welcoming orientation program that is thorough and sustained
over a significant period of time
Improving Nursing Home Culture Final Report 82
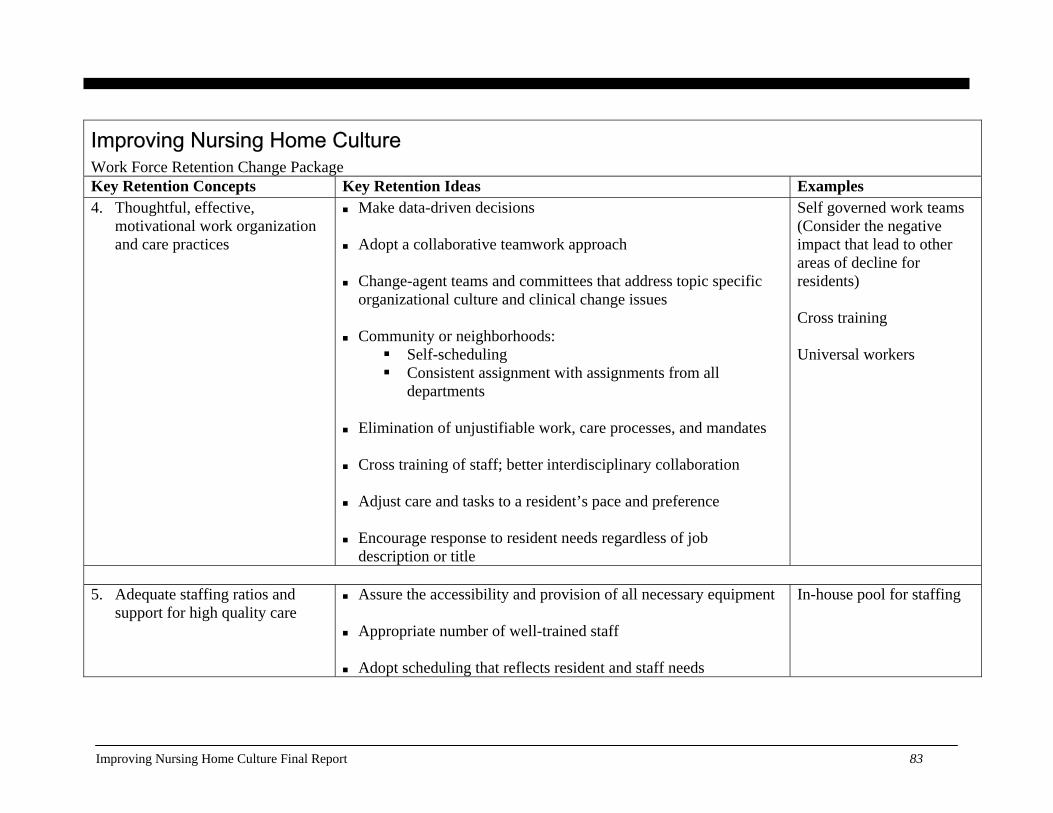
Improving Nursing Home Culture Work Force Retention Change Package Key Retention Concepts Key Retention Ideas Examples 4. Thoughtful, effective,
motivational work organization and care practices
Make data-driven decisions Adopt a collaborative teamwork approach
Change-agent teams and committees that address topic specific
organizational culture and clinical change issues Community or neighborhoods:
Self-scheduling Consistent assignment with assignments from all
departments Elimination of unjustifiable work, care processes, and mandates
Cross training of staff; better interdisciplinary collaboration
Adjust care and tasks to a resident’s pace and preference
Encourage response to resident needs regardless of job
description or title
Self governed work teams (Consider the negative impact that lead to other areas of decline for residents) Cross training Universal workers
5. Adequate staffing ratios and
support for high quality care Assure the accessibility and provision of all necessary equipment
Appropriate number of well-trained staff
Adopt scheduling that reflects resident and staff needs
In-house pool for staffing
Improving Nursing Home Culture Final Report 83
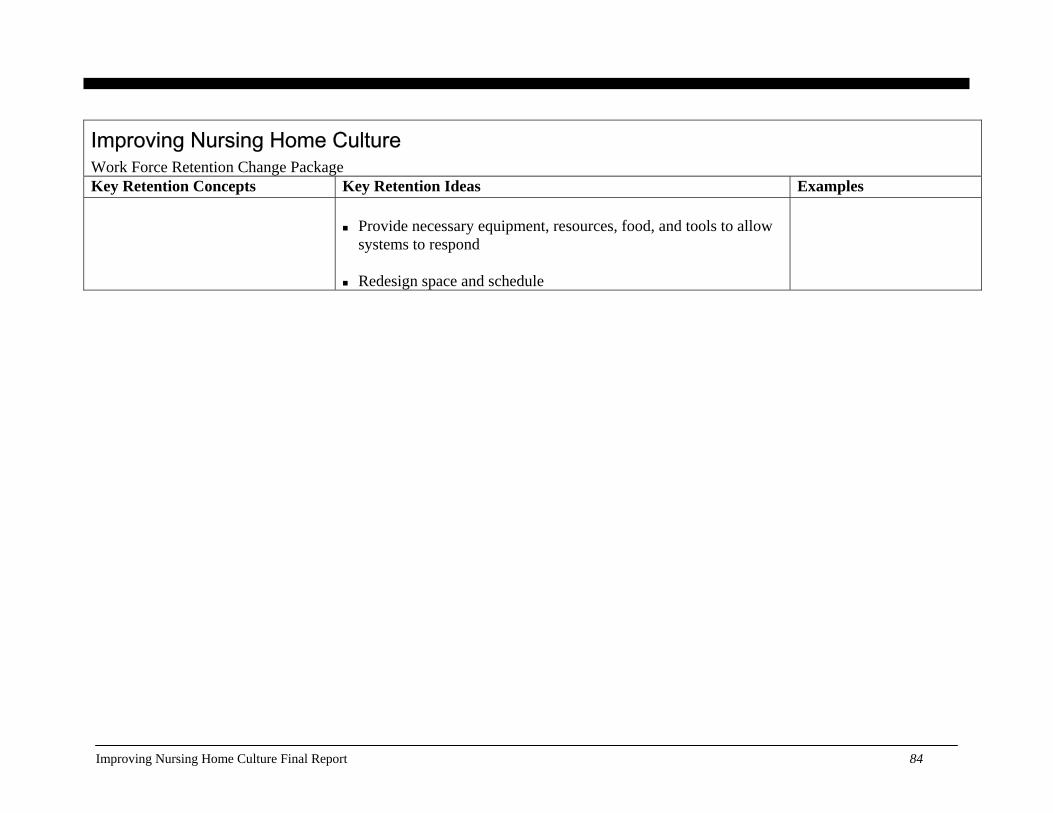
Improving Nursing Home Culture Work Force Retention Change Package Key Retention Concepts Key Retention Ideas Examples
Provide necessary equipment, resources, food, and tools to allow
systems to respond Redesign space and schedule
Improving Nursing Home Culture Final Report 84
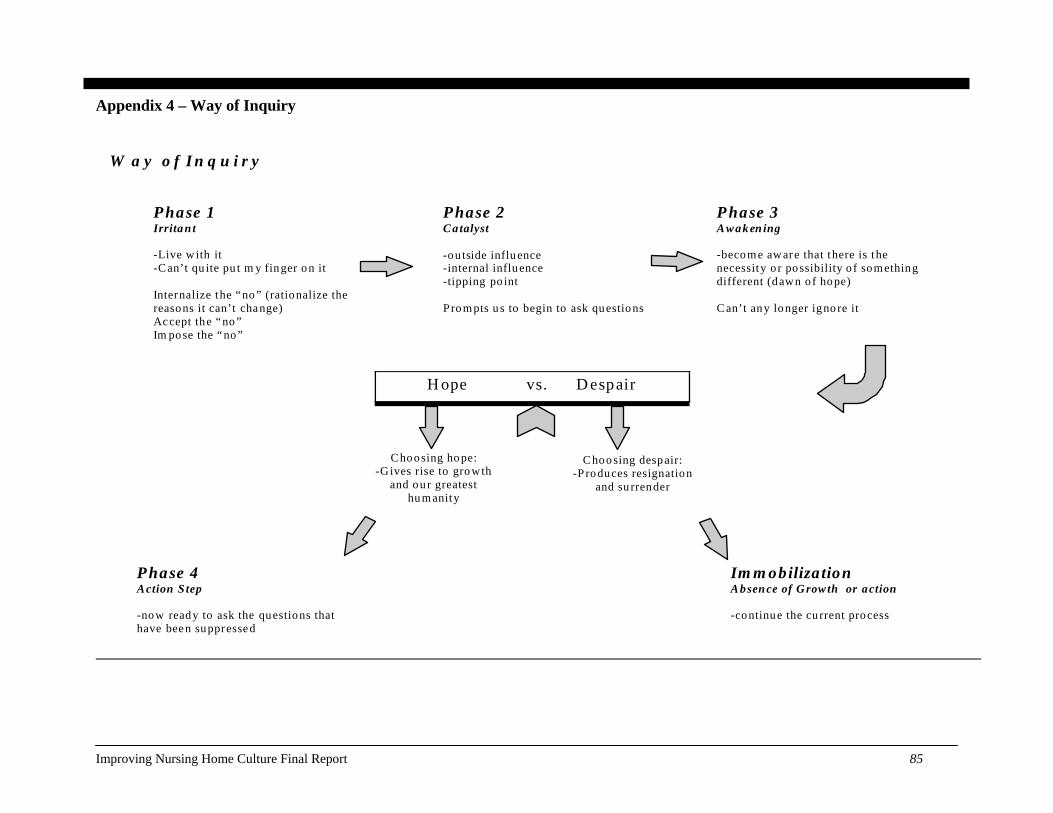
Appendix 4 – Way of Inquiry
W ay of In q u i ry
Phase 1 Irrita n t -Live w ith it -Can’t qu ite pu t m y finger o n it Internalize the “no ” (rationalize the reasons it can’t change) Accept the “no ” Im pose the “no”
Phase 2 Catalyst -ou tside influ ence -internal influ ence -tipping po int P ro m pts u s to begin to ask questio ns
P hase 3 A wak en ing -becom e aw are that there is the necessity o r possibility o f som ething different (dawn o f hope) C an’t any lo nger igno re it
Phase 4 Action S tep -now ready to ask the questions that have been suppressed
Im m obiliza tion Absence of Growth or action -continue the cu rrent process
H ope vs. D espair
C hoosing ho pe: -G ives rise to gro wth
and ou r greatest hu m anity
Choo sing despair: -P roduces resignation
and su rrender
Improving Nursing Home Culture Final Report 85
Appendix 5a – Change Ideas for Bathing
Change Ideas for Creating Pleasant Bathing
Typical issues & evidence of discordance:
• Resident displays anxiety, anguish, and combative behavior • Injuries to both staff and resident
Barriers:
• Bathing is considered a private experience – why is this a barrier? • The bathing experience is physically and emotionally cold • Sterile, institutional, and functional environment
Goals:
• A positive, pleasant, individualized bathing experience, shifting from facility-directed to person-directed bathing and assistance with hygiene.
• To reduce injuries to residents and staff caused by the current facility-centered bathing routine Infrastructure helpful to support the change:
• A team empowered to change practices. Team members include staff members who are directly affected by current bathing practices, with participation from residents and families.
• Adequate supplies for bed baths, showers (particularly enough linen) • Adequate supplies and accessories for making bathing rooms more private, warm and comfortable • Routines built around individualized bathing • Adequate and consistent supply for warm water
Measurement possibilities:
• Number of residents screaming, calling out, vocally or nonverbally registering their disapproval • Number of incident reports related to bathing, including possible injuries to residents and staff • (Need some positive measurements also) • Number of residents who have individualized methods and schedules for bathing or assisting with
hygiene. Questions to consider:
• Would you take a bath here? • How close is our bathing process to the process that you yourself use in your home?
Improving Nursing Home Culture Final Report 86
Change Ideas for Creating Pleasant Bathing
• Is it functional or personal? • What would be the benefits of changing the process? • What would you change?
PDSA Cycle: PLAN: Engage a team of interested and committed people including residents, staff and family members to
make bathing a pleasant , less stressful and less traumatic event for all. DO: A bathroom beautification/deinstitutionalization initiative based on data collected that tracked resident discomfort during bathing. Check with direct-care worker to see if there is enough linen available to keep people warm during bathing Have maintenance fix fluctuations in water temperature and pressure in the showers Provide ways to pad seats and support feet during showers STUDY: The number of agitated residents and/or the number of incident reports related to bathing ACT: Continue to evaluate and explore other potentially comforting change ideas.
Change Ideas:
• Ascertain that all residents receive interventions to help them feel warm and covered regardless of what method of bathing is utilized.
• Ascertain that direct caregivers and supervisors recognize that forced bathing is no longer acceptable and that resistance always triggers an assessment and intervention.
• Ascertain the residents former preferred behaviors, needs and schedule related to bathing. • Ask the residents a series of questions about routines before moving to the nursing home or talking to
family/friends of the resident. • Does the resident need assistance with bathing? If not, resident can bathe on his/her own. • Establish previous preference for bath or shower, time of day, leisurely activity ( cup of coffee, relaxing
music ) vs. functional routine. • Residents should be bathed in accordance with their response. A resident may enjoy bathing while
enjoying drinking a cup of coffee or listening to their favorite type of music The bathing experience should be duplicated as closely as possible.
• Create an environment that contains distractions that are pleasant. Ask the residents what they would like to see in the bathroom. Resident responses may include plants, music and other pleasantries.
• Take strides to create a more familiar and friendly environment by asking the residents what their
Improving Nursing Home Culture Final Report 87
Change Ideas for Creating Pleasant Bathing
bathrooms were like at their own homes before moving into the nursing home. • Consider personal items that can be used in the tub with residents to make the process more pleasant.
Examples include bubble bath, bath salts and bath pillow. • Consider warming lights to avoid residents being chilly when getting out of the tub or shower • Consider what items could make the experience more comfortable, for example warm/soft/fluffy towel
and caring conversation on favorite topics from a trusted, consistent caregiver. • Provide as private an experience as possible by eliminating supplies and equipment storage in the shower
area that will be needed by other staff. • Provide a buffer curtain that will protect privacy. • If at all possible, have only one person in the bathing area at a time • Have consistent caregivers assist with bathing, minimizing the number of caregivers involved, to establish
trust and knowledge about what works best.
Associated principles: • Primary: Create systems within which individual preference is honored and defended • Secondary: Commit to de-institutionalize, wherever possible, the current setting providing personal
living accommodations, a sense of peace, safety and community Resources: 1. Barrick, AL, Rader J, Hoeffer B, Sloane PD. Bathing Without a Battle: Personal Care of Individuals with
Dementia. New York, New York: Springer Publishing Company. 2001. 2. Sloane, P. D., Hoeffer, B., Mitchell, C. M., McKenzie, D. A., Barrick, A. L., Rader, J., Stewart, B. J.,
Talerico, K. A., Rasin, J., Zink, R. C., Koch, G. G. (2004). Effect of person-centered showering and the towel bath on bathing-associated aggression, agitation and discomfort in nursing home residents with dementia: A randomized, controlled trial. Journal of the American Geriatrics Society, 52:1795-1804.
Contributors Joanne Rader, Barbara Frank, Cathie Brady, and Marguerite McLaughlin
Improving Nursing Home Culture Final Report 88
Appendix 5b – Change Ideas for Death and Dying
Change Ideas for Death and Dying
Typical issues and evidence of discordance:
Dying in a nursing home can be a cold, isolated event not in any way reflective of a celebration of one’s life. An elder’s condition is often kept hidden. Upon death, doors are closed and bodies taken out through a side entrance in an attempt to shield other residents from the death. A resident’s death can be emotionally taxing on caregivers. Staff care about the people they care for but are often given little room for grieving or acknowledgment of loss. There is little opportunity for closure. Residents see how the deaths of others are handled and know this is how their end will be.
Barriers:
Death and dying is an issue with which our culture is uncomfortable. This discomfort is passed on to an environment where it is a large and looming aspect of daily life. Dying is a fact of life, all the more so in nursing homes, and yet the taboos of society infiltrate the nursing home preventing it from providing space for the healing and reconciliation that is a developmental task of old age. Many times information pertaining to death is withheld because of a misconception of HIPPA regulations; however, deaths, like births are a matter of public record. Additionally, there is a tacit understanding that it is unprofessional to express one’s sadness over the death of an elder. Equally complex is the denial that a relationship existed between staff and elder.
Goal:
• To support people in dying with dignity and caring, and to acknowledge and console people in the nursing home community in their losses.
Infrastructure helpful to support the change:
• Invite a committed team of individuals including staff, families and elders to begin conversations that identify the current process and who can create a vision for the changes needed
• A chaos-free atmosphere (consider issues related to overhead paging, body alarms, call lights, etc.) Measurement possibilities:
• Family/staff feelings of support, appropriate closure, and grieving. • Noting current practice vs. changes adopted proving supportive practices are effective. • The number of people who die alone.
Improving Nursing Home Culture Final Report 89

Change Ideas for Death and Dying
PDSA Cycles:
PLAN: Engage a team to discuss and explore ways to support, acknowledge, and console people in the nursing home community. DO: Create rituals and memorials that offer opportunities for people to express their grief. Consider a handmade quilt for the body as it leaves the building, decorative boxes for personal effects, a memorial book to give to the family, and a memorial service for staff, family, and friends. STUDY: By survey, determine if people feel a greater sense of support by having these artifacts available. ACT: Continue to explore other possibilities to bring comfort and support.
Questions to consider:
• Do we support the dying elder, staff, family, and friends physically, mentally, and spiritually? • In what ways do we help to keep the process cold, isolated, and hidden? • In what ways can we acknowledge and honor death? • What resources do we provide to assist all parties? • How can the organization honor the death of community members? • Are there rituals that we can create to assist the dying elder, staff, family, and friends? • Do we know how each elder would like to be remembered? • How is communication handled about the dying of an elder and the death of an elder?
Change Ideas:
• Create a culture that considers death a natural part of life and create ways to acknowledge and honor it. • Create a relationship with religious professionals who can provide support on an organizational basis • Establish a comfort service for families that includes a cart, refreshed frequently with small snacks,
beverages etc. Include a CD player with music, hand cream, appropriate books, freshening wipes, and religious items if desired.
• Provide staff with the opportunity to be with the dying person. • Support through hospice education
Resources: 1. Teno JM, Casey VA, Welch LC, Edgman-Levitan S. Patient-focused, family-centered end-of-life
medical care: views of the guidelines and bereaved family members. J Pain Symptom Manage 2001 Sep; 22 (3): 738-51.
Improving Nursing Home Culture Final Report 90
Appendix 5c – Change Ideas for Sleeping and Waking
Change Ideas for Sleeping and Waking Typical issues and evidence of discordance:
Residents are awakened and put to bed according to the facility’s schedule. To ease the burden on the in-coming day staff, the night shift awakens some residents. Sleeping residents are awakened during the night to take temperatures, give medications, monitor for incontinence, insert suppositories, or even to hydrate them. Some homes have gone so far as to have the night staff provide care such as clipping toenails. Sleep, for many residents, is compromised by bed alarms. Facility floors are cleaned and shined with noisy machinery during the night when hallways are clear. Residents who are sleep deprived experience a range of typical effects of sleep deprivation: lethargy, loss of appetite, depression, anxiety, agitation combative behavior, and other declines. Medications given in response to these effects, or to help residents sleep, often times exacerbate the situation.
Barriers:
The facility’s care routines unwittingly deprive residents of deep restful sleep. These care routines are at the heart of the nursing home’s culture. All work and assignments are organized around these routines. To change them will have an impact on the facility as a whole. The care routines continue because staff is not aware of the iatrogenic affects of sleep deprivation.
Goal:
To support residents’ health and well being by helping them have deep sleep through the night, by shifting from institutionally driven routines to routines that follow people’s natural rhythms of sleeping and waking. Another goal is to support better relationships between residents and their caregivers by allowing caregivers to respect people’s individual routines and set their care giving schedules around what works for each resident.
Infrastructure helpful to support the change:
Establish a work group with staff from all departments to identify and implement the changes needed in order for residents to return to their natural patterns for sleeping and waking. Adjust clinical care, staffing schedules, and routines for food service, housekeeping and maintenance to accommodate individual residents’ needs and preferences related to sleeping and waking routines. Establish a system for learning about people’s patterns as part of the welcoming in to the nursing home for new residents.
Measurement • Number of residents who sleep through the night.
Improving Nursing Home Culture Final Report 91
Change Ideas for Sleeping and Waking possibilities:
• Number of residents who wake of their own accord. • Pre and post data on agitated behavior; anxiety meds; bowel and bladder continence; UTI’s; skin care;
weight change; mobility; social engagement; staff-resident relationships; staff workload. PDSA Cycles:
PLAN: Engage a committed group of people to consider, discuss and explore better sleep hygiene for residents based on residents obvious sleep deprivation and associated problems. DO: Track the sleep of five resident volunteers who have minimal medical, hydration or treatment needs. These volunteers will be given the opportunity to awaken by their own natural body clock for two weeks. STUDY: What time they awaken over the two weeks, mood, and appetite using simple tools. Determine if residents have a greater sense of rest and peace. ACT: Consider a small group of people who have incontinence to initiate the next cycle. Explore how to maintain skin integrity while allowing for better sleep.
Questions to consider:
• Would you be comfortable sleeping here? With this bed and pillow? • How can sleep be made comfortable? • What could be improved in the following: lighting, noise, bed comfort, privacy, and clinical care to help
with sleep? • What is the importance of sleep hygiene for physical and mental well being? • What negative outcomes are we causing by constantly interrupting the sleep of our residents? • What are the medical consequences of sleep deprivation on health and well being? • How would residents and staff benefit from how awakening happens? • What evening activity and food do people who like to stay up want available? • What are all the factors that must be considered from each department in order to make this change? • Where could you start your change process? •
Change Ideas:
• Ascertain the resident’s preferred patterns, needs and schedule related to waking and sleeping. • Take the time to allow the resident’s own inner clock to be re-set. If a resident has been awakened every
day at 5:30 for the past two years it will take a couple of weeks for the residents own internal clock to be re-set.
• Figure out with each resident what would be needed for comfortable sleep.
Improving Nursing Home Culture Final Report 92
Change Ideas for Sleeping and Waking • Create an environment that is soothing and conducive to good sleep hygiene. Think about lighting and
noise. Bright hallway lights can be dimmed and floor cleaning can be completed during the day. • Chart all the factors that interrupt each resident’s sleep.
• Assess which clinical routines can be easily completed at another time. Start with the easiest situations to change and progress to the more clinically complex situations as you gain experience.
• Work with staffing patterns to adjust to the changes in workload. • Explore ways to ensure skin integrity, continence, and other clinical needs without compromising sleep. • Seek an interdisciplinary approach to residents’ healthy sleeping, and to contribute to positive clinical
outcomes. For example, instead of suppositories during the night shift, provide bran muffins, prunes, fluids, exercise opportunities throughout the day, and reduce medications that may cause constipation.
Resources: 1. Cruise PA, Schnelle JF, Alessi CA, Simmons SF, Ouslander JG. The nighttime environment and
incontinence care practices in nursing homes. J Am Geriatr Soc 1998 Feb; 46 (2): 181-6. 2. Esser S, Wiles A, Taylor H, et al. The sleep of older people in hospital and nursing homes. J Clin Nurs
1999; 8: 360-8. 3. O’Rourke DJ, Klaasen KS, Sloan JA. Redesigning nighttime care for personal care residents. J Gerontol
Nurs 2001 Jul; 27 (7): 30-7.
Improving Nursing Home Culture Final Report 93
Appendix 5d – Change Ideas for Consistent Assignment
Change Ideas for Consistent Assignment Typical issues and evidence of discordance:
When employees are not given a consistent assignment they do not build relationships with their co-workers or with residents. Rotating staff means that each time there is a rotation or change in assignment the staff person has to take the time to figure out what the needs are of each new resident they are caring for and how to work with their co-workers for the day. This constant changing is hard for both residents and staff. Most of the care being done is very intimate personal care and residents find it hard to have strangers caring for their intimate needs, and to have to explain their needs time after time to new caregivers. When staff is unfamiliar with each other it is harder for them to have good teamwork together.
Definition: Consistent assignment (sometimes called primary or permanent assignment) refers to the same caregivers (RNs,
LPNs, CNAs) consistently caring for the same residents almost (80% of their shifts) every time they are on duty. The opposite of consistent assignment is the practice of rotating staff from one group of residents to the next after a certain period of time (weekly, monthly or quarterly). Facilities who have adopted consistent assignment never rotate their staff.
Barriers:
Many times frequent changes in shift and assignment are the result of short staffing. When there is not enough staff, the organization responds by plugging holes in the schedule with an available CNA. In other situations the policy of the nursing home is not to let people get attached to each other in the mistaken belief that if a close relationship develops and the resident dies the staff member will be inconsolable. Certain nursing homes don’t think friends should work together. Still others prefer that everyone is trained on every unit and available everywhere. Others do not want staff to be “stuck” with “hard-to-care-for” residents. Ironically, inconsistent assignment exacerbates instability in staffing and conversely, consistent assignment fosters stability. Call outs and turnover are reduced when meaningful relationships develop in which workers know they are being counted on and respond by making sure that the care that is needed is given.
Goal:
• To strengthen and honor care-giving relationships • To stabilize staffing and establish strong relationships between residents and staff and among co-workers to
provide continuity, consistency, and familiarity in care giving.
Improving Nursing Home Culture Final Report 94
Change Ideas for Consistent Assignment Measurement possibilities:
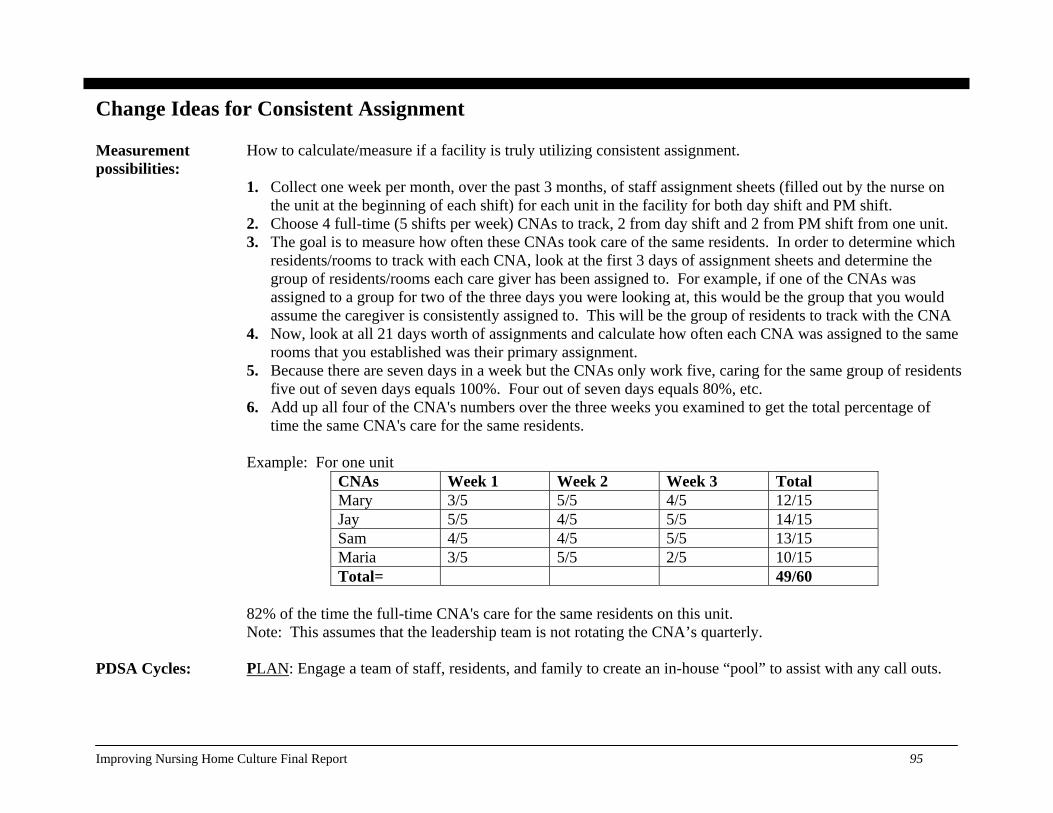
How to calculate/measure if a facility is truly utilizing consistent assignment. 1. Collect one week per month, over the past 3 months, of staff assignment sheets (filled out by the nurse on
the unit at the beginning of each shift) for each unit in the facility for both day shift and PM shift. 2. Choose 4 full-time (5 shifts per week) CNAs to track, 2 from day shift and 2 from PM shift from one unit. 3. The goal is to measure how often these CNAs took care of the same residents. In order to determine which
residents/rooms to track with each CNA, look at the first 3 days of assignment sheets and determine the group of residents/rooms each care giver has been assigned to. For example, if one of the CNAs was assigned to a group for two of the three days you were looking at, this would be the group that you would assume the caregiver is consistently assigned to. This will be the group of residents to track with the CNA
4. Now, look at all 21 days worth of assignments and calculate how often each CNA was assigned to the same rooms that you established was their primary assignment.
5. Because there are seven days in a week but the CNAs only work five, caring for the same group of residents five out of seven days equals 100%. Four out of seven days equals 80%, etc.
6. Add up all four of the CNA's numbers over the three weeks you examined to get the total percentage of time the same CNA's care for the same residents.
Example: For one unit
CNAs Week 1 Week 2 Week 3 Total Mary 3/5 5/5 4/5 12/15Jay 5/5 4/5 5/5 14/15Sam 4/5 4/5 5/5 13/15Maria 3/5 5/5 2/5 10/15Total= 49/60
82% of the time the full-time CNA's care for the same residents on this unit. Note: This assumes that the leadership team is not rotating the CNA’s quarterly.
PDSA Cycles:
PLAN: Engage a team of staff, residents, and family to create an in-house “pool” to assist with any call outs.
Improving Nursing Home Culture Final Report 95
Change Ideas for Consistent Assignment DO: Provide monetary incentive STUDY: Keep a log of facility call-outs for a set amount of time. Determine what is working and what is not working. ACT: Continue utilizing the in-house “pool” and take additional steps to provide incentive.
Questions to consider:
• How does familiarity and routine help increase comfort and competence? • How important are relationships to residents? To caregivers? To co-workers? To quality care? • How does teamwork help improve care? • Would you like different people toileting and bathing you each day? • Would you like having a different team each day? • What do residents experience when they have frequent changes in their caregivers? • What do staff experience when their assignment is routinely changed? How does that affect their
relationship to their work? Change Ideas:
• Make a mutual commitment to consistent assignment – for staff that commit to a certain set schedule, commit back that they can count on that schedule.
• Find out from staff what their preferred schedule and assignments would be. • Create teams that work regularly together. • Ask teams to work with each other to provide back-ups and substitutes for when they need to change their
schedule or call in on a scheduled shift. • Find out who on staff enjoys floating or prefers various assignments rather than destabilizing the whole
staff by making everyone float. • Have inter-shift communications among all staff from each work area, in which personal information about
how each resident did for the day is shared, so as to ensure a smooth hand-off. • Figure out when the busiest times are in accordance with the residents’ patterns, and adjust schedules to
have the help that’s needed during those times. • Have regular housekeeping and food-service staff working with each care area. • When new staff is brought on, assign them to one work area so that they are familiar with a group of
residents and co-workers and acclimate to the work with them. Process to change 1. Call two meetings, one with all of the CNA’s from the day shift and one with all of the CNA’s from the
Improving Nursing Home Culture Final Report 96
Change Ideas for Consistent Assignment from rotating assignment to consistent assignment:
night shift. 2. Begin the meeting by explaining that nursing homes that have switched to consistent assignment have
proven to the improve quality of care and life of the residents and the quality of work life for the staff. Suggest that we pilot test consistent assignment and see how it works.
3. Place each residents name on a post it note and place all of the post it notes on the wall. 4. Next, ask the group to rank each of the residents by degree of difficulty with number 1 being relatively easy
to care, number 3 in the middle and number 5 being very difficult to care for (time consuming, emotionally draining, etc…). Let the CNA’s discuss each resident and come to an agreement. Write the number on the resident’s post it note.
5. Then, allow the CNA’s to select their assignments. Assignments are fair when the numbers assigned to each resident add up to the other totals of the other CNA assignments. Therefore, if one assignment has six residents and another has eight residents but the degree of difficulty numbers total 27 then the assignments are fair. Relationships with residents are important and also should be part of the decision making process. The sequence of rooms is less important.
6. Meet every three months to reexamine that the assignments, based upon degree of difficulty, are still fair. Associated principles
• Relationships are the cornerstone of culture change. • Residents who are cared for by the same staff members come to see the people who care for them as
“family.” • Staff that care for the same residents form a relationship and get great satisfaction from their work. • When staff care for the same people daily they become familiar with their needs and desires in an entirely
different way—and their work is easier because they are not spending extra time getting to know what the resident wants—they know from their own experience with the resident.
• When staff and residents know each other well, heir relationship makes it possible for care and services to be directed by the resident’s routines, preferences, and needs.
• Relationships form over time – we do not form relationships with people we infrequently see. To encourage and support relationships, consistent assignment of both primary staff and ancillary staff is recommended.
• When staff routinely work together, they can problem-solve and find creative ways to re-organize daily living in their care area.
• Consistent assignment forms the building block for neighborhood-based living.
Improving Nursing Home Culture Final Report 97
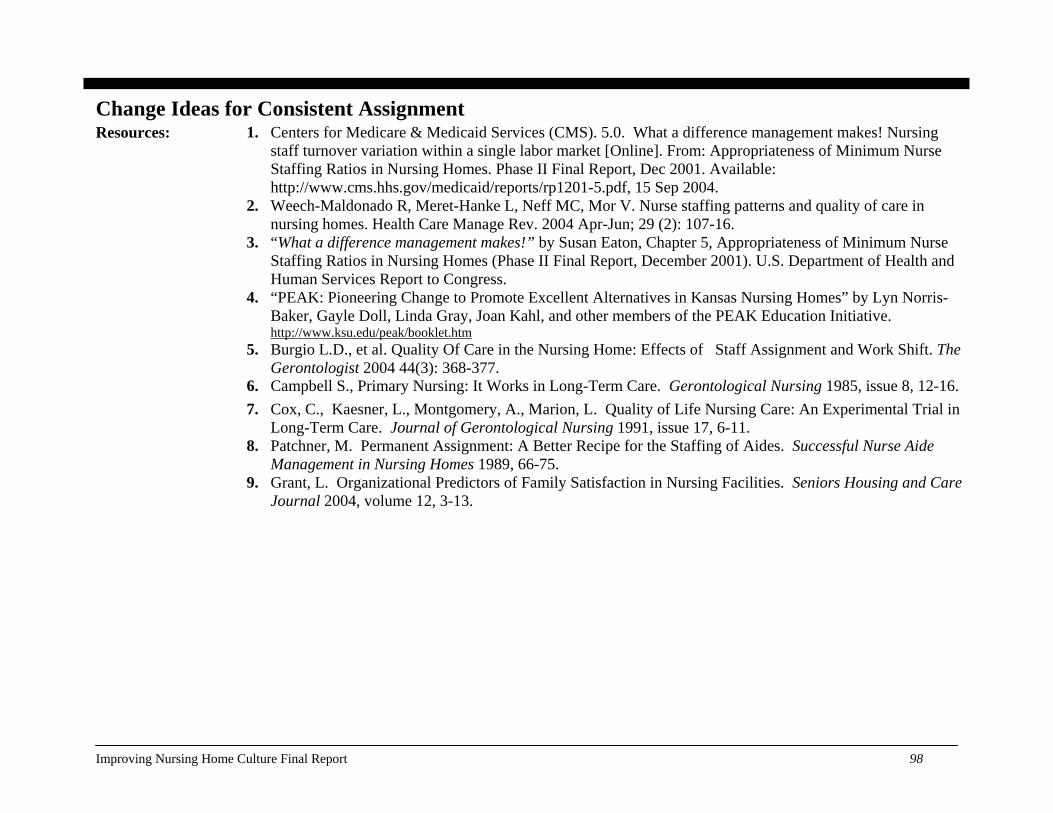
Change Ideas for Consistent Assignment Resources: 1. Centers for Medicare & Medicaid Services (CMS). 5.0. What a difference management makes! Nursing
staff turnover variation within a single labor market [Online]. From: Appropriateness of Minimum Nurse Staffing Ratios in Nursing Homes. Phase II Final Report, Dec 2001. Available: http://www.cms.hhs.gov/medicaid/reports/rp1201-5.pdf, 15 Sep 2004.
2. Weech-Maldonado R, Meret-Hanke L, Neff MC, Mor V. Nurse staffing patterns and quality of care in nursing homes. Health Care Manage Rev. 2004 Apr-Jun; 29 (2): 107-16.
3. “What a difference management makes!” by Susan Eaton, Chapter 5, Appropriateness of Minimum Nurse Staffing Ratios in Nursing Homes (Phase II Final Report, December 2001). U.S. Department of Health and Human Services Report to Congress.
4. “PEAK: Pioneering Change to Promote Excellent Alternatives in Kansas Nursing Homes” by Lyn Norris-Baker, Gayle Doll, Linda Gray, Joan Kahl, and other members of the PEAK Education Initiative. http://www.ksu.edu/peak/booklet.htm
5. Burgio L.D., et al. Quality Of Care in the Nursing Home: Effects of Staff Assignment and Work Shift. The Gerontologist 2004 44(3): 368-377.
6. Campbell S., Primary Nursing: It Works in Long-Term Care. Gerontological Nursing 1985, issue 8, 12-16. 7. Cox, C., Kaesner, L., Montgomery, A., Marion, L. Quality of Life Nursing Care: An Experimental Trial in
Long-Term Care. Journal of Gerontological Nursing 1991, issue 17, 6-11. 8. Patchner, M. Permanent Assignment: A Better Recipe for the Staffing of Aides. Successful Nurse Aide
Management in Nursing Homes 1989, 66-75. 9. Grant, L. Organizational Predictors of Family Satisfaction in Nursing Facilities. Seniors Housing and Care
Journal 2004, volume 12, 3-13.
Improving Nursing Home Culture Final Report 98
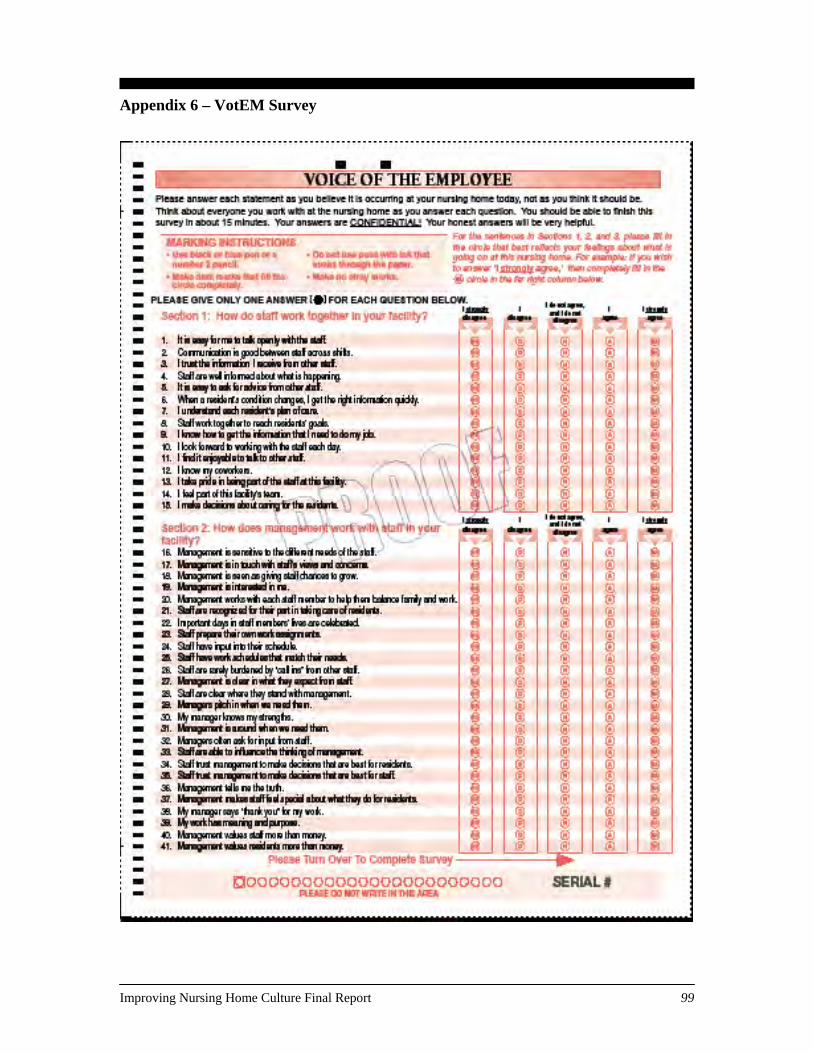
Appendix 6 – VotEM Survey
Improving Nursing Home Culture Final Report 99
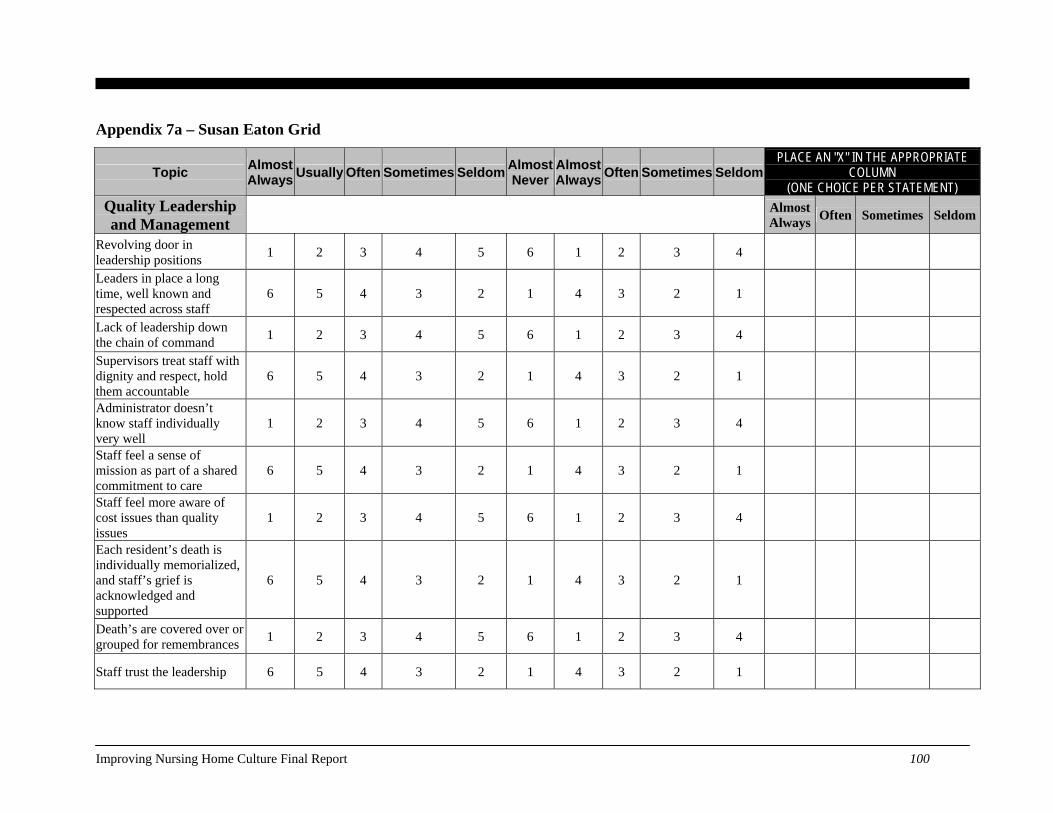
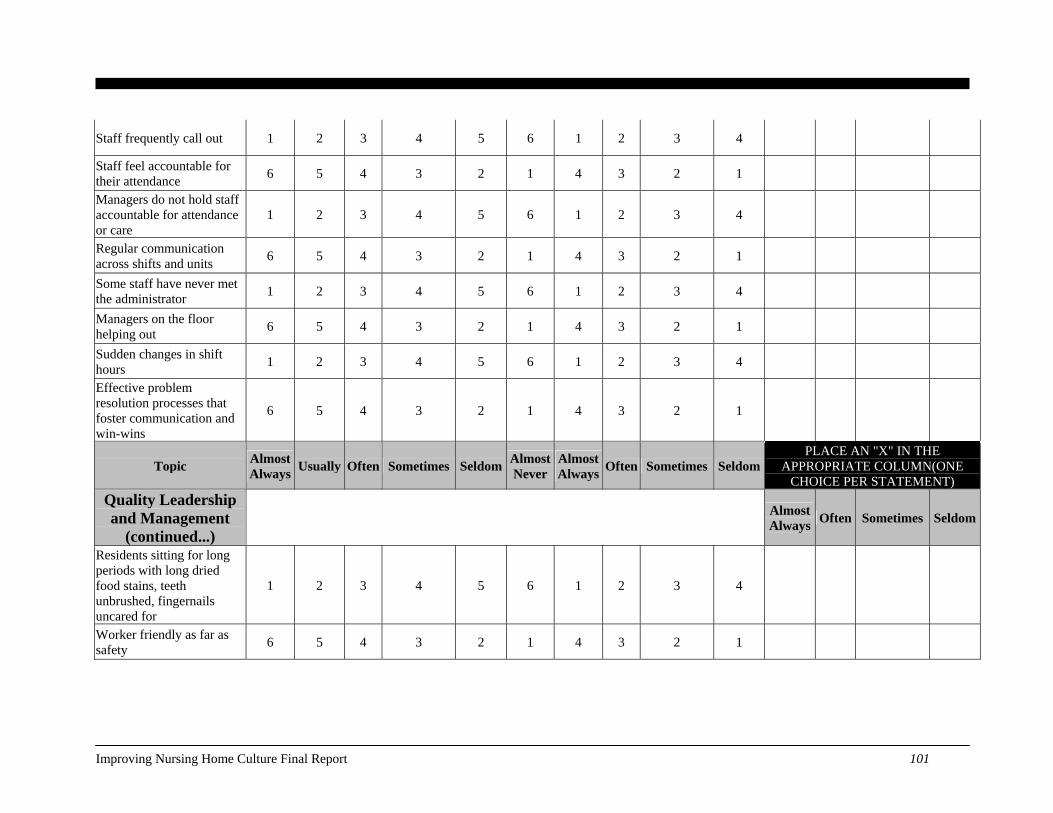
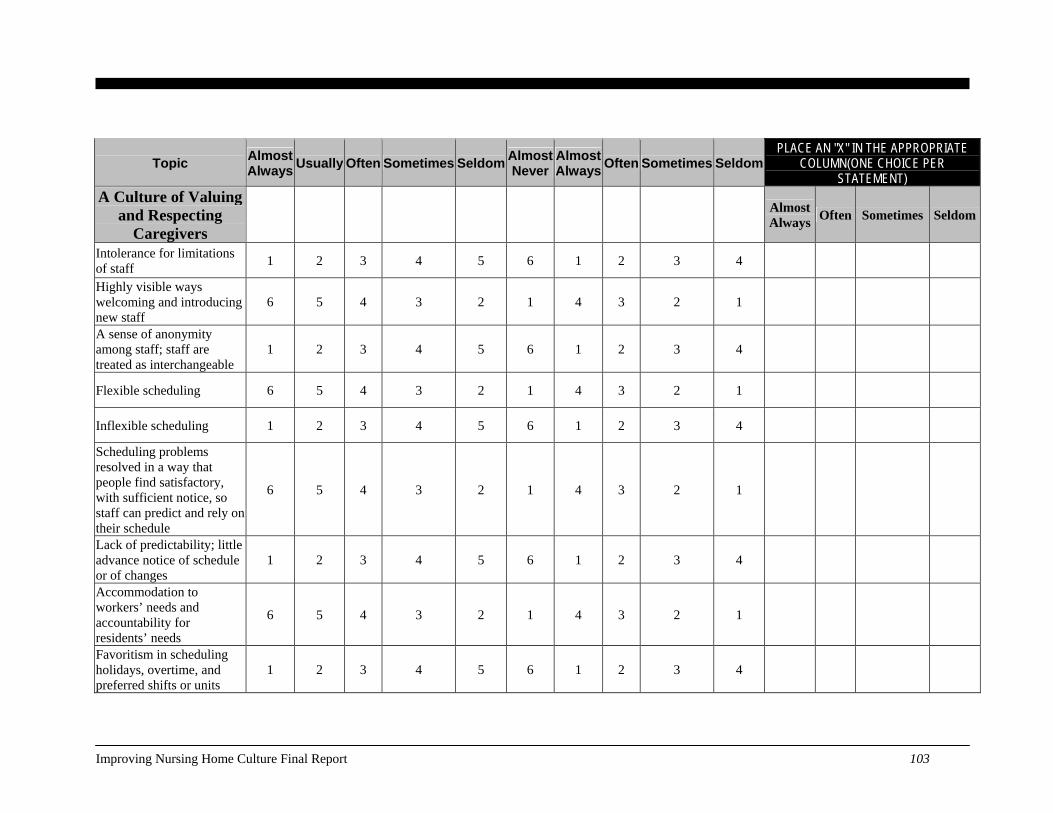
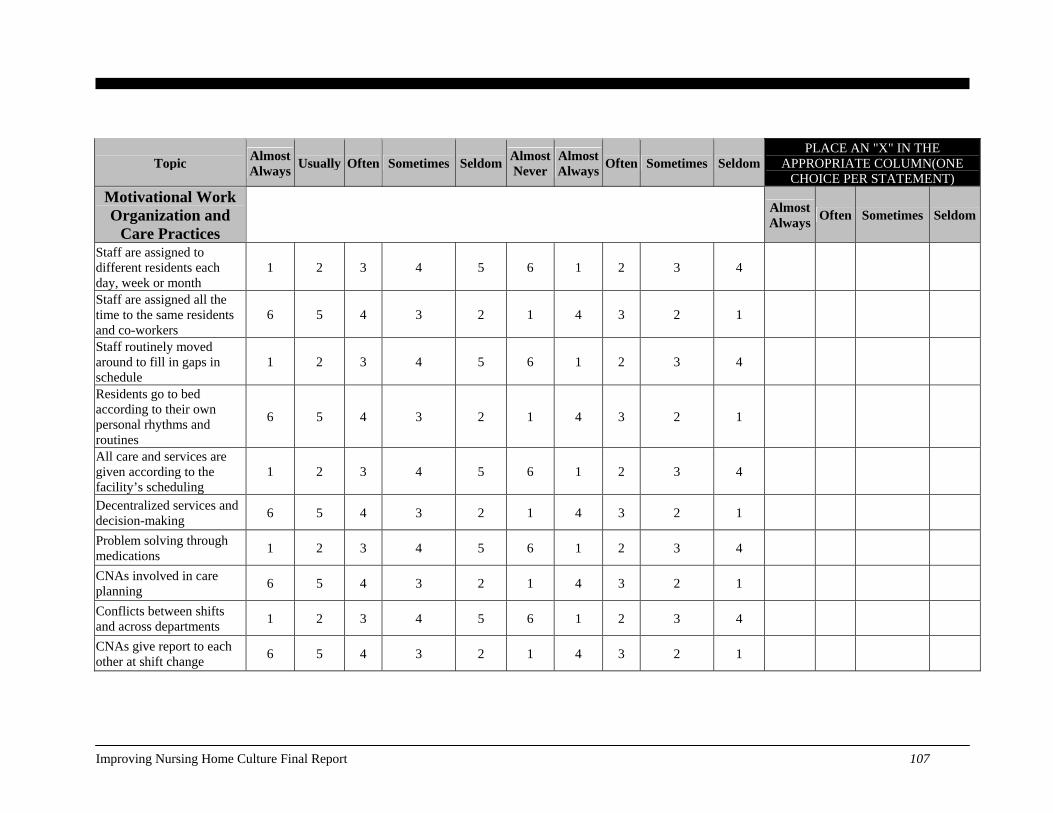
Appendix 7a – Susan Eaton Grid
Topic Almost Always Usually Often Sometimes Seldom Almost
NeverAlmost Always Often Sometimes Seldom
PLACE AN "X" IN THE APPROPRIATE COLUMN
(ONE CHOICE PER STATEMENT) Quality Leadership and Management Almost
Always Often Sometimes Seldom
Revolving door in leadership positions 1 2 3 4 5 6 1 2 3 4
Leaders in place a long time, well known and respected across staff
6 5 4 3 2 1 4 3 2 1
Lack of leadership down the chain of command 1 2 3 4 5 6 1 2 3 4
Supervisors treat staff with dignity and respect, hold them accountable
6 5 4 3 2 1 4 3 2 1
Administrator doesn’t know staff individually very well
1 2 3 4 5 6 1 2 3 4
Staff feel a sense of mission as part of a shared commitment to care
6 5 4 3 2 1 4 3 2 1
Staff feel more aware of cost issues than quality issues
1 2 3 4 5 6 1 2 3 4
Each resident’s death is individually memorialized, and staff’s grief is acknowledged and supported
6 5 4 3 2 1 4 3 2 1
Death’s are covered over or grouped for remembrances 1 2 3 4 5 6 1 2 3 4
Staff trust the leadership 6 5 4 3 2 1 4 3 2 1
Improving Nursing Home Culture Final Report 100
Staff frequently call out 1 2 3 4 5 6 1 2 3 4
Staff feel accountable for their attendance 6 5 4 3 2 1 4 3 2 1
Managers do not hold staff accountable for attendance or care
1 2 3 4 5 6 1 2 3 4
Regular communication across shifts and units 6 5 4 3 2 1 4 3 2 1
Some staff have never met the administrator 1 2 3 4 5 6 1 2 3 4
Managers on the floor helping out 6 5 4 3 2 1 4 3 2 1
Sudden changes in shift hours 1 2 3 4 5 6 1 2 3 4
Effective problem resolution processes that foster communication and win-wins
6 5 4 3 2 1 4 3 2 1
Topic Almost Always Usually Often Sometimes Seldom Almost
NeverAlmost Always Often Sometimes Seldom
PLACE AN "X" IN THE APPROPRIATE COLUMN(ONE
CHOICE PER STATEMENT) Quality Leadership and Management
(continued...) Almost
Always Often Sometimes Seldom
Residents sitting for long periods with long dried food stains, teeth unbrushed, fingernails uncared for
1 2 3 4 5 6 1 2 3 4
Worker friendly as far as safety 6 5 4 3 2 1 4 3 2 1
Improving Nursing Home Culture Final Report 101

Emergency loans, other assistance with personal life traumas/needs
6 5 4 3 2 1 4 3 2 1
Management believes for staff that, “it’s more important that they be able to take care of their families and themselves.”
6 5 4 3 2 1 4 3 2 1
Punitive if too much time off needed 1 2 3 4 5 6 1 2 3 4
Managers allow room for innovation and creativity 6 5 4 3 2 1 4 3 2 1
CNAs have little respect for their supervisors and supervisors have little respect for their CNAs
1 2 3 4 5 6 1 2 3 4
Staff feel supervisors are open and approachable, give positive feedback when due
6 5 4 3 2 1 4 3 2 1
Staff feel appreciations are empty 1 2 3 4 5 6 1 2 3 4
There’s a feeling of good teamwork throughout the building – “we help each other, we eat together, and we go back and forth together”
6 5 4 3 2 1 4 3 2 1
Topic Total - 0
Improving Nursing Home Culture Final Report 102
Topic Almost Always Usually Often Sometimes Seldom Almost
NeverAlmost Always Often Sometimes Seldom
PLACE AN "X" IN THE APPROPRIATE COLUMN(ONE CHOICE PER
STATEMENT) A Culture of Valuing
and Respecting Caregivers
Almost Always Often Sometimes Seldom
Intolerance for limitations of staff 1 2 3 4 5 6 1 2 3 4
Highly visible ways welcoming and introducing new staff
6 5 4 3 2 1 4 3 2 1
A sense of anonymity among staff; staff are treated as interchangeable
1 2 3 4 5 6 1 2 3 4
Flexible scheduling 6 5 4 3 2 1 4 3 2 1
Inflexible scheduling 1 2 3 4 5 6 1 2 3 4
Scheduling problems resolved in a way that people find satisfactory, with sufficient notice, so staff can predict and rely on their schedule
6 5 4 3 2 1 4 3 2 1
Lack of predictability; little advance notice of schedule or of changes
1 2 3 4 5 6 1 2 3 4
Accommodation to workers’ needs and accountability for residents’ needs
6 5 4 3 2 1 4 3 2 1
Favoritism in scheduling holidays, overtime, and preferred shifts or units
1 2 3 4 5 6 1 2 3 4
Improving Nursing Home Culture Final Report 103
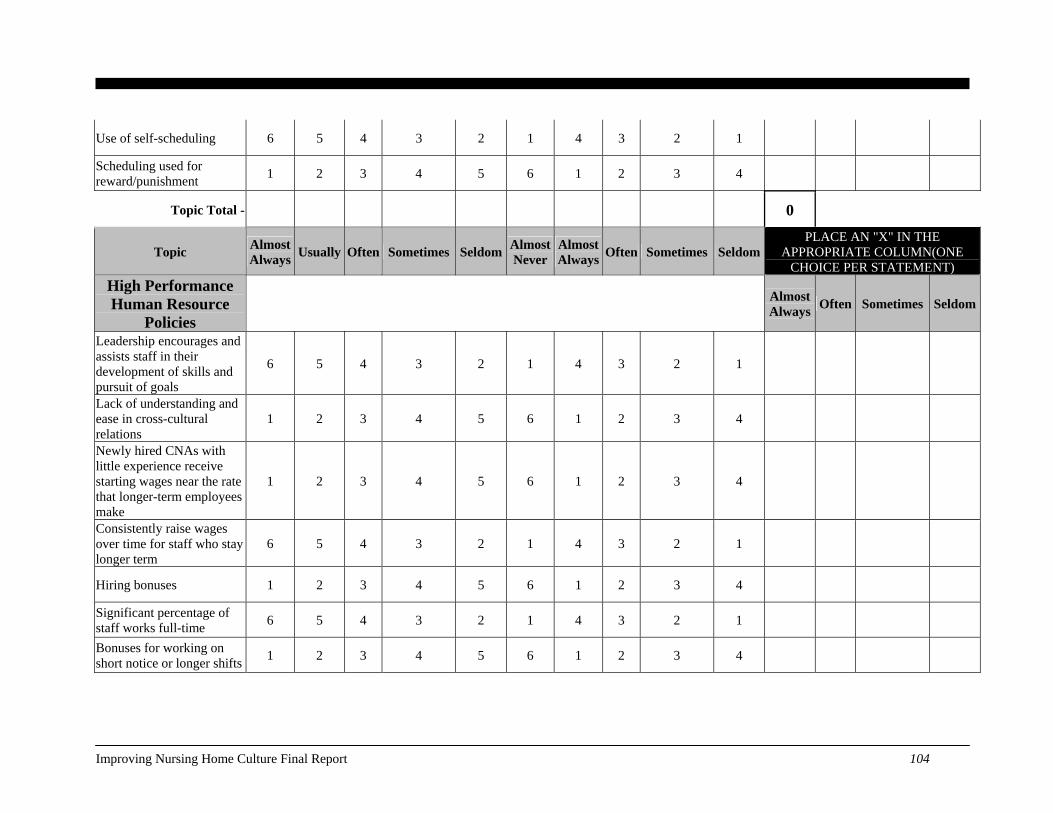
Use of self-scheduling 6 5 4 3 2 1 4 3 2 1
Scheduling used for reward/punishment 1 2 3 4 5 6 1 2 3 4
Topic Total - 0
Topic Almost Always Usually Often Sometimes Seldom Almost
NeverAlmost Always Often Sometimes Seldom
PLACE AN "X" IN THE APPROPRIATE COLUMN(ONE
CHOICE PER STATEMENT) High Performance Human Resource
Policies Almost
Always Often Sometimes Seldom
Leadership encourages and assists staff in their development of skills and pursuit of goals
6 5 4 3 2 1 4 3 2 1
Lack of understanding and ease in cross-cultural relations
1 2 3 4 5 6 1 2 3 4
Newly hired CNAs with little experience receive starting wages near the rate that longer-term employees make
1 2 3 4 5 6 1 2 3 4
Consistently raise wages over time for staff who stay longer term
6 5 4 3 2 1 4 3 2 1
Hiring bonuses 1 2 3 4 5 6 1 2 3 4
Significant percentage of staff works full-time 6 5 4 3 2 1 4 3 2 1
Bonuses for working on short notice or longer shifts 1 2 3 4 5 6 1 2 3 4
Improving Nursing Home Culture Final Report 104
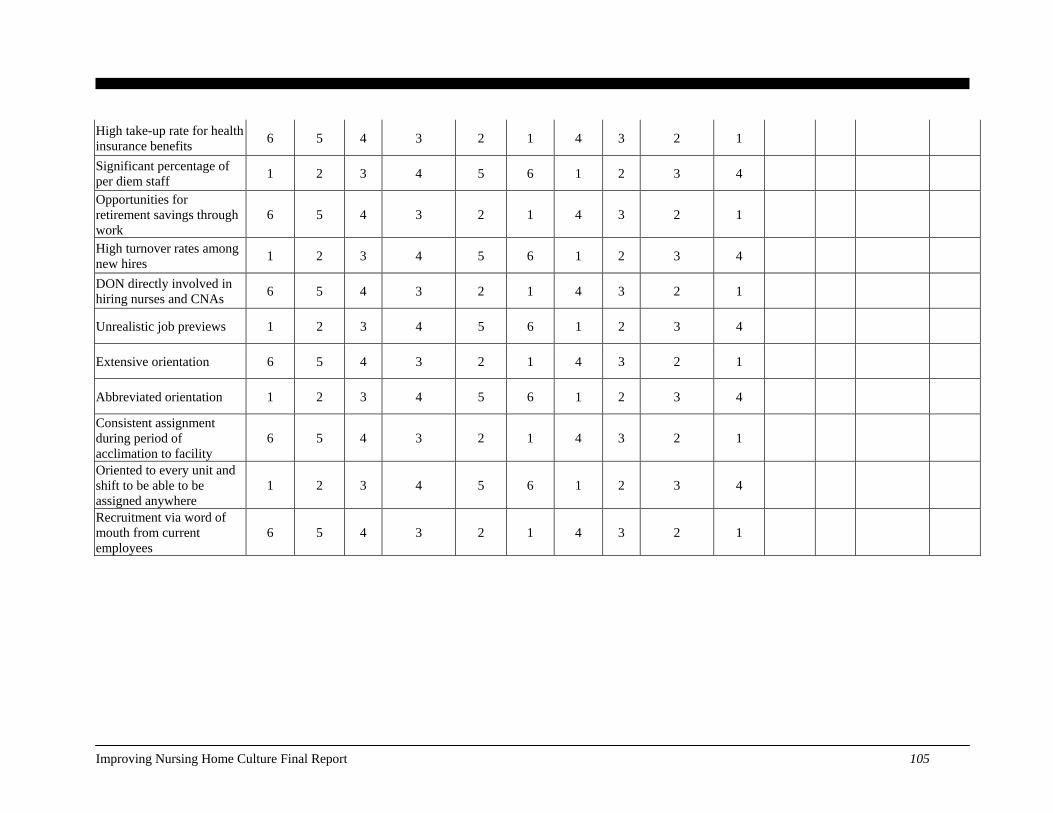
High take-up rate for health insurance benefits 6 5 4 3 2 1 4 3 2 1
Significant percentage of per diem staff 1 2 3 4 5 6 1 2 3 4
Opportunities for retirement savings through work
6 5 4 3 2 1 4 3 2 1
High turnover rates among new hires 1 2 3 4 5 6 1 2 3 4
DON directly involved in hiring nurses and CNAs 6 5 4 3 2 1 4 3 2 1
Unrealistic job previews 1 2 3 4 5 6 1 2 3 4
Extensive orientation 6 5 4 3 2 1 4 3 2 1
Abbreviated orientation 1 2 3 4 5 6 1 2 3 4
Consistent assignment during period of acclimation to facility
6 5 4 3 2 1 4 3 2 1
Oriented to every unit and shift to be able to be assigned anywhere
1 2 3 4 5 6 1 2 3 4
Recruitment via word of mouth from current employees
6 5 4 3 2 1 4 3 2 1
Improving Nursing Home Culture Final Report 105
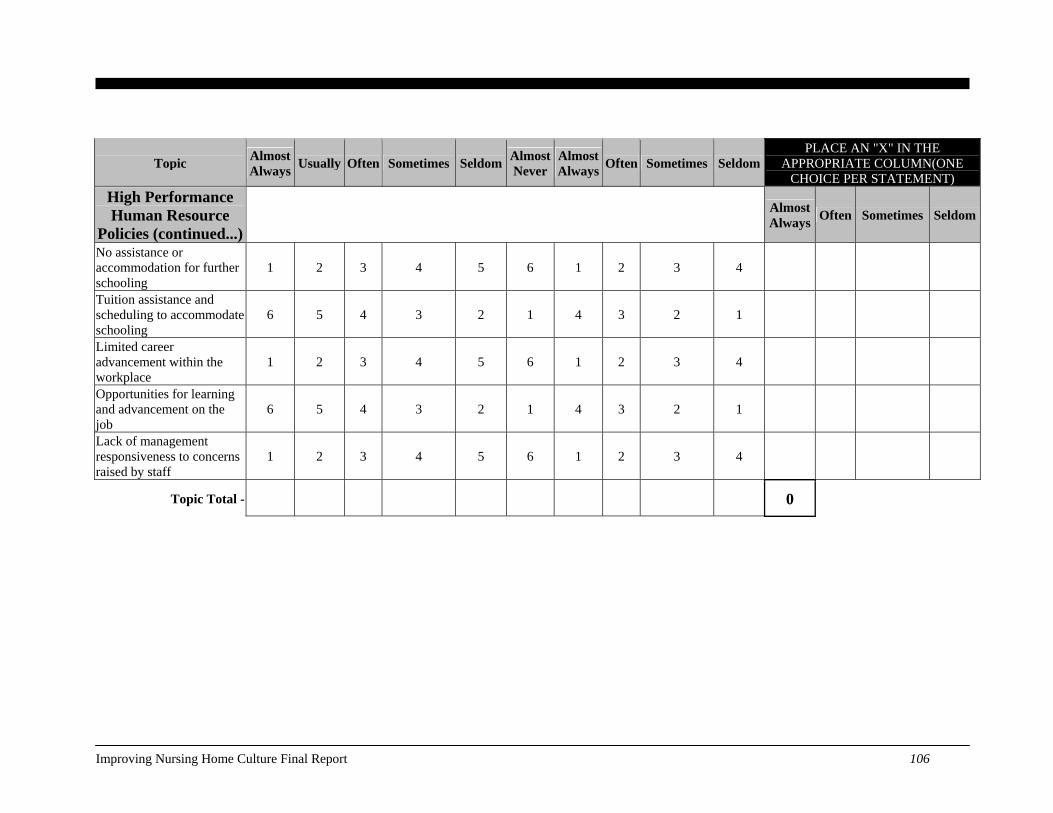
Topic Almost Always Usually Often Sometimes Seldom Almost
NeverAlmost Always Often Sometimes Seldom
PLACE AN "X" IN THE APPROPRIATE COLUMN(ONE
CHOICE PER STATEMENT) High Performance Human Resource
Policies (continued...) Almost
Always Often Sometimes Seldom
No assistance or accommodation for further schooling
1 2 3 4 5 6 1 2 3 4
Tuition assistance and scheduling to accommodate schooling
6 5 4 3 2 1 4 3 2 1
Limited career advancement within the workplace
1 2 3 4 5 6 1 2 3 4
Opportunities for learning and advancement on the job
6 5 4 3 2 1 4 3 2 1
Lack of management responsiveness to concerns raised by staff
1 2 3 4 5 6 1 2 3 4
Topic Total - 0
Improving Nursing Home Culture Final Report 106
Topic Almost Always Usually Often Sometimes Seldom Almost
NeverAlmost Always Often Sometimes Seldom
PLACE AN "X" IN THE APPROPRIATE COLUMN(ONE
CHOICE PER STATEMENT) Motivational Work Organization and
Care Practices Almost
Always Often Sometimes Seldom
Staff are assigned to different residents each day, week or month
1 2 3 4 5 6 1 2 3 4
Staff are assigned all the time to the same residents and co-workers
6 5 4 3 2 1 4 3 2 1
Staff routinely moved around to fill in gaps in schedule
1 2 3 4 5 6 1 2 3 4
Residents go to bed according to their own personal rhythms and routines
6 5 4 3 2 1 4 3 2 1
All care and services are given according to the facility’s scheduling
1 2 3 4 5 6 1 2 3 4
Decentralized services and decision-making 6 5 4 3 2 1 4 3 2 1
Problem solving through medications 1 2 3 4 5 6 1 2 3 4
CNAs involved in care planning 6 5 4 3 2 1 4 3 2 1
Conflicts between shifts and across departments 1 2 3 4 5 6 1 2 3 4
CNAs give report to each other at shift change 6 5 4 3 2 1 4 3 2 1
Improving Nursing Home Culture Final Report 107
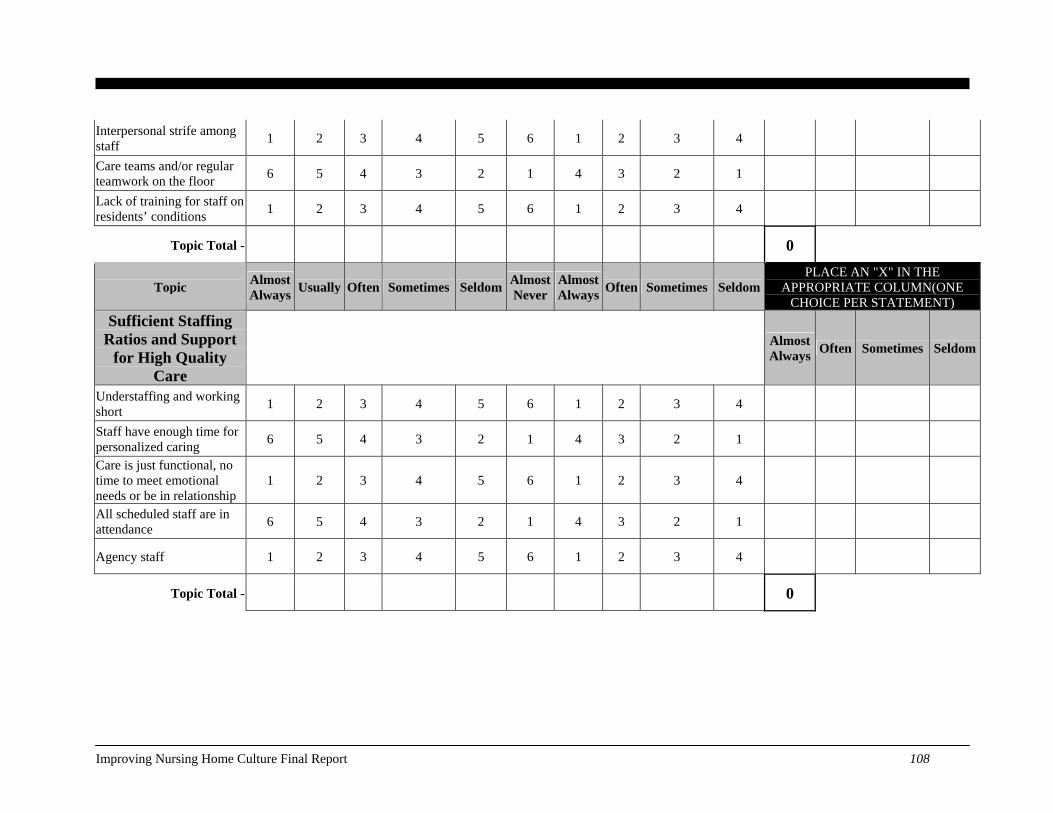
Interpersonal strife among staff 1 2 3 4 5 6 1 2 3 4
Care teams and/or regular teamwork on the floor 6 5 4 3 2 1 4 3 2 1
Lack of training for staff on residents’ conditions 1 2 3 4 5 6 1 2 3 4
Topic Total - 0
Topic Almost Always Usually Often Sometimes Seldom Almost
NeverAlmost Always Often Sometimes Seldom
PLACE AN "X" IN THE APPROPRIATE COLUMN(ONE
CHOICE PER STATEMENT) Sufficient Staffing
Ratios and Support for High Quality
Care
Almost Always Often Sometimes Seldom
Understaffing and working short 1 2 3 4 5 6 1 2 3 4
Staff have enough time for personalized caring 6 5 4 3 2 1 4 3 2 1
Care is just functional, no time to meet emotional needs or be in relationship
1 2 3 4 5 6 1 2 3 4
All scheduled staff are in attendance 6 5 4 3 2 1 4 3 2 1
Agency staff 1 2 3 4 5 6 1 2 3 4
Topic Total - 0
Improving Nursing Home Culture Final Report 108
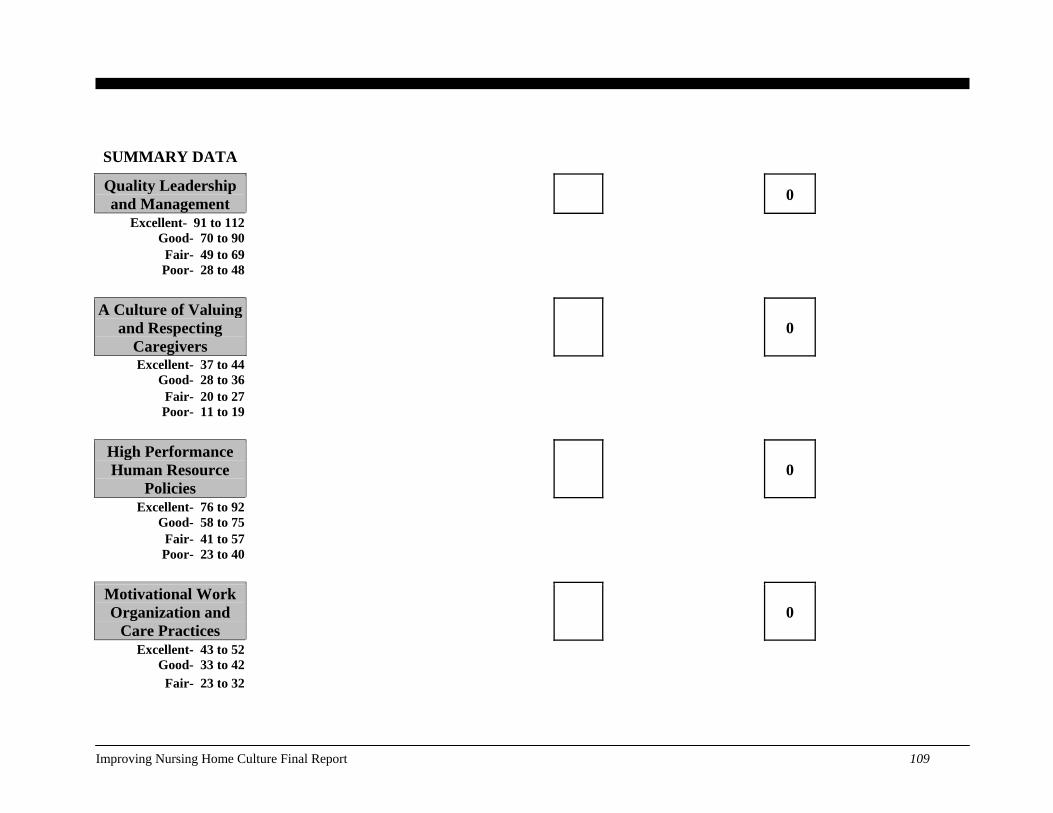
SUMMARY DATA
Quality Leadership and Management 0
Excellent- 91 to 112 Good- 70 to 90
Fair- 49 to 69 Poor- 28 to 48
A Culture of Valuing and Respecting
Caregivers 0
Excellent- 37 to 44 Good- 28 to 36
Fair- 20 to 27 Poor- 11 to 19
High Performance Human Resource
Policies 0
Excellent- 76 to 92 Good- 58 to 75
Fair- 41 to 57 Poor- 23 to 40
Motivational Work Organization and
Care Practices 0
Excellent- 43 to 52 Good- 33 to 42
Fair- 23 to 32
Improving Nursing Home Culture Final Report 109
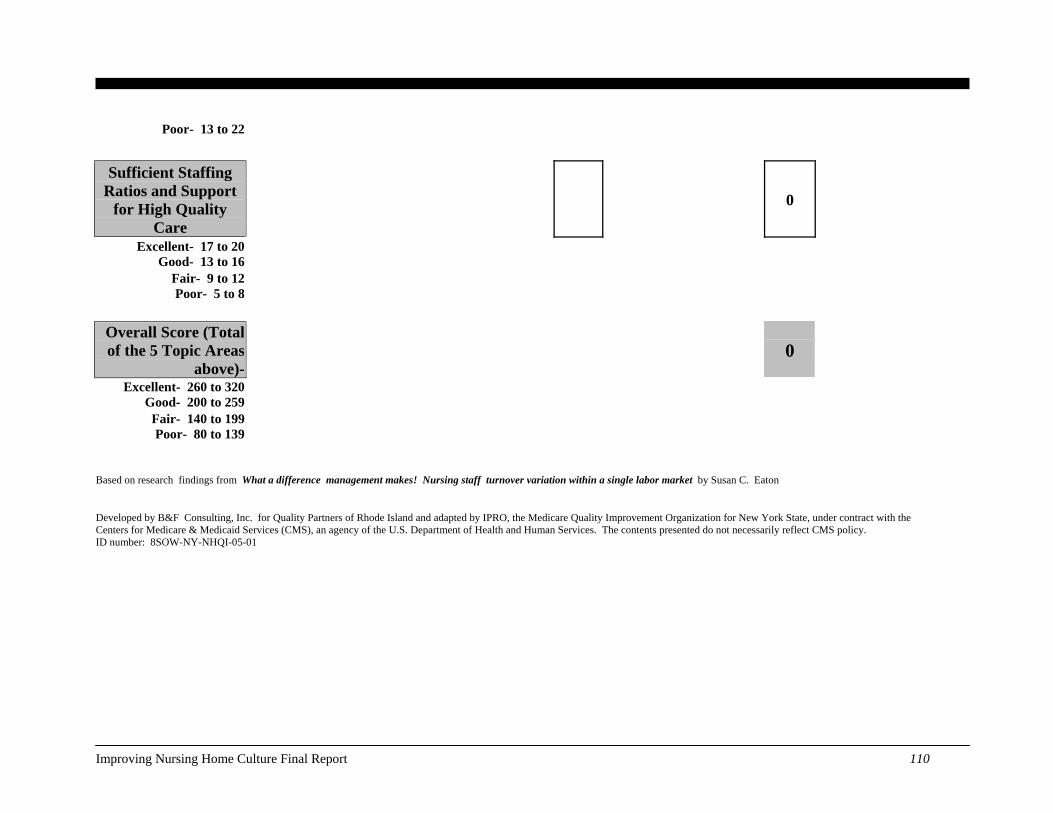
Poor- 13 to 22
Sufficient Staffing Ratios and Support
for High Quality Care
0
Excellent- 17 to 20 Good- 13 to 16
Fair- 9 to 12 Poor- 5 to 8
Overall Score (Total of the 5 Topic Areas
above)- 0
Excellent- 260 to 320 Good- 200 to 259
Fair- 140 to 199 Poor- 80 to 139
Based on research findings from What a difference management makes! Nursing staff turnover variation within a single labor market by Susan C. Eaton
Developed by B&F Consulting, Inc. for Quality Partners of Rhode Island and adapted by IPRO, the Medicare Quality Improvement Organization for New York State, under contract with the Centers for Medicare & Medicaid Services (CMS), an agency of the U.S. Department of Health and Human Services. The contents presented do not necessarily reflect CMS policy. ID number: 8SOW-NY-NHQI-05-01
Improving Nursing Home Culture Final Report 110
Appendix 7b – Susan Eaton Grid
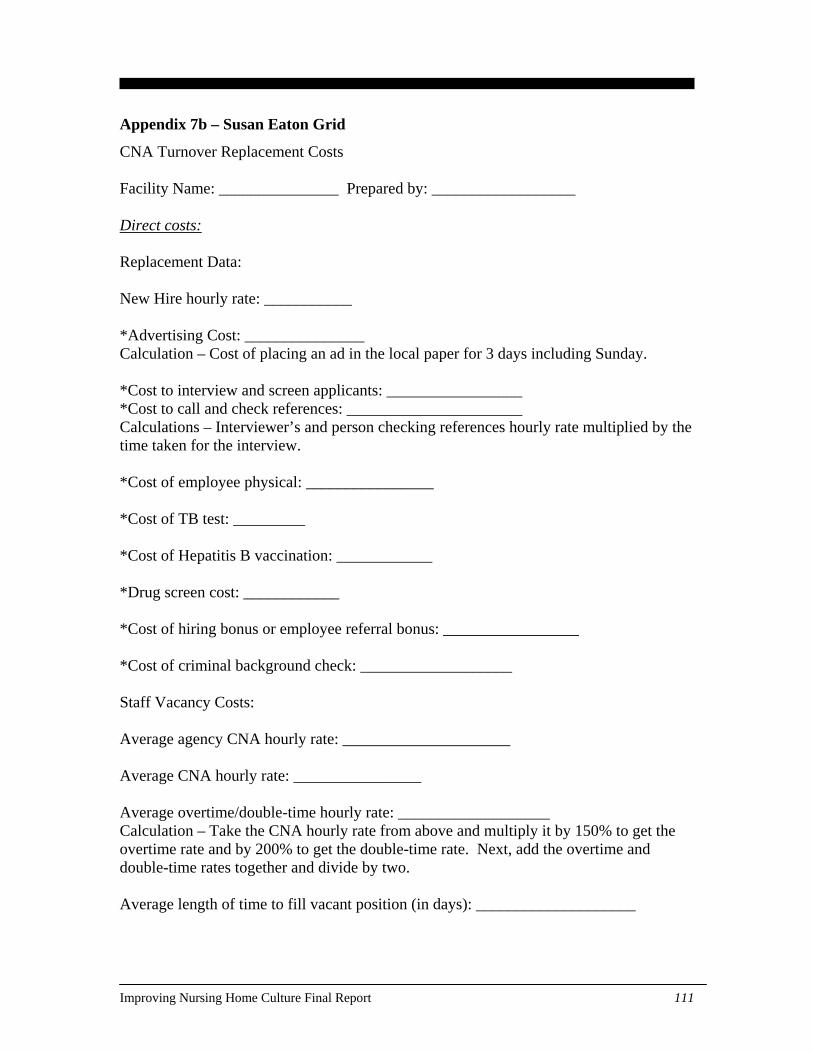
CNA Turnover Replacement Costs Facility Name: _______________ Prepared by: __________________ Direct costs: Replacement Data: New Hire hourly rate: ___________ *Advertising Cost: _______________ Calculation – Cost of placing an ad in the local paper for 3 days including Sunday. *Cost to interview and screen applicants: _________________ *Cost to call and check references: ______________________ Calculations – Interviewer’s and person checking references hourly rate multiplied by the time taken for the interview. *Cost of employee physical: ________________ *Cost of TB test: _________ *Cost of Hepatitis B vaccination: ____________ *Drug screen cost: ____________ *Cost of hiring bonus or employee referral bonus: _________________ *Cost of criminal background check: ___________________ Staff Vacancy Costs: Average agency CNA hourly rate: _____________________ Average CNA hourly rate: ________________ Average overtime/double-time hourly rate: ___________________ Calculation – Take the CNA hourly rate from above and multiply it by 150% to get the overtime rate and by 200% to get the double-time rate. Next, add the overtime and double-time rates together and divide by two. Average length of time to fill vacant position (in days): ____________________
Improving Nursing Home Culture Final Report 111
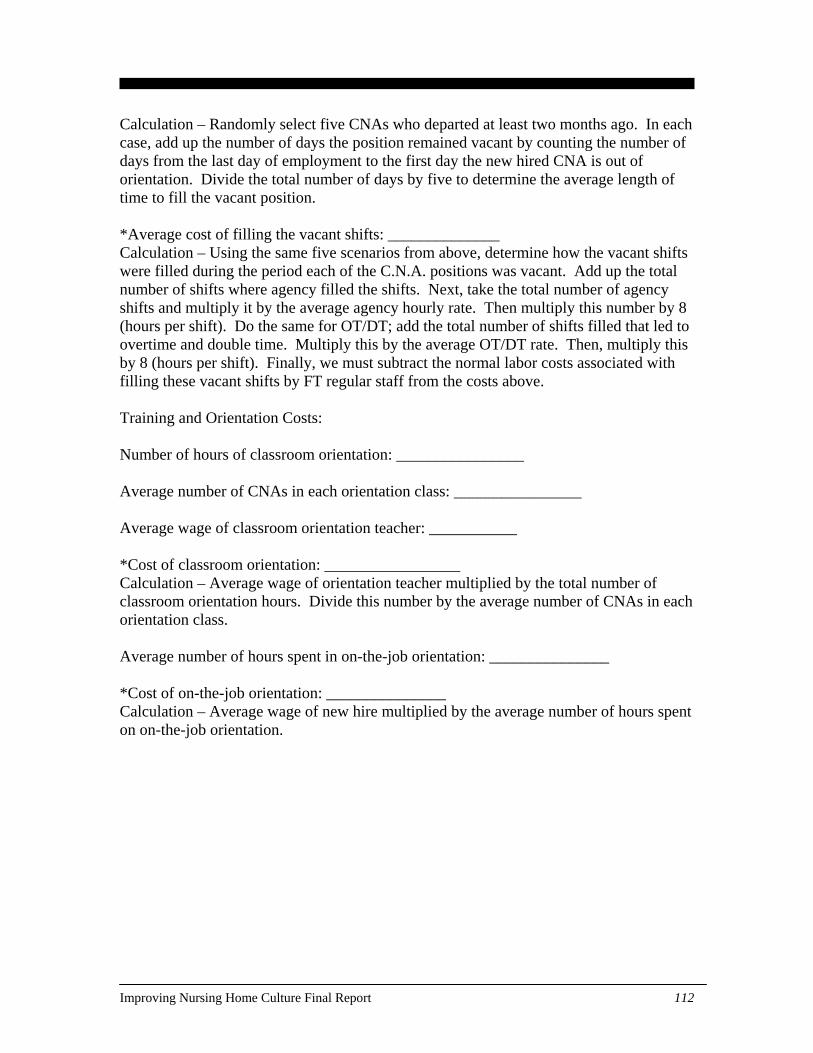
Calculation – Randomly select five CNAs who departed at least two months ago. In each case, add up the number of days the position remained vacant by counting the number of days from the last day of employment to the first day the new hired CNA is out of orientation. Divide the total number of days by five to determine the average length of time to fill the vacant position. *Average cost of filling the vacant shifts: ______________ Calculation – Using the same five scenarios from above, determine how the vacant shifts were filled during the period each of the C.N.A. positions was vacant. Add up the total number of shifts where agency filled the shifts. Next, take the total number of agency shifts and multiply it by the average agency hourly rate. Then multiply this number by 8 (hours per shift). Do the same for OT/DT; add the total number of shifts filled that led to overtime and double time. Multiply this by the average OT/DT rate. Then, multiply this by 8 (hours per shift). Finally, we must subtract the normal labor costs associated with filling these vacant shifts by FT regular staff from the costs above. Training and Orientation Costs: Number of hours of classroom orientation: ________________ Average number of CNAs in each orientation class: ________________ Average wage of classroom orientation teacher: ___________ *Cost of classroom orientation: _________________ Calculation – Average wage of orientation teacher multiplied by the total number of classroom orientation hours. Divide this number by the average number of CNAs in each orientation class. Average number of hours spent in on-the-job orientation: _______________ *Cost of on-the-job orientation: _______________ Calculation – Average wage of new hire multiplied by the average number of hours spent on on-the-job orientation.
Improving Nursing Home Culture Final Report 112
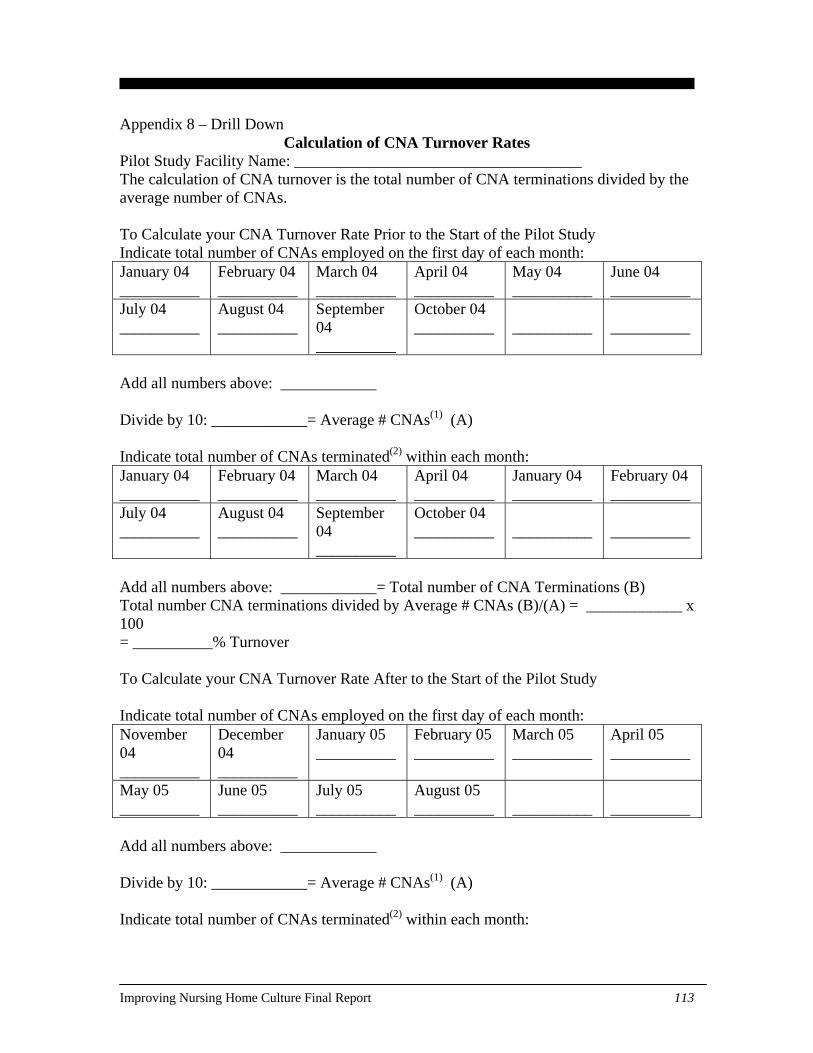
Appendix 8 – Drill Down Calculation of CNA Turnover Rates
Pilot Study Facility Name: ____________________________________ The calculation of CNA turnover is the total number of CNA terminations divided by the average number of CNAs. To Calculate your CNA Turnover Rate Prior to the Start of the Pilot Study Indicate total number of CNAs employed on the first day of each month: January 04 __________
February 04 __________
March 04 __________
April 04 __________
May 04 __________
June 04 __________
July 04 __________
August 04 __________
September 04 __________
October 04 __________
__________
__________
Add all numbers above: ____________ Divide by 10: ____________= Average # CNAs(1) (A) Indicate total number of CNAs terminated(2) within each month: January 04 __________
February 04 __________
March 04 __________
April 04 __________
January 04 __________
February 04 __________
July 04 __________
August 04 __________
September 04 __________
October 04 __________
__________
__________
Add all numbers above: ____________= Total number of CNA Terminations (B) Total number CNA terminations divided by Average # CNAs (B)/(A) = ____________ x 100 = __________% Turnover To Calculate your CNA Turnover Rate After to the Start of the Pilot Study Indicate total number of CNAs employed on the first day of each month: November 04 __________
December 04 __________
January 05 __________
February 05 __________
March 05 __________
April 05 __________
May 05 __________
June 05 __________
July 05 __________
August 05 __________
__________
__________
Add all numbers above: ____________ Divide by 10: ____________= Average # CNAs(1) (A) Indicate total number of CNAs terminated(2) within each month:
Improving Nursing Home Culture Final Report 113
November 04 __________
December 04 __________
January 05 __________
February 05 __________
March 05 __________
April 05 __________
May 05 __________
June 05 __________
July 05 __________
August 05 __________
__________
__________
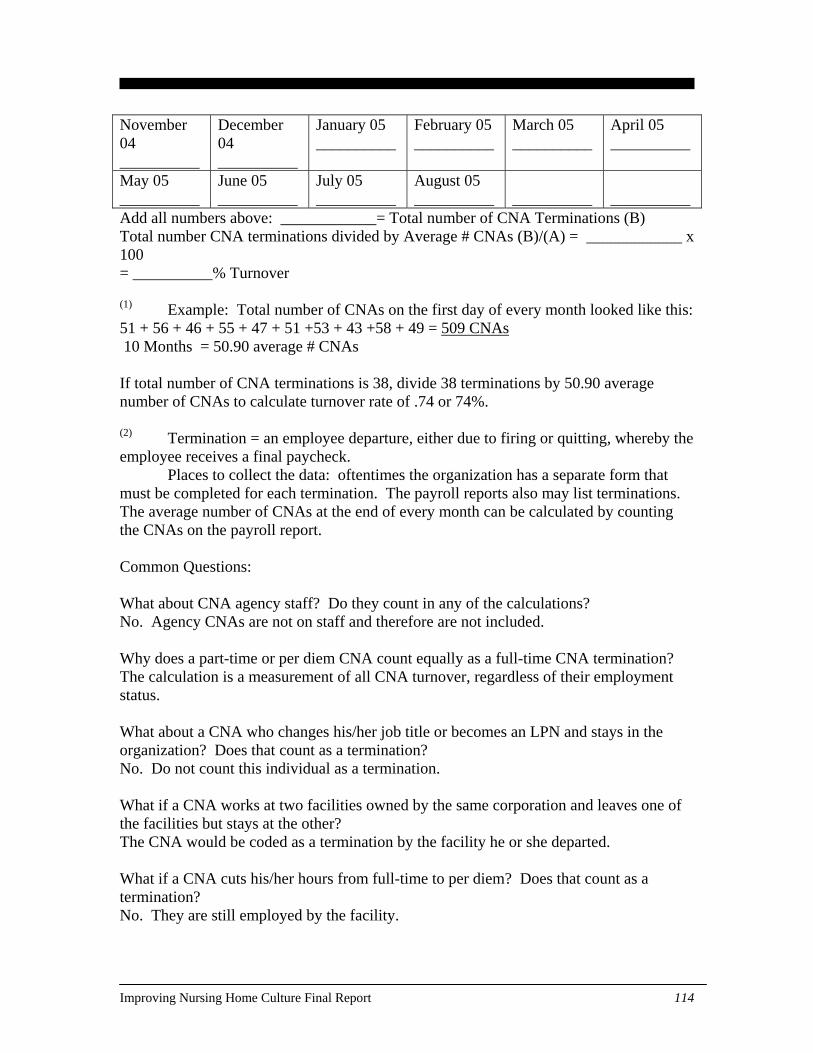
Add all numbers above: ____________= Total number of CNA Terminations (B) Total number CNA terminations divided by Average # CNAs (B)/(A) = ____________ x 100 = __________% Turnover (1) Example: Total number of CNAs on the first day of every month looked like this: 51 + 56 + 46 + 55 + 47 + 51 +53 + 43 +58 + 49 = 509 CNAs 10 Months = 50.90 average # CNAs If total number of CNA terminations is 38, divide 38 terminations by 50.90 average number of CNAs to calculate turnover rate of .74 or 74%. (2) Termination = an employee departure, either due to firing or quitting, whereby the employee receives a final paycheck. Places to collect the data: oftentimes the organization has a separate form that must be completed for each termination. The payroll reports also may list terminations. The average number of CNAs at the end of every month can be calculated by counting the CNAs on the payroll report. Common Questions: What about CNA agency staff? Do they count in any of the calculations? No. Agency CNAs are not on staff and therefore are not included. Why does a part-time or per diem CNA count equally as a full-time CNA termination? The calculation is a measurement of all CNA turnover, regardless of their employment status. What about a CNA who changes his/her job title or becomes an LPN and stays in the organization? Does that count as a termination? No. Do not count this individual as a termination. What if a CNA works at two facilities owned by the same corporation and leaves one of the facilities but stays at the other? The CNA would be coded as a termination by the facility he or she departed. What if a CNA cuts his/her hours from full-time to per diem? Does that count as a termination? No. They are still employed by the facility.
Improving Nursing Home Culture Final Report 114
What about a CNA who goes on unpaid leave or who is still employed but did not work any hours in the month or pay period? They are still employed and would continue to be included in the denominator. What if a CNA leaves (termination) and then is re-hired 3 weeks later? This employee would count as a termination. If a home has 30 budgeted CNA positions but only 25 of the positions are filled, is the average number of CNAs 25 or 30? 25 is the average number of CNAs. Additional questions may be addressed to David Farrell at [email protected] or (401) 528-3265
Improving Nursing Home Culture Final Report 115
Appendix 9 – Expanded Data Results
Measuring Organizational Culture The Workforce Retention pilot project explored many ideas for retaining employees.
These retention ideas focused on becoming accessible, skilled leaders; developing
relationships and trust with staff, residents, and families; good human resource policies
that support flexibility and opportunity for staff; and the facility as an organization that
provides jobs for staff that are meaningful, with staff consistently assigned to residents.
The Voice of the Employee (VotEM) survey that was implemented during the project
was the result of four studies funded through the Agency for Healthcare Research and
Quality and CMS, the work of several research teams, and nursing home organizations,
such as work with Eden, Wellspring, and the Pioneer Network. The instrument that
evolved through these studies and that was implemented in this project was in its fifth
version. The purposes of the instrument were to emphasize what is known to be critical
to staff retention from current organizational research in nursing homes and to provide
feedback to nursing homes that would provide direction for action, as well as to stretch
nursing homes to integrate the concepts of good working conditions and meaningful
work.
The VotEM survey had 58 questions that fell under three main categories:
Communication and Relationships, Critical Management Elements, and Resident-
Centeredness. The first section on communication and relationships asked staff to
consider several question about teamwork and communication in their facility. This
section provided information that would give the facility leadership insight as to how
connected the staff members feel as a group, and how information flows within the
facility.
The second section on critical management elements asked staff members to consider
questions about the management in their facility. The questions provided information
Improving Nursing Home Culture Final Report 116
and insight as to how staff members feel about many aspects of leading and managing
staff. Included were clusters of question that relate to support and development,
recognition and rewards, staffing flexibility, clarity of expectations and setting high
standards, management presence, trust and initiative, and management values.
The third section on resident-centeredness was added to the survey instrument for project
purposes given the nature of the study, without previous testing or development under
AHRQ grants. This section provided important information on how staff members,
residents, and families worked together in the facility, and how the staff members felt
about this working relationship. Questions focused on the individual resident being
empowered to express preferences and make choices for key aspects of care during their
day, such as dining, sleeping, and personal hygiene.
The survey was prepared as a scannable instrument. The corporations distributed the
survey to the subset of facilities that participated. A project lead at each building then
ensured that the survey was distributed to all full and part time staff. Addressed, postage-
paid envelopes were provided to the staff, and completed surveys were mailed directly to
Pearson NCS for scanning. Pearson NCS then sent data files to the CFMC for analysis.
Individual facility reports were provided to the respective corporations for distribution to
the respective participating facilities.
Three of the corporations that participated in the WFR pilot group implemented the
survey. Across the three corporations 4,214 of 6,013 employees responded to the survey,
for an overall response rate of 70%. One corporation had 11 facilities participate in the
survey process. Of these 11 facilities, 491 of 953 employees responded, for a corporate
response rate of 52%. The second corporation had 28 facilities participate, with 2,797 of
3,834 employees completing the survey for a corporate response rate of 73%. The third
corporation had 12 facilities participate in the survey, with 926 of 1,226 employees
responding, for a corporate response rate of 76%.
Improving Nursing Home Culture Final Report 117
A factor analysis was performed on the data, with subscales generated for each section.
The facility feedback report included subscale findings for each of the three sections,
with average scores provided for their individual facility, participants in their corporation,
and for participants across all three corporations. Additionally, the feedback report also
provided the frequency of responses for each question and the average response for their
facility, their corporation, and across all three participating corporations. A phone call
was provided for each of the corporations to answer any questions about their survey
results.
Workforce Data
Data Definitions
Without a common industry standard for the definition of employee turnover, one of the
project’s initial steps was to define turnover for our data collection efforts. Turnover was
defined for the project as the total number of terminations during a given month divided
by the average number of employees during that month. Rates were calculated quarterly,
and annual rates were evaluated from the quarterly rates. Agency and per diem staff were
excluded from the calculations. All other staff members were included regardless of part
time or full time status. Payroll reports were recommended to the participants as the most
accurate data source for turnover data.
Retention was assessed by the date of hire and termination date (if applicable) for each
individual employed by each facility as of January 1, 2005. The job category for each
individual was also requested. Terminations were defined for the project as an employee
departure, either due to firing or quitting, whereby the employee received a final
paycheck. Both voluntary and involuntary terminations were included. Again, payroll
records were recommended to the participants as the most accurate data source for
retention data.
Improving Nursing Home Culture Final Report 118
Participants with the capability of querying their own data systems were encouraged to
submit data files in any electronic format convenient to them. A data specification
document was provided that defined each of the variables for the project and the time
periods requested. An Excel spreadsheet with embedded macros was created by CFMC to
assist with data collection for those participants without centralized data. The tool was
designed to collect, store, and track turnover and retention data. It consisted of two data
entry forms and two metric reports. The design allowed users to enter data into the data
entry form and view year to date statistics for retention and turnover displayed in the
reports. Participants were encouraged to modify the tool to their specific needs.
Facilities without Excel macro capabilities were able to use the tool without enabling the
macros, in which case the tool was used for data entry only. A hardcopy worksheet and a
Q&A document were also provided to the participants. The project requested turnover
and retention data across six employee categories: Administrator, DON, RN, LPN, CNA,
and Other.
At the start of the project some of the participants expressed interest in collecting
absenteeism data. For purposes of the project, absenteeism was defined as any unplanned
absence that results in a shift worked short or that required a person other than the absent
employee to arrange coverage. A simple calendar format was shared by one participating
corporation, and this served as the template for a data collection instrument for those who
wanted to collect absenteeism data during the project. While the submission of turnover
and retention data was requested as a requirement for the project, the collection and
submission of absentee data was strictly voluntary.
Data Collection
At the start of the project, participants were asked to submit data on a monthly basis,
beginning with January 2005 data. Data were to be submitted by the 10th day of the
following month (e.g., January 2005 data were to be received by February 10th).
Improving Nursing Home Culture Final Report 119
Participants were to submit data for their facilities participating in the project and for a
matched number of non-participating facilities. Project staff asked that electronic copies
of the Excel spreadsheet or other data files be submitted to one project contact at Quality
Partners of Rhode Island. That contact was to collect the data and send to CFMC for
analysis.
Data collection for the project was very problematic. Given the short duration of the
project and anticipated difficulty with accessibility of data, monthly turnover data were
requested back to and including August 2004, with baseline quarter calculations
determined from August through October 2004 data. By the end of the project, only
three of the corporations were able to submit data, all with varying formats, dates, and
degrees of completion. Both the Florida and Kansas triads were able to submit data for
the project, but again, the data were submitted with varying formats, dates, and degrees of
completion.
One corporation was able to query their own data systems and submitted SPSS files of
turnover and retention following the guidelines in the data specification document.
Another corporation submitted their termination data in a modified Excel format, which
resulted in the need for extensive recoding prior to inclusion in the analyses. The third
corporation and the Florida triad submitted data collected via the Excel spreadsheet tool.
The Kansas QIO submitted data for their facilities using a modified version of the Excel
tool, which simplified data collection but resulted in extensive recoding by CFMC prior
to analyses.
All participants found the data collection process to be troublesome for a variety of
reasons. The corporations did not always have facility level data for these workforce data
calculations, so it was incumbent on the facilities to collect and submit the data. Only
select individuals at the corporations or facilities have knowledge of the data elements
needed to collect turnover and retention data. At times both payroll and human resource
staff were needed to collect the necessary data elements. Records were not easily
Improving Nursing Home Culture Final Report 120
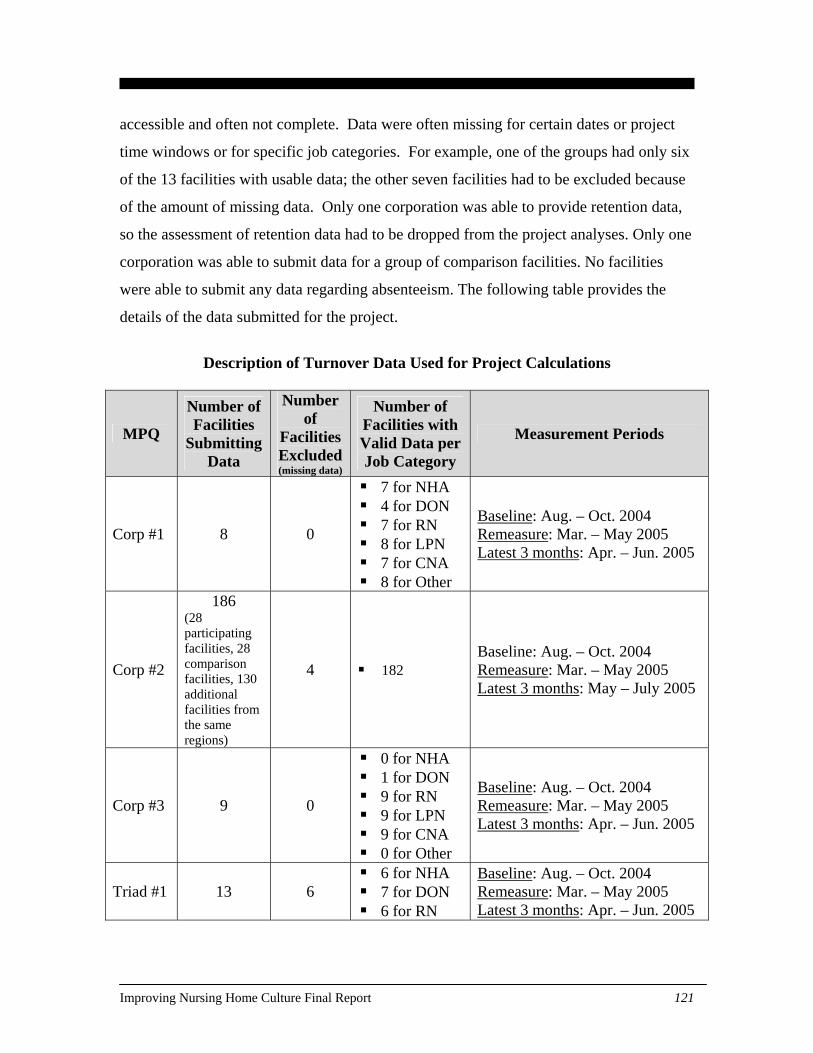
accessible and often not complete. Data were often missing for certain dates or project
time windows or for specific job categories. For example, one of the groups had only six
of the 13 facilities with usable data; the other seven facilities had to be excluded because
of the amount of missing data. Only one corporation was able to provide retention data,
so the assessment of retention data had to be dropped from the project analyses. Only one
corporation was able to submit data for a group of comparison facilities. No facilities
were able to submit any data regarding absenteeism. The following table provides the
details of the data submitted for the project.
Description of Turnover Data Used for Project Calculations
MPQ
Number of Facilities
Submitting Data
Number of
Facilities Excluded (missing data)
Number of Facilities with Valid Data per Job Category
Measurement Periods
Corp #1 8 0
7 for NHA 4 for DON 7 for RN 8 for LPN 7 for CNA 8 for Other
Baseline: Aug. – Oct. 2004 Remeasure: Mar. – May 2005 Latest 3 months: Apr. – Jun. 2005
Corp #2
186 (28 participating facilities, 28 comparison facilities, 130 additional facilities from the same regions)
4 182 Baseline: Aug. – Oct. 2004 Remeasure: Mar. – May 2005 Latest 3 months: May – July 2005
Corp #3 9 0
0 for NHA 1 for DON 9 for RN 9 for LPN 9 for CNA 0 for Other
Baseline: Aug. – Oct. 2004 Remeasure: Mar. – May 2005 Latest 3 months: Apr. – Jun. 2005
Triad #1 13 6 6 for NHA 7 for DON 6 for RN
Baseline: Aug. – Oct. 2004 Remeasure: Mar. – May 2005 Latest 3 months: Apr. – Jun. 2005
Improving Nursing Home Culture Final Report 121
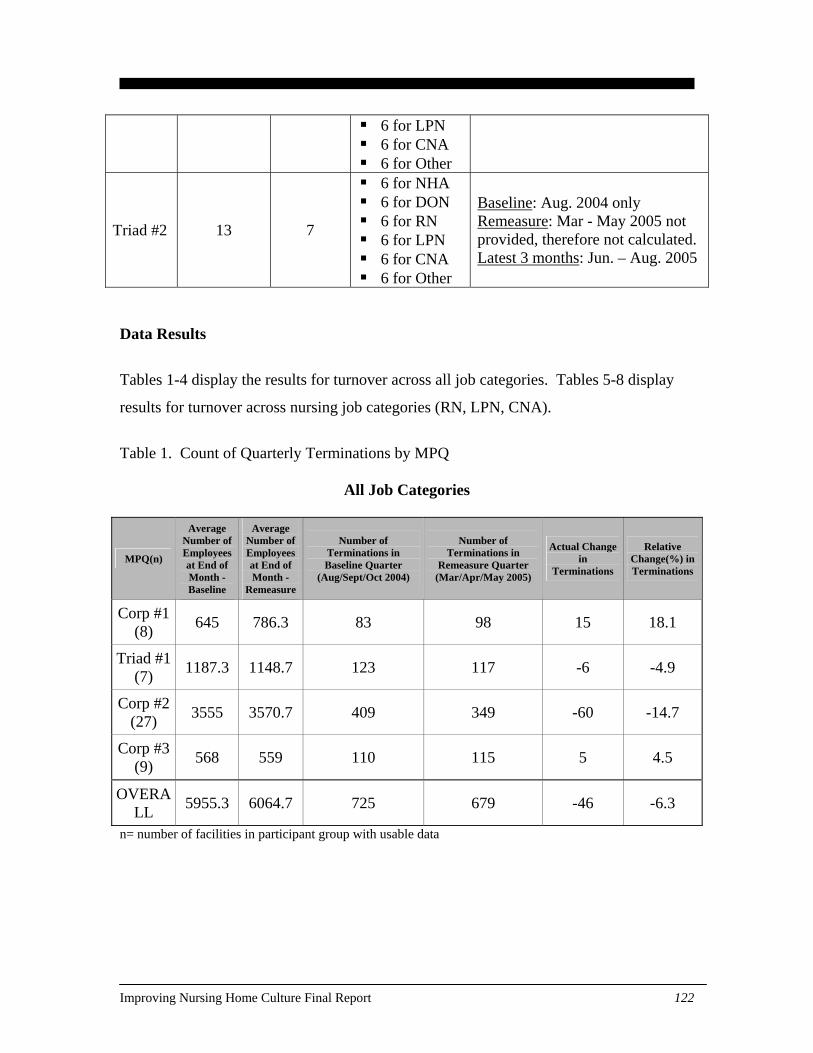
6 for LPN 6 for CNA 6 for Other
Triad #2 13 7
6 for NHA 6 for DON 6 for RN 6 for LPN 6 for CNA 6 for Other
Baseline: Aug. 2004 only Remeasure: Mar - May 2005 not provided, therefore not calculated. Latest 3 months: Jun. – Aug. 2005
Data Results
Tables 1-4 display the results for turnover across all job categories. Tables 5-8 display
results for turnover across nursing job categories (RN, LPN, CNA).
Table 1. Count of Quarterly Terminations by MPQ
All Job Categories
MPQ(n)
Average Number of Employees at End of Month - Baseline
Average Number of Employees at End of Month -
Remeasure
Number of Terminations in Baseline Quarter
(Aug/Sept/Oct 2004)
Number of Terminations in
Remeasure Quarter (Mar/Apr/May 2005)
Actual Change in
Terminations
Relative Change(%) in Terminations
Corp #1 (8) 645 786.3 83 98 15 18.1
Triad #1 (7) 1187.3 1148.7 123 117 -6 -4.9
Corp #2 (27) 3555 3570.7 409 349 -60 -14.7
Corp #3 (9) 568 559 110 115 5 4.5
OVERALL 5955.3 6064.7 725 679 -46 -6.3
n= number of facilities in participant group with usable data
Improving Nursing Home Culture Final Report 122
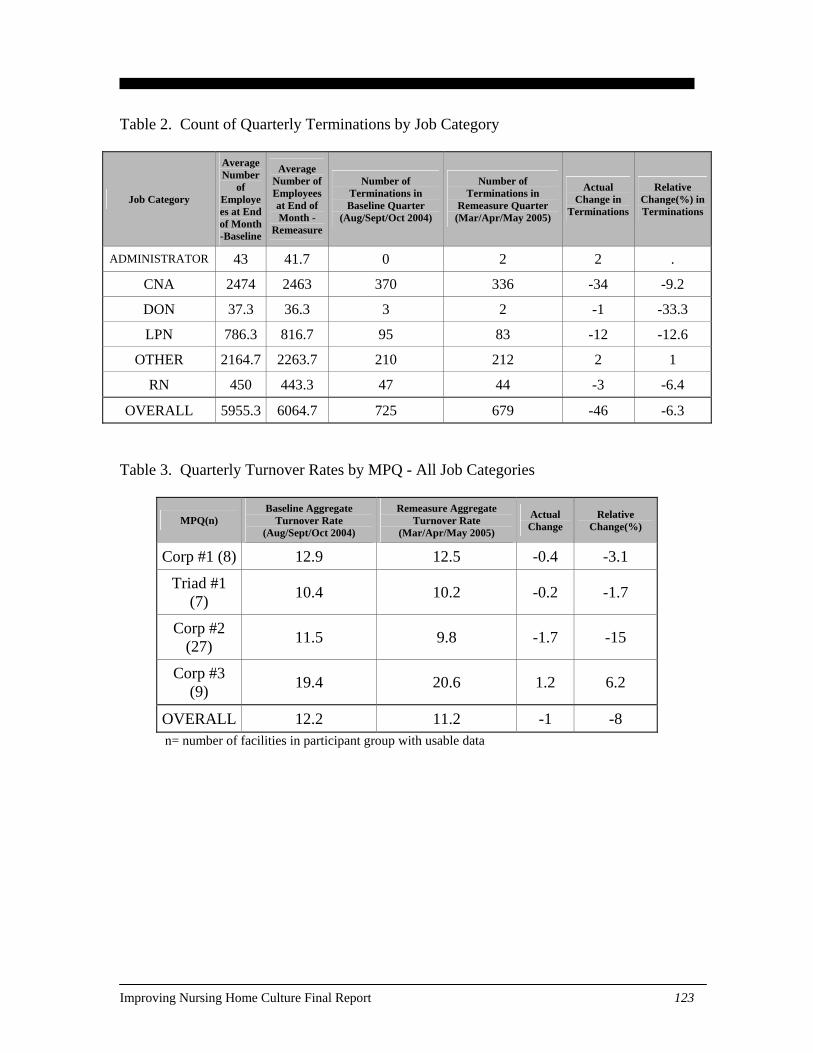
Table 2. Count of Quarterly Terminations by Job Category
Job Category
Average Number
of Employees at End of Month -Baseline
Average Number of Employees at End of Month -
Remeasure
Number of Terminations in Baseline Quarter
(Aug/Sept/Oct 2004)
Number of Terminations in
Remeasure Quarter (Mar/Apr/May 2005)
Actual Change in
Terminations
Relative Change(%) in Terminations
ADMINISTRATOR 43 41.7 0 2 2 .
CNA 2474 2463 370 336 -34 -9.2
DON 37.3 36.3 3 2 -1 -33.3
LPN 786.3 816.7 95 83 -12 -12.6
OTHER 2164.7 2263.7 210 212 2 1
RN 450 443.3 47 44 -3 -6.4
OVERALL 5955.3 6064.7 725 679 -46 -6.3
Table 3. Quarterly Turnover Rates by MPQ - All Job Categories
MPQ(n) Baseline Aggregate
Turnover Rate (Aug/Sept/Oct 2004)
Remeasure Aggregate Turnover Rate
(Mar/Apr/May 2005)
Actual Change
Relative Change(%)
Corp #1 (8) 12.9 12.5 -0.4 -3.1
Triad #1 (7) 10.4 10.2 -0.2 -1.7
Corp #2 (27) 11.5 9.8 -1.7 -15
Corp #3 (9) 19.4 20.6 1.2 6.2
OVERALL 12.2 11.2 -1 -8 n= number of facilities in participant group with usable data
Improving Nursing Home Culture Final Report 123
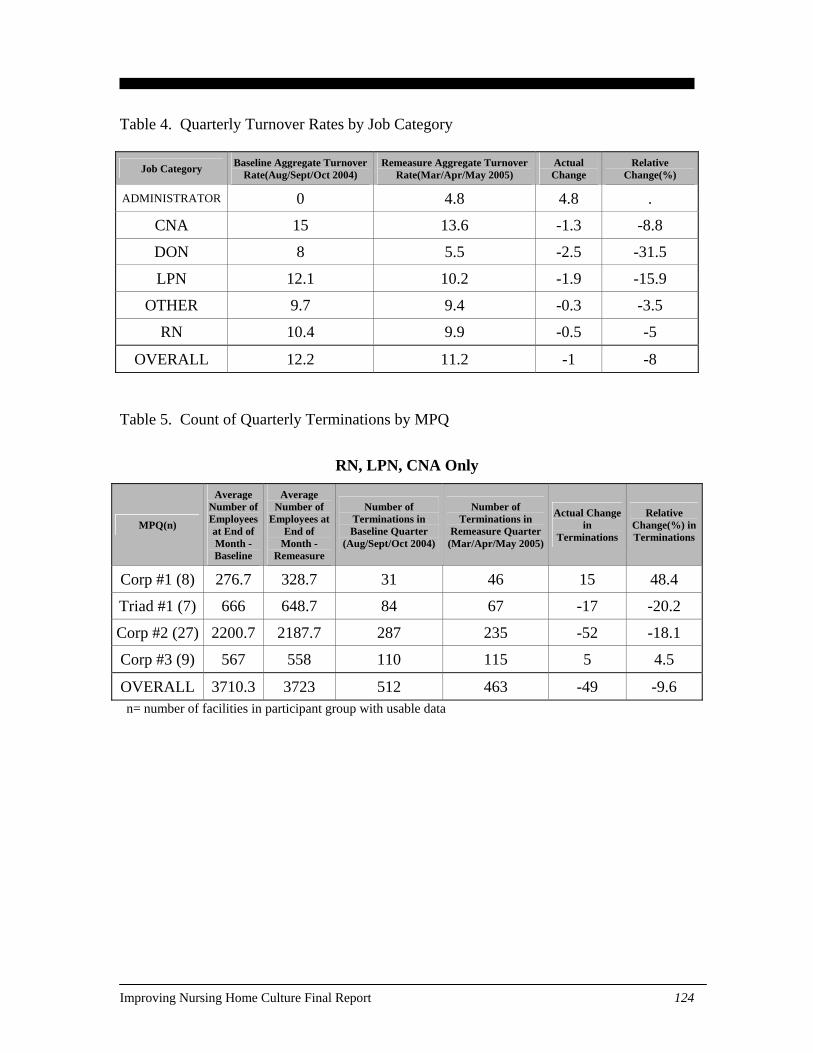
Table 4. Quarterly Turnover Rates by Job Category
Job Category Baseline Aggregate Turnover Rate(Aug/Sept/Oct 2004)
Remeasure Aggregate Turnover Rate(Mar/Apr/May 2005)
Actual Change
Relative Change(%)
ADMINISTRATOR 0 4.8 4.8 .
CNA 15 13.6 -1.3 -8.8
DON 8 5.5 -2.5 -31.5
LPN 12.1 10.2 -1.9 -15.9
OTHER 9.7 9.4 -0.3 -3.5
RN 10.4 9.9 -0.5 -5
OVERALL 12.2 11.2 -1 -8 Table 5. Count of Quarterly Terminations by MPQ
RN, LPN, CNA Only
MPQ(n)
Average Number of Employees at End of Month - Baseline
Average Number of
Employees at End of
Month -Remeasure
Number of Terminations in Baseline Quarter
(Aug/Sept/Oct 2004)
Number of Terminations in
Remeasure Quarter (Mar/Apr/May 2005)
Actual Change in
Terminations
Relative Change(%) in Terminations
Corp #1 (8) 276.7 328.7 31 46 15 48.4
Triad #1 (7) 666 648.7 84 67 -17 -20.2
Corp #2 (27) 2200.7 2187.7 287 235 -52 -18.1
Corp #3 (9) 567 558 110 115 5 4.5
OVERALL 3710.3 3723 512 463 -49 -9.6 n= number of facilities in participant group with usable data
Improving Nursing Home Culture Final Report 124
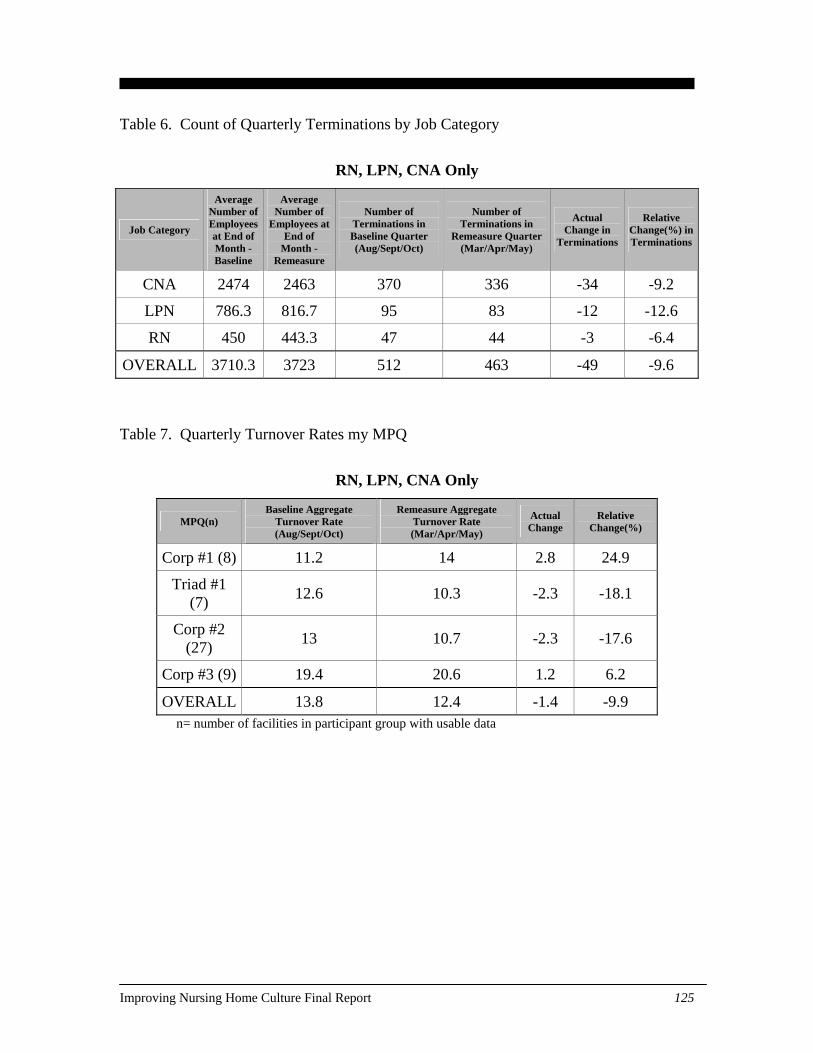
Table 6. Count of Quarterly Terminations by Job Category
RN, LPN, CNA Only
Job Category
Average Number of Employees at End of Month -Baseline
Average Number of
Employees at End of
Month -Remeasure
Number of Terminations in Baseline Quarter (Aug/Sept/Oct)
Number of Terminations in
Remeasure Quarter (Mar/Apr/May)
Actual Change in
Terminations
Relative Change(%) in Terminations
CNA 2474 2463 370 336 -34 -9.2
LPN 786.3 816.7 95 83 -12 -12.6
RN 450 443.3 47 44 -3 -6.4
OVERALL 3710.3 3723 512 463 -49 -9.6
Table 7. Quarterly Turnover Rates my MPQ
RN, LPN, CNA Only
MPQ(n) Baseline Aggregate
Turnover Rate (Aug/Sept/Oct)
Remeasure Aggregate Turnover Rate (Mar/Apr/May)
Actual Change
Relative Change(%)
Corp #1 (8) 11.2 14 2.8 24.9
Triad #1 (7) 12.6 10.3 -2.3 -18.1
Corp #2 (27) 13 10.7 -2.3 -17.6
Corp #3 (9) 19.4 20.6 1.2 6.2
OVERALL 13.8 12.4 -1.4 -9.9 n= number of facilities in participant group with usable data
Improving Nursing Home Culture Final Report 125
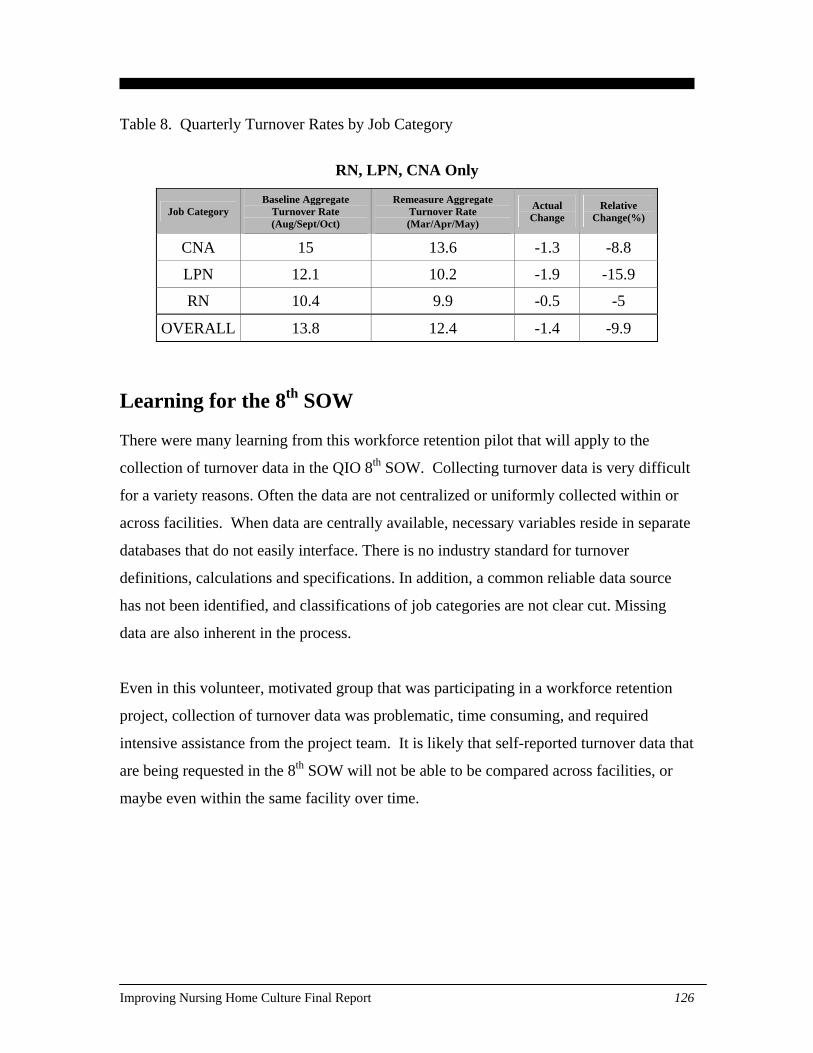
Table 8. Quarterly Turnover Rates by Job Category
RN, LPN, CNA Only
Job Category Baseline Aggregate
Turnover Rate (Aug/Sept/Oct)
Remeasure Aggregate Turnover Rate (Mar/Apr/May)
Actual Change
Relative Change(%)
CNA 15 13.6 -1.3 -8.8
LPN 12.1 10.2 -1.9 -15.9
RN 10.4 9.9 -0.5 -5
OVERALL 13.8 12.4 -1.4 -9.9
Learning for the 8th SOW There were many learning from this workforce retention pilot that will apply to the
collection of turnover data in the QIO 8th SOW. Collecting turnover data is very difficult
for a variety reasons. Often the data are not centralized or uniformly collected within or
across facilities. When data are centrally available, necessary variables reside in separate
databases that do not easily interface. There is no industry standard for turnover
definitions, calculations and specifications. In addition, a common reliable data source
has not been identified, and classifications of job categories are not clear cut. Missing
data are also inherent in the process.
Even in this volunteer, motivated group that was participating in a workforce retention
project, collection of turnover data was problematic, time consuming, and required
intensive assistance from the project team. It is likely that self-reported turnover data that
are being requested in the 8th SOW will not be able to be compared across facilities, or
maybe even within the same facility over time.
Improving Nursing Home Culture Final Report 126