Embed Size (px)
Citation preview

1
The Contribution of Livestock to the Ethiopian Economy – Part II
Roy Behnke
Odessa Centre Great Wolford
United Kingdom
Fitaweke Metaferia Senior Expert, National
Accounts Directorate, Ministry of Finance &
Economic Development (MOFED), Ethiopia.
IGAD LPI Working Paper No. 02 - 11
A Living from Livestock
IGAD Livestock Policy Initiative
brought to you by COREView metadata, citation and similar papers at core.ac.uk
provided by CGSpace

2
ACKNOWLEDGEMENTS
This work was made possible through the combined support of the Ministry of Finance and Economic Development, Federal Democratic Republic of Ethiopia, the Livestock Policy Initiative of the Intergovernmental Authority on Development, IGAD. We would particularly like to thank the following IGAD LPI staff: Dil Peeling, Chief Technical Adviser, Dr. Abdi Jama, Livestock Information Adviser, and Dr. Thomas Cherenet, National Technical Focal Point. Without their enthusiasm and persistence this report would not have been possible. Equally, this report could not have been written without access to material on livestock production collected by MOFED and without MOFED’s assistance in interpreting this data. In this regard, special thanks goes to Mr. Leulseged Dechasa, the Director of the National Accounts Directorate. MOFED’s explanation of the methods used to calculate Ethiopia’s national accounts provided the framework for this report and their contribution is gratefully acknowledged.
John McPeak kindly provided unpublished data from his own work on rates of animal sharing in southern Ethiopia. The Brooke Ethiopia supplied information on working equines drawn from a report on that subject that is currently in preparation. We wish to thank Dr. Peter Little for a summary of the information that he has collected over the years on the cross border livestock trade.
Roy Behnke Odessa Centre Great Wolford United Kingdom
Fitaweke Metaferia Senior Expert, National Accounts Directorate, Ministry of Finance & Economic Development (MOFED), Ethiopia.

3
DISCLAIMER
This paper on Ethiopia is part of a series of Working Papers on The Contribution of Livestock to GDP in the IGAD Member States planned by the Inter-Governmental Authority on Development’s Livestock Policy Initiative (IGAD LPI). The purpose of these papers is to provide support to Livestock Policy Hubs in the Member States to use study outcomes in their engagements with PRSPs processes in their respective countries (Ethiopia's Growth and Transformation Plan) to advocate and ensure that the representation of livestock in these national strategy documents is commensurate with its important contribution to economic growth, poverty reduction and food security.
The designations employed and the presentation of material in this publication do not imply the expression of any opinion whatsoever on the part of either the Food and Agriculture Organization (FAO) of the United Nations or the Inter-Governmental Authority on Development (IGAD) concerning the legal status of any country, territory, city or area or its authorities concerning the delimitations of its frontiers or boundaries.
The opinions expressed in this paper are solely those of the authors and do not constitute in any way the position of the FAO, IGAD, the IGAD Livestock Policy Initiative nor the governments studied.

4
CONTENTS
ACKNOWLEDGEMENTS .............................................................................................. 2
DISCLAIMER .......................................................................................................... 3
CONTENTS ........................................................................................................... 4
ABBREVIATIONS ..................................................................................................... 5
EXECUTIVE SUMMARY .............................................................................................. 6
INTRODUCTION ..................................................................................................... 10
PART I – THE CONTRIBUTION OF LIVESTOCK TO AGRICULTURAL GDP ..................................... 13
1.1 Introduction .................................................................................................. 13
1.2 Summary of previous work ................................................................................ 13
PART II – LIVESTOCK SERVICES NOT CAPTURED IN CONVENTIONAL NATIONAL ACCOUNTS .................. 15
2.1 Introduction .................................................................................................. 15
2.2 Livestock-based financial services ....................................................................... 15
2.2.1 The value of livestock as credit ................................................................ 17
2.2.2 The value of livestock as insurance ........................................................... 18
2.3 Transport and haulage by equines ....................................................................... 20
2.4 Summary Part II: the value of livestock services to rural livelihoods ............................... 23
PART III – THE CONTRIBUTION OF LIVESTOCK TO THE WIDER ECONOMY ............................................... 24
3.1 Introduction .................................................................................................. 24
3.2 The role of livestock in household consumption and expenditure .................................. 24
3.3 Export trade in meat and live animals .................................................................. 26
3.3.1 Hides, skins and leather exports ............................................................... 28
3.3.2 Reassessment of the national importance of livestock sector exports .................. 29
3.4 Livestock products as inputs into manufacturing ...................................................... 30
3.5 The contribution of animal power to the transport sector ........................................... 31
3.6 Summary Part III: The contribution of livestock to the wider economy ............................ 32
CONCLUSIONS AND RECOMMENDATIONS .................................................................................................... 35
ANNEXES ............................................................................................................ 37
Annex I: Summary of recommended formula to estimate the contribution of ruminant livestock to agricultural GDP ................................................................ 37
Annex II: GDP by economic activity at current prices (,000 birr) ........................................ 39
Annex III: Quantity and gross value of official Ethiopian livestock and meat exports: 1970-2006 ................................................................................ 40
REFERENCES ........................................................................................................ 41

5
ABBREVIATIONS
CSA Central Statistics Agency
EB Ethiopian birr
GDP Gross domestic product
HICE Household Income and Consumption Expenditure
IGAD Intergovernmental Authority on Development
ILCA International Livestock Centre for Africa
ILRI International Livestock Research Institute
LDMPS Livestock Development Master Plan Study
LPI Livestock Policy Initiative
MOARD Ministry of Agriculture and Rural Development
MOFED Ministry of Finance and Economic Development
PADS Pastoral Areas Development Study
ISIC International Standard Industrial Classification of All Economic Activities
SNA System of National Accounts
SNNPR Southern Nations, Nationalities and Peoples Region
TLU Tropical Livestock Unit

6
EXECUTIVE SUMMARY
This is the second of two reports on the contribution of livestock to the Ethiopian economy. Livestock specialists frequently argue that livestock production is underrepresented in the GDP estimates of African nations. With respect to Ethiopia, this study confirms that suspicion. Part of the problem is caused by deficiencies in data and estimation procedures. A second source of error lies in the conventional rules of national accounting. Both shortcomings are examined in this report.
Further studies undertaken by the IGAD Livestock Policy Initiative (LPI) point to a policy emphasis in the region on livestock marketing and production to the exclusion of other functions which are provided by livestock (IGAD LPI Working Paper No. 01 – 111) despite the fact that the relative importance of livestock’s other livelihoods services appears higher among poorer groups (IGAD LPI Working Papers 01 – 102 and 10 – 083 ) This report confirms that high economic value of many of those non-production related functions of livestock
This report supports the following conclusions:
1. Focusing on the outputs from ruminant livestock, the first report in this series (IGAD LPI Working Paper No 02-10) re-examined the contribution of livestock to agricultural GDP. The production coefficients presently used by MOFED to estimate livestock output are potentially outdated. Working Paper 02-10 evaluated and adjusted these production coefficients in light of current research and survey evidence. Using 2008-09 as a basis for comparison, the revised coefficients yielded a recalculated total gross value for 12 categories of ruminant livestock production that was an increase of about 46% over the gross value of the same production categories using MOFED’s estimation techniques. While these recalculations represent a significant increase in output estimates, they result from an up-dating of old productivity coefficients and, to a lesser extent, a revised estimate of the size of the national herd. These adjustments refine but in no way question the basic methods employed by MOFED in the calculation of agricultural GDP.
2. About 80% of Ethiopian farmers use animal traction to plough their fields. Both the mean area cultivated by a farm household and their yields per hectare are positively correlated with cattle ownership and ploughing, in comparison to hand cultivation. Despite these contributions to agricultural output, no attempt is currently made by MOFED to impute the monetary value of animal traction for Ethiopian agriculture. The value of the animal draught power input into arable production is about a quarter (26.4%) of the value of annual crop production. Based on these figures, nearly a third (31%) of the total gross value of livestock output is represented by the value of animal draught power as an input into crop cultivation, an estimated 21.500 billion EB in 2008-09.
3. Although the proportional contribution of livestock and crops will fluctuate from year to year, if we include the value of ploughing services, livestock provided 45% of agricultural GDP in 2008-
1 Livestock and Livelihoods in the IGAD Region: A Policy and Institutional Analysis: Pica-Ciamarra et al.
http://tinyurl.com/PolicyEmphasis 2 Livestock Exports from Pastoralist Areas: An Analysis of Benefits by Wealth Group and Policy Implications.
Aklilu et al. http://tinyurl.com/PastoralTrade 3 Livestock Livelihoods and Institutions in the IGAD Region: Sandford et al. http://tinyurl.com/IGADLivelihoods

7
09. Previous MOFED estimates placed livestock’s contribution at about 25% of total agricultural GDP. The gap between these two estimates suggests that the significance of livestock relative to crop production has been considerably misrepresented by past calculations of agricultural sector GDP. Even if technical considerations exclude ploughing services from GDP estimates, the quantification and expression of this value in monetary terms underlines the need the rethink the role and relative importance of crops and livestock in Ethiopian agriculture.
4. The problem of incorporating the value of oxen ploughing into estimates of agricultural GDP is symptomatic of a wider methodological obstacle to the full appreciation of the economic importance of livestock in developing economies. In principle, the ‘production approach’ employed by MOFED to calculate agricultural GDP can adequately capture the great bulk of material production in the form of goods from Ethiopian livestock, irrespective of whether this produce is sold or immediately consumed by rural households. But if Ethiopian farmers and herders provide for themselves with home produced goods, they also in large measure service themselves. The most important services provided by livestock include the supply of animal power (for traction, transport and haulage), and livestock as a source of financial services (as providers of credit, as a form of self-insurance and as a means of sharing or pooling risk). According to international conventions, the value of this self-servicing is not separately itemized in national accounts and therefore cannot be identified as part of the economic benefits that livestock provide, which compromises the usefulness of these accounts for understanding the actual contribution of livestock to the economy.
5. The credit benefits of livestock derive from the ability of livestock owners to dispose of their animals for particular purposes at a time that they choose – their ability to ‘cash in’ on the value of their animals as needed. This flexibility gives livestock owners ready access to money without the need to borrow, and confers an additional financial benefit beyond the sale, slaughter or transfer value of their livestock. This additional financial benefit can be estimated as the opportunity cost of rural credit – what it would otherwise cost a livestock owner in rural areas to obtain funds comparable to those produced by liquidating a part of the herd. Employing this estimation, the additional finance value of a livestock holding is equivalent to the interest that the owners would be required to pay to obtain loans equal to the value of their livestock offtake. Rural interest rates are highly variable, but if we assume that inflation-adjusted interest rates on rural credit in Ethiopia are currently running at about 100% per annum, then the financial value of livestock offtake is identical to the annual value of offtake – in 2008-09, for example, about a 12.8 billion EB. financial benefit on top of 12.8 billion EB in direct offtake value.
6. Part of the insurance or security value of livestock comes from the ability of owners to liquidate their own herds in an emergency. In this instance, the level of security provided to a particular individual depends on the value of that individual’s assets, so livestock ownership functions as a kind of self-insurance. The value of this form of asset-based insurance can be calculated as the annual cost that herd owners would need to pay to purchase insurance coverage equal to the capital value of their herd. Insurance coverage in rural Ethiopia costs about 10% of the value of the cover provided. At this level of premium payments, the self-insurance value of Ethiopian livestock in 2008-09 was about 8.6 billion EB or 10% of the capital value of the national herd.
7. For pastoralists in Ethiopia, the insurance value of livestock derives not only from their ability to liquidate their individual herds, but also from their ability to call upon assistance from fellow

8
pastoralists in time of need. These collective insurance schemes are based on the gifting and loaning of livestock within pastoral communities, with large herd owners donating some of their animals and less well-off pastoralists drawing support in the form of livestock received as gifts or on loan. Recent research suggests that about 10.5% of pastoral animals in Ethiopia are involved in livestock sharing networks of this kind. Assuming that the total capital value of pastoral livestock in Ethiopia is 34.779 billion EB, the collective insurance value of pastoral herds can be estimated at 34.779 x .105 = 3.652 billion EB in 2008-09.
8. According to internationally agreed conventions, national accounts do not separately itemize the value of transport services that producers supply for themselves. Although many rural households in Ethiopia use their own working animals to meet their transport and haulage needs, conventional national accounting ignores much of the benefit that households derive from animal power. In Ethiopia current national-level economic data on the use of animal power does not exist. If one recent field study is any indication of the national situation, equine power may have produced as much as EB 19 billion in value added to the national economy in 2010. Even if it incorporates a large degree of error, the scale of this estimate suggests the need for a national survey of the contribution of animal power to the Ethiopian economy.
9. Total economic benefits of livestock goods and services, now estimated at more than 113 billion EB, are more than three and a half times greater than the MOFED’s original estimate of the value added from livestock in 2008-09. Of the roughly 80 billion EB increase in benefits, about 15 billion EB are derived from recalculating the value of livestock products, and the remaining 65 billion come from broadening the estimation to include livestock services.
10. The bulk of Ethiopian livestock’s provision to the economy is not identified in conventional national accounts as coming from livestock. These distortions are particularly acute for highland livestock production systems in which animal energy for transport and dung for fuel are as important as conventional milk and meat production. Ethiopian pastoralists are, on the other hand, specialized producers of meat, milk and live animals for sale. Provided their animals get into the computations at all, it might be hoped that the output of pastoral herds would be adequately represented in national accounts. This is not the case.
11. Pastoral output underpins almost all of Ethiopia’s live animal and meat exports. Combined with hides, skins and leather exports (which are sourced primarily from highland animals) live animal and meat exports probably constitute about a fifth of all of Ethiopia’s exports. Approximately half of these livestock sector exports are not recorded and not recognized by the National Bank of Ethiopia because they are produced by the cross border trade in live animals, which the government deems to be illegal and does not recognize. As putatively illegal animals flow out of Ethiopia, equally illegal consumer goods purchased by the proceeds of animal sales flow back. Informal live animal exports do not produce foreign exchange. What the cross border trade does finance is the provision of internationally sourced commodities, presumably exactly the goods on which Ethiopian consumers would have spent their foreign exchange. All that has been lost is the paper trail that would link imported consumer goods to livestock production. What has suffered here is not the Ethiopian economy but rather, yet again, the recognition of the importance of livestock production to that economy.

9
These conclusions support the following recommendations:
1. The MOFED-led task force currently examining the contribution of livestock to agricultural GDP should develop objective methods for estimating livestock product and service outputs, based on a review of current scientific research as well as official survey data.
2. An accurate estimate of the contribution of livestock to Ethiopia’s agricultural GDP will not be possible until the size of national livestock populations has been established. Pastoral livestock numbers in Afar and Somali Regions were last enumerated in 2003-04, and a new survey of pastoral livestock is overdue. If cost or capacity limitations prevent pastoral areas from being included in the annual CSA Agricultural Sample Surveys, then the livestock in pastoral areas should be surveyed at least once in every five years.
3. To conform to international standards, MOFED must continue to estimate GDP according to established procedures. These conventional methods nonetheless do a poor job of capturing the full range of economic benefits provided by livestock to the Ethiopian national economy. In the interest of supporting more informed policies for livestock development, MOFED and the Ministry of Agriculture (MOA) should collaborate to supplement the standard national accounts with periodic estimations of the value of those livestock goods and services that are underestimated in national accounts.
4. With the support of MOFED and MOA, the CSA should undertake a national survey of the value of animal power to the economy and of the role of animal power in sustaining both rural and urban livelihoods. This survey should include all forms of animal traction, transport, and haulage by all species of working animals – cattle, equines and camels – in rural and urban areas and in all agricultural sectors – agriculture, manufacturing and services. As well as the commercial provision of animal power, the survey should assess the monetary value of the services that working animals directly provide for their owners.
5. Ethiopia needs to recognize the central contribution of the informal cross border livestock trade to national exports. As a regional organization committed to supporting regional trade, IGAD is well positioned to discuss this issue with government, and should continue to do so.

10
INTRODUCTION
The overall objective of the IGAD Livestock Policy Initiative (LPI) is to enhance the contribution of the livestock sector to sustainable food security and poverty reduction in the IGAD region. The LPI project covers IGAD member states Djibouti, Ethiopia, Kenya, Somalia, Sudan and Uganda. The objective of this report is to assess the extent to which livestock’s contribution to the Ethiopian national economy is reflected in national accounts, if necessary by assigning monetary values to the non-marketed services that livestock provide.
This report is divided into three parts, each of which discusses a distinctive sub-set of the economic benefits that Ethiopians and the Ethiopian economy derive from livestock.
• Part I quantifies the volume and value of livestock product output from the agricultural sector.
• Part II estimates the monetary value of livestock services, primarily but not exclusively as contributions to sustaining the livelihoods of Ethiopian farmers and herders.
• Part III characterizes the ‘multiplier’ or spread effects of livestock goods and services primarily outside rural areas, as the outputs provided by livestock are taken up and used by other sectors of the national economy – as exports in the trading sector, inputs into manufacturing and transport, or consumed by households.
Part I: The Contribution of Livestock to Agricultural GDP summarizes work previously reported in IGAD LPI Working Paper No. 02-10. The size of livestock’s contribution to agricultural GDP is the most commonly quoted single measure of livestock’s role to the overall national economy, and it is the foundation of any overall assessment of the contribution of livestock to the national economy.
The Ministry of Finance and Economic Development (MOFED) follows the production approach to estimating Ethiopia’s agricultural GDP, in which the value added of goods and services by different agricultural activities are summarized to arrive at total sector GDP. For livestock this approach involves four stages. First, national livestock populations are estimated by MOFED based on data supplied by the Central Statistics Agency (CSA). Second, production coefficients are applied to the livestock population estimates to generate estimates of the material output of goods such as meat, milk, butter, dung for fuel etc. Third, based on CSA producer price surveys, a monetary value expressed in Ethiopian birr – the gross value of output – is ascribed to the total output of each kind of livestock product. Finally, costs of intermediate consumption are deducted from the gross value of output to derive value added. The strength of this ‘production’ approach in a semi-commercialized rural economy is that these techniques do not distinguish between livestock product output that is traded and that which is used or consumed directly by rural livestock-owning households. As long as a reliable monetary value can be ascribed to them, home-produced-home-consumed goods are accounted for in estimates of Ethiopian agricultural GDP.
Focusing on the outputs from ruminant livestock, Working Paper No 02-10 endorsed MOFED’s methodology but recommended the adoption of several new production coefficients to calculate the physical output that could be expected from the Ethiopian national herd. These adjustments significantly altered MOFED’s estimates of the gross value of ruminant livestock output, but (with

11
the possible exception of estimates of the value of dung for fuel in highland farming communities) raised no fundamental issues of methodology.
This analysis also raised the more controversial question of the value of animal draught power and its contribution to crop production. The report argued that a monetary value could be ascribed to the use by farmers of their own animals (primarily oxen) for ploughing, and that international conventions suggested that this value should appear as part of agricultural GDP under the heading of agricultural services. A method for calculating the value of animal draught power was proposed and a preliminary estimate of its value was presented.
For the sake of completeness, Part I of this report summarizes the results of previous work, but does not alter or add to the results presented in IGAD LPI Working Paper 02-10.
Part II: Livestock Services Not Captured in National Accounts, examines the importance of livestock services and describes analytical techniques that can be used to objectively quantify the value of these services.
The problem of incorporating the value of oxen ploughing into estimates of agricultural GDP (raised in Part I and first discussed in IGAD LPI WP 02-10) is symptomatic of a wider methodological obstacle to the full appreciation of the economic importance of livestock in developing economies. The methods employed by MOFED to calculate agricultural GDP adequately capture the great bulk of material production in the form of goods from Ethiopian livestock, irrespective of whether this produce is sold or immediately consumed by rural households. The same cannot be said for livestock as service providers – as sources of animal power or suppliers of financial services. These service benefits include livestock used as power for traction, transport and haulage, or livestock as providers of credit and insurance. As the following discussion will demonstrate, there is nothing ethereal about these benefits from the point of view of livestock-owning households. In many semi-arid low-land areas, for example, water points are widely scattered, and without the family donkey or pack camel to fetch water, wide expanses of rangeland would be uninhabitable, or could be made habitable only with many hours of human labour (primarily female labour) head-loading water from well to home. In these environments, households are likely, if at all possible, to possess their own burden animals, precisely because water is so essential to family welfare. And if drought or other disasters strike, these same families may offset sudden declines in family income by disposing through sale or slaughter of some of the wealth stored in the family herd.
But if the services of working animals or the financial benefits of the family herd are very real, so are the problems of accounting for these services within conventional national accounts. The issue of accounting for domestic and childcare services, an anomaly publicized by feminists in developed countries, illustrates the problem. According to conventional analytical procedures, if a family member cares for children or cleans the house, the value of these services is not quantified and does not appear explicitly in national accounts. But let the same family hire outside help to provide identical services – a child carer, maid or housecleaner, for instance – and the cost of this service is separately enumerated and enters explicitly into the accounting system. In sum, the cost and benefits of services provided by a family for itself are not separately valued, in contrast to the same services provided by outside agents.

12
The impact of this accounting anomaly is magnified in subsistence-oriented economies when households provision and service themselves and commonly function simultaneously as both units of production and consumption. In lieu of tractor ploughing services or commercial water deliveries, many rural households in Ethiopia use their own livestock for traction and haulage; in the absence of banks, credit societies or insurance companies, they call upon livestock ownership to provide alternative, self-help financial services.
Part II of this report puts an economic value on the service and self-servicing aspects of livestock use in Ethiopia. Even if these activities are not separately identified in conventional national accounts, quantifying their scale and economic value is important if policy makers are to understand the economic organization of rural communities and the economic choices made by herders and farmers.
Part III: The Contribution of Livestock to the Wider Economy, traces the economic career of livestock and livestock products after leaving the agricultural sector and entering the economy at large. This analysis examines three different ways that the Ethiopian economy exploits the livestock outputs made available by the agricultural sector – as items of household consumption, as exports, or as inputs into other industrial processes. For a variety of reasons, most of these values cannot be accurately estimated.
• With respect to household consumption, there is a disjunction between what households in CSA surveys claim to consume and the estimated amount of livestock goods and services that the agricultural sector produces. For the Ethiopian economy as a whole, total private final consumption absorbs about 85% of national GDP. On the other hand, the goods and services derived from livestock that are consumed by private households are worth little more than half of livestock’s contribution to agricultural GDP. It would appear that Ethiopian households consume an unexpectedly small portion of national livestock production.
• The export of livestock and livestock products is a potential alternative to domestic consumption, and does indeed absorb a significant portion of Ethiopia’s livestock output. However, because the cross border trade in live animals is deemed by the authorities to be illegal, there are no reliable national estimates of the scale of this trade. Informal livestock traders use the proceeds gained by exporting livestock to finance the illicit and unrecorded importation of consumer goods such as food, clothing and electrical items. Revenues from informal livestock trading are much greater than those from legal livestock exports. Much of what Ethiopians consume – from CD players to macaroni or used clothes – may be financed by the informal livestock trade, and ultimately by livestock production, but bear no outward resemblance to a livestock product.
• Livestock goods and services also figure as intermediate inputs into activities such as manufacturing and transport provision within Ethiopia. It is possible to roughly estimate the proportion of manufacturing that depends on livestock products as raw materials. It is at present impossible to estimate with any accuracy the contribution of animal power to the transport sector, a deficiency in national statistics that the CSA should consider remedying.

13
PART I – THE CONTRIBUTION OF LIVESTOCK TO AGRICULTURAL GDP
1.1 Introduction
The contribution of livestock to agricultural GDP is the most commonly quoted single measure of livestock’s importance to the overall national economy. Agricultural GDP represents the value of unprocessed or lightly processed agricultural produce at point of first sale. Part I of this report reviews the methods currently used by MOFED to estimate the contribution of livestock to Ethiopian agricultural GDP and recommends some modification to these methods. The impact of adopting these modifications is illustrated by recalculating livestock’s contribution to agricultural GDP in 2008-09. This part of the present report summarizes the first part of IGAD LPI Working Paper No. 02-10, and contains no material not already presented in the earlier report.
1.2 Summary of previous work
Table 1 shows the gross value of 12 categories of livestock product output as originally calculated by MOFED and as recalculated according to revised production coefficients and livestock population estimates recommended in WP 02-10.
Table 1: Estimated Gross Value of Ruminant Livestock Production 2008-09, billion EB
Product or service MOFED ESTIMATE REVISED ESTIMATE Cattle offtake 6.302 8.103 Sheep offtake 1.643 2.254 Goat offtake 1.563 2.255 Camel offtake 0.145 0.145 Total estimated offtake 9.653 12.757 MOFED total offtake 9.653 Cattle milk 8.483 10.899 Cattle milk for butter 4.533 5.824 Goat milk 1.352 6.436 Camel milk 1.978 3.346 Butter residue 3.125 4.015 Total estimated milk + products 19.471 30.520 MOFED total 19.634 Sheep wool 0.003 0.005 Dung for fuel 1.966 3.429 Change in stocks 1.384 1.384 TOTAL RUMINANT PRODUCT OUTPUT 32.64 48.095 Percentage change 47% Animal draught power 0 21.500 TOTAL RUMINANT PRODUCTION 69.595 Percentage change 113%
Source: IGAD LPI Working Paper No. 02-10
The background research that provides evidence for the revised figures in Table 1 was discussed in the preceding working paper and the revised coefficients are given in Annex 1 of this report. Using 2008-09 as a basis for comparison, the new coefficients yield a recalculated total gross value for 12 categories of ruminant livestock production that is an increase of about 46% over the

14
gross value of the same production categories using MOFED’s earlier set of coefficients and herd sizes. While these recalculations represent a significant increase in output estimates, they result from up-dating of productivity coefficients and, to a lesser extent, a revised estimate of the size of the national herd. These adjustments refine but in no way question the basic methods employed by MOFED in the calculation of agricultural GDP.
The valuing of animal draught power raises more fundamental issues. About 80% of Ethiopian farmers use animal traction to plough their fields. Both the mean area cultivated by a farm household and yields per hectare are positively associated with cattle ownership and ploughing, in comparison to hand cultivation. There can therefore be no doubt that draught power makes a measurable contribution to agricultural output. Nonetheless, no attempt is currently made to impute the monetary value of animal traction for Ethiopian agriculture. Using oxen rental rates as a basis for valuing the use of oxen by farmers on their own fields, WP 02-10 provisionally put the value of the animal draught power input at 26.4% of the value of annual crop production. For purposes of calculating agricultural GDP, this calculation transfers 26.4% of the value of the production of annual crops from the arable to the livestock subsector. Based on these figures, nearly a third (31%) of the total gross value of livestock output was represented by the value of animal drought power as an input into crop cultivation in 2008-09.
One reading of the version of the international guidelines for national accounting currently used in Ethiopia (System of National Accounts, SNA 1993), suggests that ploughing services are correctly classified for GDP purposes as animal husbandry service activities under the agricultural sector. An alternative interpretation might conclude that, though real enough, the value of ploughing services lie outside ‘the production boundary of the System’ and must be excluded for technical reasons. If we accept that ploughing services are correctly included in agricultural GDP, then the recalculated gross value of the output of ruminant livestock represents an increase of about 113% over prevailing estimates, again using data from 2008-09 as a basis for comparison and combining both the estimated value of animal traction for cultivation with the use of the revised production coefficients discussed earlier (Annex 1).
Although the proportional contribution of livestock and crops fluctuates from year to year, if we include the value of ploughing services, livestock provided 45% of agricultural GDP in 2008-09. Previous MOFED estimates placed livestock’s contribution at about 25% of total agricultural GDP (Annex II). The gap between these two estimates suggests that the significance of livestock relative to crop production has been considerably underestimated in past calculations of agricultural sector GDP. Even if technical considerations exclude ploughing services from GDP estimates, the quantification and expression of this value in monetary terms underlines the need to rethink the role and relative importance of crops and livestock in Ethiopian agriculture.

15
PART II – LIVESTOCK SERVICES NOT CAPTURED IN CONVENTIONAL NATIONAL ACCOUNTS
2.1 Introduction
Part II of this report examines two kinds of economic contributions made by livestock – to financial services and to transport/haulage – that are imperfectly represented in the conventional system of national accounts. Though not exclusively, both of these kinds of economic activity tend to directly support the livelihoods of livestock owners.
The International Standard Industrial Classification of All Economic Activities (ISIC), which catalogues all economic activities recognized for national accounting purposes, explicitly recognizes ‘financial intermediation’ as a separate accounting category. The exact wording of the label for this category is significant. ‘Intermediation’ refers to specialized agents, individuals or organizations that provide financial services to others for a fee. As this report will show, many of the financial services derived from livestock in rural Ethiopia are provided by livestock for their owners, or are provided informally to kin and neighbours, often on a reciprocal basis. While the value of these ‘self-help’ financial services may be expressed in an increase in the value of the output from farming and pastoral households, GDP accounting does not attempt to isolate this contribution. The following analysis will show that the contribution of livestock-based informal financial services to household welfare is large and that disaggregating the value of these services from agricultural output in general improves our understanding of how Ethiopia’s economy actually functions.
The ISIC also recognizes transport as an accounting category for GDP estimates, but again the definition of this category is too restrictive to capture the full range of transport benefits provided by livestock in Ethiopia. In GDP estimates, the value of the transport that producers supply for themselves is ‘embedded’ in the value of their output. According to these accounting conventions, the value of the services of a farmer’s mule (or car) appears in the estimates of agricultural product output from the entire farming operation. Or to take an industrial example, the economic contribution made by a fleet of vehicles (or pack camels) owned and operated by a cement company will be expressed, for national accounting purposes, in the value of the cement produced by that company, and will not appear separately in estimates of the value added to the economy by transport industries. Should the farmer hire his mule or the cement company contract its transport requirements from a separate supplier, then in principle these activities – identical in kind to the transport services supplied by producers for themselves – will be explicitly recognized in the estimates of the value added to GDP by transport. Since many rural households in Ethiopia provide their own animal transport and haulage, the estimated value of transport in standard national accounts excludes much of the real value derived from working animals by farmers and pastoralists.
2.2 Livestock-based financial services
Catastrophic fluctuations in household income are an abiding threat to the welfare of rural families in Ethiopia. Based on survey data from the late 1990s, Table 1 lists the prevalence of the most common shocks to farming households.

16
Table 2: Shocks faced by rural households in Ethiopia
Source Dercon 2001: 2
These shocks cause both direct and indirect economic losses. Severe shocks are often the direct cause of impoverishment, but even households that escape the worst effects of a particular event must deal with the possibility that similar events may recur. Persistent high levels of risk encourage households to adopt risk averse strategies that protect or ‘smooth’ their income over time, even if these strategies mean accepting lower incomes (Hoddinot et al. 2005). Avoiding risk can therefore have a pervasive negative effect on economic performance, as households (and particularly poorer households with a narrower margin for error) choose safer rather than more risky but more profitable courses of action.
Insulating producers from the distorting effects of pervasive risk is a challenge met differently in different economic settings. In industrial countries, formal economic institutions of the sort recognized in GDP accounting – savings banks, credit and loan facilities, insurance companies – help buffer households and firms from risk. None of these institutions commonly operate in much of rural Ethiopia, or in many parts of the developing world. Instead rural households are left to protect themselves or to work together for mutual protection.
One of the ways households protect themselves is by saving for hard times. In rural Ethiopia, as in much of Africa, most savings, especially by the relatively poor, are held in the form of real assets, the equipment or other capital goods used in agricultural production (Aryeetey and Udry 1995). In Ethiopia the savings asset of choice – both for farmers and pastoralists – is livestock. Table 3 looks at the asset composition for farmers across Ethiopia; livestock make up more than half of all the assets held by farmers and are far and away the most important single asset category.
Events causing hardship
Percentage households seriously affected last 20 years
Harvest failure (drought, flooding, frost, etc.) 78 Policy shock (taxation, forced labour, ban on migration…) 42 Labour problems (illness or deaths) 40 Oxen problems (diseases or deaths) 39 Other livestock (diseases or deaths) 35 Land problems (villagisation or land reform) 17 Assets losses (fire, loss) 16 War 7 Crime/banditry (theft or violence) 3

17
Table 3: Asset composition of households in 1994
Source: Ayalew 2003: 28
While the coverage of the formal banking system may have improved since the 1990s when the data in Table 3 was collected, there is little evidence to suggest that the importance of livestock has markedly declined in the intervening period: ‘When asked, most [farming] households would like to invest into cattle rearing and to a lesser extent, trade and business’ (Dercon 2001 15).
Livestock help in two different ways to fill the institutional vacuum created by the limited presence of formal financial institutions in rural Ethiopia. First, livestock can function as a form of credit in rural areas, giving livestock owners flexible access to the economic resources represented by livestock offtake, but without having to borrow money and pay interest on a loan. Secondly, the value of the assets tied up in livestock can provide a form of security against risk, in the absence of insurance agents, premium payments, and claims. The following sections estimate, first, the value of livestock offtake as a partial substitute for formal credit institutions, and then examine the role of livestock wealth as a form of insurance.
Because their value is not established by market exchanges, the amount of credit and insurance benefit that should be attributed to livestock is subject to debate and alternative methods of estimation. The estimation methods employed here are based on Bosman et al. (1997).
2.2.1 The value of livestock as credit
The credit or financing benefits of livestock derive from the ability of livestock owners to dispose of their animals for particular purposes at a time that they choose – their ability to ‘cash in’ on the value of their animals as needed. This flexibility gives livestock owners ready access to money without the need to borrow and confers an additional financial benefit beyond the sale, slaughter or transfer value of their livestock. This additional financial benefit can be estimated as the opportunity cost of rural credit – what it would otherwise cost a livestock owner to obtain funds comparable to those produced by liquidating a part of the herd. Employing this method of estimation, the additional finance value of a livestock holding is equivalent to the interest that the owners would be required to pay to obtain loans equal to the value of their livestock offtake.
In practice this calculation is not straightforward. Rural financial markets are often described as fragmented in the sense that different kinds of borrowers are serviced by a wide array of lenders offering loans subject to different repayment conditions. As a result, the interest rates changed by rural lenders can vary widely within a community, ranging from zero for loans between kin and
Assets
Mean value in birr
Number of households
% sampled households
Livestock 2181 1154 78 Farm tools and implements 49 1307 89 Wooden and other furniture 112 1100 75 Cooking materials 140 345 23 Radio, tape, jewellery watch 66 305 21 Guns, spear, etc. 158 186 13 Cart 535 18 1.2 ‘Gotera’ (grain storage basket) 391 6 0.4 Others 120 22 1.5 Sampled households 1477 Holders of bank accounts 12 0.8

18
friends to well over 100% per annum on loans from professional moneylenders (Banerjee 2003, cited in Conning and Udry 2005). Nominal interest rates are also misleading when high rates of monetary inflation reduce the real interest rate that borrowers actually pay.
We were unable to obtain current information on the interest rates being charged on average for rural lending in Ethiopia. Table 4 nonetheless presents some illustrative interest rates both for rural Ethiopia and for a selection of other African countries over a range of years. From previous work (IGAD 2010: Table 15) we already know that total ruminant livestock offtake (cattle, sheep, goat and camel) in Ethiopia in 2008-09 had a value of about 12.8 billion EB. In the absence of firm evidence on rural interest rates, the additional financial benefit to Ethiopia’s economy that can be ascribed to this offtake ranges from about 2.56 billion EB (at an annual interest rate of 20%), to 15.36 billion EB (120% annual interest) to 25.6 billion EB (annual interest of 200%). Clearly much hinges on establishing the correct rural interest rate. From table 4 it is also clear that informal rural annual interest rates of 100% are not unusual, and in some respects lie in the middle range of available estimates. If we assume that inflation adjusted interest rates on rural credit in Ethiopia are currently running at about 100% per annum, then the financial value of livestock offtake is identical to the annual value of offtake – in 2008-09 , for example, about a 12.8 billion EB. financial benefit on top of 12.8 billion in direct offtake value.
Table 4: Interest rates in informal rural credit markets in sub-Saharan Africa
Source and country Loan period Interest rate
Ayalew 2000 – Ethiopia 1 year 18.3-100%
Gobezie n.d. – Ethiopia 1 year 60-120%
Admasie et al 2003 – Ethiopia 1 month 5-15%
6 months 50-100%
1 year 231%
Udry 1994 – Nigeria 1 month 2.6 to -7.5% – inter-household, rates depending on household circumstances
Aryeetey 1994 – Ghana 1 month 8% - moneylender
3 months 25-30% - moneylender
6-12 months 50-100% - moneylender
2.2.2 The value of livestock as insurance
2.2.2.1 Self- insurance
Part of the insurance or security value of livestock comes from the ability of owners to liquidate their own herds in an emergency. In this instance, the level of security provided to a particular individual depends on the value of that individual’s assets, so livestock ownership functions as a kind of self-insurance. The value of this form of asset-based insurance can be calculated as the annual cost that herd owners would need to pay to purchase insurance coverage equal to the capital value of their herd. For example, the capital value of the Ethiopian herd in 2008-09 was roughly 86 billion EB. The value of these assets as self-insurance would then be equal to the

19
insurance premiums that rural Ethiopians would need to pay to provide themselves with 86 billion EB of insurance coverage, i.e. the opportunity cost of comparable levels of coverage.
Rural community-based insurance systems, iddir, are well established in Ethiopia. They consist of:
An association made up by a group of persons united by ties of family and friendship, by living in the same district, by jobs, or by belonging to the same ethnic group, and has an object of providing mutual aid and financial assistance in certain circumstances … In practice, the iddir is a sort of insurance programme run by a community or group to meet emergency situations (Mauri 1987, quoted in Aredo 1993).
Though originally created to cover burial costs, the iddir currently provide a wide range of services, have written constitutions and are routinely financed by monthly contributions from their members, augmented in some cases by one-off entrance fees. Iddir membership is widespread in rural areas (Dercon et al. 2004; Bold n.d.).
The de facto ‘insurance premium’ rate that sustains iddir can be calculated as the average annual fee paid by group members relative to the average annual payout. These fees constitute the real cost of insurance for rural Ethiopians. As Table 5 demonstrates, the insurance rates charged by iddir are remarkably uniform at around 10% of the value of an average payout.
Table 5: Rural insurance premiums expressed as a percentage of insurance payouts
Source and country
Annual Premium as a percentage of annual payout
Bold n.d. – Ethiopia in 2003-04 9.65% Ayalew et al. 2001 – Ethiopia 8.25% Dercon et al. 2004 – Ethiopia in 2002-03 9.55% annual payment without entrance fee
11.59 annual payment with entrance fee spread over 10 year membership period 13.63% annual payment with entrance fee spread over 5 year membership period
Bosman et al. 1997 – Nigeria (Igbo clubs providing informal life insurance)
10%
If insurance coverage in rural Ethiopia costs about 10% of the value of the cover provided (as Table 5 implies), then the self-insurance value of Ethiopian livestock in 2008-09 was about 8.6 billion EB or 10% of the capital value of the national herd.
2.2.2.2 Risk pooling
For pastoralists in Ethiopia, the insurance value of livestock derives not only from their ability to liquidate their individual herds, but also from their ability to call upon assistance from fellow pastoralists in time of need. These collective insurance schemes are based on the gifting and loaning of livestock within pastoral communities, with large herd owners donating some of their animals and less well-off pastoralists drawing support in the form of livestock received as gifts or on loan. Since transfers are in-kind – meat, milk, live animals and traction/transport services – contributions into these systems are roughly comparable to withdrawals from them. The value of the system from the perspective of resource givers and receivers is therefore approximately equal: poorer pastoralists extract a level of support from the system that equals what richer

20
pastoralists are willing to invest in order to maintain their reputation for generosity and thereby retain their right to call upon community support if they require future assistance. The value of this communal system of livestock insurance is therefore equal to the level of livestock loaning and gifting within a pastoral community.
No one knows for sure how many pastoral livestock exist in Ethiopia. In the absence of facts, the conventional assumption is that 30% of the nation’s cattle and sheep, 70% of the goats and all camels reside in pastoral areas (PADS Vol. 2, Study 5, Animal Breeds). By these standards in 2008-09, out of a total capital value of 86.455 billion EB for the national herd, 34.779 billion EB worth of Ethiopia’s livestock were managed by pastoralists (in billion EB: 20.258 for cattle, 2.254 for sheep, 5.011 for goats and 7.256 for camels). Like farmer-managed livestock, these animals will have the self-insurance value that can be ascribed to all Ethiopian livestock, as discussed in the previous section. Some pastoral animals will also have an additional collective insurance value depending on how many animals are involved in livestock sharing schemes designed to pool risk.
Table 6 summarizes the results of recent work on rates of livestock sharing among pastoralists in southern Ethiopia and northern Kenya.
Table 6: Rates of animal sharing in southern Ethiopian and northern Kenyan rangelands
Country Site Ethnic majority
Gifted animals as %
of herd
Borrowed animals as %
of herd
Total shared animals as %
of herd Kenya Dirib Gumbo Boran 13 5 18
Kargi Rendille 3 10 13 Logologo Ariaal 6 2 8 Ng’ambo Il Chamus 8 0 8 North Horr Gabra 9 2 11 Sugata Marmar Samburu 10 2 12
Ethiopia Dida Hara Boran 10 5 15 Dillo Boran 4 3 7 Finchawa Guji/Gabra 1 9 10 Qortate Boran 1 0 1 Wachille Boran 9 3 12
Unweighted mean
10.5
Source: Barrett et al. 2006; McPeak et al. forthcoming 2011
If 10.5% of all pastoral animals in Ethiopia are involved in livestock sharing networks and if the total capital value of pastoral livestock in Ethiopia is 34.779 billion EB, the collective insurance value of pastoral herds can be estimated at 34.779 x .105 = 3.652 billion EB in 2008-09.
2.3 Transport and haulage by equines
This section estimates the national economic benefits derived from the use of equines – horses, donkeys and mules – as providers of transport, traction and haulage.
Ethiopia is home to a lot of equines. According to FAOSTATS, Ethiopia contains over 40% of sub-Saharan Africa’s horses and donkeys and over 90% of the subcontinent’s mules. World-wide, only

21
China has more donkeys than Ethiopia (FAOSTAT http://www.fao.org/corp/statistics/). Ethiopian equines are working animals. Pack and riding animals compete successfully with wheeled vehicles because of the country’s rugged terrain and poor road network, both in remote rural areas and in parts of some cities. Equine power therefore has a clear economic value, which is implicitly recognized by MOFED since it assigns producer prices to equines. However, MOFED has not developed output coefficients to estimate equine work capacities, and neither CSA nor MOFED assign producer prices to the services supplied by equines. Aside from their value as stock or as a store of value, for purposes of calculating agricultural GDP, equines might as well not exist.4
Table 7 presents recent national statistics on equine populations. For reasons that at present are unclear, MOFED estimates of these populations differ – in some years quite substantially – from CSA estimates based on annual livestock surveys (Table 7). Calculations in this report will use the CSA survey data, but these surveys (like the MOFED figures) are only partial since they omit the pastoral zones of Afar and Somali Regions.
Table 7: National equine populations, 1000 head, MOFED and CSA estimates
Stock type
1997 2004-05
1998 2005-06
1999 2006-07
2000 2007-08
2001 2008-09
2002 2009-10
MOFED CSA MOFED CSA MOFED CSA MOFED CSA MOFED CSA MOFED CSA Donkey
4171 3930 4171 4289 4172 4498 4173 5573 4173 5422 - 5715
Horses 1504 1518 1506 1569 1507 1655 1509 1776 1510 1787 - 1995 Mules 357 318 358 341 358 326 359 377 359 374 - 366
The most recent CSA survey of pastoral livestock in Afar and Somali Regions occurred in 2003. Information from this survey is used in Tables 8 and 9 to correct the partial coverage of the annual CSA surveys by including pastoral equines. A detailed explanation of correction procedures employed here is contained in section 1.2 of IGAD LPI WP 02-10.
Table 8: CSA 2008-09 national equine livestock population estimates adjusted to include pastoral animals in Afar and Somali Regions
Donkeys Horses Mules
A CSA National 5421895 1787211 373519 B Afar (2 Zones) 26451 0 0 C Somali R. (3 Zones) 96670 0 0 D = A – (B + C) CSA national, 5
Zones removed 5298774 1787211 373519
E Constant 1.0874 1.0006 1.0109 F = D + E CSA national
adjusted 5761887 1788283 377590
G MOFED national ‘000 head
4173 1510 359
4 It would appear that retail price surveys are the only attempt made by the CSA to establish regional
and national prices for equine power. According to the most recent retail price survey, the ‘national average animal transport fare’ in 2008-09 was 33.51 EB per trip, a figure that in isolation is of little use, if we do not also know what kind of journeys this fare applies to and how frequently working animals could be expected to make such a trip.
22
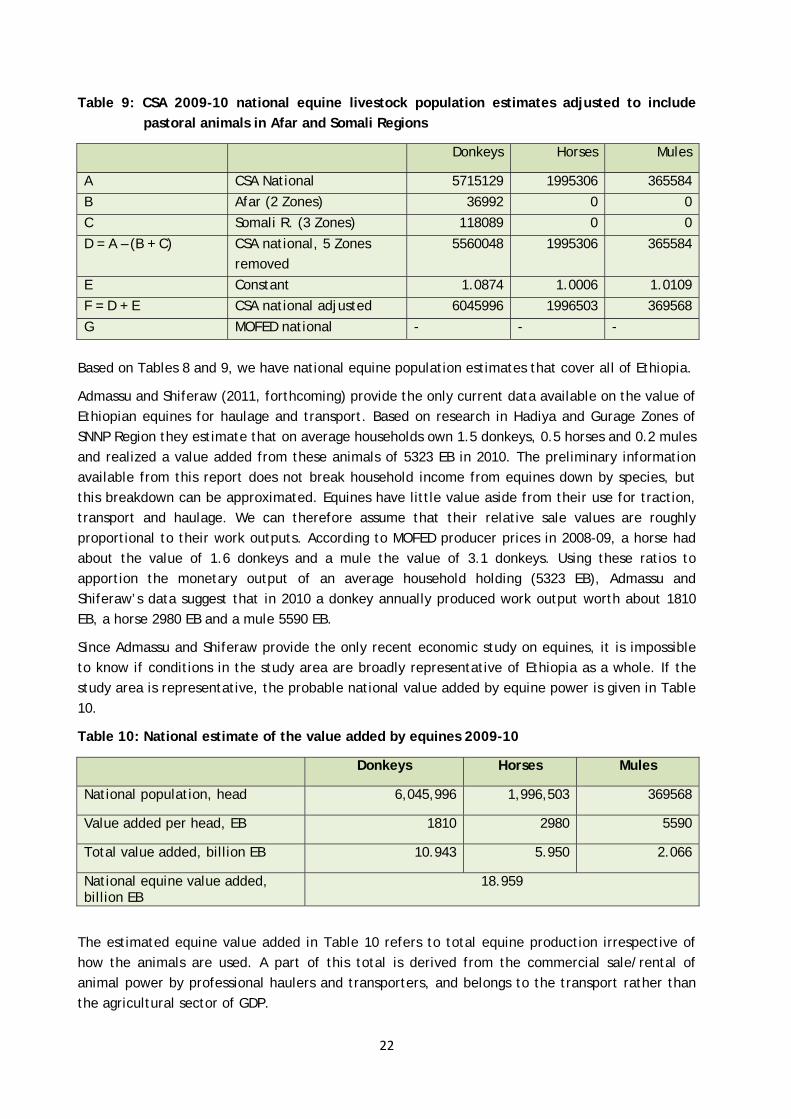
Table 9: CSA 2009-10 national equine livestock population estimates adjusted to include pastoral animals in Afar and Somali Regions
Donkeys Horses Mules
A CSA National 5715129 1995306 365584 B Afar (2 Zones) 36992 0 0 C Somali R. (3 Zones) 118089 0 0 D = A – (B + C) CSA national, 5 Zones
removed 5560048 1995306 365584
E Constant 1.0874 1.0006 1.0109 F = D + E CSA national adjusted 6045996 1996503 369568 G MOFED national - - -
Based on Tables 8 and 9, we have national equine population estimates that cover all of Ethiopia.
Admassu and Shiferaw (2011, forthcoming) provide the only current data available on the value of Ethiopian equines for haulage and transport. Based on research in Hadiya and Gurage Zones of SNNP Region they estimate that on average households own 1.5 donkeys, 0.5 horses and 0.2 mules and realized a value added from these animals of 5323 EB in 2010. The preliminary information available from this report does not break household income from equines down by species, but this breakdown can be approximated. Equines have little value aside from their use for traction, transport and haulage. We can therefore assume that their relative sale values are roughly proportional to their work outputs. According to MOFED producer prices in 2008-09, a horse had about the value of 1.6 donkeys and a mule the value of 3.1 donkeys. Using these ratios to apportion the monetary output of an average household holding (5323 EB), Admassu and Shiferaw’s data suggest that in 2010 a donkey annually produced work output worth about 1810 EB, a horse 2980 EB and a mule 5590 EB.
Since Admassu and Shiferaw provide the only recent economic study on equines, it is impossible to know if conditions in the study area are broadly representative of Ethiopia as a whole. If the study area is representative, the probable national value added by equine power is given in Table 10.
Table 10: National estimate of the value added by equines 2009-10
Donkeys Horses Mules
National population, head 6,045,996 1,996,503 369568
Value added per head, EB 1810 2980 5590
Total value added, billion EB 10.943 5.950 2.066
National equine value added, billion EB
18.959
The estimated equine value added in Table 10 refers to total equine production irrespective of how the animals are used. A part of this total is derived from the commercial sale/rental of animal power by professional haulers and transporters, and belongs to the transport rather than the agricultural sector of GDP.

23
2.4 Summary Part II: the value of livestock services to rural livelihoods
Table 11 summarizes the value of all the goods and services derived from livestock.
Table 11: Livelihood benefits derived from ruminant and equine livestock, 2008-09 in billion EB
Type of benefit Agricultural GDP Services not in current GDP estimates
Value added livestock products (meat, milk, etc)5
MOFED: 32.232 re-estimated: 47.6876
Traction power for ploughing 21.500 Benefit from financing 12.800 Benefit from self-insurance 8.600 Benefit from risk pooling/stock sharing 3.650 Transport and haulage by equines* 18.959* Sub-totals 47.687 65.590 Total economic benefits 113.196
Notes: *refers to 2009-10
Total economic benefits of livestock goods and services, now estimated at more than 113 billion EB, are more than three and a half times greater than the MOFED’s standard GDP estimate of the value added from livestock in 2008-09. Of the roughly 80 billion EB increase in benefits, about 15 billion EB are derived from recalculating the value of livestock products, and the remaining 65 billion come from broadening the estimation to include livestock services.7
In practice, the use of equines for ploughing may cause the double counting of these benefits, but the estimations in Table 11 otherwise refer to distinct categories of livestock income. Output in the form of material products is obviously different from livestock services. Financing benefits are a function of herd offtake, the portion of livestock holdings that is used to meet household requirements. Insurance benefits, on the other hand, are a function of the level of livestock capital retained after offtake has taken place (Bosman et al. 1997). Self-insurance reflects personal wealth in livestock; risk pooling is a measure of an individual’s ability to call upon the livestock wealth of others. It is appropriate to sum the values in Table 11 and, at least in principle, EB 113.196 billion is a methodologically defensible estimate of the gross domestic product from Ethiopian livestock in 2008-09.
5 Defined as the gross value of ruminant output less intermediate costs of 408,026 EB, i.e. all of
MOFED’s intermediate livestock production costs except poultry feed (IGAD 2010 Table 4). 6 Source IGAD LPI Working Paper No 02-10 (2010) 7 Table 11 is flawed because it combines data from two years – from 2009-10 for equine power and
from 2008-09 for all other outputs. This shortcoming will be corrected in the final version of this report, which will adjust all estimates to a common year based on additional data from MOFED.

24
PART III – THE CONTRIBUTION OF LIVESTOCK TO THE WIDER ECONOMY
3.1 Introduction
This part of the report examines three different ways Ethiopians make use of livestock outputs – for private consumption, as exports, or as inputs into other domestic industries. For a variety of reasons, estimating the scale of these different forms of utilization is imprecise. What this exercise does confirm is the great diversity of ways in which livestock contribute to the national economy.
3.2 The role of livestock in household consumption and expenditure
Table 12, summarizes information in the national accounts on household consumption and expenditure. The estimates in Table 12 are extrapolated from results contained in two CSA Household Income, Consumption and Expenditure (HICE) Surveys, the first in 1999/2000 (Bulletin 258) and the second in 2004/05 (Bulletin 394). By going back to the CSA survey reports, it is possible to get some general idea of the contribution of meat and dairy products, by far the most important livestock consumables, to household expenses.8
According to the survey in 1999/2000, about 11.6% of all expenditures on food and drink at home were on livestock products; the 2004/05 survey estimates this proportion at 11.2%. Taking an average of these two values, if 11.4 % of the 126.553 billion EB spent in 2008-09 on food, beverages and tobacco was spent on products originating from livestock (Table 12), then this category of household expenses amounted to about 14.427 billion EB in that year.
Estimates the value of livestock food products consumed outside the home are imprecise. It is unclear how much of the 14.316 billion EB expenditure under ‘hotels, cafes and restaurant’ in 2008-09 (Table 12) should be attributed to accommodation or to food. The 2004/05 HICE survey documented food and drink costs outside the home at about 10% of those inside the home. On this basis, food and drink consumed outside the home in 2008-09 was worth in total 12.655 billion EB. If 11.4% of these food costs were (as in the home) spent on items originating from livestock, then expenditures outside the home on food and drink of livestock origin amounted to 1.44 billion EB in 2008-09, though the degree of error in this estimate is probably large
Transport is another area in which we can get a general idea of the proportion of the total household budget that was spent to acquire animal powered services such as pack animals and cart transport. According to the 1999/2000 survey, expenditure on animal transport constituted 8.1% and in the 2004/05 survey about 12.5% of total spending on transport. Taking the mean value given by the two surveys, If we assume that livestock transport services constituted 10.3% of the cost of all household transport in 2008-09, then households spent 1.059 billion EB on providing these services for themselves in that year.9
8 According to CSA survey data in 2004/05, 52% of all household expenditure was devoted to food,
beverage and tobacco (CSA 2007 Table 3.14); in Table 12, MOFED estimates that expenditures on this category amount to about 45% of total household expenditure in 2004/05. The reasons for this apparent discrepancy are unclear, but this and other similar complications emphasize that we are dealing here with rough approximations.
9 There is, however, a serious deficiency in the livestock transport data that does not apply to the information on food expenditures. Because they are goods, the estimates of household food expenses include the value of home-produced home-consumed food. On the other hand, because they are

25
Table 12: Private final consumption expenditure at current market price (million birr)
Source: MOFED unpublished
An estimate of the value of household expenditures on dung purchases for fuel, 2.0 billion EB in 2008-09, is available from MOFED’s calculations of agricultural sector GDP. For still other categories of expenditure it is not possible to give any estimate of the livestock component. This is the situation with respect to the contribution of leather goods and animal fibres to the general expenditure heading ‘Clothing and footwear’. While it might be possible to extract information on the consumption of these livestock products from the original CSA survey data, it is not possible to reconstruct this information from published CSA reports given the way the data has been aggregated.
Even taking into account the blank spots in our knowledge, the total national contribution of livestock to household expenditure would appear to be modest. Table 13 sums these values, for a total documented final consumption expenditure value for livestock products and services of 19.0 billion EB in 2008-09. MOFED estimated national total household expenditures in that year at 286.320 billion EB, implying that less than 7% of household expenditures could be attributed to consumption made possible by livestock outputs.
services, the estimates of household expenditure on transport exclude the value of any transport services that are supplied by animal owners for themselves. This approach is consistent with national accounting guidelines which do not separately enumerate the value of any kind of transport/haulage service – animal-powered or motorized – supplied by firms or individuals for their own use. It would appear, however, that the CSA surveys also did not enquire about these self-servicing activities, which means that it is now difficult to reconstruct how much of the total transport/haulage value actually received by owners from their animals has been ignored.
1992 1993 1994 1995 1996 1997 1998 1999 2000 2001
Description 1999/00 2000/01 2001/02 2002/03 2003/04 2004/05 2005/06 2006/07 2007/08 2008/09
Food, Beverage & Tobacco 27,902 27,889 26,676 30,794 35,574 38,833 48,638 61,582 93,243 126,553
Clothing & Footwear 3,460 2,904 3,859 4,614 4,405 6,176 7,887 9,967 15,062 20,443
Housing, Water, Electricity Gas and Other Fuels 8,819 9,457 10,608 12,088 11,881 19,866 25,031 31,820 48,373 65,653
Furnishing, Household Equipment and Routine Maintenance of the House 2,933 4,372 4,073 5,075 5,147 6,726 8,380 10,495 15,716 21,331
Health 762 799 819 810 752 472 657 834 1,266 1,718
Transport 1,107 1,191 1,273 1,357 1,323 3,127 4,053 5,143 7,805 10,594
Leisure, Entertainment and Culture 262 301 363 402 406 584 767 973 1,477 2,004
Education 445 589 685 744 719 785 986 1,237 1,856 2,520
Hotels, Cafes and Restaurant 945 1,251 1,427 1,541 1,563 4,058 5,258 6,812 10,548 14,316
Miscellaneous * 2,094 2,507 2,906 3,221 3,256 6,385 7,887 10,148 15,611 21,188
TOTAL 48,728 51,260 52,690 60,645 65,026 87,012 109,546 139,012 210,958 286,320
Growth rate (%) 5.2 2.8 15.1 7.2 33.8 25.9 26.9 51.8 35.7

26
Table 13: Private final consumption of livestock products in 2008-09, billion EB
Expenditure Value
Animal origin food and drink – home consumed 14.5 Animal origin food and drink – outside the home 1.4 Animal transport rent or hire 1.1 Animal transport self service excluded Dung sold for fuel* 2.0 Dung produced on farm and used for fuel** excluded Other (footwear, leather products, woollens) unknown TOTAL 19.0
Notes: *Assumes the value of purchased household consumption to be equal to MOFED’s estimate of sold dung production since households are likely to be the only consumers.
** Dung produced by households for their own use can be valued at 1.4 billion EB in 2008-09, which represents the total value of dung production in that year (3.429 billion EB as estimated in IGAD LPI WP 02-10) less the value of sold production, estimated by MOFED at 2 billion EB.
Final private consumption does not absorb all the output of livestock goods and services. Some part of livestock GDP is reinvested in capital accumulation/change in stocks, some production is lost to domestic consumption through exports, the government may directly consume livestock outputs (in provisioning the military, for example), and some goods and services will be used as inputs into economic activities that produce outputs with no obvious connection to livestock.
Even taking these exclusions into account, the estimates in Table 13 of the private consumption of livestock products would appear to be very low. In 2008-09 MOFED estimated the value added from animal farming and hunting at 37.384 billion EB. If private consumption was roughly 19 billion EB, this implies that only about half of livestock GDP was privately consumed. This seems improbable since total national private final consumption (286.320 billion EB) averaged 85% of total national GDP (336.106 billion EB) at current prices in 2008-09. Using a re-estimated agricultural GDP value of 47.687 billion EB (recommended in IGAD LPI WP 02-10), the discrepancy between livestock output and product consumption is even greater. For reasons that are unclear, it is likely that a significant proportion of what Ethiopian households spend on livestock products and services is unaccounted or that an unexpectedly large portion of livestock GDP is exported.
The scale of the export trade in livestock and livestock products is examined in the next section.
3.3 Export trade in meat and live animals Figure 1 documents changes in the value of the legal export trade in live animals and meat from the 1970s to 2008, based on data collected by the National Bank of Ethiopia expressed in US dollars.

27
Figure 1: The value of official meat and live animal exports, million USD, 1971-2008
Source: Little et al. 2010, based Legese et al 2008, see Annex III.
From Fig. 1 it is clear that live animal export levels stagnated at a low level between 1991 and 2004 and then grew rapidly from 2005 through to 2008 (Little et al. 2010). Despite this recent expansion, the value of the official trade in meat and live animals is still only a fraction of the value of unofficial cross-border live animal exports. Since it is considered to be illegal by the Ethiopian authorities, the unofficial cross border trade is poorly documented, and its exact value is unknown. Estimating the extent of the unofficial cross border trade from Ethiopia is further complicated because animals move along multiple routes out of Ethiopia into four adjoining countries – Sudan, Somalia/Somaliland/Puntland, Kenya and Djibouti. Unfortunately, estimates of the scale of these movements refer to different time periods for each route:
• Somaliland: $42 million from Somali Region, circa 2003 (Nin Pratt et al. 2005); $57 million in 2009 (Little et al. 2010, citing Somaliland Chamber of Commerce)
• Puntland: The Puntland port of Bosasso became a major competitor to the port of Berbera in Somaliland after 2000 following the imposition of a ban on livestock imports imposed by Saudi Arabia due to concerns about animal health. By 2008-09, exports from Berbera and Bosasso were roughly equal at about 1.2 million head of sheep and goats and 75,000 head of cattle annually. Very approximately, exports via Puntland may be of equivalent value to those from Somaliland - $57 million in 2009 (Little et al. 2010, citing Somaliland Chamber of Commerce)
• Sudan via North Gondar: $18 million, circa 2007 (Mulugeta et al. 2007)
• Kenya via Moyale: $11 million from southern Ethiopia in 2001 (Mahmoud 2003, cited in Mahmoud 2010); $10 million from Somali Region, circa 2003 (Nin Pratt et al. 2005)
• Djibouti: Became a major player in livestock exports when it gained privileged access to the Saudi market in late 2006 after opening a Regional Quarantine Facility to certify the health of exported animals. At that time competing ports in Somalia and Somaliland were

28
banned officially from shipping to the Saudi market due to fears about Rift Valley Fever. 1.5 million sheep and goats were exported from Djibouti in 2007 and 2008, falling to 1 million in 2009 after the RVF ban was lifted (Majid 2010). We have no information on the proportion of the animals that transited legally or illegally from Ethiopia into Djibouti, or their monetary value.
• The Livestock Marketing Authority estimated total unofficial exports on all routes except to Sudan at US $105-107 million, circa 2000 (Hurissa and Eshetu 2002; LDMPS – Phase I, Vol. O, pp 21 citing the Livestock Marketing Authority). More recently, the Ethiopian Sanitary and Phytosanitary Standards and Livestock and Meat Marketing Program (SPS-LMM) estimated the value of the unofficial cross border trade at between $250 and $300 million US dollars per year (Little et al. 2010).
The bar to the right of Figure 2 compares official live animal and meat exports for 2008-09 with estimates of the different unofficial cross border trade flows enumerated above. About 50% of the sheep and goats exported through Berbera originate in Ethiopia’s Somali Region, and it is likely that a similar proportion of the animals exported from Bosasso come from Ethiopia (Majid 2010, citing Holleman 2002).
Figure 2: The annual value of the livestock trade, official and unofficial channels
If we combine recent SPS-LMM estimates of unofficial cross border trade ($250-300 million USD) with National Bank of Ethiopia estimates for official meat and live animal exports ($79 million USD), the total livestock meat and live animal export sector can be estimated conservatively at about $325 million USD in 2008-09.
3.3.1 Hides, skins and leather exports The value of official livestock and meat exports has fluctuated widely over the decades (Fig. 1). Official exports of hides, skins and leather have, in comparison, been both more stable and more valuable. The LDMPS (Phase I, Volume B Annex IV, 2007) provides annual export figures for the value of live animals, meat and hides/skins from 1984 to 2004. According to these figures, hides and skins averaged a yearly export value of $52,160,000 USD, livestock averaged $3,390,000 USD,

29
and meat $2,380,000. Over this twenty-one year period, hides and skins provided on average 90% of official livestock sector exports, livestock provided 6% and meat 4%. For a time in the 1990s, hides, skins and leather were Ethiopia’s second largest export earner after coffee.
The current situation is depicted in Table 14 which gives the US dollar value and percentage export share of Ethiopia’s major exports from 2002-03 to 2008-09. Table 14 shows that the contribution of the livestock sector (live animals, meat and hides, skins and leather products) to exports has held steady at about 11% of the national total, with declines in the value of skins, hides and leather being offset by roughly comparable increases in live animal exports. By 2008-09 the position of hides, skins and leather exports had declined to the point where these constituted less than half of the livestock sector’s contribution to official exports.
Table 14: Value in million US dollars and percentage of export share for major exports, 2002-2009
Commodity 2002-03 2003-04 2004-05 2005-06 2006-07 2007-08 2008-09 Coffee 165.26
34.2% 223.45 37.2%
335.37 39.6%
354.3 35.4%
424.2 35.8%
524.5 35.8%
375.9 26.0%
Leather, hides and skins
52.22 10.8%
43.59 7.3%
63.73 8.0%
75.0 7.5%
89.6 7.6%
99.2 6.8%
75.3 5.2%
Pulses 19.97 4.1%
22.58 3.8%
35.47 4.2%
37.0 3.7%
70.3 5.9%
143.6 9.8%
90.7 6.3%
Oilseeds 46.09 9.5%
82.66 13.8%
102.29 14.8%
211.4 21.1%
187.4 15.8%
218.8 14.9%
356.1 24.6%
Fruit and veg.
9.58 2.0%
12.72 2.1%
16.07 1.9%
13.2 1.3%
16.2 1.4%
12.8 0.9%
12.1 0.8%
Meat 2.42 0.5%
7.66 1.3%
14.59 1.7%
18.5 1.9%
15.5 1.3%
20.9 1.4%
26.6 1.8%
Live animals 0.481 0.1%
1.91 0.3%
12.82 1.5%
27.6 2.8%
36.8 3.1%
40.9 2.8%
52.7 3.6%
Chat 58.02 12.0%
88.02 14.7%
99.96 11.8%
89.1 8.9%
92.8 7.8%
108.3 7.4%
138.7 9.6%
Gold 42.08 8.7%
48.71 8.1%
52.50 7.0%
64.7 6.5%
97.0 8.2%
78.8 5.4%
97.8 6.8%
Flower - 2.3 0.4%
7.8 0.9%
21.8 2.2%
63.6 5.4%
111.8 7.6%
130.7 9.0%
Others 86.66 18.0%
66.7 11.1%
73.0 8.6%
87.8 8.8%
91.8 7.7%
106.3 7.2%
91.3 6.3%
Total 482.78 100%
600.45 100%
817.74 100%
1000.3 100%
1185.1 100%
1465.7 100%
1447.9 100%
Livestock/ products share
11.4% 8.9% 11.2 12.2 12.0 11.0 10.6
Source: Compiled from National Bank of Ethiopia Annual Reports from 2004-05 to 2008-09
3.3.2 Reassessment of the national importance of livestock sector exports From the perspective of official export figures, livestock and their products make a regular but modest contribution (Table 14). But the official figures do not tell the entire story, as has already been discussed in section 3.3. Accordingly, Table 15 takes the LMA 2000 estimate for the value of informal cross border livestock trade (US $106 million) and combines this figure with official exports in 2002-03, and does the same for the SPS-LMM 2008-09 estimate (US $250 million), which is incorporated into the official figures for 2008-09.

30
Table 15: Value (million US dollars) and percentage of export share for major exports, with and without the cross border livestock trade – 2002-03 and 2008-09
Commodity 2002-03 official
2002-03 cross border included
2008-09 official
2008-09 cross border included
Coffee 165.26 34.2%
165.26 28.1%
375.9 26.0%
375.9 22.1%
Leather, hides and skins 52.22 10.8%
52.22 8.9%
75.3 5.2%
75.3 4.4%
Pulses 19.97 4.1%
19.97 3.4%
90.7 6.3%
90.7 5.3%
Oilseeds 46.09 9.5%
46.09 7.8%
356.1 24.6%
356.1 21.0%
Fruit and veg. 9.58 2.0%
9.58 1.6%
12.1 0.8%
12.1 0.7%
Meat 2.42 0.5%
2.42 0.4%
26.6 1.8%
26.6 1.6%
Live animals 0.48 0.1%
106.48 18.1
52.7 3.6%
302.7 17.8
Chat 58.02 12.0%
58.02 9.9
138.7 9.6%
138.7 8.2%
Gold 42.08 8.7%
42.08 7.1%
97.8 6.8%
97.8 5.8%
Flower - - 130.7 9.0%
130.7 7.7%
Others 86.66 18.0%
86.66 14.7
91.3 6.3%
91.3 5.4%
Total 482.78 100%
588.78 100%
1447.9 100%
1697.9 100%
Livestock/ products share
11.4% 19.66% 10.6 23.8%
For the two years that it covers, Table 15 undoubtedly provides a more realistic estimation of Ethiopia’s export situation than do the official figures alone. Including the cross border trade, live animals were the second most important national export by value in 2002-03, following coffee, and the third most important export in 2008-09, following coffee and oilseeds. The revised total value of livestock and their products now stands at about 20% of all national exports, up from 11% according to official calculations.
Even including the cross-border trade, the vast bulk of Ethiopia’s livestock output is consumed domestically. Household expenditure on livestock products was estimated in 2008-09 at 19 billion EB (section 3.2). Generous estimates of the total value of livestock sector exports places their value at slightly more than 4 billion EB in that year. Domestic consumption outweighs exports by a factor of nearly five to one.
3.4 Livestock products as inputs into manufacturing CSA conducts separate surveys covering different sizes of manufacturing enterprises: cottage/handicraft manufacturing (surveyed in 2002, CSA 2003), small scale manufacturing (surveyed in 2007-08, CSA Bulletin 480, 2010), and large and medium scale manufacturing (surveyed in 2007-08, CSA Bulletin 472, 2009). These surveys contain sufficient disaggregated data to indicate the approximate proportion of all manufacturing that is devoted to animal products, as follows:

31
• In 2001-02, 2% of the gross value of production from cottage/handicraft manufacturing was derived from the manufacturing of livestock products (CSA 2003).10
• In 2007-08 1% of the gross value of production from small scale manufacturing was obtained from work on livestock products.11
• In the five years between 2003-04 and 2007-08 on average 6.35% of all large and medium scale manufacturing concerned livestock products.12
The relatively modest contribution of livestock food items to manufacturing GDP can be attributed to the importance of home produced food in Ethiopian diets. The CSA household consumption and expenditure survey for 2000 estimated that the value of home produced livestock food products accounted at the national level for 70% of all livestock food expenditures (MOFED unpublished records using the results of CSA 2001). The vast bulk of national meat and dairy consumption is not manufactured, transported or traded outside the home, and hence makes a small contribution to these sectors of national GDP.
Table 16 enumerates the overall contribution of the different sizes of manufacturing enterprises – cottage, small-scale and medium/large – to manufacturing GDP. Based on the relative importance of livestock related manufactures to each scale of enterprise, manufactures using livestock products contributed approximately 4.9% or .616 billion EB to total manufacturing GDP in 2008-09.
Table 16: Manufacturing GDP at current prices (,000 birr)
Year EFY 1992 1993 1994 1995 1996 1997 1998 1999 2000 2001Year 1999/00 2000/01 2001/02 2002/03 2003/04 2004/05 2005/06 2006/07 2007/08 2008/09Cottage/handicraft 730,650 769,288 822,153 842,177 879,440 1,088,557 1,237,341 1,488,793 1,962,432 3,028,048
Small Scale Manufacturing 425,911 471,975 471,768 456,882 497,602 569,716 619,341 723,792 817,841 1,007,435Large and Medium Scale Manufacturing 2,279,338 2,366,790 2,213,690 2,567,799 2,838,629 3,024,605 3,676,781 4,923,455 6,471,124 8,585,282 TOTAL 3,435,899 3,608,053 3,507,611 3,866,857 4,215,671 4,682,879 5,533,464 7,136,040 9,251,396 12,620,765
3.5 The contribution of animal power to the transport sector For most types of transport, MOFED uses the production approach to estimate the gross value of output. This method begins with an estimation of the annual volume of services provided by different kinds of commercial vehicles (cars, buses, etc.), the number of operating vehicles of each type, and the prices charged for different types of services. Value added is then derived by deducting operating costs such as fuel and vehicle maintenance from estimates of gross output (MOFED 2005). Similar methods were used in section 2.3 of this report to give a preliminary estimate of the national value of equine power.
MOFED does not use the production approach to estimate the value of animal transport. Instead, estimates of the monetary value of animal power for national accounts are extrapolated from
10 Derived from CSA 2003 Table 4.20A; 2% is the proportion of total cottage/handicraft manufacturing value added
contributed by five manufacturing categories 1. production and processing of meat, fruit and vegetables, 2. vegetable and animal oils and fats, 3. dairy products, 4. prepared animal feeds, and 5. tanning and dressing of leather and manufacture of footwear, luggage and handbags.
11 Derived from CSA 2010 Table 4.15; 1% is the proportion of total small scale manufacturing value added produced by three manufacturing categories 1.production, processing and preserving of meat and meat production, 2 vegetable and animal oils and fats 3. Luggage, handbags and footwear.
12 Derived from CSA 2009 Table 5.14; 6.35% is the proportion of total large and medium scale manufacturing value added produced by five manufacturing categories: 1. production, processing of meat, fruit and vegetables, 2. vegetable and animal oils and fats, 3. dairy products, 4. prepared animal feeds, and 5. tanning and dressing of leather and manufacture of footwear, luggage and handbags.

32
survey data on the average expenditure incurred by households in purchasing animal transport services, multiplied by the number of households. Table 17 gives estimates derived in this way for the contribution of animal transport to the transport sector between 1999 and 2009.
Table 17: Animal transport gross value added, at current prices (‘000 birr), 1999 to 2009
EFY 1992 1993 1994 1995 1996 1997 1998 1999 2000 2001
Gregorian year 1999/00 2000/01 2001/02 2002/03 2003/04 2004/05 2005/06 2006/07 2007/08 2008/09
Gross Value of Output 26,910.9 27,671.7 28,870.4 30,924.3 32,424.4 36,002.8 39,410.2 43,140.1 47223.1 51692.4
Intermediate Input 3,148.0 3,236.9 3,377.2 3,617.4 3,792.9 4,211.5 4,610.1 5,046.4 5524.0 6046.8
Gross Value Added 23,763.0 24,434.8 25,493.2 27,306.9 28,631.5 31,791.3 34,800.2 38,093.7 41,699.1 45,645.6
growth% 2.8 4.3 7.1 4.9 11.0 9.5 9.5 9.5 9.5
Source: MOFED unpublished
The estimates in Table 17 exclude two classes of economic benefit:
• all animal-powered transport services that economic actors organize for their own use.
• animal transport costs incurred by business enterprises.13
The estimate of 51,692,400 EB as the gross value of animal transport services in 2008-09 is likely to be a large underestimate. Aklilu and Catley (2011) examined the value of commercial camel transport and haulage services in what they termed ‘mid-altitude’ Ethiopia – at between 1100 and 2000 meters above sea level immediately above the central and north-eastern escarpments. These are primarily farming areas adjacent to pastoral regions in which camel herding is long-established. Aklilu and Catley demonstrated the rapid expansion of camel keeping into these mid-altitude areas and its economic importance. They estimated that the mid-altitude areas contained 200,000 head of camels in 2009-10. According to CSA agricultural surveys, approximately 20% of Ethiopia’s camel herd consists of working animals providing transport services, implying a mid-altitude transport camel population of 40,000 animals (CSA 2009). Aklilu and Catley’s data further suggest that a transport camel is likely to earn about 12,000 EB/year gross at 2009-10 prices. At this rate, the 40,000 working camels at mid-altitudes provide transport services worth 480,000,000 EB total gross value. An additional 6,534,000 EB is contributed by transport camels hauling salt from mines located in the Danakil Depression at Reged in Berahle (estimate based on 1210 camels rented at 20 EB/day working for nine months per year, Aklilu and Catley 2011: 9-11). Adding together general transport services and the haulage of salt, the total gross value of camel transport services is unlikely to be less than 486,534,000 EB in 2009-10., or more than nine times the MOFED estimate of the gross value of all animal transport services in 2008-09.
3.6 Summary Part III: The contribution of livestock to the wider economy Part III examined the most important ways Ethiopians use animal production – as consumables, as exports and as industrial inputs. While this analysis is inconclusive because there is insufficient reliable data, it supports the following preliminary conclusions:
• In 2008-09 the consumption of livestock products constituted 7% of household expenditures. It is likely, however, that a significant proportion of what Ethiopians households spend on livestock, their products and services is unaccounted. The value of
13 The estimations of the value of animal transport in Table 17 disagree with HICR survey results which are
summarized in section 3.2 and which provide the benchmark data for calculating the values in Table 17.

33
household expenditures on livestock-related products amounts to a little over half of the lower MOFED estimate of the value of livestock’s contribution to agricultural GDP. If we adopt the higher estimate of the value of livestock production recommended by IGAD LPI WP 02-10, then private consumption absorbs only about 40% of livestock output. At least in accounting terms, a lot of livestock output has gone missing.
• The export of livestock and livestock products could explain the discrepancy between production and consumption levels, but the actual volume of exports is unknown. This is because the bulk of livestock exports are deemed by the government to be illegal and are, as a consequence, poorly documented. The importance of different export items fluctuates from year to year, but in the recent past official livestock exports have constituted about 11% of all of Ethiopia’s exports. Combining official and informal exports, livestock probably contribute about 20% of the present value of all exports. 20% is a conservative estimate and the actual contribution to exports by livestock could be much higher. No one knows for sure, and until the cross border trade in live animals is recognized and monitored, no one is likely to find out.
• Even including the cross-border trade, the vast bulk of Ethiopia’s livestock output is consumed domestically. Household expenditure on livestock products was estimated in 2008-09 at 19 billion EB. Present estimates of the total value of livestock sector exports places their value at slightly more than 4 billion EB in that year. Domestic consumption outweighs exports by a factor of nearly five to one.
• At present estimates of their size, exports do not fill the apparent gap between estimated livestock output and estimated domestic consumption. Using different estimation methods from those in this report, the most comprehensive recent assessment of the livestock sector – the Livestock Development Master Plan Study (LDMPS Phase 2, Volume O, 2007) – also noted a discrepancy between assumed levels of live animal exports and the supply of livestock available for exports after meeting domestic consumption needs. The report speculated that this anomaly could be caused by the underestimation of domestic consumption levels, but it could equally be explained by the underestimation of the scale of unofficial exports.
• Livestock exporters are also commodity importers, or smugglers in current government terminology. The proceeds of livestock exportation pay for the importation of clothing, food items and electrical goods, amongst other things. In this way, livestock and their exportation supply Ethiopians with a wide range of consumer items that have no apparent connection to livestock. Because they are deemed to be contraband, these material contributions to Ethiopian well being are, like the livestock exports that fund them, poorly documented and insufficiently appreciated.
• The manufacture of livestock products contributes about 5% of total manufacturing GDP. The livestock contribution to manufacturing is modest because Ethiopian households produce for themselves about 70% of the livestock products that they consume. In particular, the vast bulk of national meat and dairy consumption is not manufactured, transported or traded outside the home, and hence makes a small contribution to these sectors of GDP.

34
• The contribution of equines and camels to the transport sector is undoubtedly large but virtually undocumented. Animals power important parts of the Ethiopian transport and agricultural sectors but the scale of this contribution cannot be known without further study. The scattered information currently available suggests a vast underestimation of the value of animal transport in current national accounts.

35
CONCLUSIONS AND RECOMMENDATIONS
Livestock specialists frequently argue that livestock production is underrepresented in the GDP estimates of African nations. With respect to Ethiopia, this study confirms that argument. Part of the problem is caused by deficiencies in data and estimation procedures. A second source of error lies in the conventional rules of national accounting. Both shortcomings have been examined in this report.
Focusing on the outputs from ruminant livestock, the first report in this series (IGAD LPI Working Paper No 02-10) re-examined the contribution of livestock to agricultural GDP. The production coefficients presently used by MOFED to estimate livestock output are potentially outdated. Working Paper 02-10 evaluated and adjusted these production coefficients in light of current research and survey evidence. Using 2008-09 as a basis for comparison, the revised coefficients yielded a recalculated total gross value for 12 categories of ruminant livestock production that was an increase of about 46% over the gross value of the same production categories using MOFED’s estimation techniques. While these recalculations represented a significant increase in output estimates, they resulted from an up-dating of old productivity coefficients and, to a lesser extent, a revised estimate of the size of the national herd. These adjustments refined but in no way questioned the basic methods employed by MOFED in the calculation of agricultural GDP.
This second report takes on more fundamental questions concerning the adequacy of conventional national accounting techniques for semi-commercialized economies. At issue is the operational distinction in GDP accounting between material goods and services. At least in principle, the value of all goods is explicitly recognized for national accounting purposes, irrespective of whether these goods are traded or consumed by the household that produces them. In a semi-commercialized agricultural economy where herders and farmers directly consume a large part of what they produce, GDP estimates would have little attachment to reality if home production and consumption were ignored. This conclusion is reinforced by CSA surveys that estimate the value of home produced livestock food products at 70% of total household expenditures on livestock foods. The great bulk of the meat and milk products that Ethiopians eat are not processed or traded outside the home.
But if Ethiopian farmers and herders provision themselves with home produced goods, they also in large measure service themselves. The most important services provided by livestock include the supply of animal power (for traction, transport and haulage), and livestock as a source of financial services (as providers of credit, as a form of self-insurance and as a means of sharing or pooling risk). According to international conventions, the value of this self-servicing is not separately itemized in national accounts and therefore cannot be identified as part of the economic benefits that livestock provide. The calculations undertaken in this report suggest that the value of livestock services is about double the official estimated value added from the production of livestock goods. The bulk of what Ethiopian livestock provide the economy is therefore not identified in national accounts as coming from livestock. These distortions are particularly acute for highland agricultural systems in which animal energy for traction and dung for fuel are as important, or even more important, than conventional milk and meat production.
Ethiopian’s pastoralists are, on the other hand, specialized producers of meat, milk and live animals for sale. Provided their animals get into the computations at all, it might be hoped that

36
the output of pastoral herds would be adequately represented in national accounts. This is not the case.
Pastoral output underpins almost all of Ethiopia’s live animal and meat exports. Combined with hides, skins and leather exports (which are sourced primarily from highland animals) live animal and meat exports probably constitute about a fifth of all of Ethiopia’s international exports, but approximately half of these exports, and especially the live animals derived from pastoral areas, are not recorded and do not appear in official estimates prepared by the National Bank of Ethiopia. This is because the government deems the cross border trade in live animals to be illegal and does not recognize its existence. As putatively illegal animals flow out of Ethiopia, equally illegal consumer goods purchased by the proceeds of animal sales flow back. Live animal exports do not produce foreign exchange. What the cross border trade does finance is the provision of internationally sourced commodities, presumably exactly the goods on which Ethiopian consumers would want to spend their foreign exchange. All that has been lost is the paper trail that would link imported consumer goods to livestock production. What has suffered here is not the Ethiopian economy but rather, yet again, the recognition of the importance of livestock production in that economy.
These conclusions support the following recommendations:
1. The MOFED-led task force currently examining the contribution of livestock to agricultural GDP should develop objective methods for estimating livestock product and service outputs, based on a review of current scientific research as well as official survey data.
2. An accurate estimate of the contribution of livestock to Ethiopia’s agricultural GDP will not be possible until the size of national livestock populations has been established. Pastoral livestock numbers in Afar and Somali Regions were last enumerated in 2003-04, and a new survey of pastoral livestock is overdue. If cost or capacity limitations prevent pastoral areas from being included in the annual CSA Agricultural Sample Surveys, then the livestock in pastoral areas should be surveyed at least once in every five years.
3. To conform to international standards, MOFED must continue to estimate GDP according to established procedures. These conventional methods nonetheless do a poor job of capturing the full range of economic benefits provided by livestock to the Ethiopian national economy. In the interest of supporting more informed policies for livestock development, MOFED and the Ministry of Agriculture and Rural Development (MOARD) should collaborate to supplement the standard national accounts with periodic estimations of the value of those livestock goods and services that are poorly documented or underestimated in national accounts.
4. With the support of MOFED and MOARD, the CSA should undertake a national survey of the monetary value of animal power to the economy and of the role of animal power in sustaining both rural and urban livelihoods. This survey should include all forms of animal traction, transport, and haulage by all species of working animals – cattle, equines and camels – in rural and urban areas and in all agricultural sectors – agriculture, manufacturing and services. As well as the commercial provision of animal power, the survey should assess the monetary value of the services that working animals directly provide for their owners.
5. Ethiopia needs to recognize the central contribution of the informal cross border livestock trade to national exports. As a regional organization committed to supporting regional trade, IGAD is well positioned to discuss this issue with government, and should continue to do so.

37
ANNEXES
Annex I: Summary of recommended formula to estimate the contribution of ruminant livestock to agricultural GDP
1. Cattle offtake
MOFED cattle population * .09 (offtake rate) * EB/head CSA offtake price
2. Sheep offtake
re-estimated sheep population * .30 (offtake rate) * EB/head CSA offtake price
3. Goat offtake
re-estimated goat population * .315 (offtake rate) * EB/head CSA offtake price
4. Camel offtake
MOFED camel population * .02 (offtake rate) * EB/head CSA offtake price
5. Cattle milk
MOFED cattle population * .206 (lactating proportion of herd) * 448 (litres per lactation) * .5
(proportion of milk retained as fluid milk) * EB per litre CSA milk price
6. Cattle milk for butter
MOFED cattle population * .206 (lactating proportion of herd) * 448 (litres per lactation) * .5
(proportion of milk for butter) * .051 * 1.031 (conversion of fluid milk to kg of butter) *
EB/kg CSA butter price
7. Goat milk
re-estimated goat population * .6235 (lactating proportion of flock) * 46.5 (litres per
lactation) * EB/litre CSA goat milk price
8. Camel milk
MOFED camel population * .20 (lactating proportion of herd) * 1326 (litres per lactation) *
EB/litre CSA camel milk price
9. Fluid residue of butter processing
MOFED cattle population * .206 (lactating proportion of herd) * 448 (litres per lactation) * .5
(proportion of milk for butter) * .95 (fluid residue after butter) * EB/litre CSA residue price
10. Dung for fuel
MOFED cattle population * .237 (tons of dung fuel per head of cattle per year) * EB/ton CSA
dung price
11. Animal draught power
MOFED estimated value of cereal and pulses * .80 (proportion of farmers using animals for
cultivation) * .33 (portion of crop yields paid for animal draught usage in sharecropping

38
arrangements) or .264 * MOFED estimated value of cereal and pulses
12. Sheep wool
re-estimated sheep population * .05 (sheared proportion of flock) * 1 (kg fleece/head/year) *
EB/kg of fleece CSA sale price
13. Change in stocks
MOFED estimates refer to all livestock including poultry and equines; there should be a slight
increase in the revised figure due to re-estimated sheep and goat numbers, but this increase
has not been calculated.

39
Annex II: GDP by economic activity at current prices (,000 birr)
1992 1993 1994 1995 1996 1997 1998 1999 2000 2001Industry/Year 1999/00 2000/01 2001/02 2002/03 2003/04 2004/05 2005/06 2006/07 2007/08 2008/09
Agriculture, Hunting and Forestry 31,049,126 30,039,154 26,854,820 28,559,519 34,951,194 45,709,931 58,369,113 75,802,169 117,003,959 160,491,143 Crop 17,712,850 16,332,268 13,134,677 14,954,471 19,732,776 27,296,975 35,402,548 48,364,287 80,013,059 111,737,367 Animal Farming and Hunting 9,970,214 9,940,983 9,788,953 9,593,350 10,710,495 13,485,245 17,484,021 20,834,045 27,663,734 37,383,517 Forestry 3,366,061 3,765,902 3,931,190 4,011,698 4,507,922 4,927,711 5,482,545 6,603,837 9,327,166 11,370,259
Fishing 23,847 25,307 25,292 18,889 37,244 49,843 62,065 72,844 104,354 136,176 Mining and Quarrying 285,741 374,823 399,246 454,242 472,837 559,778 676,017 635,612 944,293 1,269,813 Manufacturing 3,435,899 3,608,053 3,507,611 3,866,857 4,215,671 4,682,879 5,533,464 7,136,040 9,251,396 12,620,765
Large and Medium Scale Manufacturing 2,279,338 2,366,790 2,213,690 2,567,799 2,838,629 3,024,605 3,676,781 4,923,455 6,471,124 8,585,282 Small Scale and Cottage Industries 1,156,561 1,241,263 1,293,921 1,299,058 1,377,042 1,658,274 1,856,683 2,212,585 2,780,272 4,035,483
Electricity and Water 1,334,579 1,393,740 1,471,337 1,573,549 1,812,317 1,951,586 2,316,027 3,135,501 3,480,996 4,036,848 Construction 2,641,472 2,836,586 3,204,762 3,693,337 4,626,752 5,510,819 6,921,071 9,268,810 12,000,273 16,073,853 Whole Sale and Retail Trade 7,444,192 7,417,352 7,120,712 8,445,545 9,635,285 11,638,598 15,354,844 21,139,856 30,473,352 46,584,838 Hotels and Restaurants 1,322,084 1,372,197 1,502,759 1,613,492 1,790,250 2,102,051 2,821,683 4,334,097 6,439,514 10,159,282 Transport and Communications 2,940,550 3,501,297 3,732,240 4,186,996 5,011,770 6,823,589 6,863,056 7,927,587 9,349,834 12,719,356 Financial Intermediation 1,106,507 1,171,982 860,647 1,183,143 1,336,644 1,633,014 2,208,373 2,668,799 3,610,238 4,774,697 Real Estate, Renting and Business Activities 3,923,584 4,459,792 5,715,877 6,411,046 6,754,311 7,486,146 9,119,465 13,380,850 19,986,149 24,336,640 Public Administration and Defense 4,096,012 3,867,857 3,870,482 4,119,712 4,098,847 4,686,859 5,446,614 6,342,591 8,370,387 10,320,218 Education 1,414,384 1,636,198 1,919,647 2,437,523 2,580,437 2,986,734 3,793,051 4,830,781 6,515,505 7,678,773 Health and Social Work 574,877 652,296 671,888 653,527 761,316 931,168 1,069,964 1,303,992 1,732,699 1,952,710 Other Community , Social & Personal Services 1,149,055 1,131,117 1,103,938 1,288,642 1,466,681 1,693,037 2,074,588 2,652,723 3,708,441 5,357,556 Private Households with Employed Persons 165,880 180,103 191,612 207,106 227,811 242,527 320,724 370,947 506,429 674,240 Total 62,907,790 63,667,854 62,152,871 68,713,124 79,779,366 98,688,560 122,950,117 161,003,200 233,477,821 319,186,908
Less : FISIM 608,408 598,646 374,224 508,904 594,415 682,806 1,006,665 1,200,059 1,657,451 2,219,587 Gross Value Added at Current Basic Prices 62,299,382 63,069,208 61,778,647 68,204,220 79,184,951 98,005,755 121,943,453 159,803,141 231,820,370 316,967,321 Taxes on Products 4,348,950 4,957,600 4,778,000 5,228,000 7,476,000 8,467,000 9,698,000 12,186,000 16,785,000 19,139,000 GDP at Current Market Prices 66,648,332 68,026,808 66,556,647 73,432,220 86,660,951 106,472,755 131,641,453 171,989,141 248,605,370 336,106,321
Source: MOFED unpublished records

40
Annex III: Quantity and gross value of official Ethiopian livestock and meat exports: 1970-2006
Year Value (EB x 103) Quantity tons
Gregorian Ethiopian Meat Live Animals Meat Live Animals
1970/71 1963 7043 2043 6020 2013 1971/72 1964 11,981 2661 8271 2412 1972/73 1965 15,697 5771 10,941 4650 1973/74 1966 18,325 12,342 18,385 10,891 1974/75 1967 9894 16,885 5121 10,569 1975/76 1968 6804 31,370 2717 21,073 1976/77 1969 5027 5395 3528 2174 1977/78 1970 1296 1542 948 445 1978/79 1971 2135 1436 820 583 1979/80 1972 5407 8317 2017 2991 1980/81 1973 6310 9800 2288 3547 1981/82 1974 5324 8296 1434 2776 1982/83 1975 10,249 16,344 3106 5331 1983/84 1976 5869 14,780 2832 4686 1984/85 1977 3922 19,173 953 6635 1985/86 1978 3866 18,908 1147 7353 1986/87 1979 5370 15,646 1458 5012 1987/88 1980 5142 32,357 1726 14,056 1988/89 1981 2089 23,539 584 13,558 1989/90 1982 1149 10,821 229 4258 1990/91 1983 1015 5169 268 2195 1991/92 1984 18 467 3 124 1992/93 1985 418 1322 40 312 1993/94 1986 672 10,757 49 2407 1994/95 1987 6073 7655 440 771 1995/96 1988 12,169 770 950 183 1996/97 1989 24,175 11,201 1716 1305 1997/98 1990 29,340 10,562 1529 1324 1998/99 1991 31,644 5724 2078 919 1999/00 1992 32,708 14,137 1977 1766 2000/01 1993 14,366 2360 870 214 2001/02 1994 9423 7132 662 166 2002/03 1995 20,781 4129 1722 607 2003/04 1996 66,676 16,454 4007 3141 2004/05 1997 126,254 110,915 7274 9126 2005/06 1998 160,842 239,240
Source: Legese et al. 2008, citing National Bank of Ethiopia reports

41
REFERENCES
Admasie, A., Ageba, G. and Demeke, M. 2003. Rural finance in Ethiopia: assessment of the financial products of microfinance institutions AEMFI Occasional Paper 12.
Aklilu, Y. and Catley, A. 211. Shifting Sands: The Commercialization of Camels in Mid-altitude Ethiopia and Beyond. Feinstein International Center, Tufts University, Addis Ababa.
Aredi, D. 1992. The informal and semi-formal financial sectors in Ethiopia: a study of the iqqub, iddir and savings and credit co-operatives. Research paper 21.
Idl-bnc.idrc.ca/dspace/bitstream/10625/13646/1/100306.pdf (accessed April 23 2011)
Aryeetey, E. and Udry, C. 1995. The characteristics of informal financial markets in Africa. Paper prepared for presentation at the African Economic Research Consortium, Nairobi, Kenya.
Ayalew, D. 2003. Risk-sharing networks among households in rural Ethiopia.
www.econ.kuleuven.be/ces/discussionpapers/Dps03/Dps0305.pdf (Accessed April 23 2011)
Ayalew, W., J.M. King, E. Bruns and B. Rischkowsky. 2001. Economic evaluation of smallholder subsistence livestock production: lessons from an Ethiopian goat development program.
www.ilri.org/research/proj4/angr/article13.doc
Barrett, C., Bellemare, M. and Osterloh, S. 2006. Household‐level livestock marketing behaviour among
northern Kenyan and southern Ethiopian pastoralists. In McPeak, J. and Little, P.D. (eds.) Pastoral
Livestock Marketing in Eastern Africa: Research and Policy Challenges. Intermediate Technology
Publications, Rugby, U.K.
Bold, T. Risk‐sharing insurance groups in rural Ethiopia. www.csae.ox.ac.uk/conferences/2007‐EDiA.../409‐
Bold.pdf (Accessed April 23 2011)
Bosman, HG, Moll HAJ, and HMJ Udo. 1997. Measuring and interpreting the benefits of goat keeping in tropical farm systems. Agricultural Systems 53: 349-372.
Central Statistical Agency. 2001. Report on the 1999/2000 Household Income, Consumption and Expenditure Survey. Statistical Bulletin 258. Addis Ababa.
Central Statistical Agency. 2003. Report on Cottage/Handicraft Manufacturing Industries Survey November 2002. Addis Ababa.
Central Statistical Agency. 2007. Household Income, Consumption and Expenditure (HICE) Survey 2004/5, Volume I, Analytical Report and Volume II, Statistical Report. Statistical Bulletin 394 Addis Ababa.
Central Statistical Agency. 2009a. Report on Large and Medium Scale Manufacturing and Electricity Industry Survey. Statistical Bulletin 472. Addis Ababa.
Central Statistical Agency. 2009. Agricultural Sample Survey 2008/2009, Volume II Report on Livestock and Livestock Characteristics (Private and Peasant Holdings) Statistical Bulletin 446. Addis Ababa.
Central Statistical Agency. 2010. Report on Small Scale Manufacturing Industries Survey. Statistical Bulletin 480. Addis Ababa.
Conning, J. and Udry, C. 2005. Rural financial markets in developing countries. Yale University
Economic Growth Center Discussion Paper No. 914. http://ssrn.com/abstract=756965

42
Dercon, S. 2001. Income risk, coping strategies and safety nets. www.sais‐
jhu.edu/faculty/kmacours/pdf.../WBRO_dercon.pdf (Accessed April 23 2011)
Dercon, S., Bold, T., de Weerdt, J, and Pankhurst, A. 2004. Group-based funeral insturance in
Ethiopia and Tanzania. CSAE WPS/2004-27. www.csae.ox.ac.uk › Output › Working Papers
(Accessed April 23 2011)
Gobezie, G. Subsidizing microcredit interest: how important is it to the poor.
www.mixmarket.org/sites/default/files/medialibrary/.../INAFI_Digest_3.doc (Accessed April 23 2011).
Gryseels, G. 1983. Livestock in farming systems research for smallholder agriculture: experiences of ILCA’s highlands programme. ILCA, Addis Ababa. pdf.usaid.gov/pdf_docs/PNAAY397.pdf (Accessed April 23 2011)
Gryseels, G. and M.R. Goe. n..d. Energy flows on smallholder farms in the Ethiopian highlands. Summary of a paper submitted to the Beijer Institute, Stockholm, Sweden.
http://www.ilri.org/InfoServ/Webpub/Fulldocs/Bulletin17/Energy.htm
Gryseels, G. n.d. The role of livestock in the generation of smallholder farm income in two Vertisol areas of the central Ethiopian highlands.
http://www.ilri.org/InfoServ/Webpub/Fulldocs/X5493e/x5493e14.htm
Hoddinott, J., Dercon, S. and Krishnan, P. 2005 Networks and informal mutual support in 15
Ethiopian Villages. www.economics.ox.ac.uk/members/stefan.dercon/hodd_der_kr.pdf (Accessed April 23 2011)
Holleman, C. 2002. The Socio-economic Implications of the Livestock Ban (USAID/FEWSNET).
Hurissa, B. and Eshetu, J. 2002. Challenges and Opportunities of Livestock Marketing in Ethiopia. Paper prepared for the tenth annual conference of the Ethiopian Society of Animal Production, Livestock Marketing Authority, Addis Ababa
ISIC. 2006. International Standard Classification of all Economic Activities, Revision 3 Structure.
United Nations Statistics Division. http://unstats.un.org/unsd/cr/registry/regcst.asp?Cl=2
LDMSP 2007. Livestock and Products Marketing, Volume O, and Meat Production, Volume B, Livestock Development Master Plan Study, Phase I, MOARD, Addis Ababa.
Legese, G., Teklewold, H., Alemu, D., and Negassa, A. 2008. Live Animal and Meat Export Value Chains for Selected Areas in Ethiopia: Constraints and Opportunities for Enhancing Meat Exports. People, Livestock and the Environment Discussion Paper No. 12, ILRI, Addis Ababa.
Little, P., Behnke, R., McPeak, J., Gebru, G. 2010. Future Scenarios for Pastoral Development in Ethiopia, 2010-2025. Report No. 2: Pastoral Economic Growth and Development Policy Assessment. DFID, Addis Ababa.
Majid, N. 2010. Livestock Trade in the Djibouti, Somali and Ethiopian Borderlands. Chatham House Briefing Paper, Chatham House, London.
Mauri 1987. The role of financial intermediaries in the mobilization and allocation of household savings in developing countries: interlinks between organized and informal circuits. International Experts Meeting on Domestic Savings Mobilization, East-West Center, Honolulu.

43
McPeak, J. 2005. Confronting the risk of asset loss: what role do livestock transfers in northern Kenya play? Journal of Development Economics 81: 415-437.
McPeak, J., Little, P.D., and Doss, C. 2011 (forthcoming). Risk and Social Change in an African Rural Economy: Livelihoods in Pastoralist Communities. Routledge.
MOFED 2005. National Accounts Statistics of Ethiopia: Sources and Methods 1992 (1999/2000) Base Year Series (draft). National Accounts Department, MOFED, Addis Ababa.
Moll, HAJ 2005. Costs and benefits of livestock systems and the role of market and nonmarket relationships. Agricultural Economics 32 (2): 181-193.
Mulugeta, E., Gebremedhin, B., Hoekstra, D., and Jabbar, M.A. 2007. Analysis of the Ethio-Sudan Cross Border Cattle Trade: The Case of Amhara Regional State, Improving Productivity and Market Success of Ethiopian Farmers, Working Paper 4, ILRI, Nairobi.
Negassa, A. and M. Jabbar. 2008. Livestock Ownership, Commercial Off-take Rates and their Determinants in Ethiopia. ILRI, Addis Ababa.
Nin Pratt, A., Bonnet, P., Jabbar, M.A., Ehui, S., and de Haan, C., 2005. Benefits and Costs of Compliance of Sanitary Regulations in Livestock Markets: The Case of Rift Valley Fever in the Somali Region of Ethiopia. ILRI, Nairobi.
PADS 2004. Pastoral Areas Development Study (PADS), Phase 1 Report, Volume 2 Livestock Resources, Study 5 Animal Breeds. TECHNIPLAN, Addis Ababa and Rome.
Perlov, D. 1987. Trading for Influence: The Social and Cultural Economics of Livestock Marketing Among the Highland Samburu of Northern Kenya. Doctoral dissertation Department of Anthropology, University of California at Los Angeles.
Rijneveld, W. 2006. Analyzing the micro finance sector in: Ethiopia. Woord en Daad.
http://www.search4dev.nl/document/209985 (Accessed April 23 2011).
Santos, P. and Barrett, C. 2010. Persistent poverty and informal credit. Journal of Development Economics.
SNA 93. 1993, with revisions. System of National Accounts 1993. Inter-Secretariat Working Group on
National Accounts. unstats.un.org/unsd/sna1993/introduction.asp
Udry, C. 1994. Risk and insurance in a rural credit market: an empirical investigation in northern Nigeria. Review of Economic Studies 61: 495-526.
Upton, M. 1985. Models of improved production system for small ruminants. In JE Sumberg and K Cassaday (eds.) Sheep and Goats in Humid West Africa. Proceedings of the Workshop on Small Ruminant Production Systems in the Humid Zone of West Africa, Ibadan, Nigeria, ILCA, Addis Ababa, pp. 55-67.