Embed Size (px)
Citation preview

A summary of results from the IFCN Dairy Report 2012
This article summarises the key findings of
the IFCN work in 2012 and the recently published IFCN Dairy Report 2012
Content
1. Top 20 milk producing countries 2011 2. IFCN Top 20 milk processors list 2012 3. IFCN Cost of milk production in 2011 4. Developments of feed prices 5. IFCN Dairy network 2012 6. IFCN Partner companies 2012
Authors: Torsten Hemme and dairy researchers from 91 countries
participating in IFCN
IFCN Dairy Research Center Schauenburger Straße 116
24118 Kiel, Germany Phone: +49 (0) 431 - 5606 - 250
email: [email protected] website: www.ifcndairy.org
Disclaimer: Neither IFCN Dairy Research Center nor other legal entities in the IFCN Dairy Network accept any liability whatsoever for any direct or consequential loss howsoever arising from any of the IFCN material or its contents or otherwise arising in connection herewith. Copyright: © IFCN Dairy Research Center 2012: All rights reserved. This article could be reproduced or distributed by any means without prior permission from the IFCN Dairy Research Center. All publications arising from parts or this entire article must be accompanied by the text shown in the box below.
The IFCN concept + method IFCN mission: “We create a better understanding of milk production worldwide” The IFCN – International Farm Comparison Network - is a global network of dairy researchers from 91 countries cooperating with over 93 companies representing the dairy chain. The IFCN has a Dairy Research Center (DRC) with 19 dairy researchers coordinating the network process and dairy research activities. The IFCN is independent from third parties and committed to truth, science and reliability of results. The main research focus of the IFCN and its core competence is in the field of milk production, milk prices and especially dairy farm economics. Further details: www.ifcndairy.org.
1
1. The Top 20 milk producing countries 2011
IFCN approach to create a better understanding of milk production The IFCN as research network was established in the year 2000 to create a better understanding of milk production world-wide. IFCN is focusing on this segment of the dairy chains as it is the most important element of the chain once it comes to I) the costs, II) resources used, III) emissions created and IV) the political challenges.
IFCN top 20 dairy countries list 2011 It is quite important for the dairy industry to have a solid method to rank countries by milk volumes. The IFCN provides one standard concept and consistent data collection. These data have been collected and validated by the IFCN research partners in the countries since the year 2000. Moreover the list has standardised national milk production figures (cows and buffalos) to 4% fat and 3.3 % protein by using the Energy Corrected Milk (ECM) concept described below.
World milk production 2011 World milk production (cow and buffalo milk) 2011 was in natural fat/protein content 708.7 mill t. As the average natural content of the milk is higher than 4% fat and 3.3% protein the ECM milk volume is 721.4 mill t which is 12.4 mill t more. Once it comes to milk deliveries IFCN is estimating that only 62% of world milk production is delivered to milk processors. The remaining 38% are consumed on the farms or sold informally.
IFCN top 20 milk production and processing countries 2011
No. Country Milk production Milk production Milk delivered Milk delivered
in mill t ECM in mill t natural
content in mill t ECM in mill t natural
content
1 India 137.5 121.2 23.0 20.5 2 USA 84.3 89.0 83.8 88.5 3 Pakistan 41.6 35.6 1.3 1.1 4 China 33.9 37.4 29.2 32.8 5 Brazil 32.0 33.0 21.8 22.5 6 Germany 31.1 30.3 30.1 29.3 7 Russian Federation 30.1 31.7 15.5 16.4 8 France 25.2 25.3 24.6 24.7 9 New Zealand 21.3 18.9 21.3 18.9 10 United Kingdom 14.1 14.1 13.8 13.8 11 The Netherlands 12.7 12.0 12.4 11.6 12 Turkey 12.2 12.8 6.7 7.1 13 Poland 12.0 12.1 8.9 9.0 14 Argentina 11.4 12.0 10.2 10.7 15 Italy 11.3 11.6 10.5 10.8 16 Mexico 11.1 11.1 7.7 7.7 17 Ukraine 10.2 11.1 4.3 4.6 18 Australia 9.8 9.6 9.5 9.3 19 Iran 9.8 9.7 7.2 7.3 20 Canada 8.9 9.2 8.6 8.8 World 721.4 708.7 447.0 453.2 ECM correction: As the dairy farms operate with very different fat/protein contents of the milk the IFCN is using the energy correct milk (ECM) approach to standardised milk volumes to 4% fat and 3,3 % protein. The use formula is the following one: ECM milk = (milk production * (0.383 * % fat + 0.242 * % protein +0.7832) / 3.1138).
Top 5 milk production countries 2011 – 4 developing countries among the top 5 The top 5 countries: 1. India, 2. USA, 3. Pakistan, 4. China and 5. Brazil
Top 5 milk processing countries 2011 – China is no.3 milk processing country in the world The top 5 countries: 1. USA, 2. Germany, 3. China, 4. France and 5. India

2
2. IFCN Top 20 milk processors list 2012
Introduction: To better understand the future of milk production the IFCN has started to benchmark milk processors by milk intake in 2008. We have created a top 20 milk processors list in 2012 and have also estimated a turnover which can be associated to the milk intake.
Concentration of milk processing 2012: Based on the table below the Top 20 milk processing companies process 24% of world cow and buffalo milk production. Measured by milk deliveries they account for 39% world-wide. The largest milk processor Fonterra is processing 3.0% of world milk production or 4.8% of world milk deliveries (cow and buffalo milk).
In comparison to the Global dairy top (Rabobank) in the IFCN ranking cooperatives are important as they usually have a higher milk intake in relation to their turnover compared to private companies. Private companies often create higher value products and so have higher turnover to milk volume ratios.
IFCN Top 20 milk processors list 2012 Rank Company name Country Dairy processing plants
main locationMarket share in % of world milk
production
Milk intake, in mill. t
Dairy turnover, US-$ bill.
1 Fonterra Co‐operative Group New Zealand international 3.0% 21.6 16.4
2 Dairy Farmers of America USA USA 2.4% 17.1 13.0
3 Groupe Lactalis (Parmalat) France international 2.1% 15.0 16.9
4 Nestlé Switzerland international 2.1% 14.9* 19.1
5 Dean Foods USA USA 1.7% 12.0 13.1
6 Arla Foods/MUH/Milk Link Denmark/Sweden DK/SE/DE/UK 1.7% 12.0 12.0
7 FrieslandCampina The Netherlands NL/DE 1.4% 10.1 13.4
8 Danone France international 1.1% 8.2 15.6
9 Kraft Foods USA international 1.1% 7.8 7.5
10 DMK Germany Germany 1.0% 6.9 6.4
11 Saputo Inc. Canada/USA Canada/USA/Argentina 0.9% 6.3 7.0
12 Glanbia Group Ireland international 0.8% 6.0 3.9
13 Land O' Lakes Inc. USA USA 0.8% 5.9 4.3
14 California Dairies Inc. USA USA 0.6% 4.6 3.0
15 Unternehmensgruppe Theo Müller Germany international 0.6% 4.4 6.5
16 Groupe Sodiaal France France 0.6% 4.1 5.7
17 Mengniu Dairy Company Ltd. China China 0.6% 4.1** 5.8
18 GCMMF (Amul) India India 0.6% 4.0 2.5
19 Yili Group China China 0.6% 4.0** 5.8
20 Bongrain SA France international 0.5% 3.6 5.5
Sum of Top 20 24% 172.8 183.4
Source: IFCN analysis and estimates. Data represents in most cases the year 2011. *2010, ** estimated. Explanation: Milk intake represents milk volume collected, commodity purchase (in milk equivalent) for main company and its subsidiaries. Milk intake f igures in mill tons. In some cases recalculated from litre (1litre = 1.033 kg). Dairy turnover represents turnover w hich belongs only to processed milk and not to other activities. Turnover f igures in US-$ bill, in some cases converted to US-$ by using the annual average exchange rate. Turnover directly valided by companies or taken from annual reports. Comments: Amul (India): milk w ith high fat content. Arla incl. MUH and Milk Link: IFCN estimate. Danone: Fresh Dairy Direct only. Neslé: Dairy products and ice cream, milk intake f igure represents the year 2010. 50% of DPA milk intake and turnover allocated to Fonterra and Nestlé each. California Dairies: milk intake 60 % of total milk collected, 40% is directly shipped to other companies. FrieslandCampina: milk intake excl. supplier milk outside NL/DE. Sodiaal: uncertainty w hether milk intake includes all purchased products. Müller: total milk processed (including all subsidiaries), turnover represents groups turnover, including non dairy activities. DMK: Deutsches Milchkonotr. GCMMF (Amul): Gujarat Cooperative Milk Marketing Federation Ltd. Mengniu and Yili: milk intake f igures estimated, uncertainty about proportion of fresh milk and milk pow der intake. Double counting of milk intake possible (purchased products).
Top milk processors 2012: The global top five dairy processors are Fonterra (NZ), Dairy Farmers of America (USA), Lactalis (FR), Nestlé (CH) and Dean Foods (USA). 50 % of all companies included in the list are originally from Europe, 30 % from the USA/CA and 20 % from other world regions including Top 1 Fonterra, which is originally from Oceania. Half of the companies are cooperatives and half are private companies. Compared to the IFCN ranking 2011 there were the following major changes in the ranks:
Moved up in this ranking: Arla and Lactalis– mainly via mergers / acquisitions.
Newcomer in this ranking: Bongrain, Glanbia and Müller via the acquisition of Wiseman.
Turnover per kg milk intake: This indicator can be interpreted as “dairy value creation”. To find a meaningful match of milk intake and dairy turnover which is also comparable between companies is challenging. Initial calculations show that the turnover per kg milk differs significantly between companies (range: 0.65 -1.53 US-$ per kg milk, excl. outliers). Details on method and results are published in the IFCN Dairy Report as special study. The IFCN plans to refine the method and welcomes any feedback especially in this difficult field.
3
3. IFCN Cost of milk production in 2011
IFCN concept: Since 2000 the IFCN has been comparing typical farms around the world. In 2012, 171 typical farms from 61 dairy regions in 51 countries were analysed. The analysis is based on the concept of typical farms and has used the model TIPI-CAL to have standardised calculation across the countries. The data collection and validation has been done by researchers in the countries, by researchers in the IFCN Center and also during the IFCN Dairy Conference held in June 2012 in Kiel.
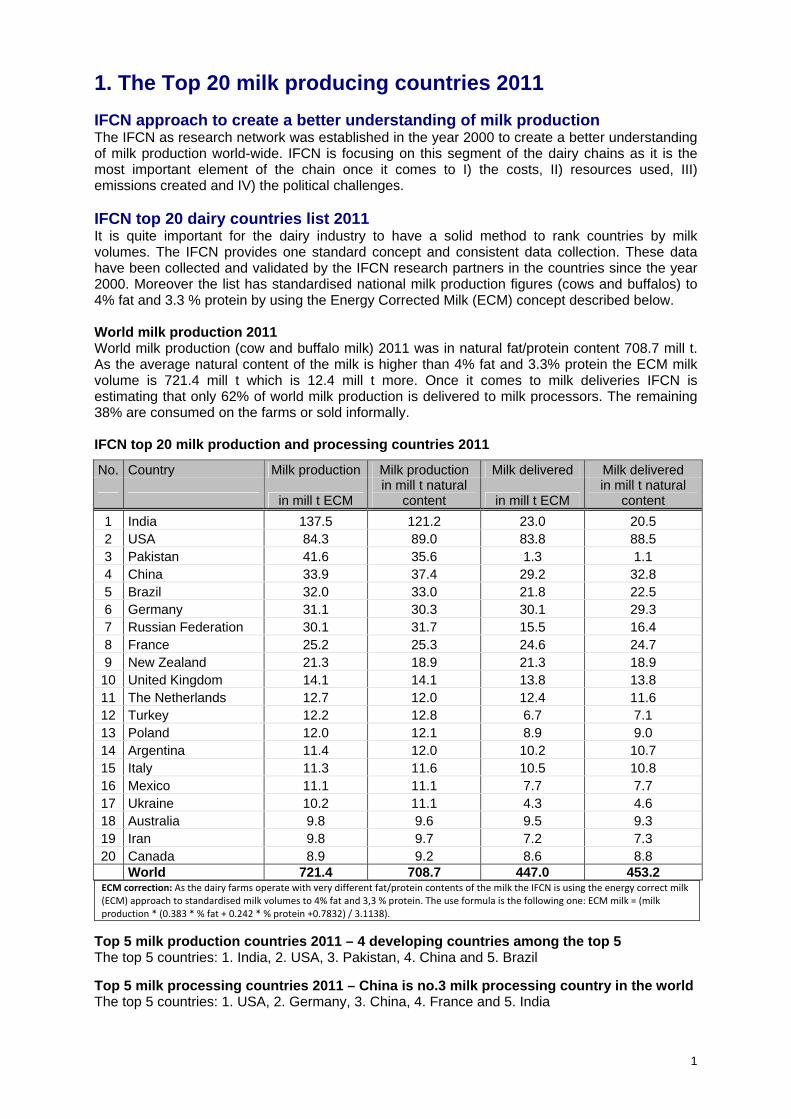
IFCN cost indicator: The IFCN uses the indicator cost of milk production only which can be directly related to a milk price. This cost includes all costs from the profit & loss account of the farms and also opportunity costs for own labour, land and capital. From this cost level the non-milk returns from sales of cull cows, heifers, calves, manure, etc. and also direct payments have been deducted. For creation of the world map, the cost levels on average sized farms have been used. Cost of milk production in average sized farms per country in 2011
Cost range: Cost of milk production ranges from about 5 US-$ per 100 kg milk in extensive farming systems in Cameroon to 100 US-$ on an average sized farm type in Switzerland. The average cost over all countries analysed was 40.6 US-$/100 kg milk. The countries can be grouped in the following cost categories: Costs below 30 US-$: Argentina, Chile, Peru, Indonesia, Pakistan, and countries in central Africa. Costs 30 -40 US-$: Oceania, South Africa, India, selected countries in Northern Africa and Eastern Europe. Costs 40 -50 US-$: USA, Brazil, UK, Ireland and Tunisia. Costs > 50 US-$: A wide number of countries in Western Europe, Poland, Mexico, Colombia, Morocco, Israel, Jordan, Iran, Turkey and China. Most likely, Japan and Korea are also in this segment. It is worth mentioning that economies of scale were significant in almost all countries, especially in Western Europe and the variation in farm sizes was quite high. Key developments in 2011: Cost of milk production increased on average by 5 US-$ In the year 2011, the costs have increased on average by 5 US-$ per 100 kg milk. A key driver was the 38% increase in feed price (based on the IFCN world feed price indicator). Moreover, dairy farms in emerging dairy countries are facing strong increases in wages. A third driver for costs is the increasing energy and fertilizer prices. Outlook for cost developments in 2012 In 2012, costs are expected to increase by about 5% compared to 2011. The main drivers for cost increase are: increasing feed prices, high energy costs, increasing competition on land market worldwide (affecting prices). From the return side, the average milk price from January to August has dropped by 24% in 2012 compared to the same period in 2011. Therefore, profitability of dairy farms is expected to decline significantly in 2012, compared to 2011. More details will be available in IFCN Dairy Report 2013.

4
4. Developments of feed prices and the impacts on dairy
Feed prices have almost tripled since 2006 Feed price developments: Almost tripling prices since 2006 from 13 US-$ to now 42 US-$/100 kg feed. There have been three phases and in each phase, the price level increased by 10 US-$ per 100 kg feed.
January 2006 to November 2007: +70% from 13 to 22 US-$ / 100 kg feed driven by high oil price and biofuel policies
August 2010 to February 2011: +50% from 22 to 32 US-$ / 100 kg feed
April 2012 to August 2012: +30% from 32 to 41 US-$ / 100 kg feed driven by forecast supply shortage, which in turn was driven mainly by extensive drought in the USA. In September, a slightly lower feed price was observed.
Price of 1 kg feed > price of 1 kg milk since July 2012 Similar to 2009, the price of feed is currently higher than the price of milk, even though on a higher level. The milk feed price ratio is below 1. This very simple indicator illustrates when dairy farm economics come under pressure due to transmission of world market prices to the farm level. Farming systems based on high concentrate feed input are affected to a larger extent.
Effects of high world feed prices over a longer period on farm economics Step 1: Transformation of world feed price into national price for concentrates. Step 2: Purchase feed costs rise depending on the amount feed bought and duration of
forward contracting of farmers. Step 3: Land values increase especially for arable land for cash crops. This transforms into
increasing land rent costs depending on the local land markets and also the land rental contracts
Step 4: Opportunity costs for own land increases as the farmers might make a better profit from selling the crops they produce instead of feeding them to their cows. A cost increase out of this depends on the perception and decision of each dairy farmer.
Steps 5: If feed prices stay longer on the currently high level, the prices for pastureland would also increase, which would in turn lead to an increase in costs of grazing systems.
Summing up: In times of high feed prices, dairy farms having low concentrate intake (like in Ireland) have a competitive advantage. Adaptation of the farming system by either increasing milk yields (maximise output) or by decreasing yields (minimise input) could help high input systems to improve their farm economics.
1996-2005 Jan 2006 to Sep 2012 annual monthly
1996-2005 Jan 2006 to Sep 2012 annual monthly
World milk and feed prices The IFCN feed price indicator - a key indicator for compound feed prices for dairy farmers world-wide. IFCN feed price indicator: Source: International Monetary Fund. Specification: Soybean meal: CME futures first contract forward, Corn: FOB US Gulf. Calculation: 0.3 * soybean meal price + 0.7 * corn price. New combined IFCN milk price indicator: Weighted average of IFCN milk price indicators: 35% SMP&butter, 45% cheese&whey, 20% WMP Milk : feed price ratio: Milk price divided by the calculated feed price.

5
5. IFCN Dairy Network in 2012 The IFCN (International Farm Comparison Network) The IFCN is a global network of dairy researchers related to companies and other stakeholders of the dairy chain. It was established in 1997 and is coordinated by the IFCN Dairy Research Center (DRC), which is connected to the University Kiel. Together with the research partners the DRC develops standard methods and condenses dairy data from over 91 countries. This on-going process provides cross country comparability and leads to global dairy insights. To fulfill its tasks the DRC has currently 19 people (senior dairy researchers + PhD/MSc students and support people). Via this the IFCN is the leading global knowledge organisation in milk production. (www.ifcndairy.org)
Status of the IFCN in 2012 Farm Comparison Analysis: In 2012, farms from 51 countries and 61 dairy regions are analysed. Progress: In 2012 the IFCN has made significant progress to develop research partnerships in the countries Colombia, Turkey, Ethiopia, Uruguay, USA, Australia, Pakistan, Tunisia, China, Mexico and Russia.
Country Profile Analysis: In the IFCN Dairy Report 2012 there will be shown a dairy sector and chain profile for 91 countries, covering 97.5% of world milk production.
IFCN Conferences IFCN Dairy Conference 2012:
In June 2012, the 12th IFCN Dairy Conference was held. This year, IFCN dairy economists from 47 countries have participated, representing 85% of world milk production. During this conference, the data collected by the researchers and analysed by the IFCN Dairy Research Center are validated and new methods are dis-cussed.
Participants of the 13th IFCN Dairy Conference in Germany, June 2012
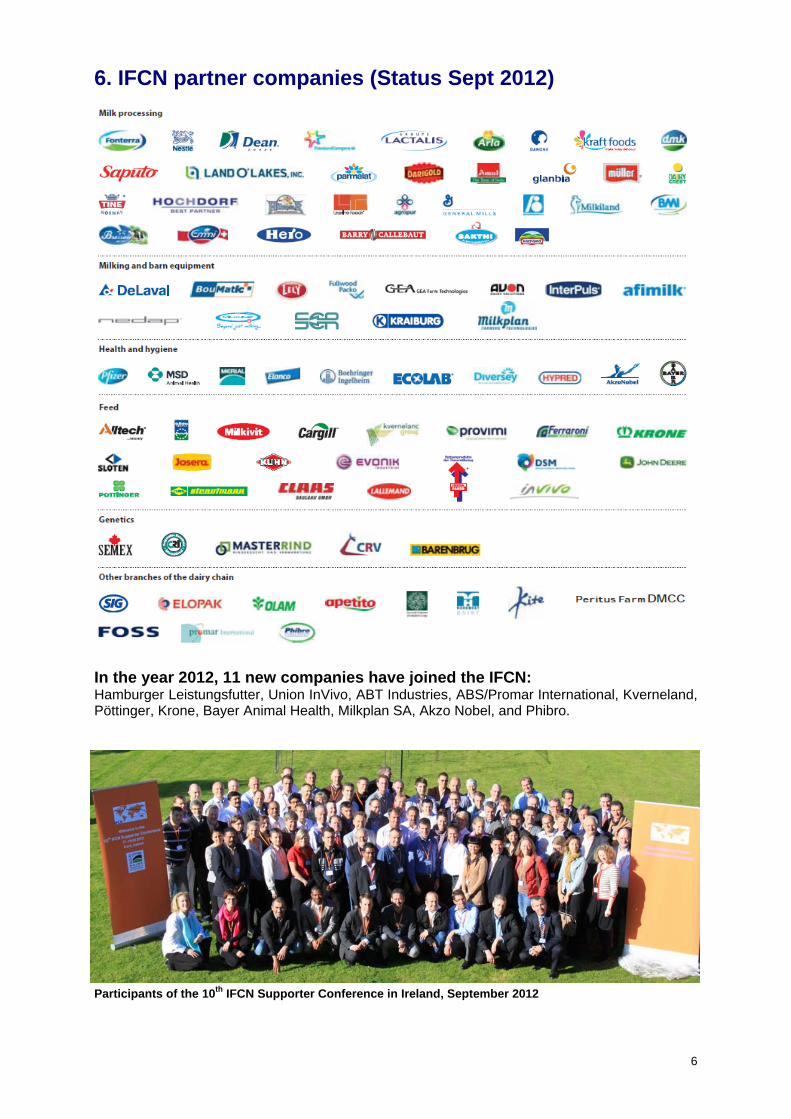
IFCN Supporter Conference 2012: In September 2012, the 10th IFCN Supporter Conference 2012 was held in Cork, Ireland. 100 participants attended, such as dairy farmers and delegates from over 70 global leading companies related to milk production. These companies represent all aspects of the dairy chain such as milk processing, milking equipment, feeding, farm machinery, animal health, hygiene, genetics, consulting and milk packaging.
6
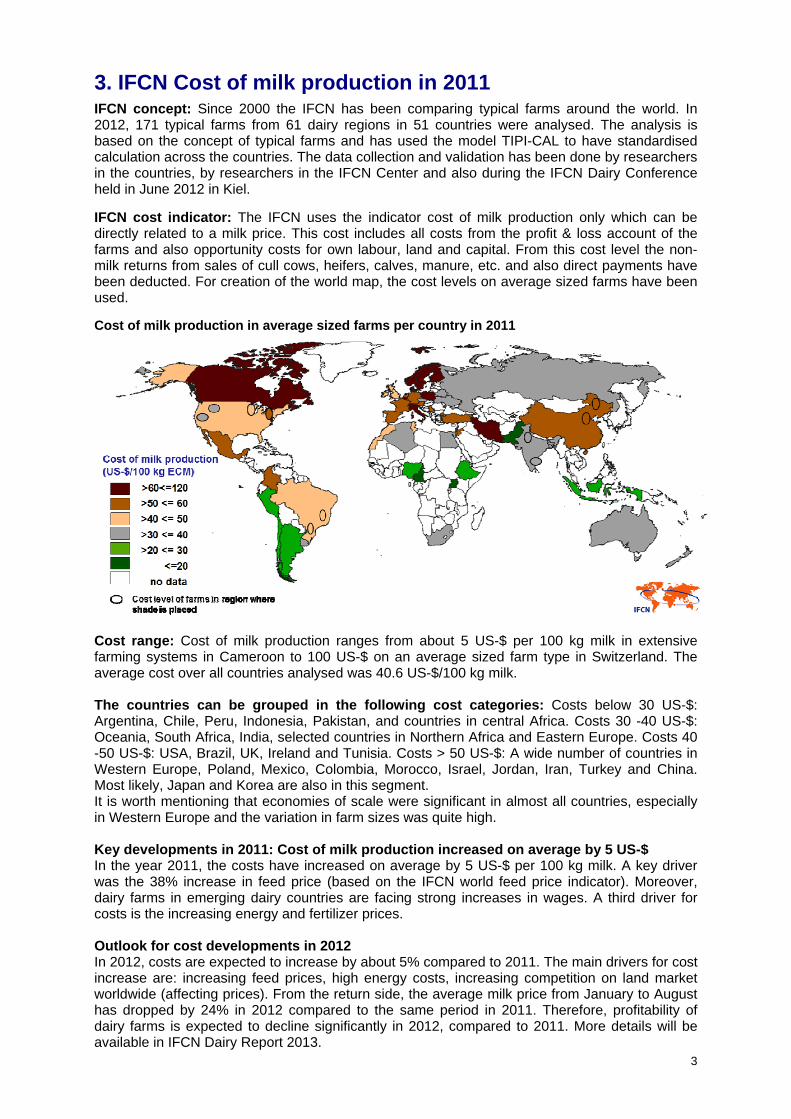
6. IFCN partner companies (Status Sept 2012)
In the year 2012, 11 new companies have joined the IFCN: Hamburger Leistungsfutter, Union InVivo, ABT Industries, ABS/Promar International, Kverneland, Pöttinger, Krone, Bayer Animal Health, Milkplan SA, Akzo Nobel, and Phibro.
Participants of the 10th IFCN Supporter Conference in Ireland, September 2012