Embed Size (px)
Citation preview

Page 1
eSCAD: Data Collection and Dashboard in Abu Dhabi
IAOS Conference 2016 Abu Dhabi, UAE
Authors: Huda Al-Awar Al-Bastaki
Ghassan Hammoudeh Saleh
Statistics Centre – Abu Dhabi
P.O. Box: 6036 Abu Dhabi, UAE
T: +971.2.81.00.000
Abu Dhabi, August 2016
Abstract:
Like all statistical organisations, Statistics Centre – Abu Dhabi (SCAD) relies on efficient collection
of administrative data for the production of timely statistics. SCAD also has a strategic vision to
provide advanced and innovative dissemination tools.
In 2015, SCAD embarked on an ambitious project to develop two systems to address these
statistical processes. The project was called eSCAD.
The first eSCAD system automates and streamlines the administrative data collection process
from 56 Abu Dhabi government entities. The system links the agencies to SCAD through a secure
network (B2B). The received data are automatically validated and quality checked. Some datasets
have predefined calculation procedures applied to them to directly produce statistics, while others
are loaded as databases, available for further analysis by subject matter experts.
The second component of eSCAD was the development of suite of statistical dashboards.
Dashboards provide an ‘at-a-glance’ view of a situation. SCAD has found that official statistics are
well suited to the dashboard concept. The first suite of dashboards were released in May 2015. To
date, 11 datasets with 36 related dashboards have been deployed.
Topics covered in the paper will include: benefits of SCAD’s administrative data collection system;
benefits of statistical dashboards; development and technology considerations; lessons learned;
and outcomes.
Key words: eSCAD, administrative datasets, dashboard, data visualization, innovation.

2
1. Introduction
1.1 Abu Dhabi
Abu Dhabi is the federal capital of the United Arab Emirates (UAE) and the largest of the seven
emirates. Geographically, Abu Dhabi lies on the borders with the Kingdom of Saudi Arabia, the
Sultanate of Oman, and the Arabian Gulf. Over the past 40 years, Abu Dhabi has experienced
significant population growth and economic development.
To manage the growth and prosperity of the Emirate, the Government of Abu Dhabi required an
official agency that could provide statistics for decision-making and policy setting.
1.2 Statistics Centre – Abu Dhabi
Statistics Centre – Abu Dhabi (SCAD) was established in accordance with Law #7 (2008). SCAD is
responsible for the collection, classification, storage, analysis and dissemination of official statistics
covering social, demographic, economic, environmental and cultural indicators.
1.3 eSCAD Project
SCAD is motived by innovation. In particular, SCAD seeks to apply innovative techniques to
administrative data collection process and the dissemination of statistics. To meet this dual
obligation, the eSCAD project was created.
2. eSCAD: Administrative Data Collection
As a young organisation, SCAD has sought to advantage of existing databases within other
government entities as a source for the production of official statistical indicators. To achieve this,
SCAD needed to develop an integrated electronic data capture and storage system.
2.1 Internal Stakeholders
By determining the needs of the senior management, the Board of Directors, and technical
departments, the following objectives were set:
Create a single, comprehensive, easily accessible statistical database
Automate the downloading of data as well as all the related procedures and processes, in
order to produce a broader range of indicators at a faster frequency and lower cost
Provide regular time series for all statistics
2.2 External Stakeholders
The growing demand for statistics by the Executive Council and government entities in the Emirate
increase the expectations placed upon SCAD. More than 40 Several meetings with government
entities were conducted to identify their statistical and technological needs. Following this

3
stakeholder consultation, some of the goals for the eSCAD Administrative Data Collection project
included:
Eliminate inconsistencies in the figures issued by government agencies
Adopt international best practices in the compilation of statistical indicators
Apply best computing methods in the integration editing, processing, analysis,
dissemination and protection of data
Enable other government entities to load data directly into SCAD’s database
Facilitate access to information provided by SCAD
2.3 Conceptual Design
Knowledge from the stakeholder meetings and an official visit to Statistics Korea determined the
technical policies of the project. The conceptual design (see Figure 1) included the use of:
Oracle as the database
automated methods in the extraction, transfer and loading of administrative records
service-oriented engineering to control the life-cycle management
data quality engines
analytical engines to extract and store indicators in the main data warehouse
2.4 Project Planning
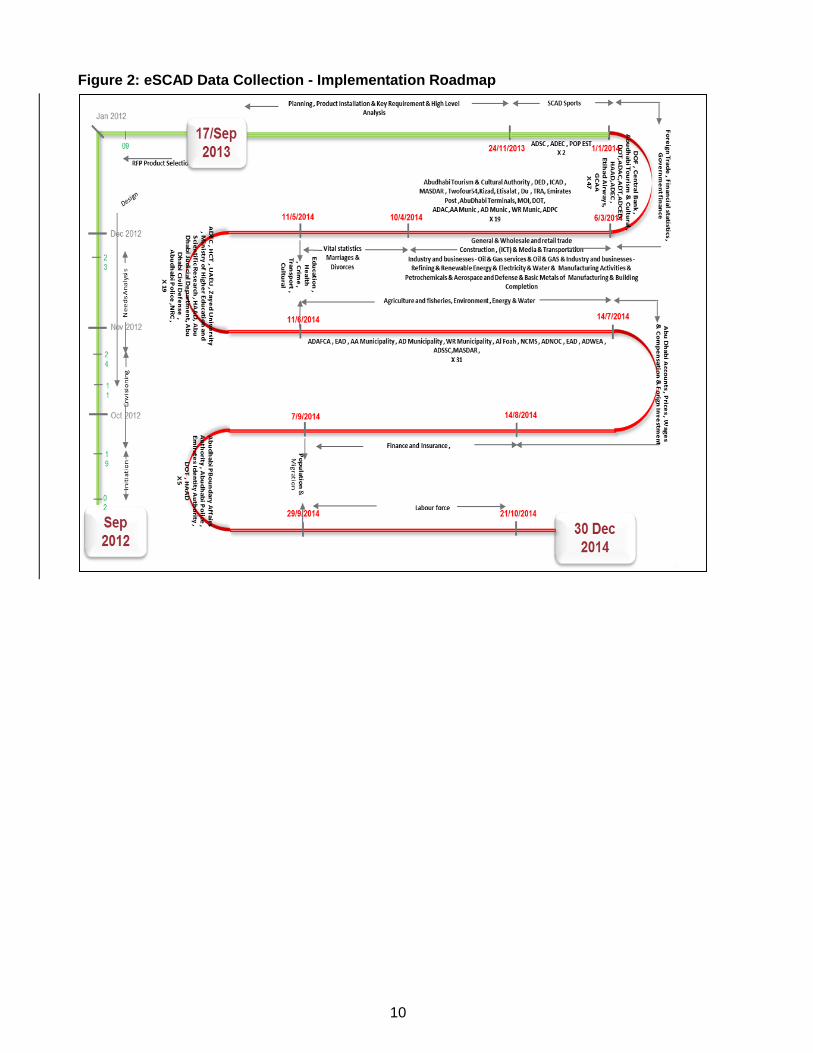
A project of this size is a complex undertaking. A 14 phase roadmap was prepared with operational
targets for each strategic objective. Action plans and timelines were also prepared for the
implementation of each of the project phases as illustrated in Figure 2.
A successful component of the project was a comprehensive communication plan. The plan
included responsibilities, channels, procedures and contact persons, as well as feedback
mechanisms. In addition, a quality assurance plan and a quality control system were set-up.
2.5 Operation
The eSCAD Administrative Data Collection system currently links 56 data providing agencies to
SCAD through a secure network (B2B). Dependent upon the nature of the administrative data,
agencies are provided with data structure rules prior to uploading. The received data are
automatically validated and quality checked. Some datasets have predefined calculation
procedures applied to them to directly produce statistics, while others are loaded as databases,
available for further analysis by subject matter experts.

4
2.6 Outcomes
The main successful outcomes from this project were:
timeliness of data flow
coverage of the administrative data used in the compilation of statistics
consistency of statistical data with standard international definitions and classifications
regular updates of administrative data
measurement of data quality
ability to identify data gaps in administrative records
To date, XX administrative datasets have been successfully loaded and validated in the eSCAD
data collection system. The operational plan for the system identifies at least XX more datasets to
be incorporated.
3. eSCAD: Statistical Dashboard
The second eSCAD system developed was the Statistical Dashboard. It was launched in May
2015. The dashboard tool provides an ‘at-a-glance’ view of statistical indicators on topics such as:
population, foreign trade, hotel establishments, foreign investment, education, and more.
The project innovation is the use of standard dashboards for the dissemination of official statistics.
The dashboard supports the presentation of complex data, but in an easily consumable way.
3.1 Key Features fFor Users
3.1.1 Interactivity between indicators
The eSCAD Statistical Dashboard was designed to allow interactivity between different indicators.
For example, in the GDP dashboard, if a user selects an economic activity in a chart – the same
activity will be automatically highlighted elsewhere in the dashboard (see Figure 3).
3.1.2 Customizing bBy Filtering
Since users’ needs differ, the eSCAD Statistical Dashboard allows customizing by filtering. For
example, data can be filtering for a specific region, school type, citizenship, etc. (see Figure 4).
3.1.3 Drill Downs
The system allows the user to ‘drill down’ to further, more detailed data in two ways. Either, at
single chart level - where the chart changes to another chart to present additional data, or drill to
another related dashboard with different indicators and graphs (see Figure 5).

5
3.1.4 Device independence
The eSCAD Statistical Dashboard operates on different devices platforms and operating systems,
such as, PCs, tablets, and smart phones (iOS, Windows, and Android). The system also works in
Flash and HTML5 formats.
3.1.5 Intuitive User Interface
The system recognised by clients for its attractive, clean, and simple interface. In fact, the system
requires no dedicated training. Even though the interface is simple, the eSCAD Statistical
Dashboard is still able to present large amount of data in clear and cohesive manner that is not
possible from standard data tables.
3.1.6 Metadata
The system provides additional information boxes (metadata) when hovering on charts.
3.1.7 Exporting
To implement the open data concept, eSCAD Statistical Dashboard allows the user to export the
whole dashboard data or a single chart data. Export formats include: PDF, MS Excel, and CSV.
3.2 Key features for Developers level key features
3.2.1 No Coding Required
The software used for developing SCAD’s dashboard system is iDashboard. It was selected due to
the ease with which data relationships can be applied and dashboards can be built. In fact,
iDashboards does not require any coding to produce beautiful charts and graphs. All that is
required is a good understanding of the underlying data and intermediate IT skills.
3.2.2 Source Connectivity
A mandatory requirement for the dashboard tool was the ability to connect to several internal data
sources types. The current system connects to Oracle database, MySQL, SAS, and MS Excel.
3.2.3 User Management and Reporting
Within iDashboard, users are assigned to groups with specific permissions (or access rights).
Users can be authenticated from credentials, or given guest user status (e.g. public access). The
user management module allows tracking and reporting on dashboard usage.
3.2.4 Security
For security purposes, the application, system administration database, and data are located in
different environments.

6
3.3 Dashboard Layout
3.3.1 Home page layout (see Figure 6)
Header – place holder for main title and logos.
Navigation Panel – icons located to right side of the screen. These include: language, help,
user manual, user satisfaction, and contact us.
Body – large icons of the six statistical themes with sub-themes listed and linked
Footer – icons as symbolic indicators values that can give ‘at-a-glance’ value and used as
short cuts for important detailed dashboards.
3.3.2 Dashboards layout (see Figure 7)
Header - contains the dashboard title and specific dashboard filters.
Navigation Panel – icons located to right side of the screen. These include: home,
language, and any associated drill down dashboards
Body - contains all charts and tables that form the dashboard. Usually a dashboard
contains seven charts at maximum to ensure good visibility.
3.4 Lessons Learned
3.4.1 Consider Visual Perception
The design of a dashboard should support visual perception rules. For example, the flow of
information should run from left-to-right, or charts should progress from simple to more complex.
The challenge in creating dashboards is to engage the user by creating a ‘story’ with the data. The
story should flow - as Stephen Few states “structure is a navigation mechanism for the user
perception and experience”[1].
3.4.2 The Importance of Analysis
Time spent upfront in analysing data and designing is never wasted. The dashboard development
phase will be smoother when the data are understood and the best designs have been deliberated.
3.4.3 Best Chart for the Job
Within data, there are various statistical relationships – magnitude, change over time, distribution,
part-to-whole, correlation, ranking, etc. Some charts better present these relationships than others.
For example, for magnitude, a bar chart may be best choice.
3.4.4 The Importance of colours
An important consideration in designing a dashboard is the use of colour. When used well, colour
selection can assist a user to quickly identify trends, or spot outliers. Used incorrectly, and colours
can confound and mislead users. In eSCAD, dashboards within statistical themes have the same

7
colour scheme. This gives the user confidence that they know what data they working with.
Additionally, using a white background in dashboards assists the visual perception of the charts.
3.4.5 Stand Alone Charts
While it is important to keep charts clean, there is a duty to the user that the details about the data,
that give it meaning, are made available. That is, the chart should be able to ‘stand alone’ and still
be interpretable. Consider the geographic reference, the temporal reference, axis titles,
measurement units, etc.
4. Conclusion
This is a case study of two successful systems developed by SCAD. The eSCAD Data Collection
tool has been deployed to 56 agencies and is continuously available for data downloads and
storage.
The eSCAD Statistical Dashboard has been a major success with our clients. Since release over
XX,XXX users have accessed the public system via the SCAD website. An additional XX
government users have been registered and actively use the system. SCAD would recommend all
statistical organisations consider the use of dashboards for the dissemination of official statistics.

8
5. References
[1] Steven Few….?
Pervasive Hurdles to |Effective Dashboard Design, Stephen Few, Visual Business Intelligence
Newsletter, January 2007.
[2] Guide to Creating Dashboards People Love to Use , Juice , November 2009, Page 26
[3] website http://extremepresentation.typepad.com/blog/2006/09/choosing_a_good.html
[4] https://www.abudhabi.ae/cs/groups/public/documents/attachment/x2jy/b2no/~edisp/ad_sdi_brochure.pdf.
[5] https://www.abudhabi.ae/cs/groups/public/documents/attachment/mgfk/mdyy/~edisp/ad062021.pdf
[6] http://kostat.go.kr/portal/eng/index.action.
[7] http://www.oracle.com/us/solutions/business-analytics/business-intelligence/enterprise-edition/overview/index.html
[8] http://www.oracle.com/technetwork/middleware/data-integrator/overview/index.html
[9] http://www.oracle.com/us/products/middleware/soa/overview/index.html
[10] http://www1.unece.org/stat/platform/display/metis/The+Generic+Statistical+Business+Process+Model
[11] http://sis.scad.ae/dashboards/index.html

9
6. Figures
Figure 1: eSCAD Data Collection - Conceptual Design Schema
DATA QUALITY LAYER DATA QUALITY LAYER
XML Files
Flat Files
DATA FILES
DATA SOURCE DATA LAYER
MFTP/SFTP/XFB
SOAPADNET
SCAD
E. D. I LAYER STORAGE LAYERANALYSIS
LAYER
PRESENTATION LAYER
Read Data
EXTRACT
REA
D &
EX
TRA
CT
SOU
RC
E D
ATA
DA
TA V
ALI
DA
TIO
N –
(Te
chn
ical
)
DA
TA T
YP
E ST
AN
DA
RD
ISA
TIO
N
REJECT DATA
AREA
CLEANSE
PARSE CORRECT ENHANCE
STANDARDISE / MATCH
REMOVE DUPLICATES
FILTER/SORT/CONSOLIDATE
DATA VALIDATION (Statistical)
TRANSFORM
SOU
RC
E SP
ECIF
IC
RA
NSF
OR
MA
TIO
N
AP
PLY
BU
SIN
ESS
RU
LES
CR
EATE
AG
GR
EGA
TES
BU
ILD
REF
EREN
CE
DA
TA
GEN
ERA
TE A
UD
IT A
ND
R
ECO
NC
ILIT
ATI
ON
REP
OR
T
GEN
ERA
TE S
UR
RO
GA
TE K
EYS
LOAD
LOAD STAGING TABLES
LOAD DATAWAREHOUSE
LOAD OLAP CUBES
LOAD DATA MARTS
LOAD AGGREGATE DATA
ETL PROCESS OLAP ENGINE
DATA MINING ENGINE
REPORTING ENGINE
MS Office PLUGIN
Interactive Dashboards Reports & Scorecards
OLAP & Advanced Analytics
MS Office Plugin
Mobile Delivery of Reports & Alerts
Outlook
ADNET
DATA PUSH
DB LINK/ XML Over
HTTP
HTTPS
DATABASE
Relational
Database
Ana
lysi
s &
R
epor
ting
Inte
rfac
e
Dat
abas
e
Co
nn
ect
ors
Re
ject
D
ata
DRA – Landing Dir
Flat Files
Excel
DATA RECEPTION AREA
INTERFACE APPLICATIONS
B2B Data
Exchange
B2B Data
Exchange
Staging Database
Relational
Database
AccessMetadata
RAW DATA
STAGING AREA
DATA MART DATA MART
DATA MART DATA MART
DATAWAREHOUSE
ODS
RELATIONAL DATABASE SERVER
Database Replication
ONLINE INTERFACE
Online Form Filling
AccessMetadata
AccessMetadata
B2B Data Exchange
AccessMetadata
LOA
D D
ATA
REA
D D
ATA
WORKFLOW ENGINE
Online File Upload
HTTPS
WEB SERVICE
Excel
ADNET
AD
GE
SOURCE SYSTEMS
SCA
D
XML Files
ADNETB2B Data
Exchange
OTH
ER S
OU
RC
ES
HTTPSSOCIAL
NETWORK DATA
SCAD STATISTICAL PRIVATE SOCIAL NETWORK
BI ENGINE
Historical Data
ONLINE
COLLABORATIONHTTPS
CONTENT COLLABORATION INSTANT MESSAGING VIDEO MEETING FUNCTIONAL GROUPS
ADNET
ADNET
FEED TO EXTERNAL SYSTEMS
MFTP/SFTP/ WEBSERVICE
DATA ARCHIVAL AREA
DATABASEFILES
Archival Process
FILE STORAGE
PDF FilesExcel XML
MS WordFlat Files
METADATA REPOSITORY
DATA WAREHOUSE & REPORTING METADATA
OLAP METADATA
Staging, Datawarehouse, Datamart Table Structures
SOURCE SYSTEM DETAILS METADATA
Source Server Details Server Connectivity Details XML DTDs Source application URLs, links
ETL METADATA File names and location Input Data Layout definitions Database Table and layouts Attribute meaning
Data Mappings Transformation Rules Data Quality Rules Workflow Rules
DATA GOVERNANCE
Policies Processes and Procedures
Governance Risk and Compliance
Data Security
SLA Management
YEARLYBOOK, HISTORICAL DATA
PDF FilesExcel MS Word
CRM
Change Management
10
Figure 2: eSCAD Data Collection - Implementation Roadmap

11
Figure 3: Indicators Interactivity
Figure 2: Filters

12
Figure 3: Drill Down

13
Figure 4: Home page layout
Figure 5: Dashboards layout
Header B
od
y
Fo
ote
r
Na
vig
ati
on
Header
Bo
dy
Na
vig
ati
on