Embed Size (px)
Citation preview

Buddy Garcia, Chairman Larry R. Soward, Commissioner Bryan W. Shaw, Ph.D., Commissioner Glenn Shankle, Executive Director
TEXAS COMMISSION ON ENVIRONMENTAL QUALITY Protecting Texas by Reducing and Preventing Pollution
. .'·;,_
April23, 2008 ........ : n ; > ••
w~ ThciJ.rtts biggs' · , · Associate Division Director for Air Programs Environmental Protection Agency 1445 Ross Avenue, Suite 1200 Dallas, Texas 75202-2733
l..•
.... ,···;.
'. ,,
·' .. ~ ....
·, ;_
·i:
... ) .)(:.. . .. . :i.
J • -1~ . '
" '.
Re: Dallas-Fort Worth Eight-Hour Ozone "State hnplementatiori. Plan. .... 1 .... / .~ .. '; \''., :;_ ·-·
. . "/:.. . : :'· .. ~-~
Dear Mr. Diggs: L·
Thank you for your letter ofMarch 7, 2008. Ai:, requested, this-letter provides supplemental iiiformation · that would ·be beneficial to the Environmental·Protection Agency's review of the Dallas-Fort Worth Eight-Hour Ozone State hnplementation Plan (DFW SIP).
Items addressed include updated information regard#lg airport eiiDsswns and Discrete Emission Reduction Credits (DERCs), which has led to adjustments made for more accurate projections of emissions ~stimates from these categories. Also provided is additional and updated information regarding the Texas Emission Reduction Plan (TERP) and AirCheckTexas funding and.J)rogram enhancements.
The commission received co:rnment regarding growth in the gas compressor engine inventory associated :with new oil and gas production in the Barnett Shale formation in and near the .DFW nonattainment area. As a result, .the commission directed staff to research this issue~ The TCEQ staff conducted .a si.rrvey of stationary, gas-fired engines :in the DFW nonattainment area. Information regarding the growth in the gas compressor engine .inventory in the DFW nonattainment area is also included.
As suggested by the EPA, analysis of reductions from back-up generators described in theDFW SIP have been perfonned, which further supports the attainrrient demonstration.
The TCEQ performed numerous sep.sitivity analyses as a part of the DFW SIP development, which has enabled the state to provide clarifying information in support of the DFW SIP attainment demonstration. This information indicates that the ·emissions adjustments for airports, the revised projections of DERC usage, and the eruissions reductions from back-up generators will bring design values for all DFW monitors below 88 ppb. The strong weight of evidence argument provided in the DFW SIP and the clarifying information provided here demonstrates that all DFW monitors will be in attainment of the Eight-Hour Ozone Standard by the attainment date.
P.O. Box 13087 • Austin, Texas 78711-3087 · • 512-239-1000 • Internet address: www.tceq.state.tx.us printed on recycled paper using soyMbased ink

Mr. Thomas Diggs Page2 April23, 2008
We understand that a letter of conm1itment from the executive director is needed regarding the TCEQ's pians for the DERC flow-contro(rule atJ.d a DFW SIP revision to include that rule and address contingency measures. That letter will be sent to you under separate cover.
Thank you for your consideration of this· infommtion in support of the DFW SIP. We appreciate the contributions of the EPA and North Central Texas Council of Govenm1ents (NCTCOG} to provide updated and clarifying information regarding the DFW Eight-Hour Ozone SIP. We hope that this information will provide the support needed for the EPA to propose conditional approval of the DFW SIP, and we look forward to your proposal.
Sincerely,
~/{ Susana M. Hildebrand, P .E. Director, Air Quality Division
Enclosure

Texas Emission Reduction Plan (TERP) and AirCheckTexas As mentioned in the DFW SIP, the 80th Texas Legislature (2007) was contemplating additional funding for TERP, but the final funding decision was not available until after the DFW SIP was sent to the EPA. Direction was given to staff at the DFW SIP adoption agenda to provide the EPA with additional information once the legislation and appropriations were complete. As requested, additional funding information is being provided to assist in your review. On July 15, 2007, the Governor of Texas signed House Bill 1, which allowed the Legislature to appropriate $297,144,243 in funding statewide for TERP for fiscal years 2008 and 2009. We agree that TERP will continue to be a highly cost effective program to reduce NOX emissions from diesel vehicles and equipment. The TCEQ thanks you for your joint efforts with local officials to help increase the number of TERP projects implemented in the DFW area by the attainment year. As also mentioned in the SIP, the legislature was considering providing additional funding for the AirCheckTexas Drive a Clean Machine program. During the 80th Legislative Session, Senate Bill 12 was passed and subsequently signed by the governor on June 15, 2007. Funds were appropriated by the Legislature for the 2008-2009 biennium for AirCheck Texas. Air quality benefits over and above those modeled for the SIP are expected from the additional TERP funding. Because the commission is currently awarding grants based on program criteria rather than on predetermined percentages for each nonattainment area of the state, an estimated reduction in NOX emissions can be made using only an estimated funding allotment for the DFW area. As an example, if 50 percent of available 2008 funding and 70 percent of the 2009 funding were to be used for projects in the DFW area, a 14.2 tpd reduction in NOX emissions could be anticipated. This example calculation is based upon an average seven-year project life, an estimated $6,000 cost per ton for TERP program emissions reductions, and using 2008 funds remaining after previous commitments are met. A model-based analysis indicating a 14.2 tpd change in NOX, using the EPA’s duplication of the TCEQ’s Combo 10 and the EPA’s sensitivity test, results in an estimated ozone reduction of 0.487 ppb at the Frisco monitor and 0.650 ppb at the Denton monitor. When evaluated over all the DFW monitors, the average reduction is 0.434 ppb. Attachment C: Model-Based Ozone Response Calculations provides additional information about these estimated ozone reductions. Similarly, the AirCheckTexas program in the DFW area was funded at $21,348,583 each for fiscal years 2008 and 2009. The North Central Texas Council of Governments (NCTCOG) is the local entity implementing the program and processing applications. Since the SB 12 enhanced program started on December 12, 2007, there has been high interest and 15,092 applications submitted. NCTCOG reports that through April 4, 2008, there were 6,986 vouchers issued. Of those, 404 repair vouchers were redeemed for a total of $186,947.10 and 3,032 replacement vouchers were redeemed for a total of $9,104,000.00. Interest level and applications are expected to remain high in the future. Airport Emissions Inventory Adjustments As acknowledged by the EPA, as a part of collaborative efforts with the TCEQ and the EPA to review local measures, NCTCOG identified the airport emissions inventory as a sector meriting more intensive review. DFW International Airport, Love Field, the City of Fort Worth, and the City of Dallas agreed that there was value in assessing the airports’ emissions. Information regarding the revised estimates and estimated impact in the model is being provided for your
Page 1 of 20

review, as requested. The following discussion is summarized in Table 1: Summary of Emissions Adjustment for DFW Area Airports at the end of the section. The 2009 SIP emissions inventory for the DFW International Airport, Love Field Airport and others (Arlington Municipal, Addison Airport, Carswell Air Force Base, Dallas North, Fort Worth Alliance, Fort Worth Meacham, and Denton Municipal) was reported as 21.01 tpd for aircraft emissions and 3.04 tpd for Ground Support Equipment (GSE) emissions. In the SIP, the 2009 future case airport emissions were derived from 2005-2009 projections based on 2002 operational data. The Emission Dispersion Modeling System (EDMS) model (version 4.12) was used to estimate the commercial aircraft emissions. The emissions from Air Taxi, General Aviation, and Military were considered insignificant when compared to the commercial aircraft emissions; therefore, these emissions were not included in the SIP estimation. Aircraft landing and take off (LTO) data were used to allocate the total 21.01 tpd aircraft emissions to DFW International Airport (18.54 tpd), Love Field (2.21 tpd), and others (0.26 tpd). After adoption of the SIP, more accurate and updated LTO data were made available by the City of Dallas and DFW International Airport. The DFW International Airport provided NCTCOG with data on activities, fleet mix, and more accurate LTOs. With this data, NCTCOG estimated 2005 emission numbers to be 10.20 tpd for aircraft and 1.3 tpd for GSE. The revised 2005 aircraft emissions were then projected to 2009, using an annual percentage growth of 2.45 percent based upon the “Terminal Area Forecast Summary for Fiscal Year 2006-2025, U.S. Department of Transportation Federal Aviation Administration, FAA-APO-07-1, March 2007.” Updated DFW airport emissions estimates for 2009 are 11.20 tpd for aircraft emissions and 1.43 tpd for GSE emissions. For Love Field Airport, the Environmental Research Group’s “2005 Emissions Inventory, Love Field Airport” report for the Aviation Department Environmental Affairs Group, May 30, 2007, was used to determine the updates to the emissions inventory (see Attachment A: ERG Report, Love Field 2005 Emissions Inventory). Using the updated 2005 aircraft emissions and a newer model, EDMS version 4.5, Love Field 2005 aircraft emissions were adjusted to 0.69 tpd (from 2.21 tpd included in the SIP). The 2009 projected emissions inventory was then recalculated to 0.79 tpd using an annual growth of 3.64 percent between 2005 and 2009 (prorated using 18.2 percent growth between 2005 and 2010 as shown in Table 6-1: 2005 / Estimated 2010 LTO Data by Aircraft Type on page 6-1 of the ERG report). Using the ERG report and methodology, GSE emissions were changed from 0.43 tpd to 0.02 tpd. As a result of the updated 2005 operational data for both Dallas Love Field and DFW International Airport after adoption of the SIP, the emissions estimates for the 2009 future case for aircraft and GSE emissions can be reduced by 10.34 tpd, as shown in Table 1. When the existing NCTCOG Voluntary Mobile Emission Reduction Program (VMEP) commitment of 0.95 tpd on page 4-15 of the SIP is deducted from the revised projection of 10.34 tpd, the final adjustment is 9.39 tpd less in the projected 2009 future inventory. Both Southwest Airlines and DFW International Airport have concurred with these adjustments by letter (see Attachments B.5 and B.6 within Attachment B: Aircraft and Ground Support Equipment Emissions Update for Airports in the DFW Region). A model-based technical analysis similar to the EPA replication runs and EPA non-road sensitivity tests indicates that the 9.39 tpd less NOX should reduce ozone concentrations by 0.322 ppb at the Frisco monitor and by 0.430 ppb at the Denton monitor. Averaged across the monitors, ozone concentrations are projected to be reduced by 0.287 ppb.
Page 2 of 20

The EPA sensitivity tests were run with non-road NOX reduced across the entire DFW nine-county area, whereas the DFW International Airport and Love Field emissions are concentrated in a relatively small area between Dallas and Fort Worth.
Table 1: Summary of Emissions Adjustments for DFW Area Airports Dallas
Love FieldDFW
International
Others
Total
NOX Inventory Description tpd tpd tpd tpd
2009 Aircraft SIP Emissions 2.21 18.54 0.26 21.01 2009 GSE SIP Emissions 0.43 2.59 0.02 3.04
Total Airport SIP Emissions 2.64 21.13 0.28 24.05 2009 Aircraft Emissions
Adjustment 0.79 11.20 0.26 12.25
2009 GSE Emissions Adjustment 0.02 1.43 0.02 1.47 Total Airport Adjustment 0.81 12.63 0.28 13.72
Emission Reductions 1.84 8.50 0.00 10.34 VMEP Emissions Reductions
Included in the Inventory - - - -0.95
Total Airport Emissions Saved 9.39
Discrete Emission Reduction Credits (DERCs) Emissions Inventory Adjustment In the DFW SIP, the projected use of banked emissions credit inventory for Emission Reduction Credits (ERCs) and Discrete Emission Reduction Credits (DERCs) were estimated using a growth rate of 45 percent for non-Electric Generating Unit (EGU) point source emissions by 2009. This growth rate is a very conservative assumption since it assumes all credits banked would be used. The photochemical modeling in the DFW SIP included all 22.0 tpd emissions from ERCs and DERCs available in the registry as of August 17, 2005, assuming that all would be used by March 1, 2009. The portion of the projected emissions attributable to DERC use was 20.4 tpd for the future case inventory. However, since the DERC program started in 1993, multiple “intent to use” applications have been filed, but no actual use of DERCs has occurred in the DFW nonattainment area. Therefore, a less conservative and more realistic projection of anticipated DERC emissions has been made. A 2009 future case inventory projection for NOX emissions of 3.2 tpd from DERCs is a more realistic estimate, allowing an adjustment to be made for the projected 2009 future inventory for NOX by 17.2 tpd. A model-based analysis using TCEQ point source sensitivity tests indicates that removal of 17.2 tons of NOX from the projected inventory should reduce ozone concentrations by 0.387 ppb at the Frisco monitor and by 0.315 ppb at the Denton monitor. An average reduction of 0.463 ppb ozone across all of the monitors is predicted. These estimated ozone reductions are based upon response factors from an existing TCEQ point source sensitivity test that reduced point source NOX emissions by 15 tpd, distributed across the DFW area (4 tons from low level points and 11 tons from elevated point sources). In the DFW SIP, the projected emissions from DERC usage were assigned to non-EGU and non-cement kiln point sources distributed across the nine-county area. Therefore, the 17.2 tpd adjustment to point source emissions closely matches the sensitivity analysis assumption validating the results at all monitor sites. The summary of this analysis for all DFW monitors is included in Table 2: Adjustments to DFW 2009 Future Design Values.
Page 3 of 20

To make a reduction in the DERC inventory projection viable, the TCEQ’s staff recognizes the EPA’s recommendation that DERC usage must be restricted during the attainment year in the DFW area. Therefore, the restriction must be effective by the beginning of ozone season 2009. Therefore, as mentioned in the cover letter, the TCEQ executive director plans to send a letter of commitment to propose a revision to the DERC rule and the SIP to the EPA. The proposed rule revision would (subject to commission approval and public participation) prohibit the use of DERCs beyond the level allowed in the accompanying SIP revision and be consistent with attainment of the Eight-Hour Ozone Standard for the DFW area. The executive director’s recommended proposal is planned for commission consideration on August 20, 2008, and the adoption date is tentatively planned for January 28, 2009. A proposed SIP revision to incorporate the DERC rule into the DFW SIP is also tentatively planned for consideration by the commission on August 20, 2008, and for adoption on January 28, 2009, concurrent with the rule. If adopted, the rule and corresponding SIP revision would be submitted to the EPA and effective before March 1, 2009. Back-up Generators (Stationary Diesel Engines and Dual-Fuel Engines) An estimated impact of reductions from back-up generators is being provided for review. The DFW SIP revision includes an estimated 0.9 tpd of NOX reductions from rules adopted for back-up generators. The rules ensure that back-up generators are replaced with newer and cleaner engines, and a prohibition is established on operating diesel and dual-fuel engines for maintenance and testing purposes between 6:00 A.M. and noon. As discussed on page 4-22 of the DFW SIP, these measures are similar to measures implemented in the Houston-Galveston-Brazoria (HGB) area for the HGB One-Hour Ozone Attainment Demonstration SIP. The HGB diesel engine and dual-fuel engine control measures are expected to reduce 1.0 tpd NOX, which the EPA approved. The calculation includes an estimated 0.1 tpd reduction from the Mass Emissions Cap and Trade (MECT) Program, which is HGB specific. By subtracting the 0.1 tpd for the diesel engines in MECT from the total HGB reductions for diesel and dual-fuel engines, approximately 0.9 tpd reductions were estimated for implementing the measures in the DFW area, using modeling-based technical analysis methods. Because all of these engines are in the area sources emissions inventory and are located at office buildings, minor industrial sites, hospitals, and small businesses, etc., the population of affected sources in DFW is roughly equivalent to those in the HGB area. The rules implementing these measures for the DFW area were adopted by the commission on May 23, 2007. However, the reductions were initially only included in the weight of evidence discussion in the DFW SIP, because the estimated 0.9 tpd reductions were extrapolated from the estimate used for the HGB area. Based on discussions between the EPA and TCEQ staff, the EPA Region 6 has indicated that the approach to estimate the 0.9 tpd NOX reductions from the adopted rules for stationary, diesel engines and dual-fuel engines may be sufficient for quantification of this control measure. Model-based analysis indicates that reducing emissions from back-up engines should have a small additional impact on the DFW area. The area-wide model-based technical analysis (based upon the EPA non-road sensitivity tests) indicates that a NOX reduction of 0.9 tpd is estimated to reduce ozone by 0.031 ppb at the Frisco monitor and by 0.041 ppb at the Denton monitor. Averaged across the monitors, ozone concentrations should be reduced by 0.028 ppb. Since the
Page 4 of 20

0.9 tpd adjustment to non-road emissions closely matches the EPA sensitivity test assumptions, the results should be valid at all monitor sites. Summary of Model-Based Analysis The availability of updated emissions information regarding reductions in airport emissions, DERCs, and backup generator emissions will reduce ozone in both the future case and control case. The impact of these changes in NOX emissions can be calculated using response data from previously run sensitivity tests in order to quantify the differences in ozone expected to result from the adjustments to the NOX emissions. The future ozone design values are adjusted upward or downward based upon changes in projected emissions. The changes in ozone are calculated by multiplying the updated estimates of future emissions by the response factors derived from previous sensitivity tests developed as a part of the DFW Attainment Demonstration SIP Revision. Attachment C: Model-Based Ozone Response Calculations provides additional information on the calculations supporting these changes. The net result of the adjustments to the DERC usage, airport, and back-up generator emissions is shown in Table 2: Adjustments to DFW 2009 Future Design Value (Combo 10) below. The table includes columns for each adjustment and calculations for every monitor in the DFW area. The EPA guidance suggests that all decimal points be carried through the calculations and truncated at the end of the process, and this table follows that procedure. For example, at the Frisco monitor the 2009 Future Design Value (FDV) in the DFW SIP starts at 88.680 ppb, before truncation. The total adjustment at the Frisco monitor for all three changes in emissions is -0.740 ppb. As a result, the adjusted FDV for the Frisco monitor is 87.940, which is 87 ppb after truncation.
Table 2: Adjustments to DFW 2009 Future Design Values (Combo 10)
2009 DERCS Airports Generators Total Adjusted FDV @ -17.2 @ -9.39 @ -0.9 Adjustment FDV Monitor Name (ppb) Points Non-Road Non-Road Frisco C31 88.680 -0.387 -0.322 -0.031 -0.740 87.940 Hinton C60 85.595 -0.358 -0.258 -0.025 -0.641 84.954 Dallas N C63 84.804 -0.358 -0.278 -0.027 -0.663 84.142 Dallas Exec C402 78.804 -0.473 -0.192 -0.018 -0.684 78.120 Denton C56 88.610 -0.315 -0.430 -0.041 -0.786 87.823 Midlothian C94 83.932 -0.659 -0.086 -0.008 -0.753 83.179 Arlington C57 80.873 -0.674 -0.243 -0.023 -0.940 79.933 FtW NW C13 85.570 -0.573 -0.341 -0.033 -0.947 84.623 FtW Keller C17 84.816 -0.373 -0.434 -0.042 -0.848 83.969 Average 84.632 -0.463 -0.287 -0.028 -0.778 83.854
Compressor Engines As requested by the EPA, the following information is being provided regarding emissions from stationary, gas-fired engines. During the May 23, 2007, adoption agenda for the 30 TAC Chapter 117 rules and DFW SIPs, stakeholders commented that the number of stationary, gas-fired engines in the DFW area was underestimated. This discussion led to direction from the commissioners for the executive director's staff to research the issue. Staff subsequently
Page 5 of 20

conducted a survey to re-evaluate the number of stationary, gas-fired engines in the nine-county DFW area. The TCEQ survey results indicate a current fleet of approximately 1,170 stationary, gas-fired internal combustion engines in the DFW area source inventory, which is more than was estimated for the DFW SIP planning, but less than the 2,200 engines asserted by the stakeholders. Survey respondents indicated that at least 200 additional engine installations are also expected by March 1, 2009, which is the beginning of the attainment year ozone season. The majority of the stationary engines in the DFW area are located at minor sources not reported in the agency's point source emissions inventory. Because of this, obtaining exact numbers for non-point source compressor engine populations is difficult and time-consuming; therefore, estimation methods are frequently used by the EPA, the TCEQ, and other state agencies, to determine source populations for area sources. TCEQ initially based compressor engine NOX emissions and population estimates for the DFW area on studies made in early 2005. Although this provided reasonable approximations for engine fleet population in 2004 and prior, the studies failed to predict a surge in growth that occurred in and after 2005. TCEQ survey results reflect an unexpected growth in the natural gas production compressor engine inventory, indicating that at least 65 percent of the engines were installed as new service in 2005 or later, and that more than 50 percent of those were installed in or after 2006. The survey results conclude that the unexpected growth at unreported source locations led to an underestimation of the compressor engine population during the Chapter 117 rulemaking process. The portion of the oil and gas area source NOX emissions inventory that includes compressor engines was also underestimated based on older studies. The modeled emissions from area source oil and gas inventory are based on base case year oil and gas production data rather than on individual component source categories. The NOX emissions estimated from area source compressor engines are approximately 30 - 35 percent of the 11.9 tpd in the base case oil and gas area source NOX inventory. The balance of the oil and gas inventory was assumed to be the remainder of oil and gas area combustion sources. However, based on two recent studies, compressor engines actually comprise about 95 percent of the oil and gas area source NOX inventory, and the balance of NOX emissions from other combustion sources is very small. Therefore, almost all of the 11.9 tpd in the base case oil and gas area source NOX inventory is from compressor engines. In effect, the model underestimated NOX emissions from compressor engines and overestimated emissions from other combustion sources in the oil and gas area source inventory. This conclusion is supported by two recent studies: the 2006 ERG study: Emissions from Oil and Gas Production Facilities and a 2007 ENVIRON study titled WRAP Area Source Emissions Inventory Projections and Control Strategy Evaluation - Phase II. As a result, the Combo 10 control run underestimated reductions that will be realized from the engine rule. Figure 1: DFW Oil and Gas Area Source NOX Inventory, Modeled vs. Estimated Actual Emissions provides a graphical representation of the estimated change in projected future case NOX emissions, due to additional compressor engines in the oil and gas area source emissions inventory as compared to the NOX emissions projected in the model. The survey results underscore the need for the Chapter 117 reductions from this source category. Without controls required by Chapter 117 rules, future case oil and gas area source NOX emissions are estimated to be approximately 62 tpd, which is 47 tpd more NOX emissions than predicted and used in the model. The 62 tpd estimate for the future case oil and gas area source NOX emission is based on two components, including approximately 59 tpd NOX emissions from compressor engine numbers indicated by survey results, and approximately three tpd from other combustion sources. The other combustion sources component is based on a reevaluation of the oil and gas area source inventory discussed above.
Page 6 of 20

With controls on compressors engines in place, a 47 tpd NOX reduction from compressor engines is expected in the future case oil and gas area source NOX emissions. The overall net effect is that after controls, the future case oil and gas area source NOX emissions are now estimated to be three tpd more than was projected for use in the SIP model. The projected increase in NOX emissions from additional compressor engines is expected to be focused in Johnson, Parker, and Tarrant Counties. The map in Attachment D: Barnett Shale Oil and Gas Wells shows the DFW area oil and gas well locations as of January 2008 along with DFW area ozone monitor locations. Because DFW area wind patterns associated with DFW ozone frequently entail winds blowing from the southeast to the northwest, an increase in NOX emissions from the additional engines is not anticipated to significantly impact the Frisco (C31) and Denton (C56) monitors, which are the controlling monitors in the SIP modeling. In summary, while the future case controlled NOX emissions inventory in the model is expected to slightly increase, those increased emissions are not anticipated to significantly impact the monitors, and the NOX emissions from the additional engines will be effectively controlled by the Chapter 117 rules adopted by the commission on May 23, 2007. These controls will lead to substantial real-world NOX reductions between 2007 and 2009 from the compressor engine source category, which will have significant benefit toward reducing actual monitored ozone values in the DFW area.
DFW Oil & Gas Area Source NOx InventoryModeled vs. Estimated Actual Emissions
0
10
20
30
40
50
60
70
80
1999 2000 2001 2002 2003 2004 2005 2006 2007 2008 2009Year
NO
x (T
PD)
Actual Total O&G Emissions (w/ engines)
Modeled Total O&G Emissions (w/ engines)
* The actual emissions data are estimates based on information from the DFW engine survey (2007) and are only presented for a graphical comparison to modeled data. Actual emissions from 2000 to 2006 are interpolated based on 1999 and 2007 data using Texas Railroad Commission natural gas production data.
Figure 1: DFW Oil and Gas Area Source NOX Inventory, Modeled vs. Estimated Actual Emissions
Green Cement Ordinances EPA noted that cement manufacturers have been in negotiation with local municipalities to reduce emissions beyond SIP requirements and requested an update regarding these efforts. The
Page 7 of 20

TCEQ is aware that the City of Dallas is negotiating with Ash Grove Cement about additional voluntary NOX emission reductions. However, the TCEQ is not aware that this commitment has been finalized. If a commitment for additional voluntary NOX emission reductions is finalized, the TCEQ will provide this information in the future. Contingency Measures Since the EPA's initial review indicates that the DFW SIP contingency plan does not sufficiently identify contingency measures to achieve three percent reductions in the event the DFW area fails to attain the eight-hour ozone NAAQS, the TCEQ executive director will propose a revision to the DFW SIP that will (subject to commission approval and public participation) adequately address contingency measures. The proposed SIP will identify measures and applicable reductions that are needed in addition to those measures currently named in the DFW SIP to fulfill the unmet portion of the three percent for contingency. The proposed SIP revision will likely identify a portion of the on-road fleet turnover reductions from 2009 to 2010 as the measure the unmet portion of the three percent reductions needed. The on-road fleet turnover reductions from 2009 to 2010 provide up to 20.78 NOX tpd and up to 4.86 VOC tpd reductions available to fulfill that remaining contingency plan need. These reductions alone would fulfill the three percent emissions reduction requirement either based upon the 1999 emissions inventory used in the DFW Attainment Demonstration SIP, or otherwise based upon the 2002 emissions inventory used in the DFW RFP SIP. Appendix B: Emissions Inventory Development of the most recent DFW Attainment Demonstration SIP references 754.56 NOX tpd and 520.08 VOC tpd of 1999 base case emissions from all anthropogenic sources. If the contingency requirement is based upon the 1999 emissions inventory for the DFW area, the reductions from 2009 to 2010 fleet turnover alone would meet a 2.75 percent reduction for NOX and a 0.94 percent reduction for VOC. The sum of these NOX and VOC ratios provides a 3.69 percent reduction of the 1999 emissions inventory, which alone exceeds any portion of the three percent contingency requirement still needed. Tables 2-13 and 2-14 of the latest DFW Reasonable Further Progress (RFP) SIP reference 2002 base year emissions of 607.19 NOx tpd and 545.03 VOC tpd from all anthropogenic sources. If the contingency requirement is based upon the 2002 emissions inventory for the DFW area, the reductions from 2009 to 2010 on-road fleet turnover alone would meet a 3.42 percent reduction for NOX and a 0.89 percent reduction for VOC. The sum of these NOX and VOC ratios is a 4.31 percent reduction of the 2002 inventory, which alone also exceeds any portion of the three percent contingency requirement still needed. The DFW SIP revision is tentatively planned for proposal on August 20, 2008, and adoption on January 28, 2009. If adopted, the DFW SIP revision would be submitted to the EPA by March 1, 2009. Evaluating Other Episodes - 1999, 2000, 2002 As requested by the EPA, the following discussion regarding the TCEQ’s evaluation of additional modeling episodes is being provided to clarify and support the appropriateness of the selected episode for SIP planning. During the course of modeling the DFW core episode (August 13-22, 1999), base case ozone model performance was substantially improved as a result of
Page 8 of 20

improvements in meteorological modeling and upgrades in the emissions inventory. These improvements are further discussed in Chapter 2 of the DFW SIP. Figure 2-13 of the SIP shows the improvements in the DFW episode in both bias and gross error statistics as a result of these performance enhancing adjustments. Early in 2005, the TCEQ evaluated two additional episodes to determine if they could provide useful data to supplement the DFW 1999 attainment demonstration modeling. The two episodes were the Oklahoma Extension (August 23-September 1, 1999) and the TexAQS 2000 episode (August 22-September 6, 2000). Since both of these episodes had undergone only preliminary modeling, the TCEQ questioned whether it would be worthwhile to invest the additional time and effort to remodel these episodes and to bring the base case performance up to the level already achieved in the DFW core episode. The performance of the Oklahoma Extension and the TexAQS 2000 episode are briefly discussed in Chapter 2 of the DFW SIP, and a summary of those evaluations follows. The performance of the meteorological modeling for the Oklahoma Extension was not as good as the DFW base case meteorological modeling. The ozone modeling was based on a coarse 12k grid, and detailed daily emissions were available for Oklahoma, but not for Texas. Overall, the Oklahoma ozone modeling was biased low, although it strongly over-estimated the ozone at Frisco and Denton on August 31 and September 1. Figure 2: Oklahoma Extension - Bias and Gross Error in Dallas shows the unsatisfactory ozone model performance for daily bias and gross error statistics. Figure 3: Oklahoma Extension - Scatter Plot for DFW Eight-Hour Ozone Daily Maxima displays the first and second half of the period, indicating that the Oklahoma Extension does not perform differently from the first half which had already been modeled for Dallas. Attachment E: OK12kObsMaxVSModelMax.Harper.xls provides the calculations for Figure 3: Oklahoma Extension- Scatter Plot for DFW Eight-Hour Ozone Daily Maxima. Figure 4: Oklahoma Extension- Relative Reduction Factors in the Future Case shows the results of a future case analysis of the Oklahoma Extension, with RRFs calculated for monitors in the DFW area. Attachment F: 615DFWRRFAnalysis.xls provides the calculations for Figure 4: Oklahoma Extension – Relative Reduction Factors in the Future Case. The graph shows not only that the urban core monitors are less responsive than the downwind monitors, but that the model response in the two periods was very similar. Further, the response at Frisco was almost identical in both periods; therefore, the extended episode would not change the future case modeling results for the controlling monitor. Similarly, work on the TexAQS 2000 modeling had been optimized for the Houston area (rather than for the DFW area). Data from both emissions and meteorology was only available on a coarse 12k grid. Overall, performance in the DFW area was poor, and the ozone was biased consistently low on 14 of the 16 days during the episode. Figure 5: TexAQS 2000 – Bias and Gross Error in Dallas shows the erratic model performance for the TexAQS 2000 episode in the DFW area. Figure 6: TexAQS 2000 - Scatter Plot for DFW Eight-Hour Ozone Daily Maxima shows the widely scattered modeling results. A best fit regression line through the data indicates that for high ozone, the model produces only about 49.6 percent as much ozone as it should, which is only half of the daily maximum ozone measured in the DFW area. Since considerable time and effort would have been required to bring the level of performance for these episodes up to that of the DFW core episode, and because little benefit could be realized, further work on these supplemental episodes was terminated.
Page 9 of 20

TCEQ (Breitenbach)March 3, 2005
Oklahoma 12k Grid Modeling Evaluation in Dallas AreaBias- Gross Error (August 13 - September 1, 1999)
0
15
30
45
-45 -30 -15 0 15 30
Normalized Bias (%)
Gro
ss E
rror
(%
45
)
Aug 13-22 Aug 23-Sep1 EPA Standards '
23
13
Oklahoma 12k Performance in DallasBias and Gross Error Plot
Figure 2: Oklahoma Extension - Bias and Gross Error in Dallas
Oklahoma 12k Modeling Performance in Dallas/Ft. Worth Area Observed vs. Modeled, 8-Hour Ozone Daily Max Values at Monitors
First Half: y = 0.4759x + 39.137
R2 = 0.4995
Second Half: y = 0.4746x + 41.424
R2 = 0.2359
0
20
40
60
80
100
120
140
0 20 40 60 80 100 120 140
Observed O3 (ppb)
Mod
eled
03
(ppb
)
Oklahoma 12k Performance in Dallas8-Hour Ozone Peaks at all Monitors
Clint Harper Figure 3: Oklahoma Extension - Scatter Plot for DFW Eight-Hour Ozone Daily Maxima
Page 10 of 20

TCEQ/Breitenbach 901DFWModeling.NCT.ppt
DFW Monitor Specific 2010 Relative Reduction FactorsCore vs Episode Extension, Sorted by Core RRF
0.800
0.825
0.850
0.875
0.900
0.925
0.950
0.975
1.000
Dallas
Hinton
Dallas
North
Sunnyvale
Dallas
Execu
tive
Arlington
Midlothian
Rockwall
Frisco
Grapev
ine
Kaufm
an
Granbury
FTW NW
Anna
Cleburn
e
FTW Kell
er
Eagle
Mt Lak
e
Denton
Weatherf
ord
RR
F
Core Period Extension
Urban Core Monitors Downwind Monitors
Model is relatively stiff in
Urban Core
Model is more responsive in
downwind areas
Figure 4: Oklahoma Extension- Relative Reduction Factors in the Future Case
TCEQ (Breitenbach)March 3, 2005
DFW 1-Hour Model Performance during TexAQS 2000
0.0
15.0
30.0
45.0
-45.0 -30.0 -15.0 0.0 15.0 30.0 45.0
Bias (%)
Gro
ss E
rror
(%)
First Half (Aug 22-28) Second Half (Aug 29-Sep 6) EPA Standard '
Aug 22
Aug 29
TexAQS 12k Performance in DallasBias and Gross Error Plot
Figure 5: TexAQS 2000 – Bias and Gross Error in Dallas
Page 11 of 20

TCEQ (Breitenbach)March 3, 2005
TexAQS-2000 12k Performance in DFW Area8-Hour Daily Maxima - All Sites
y = 0.4963x + 29.517R2 = 0.2265
0
20
40
60
80
100
120
0 20 40 60 80 100 12
Observed 8-Hour Ozone (ppb)
Mod
eled
8-H
our O
zone
(ppb
)
0
TexAQS 12k Performance in Dallas8-Hour Maxima at All Sites
Figure 6: TexAQS 2000 - Scatter Plot for DFW Eight-Hour Ozone Daily Maxima
Updating Trends with 2007 Monitored Data for the DFW Area The EPA has requested preliminary 2007 monitoring data and an update on the QA/QC data verification process. The eight-hour and one-hour ozone design values for the DFW area are provided in Table 5: Eight-Hour and One-Hour Ozone Design Values for the DFW Area. The eight-hour ozone design value for 2007 is 95 ppb, and the one-hour ozone design value for 2007 is 124 ppb. The data shows that in 2007, the eight-hour design value decreased 1 ppb from the previous year. This information is available on both the TCEQ and EPA websites and is also provided in this enclosure to the EPA as a courtesy. The TCEQ expects to have the QA/QC data verification process completed and resubmitted to the EPA’s Air Quality system by July 2008.
Page 12 of 20

Table 5: Eight-Hour and One-Hour Ozone Design Values for the DFW Area
Year Eight-Hour Ozone Design Value
One-Hour Ozone Design Value
1991 105 140 1992 99 147 1993 95 141 1994 96 140 1995 106 140 1996 104 139 1997 104 139 1998 98 138 1999 101 138 2000 102 131 2001 101 137 2002 99 135 2003 100 135 2004 98 129 2005 95 125 2006 96 124
2007* 95 124 *2007 design values are current as of January 8, 2008, and are subject to change.
Figure 7: Eight-Hour and One-Hour Ozone Design Values in the DFW Area, 1991 to 2007 provides the same data in graphical form, showing both the eight-hour and the one-hour ozone design values decreasing since 1991. The slope of the one-hour regression line shows a decrease of 0.17 ppb each year, and the eight-hour slope shows a reduction of 0.32 ppb per year. Over the past 17 years, the one-hour ozone design value has decreased by 11.4 percent, and the area met the previous one-hour ozone standard in both 2006 and 2007. The eight-hour ozone design values have not decreased as quickly as the one-hour ozone design values; however, the eight-hour ozone design value has decreased 9.5 percent over the same period.
Page 13 of 20

One-Hour and Eight-Hour Ozone Design Values for the DFW Area(1991-2007)
1-Hr DV = -1.17*Year + 146R2 = 0.81
8-Hr DV = -0.32*Year + 103R2 = 0.20
50
70
90
110
130
150
170
1991 1992 1993 1994 1995 1996 1997 1998 1999 2000 2001 2002 2003 2004 2005 2006 2007*
Ozo
ne D
esig
n Va
lue
(ppb
)
8-Hour DV 8-Hour NAAQS 1-Hour DV 1-Hour NAAQS 1-Hour DV Trend 8-Hour DV Trend
125 ppb
85 ppb
*2007 design values are current as of January 8, 2008 and are subject to change. Figure 7: Eight-Hour and One-Hour Ozone Design Values
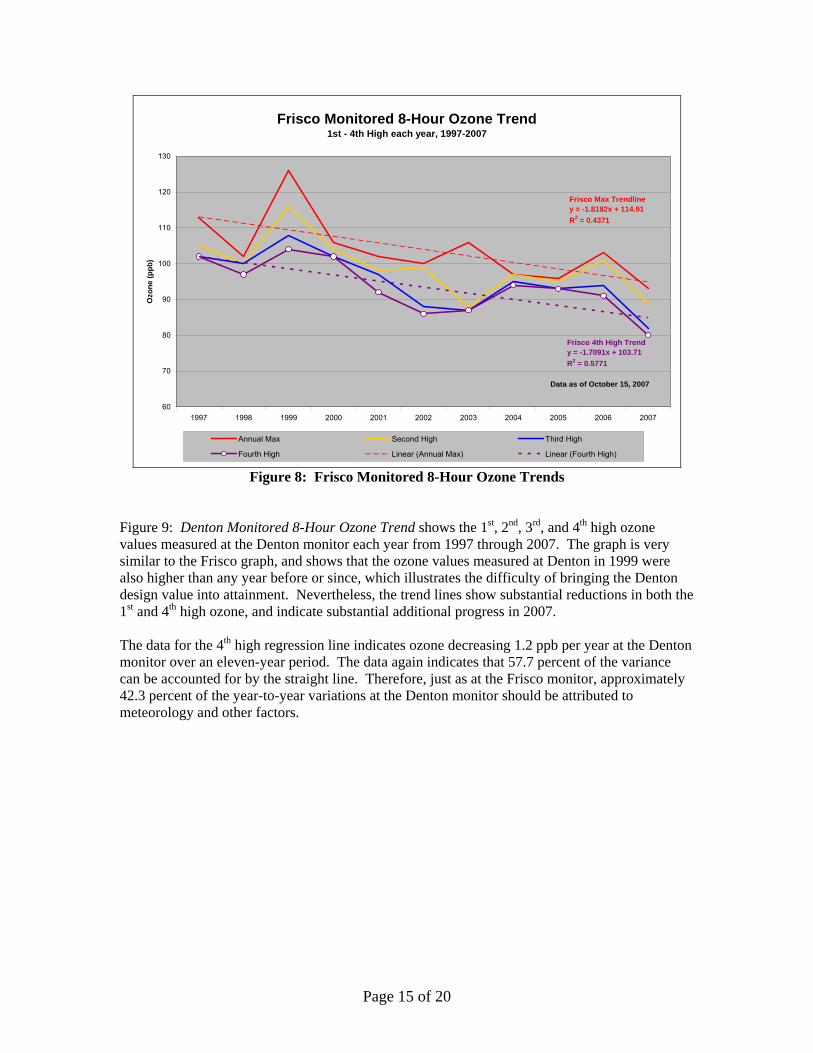
in the DFW Area, 1991 to 2007 Figure 8: Frisco Monitored 8-Hour Ozone Trends shows the 1st, 2nd, 3rd, and 4th high ozone values measured at the Frisco monitor each year, from 1997 through 2007. The graph is similar to one contained in the DFW SIP, but also includes 2007 data. The data shows that the ozone values measured in 1999 were higher than any year before or since, which illustrates the difficulty of bringing the design value for that year into attainment. Nevertheless, the trend lines show substantial reductions in both the 1st and 4th high ozone, and indicate substantial additional progress in 2007. The data for the 4th high regression line indicates that ozone has been decreasing 1.7 ppb per year over the eleven-year period. The data also indicates that 57.7 percent of the variance can be accounted for by the straight line. Therefore, approximately 42.3 percent of the variance should be attributed to year-to-year variations in meteorology and other factors.
Page 14 of 20
Frisco Monitored 8-Hour Ozone Trend1st - 4th High each year, 1997-2007
Frisco Max Trendliney = -1.8182x + 114.91R2 = 0.4371
Frisco 4th High Trendy = -1.7091x + 103.71R2 = 0.5771
60
70
80
90
100
110
120
130
1997 1998 1999 2000 2001 2002 2003 2004 2005 2006 2007
Ozo
ne (p
pb)
Annual Max Second High Third High
Linear (Fourth High)
Data as of October 15, 2007
Fourth High Linear (Annual Max)
Figure 8: Frisco Monitored 8-Hour Ozone Trends Figure 9: Denton Monitored 8-Hour Ozone Trend shows the 1st, 2nd, 3rd, and 4th high ozone values measured at the Denton monitor each year from 1997 through 2007. The graph is very similar to the Frisco graph, and shows that the ozone values measured at Denton in 1999 were also higher than any year before or since, which illustrates the difficulty of bringing the Denton design value into attainment. Nevertheless, the trend lines show substantial reductions in both the 1st and 4th high ozone, and indicate substantial additional progress in 2007. The data for the 4th high regression line indicates ozone decreasing 1.2 ppb per year at the Denton monitor over an eleven-year period. The data again indicates that 57.7 percent of the variance can be accounted for by the straight line. Therefore, just as at the Frisco monitor, approximately 42.3 percent of the year-to-year variations at the Denton monitor should be attributed to meteorology and other factors.
Page 15 of 20

Denton Monitored 8-Hour Ozone Trend1st - 4th High each year, 1997-2007
Denton Max Trendliney = -1.2091x + 116.98R2 = 0.3377
Denton 4th High Trendy = -1.2182x + 105.4R2 = 0.577
60
70
80
90
100
110
120
130
1997 1998 1999 2000 2001 2002 2003 2004 2005 2006 2007
Ozo
ne (p
pb)
Annual Max Second High Third High
Fourth High Linear (Annual Max) Linear (Fourth High)
Data As Of October 15, 2007
Figure 9: Denton Monitored 8-Hour Ozone Trend
Figure 10: Eight-Hour and One-Hour Ozone Exceedance Days in the DFW Area, 1990 to 2007 shows the number of exceedance days measured at the monitors in the DFW area. The figures show there were only twelve, eight-hour ozone exceedance days and two, one-hour ozone exceedance days in the DFW area in 2007. Although there are annual variations in both the one-hour and eight-hour counts, there is an obvious downward trend from 1998 to the present, and that trend is supported and strengthened with the 2007 data. Since the number of exceedances is influenced by the number of monitors in the area, EPA does not ordinarily use the exceedance count to evaluate trends. Nevertheless, since the number of monitors in the DFW area has increased dramatically during the period (as previously discussed in section 3.3 of the SIP) the overall downward trend is remarkable.
Page 16 of 20

One-Hour and Eight-Hour Ozone Exceedance Days in the DFW Area (1990 - 2007)
32
26
22
18
44
49
28
36
42
3836
30
37
31
25
44
31
12
7 74 4
9
15
4
12
5
11
52
7
3 4 31 2
0
10
20
30
40
50
60
1990 1991 1992 1993 1994 1995 1996 1997 1998 1999 2000 2001 2002 2003 2004 2005 2006 2007
Num
ber o
f Exc
eeda
nce
Day
s
Eight-Hour Exceedance Days One-Hour Exceedance Days
Figure 10: Eight-Hour and One-Hour Ozone Exceedance Days
In the DFW Area, 1990 to 2007
Figure 11: Percentage of Total Eight-Hour Ozone Exceedance Days Above and Below 95 ppb in the DFW Area 1990 to 2007 provides further information regarding the eight-hour ozone exceedance days. The figure shows that the relative frequency of high ozone events (percent of exceedances greater than or equal to 95 ppb) has been decreasing since 1999 and that the 2007 data further strengthens that trend.
Percent of Total Eight-Hour Ozone Exceedance Days Above and Below 95 ppb in the DFW Area (1990-2007)
0%
10%
20%
30%
40%
50%
60%
70%
80%
90%
100%
1990 1991 1992 1993 1994 1995 1996 1997 1998 1999 2000 2001 2002 2003 2004 2005 2006 2007
Perc
ent o
f Tot
al E
xcee
danc
e D
ays
Percent < 95 ppb Percent ≥ 95 ppb Figure 11: Percentage of Total Eight-Hour Ozone Exceedance Days Above and
Below 95 ppb in the DFW Area, 1990 to 2007
Page 17 of 20

2007-2009 Emission Changes The EPA has requested supplemental information regarding the changes in DFW emissions expected between 2007 and 2009, in order to compare these with emissions reductions projected in other states. Since the DFW SIP was finalized and submitted in June 2007 and the new controls proposed in the SIP will become effective after 2007, the NOX emissions documented in the SIP modeling already reflect the area’s emissions reductions that will occur during the 2007-2009 period. The 2009 future baseline modeling, as well as the Combo 10 modeling, already included the mandated state and federal controls. The Combo 10 modeling adds the committed state and local efforts that are expected to come into effect during 2007-2009. Therefore, the difference between the DFW nine-county NOX emissions in the 2009 baseline and the Combo 10 run will show the amount of new local reductions implemented in the DFW area between 2007 and 2009 as a direct result of this SIP and the incorporated rules. As previously discussed in this enclosure, new growth and emissions inventory data became available after the DFW SIP was published. This new data leads to emission adjustments in both the 2009 baseline and in Combo 10. Table 6: DFW Nine-County NOX Emissions and Adjustments quantifies the reductions expected as result of the controls included in the SIP, as well as adjustments based upon more recent emissions data.
Table 6: DFW Nine-County NOX Emissions and Adjustments Source Area Non-Road Point On-Road Totals2009.a2 Future Baseline 44 107 59 193 403Gas Compressors 47 472009 Baseline Totals 91 107 59 193 450
2009 Combo 10 41 105 40 186.81 372.81DERC Adjustment -17.2 -17.2Backup Generators -0.9 -0.9Gas Compressors 3 3New TERP (estimate) -14.2 -14.22009 Combo 10 Totals 44 89.9 22.8 186.81 343.51
Reduction in Tons/Day -47 -17.1 -36.2 -6.19 -106.49Percent Reduction -51.6% -16.0% -61.4% -3.2% -23.7% The 2009.a2 Future Baseline data in the table shows the NOX emissions for the DFW nine-county area as listed in the DFW SIP. The next line of the table adds 47 tpd for the increased NOX emissions resulting from the increases in the number of gas compressor engines in the Barnett Shale gas field. The last line in the first part of the table shows the total NOX emissions in the 2009 baseline, adjusted for the new emissions data.
The next part of the table shows the DFW nine-county NOX emissions, as modeled in Combo 10 of the DFW Ozone SIP, with adjustments. The federal motor vehicle emissions reductions are already included in both the 2009 baseline and the Combo 10 package, so they are not listed again. Similarly, the reduction in airport emissions discussed previously in this document were determined as a result of a 2005 study, and so are also not included. Since the airport reductions occurred prior to 2007, the reductions would be made in both the 2009 baseline and in the 2009 Combo 10 sections of the table, and would cancel each other.
Page 18 of 20

The Combo 10 NOX emissions are corrected to reflect the 17.2 tpd reduction in DERC NOX emissions as discussed previously in this enclosure. The back-up generator emissions inventory is reduced by 0.9 ppb as discussed previously. The gas compressor engine emissions in the first part of the table are adjusted to reflect the application of the new SIP rule to those engines. However, since there are more engines than before, there is a net gain of approximately three tpd, even after the application of controls. The 14.2 tpd TERP adjustment estimates a NOX reduction due to new funds appropriated by the Texas Legislature after the DFW SIP was published. The Combo 10 Totals line at the bottom of the section shows the NOX emissions in the 2009 control case, adjusted for the new emissions data. The bottom two lines of Table 6 show results of this DFW NOX analysis, the net NOX reductions in tpd, and the percent change between the two modeling scenarios. The data shows that as a result of controls mandated in the DFW SIP document, DFW local NOX emissions are expected to be reduced by approximately 106 tpd during the 2007-2009 period, which is a 23.7 percent reduction in local NOX when compared to the 2009 adjusted baseline. This analysis includes only the local NOX reductions occurring inside the DFW nine-county nonattainment area as a direct result of the DFW SIP. It does not include the substantial (and continuing) state reductions that have occurred since 2007, resulting from the TCEQ rules that were implemented prior to SIP publication in 2007 or the 50 percent NOX reductions mandated by Senate Bill 7 passed by the 76th Texas Legislature. The SB7 rule was implemented between 1999 and 2005, so although the ozone reductions resulting from SB7 show in the DFW 2009 modeling results, they should be part of the 2007-2009 reductions that the EPA will use to compare the TCEQ efforts to other states. Nevertheless, it is important to point out that the TCEQ SB7 reductions resulted in early compliance with Phase 1 of the Clean Air Interstate Rule (CAIR) while other states are only now implementing the required CAIR Phase 1 controls. Alternative Design Value Approach As requested, TCEQ is providing the following alternative design value calculation methodology for consideration by EPA. As discussed on pages 2-45 and 3-4 of the SIP, unusually high ozone levels were measured in the DFW area in 1999. In its April 2007 modeling guidance, the EPA recommends that calculation of eight-hour future ozone design values be done by multiplying the baseline year measured ozone (baseline) by a Relative Response Factor (RRF) derived from the ratio between base and future case model results. This procedure is more reliable than the previous one-hour ozone calculation procedure because it anchors the FDV calculation in the measured data. Further, by focusing on model response, this new procedure avoids the problems that can occur when model results are biased higher or lower than the ozone measurements. However, since measured ozone varies greatly from year to year, the baseline year must be calculated in an appropriate manner. The issue of meteorological bias was previously discussed on page 2-45 of the DFW SIP, and this analysis is presented to supplement that brief discussion. Current EPA modeling guidance (2007) recommends calculating the baseline ozone by averaging three, three-year design values. The average of the three design values is effectively a five-year center weighted average, which emphasizes the center year in the calculation. If the central year is high, as was 1999, the starting point for future design value calculations is also high. This procedure inadvertently penalizes states that select a base year with higher than average measured ozone.
Page 19 of 20

The EPA is evaluating a procedure for adjusting the baseline for meteorological variations, but that report is not yet available. Since the EPA report and procedures are not available, the TCEQ suggests using a five-year linear average for baseline ozone as an alternate method allowed in the recent guidance. The advantage of the five-year linear average method is that it does not favor selecting one year over another and it effectively smoothes the attainment demonstration calculations to account for annual variations in meteorology. Table 3: DFW 1999 Baseline Design Value Calculations provides results from each of the two calculation procedures for DFW monitors, along with resulting differences in both ppb measurements and percentage.
Table 3: DFW 1999 Baseline Design Value Calculations Site Name CAMS EPA Linear Difference Difference
DV DV ppb %Frisco C31 100.3 99.4 -0.9 -0.93%Dallas Hinton C60 92.0 91.4 -0.6 -0.65%Dallas North C63 93.0 93.7 0.7 0.72%Dallas Exec (Redbird) C402 88.0 88.8 0.8 0.91%Denton C56 101.5 101.0 -0.5 -0.49%Midlothian C94 92.5 90.8 -1.8 -1.89%Arlington Reg Office C57 90.5 90.5 0.0 0.00%FtW NW (Meacham) C13 98.3 98.4 0.1 0.07%FtW Keller C17 96.3 95.0 -1.3 -1.38%
For example, the five-year linear average method decreases the Future Design Value (FDV) at the Frisco monitor by 0.9 ppb (0.93 percent). At the Denton monitor (the other controlling monitor), it decreases the value by 0.5 ppb (0.49 percent). When these adjustments are applied to the FDV at all sites, the model calculation is effectively smoothed to reflect the average meteorology in the area. Since the modeled values are proportionately reduced by the RRF methodology, a logical next step would reduce the FDV by these percentages. Applying these percentages to the adjusted FDV for Combo 10, and then truncating, gives the results in Table 4: Linear Five-Year Meteorological Adjustment to Linear Future Design Values.
Table 4: Linear Five-Year Meteorological Adjustment to Linear Future Design Values
Adjusted Linear Adjusted Truncated FDV Difference FDV FDV
Monitor Name ppb % ppb ppbFrisco C31 87.940 87
87.823 87
-0.93% 87.122Hinton C60 84.954 -0.65% 84.400 84Dallas N C63 84.142 0.72% 84.745 84Dallas Exec C402 78.120 0.91% 78.830 78Denton C56 -0.49% 87.391Midlothian C94 83.179 -1.89% 81.605 81Arlington C57 79.933 0.00% 79.933 79FtW NW C13 84.623 0.07% 84.680 84FtW Keller C17 83.969 -1.38% 82.806 82Average 83.854 -0.41% 83.513 83
Page 20 of 20

Attachment A
2005 Emissions Inventory Love Field Airport
Aviation Department
Environmental Affairs Group
November 3, 2006

2005 Emission Inventory Love Field Airport
Aviation Department
Environmental Affairs Group
November 3, 2006 Eastern Research Group

i
TABLE OF CONTENTS
Page
1.0 SUMMARY ........................................................................................................ 1-1
2.0 EMISSION SOURCE IDENTIFICATION................................................................... 2-1 2.1 Mobile Sources .................................................................................... 2-1 2.2 Stationary Sources................................................................................ 2-4
3.0 EMISSION ESTIMATION METHODOLOGY ............................................................ 3-1 3.1 Emissions and Dispension Modeling System (EDMS).......................... 3-1 3.2 Generic Aircraft Approach ................................................................... 3-4 3.3 Texas Ground Support Methodology.................................................... 3-5
4.0 COMPILATION OF ACTIVITY DATA .................................................................... 4-1 4.1 Mobile Sources .................................................................................... 4-1 4.2 Stationary Sources................................................................................ 4-4
5.0 EMISSION ESTIMATIONS.................................................................................... 5-1 5.1 Development of Input Files .................................................................. 5-1 5.2 Running EDMS.................................................................................... 5-6 5.3 Estimating Ground Support Equipment Emissions ..............................5-13
6.0 FUTURE YEAR PROJECTIONS ............................................................................. 6-1
7.0 RESULTS .......................................................................................................... 7-1
8.0 QUALITY CONTROL CHECKS ............................................................................. 8-1
9.0 REFERENCES..................................................................................................... 9-1 Appendix A - Baseline Ground Support Equipment Profile by Aircraft Model Appendix B - Actual 2005 Ground Support Equipment Profile by Aircraft Model

ii
LIST OF TABLES
Page Table 1-1. 2005 Emission Summary (tons per year) ................................................................1-2
Table 1-2. 2010 Emission Summary (tons per year) ................................................................1-2
Table 1-3. Estimated Emission Reductions...............................................................................1-3
Table 3-1. Emission Factors for Aircraft Types (pounds per LTO)..........................................3-5
Table 4-1. 2005 Aircraft-specific LTO Data............................................................................4-1
Table 4-2. Aircraft-type LTO Data..........................................................................................4-2
Table 4-3. Airport Vehicle Traffic...........................................................................................4-3
Table 4-4. Table Vehicle Parking Activity ..............................................................................4-4
Table 4-5. Summary of Natural Gas Boiler Annual Fuel Consumption....................................4-4
Table 4-6. Census of Fuel Storage Tanks, Content, and Annual Throughput ............................4-5
Table 4-7 Census of Degreasing Equipment and Annual Solvent Usage..................................4-6
Table 5-1. Fuel Tank Throughput..........................................................................................5-13
Table 5-2. Baseline Ground Support Equipment Fleet Emissions ..........................................5-13
Table 5-3. Current Ground Support Equipment Fleet Emissions............................................5-13
Table 5-4. Emission Benefits ................................................................................................5-13
Table 6-1. 2005 / Estimated 2010 LTO Data by Aircraft Type ................................................6-1
Table 6-2. 2005/2010 Adjustment Factors for Fuel Storage Tanks...........................................6-2
Table 7-1. 2005 Aircraft Emission Estimates (tons per year) ...................................................7-1
Table 7-2. 2005 Other Mobile Emission Sources (tons per year) .............................................7-1
Table 7-3. 2005 Stationary Source Emission Estimates (tons per year)....................................7-1
Table 7-4. 2010 Aircraft Emission Estimates (tons per year) ...................................................7-2
Table 7-5. 2010 Other Emission Sources (tons per year) .........................................................7-2
Table 7-6. 2010 Stationary Source Emission Estimates (tons per year)....................................7-2
Table 7-7. Emission Reductions (tons per year).......................................................................7-3

LIST OF TABLES (Continued)
Page
iii
Table 7-8. Emission Reductions (tons per day)........................................................................7-3
Table 8-1. Comparison of Aircraft Emission Estimates (tons per year)....................................8-1
Table 8-2. Comparison of Other Mobile Emission Estimates (tons per year) ...........................8-2
Table 8-3. Comparison of Stationary Emission Estimates (tons per year) ................................8-2

iv
LIST OF FIGURES
Page Figure 2-1. Landing and Take Off Cycle .................................................................................2-2
Figure 2-2. Auxiliary Power Unit ............................................................................................2-3
Figure 2-3. Example of a Cutaway Vehicle .............................................................................2-4
Figure 3-1. Overall Approach to Estimate 2005 and 2010 Emissions at Love Field ..................3-2
Figure 4-1. Map of Airport and Associated Roads...................................................................4-3
Figure 5-1. Start Up ................................................................................................................5-1
Figure 5-2. Setup ....................................................................................................................5-2
Figure 5-3. File Menu ..............................................................................................................5-2
Figure 5-4. Emission Menu .....................................................................................................5-3
Figure 5-5. Aircraft Operations & Assignment .........................................................................5-3
Figure 5-6. Utilities Menu, Exporting......................................................................................5-4
Figure 5-7. Export Wizard Step 1............................................................................................5-4
Figure 5-8. Export Wizard Step 2............................................................................................5-5
Figure 5-9. Export Complete....................................................................................................5-5
Figure 5-10. CSV File Open.....................................................................................................5-6
Figure 5-11. CSV Prompt........................................................................................................5-6
Figure 5-12. Utilities Menu, Importing....................................................................................5-7
Figure 5-13. Import Wizard Step 1..........................................................................................5-7
Figure 5-14. Import Wizard Step 2..........................................................................................5-8
Figure 5-15. Import Wizard Step 3...........................................................................................5-9
Figure 5-16. Emissions Menu...................................................................................................5-9
Figure 5-17. Parking Facilities ..............................................................................................5-10
Figure 5-18. Roadways ..........................................................................................................5-10
Figure 5-19. Stationary Sources .............................................................................................5-11

LIST OF FIGURES (Continued)
v
Figure 5-20. Training Fires ...................................................................................................5-11
Figure 5-21. View Emissions Inventory ................................................................................5-12
Figure 5-22. Emissions Inventory Summary..........................................................................5-12

1-1
This report estimates 2005 emissions from mobile and stationary sources associated with the Dallas Love Field airport. Opened originally in 1917 as a military training base, the airport started commercial passenger service in 1927. The airport is located on 1,300 acres in Dallas County, approximately seven miles north of Dallas’ central business district. Dallas County is listed by the U.S. Environmental Protection Agency (EPA) as a subpart 2 moderate nonattainment area for ozone. Dallas County is considered in compliance with all other ambient criteria pollutants. Ozone is not emitted from this anthropogenic source, but is formed through photochemical reactions between organic compounds and nitrogen oxides (NOx) in the local atmosphere. Ozone attainment is an air quality objective of the City of Dallas, thus, emission sources of volatile organic chemicals (VOC) and NOx are being studied to determine how best to reduce the emission of these pollutants and lower ozone concentrations in the county. Mobile sources, such as aircraft, ground support equipment and vehicles, and stationary sources, such as boilers, heating units, and fuel storage tanks are located at airports and emit VOC and NOx. This inventory also quantified airport-related emissions of other criteria pollutants such as carbon monoxide (CO), sulfur dioxide (SO2), particulate matter (PM) and fine particulate matter (PM2.5). 1.0 SUMMARY
To estimate emissions, input files were compiled and applied to the Emissions and Dispersion Modeling System (EDMS) (8). EDMS is an emission estimating tool developed by the U.S. Department of Transportation’s Federal Aviation Administration (FAA). This computer model integrates all airport emission sources, mobile and stationary source emissions, into a single model. The mobile source emissions include aircraft, ground support equipment, auxiliary power units, road traffic (including shuttle bus services), and vehicle emissions from parking areas. Stationary sources include power and heat generation, surface coating, degreasing, incineration, and fuel storage tanks. EDMS requires aircraft-specific activity data — specifically, the make and model number of the aircraft using Love Field. While such data are readily available for medium to large commercial air carriers, it is not typically available for air taxis, general aviation, and military aircraft. To estimate emissions from these sources, the methodology documented in the EPA’s National Emission Inventory (NEI) was used. The Texas Commission Environmental Quality (TCEQ) recommended the use of an alternative approach to estimate emissions from ground support equipment, which is based on the EPA’s NONROAD emission estimating model. For this emission inventory, the TCEQ approach was used. Estimates for ground support equipment generated by EDMS were used as a quality check on the TCEQ approach. The activity data needed to estimate emissions were provided by Love Field’s Environmental Affairs group and compiled into model–ready input files. The compiled input files were reviewed by senior staff and any identified data gaps or duplicate data were discussed with airport staff to determine an appropriate method to address these anomalies.

1-2
Once the input data were quality checked, the emissions were calculated for 2005. The 2005 emission estimates were adjusted to reflect projected activity in 2010 based on projection data obtained from Love Field’s Impact Analysis Update (May 2006). The final results are summarized in Table 1-1 for 2005 and Table 1-2 for 2010. A more detailed breakout of emission source categories is presented in a series of tables in Section 7 of this report.
Table 1-1. 2005 Emission Summary (tons per year)
Aircraft Other Mobile
Sources Stationary
Sources Total VOC 42.41 5.25 2.51 50.17 NOx 254.69 8.39 3.17 266.25 CO 875.58 71.56 1.40 948.54 SO2 21.85 0.11 0.14 22.10 PM10 14.60 0.29 0.23 15.12 PM2.5 14.26 0.24 0.23 14.73
Table 1-2. 2010 Emission Summary (tons per year)
Aircraft Other Mobile
Sources Stationary
Sources Total VOC 51.46 6.44 3.02 60.92 NOx 301.17 10.27 3.17 314.61 CO 1,073.76 87.74 1.40 1,162.9 SO2 25.84 0.12 0.14 26.10 PM10 18.03 0.35 0.23 18.61 PM2.5 17.60 0.30 0.23 18.13
This emission inventory was also set up to quantify the impact of two control options implemented at Love Field. The first control option considers the shift from combustion powered ground support equipment to vehicles and engines powered by electricity. The second option considers the use of gates that are equipped with electricity and preconditioned air. These gates significantly reduce 90 percent in the operating hours of the aircraft’s auxiliary power units. These units provide the aircraft with electricity and air conditioning. The estimated emission reductions for both options are presented in Table 1-3. Section 2 of this report documents the emission sources considered in this inventory. Section 3 describes the methodologies and equationsused to estimate emissions and Section 4 documents the activity data compiled by airport staff that were applied to the methodologies discussed in Section 3. Implementation of the emission estimating methodologies is discussed in Section 5. Section 5 is designed to provide sufficient detail for staff at Love Field to independently reproduce the emission estimates developed in this inventory. The 2005 emission estimates are adjusted to reflect anticipated activity levels in 2010, which is discussed in detail in Section 6. Results from implementing these methodologies and adjustments are summarized in Section 7.

1-3
Quality assurance procedures implemented for this project are discussed in section 8, including comparison of the emission estimates to earlier studies for Love Field. Section 9 includes all references.
Table 1-3. Estimated Emission Reductions
Ground Support Equipment Auxiliary Power Units Total
Pollutant Reduction (tons/year)
Reduction (tons/day)
Reduction (tons/year)
Reduction (tons/day)
Reduction (tons/year)
Reduction (tons/day)
VOC 25.99 0.0713 0.69 0.0019 26.68 0.073 NOx 76.16 0.2087 3.41 0.0094 79.57 0.218 CO 671.90 1.8409 10.67 0.0292 682.57 1.870 SO2 0.21 0.0006 0.68 0.0019 0.89 0.0025 PM10 2.13 0.0058 NA NA 2.13 0.0058 PM2.5 2.07 0.0057 NA NA 2.07 0.0057

2-1
2.0 EMISSION SOURCE IDENTIFICATION
EDMS and EPA guidance and other airport inventories were considered when developing a comprehensive list of potential emission sources at Love Field. This section discusses source categories considered for this study. Due to the unique role that Love Field plays in the region, some anticipated emission sources, such as aircraft surface coating and stationary incinerators, are not operated at the airport and are not included. A matix for each potential source category was developed that included the activity data needed to estimate emissions. This matrix was discussed with airport staff and inappropriate source categories were removed. 2.1 Mobile Sources
Aircraft. The aircraft source category includes all aircraft types used for public, private, and military purposes. Aircraft tend to emit significant amounts of NOx, VOC, and CO. Typically, this includes four types of aircraft:
• Commercial air carriers • Air taxis • General aviation • Military
Commercial aircraft transport passengers, freight, or both. Air taxis are commercial aircraft and tend to be larger aircraft powered by jet engines. The airport provides services to several commercial airlines including the following:
• Southwest Airlines • Continental Airlines • American Airlines/American Eagle • Express Jet
Air taxis carry passengers, freight, or both. Air taxis are usually smaller aircraft that operate on a limited basis compared to commercial carriers. The national air taxi fleet includes both jet and propeller-driven aircraft. General aviation includes most other aircraft used for recreational flying and personal transportation. Aircraft that support business travel, usually on an unscheduled basis, are included in the category of general aviation. Most of the general aviation fleet is made up of propeller-driven aircraft, though smaller business jets can also be found in this category. The piston driven aircraft tend to have higher VOC, PM, and CO emissions and lower NOx emissions than larger jet-powered aircraft. Military aircraft cover a wide range of aircraft types such as training aircraft, fighter jets, helicopters, and jet- and piston-driven cargo planes of varying sizes. Typically, local aircraft emissions are associated with an aircraft’s landing and takeoff (LTO) cycle. The cycle begins when the aircraft approaches the airport on its descent from cruising altitude, then lands and taxis to the gate, where it idles during passenger deplaning. The cycle

2-2
continues as the aircraft idles during passenger boarding, taxis back out onto the runway, takes off, and ascends (climbout) to cruising altitude. Thus, the six specific operating modes in an LTO noted in Figure 2-1 are the following:
• Approach • Taxi/idle-in • Taxi/idle-out • Idling • Takeoff • Climbout
The LTO cycle provides a basis for calculating aircraft emissions. During each mode of operation, an aircraft engine operates at a specific power setting and fuel consumption rate for a given aircraft make and model. Emissions for one complete cycle are calculated using emission factors for each operating mode for each specific aircraft engine combined with the typical period of time the aircraft is in the operating mode.
Figure 2-1. Landing and Take Off Cycle
In addition to the engines used to propel the plane, many medium to larger sized aircraft also operate separate auxiliary power units, which are typically located near the rear of the aircraft (Figure 2-2). These small gas turbines generate electricity and condition air for the cabin, and provide compressed air to the main propulsion engines during the startup period.

2-3
Figure 2-2. Auxiliary Power Unit
Ground Support Equipment. Ground support equipment comprises vehicles or engines needed to support the aircraft while at the terminal or initiating takeoff. In most cases, these vehicles are not licensed to operate on public roads and are confined to operating on the airport’s taxi apron. Aircraft require a mix of ground support equipment that includes the following:
• External air conditioners • Compressors to help with engine starts • Aircraft tractors or tugs • Baggage tractors • Belt loaders • Cabin service trucks • Catering trucks • Lavatory trucks • Water supply trucks • External generators • Hydrant fueling trucks
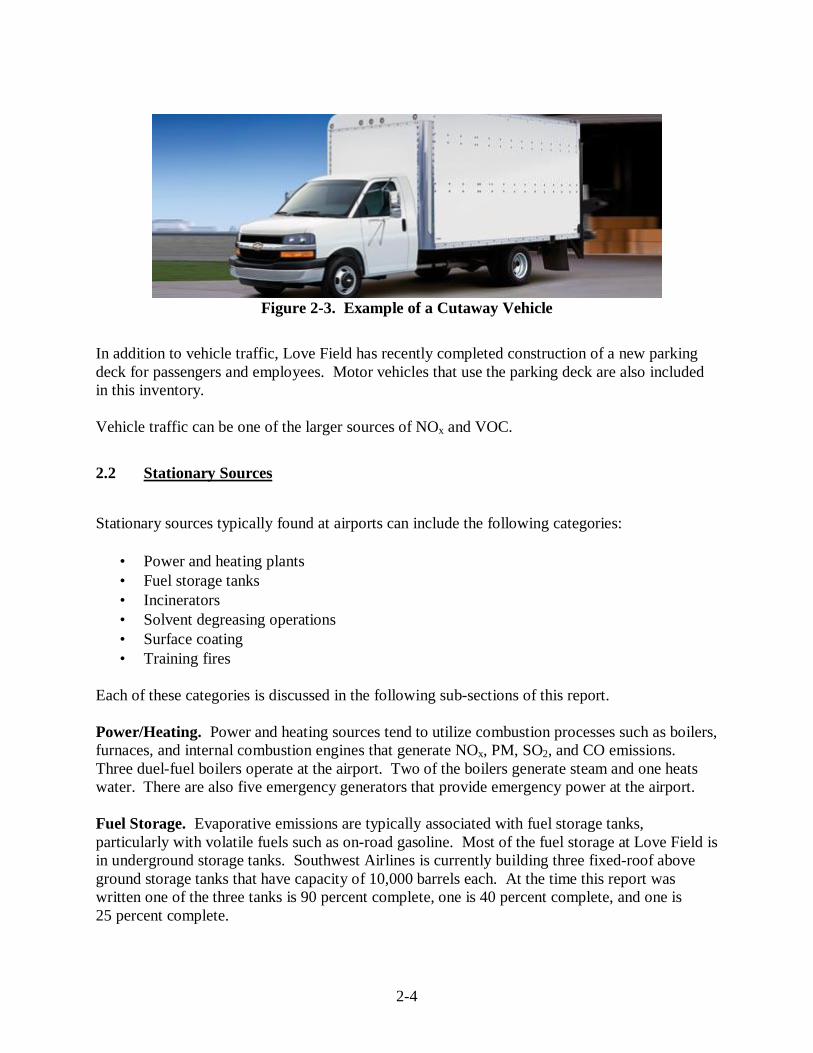
Typically, ground support equipment is associated with specific commercial aircraft by make and models. The type and number of ground support equipment vary between different aircraft models, based on the number of passengers for which the aircraft is designed and the types of services provided onboard. On-road Traffic / Parking Activities. Airport traffic includes a variety of vehicles, including light duty passenger cars and dedicated vehicles that support facility operations such as taxis, shuttle buses, and small delivery vehicles, often referred to as cutaways (See Figure 2-3). Hertz car rentals is currently the only company operating shuttle bus service at the airport.
2-4
Figure 2-3. Example of a Cutaway Vehicle
In addition to vehicle traffic, Love Field has recently completed construction of a new parking deck for passengers and employees. Motor vehicles that use the parking deck are also included in this inventory. Vehicle traffic can be one of the larger sources of NOx and VOC.
2.2 Stationary Sources
Stationary sources typically found at airports can include the following categories:
• Power and heating plants • Fuel storage tanks • Incinerators • Solvent degreasing operations • Surface coating • Training fires
Each of these categories is discussed in the following sub-sections of this report. Power/Heating. Power and heating sources tend to utilize combustion processes such as boilers, furnaces, and internal combustion engines that generate NOx, PM, SO2, and CO emissions. Three duel-fuel boilers operate at the airport. Two of the boilers generate steam and one heats water. There are also five emergency generators that provide emergency power at the airport. Fuel Storage. Evaporative emissions are typically associated with fuel storage tanks, particularly with volatile fuels such as on-road gasoline. Most of the fuel storage at Love Field is in underground storage tanks. Southwest Airlines is currently building three fixed-roof above ground storage tanks that have capacity of 10,000 barrels each. At the time this report was written one of the three tanks is 90 percent complete, one is 40 percent complete, and one is 25 percent complete.

2-5
Surface Coating. If extensive aircraft maintenance activities are implemented at an airport, surface coating operations can be a source of VOC and PM 2.5. Love Field does not have any significant surface coating operations and there currently no plans to provide such services. Degreasing. Degreasing operations are associated with aircraft maintenance activities. For larger airports that provide comprehensive aircraft or engine maintenance services, parts degreasing using highly volatile solvents can be a significant emission source of VOCs. Love Field has a relatively small amount of degreasing operations using new lower VOC solvents. Incineration. Incinerators are sometimes used at airports to dispose of solid waste, generating NOx and PM emissions. Currently there are no incinerators and there are no plans to install an incinerator at Love Field; therefore, this source category is not included in this emission inventory. Training Fires. To maintain certification, fire fighters associated with airports occasionally have training fires at the site. These fires tend to be confined and of short duration. Most of the emissions are associated with the accelerant used to initiate and maintain the fire. Love Field uses a relatively small amount of diesel fuel annually for training fires.

3-1
3.0 EMISSION ESTIMATION METHODOLOGY
To develop the most accurate aircraft emission inventory possible, two different approaches were required. If data were available, an aircraft-specific approach was applied using the FAA’s EDMS model, in conjunction with detailed aircraft make and model (e.g., Boeing 747-200 series) activity data. If such data were not available, a more general approach for different aircraft types (i.e., air taxis, general aviation, and military aircraft) was applied using available generic emission estimating procedures. Using these two complementary approaches provides the most accurate emission estimates for the larger commercial jets, which tend to be more significant aircraft emission source, while still providing estimates for smaller aircraft. EDMS was also used to estimate emissions from other airport mobile and stationary sources, except ground support equipment. As discussed above, emission estimates for ground support equipment were developed using the approach recommended by TCEQ. The activity data used to estimate emissions were provided by Love Field staff and compared with FAA data to insure that they were reasonable. Figure 3-1 is provided to show the approaches that were used to estimate emissions for 2005 for all identified source categories and the application of appropriate growth factors to represent emissions in 2010. 3.1 Emissions and Dispension Modeling System (EDMS)
Most of the mobile and stationary source emission estimates developed for the 2005 Love Field inventory used the FAA’s EDMS. This model is designed to estimate air quality impacts of airport emission sources, particularly aviation sources, which consist of the following:
• Aircraft
• Auxiliary power units
• Ground support equipment
• Airport on-road traffic and parking
• Stationary sources EDMS is one of the few air quality assessment tools specifically engineered for the aviation community. It includes the following:
• Emissions and dispersion calculations
• The latest aircraft engine emission factors from the International Civil Aviation Organization (ICAO) Engine Exhaust Emissions Data Bank
• Vehicle emission factors from the latest version of EPA’s MOBILE6 model

3-2
Figure 3-1. Overall Approach to Estimate 2005 and 2010 Emissions at Love Field
ATADS TAF
DOT Form 5010s
Love Field-provided
Information
Love Field Master Plan Love Field
Impact Analysis Update
Aircraft Type Activity Data
Emission Inventory Database
Other Stationary and Mobile Source Activity Data
Aircraft-specific Activity Data
FAA EDMS EPA Generic
Emission Factors
GSE TCEQ Nonroad
Equation FAA EDMS
Emissions Emissions Emissions Emissions
Projection Year Adjustment
Factors
FAA Airport Activity Data

3-3
EDMS was derived from the FAA’s Aircraft Engine Emission Database and provides reasonably accurate emission estimates, especially for larger commercial aircraft. The EDMS procedures for the other mobile and stationary source categories provide less accurate estimates, but these data can be used as a screening tool to evaluate whether more detailed studies need to be implemented in the future. For example, EDMS provides an estimate of evaporative emissions from fuel storage tanks that take into consideration the annual fuel throughput, fuel stored, and tank shape and size. The U.S. EPA’s TANKS model includes these variables as well as detailed dimension of the tanks, pressure setting of the vents, whether the tank is heated or underground, the color and general condition of the tank, and the shape of the roof. Because emissions from tanks at Love Field are relatively small (approximately 2 tons of VOC per year), it was not necessary to collect all of the detailed data needed to run the EPA’s TANKS software. EDMS uses the following equation to estimate aircraft emissions:
Eil = ∑ Tk × NEjl ×(FFjlk / 1000) × (EIilk) × LTO jl
Where:
Eil = Emission of pollutant i in pounds produced by the aircraft make j and model l
Tk = Operating time in mode k (min) NEjl = Number of engines associated with aircraft make j and model l; FFj = Fuel flow for individual engine used on aircraft
make type j and model l operating in mode k(lbs/min); EIij = Emission index for pollutant i for each engine associated
with aircraft make j and model l operating in mode k (lbs of pollutant /1,000 lbs of fuel)
i = Pollutant (i.e, HC, CO, NOx SO2) j = Aircraft make (e.g. Boeing, McDonald Douglas, Airbus) l = Aircraft model (e.g., B-737 300 series) k = Mode (approach, taxi, climbout)
Similarly, emissions from auxiliary power units are estimated using the following equation:
Eij = T × (FFj/1,000) ×(EIij)
Where:
Eij = Emission of pollutant i in pounds produced by the auxiliary power unit installed on aircraft type j for one LTO cycle
T = Operating time per LTO cycle (min) FFj = Fuel flow for each auxiliary power unit used on aircraft
type j (lbs/min) EIij = Emission index for pollutant i for each auxiliary power unit used
on aircraft type j (lbs of pollutant /1,000 lbs of fuel) i = Pollutant (i.e, HC, CO, NOx SO2)

3-4
j = Aircraft type (e.g., B-737, MD-11) For all other sources, emissions are estimated by applying activity data to an appropriate emission factor. Where control devices are used, emissions are reduced relative to the expected control efficiency of the device as noted in the following equation:
EE = A × EF × (1-CE/100)
Where:
EE = Emission estimate (tons per year) A = Annual activity level EF = Emission factor (tons/activity) CE = Anticipated emission reduction (percentage)
EDMS provides emission estimates for NOx, HC, VOC, CO, SO2, and PM10. Recently, in support of the regional haze assessments, first order approximates for PM2.5 for aircraft were incorporated into the latest versions of the model. 3.2 Generic Aircraft Approach
EDMS can provide emission estimates if the aircraft make and model number are known. Often this is not the case for air taxis, general aviation, and military aircraft. For these aircraft types, a generic approach is used that relies upon representative emission factors provided by EPA incorporated into the following equation:
Eixj = LTOi × FRpro-i × EFij
Where:
Eixj = Emission estimate for aircraft type i equipped with engine type x and pollutant j (lbs/year)
LTOi = Annual count of LTO cycles for aircraft type i FRx = Fraction of LTOs equipped with engine type x (GA: 20% jet or turbojet
propulsion, 80 percent propeller driven; air taxis: 52% jet or turbojet propulsion, 48 percent propeller driven – from FAA general aviation and air taxi survey)
EFij = Generic emission factor for aircraft type i equipped with engine type x and pollutant j (lbs/LTO)
i = Aircraft type (i.e., air taxi, general aviation, and military) x = Engine type (i.e, jet or turboprop, and piston engine) j = Criteria pollutant j.
Critical to the calculation is the application of representative emission factors that account for the different aircraft in the national fleet. For this study fleet wide emission factors were used from EPA State Implementation Plan (SIP) guidance (15). It should be noted that EPA emission

3-5
factors were developed over 20 years ago and do not reflect the evolution of engine design occurring during this period and the attrition of older, less efficient aircraft from the national fleet. More up to upto date emission factors would improve the accuracy of these emission estimates. Table 3-1 lists the generic emission factors by aircraft type.
Table 3-1. Emission Factors for Aircraft Types (pounds per LTO)
Aircraft Type CO VOC TOG NOX SO2 PM10 PM2.5
Air Taxi 28.130 1.222 1.312 0.158 0.015 0.603 0.589 General Aviation 12.014 0.382 0.410 0.065 0.010 0.237 0.231 Military Aircraft 28.130 1.222 1.312 0.158 0.015 0.603 0.589
3.3 Texas Ground Support Methodology
Instead of using the ground support equipment function in EDMS, TCEQ provided an alternative and more detailed approach to estimating emissions for this source category (7). This approach was developed by the Ashworth Leininger Group and the Air Transport Association of America as part of the individual carriers’ agreement with TCEQ (1) . The TCEQ approach to estimate ground support equipment emission estimates used the following equation:
E [(ZHF ) (Power ) (LF ) (Activity ) (DF )]gse ii 1
n
i i i i= ⋅∑ ⋅ ⋅ ⋅=
Where:
Egse = Emission estimate for ground support equipment N = Number of units in the fleet ZHF = Zero-hour emission factor for equipment category i (g/bhp-hr) Power = Rated power for equipment i (break horsepower) LF = Load factor for equipment i (% of maximum power) Activity = Activity for equipment i (hours per year of use) DF = Deterioration factor for equipment i (factor >1.00 expressing increased
emissions due to aging) i = Specific equipment type (e.g., baggage tractor, belt loader, catering
truck, lavatory truck, water service truck, and fuel hydrant truck) This approach is consistent with the calculation methodology used in EPA’s NONROAD2005 (14) emission factor model, although TCEQ’s approach utilizes more detailed equipment and activity data than does NONROAD. Specifically, where NONROAD only provides estimates for generic ground support equipment (for gasoline, diesel, and propane equipment), TCEQ developed equipment and activity data specific to each ground support equipment category. In this way more precise emission estimates can be developed for specific ground support
3-6
equipment fleets. The ground support equipment categories delineated by TCEQ include the following:
• Air Conditioner • Air Start • Aircraft Tractor • Baggage Tractor • Belt Loader • Bobtail • Cargo Loader • Catering Truck • Deicer • Forklift • Fuel Truck • Generator • Lavatory Truck • Lift • Other ground support equipment • Passenger Stand
To be consistent with the level of detail used in the TCEQ emission calculation procedures, separate estimates were required for each of the parameters in the above equation, for each ground support equipment category in the Love Field fleet. Once obtained, these factors were used to develop fleet-specific input files for the NONROAD model, as described in Section 5.3 below. Power. Each ground support equipment engine is associated with a maximum rated horsepower. This is also referred to as the manufacturer’s nameplate horsepower or the engine brake horsepower. In simple terms, it is the theoretical maximum power output of the engine, discounting variation in mechanical losses or fluctuations in operating conditions. Power levels for each piece of ground support equipment was provided by the equipment fleet operators for this analysis. Load Factor. The load factor takes into account actual operating conditions for specific equipment types, including variable loads, idling time, load characteristics (e.g., transient loads), equipment specifications, and use. It is expressed as the fraction of the theoretical maximum rated horsepower of the engine utilized during actual operation. Estimates of load factor were developed for each piece of ground support equipment by the fleet operators for this analysis. Activity. The activity is expressed in hours per year of use. Since the emissions calculations are performed on an annual average basis, the estimated emissions are calculated using the annual activity. Activity estimates were developed for each piece of ground support equipment by the fleet operators for this analysis.

3-7
Zero-Hour Emission Factor. The zero-hour factor (ZHF) is expressed in grams of pollutant per brake horsepower-hour (g/bhp-hr) and represents the baseline emission rate of a new engine. The ZHFs, as well as the deteriorations rate described next, vary across fuel types, engine sizes, and emission standards. The ZHFs provided in the NONROAD2005 model for gasoline, propane, and diesel-fueled ground support equipment were assumed for this analysis. Deterioration Rate. Over time engine performance deteriorates, which directly affects fuel consumption and emissions. The deterioration factor for nonroad equipment is calculated according to the following equation:
DF 1 AAge LF
Lifehours
B
= + ⋅⋅
Where:
A = Constant, depends on engine technology and fuel type B = Constant, depends on engine technology and fuel type Agehours = Age of engine in hours of use Life = Full-load median life (represents hours of operation at full load at
which 50% of all engines are expected to be retired or rebuilt - varies with engine size and fuel type)
Records are not always available to directly determine equipment age in hours for most units. Agehours may be estimated from the year of manufacture, the estimation year, and the activity factor, as in the following equation:
Age (hours) [Year Year ] [Activity]hours est mfg= − ⋅
Where:
Yearest = Year for which the emissions are estimated (Year) Yearmfg = Age of engine in hours (Year) Activity = Annual hours of operation (hours/year)
Once annual activity and engine life estimates are provided by the user, deterioration rates and overall emissions are calculated within the NONROAD2005 model, for any chosen episode year. The deterioration factors provided in the NONROAD2005 model for gasoline, propane, and diesel-fueled ground support equipment were assumed for this analysis. TxLED Adjustment. Once the above parameters have been combined, total emissions can be estimated for each ground support equipment category, within the NONROAD model. The resulting NOx emission estimates must then be adjusted outside the model to account for the use of Texas Low Emission Diesel Fuel (TxLED) in diesel ground support equipment units. TxLED is estimated to reduce nonroad engine NOx emissions by 6.2%, relative to standard federal diesel formulations (16). Therefore all diesel ground support equipment emission estimates from NONROAD must be multiplied by a factor of (1 – 0.062) = 0.938.

4-1
4.0 COMPILATION OF ACTIVITY DATA
4.1 Mobile Sources
Aircraft. The EPA’s aircraft emission estimates that are incorporated in the National Emission Inventory (13) were developed from the Bureau of Transportation Statistics (BTS) T-100 data set (10). This data set provides aircraft-specific LTO data, which can be applied to the FAA’s EDMS model. The BTS data can be significantly different from local aircraft activity data; thus, this study relied on local data to quantify activity levels. Love Field staff provided sufficient aircraft-specific data for commercial air carriers to use EDMS. Aircraft-specific LTO data are summarized in Table 4-1 (5). As noted earlier, the EDMS model calculates emissions based on the specific aircraft (i.e, individual aircraft make and model) operating at the field for specific time in mode (i.e., approach, taxi, idle, take off and climb out).
Table 4-1. 2005 Aircraft-specific LTO Data
Aircraft Annual LTOs B737-300 15,002 B737-500 15,665 B737-700 4,226 B767-300 403 Canadair Reg-700 1 Cessna 208 Caravan 540 CL600 287 CL601-3A 1 CL604 124 DC9-30 7 Embraer ERJ 135/140 388 Embraer ERJ 145 2,989 Learjet 25B 175 Learjet 35/36 1,058 McDonald Douglas -80 475 McDonald Douglas -80-81 174 McDonald Douglas -80-83 187 MD-80-83 65 Swearingen Merlin 1,267
Total 43,034 Less detailed activity data were used to estimate emissions from air taxis, general aviation, and military operations (5) (11). Table 4-2 summarizes 2005 activity data for these aircraft types.

4-2
Table 4-2. Aircraft-type LTO Data
Aircraft Type LTO data Air Taxis 22,446 General Aviation 54,058 Military Operations 1,293
Total 77,797 Ground Support Equipment. Love Field staff compiled sufficient data to use the detailed calculation methodology described in Section 3 to estimate emissions from ground support equipment (5). These data are presented in Appendices A and B, and include information about the equipment mix, maximum horsepower rating, and hours of operation by airline. Appendix A includes data for the baseline estimate if electrification of the ground support equipment fleet had not taken place. For the baseline ground support equipment estimate, the 2005 aircraft LTO data were applied to EDMS to generate the equipment fleet mix and annual hours of operation. Equipment which was not employed at Love Field was removed from theEDMS output. Appendix B includes data for the actual 2005 ground support equipment fleet, excluding electrified equipment. The current (non-electric) ground support equipment fleet is significantly smaller than the base year fleet, accounting for the shift from combustion-powered ground support equipment to electric powered equipment. Electric units operating in 2005 were removed from the equipment list because they do not directly emit pollutants at the airport. The difference between the baseline fleet and the actual fleet represent the emission reductions associated with the shift to electric powered ground support equipment. Traffic/Parking Activities. To account for airport traffic (including shuttle bus service), EDMS requires an estimate of annual vehicle trips, average speed, and trip distance. Vehicle trip data was obtained from the 2000 Master Plan for Love Field (3) and adjusted for 2005 based on the LTO activity for 2000 and 2005. Only traffic on the airport grounds were considered, thus, the traffic counts for the intersection of Cedar Springs Road and Mockingbird Lane were considered as noted in Figure 4-1. According to the Master Plan, 88,700 vehicles go through the intersection daily. Of this amount, the Master Plan documents that 48 percent of traffic is related to the airport, providing a daily airport vehicle count of 42,576. This vehicle count includes inbound and outbound vehicles; thus, to get the number of vehicle trips, the airport daily vehicle count was divided by two, providing a daily trip count of 21,288. To get the number of annual trips the daily trip count is multiplied by 365 yielding an estimate of 7.77 million airport vehicle trips per year. Vehicle activity is not constant throughout the week, thus, the actual number of vehicle trips may be significantly greater than or less than the average value used to estimate annual activity.

4-3
Figure 4-1. Map of Airport and Associated Roads
Data for all other vehicles that are dedicated to the airport were compiled by Love Field’s Environmental Affairs Group and are presented in Table 4-3 (5). The estimate of total passenger traffic was adjusted to account for the traffic associated with airport-dedicated vehicles to avoid double counting between these two vehicle activities. It should also be noted that the airport bus fleet uses Texas Low Emissions Diesel. The cutaways are classified as low emissions vehicles. The taxi fleet is comprises vehicles that were made in 2004 or earlier, with the majority of these vehicles are classified as ultra low emissions vehicles.
Table 4-3. Airport Vehicle Traffic
Vehicle Type
Number of Trips
Average Trip
Distance (miles)
Average Vehicle Speed (mph)
Passenger 7,596,160 0.4 45 Cutaway 112,640 0.4 15 Bus 17,520 0.4 15 Taxi 43,800 0.4 45

4-4
To estimate parking lot emissions using EDMS, the annual vehicle traffic was documented for the new Love Field parking lot. The Environmental Affairs group estimated the average travel distance, speed, and idle time associated with vehicles that use the new facility. These data are summarized in Table 4-4.
Table 4-4. Table Vehicle Parking Activity
Location
Height of Lot (ft above
ground level)
Number of Vehicles that Use the Parking Lot
per Year
Average Trip
Distance (miles)
Average Speed (mph)
Typical Idle Time per Vehicle (minutes)
8008 Cedar Springs 47.75 697,378 0.4 5 0.5
4.2 Stationary Sources
Power/Heating. To estimate emissions from power and facility heating sources, data on the type of combustion source, the type of fuel used and annual fuel consumption rate were needed. These data were obtained from the Love Field Environmental Affairs Group (5) and airport Master Plan (2). The compiled data are summarized in Table 4-5. The airport’s three boilers primarily use natural gas, although they are configured to also use diesel fuel. The airport has not had to use the boilers on a continuous basis using diesel, however, they are tested monthly for an hour and the total boilers fuel usage is about 65 gal per hour or approximately 780 gallons per year. For the purpose of this study we classified the boilers as uncontrolled wall fired boilers less than 100 million Btu-hr. Five emergency generators at Love Field use Texas low emission diesel fuel. Emergency power generators operate for short periods of time during power outages and for a one-hour period per month for testing and maintenance.
Table 4-5. Summary of Natural Gas Boiler Annual Fuel Consumption
Fuel Type BTU - hr Rating
Annual Fuel Consumption (Cubic Foot) Controls
Natural Gas 14,645,000 6,779,062 None Natural Gas 18,200,000 8,488,969 None Natural Gas 18,200,000 8,488,969 None
Fuel Storage. To estimate evaporative emissions from fuel storage tanks, EDMS requires the type of fuel stored and the annual throughput. Table 4-6 provides a census of all fuel storage tanks at Love Field (5). Most of the larger tanks are underground storage tanks. Tank content, capacity, and throughput data were provided by the Love Field’s Environmental Affairs Group. All 23 of the underground storage tanks designated for Southwest Airlines (Allied Aviation) are being phased out of operation and are being replaced by three above ground storage tanks.

4-5
Currently, these above ground tanks are under construction and are not included in the 2005 inventory, but will need to be considered when doing future year projections.
Table 4-6. Census of Fuel Storage Tanks, Content, and Annual Throughput
Operator Capacity Fuel Type Throughput (gal/yr)
Allied Aviation (FBO)1 18 – 50,000 gallon UST 4 – 12,000 gallon UST 1 – 10,000 gallon UST
Jet A Gasoline
Diesel
44,256,030 38,641 25,543
Associated Air/ Piedmont/Hawthorne (FBO) 3 – 12,000 gallon UST Jet A 36,000 each
Business Jet Center (FBO) 2 – 30,000 gallon UST 1 – 12,000 gallon UST 1 – 4,000 gallon UST
Jet A Av Gas
Gasoline
72,000 32,000 7,000
Dalfort Aerospace 1 – 300 gallon AST Diesel 0 Dallas Fire Station No. 21 1 – 3,000 gallon UST Diesel 1,705 Dallas Fire Station No. 42 1 – 1,000 gallon UST Diesel 865
1 – 20,000 gallon UST 1 – 1,400 gallon AST 1 – 1,200 gallon AST 1 – 1,000 gallon UST 2 – 100 gallon AST
Diesel Diesel Diesel Diesel Diesel
11,885 100 100 100
60 each Department of Aviation
1 – 1,000 gallon UST 3 – 300 gallon AST 1 – 300 gallon AST
Diesel Diesel
Gasoline
100 1,200 each
320 Federal Aviation Administration 1 – 2,000 gallon UST Diesel 100
Jet Aviation Texas, Inc. (FBO) 1 – 90,000 gallon UST 1 – 12,000 gallon UST
Jet A Av Gas
144,000 24,000
3 – 12,000 gallon UST 2 – 15,000 gallon UST 1 – 12,000 gallon UST
Jet A Jet A
Av Gas
976,000 all Jet A
36,000 MLT Development Co. 2 – 12,000 gallon UST 1 – 12,000 gallon UST
Jet A Av Gas
34,036 8,000
Regal Aviation (FBO) 2 4 – 20,000 gallon UST Jet A 65,000 each 4 – 48,000 gallon UST 2 – 20,000 gallon UST 1 – 20,000 gallon UST
Jet A Av Gas
Gasoline
422,000 total 19,000 3,600 Signature Flight Support (FBO) 6 – 20,000 gallon UST
2 – 10,000 gallon UST 1 – 10,000 gallon UST
Jet A Av Gas
Gasoline
1,478,665 44,650 2,400
TXI 2 – 12,000 gallon UST 1 – 1,000 gallon UST
Jet A Av Gas 236,000 46,000
Degreasing. EDMS includes emissions from solvent degreasing. EDMS requires the type of solvent degreaser (e.g., cold clean, open top vapor, conveyorized vapor or conveyorized non-boiling) and the annual solvent consumption rate. This information was provided by the Love Field’s Environmental Affairs Group (5) and is summarized in Table 4-7.
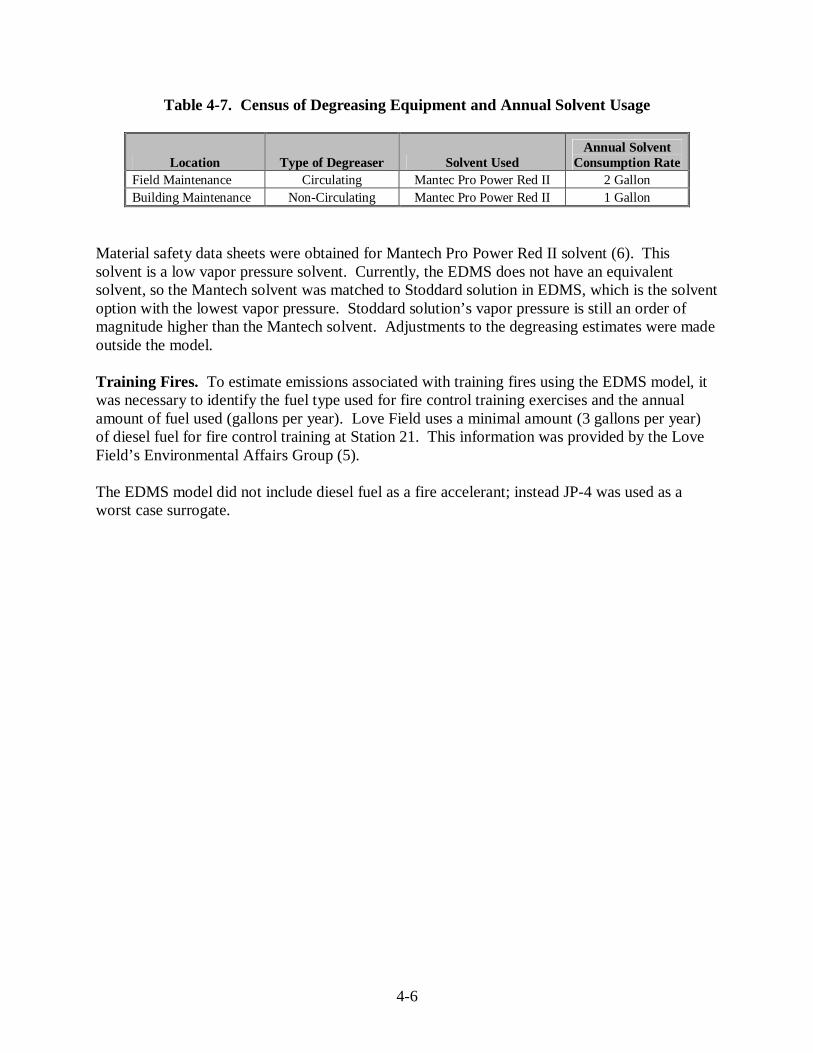
4-6
Table 4-7. Census of Degreasing Equipment and Annual Solvent Usage
Location Type of Degreaser Solvent Used Annual Solvent
Consumption Rate Field Maintenance Circulating Mantec Pro Power Red II 2 Gallon Building Maintenance Non-Circulating Mantec Pro Power Red II 1 Gallon
Material safety data sheets were obtained for Mantech Pro Power Red II solvent (6). This solvent is a low vapor pressure solvent. Currently, the EDMS does not have an equivalent solvent, so the Mantech solvent was matched to Stoddard solution in EDMS, which is the solvent option with the lowest vapor pressure. Stoddard solution’s vapor pressure is still an order of magnitude higher than the Mantech solvent. Adjustments to the degreasing estimates were made outside the model. Training Fires. To estimate emissions associated with training fires using the EDMS model, it was necessary to identify the fuel type used for fire control training exercises and the annual amount of fuel used (gallons per year). Love Field uses a minimal amount (3 gallons per year) of diesel fuel for fire control training at Station 21. This information was provided by the Love Field’s Environmental Affairs Group (5). The EDMS model did not include diesel fuel as a fire accelerant; instead JP-4 was used as a worst case surrogate.

5-1
5.0 EMISSION ESTIMATIONS
The goal of this section is to present the EDMS procedures with sufficient transparency and detail that Love Field staff can independently reproduce the current results and modify the data to update current input files or develop future emission control scenarios. This section takes the user through the step-by-step procedures that were followed to develop the current results. Also included in this section is a discussion of the NONROAD model which was modified for use in Texas to quantify emissions from ground support equipment.
5.1 Development of Input Files
Upon starting EDMS, the user can create a new study, open the most recent study, or open a study from a disk. Initally, a new study named “Love Field” was created and the study name and file location were defined (see Figure 5-1).
Figure 5-1. Start Up
After the Love Field study was created, the study setup menu appears (see Figure 5-2). In this case, the user selected the airport DAL (Love Field) from the airport ID pulldown menu and general airport data compiled by the FAA was automatically loaded for a limited number of data fields. Note, the user has other options to select such as the study type, ground support equipment modeling basis, and which version of MOBILE to use for onroad estimates. For this study, all components were used. The study setup menu can be accessed at anytime through the File menu under Setup (see Figure 5-3).

5-2
Figure 5-2. Setup
From the study setup menu, the model was adjusted to more accurately represent Love Field aviation conditions. For example, the time-in-mode values for taxi-in and taxi-out times were modified in EDMS to reflect the very short taxi times typical for Love Field. The default taxi time value in EDMS is 26 minutes, while typical taxi times at Love Field are 10 minutes as documented in the airports’ Master Plan.
Figure 5-3. File Menu

5-3
Once the initial setup was finished, the aircraft activity data were entered into EDMS. Because EDMS has a very specific input format for the data to imported correctly, a dummy record was created in EDMS to obtain the correct format and then the dummy record was exported. The compiled activity data were entered into the dummy file for importation back into EDMS. To create the dummy record, the Aircraft & Assignments button was selected from the Emissions menu (see Figure 5-4.). One of the aircraft from the available aircraft/engine list was selected along with an associated engine. Then the Add button was clicked to add the aircraft and engine to the inventory. Next, the identifer code was entered for the aircraft and engine. To complete the dummy record, the default name “#1” was used. Next, OK was clicked twice to exit the menu (see Figure 5-5).
Figure 5-4. Emission Menu
Figure 5-5. Aircraft Operations & Assignment

5-4
The dummy record was exported by selecting Export from the Utilities menu (see Figure 5-6.).
Figure 5-6. Utilities Menu, Exporting
Once the file has been exported, the Export Wizard Step 1 menu appears. Aircraft Operations & Assignments was selected to expand the list and Aircraft Operations was checked. The user selects the Next button at the bottom (see Figure 5-7) to go to the next step. The next step was to name the file and select a location for the file to export to. The file was exported in Comma Separated Values (CSV) format, which was opened easily with Excel for editing (see Figure 5-8). After the aircraft operations were exported, EDMS confirmed that the export has been completed (see Figure 5-9).
Figure 5-7. Export Wizard Step 1

5-5
Figure 5-8. Export Wizard Step 2
Figure 5-9. Export Complete
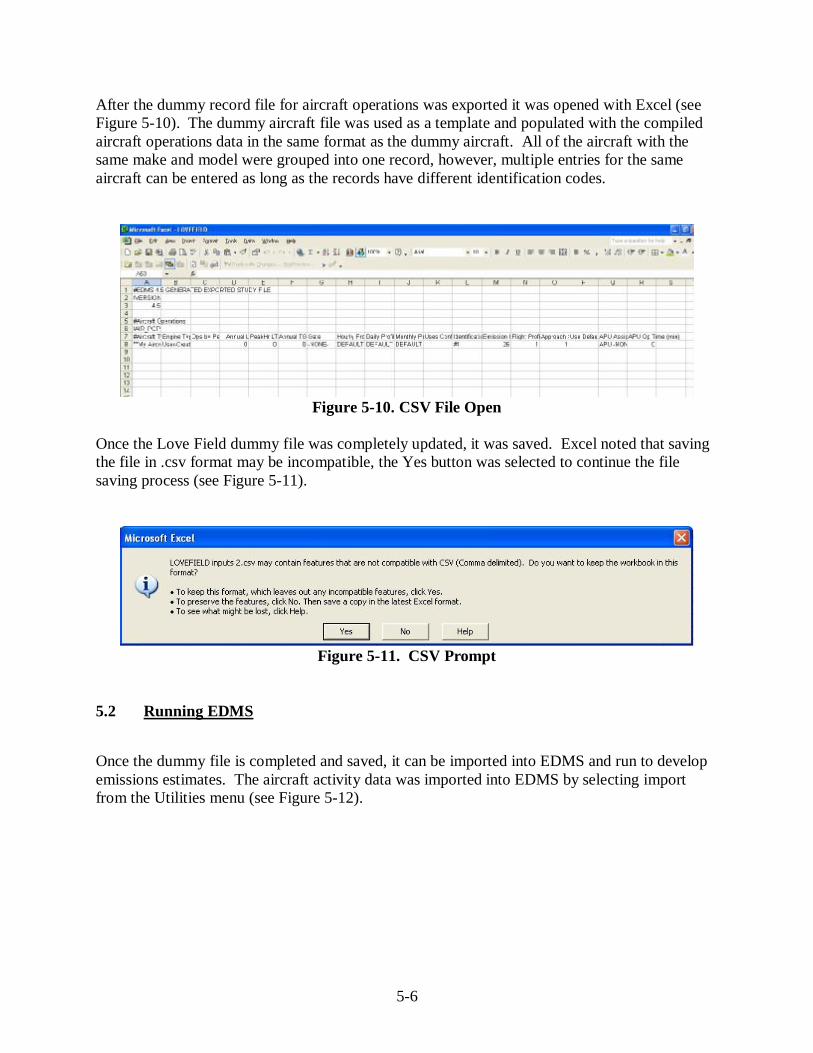
5-6
After the dummy record file for aircraft operations was exported it was opened with Excel (see Figure 5-10). The dummy aircraft file was used as a template and populated with the compiled aircraft operations data in the same format as the dummy aircraft. All of the aircraft with the same make and model were grouped into one record, however, multiple entries for the same aircraft can be entered as long as the records have different identification codes.
Figure 5-10. CSV File Open
Once the Love Field dummy file was completely updated, it was saved. Excel noted that saving the file in .csv format may be incompatible, the Yes button was selected to continue the file saving process (see Figure 5-11).
Figure 5-11. CSV Prompt
5.2 Running EDMS
Once the dummy file is completed and saved, it can be imported into EDMS and run to develop emissions estimates. The aircraft activity data was imported into EDMS by selecting import from the Utilities menu (see Figure 5-12).

5-7
Figure 5-12. Utilities Menu, Importing
The first step in the Import Wizard is to find the import file by either typing in the plan name and file or by browsing for it using the Browse button. The user selects then Next to go to the next step (see Figure 5-13).
Figure 5-13. Import Wizard Step 1
As done with the Export Wizard Step 1, Aircraft Operations & Assignments was selected to expand the list and Aircraft Operations was selected. Upon selecting Next, at Step 2, EDMS imported the aircraft operations (see Figure 5-14).

5-8
Figure 5-14. Import Wizard Step 2
Step 3 indicates the number of records imported (see Figure 5-15). The number of records imported was selected to ensure that it matched the number of records that were in the in the import file, confirming that the importation was complete. The OK button was selected to finish the imporation process. Once airport operations are imported, data for the other emissions sources associated with the airport can be addressed. From the Emissions Menu, the Parking Facilities, Roadways, Stationary Sources, and Training Fires buttons were selected to enter data for these source categories. However, note that once at least one source is imported (including aircraft), the user can select Run Emissions Inventory to have EDMS generate the emission estimates (see Figure 5-16).

5-9
Figure 5-15. Import Wizard Step 3
Figure 5-16. Emissions Menu
At Love Field, emissions from parking facilities were addressed. Upon selecting Parking Facilities, the user was prompted to Add/Remove a source. The user then supplied the necessary information for the source being added. The user must check either the box labeled “Use System Generated Values” for the emission factors or enter site’ specific emission factors (see Figure 5-17). The other emission sources have similar menus and also must have the emission factor (or emission parameter) box checked or have the emission factors or parameters entered (see Figures 5-18 to 5-20). For the purposes of the Love Field inventory, the System Generated Values were used.

5-10
Figure 5-17. Parking Facilities
Figure 5-18. Roadways

5-11
Figure 5-19. Stationary Sources
Figure 5-20. Training Fires

5-12
Once data for all of the emissions sources were entered, the emissions inventory was run by selecting Run Emissions Inventory. Output from the model was viewed by selecting the View menu and selecting Emissions Inventory (see Figure 5-21).
Figure 5-21. View Emissions Inventory
The emissions inventory can be viewed in six different ways: (1) the summary (which is by emissions category), (2) aircraft emissions by mode, (3) aircraft/ ground support equipment / auxillary power unit emissions, (4) ground support equipment population emissions (available only if ground support equipment population data was provided), (5) vehicular emissions, and (6) stationary emissions. The user can examine different views by selecting one of the six buttons below the main menu (see Figure 5-22).
Figure 5-22. Emissions Inventory Summary
Emissions from auxiliary power units were adjusted outside the model to reflect the reduction in hours of operation associated with the use of gates equipped with electricity and preconditioned air. According to the U.S. EPA, auxiliary power units need to operate during start-up to generate compressed air to start the engines. Auxiliary power units also operate during approach, taxi,

5-13
take off, and climb out to provide air and electricity to the passenger compartment. U.S. EPA recommended that hours of operation of auxiliary power units be reduced by 90 percent to account for use of gates equipped with electricity and preconditioned air. For fuel storage tanks, the newest version of EDMS incorporates all of the details of EPA’s TANKS model. Version 4.0 (9) includes a simplified version that can be used as a screening tool. The compiled fuel tank activity data were used as input into version 4.0 of the EDMS model. The activity data summarized in Table 5-1 provides an estimate of approximately 2 tons per year of total hydrocarbons. Thus, fuel storage is not a significant VOC emission source at Love Field and use of more complex emission estimating models such as EDMS 4.5 or TANKS is not warranted.
Table 5-1. Fuel Tank Throughput
Total Throughput Fuel Gallons per year Kiloliters per year
Aviation gasoline 209,650 794 Diesel 44,218 167 Gasoline 51,961 197 Jet A 47,986,731 181,649
5.3 Estimating Ground Support Equipment Emissions
Love Field’s Environmental Affairs group provided detailed information on the projected ground support equipment mix without electrification, as well as the current ground support equipment mix after electrification. Both scenarios were developed for the 2005 base year. For each scenario the average horsepower and activity levels for each type of ground support equipment were calculated, weighted by horsepower-hour levels for each unit. ERG also used information from the Ashworth Leininger Group report provided by TCEQ to estimate the median life for the different ground support equipment categories, to be consistent with TCEQ emission calculation methods. The following ground support equipment categories were included in the Love Field data:
• Air Start • Aircraft Tractor • Baggage Tractor • Belt Loader • Cabin Service Truck • Catering Truck • De-icing Truck • Fuel Truck • Ground Power Unit • Hydrant Truck • Lavatory Truck • Service Truck

5-14
In instances where a corresponding equipment type was not included in the 2001 inventory, similar types of equipment were identified using EPA’s NONROAD2005 model and the model’s default median life value for these units was used. For example, the data provided for Love Field included diesel ground power units in the 50-75 horsepower (hp) range. The 2001 Love Field inventory provided by TCEQ did not include diesel ground power units within this horsepower range. Therefore, ERG used the NONROAD2005 model median life for a similar equipment category instead, in this case, for diesel generators in the 50-75 horsepower range.
Using the data provided, ERG created new population, activity, and allocation data files for the NONROAD2005 model, specific to the Love Field fleet scenarios. The model used these custom data files to calculate emissions from the various ground support equipment categories. Emissions estimates for the appropriate model years were then extracted from NONROAD’s by-model-year output files. ERG used the output from the model to determine emissions foe each piece of ground support equipment, which was then multiplied by the number of pieces of equipment, providing an estimate of emissions for the ground support equipment fleet. The by-model-year output from the NONROAD2005 model estimates hydrocarbon emissions as total hydrocarbons (THC) and particulate matter of 10 micrometers or less in size (PM10). However, VOCs are not identical with THC emissions and Particulate Matter of 2.5 micrometers or less (PM2.5) is only a fraction of total the PM calculated by the NONROAD2005 model. Therefore ERG applied conversion factors to convert THC to VOC (1.053) and PM10 to PM2.5 (0.97). In addition to the federal emission standards automatically applied by the NONROAD2005 model, ground support equipment at Love Field also utilize TxLED. To reflect emissions benefits from this fuel, ERG adjusted the NOx emissions for all diesel equipment by applying a 6.2% reduction to all diesel NOx emissions. Finally, the 2005 annual ground support equipment emissions estimates for each scenario were summed and compared. The results for the baseline fleet (without electrification) and the current fleet (with electrification) are presented in Tables 5-2 and 5-3 below, respectively. The overall emissions benefits from electrification are presented in Table 5-4.

5-15
Table 5-2. Baseline Ground Support Equipment Fleet Emissions (Tons/Year)
Ground Support
Equipment NOx CO SO2 PM10 PM2.5 VOC Air Start 0.7779 0.3549 0.0006 0.0361 0.0351 0.0650 Baggage Tractors 32.4733 549.1427 0.1172 0.2292 0.2224 19.3725 Cabin Service Trucks 12.3012 3.3632 0.0140 0.6078 0.5895 0.9698 De-Icing Trucks 0.0321 0.0099 0.0000 0.0016 0.0015 0.0027 Ground Power Units 0.7635 8.1712 0.0020 0.0207 0.0201 0.3371 Lavatory Trucks 1.2932 1.3824 0.0016 0.1050 0.1018 0.1612 Service Trucks 3.4897 0.9135 0.0039 0.1557 0.1510 0.2673 Aircraft Tractors 2.2016 1.0288 0.0021 0.1094 0.1061 0.1323 Belt Loaders 6.4556 117.0120 0.0549 0.1313 0.1273 3.8405 Catering Trucks 9.3761 2.8181 0.0108 0.4502 0.4367 0.7587 Fuel Trucks 0.4622 0.1228 0.0005 0.0240 0.0233 0.0339 Hydrant Trucks 10.9976 2.9799 0.0127 0.4645 0.4505 0.8732
Table 5-3. Current Ground Support Equipment Fleet Emissions (Tons/Year)
Ground Support Equipment NOx CO SO2 PM10 PM2.5 VOC
Air Start 0.7779 0.3549 0.0006 0.0361 0.0351 0.0650 Baggage Tractors 1.3113 2.4467 0.0015 0.0687 0.0666 0.1497 Cabin Service Trucks 0.2936 0.0690 0.0003 0.0155 0.0150 0.0200 De-Icing Trucks 0.0321 0.0099 0.0000 0.0016 0.0015 0.0027 Ground Power Units 0.7635 8.1712 0.0020 0.0207 0.0201 0.3371 Lavatory Trucks 0.1027 0.4334 0.0002 0.0079 0.0076 0.0344 Service Trucks 0.1233 0.0285 0.0001 0.0057 0.0055 0.0084 Aircraft Tractors 0.2595 0.1225 0.0003 0.0128 0.0124 0.0159 Belt Loaders 0.3433 3.6047 0.0010 0.0125 0.0121 0.1568 Catering Trucks 0.0266 0.0211 0.0000 0.0021 0.0020 0.0028 Fuel Trucks 0.4316 0.1146 0.0004 0.0223 0.0217 0.0317
Table 5-4. Emissions Benefits
(Tons/Year)
NOx 76.16 CO 671.9 SO2 0.21 PM10 2.13 PM2.5 2.07 VOC 25.99

6-1
6.0 FUTURE YEAR PROJECTIONS
Future emissions were determined by multiplying the estimated 2010 LTO data by the 2005 emission estimates, which are divided by the 2005 LTOs for each aircraft type as noted in the following equation:
AEMij10 = LTOj10 × EMij05/LTOj05
Where:
AEMij10 = Adjusted 2010 emission estimate for pollutant i, for aircraft type j (tons) LTOj10 = LTOs for aircraft type j for 2010 (LTO cycles) LTOj05 = LTOs for aircraft type j for the 2005 base year (LTO cycles) EMij05 = Emission estimate for pollutant i and aircraft type j for 2005
base year (tons) i = Pollutant (i.e., CO, VOC, TOG, NOx, SO2, PM10, and PM2.5) j = Aircraft type (i.e., commercial, air taxi, general aviation, and military)
The 2010 LTO data for commercial air carriers was obtained from the forecasted operations noted in the Dallas Love Field Impact Analysis Update. Estimated 2010 LTO data for air taxis, general aviation, and military operations were obtained from the FAA’s Terminal Area Forecast (12). These base and projected LTO values are presented in Table 6-1, noting the percentage difference from the base year. The approach presented here assumes that the fleet mix in 2010 will be similar to the fleet mix in 2005.
Table 6-1. 2005 / Estimated 2010 LTO Data by Aircraft Type
Aircraft Type 2005 2010 % Difference Commercial Air Carriers 43,033 50,871 + 18.2 Air Taxi 22,446 27,515 + 22.6 General Aviation 54,058 68,678 + 27.0 Military 1,293 1,234 - 4.6
Total 120,830 148,298 + 22.7 A similar approach was used to adjust ground support equipment, storage tanks, and on-road traffic and parking emission estimates using the appropriate aircraft LTO data between the base year and the projected years. For example; the different fuels being stored was adjusted based on changes in the related aircraft type. General aviation fuel usage was assumed to be correlated with general aviation activities, while the Jet A fuel through-put was assumed to be correlated to changes in commercial air traffic. If the fuel was not directly associated with an aircraft type, then the aggregated average value was used as noted in Table 6-2.

6-2
Table 6-2. 2005/2010 Adjustment Factors for Fuel Storage Tanks
Fuel Matched Aircraft Growth Factor
2005 Hydrocarbon
Emission Estimate
% Adjustment
2010 Hydrocarbon
Emission Estimate
General Aviation Gasoline
General Aviation 0.903 + 27.0 1.147
Diesel Aggregated 0.001 + 22.7 0.001 Gasoline Aggregated 0.401 + 22.7 0.492 Jet A Commercial Air
Carriers 0.961 + 18.2 1.136
Stationary source emission estimates, such as those associated with power generation and heat, degreasing, and training fires, were held constant between the base and projected inventory years.
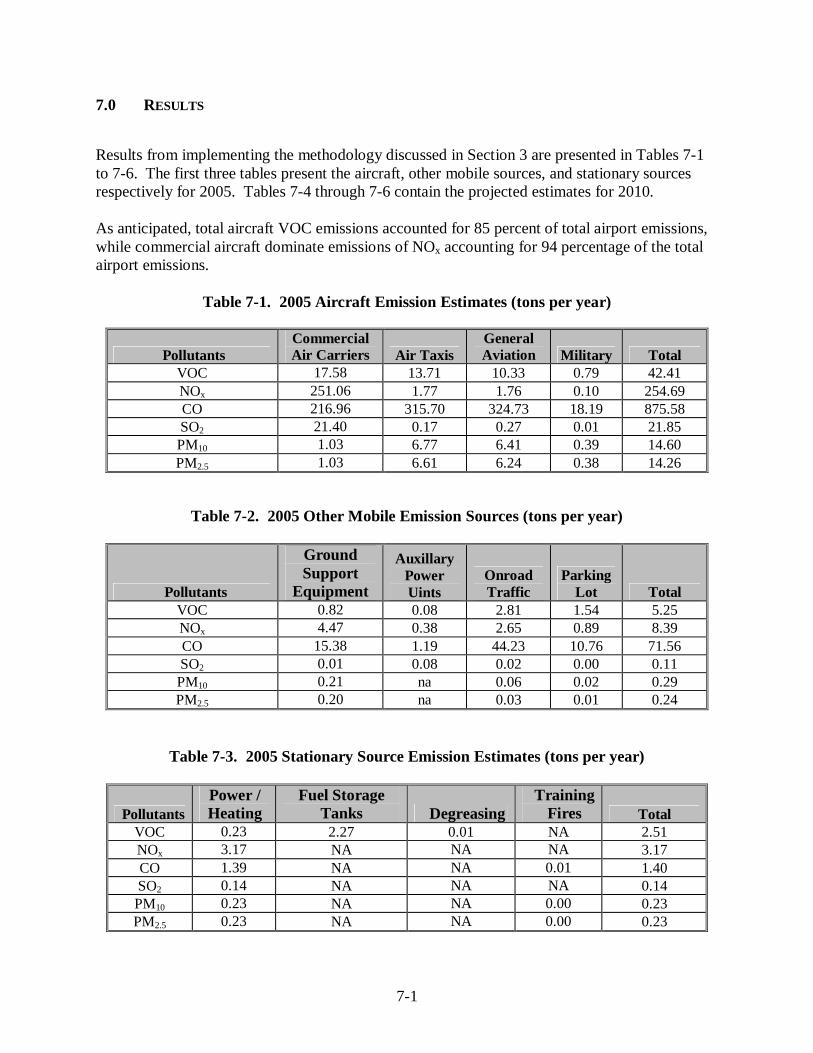
7-1
7.0 RESULTS
Results from implementing the methodology discussed in Section 3 are presented in Tables 7-1 to 7-6. The first three tables present the aircraft, other mobile sources, and stationary sources respectively for 2005. Tables 7-4 through 7-6 contain the projected estimates for 2010. As anticipated, total aircraft VOC emissions accounted for 85 percent of total airport emissions, while commercial aircraft dominate emissions of NOx accounting for 94 percentage of the total airport emissions.
Table 7-1. 2005 Aircraft Emission Estimates (tons per year)
Pollutants Commercial Air Carriers Air Taxis
General Aviation Military Total
VOC 17.58 13.71 10.33 0.79 42.41 NOx 251.06 1.77 1.76 0.10 254.69 CO 216.96 315.70 324.73 18.19 875.58 SO2 21.40 0.17 0.27 0.01 21.85 PM10 1.03 6.77 6.41 0.39 14.60 PM2.5 1.03 6.61 6.24 0.38 14.26
Table 7-2. 2005 Other Mobile Emission Sources (tons per year)
Pollutants
Ground Support
Equipment
Auxillary Power Uints
Onroad Traffic
Parking Lot Total
VOC 0.82 0.08 2.81 1.54 5.25 NOx 4.47 0.38 2.65 0.89 8.39 CO 15.38 1.19 44.23 10.76 71.56 SO2 0.01 0.08 0.02 0.00 0.11 PM10 0.21 na 0.06 0.02 0.29 PM2.5 0.20 na 0.03 0.01 0.24
Table 7-3. 2005 Stationary Source Emission Estimates (tons per year)
Pollutants Power / Heating
Fuel Storage Tanks Degreasing
Training Fires Total
VOC 0.23 2.27 0.01 NA 2.51 NOx 3.17 NA NA NA 3.17 CO 1.39 NA NA 0.01 1.40 SO2 0.14 NA NA NA 0.14 PM10 0.23 NA NA 0.00 0.23 PM2.5 0.23 NA NA 0.00 0.23

7-2
The 2010 activity data were obtained from Love Fields’ Updated Impact Analysis, which assumes repeal of the Wright Amendment. Actual 2010 emissions are expected to be more similar to 2005, based on the recent Memorandum of Understanding between the airport and the air carriers. Slight increases in activity are likely in 2025 when the gate limitations expire. If the Wright amendment is repealed, then there may be a shift in the aircraft fleet for Southwest Airlines, allowing them to expand their services to new markets, and requiring the use of larger aircraft. It should be noted that the 2010 estimate for ground support equipment assumed that the current level of electrification would be maintained. If the other airlines implement a program of electrification similar to Southwest, then the projected 2010 emissions would be less than reported in Table 7-4. The anticipated level of reduction is anticipated to be small as the amount of traffic associated with the other airlines is significantly less than the traffic associated with Southwest.
Table 7-4. 2010 Aircraft Emission Estimates (tons per year)
Pollutants Commercial Air Carriers Air Taxis
General Aviation Military Total
VOC 20.78 16.81 13.12 0.75 51.46 NOx 296.75 2.17 2.24 0.08 301.168 CO 256.45 387.05 412.41 17.35 1,073.26 SO2 25.29 0.21 0.34 0.01 25.84 PM10 1.22 8.30 8.14 0.37 18.03 PM2.5 1.22 8.10 7.92 0.36 17.60
Table 7-5. 2010 Other Emission Sources (tons per year)
Pollutants
Ground Support
Equipment
Auxillary Power Uints
Onroad Traffic
Parking Lot Total
VOC 1.01 0.08 3.45 1.89 6.44 NOx 5.48 0.45 3.25 1.09 10.27 CO 18.87 1.40 54.27 13.20 87.74 SO2 0.01 0.09 0.02 0.00 0.12 PM10 0.26 NA 0.07 0.02 0.35 PM2.5 0.25 NA 0.04 0.01 0.30
Table 7-6. 2010 Stationary Source Emission Estimates (tons per year)
Pollutants Power / Heating
Fuel Storage Tanks Degreasing
Training Fires Total
VOC 0.23 2.78 0.01 NA 3.02 NOx 3.17 NA NA NA 3.17 CO 1.39 NA NA 0.01 1.40 SO2 0.14 NA NA NA 0.14 PM10 0.23 NA NA 0.00 0.23 PM2.5 0.23 NA NA 0.00 0.23

7-3
This inventory also evaluated the emission reduction associated with the electrification of the ground support equipment and the use of gates equipped with electricity and preconditioned air. The emission reductions associated with the ground support equipment for 2005 was estimated by using EDMS to estimate the fleet and hours of operation of ground support equipment needed to accommodate the number and aircraft type that visited Love Field during the base year period. This equipment profile was compared to the actual ground support equipment fleet that operated in 2005 to quantify the emission reduction from electrification of the ground support equipment. It should be noted that more detailed information about Southwests current ground support equipment fleet and the associated hours of operation would provide more accurate estimate of the emission reductions associated with this control option. Emission reductions associated with use of gates equipped with electricity and preconditioned air were also quantified. The use of these gates reduces the amount of time auxiliary power units are operating during an LTO cycle by 90 percent based on EPA guidance. These emission reductions are summarized in Tables 7-7 and 7-8. Table 7-7 provides an estimate of the annual emission reductions for all pollutants included in this project, while Table 7-8 provides the same data in terms of tons of pollutant reduced per day.
Table 7-7. Emission Reductions (tons per year)
Ground Support Equipment Auxiliary Power Units Pollutant Baseline Current Reduction Uncontrolled Controlled Reduction
Total Reduction
VOC 26.81 0.82 25.99 0.76 0.08 0.69 26.68 NOx 80.63 4.47 76.16 3.79 0.38 3.41 79.57 CO 687.28 15.38 671.90 11.85 1.19 10.67 682.57 SO2 0.22 0.01 0.21 0.75 0.08 0.68 0.89 PM10 2.34 0.21 2.13 NA NA NA 2.13 PM2.5 2.27 0.20 2.07 NA NA NA 2.07
Table 7-8. Emission Reductions (tons per day)
Ground Support Equipment Auxiliary Power Units Pollutant Baseline Current Reduction Uncontrolled Controlled Reduction
Total Reduction
VOC 0.0735 0.0022 0.0713 0.0021 0.0002 0.0019 0.0732 NOx 0.2209 0.0122 0.2087 0.0104 0.0010 0.0094 0.2181 CO 1.8830 0.0421 1.8409 0.0325 0.0033 0.0292 1.8701 SO2 0.0006 0.0000 0.0006 0.0021 0.0002 0.0019 0.0025 PM10 0.0064 0.0006 0.0058 NA NA NA 0.0058 PM2.5 0.0062 0.0005 0.0057 NA NA NA 0.0057

8-1
8.0 QUALITY CONTROL CHECKS
Quality control checks were performed at a variety of critical points in the development of this inventory. In general, these checks were implemented by senior staff who are familiar with the source categories included in this project, but who were not directly involved in the calculations. The project manager was notified where errors were encountered and the data sets were corrected to address any errors identified by the reviewers. Specific checks performed and results are summarized below:
• The generic aircraft type emission factors were independently checked by TCEQ staff who are familiar with aircraft emission inventories, but were not directly involved in the development of these emission factors. Originally, the plan was to use emission factors developed for SCAQMD for air taxis and general aviation, but there was insufficient time for TCEQ to implement an exhaustive review of the new factors, so the older EPA emission factors were used for this effort.
• In reviewing the emissions calculations, no mathematical errors were encountered.
• The input files for the EDMS model were reviewed by senior reviewers who have
worked with this model in the past. The number of records in the input file matched the number of records in the project aircraft-specific activity data files. Also the LTO data attributes in the input file were the same as the values in the database. LTOs were double checked to insure that aircraft operations were not used in any of the calculations. Note there are two operations for every LTO aircraft arrival and aircraft departure.
• Output from EDMS were also reviewed to identify any unusual estimates. No unusual
values were encountered.
• Spreadsheets to estimate aircraft type activity data were reviewed by senior staff and no errors were encountered during this review.
• All emission estimates were compared to the emission estimates developed for the airport
master plan (2) and the 2006 Emission Impact Update (4). The 2006 estimates were developed assuming a much higher level of aircraft activity and were adjusted to be comparable with the level of aircraft traffic documented for 2005. These comparisons are noted in Tables 8-1 through 8-3.
Table 8-1. Comparison of Aircraft Emission Estimates (tons per year)
Data Source CO VOC NOx SO2 PM
Master Plan (2000) 465 55 417 20 -- Impact Assessment Update (2006) 789 74 299 23 4 Current Inventory 876 42 255 22 15
An issue that was noted and discussed in the Impact Assessment Update concerns use of different versions of EDMS. The aircraft emission factors used in EDMS are updated frequently, such that older emission factors are replaced with newer test data with each
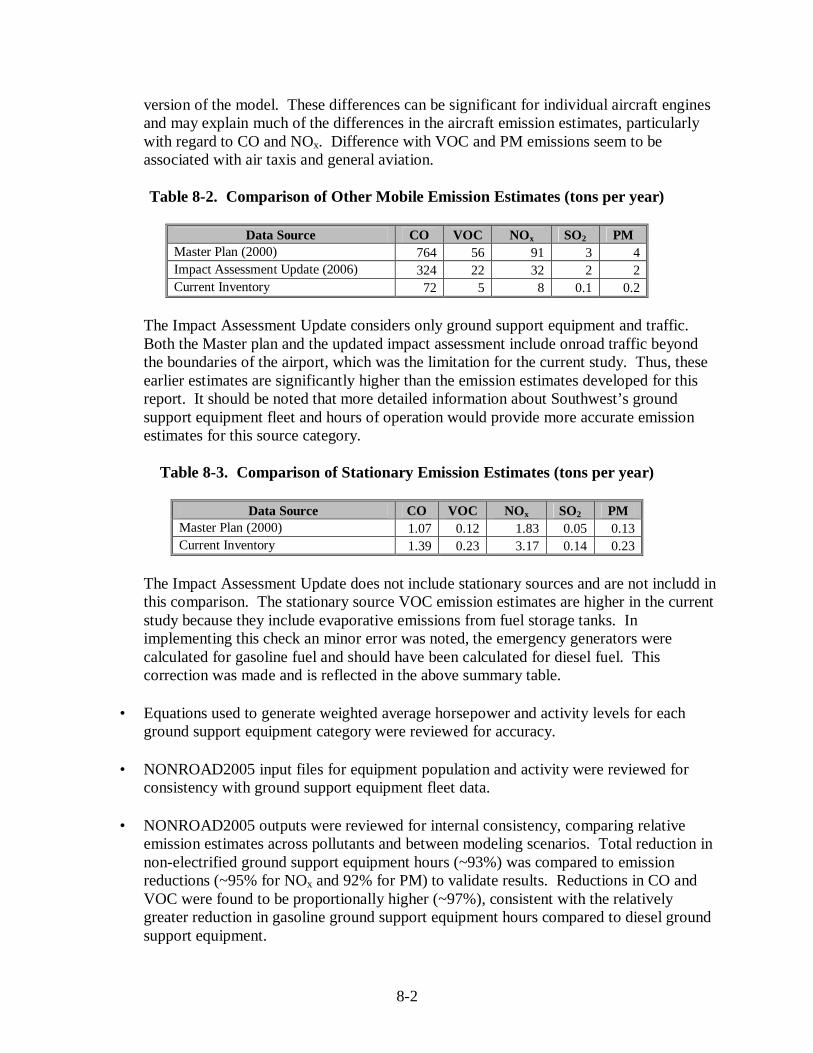
8-2
version of the model. These differences can be significant for individual aircraft engines and may explain much of the differences in the aircraft emission estimates, particularly with regard to CO and NOx. Difference with VOC and PM emissions seem to be associated with air taxis and general aviation.
Table 8-2. Comparison of Other Mobile Emission Estimates (tons per year)
Data Source CO VOC NOx SO2 PM
Master Plan (2000) 764 56 91 3 4 Impact Assessment Update (2006) 324 22 32 2 2 Current Inventory 72 5 8 0.1 0.2
The Impact Assessment Update considers only ground support equipment and traffic. Both the Master plan and the updated impact assessment include onroad traffic beyond the boundaries of the airport, which was the limitation for the current study. Thus, these earlier estimates are significantly higher than the emission estimates developed for this report. It should be noted that more detailed information about Southwest’s ground support equipment fleet and hours of operation would provide more accurate emission estimates for this source category.
Table 8-3. Comparison of Stationary Emission Estimates (tons per year)
Data Source CO VOC NOx SO2 PM
Master Plan (2000) 1.07 0.12 1.83 0.05 0.13 Current Inventory 1.39 0.23 3.17 0.14 0.23
The Impact Assessment Update does not include stationary sources and are not includd in this comparison. The stationary source VOC emission estimates are higher in the current study because they include evaporative emissions from fuel storage tanks. In implementing this check an minor error was noted, the emergency generators were calculated for gasoline fuel and should have been calculated for diesel fuel. This correction was made and is reflected in the above summary table.
• Equations used to generate weighted average horsepower and activity levels for each
ground support equipment category were reviewed for accuracy.
• NONROAD2005 input files for equipment population and activity were reviewed for consistency with ground support equipment fleet data.
• NONROAD2005 outputs were reviewed for internal consistency, comparing relative
emission estimates across pollutants and between modeling scenarios. Total reduction in non-electrified ground support equipment hours (~93%) was compared to emission reductions (~95% for NOx and 92% for PM) to validate results. Reductions in CO and VOC were found to be proportionally higher (~97%), consistent with the relatively greater reduction in gasoline ground support equipment hours compared to diesel ground support equipment.
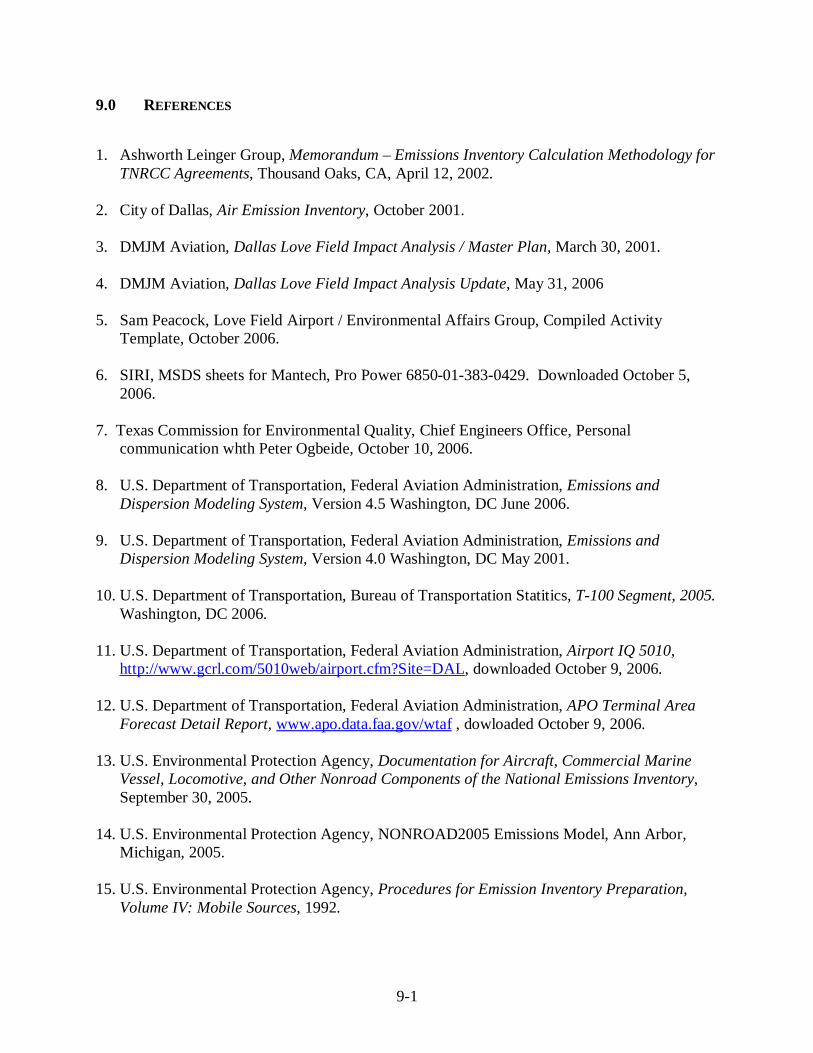
9-1
9.0 REFERENCES
1. Ashworth Leinger Group, Memorandum – Emissions Inventory Calculation Methodology for TNRCC Agreements, Thousand Oaks, CA, April 12, 2002.
2. City of Dallas, Air Emission Inventory, October 2001. 3. DMJM Aviation, Dallas Love Field Impact Analysis / Master Plan, March 30, 2001. 4. DMJM Aviation, Dallas Love Field Impact Analysis Update, May 31, 2006 5. Sam Peacock, Love Field Airport / Environmental Affairs Group, Compiled Activity
Template, October 2006. 6. SIRI, MSDS sheets for Mantech, Pro Power 6850-01-383-0429. Downloaded October 5,
2006. 7. Texas Commission for Environmental Quality, Chief Engineers Office, Personal
communication whth Peter Ogbeide, October 10, 2006. 8. U.S. Department of Transportation, Federal Aviation Administration, Emissions and
Dispersion Modeling System, Version 4.5 Washington, DC June 2006. 9. U.S. Department of Transportation, Federal Aviation Administration, Emissions and
Dispersion Modeling System, Version 4.0 Washington, DC May 2001. 10. U.S. Department of Transportation, Bureau of Transportation Statitics, T-100 Segment, 2005.
Washington, DC 2006. 11. U.S. Department of Transportation, Federal Aviation Administration, Airport IQ 5010,
http://www.gcrl.com/5010web/airport.cfm?Site=DAL, downloaded October 9, 2006. 12. U.S. Department of Transportation, Federal Aviation Administration, APO Terminal Area
Forecast Detail Report, www.apo.data.faa.gov/wtaf , dowloaded October 9, 2006. 13. U.S. Environmental Protection Agency, Documentation for Aircraft, Commercial Marine
Vessel, Locomotive, and Other Nonroad Components of the National Emissions Inventory, September 30, 2005.
14. U.S. Environmental Protection Agency, NONROAD2005 Emissions Model, Ann Arbor,
Michigan, 2005. 15. U.S. Environmental Protection Agency, Procedures for Emission Inventory Preparation,
Volume IV: Mobile Sources, 1992.

9-2
16. U.S. Environmental Protection Agency, Memorandum from Karl Eklund (Region V) to Robert Larson (EPA/OTAQ) Re. Texas Low Emission Diesel Fuel Benefits, September 27, 2001.

Appendix A
BASELINE GROUND SUPPORT EQUIPMENT PROFILE BY AIRCRAFT MODEL

A-1
Appendix A – Baseline Ground Support Equipment Profile by Aircraft Model
Aircraft Associated Ground Support Equipment Fuel
Minutes /LTO
Horse Power
Load Factor
B737-300 Air Conditioner Electric 30 0 0.75 B737-300 Air Start Diesel 7 425 0.9 B737-300 Aircraft Tractor Diesel 8 88 0.8 B737-300 Baggage Tractor Gasoline 75 107 0.55 B737-300 Belt Loader Gasoline 48 107 0.5 B737-300 Cabin Service Truck Diesel 20 210 0.53 B737-300 Catering Truck Diesel 15 210 0.53 B737-300 Hydrant Truck Diesel 12 235 0.7 B737-300 Lavatory Truck Diesel 15 56 0.25 B737-300 Service Truck Diesel 15 235 0.2 B737-300 Water Service Electric 12 0 0.2 B737-500 Air Conditioner Electric 30 0 0.75 B737-500 Air Start Diesel 7 425 0.9 B737-500 Aircraft Tractor Diesel 8 88 0.8 B737-500 Baggage Tractor Gasoline 75 107 0.55 B737-500 Belt Loader Gasoline 48 107 0.5 B737-500 Cabin Service Truck Diesel 20 210 0.53 B737-500 Catering Truck Diesel 15 210 0.53 B737-500 Hydrant Truck Diesel 12 235 0.7 B737-500 Lavatory Truck Diesel 15 56 0.25 B737-500 Service Truck Diesel 15 235 0.2 B737-500 Water Service Electric 12 0 0.2 B737-700 Air Conditioner Electric 30 0 0.75 B737-700 Air Start Diesel 7 425 0.9 B737-700 Aircraft Tractor Diesel 8 88 0.8 B737-700 Baggage Tractor Gasoline 75 107 0.55 B737-700 Belt Loader Gasoline 48 107 0.5 B737-700 Cabin Service Truck Diesel 20 210 0.53 B737-700 Catering Truck Diesel 15 210 0.53 B737-700 Hydrant Truck Diesel 12 235 0.7 B737-700 Lavatory Truck Diesel 15 56 0.25 B737-700 Service Truck Diesel 15 235 0.2 B737-700 Water Service Electric 12 0 0.2 B767-300 Air Conditioner Electric 30 0 0.75 B767-300 Air Start Diesel 7 850 0.9 B767-300 Aircraft Tractor Diesel 8 475 0.8 B767-300 Baggage Tractor Gasoline 120 107 0.55 B767-300 Belt Loader Gasoline 35 107 0.5

Appendix A – Baseline Ground Support Equipment Profile by Aircraft Model (Continued)
A-2
Aircraft Associated Ground Support Equipment Fuel
Minutes /LTO
Horse Power
Load Factor
B767-300 Cabin Service Truck Diesel 35 210 0.53 B767-300 Cargo Loader Diesel 80 80 0.5 B767-300 Catering Truck Diesel 20 210 0.53 B767-300 Hydrant Truck Diesel 20 235 0.7 B767-300 Lavatory Truck Diesel 25 235 0.25 B767-300 Service Truck Diesel 15 235 0.2 B767-300 Water Service Electric 12 0 0.2 Canadair Reg-700 Aircraft Tractor Diesel 5 86 0.8 Canadair Reg-700 Baggage Tractor Gasoline 35 107 0.55 Canadair Reg-700 Belt Loader Gasoline 30 107 0.5 Canadair Reg-700 Catering Truck Diesel 10 71 0.53 Canadair Reg-700 Fuel Truck Diesel 20 175 0.25 Canadair Reg-700 Lavatory Truck Gasoline 15 97 0.25 Canadair Reg-700 Service Truck Diesel 15 235 0.2 Cessna 208 Caravan Fuel Truck Diesel 10 175 0.25 Cessna 208 Caravan Ground Power Unit Diesel 40 71 0.75 CL600 Aircraft Tractor Diesel 5 86 0.8 CL600 Baggage Tractor Gasoline 35 107 0.55 CL600 Belt Loader Gasoline 30 107 0.5 CL600 Catering Truck Diesel 10 71 0.53 CL600 Fuel Truck Diesel 20 175 0.25 CL600 Ground Power Unit Diesel 50 194 0.75 CL600 Lavatory Truck Gasoline 15 97 0.25 CL600 Service Truck Diesel 15 235 0.2 CL601-3A Aircraft Tractor Diesel 5 86 0.8 CL601-3A Baggage Tractor Gasoline 35 107 0.55 CL601-3A Belt Loader Gasoline 30 107 0.5 CL601-3A Catering Truck Diesel 10 71 0.53 CL601-3A Fuel Truck Diesel 20 175 0.25 CL601-3A Ground Power Unit Diesel 50 194 0.75 CL601-3A Lavatory Truck Gasoline 15 97 0.25 CL601-3A Service Truck Diesel 15 235 0.2 CL604 Aircraft Tractor Diesel 5 86 0.8 CL604 Baggage Tractor Gasoline 35 107 0.55 CL604 Belt Loader Gasoline 30 107 0.5 CL604 Catering Truck Diesel 10 71 0.53 CL604 Fuel Truck Diesel 20 175 0.25 CL604 Ground Power Unit Diesel 50 194 0.75 CL604 Lavatory Truck Gasoline 15 97 0.25 CL604 Service Truck Diesel 15 235 0.2

Appendix A – Baseline Ground Support Equipment Profile by Aircraft Model (Continued)
A-3
Aircraft Associated Ground Support Equipment Fuel
Minutes /LTO
Horse Power
Load Factor
DC9-30 Air Conditioner Electric 30 0 0.75 DC9-30 Air Start Diesel 7 425 0.9 DC9-30 Aircraft Tractor Diesel 8 88 0.8 DC9-30 Baggage Tractor Gasoline 75 107 0.55 DC9-30 Belt Loader Gasoline 48 107 0.5 DC9-30 Cabin Service Truck Diesel 20 210 0.53 DC9-30 Catering Truck Diesel 15 210 0.53 DC9-30 Hydrant Truck Diesel 12 235 0.7 DC9-30 Lavatory Truck Diesel 15 56 0.25 DC9-30 Service Truck Diesel 15 235 0.2 DC9-30 Water Service Electric 12 0 0.2 Embraer ERJ 135/140 Aircraft Tractor Diesel 5 86 0.8 Embraer ERJ 135/140 Baggage Tractor Gasoline 35 107 0.55 Embraer ERJ 135/140 Belt Loader Gasoline 30 107 0.5 Embraer ERJ 135/140 Catering Truck Diesel 10 71 0.53 Embraer ERJ 135/140 Fuel Truck Diesel 20 175 0.25 Embraer ERJ 135/140 Ground Power Unit Diesel 40 71 0.75 Embraer ERJ 135/140 Lavatory Truck Diesel 15 56 0.25 Embraer ERJ 135/140 Service Truck Diesel 15 235 0.2 Embraer ERJ 145 Aircraft Tractor Diesel 5 86 0.8 Embraer ERJ 145 Baggage Tractor Gasoline 35 107 0.55 Embraer ERJ 145 Belt Loader Gasoline 30 107 0.5 Embraer ERJ 145 Catering Truck Diesel 10 71 0.53
Embraer ERJ 145 Fuel Truck Diesel 20 175 0.25 Embraer ERJ 145 Lavatory Truck Diesel 15 56 0.25 Embraer ERJ 145 Service Truck Diesel 15 235 0.2 Learjet 25B Fuel Truck Diesel 20 175 0.25 Learjet 25B Ground Power Unit Gasoline 40 107 0.75 Learjet 35/36 Fuel Truck Diesel 20 175 0.25 Learjet 35/36 Ground Power Unit Gasoline 40 107 0.75 MD-80 Air Conditioner Electric 30 0 0.75 MD-80 Air Start Diesel 7 425 0.9 MD-80 Aircraft Tractor Diesel 8 88 0.8 MD-80 Baggage Tractor Gasoline 75 107 0.55 MD-80 Belt Loader Diesel 48 71 0.5 MD-80 Cabin Service Truck Diesel 20 210 0.53 MD-80 Catering Truck Diesel 15 210 0.53 MD-80 Hydrant Truck Diesel 12 235 0.7 MD-80 Lavatory Truck Diesel 15 56 0.25

Appendix A – Baseline Ground Support Equipment Profile by Aircraft Model (Continued)
A-4
Aircraft Associated Ground Support Equipment Fuel
Minutes /LTO
Horse Power
Load Factor
MD-80 Service Truck Diesel 15 235 0.2 MD-80 Water Service Electric 12 0 0.2 MD-80-81 Air Conditioner Electric 30 0 0.75 MD-80-81 Air Start Diesel 7 425 0.9 MD-80-81 Aircraft Tractor Diesel 8 88 0.8 MD-80-81 Baggage Tractor Gasoline 75 107 0.55 MD-80-81 Belt Loader Diesel 48 71 0.5 MD-80-81 Cabin Service Truck Diesel 20 210 0.53 MD-80-81 Catering Truck Diesel 15 210 0.53 MD-80-81 Hydrant Truck Diesel 12 235 0.7 MD-80-81 Lavatory Truck Diesel 15 56 0.25 MD-80-81 Service Truck Diesel 15 235 0.2 MD-80-81 Water Service Electric 12 0 0.2 MD-80-83 Air Conditioner Electric 30 0 0.75 MD-80-83 Air Start Diesel 7 425 0.9 MD-80-83 Aircraft Tractor Diesel 8 88 0.8 MD-80-83 Baggage Tractor Gasoline 75 107 0.55 MD-80-83 Belt Loader Diesel 48 71 0.5 MD-80-83 Cabin Service Truck Diesel 20 210 0.53 MD-80-83 Catering Truck Diesel 15 210 0.53 MD-80-83 Hydrant Truck Diesel 12 235 0.7 MD-80-83 Lavatory Truck Diesel 15 56 0.25 MD-80-83 Service Truck Diesel 15 235 0.2 MD-80-83 Water Service Electric 12 0 0.2 MD-80-83 Air Conditioner Electric 30 0 0.75 MD-80-83 Air Start Diesel 7 425 0.9 MD-80-83 Aircraft Tractor Diesel 8 88 0.8 MD-80-83 Baggage Tractor Gasoline 75 107 0.55 MD-80-83 Belt Loader Diesel 48 71 0.5 MD-80-83 Cabin Service Truck Diesel 20 210 0.53 MD-80-83 Catering Truck Diesel 15 210 0.53 MD-80-83 Hydrant Truck Diesel 12 235 0.7 MD-80-83 Lavatory Truck Diesel 15 56 0.25 MD-80-83 Service Truck Diesel 15 235 0.2 MD-80-83 Water Service Electric 12 0 0.2 Swearingen Merlin Aircraft Tractor Diesel 5 86 0.8 Swearingen Merlin Baggage Tractor Gasoline 35 107 0.55 Swearingen Merlin Belt Loader Gasoline 30 107 0.5 Swearingen Merlin Cabin Service Truck Diesel 10 71 0.53

Appendix A – Baseline Ground Support Equipment Profile by Aircraft Model (Continued)
A-5
Aircraft Associated Ground Support Equipment Fuel
Minutes /LTO
Horse Power
Load Factor
Swearingen Merlin Fuel Truck Diesel 20 175 0.25 Swearingen Merlin Ground Power Unit Diesel 40 71 0.75 Swearingen Merlin Service Truck Diesel 15 235 0.2
Appendix B
ACTUAL 2005 GROUND SUPPORT EQUIPMENT PROFILE BY AIRCRAFT MODEL

B-1
Airline Ground Support
Equipment Fuel Horsepower Load
Factor
Total Time
(Hours) Equipment Population
Year of Manufacture
American Air Start Diesel 425 0.9 10 1 1990 American Aircraft Tractor Diesel 86 0.8 140 1 1998 American Baggage Tractor Diesel 107 0.55 480 1 1998 American Belt Loader Diesel 71 0.5 480 1 2000 American Cabin Service Truck Diesel 210 0.53 480 1 2001 Signature Fuel Truck Diesel 175 0.25 600 1 2002 American Ground Power Unit Diesel 71 0.75 10 1 1995 American De-Icing Truck Diesel 175 0.1 48 1 2005 American Lavatory Truck Diesel 56 0.25 480 1 2000 Continental Aircraft Tractor Diesel 86 0.8 70 1 2000 Continental Baggage Tractor Diesel 107 0.55 480 2 2005 Continental Belt Loader Gasoline 107 0.5 400 1 1999 Continental Catering Truck Diesel 71 0.53 70 1 2004 Signature Fuel Truck Diesel 175 0.25 120 1 1999 Continental Ground Power Unit Diesel 71 0.75 10 1 1995 Continental De-Icing Truck Diesel 175 0.1 48 1 2003 Continental Lavatory Truck Diesel 56 0.25 480 1 2002 General Aviation Air Start Diesel 425 0.9 240 7 1995 General Aviation Aircraft Tractor Diesel 86 0.8 140 7 2000 General Aviation Baggage Tractor Propane 107 0.55 800 5 2005 General Aviation Baggage Tractor Diesel 107 0.5 800 2 1995 General Aviation Fuel Truck Diesel 175 0.25 1060 12 1999 General Aviation Ground Power Unit Diesel 194 0.75 343 5 2000 General Aviation Ground Power Unit Gasoline 107 0.75 500 2 1995 Signature Lavatory Truck Gasoline 97 0.25 103 1 2000 Signature De-Icing Truck Diesel 175 0.1 48 1 2004 General Aviation Service Truck Diesel 235 0.2 480 4 2000 Southwest Air Start Diesel 425 0.9 10 2 2000 Southwest Air Start Diesel 850 0.9 10 2 2000 Southwest Aircraft Tractor Diesel 475 0.8 53 4 1997 Southwest Baggage Tractor Diesel 107 0.55 600 3 1995 Southwest De-Icing Truck Diesel 175 0.1 48 1 2005

Attachment B
Aircraft and Ground Support Equipment Emissions Update for Airports in the Dallas-Fort
Worth (DFW) Region
Prepared for:
The Texas Commission on Environmental Quality (TCEQ) in Identifying Emission Credits through Aviation Control Measures to Aid in the Environmental
Protection Agency’s (EPA) Approval Process of the DFW Eight Hour State Implementation Plan (SIP)
Prepared by:
Christopher Klaus, Madhusudhan Venugopal, Sun-Kyoung (Helena) Park Transportation Department
North Central Texas Council of Governments 616 Six Flags Drive P.O. Box 5888 Arlington TX 76005 -5888
And
Peter Ogbeide Texas Commission on Environmental Quality
12100 Park 35 Circle, Building E, Austin, TX 78753 Phone: 512-239-1937, Fax: 512-239-1515
February 25, 2008
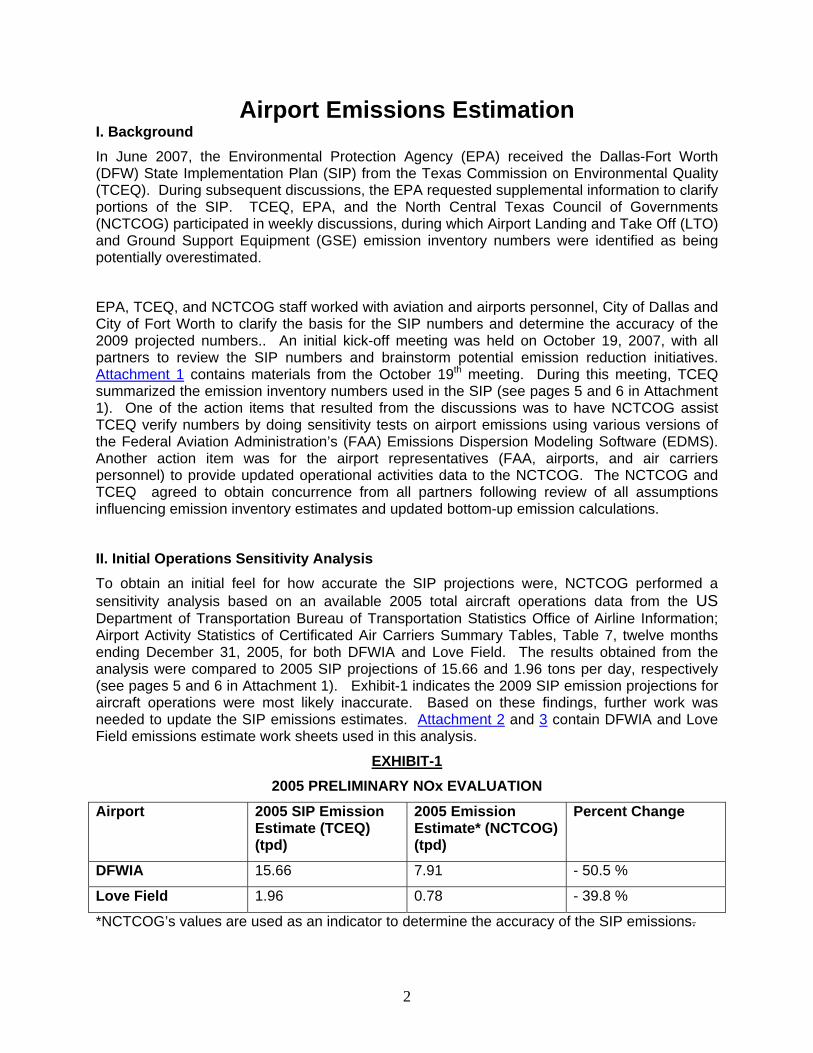
Airport Emissions Estimation I. Background In June 2007, the Environmental Protection Agency (EPA) received the Dallas-Fort Worth (DFW) State Implementation Plan (SIP) from the Texas Commission on Environmental Quality (TCEQ). During subsequent discussions, the EPA requested supplemental information to clarify portions of the SIP. TCEQ, EPA, and the North Central Texas Council of Governments (NCTCOG) participated in weekly discussions, during which Airport Landing and Take Off (LTO) and Ground Support Equipment (GSE) emission inventory numbers were identified as being potentially overestimated.
EPA, TCEQ, and NCTCOG staff worked with aviation and airports personnel, City of Dallas and City of Fort Worth to clarify the basis for the SIP numbers and determine the accuracy of the 2009 projected numbers.. An initial kick-off meeting was held on October 19, 2007, with all partners to review the SIP numbers and brainstorm potential emission reduction initiatives. Attachment 1 contains materials from the October 19th meeting. During this meeting, TCEQ summarized the emission inventory numbers used in the SIP (see pages 5 and 6 in Attachment 1). One of the action items that resulted from the discussions was to have NCTCOG assist TCEQ verify numbers by doing sensitivity tests on airport emissions using various versions of the Federal Aviation Administration’s (FAA) Emissions Dispersion Modeling Software (EDMS). Another action item was for the airport representatives (FAA, airports, and air carriers personnel) to provide updated operational activities data to the NCTCOG. The NCTCOG and TCEQ agreed to obtain concurrence from all partners following review of all assumptions influencing emission inventory estimates and updated bottom-up emission calculations.
II. Initial Operations Sensitivity Analysis To obtain an initial feel for how accurate the SIP projections were, NCTCOG performed a sensitivity analysis based on an available 2005 total aircraft operations data from the US Department of Transportation Bureau of Transportation Statistics Office of Airline Information; Airport Activity Statistics of Certificated Air Carriers Summary Tables, Table 7, twelve months ending December 31, 2005, for both DFWIA and Love Field. The results obtained from the analysis were compared to 2005 SIP projections of 15.66 and 1.96 tons per day, respectively (see pages 5 and 6 in Attachment 1). Exhibit-1 indicates the 2009 SIP emission projections for aircraft operations were most likely inaccurate. Based on these findings, further work was needed to update the SIP emissions estimates. Attachment 2 and 3 contain DFWIA and Love Field emissions estimate work sheets used in this analysis.
EXHIBIT-1 2005 PRELIMINARY NOx EVALUATION
Airport 2005 SIP Emission Estimate (TCEQ) (tpd)
2005 Emission Estimate* (NCTCOG) (tpd)
Percent Change
DFWIA 15.66 7.91 - 50.5 %
Love Field 1.96 0.78 - 39.8 %
*NCTCOG’s values are used as an indicator to determine the accuracy of the SIP emissions.
2

III. EDMS Emission Sensitivity A parallel analysis was conducted to test output variances between different versions of FAA’s EDMS aircraft emission model. This was important as the DFWIA used the latest version of EDMS (i.e. version 5.02) to calculate emissions estimates used in this report; while, an existing emission inventory for Dallas Love Field was based on EDMS version 4.5, the latest model available at the time their 2005 emissions inventory was prepared.
FAA’s EDMS5.02 modeling improvements include:
Over 220 new aircraft
Over 65 new engines
Multiple scenarios, airports, and years all in one study
Harmonized emissions inventories and dispersion analyses
New dynamic aircraft performance-based modeling
New sequencing modeling for taxi times
New capability to use hourly weather data in emission inventories
More precise aircraft delay and sequencing capabilities by operational profiles in 15-minute bins
Improved EDMS menu architecture
The Airport Emissions Reduction Credit (AERC) report is now integrated into EDMS
Taxiway usage is now computed automatically
Import and Export features are enhanced and available under the FILE menu
Runway queues are now computed dynamically by the sequencing model
In order to validate emission estimates from DFWIA and Dallas Love Field inventories, a sensitivity test was performed to identify emission changes due to different model versions, EDMS4.1, EDMS4.5, and EDMS5.02. Exhibit-2 shows emissions for Oxide of Nitrogen (NOx) and Volatile Organic Compound (VOC) emissions for different aircraft and engine types for a unit Landing and Take-off (LTO). EDMS5.02 shows an increase in NOx emissions for most of the sample aircraft combinations. To be conservative, NCTCOG decided to use EDMS5.02 for updating the DFW airport emissions.
3
EXHIBIT-1 NOx AND VOC SENSITIVITY TEST ON EDMS MODEL VERSIONS
Sample Aircraft /Engine Combinations
NOx (lbs/LTO)
VOC (lbs/LTO)
Aircraft Engine EDMS 4.1
EDMS 4.5
EDMS 5.02
EDMS 4.1
EDMS 4.5
EDMS 5.02
Boeing 717-200 BR700-715A1-30 12.854 14.145 16.777 0.158 0.161 0.304Boeing 737-300 CFM56-3-B1 11.530 11.160 12.978 2.027 2.026 3.883Boeing 737-800 CFM56-7B26 21.090 22.051 28.034 1.736 1.737 3.294Boeing 757-200 PW2037 28.456 27.763 22.924 2.303 2.304 4.412Boeing 767-300 CF6-80A2 46.154 46.460 52.367 7.978 7.976 15.12Embraer-140 AE3007A1/3 4.296 5.269 7.352 1.467 1.453 2.79Embraer-145 AE3007A 4.948 6.054 7.904 1.057 1.054 2.028MD-80's JR8D-219 18.906 17.663 17.736 NA NA 8.396SAAB-FAURCHD 340/B
CT7-5 1.236 1.140 2.339 0.598 0.571 1.199
Note: Emission factors vary by airport, time-in mode, aircraft and engine type.
However, based on the aircraft type and engine configuration at Dallas Love Field, and the fact the emission results between the two models is minimal (see Exhibit-2), and the limited time, it was not necessary to recalculate Dallas Love Field emissions using EDMS5.02.
EXHIBIT-2
DALLAS LOVE FIELD EMISSIONS COMPARISON USING EDMS4.5 AND EDMS5.02
Based on (ERG, 2007) (tons/day) for 2005
Emission Change (tons/day) Model Version
VOC NOx VOC NOx
EDMS4.5 0.12 0.75
EDMS5.02 0.23 0.71 0.11 -0.03
IV. Dallas Love Field Aircraft and Ground Support Equipment (GSE) NOx Emission Estimates The Dallas Love Field 2005 emissions inventory, prepared by ERG (“2005 Emissions Inventory, Love Field Airport”, Aviation Department Environmental Affairs Group, May 30, 2007), was based on local data. Adjusted forecasted 2009 aircraft emissions were calculated using an annual growth of 3.64 percent from 2005 to 2009 (prorated from 18.2 percent growth between 2005 and 2010 as shown in Table 6-1 of the ERG report). NCTCOG verified the growth rate of LTOs based on data obtained from Dallas Love Field airport traffic statistics as shown in Exhibit-3.
4

EXHIBIT-3 DAL AIRCRAFT NOx EMISSIONS PROJECTIONS
Year 2005* 2005** 2006** 2007** 2009*
Love Field LTOs 43,033 39,511 43,444 45,631 49,299
% Growth 9.95% 5.03% 14.6%
Love Field Emissions (TPD) 0.690 0.634 0.697 0.732 0.790 *ERG, 2005 Emission Inventory Love Field Airport, Aviation Department, Environmental Affairs Group, May 30, 2007 (Table 6-1, page 6-1 and Table 7-1, page 7-1) based on Local data.
** LTOs for 2005, 2006 and 2007 were obtained from Dallas Love Field airport traffic statistics http://www.dallas-lovefield.com/lovenotes/statistics.html
In response to information requested from air carriers at the October meeting, NCTCOG received a letter from Southwest Airlines, dated November 9, 2007, Attachment 4, identifying specific operational characteristics used for consideration in developing the 2005 Dallas love Field airport emissions estimates.
Ground Support Equipment (GSE) emissions for 2009 were based on Dallas Love Field 2009 projected LTOs as calculated by EDMS4.5. Exhibit-4 shows 2005 and 2009 GSE emissions as calculated by EDMS4.5 as a function of LTOs.
EXHIBIT-4
DALLAS LOVE FIELD GSE NOx EMISSIONS PROJECTIONS
Airport 2005 GSE Emissions (TPD)
2009 Projected GSE Emissions (TPD)
Love Field 0.0122* 0.015 *ERG, 2005 Emission Inventory Love Field Airport, Aviation Department, Environmental Affairs Group, May 30, 2007, Table 5-4, Page 5-17
Following these Dallas Love Field airport aviation and GSE emissions investigations, NCTCOG forwarded results, summarized above, to appropriate partners for review. Attachment 5 contains correspondence from Southwest Airlines concurring with adjusted 2009 emission projections attributable to Southwest Airlines Co., as prepared by the North Central Texas Council of Governments.
V. Dallas Fort Worth International Airport Aircraft and GSE NOx Emission Estimates Similar to past efforts, NCTCOG worked directly with DFWIA in determining 2005 and projected 2009 emissions from aircraft and GSE. For 2005, emissions are based on LTOs as recorded by
5

DFW operations and a derived fleet mix based on local TRACON data recorded by DFW’s noise compatibility office. Important factors/parameters used to model 2005 emissions include:
APU emissions are based on EDMS model defaults (26 minutes)
Taxi-in and Taxi-out times are based on EDMS model defaults (26 minutes)
GSE selected for aircraft types are based on EDMS model defaults
High NOx engine configuration used for all aircraft representing >0.5% of fleet mix (95.5% of ops)
NOx emissions for 2009 were then estimated based on DFWIA’s 2005 activity information and an annual growth rate obtained from FAA’s report “Terminal Area Forecast Summary 2006-2025”. DFWIA TAF operations are shown in Exhibit-5.
EXHIBIT-5
Airport Operations at the Top 5 Operational Evolution Plan (OEP) Airports (In Thousand)
Loc 2005* Airport Ranking
ID Reg AIRPORT NAME 2005 Percent 2006 2010 2025 2005 2025
ATL ASO HARTSFIELD-JACKSON ATLANTA INTL 984 0.84 963 1091 1462 1 1
ORD AGL CHICAGO OHARE INTL P 980 0.84 962 1046 1398 2 2
DFW ASW DALLAS/FORT WORTH INTERNATIONAL 740 0.63 704 773 1051 3 4
LAX AWP LOS ANGELES INTL 654 0.56 653 753 1153 4 3
LAS AWP MC CARRAN INTL 605 0.52 619 687 1020 5 5 Source: Terminal Area Forecast Summary 2006-2025 *Percent of total US operations. Note: LTO= Total Airport Operations/2
NCTCOG also looked at traffic statistics data from DFWIA website to ensure the growth trend. NCTCOG recommends using initial 2009 LTOs (391,371) estimated using “TAF Summary
6

2006-2025” report; this number is a conservative estimate that will allow for DFWIA to accommodate projected growth between now and 2009.
The 2009 GSE emissions estimates for DFWIA were projected as a function of LTOs using 2005 emissions estimates as baseline. The 2005 and 2009 aircraft and GSE emissions are shown in Exhibit-6 and Exhibit-7 respectively. The fleet mix used to calculate 2005 aircraft and GSE emissions are shown in the Exhibit-8.
7

EXHIBIT-6 DFWIA AIRCRAFT NOx EMISSIONS PROJECTIONS
Year 2005* 2005** 2006** 2009#
DFW (LTOs) 356,440 355,939 351,276 391,371
% Growth -1.31% 9.80%
DFW Emissions (TPD) 10.20 10.19 10.05 11.20
* 2005 emissions were calculated based on LTOs provided by DFWIA
** The LTOs for 2005 and 2006 in these columns were obtained from DFW airport traffic statistics http://www.dfwairport.com/stats/
#2009 LTOs were projected based on the FAA's report "Terminal Area Forecast Summary 2006-2025". The annual growth rate between 2006 and 2010 is estimated to be 2.45 %. So a 2.45% growth rate per year was applied to estimate 2009 LTOs http://www.faa.gov/data_statistics/aviation/taf_reports/media/TAF2006-2025Summary.pdf
EXHIBIT-7
DFWIA GROUND SUPPORT EQUIPMENT NOx EMISSIONS PROJECTIONS
Airport 2005 GSE Emissions (TPD)
2009 Projected Emissions (TPD)
DFW Airport 1.3 1.43
Following its DFWIA aviation and GSE emissions investigations, NCTCOG forwarded results, summarized above, to American Airline and DFWIA for review. Attachment 6 contains correspondence from DFWIA supporting the final emission inventory adjustments.
8

EXHIBIT-8
DFWIA 2005 AIRCRAFT FLEET MIX Aircraft ID AIRCRAFT TYPE % of Fleet LTO Cycles MD82 Boeing MD-82 30.286% 107,953 E145 Embraer 145 Regional Jet 14.520% 51,755 B752 Boeing 757-200 7.471% 26,629 MD83 Boeing MD-83 7.120% 25,378 E135 Embraer ERJ-135 6.884% 24,539 B738 Boeing 737-800 6.025% 21,477 SF34 Saab 340 4.662% 16,615 CRJ7 Canadair Regional Jet 7 2.357% 8,401 B733 Boeing 737-300 2.284% 8,142 B763 Boeing 767-300 1.763% 6,283 A319 Airbus 319 1.562% 5,569 B712 Boeing 717-200 1.516% 5,402 CRJ2 Canadair Regional Jet 2 1.123% 4,001 E170 Embraer ERJ-170 1.082% 3,858 B735 Boeing 737-500 0.966% 3,442 B772 Boeing 777-200 0.951% 3,391 MD80 Boeing MD-80 0.607% 2,162 B190 Beech 1900 0.497% 1,771 DC93 Douglas DC9-30 0.482% 1,717 B737 Boeing 737 (all series) 0.454% 1,620 MD90 Boeing MD-90 0.441% 1,572 C208 Cessna 208 Caravan 0.423% 1,507 A306 Airbus 300B-600 0.401% 1,429 E120 Embraer EMB-120 Brasilia (VC-97) 0.318% 1,134 B744 Boeing 747-400 0.289% 1,030 B722 Boeing 727-200 0.258% 918 A320 Airbus 320 0.257% 916 MD11 Boeing MD-11 0.256% 911 MD10 Boeing MD-10 0.253% 903 Helicopter 0.226% 804 B72Q Boeing 727 (hushkit) 0.192% 685 RJ85 RJ-85 Avroliner 0.191% 679 CRJ9 Canadair Regional Jet 9 0.181% 644 B732 Boeing 737-200 0.170% 606 A318 Airbus 318 0.162% 577 B762 Boeing 767-200 0.152% 542 SW3 Swearingen SA-226 Merlin 3 0.146% 522 A30B Airbus 300B-100/200 0.142% 506 E45X Embraer EMB-145XR (Twin-jet0 0.138% 493
9

DC8Q Douglas DC-8 (hushkit) 0.135% 481 MD87 Boeing MD-87 0.127% 453 PA31 Piper Navajo/Mohave 0.125% 447 B734 Boeing 737-400 0.114% 405 C560 Cessna Citation V 0.108% 384 DC87 Douglas DC8-70 0.107% 383 B742 Boeing 747-200 0.093% 332 L101 Lockheed 1011 Tri-Star 0.090% 320 A343 Airbus 340-300 0.087% 310 MD88 Boeing MD-88 0.082% 293 SW4A Merlin 4 0.078% 280 H25B Raytheon Hawkwr 800 0.078% 279 A310 Airbus 310 0.077% 273 C550 Cessna Citation II/S/2 0.058% 206 C172 Cessna 172 0.056% 198 DC10 Douglas DC10 0.056% 198 LJ35 LEARJET 35 0.051% 182 DC95 Douglas DC9-50 0.050% 178 CL60 Canadair CL-600 Challenger 0.049% 176 BE40 Beech 400 Beechjet 0.049% 174 DC94 Douglas DC9-40 0.042% 151 LJ60 LEARJET 60 0.042% 150 B741 Boeing 747-100 0.039% 140 C402 Cessna 402 0.039% 138 BE9L King Air 90/90A-90E 0.038% 136 BE20 Beech Super King Air 200/1300 0.038% 134 LJ45 LEARJET 45 0.038% 134 P28A Piper Arrow 0.038% 134 GLF4 Gulfstream 4 0.036% 129 C650 Cessna Citation III/6/7 0.034% 123 C525 Cessna Citation C525 0.031% 110 MU2 Mitsubishi MU-2 0.030% 106 C401 Cessna 401 0.026% 91 GLF3 Gulfstream 3 0.025% 89 LJ31 LEARJET 31 0.024% 87 C750 Cessna Citation X 0.023% 82 BE36 Bonanza 36 0.021% 76 BE55 Beech: Baron 55/Chochise 0.021% 75 FA20 Dassault Falcon 20 0.021% 74 PA32 Piper Lance 0.020% 70 B350 King Air 350 0.019% 69 C310 Cessna 310 0.019% 68 LJ25 LEARJET 25 0.019% 67
10

C210 Cessna Centurion 0.019% 66 PA28 Piper Cherokee 0.018% 65 BE35 Bonanza 35 0.018% 63 FA50 Dassault Falcon 50 0.017% 62 WW24 IAI 1124 Westwind 0.017% 61 C182 Cessna 182 0.017% 59 BE10 Beech 100 King Air 0.016% 58 MD81 Boeing MD-81 0.016% 58 PA34 Piper Seneca 0.016% 57 BE58 Beech: Baron 58 Foxstar 0.015% 55 BE99 Beech: Airliner 99 0.015% 55 F2TH Dassault Falcon 2000 0.015% 54 C421 Cessna 421 Golden Eagle 0.014% 50 FA10 Dassault Falcon 10 0.014% 50 B753 Boeing 757-300 0.013% 46 A333 Airbus 330 - 300 0.012% 42 C414 Cessna 414 0.011% 40 F900 Dassault Falcon 900 0.011% 39 LJ55 LEARJET 55 0.010% 37 C340 Cessna 340 0.010% 35 CRJ1 Canadair Regional Jet 1 0.010% 35 BE90 Beech King Air 0.010% 34 CL30 Canadair Challenger 300 0.010% 34 BE30 Beech Super King Air 300/300L 0.009% 33 C501 Cessna Citation 1/SP 0.009% 33 GALX C5 Galaxy 0.009% 31 C150 Cessna 150 0.008% 29 C441 Cessna 441 Conquest / Conquest 2 0.008% 29 PA60 Piper Aerostar 0.008% 27 B767 Boeing 767 0.007% 25 GLF5 Gulfstream 5 0.007% 25 SR22 Cirrus SR-22 0.007% 25 B757 Boeing 757 0.007% 24 DC86 Douglas DC8-60 0.007% 24 MU30 Mitsubishi MU-300 Diamond 0.007% 24 BE33 Beech Bonanza 33 Debonair (E-24) 0.006% 21 PA46 Piper Malibu 0.006% 20 PAY2 Piper Cheyenne 2 0.006% 20 AEST Aerostar 0.005% 19 C425 Cessna 425 Corsair / Conquest I-425 0.005% 17
TOTAL 356,440 Source: DFWIA
11

VI. Aircraft and GSE NOx Emission Summary Through successive meetings with air carriers and each airport, aviation control measures that could yield emission benefits were identified. Exhibit-9 summarizes the status of these control measures by airport.
EXHIBIT-9 DALLAS FORT WORTH 8-HOUR STATE IMPLEMENTATION PLAN
AVIATION CONTROL MEASURES
Parameters Dallas
Love Field
Dallas-Fort Worth
International Comments
Landings and take Offs (LTO's) data/Emissions
Corrections
Included in the ERG inventory
Included in emission calculation
GSE Electrification Included in the ERG inventory
Not included in emission
estimation
Decreased aircraft taxi times Included in the ERG inventory
Not included in emission
estimation
Percentage of engine thrust upon take-off
No approved method for calculating
benefits
No approved method for calculating
benefits
Not considered in this analysis
Gate electrification Included in the ERG inventory
Not included in emission
estimation
Fleet turnover Included in the ERG inventory
Not included in emission
estimation
Total NOx emissions from all DFW airports have been adjusted from 24.05 tpd (21.01 tpd from aircraft emissions and 3.04 tpd from GSE emissions) as documented in the SIP inventory to 13.72 tpd (12.25 tpd from aircraft emissions and 1.46 tpd from GSE emissions) resulting in an emission benefit of 10.34 tpd. Exhibit-10 summarizes the benefits from all airports in the DFW nonattainment area. Due to the negligible emission estimates from municipal airports, it was decided not to calculate adjustments from these airports. The decrease in the NOx emissions identified during this process can be attributed to:
Decreased LTOs from 2002 to 2005
Observed LTO data from DFWIA
Update aircraft fleet-mix data
Gate electrification
GSE and aircraft fleet turn-over
Reduced time for taxi-in and taxi-out
Electrification of GSE
12

Updated version of the EDMS model
EXHIBIT-10
DFWIA AND DALLAS LOVE FIELD AIRCRAFT AND GSE FINAL EMISSIONS SUMMARY
Dallas Love Field DFW International
Others Total NOX Inventory Description
tpd tpd tpd tpd
2009 Aircraft SIP Emissions 2.210 18.540 0.260 21.010
2009 GSE SIP Emissions 0.434 2.588 0.018 3.040
Total Airport SIP Emissions 2.644 21.128 0.278 24.050
2009 Aircraft Emissions Adjustment
0.790 11.200 0.260 12.250
2009 GSE Emissions Adjustment 0.015 1.430 0.018 1.463
Total Airport Adjustment 0.805 12.630 0.278 13.713
Emission Reductions 1.839 8.498 0.000 10.337
VMEP Emissions Reductions included in the Inventory
0.190 0.760 0.000 -0.950
9.387
Total airport Emissions Adjustments
9.39 tpd
13

14
VII. Conclusions After careful review and evaluation, TCEQ and NCTCOG determined that an emission inventory adjustment of 9.39 tons/day of NOx can be made as a result of more precise and updated data related to the inventory work of emissions sources found at DFWIA and the Dallas Love Field airports.

Attachment B.1
Aircraft Emissions Meeting - North Central Texas Council of Governments Attachment B.1 contains materials from the October 19, 2007, kick-off meeting among EPA, TCEQ, NCTCOG staff, aviation and airports personnel, the City of Dallas, and the City of Fort Worth to clarify emissions inventory numbers used to develop the DFW SIP, and to determine the accuracy of the 2009 projected emissions inventory numbers. All documents are available at: ftp://ftp.nctcog.org/Outgoing/Airport/Attach.1.Aircraft%20Emissions%20Meeting_101907.pdf

Attachment B.2 DFWIA -- AircraftAircraft LTOs* LTOs* VOC NOx VOC (lbs) NOx (lbs) VOC (lbs) NOx (lbs)
1999 (DFWIA) 2005 (DFWIA) Emissions (lbs/LTO) 1999 (DFWIA) 2005 (DFWIA)A300-600/R/CF/RCF 95 1408 2.145 44.324 203.8 4,210.8 3,020.2 62,408.2
A300B 418 2.465 46.507 - - 1,030.4 19,439.9 A310-200C/F 104 266 7.91 37.606 822.6 3,911.0 2,104.1 10,003.2
A318 340 4.246 17.937 - - 1,443.6 6,098.6 A319 768 5092 4.383 14.62 3,366.1 11,228.2 22,318.2 74,445.0
A320-100/200 330 821 0.148 19.094 48.8 6,301.0 121.5 15,676.2 A321 1 3.404 29.632 - - 3.4 29.6
ATR-72 17186 0 0 5.589 - 96,052.6 - - Avroliner RJ85 148 681 3.294 9.279 487.5 1,373.3 2,243.2 6,319.0
Beech 18 (Beech King Air 100) 3 0 0.139 0.904 0.4 2.7 - - Beech 1900 A/B/C 1823 4.495 1.254 - - 8,194.4 2,286.0
B707-300C 26 0 240.99 21.799 6,265.7 566.8 - - B717-200 5371 0.108 18.808 - - 580.1 101,017.8 B727-100 578 228 5.21 20.906 3,011.4 12,083.7 1,187.9 4,766.6
B727-100C/QC 822 0 5.086 20.397 4,180.7 16,766.3 - - B727-200 32379 1060 3.073 27.359 99,500.7 885,857.1 3,257.4 29,000.5
B737-100/200 8061 615 2.317 12.67 18,677.3 102,132.9 1,425.0 7,792.1 B737-200C 22 9 1.991 14.343 43.8 315.5 17.9 129.1 B737-300 7160 8137 2.026 11.16 14,506.2 79,905.6 16,485.6 90,808.9 B737-400 793 380 1.631 12.99 1,293.4 10,301.1 619.8 4,936.2 B737-500 4051 3458 1.389 15.898 5,626.8 64,402.8 4,803.2 54,975.3
B737-700/LR 1568 2.099 15.895 - - 3,291.2 24,923.4 B737-800 526 21499 1.737 22.051 913.7 11,598.8 37,343.8 474,074.4 B737-900 4 1.737 22.051 - - 6.9 88.2 B747-100 54 137 119.063 113.538 6,429.4 6,131.1 16,311.6 15,554.7
B747-200/300 33 311 44.791 113.999 1,478.1 3,762.0 13,930.0 35,453.7 B747F (B747-100F) 1 1 119.063 113.538 119.1 113.5 119.1 113.5
B757-200 28255 26512 2.304 27.763 65,099.5 784,443.6 61,083.6 736,052.7 B757-300 31 2.07 35.303 - - 64.2 1,094.4
B767-200/ER 1632 527 7.976 46.46 13,016.8 75,822.7 4,203.4 24,484.4 B767-300/ER 7413 6224 2.901 51.952 21,505.1 385,120.2 18,055.8 323,349.2 B767-400ER 12 2.383 45.704 - - 28.6 548.4
B777 (B777-200) 872 2770 5.776 78.659 5,036.7 68,590.6 15,999.5 217,885.4 Canadair Reg-100 32 1.72 3.748 - - 55.0 119.9 Canadair Reg-700 8411 0.057 7.322 - - 479.4 61,585.3 Canadair Reg-900 449 0.082 7.602 - - 36.8 3,413.3
Cessna 208 Caravan 26 0 0.079 0.428 2.1 11.1 - - Convair CV-580 2 9.7 1.052 - - 19.4 2.1
Convair CV-600 (Convair Liner) 1 0 9.7 1.052 9.7 1.1 - - Dassault Falcon 32 10 3.845 1.889 123.0 60.4 38.5 18.9
Douglas DC-10-10 1648 903 42.825 75.222 70,575.6 123,965.9 38,671.0 67,925.5 Douglas DC-10-30 1241 187 5.668 67.448 7,034.0 83,703.0 1,059.9 12,612.8 Douglas DC 10-40 9 0 33.512 80.416 301.6 723.7 - - Douglas DC-8-50F 221 0 238.725 21.775 52,758.2 4,812.3 - - Douglas DC-8-61 193 3 9.054 23.521 1,747.4 4,539.6 27.2 70.6 Douglas DC-8-62 470 0 9.054 23.521 4,255.4 11,054.9 - - Douglas DC-8-63 39 8 3.375 25.091 131.6 978.5 27.0 200.7
Douglas DC-8-63F 86 0 243.375 25.091 20,930.3 2,157.8 - - Douglas DC-8-71 1045 537 2.366 36.024 2,472.5 37,645.1 1,270.5 19,344.9 Douglas DC-8-73 584 189 2.366 36.024 1,381.7 21,038.0 447.2 6,808.5
Douglas DC-8-73F 96 129 2.366 36.024 227.1 3,458.3 305.2 4,647.1 Douglas DC-9-10 632 1 3.99 10.523 2,521.7 6,650.5 4.0 10.5
Douglas DC-9-15F 20 8 3.99 10.523 79.8 210.5 31.9 84.2 Douglas DC-9-30 8316 1729 4.008 12.624 33,330.5 104,981.2 6,929.8 21,826.9 Douglas DC-9-40 511 129 11.879 14.431 6,070.2 7,374.2 1,532.4 1,861.6 Douglas DC-9-50 945 178 1.75 16.422 1,653.8 15,518.8 311.5 2,923.1 EMB-120 Brasilia 24010 0 0 2.751 - 66,051.5 - -
Embraer-135 176 1001 1.453 5.269 255.7 927.3 1,454.5 5,274.3 Embraer-140 23429 1.453 5.269 - - 34,042.3 123,447.4 Embraer-145 8481 52231 1.054 6.054 8,939.0 51,344.0 55,051.5 316,206.5 Embraer-170 3667 0.082 7.659 - - 300.7 28,085.6 Fokker 100 30050 0 3.4 9.218 102,170.0 277,000.9 - -
L-1011-1/100/200 883 7 180.889 68.95 159,725.0 60,882.9 1,266.2 482.7 L-1011-500 Tristar 193 263 6.757 102.431 1,304.1 19,769.2 1,777.1 26,939.4
Lockheed L-188A/C 30 0 21.608 9.07 648.2 272.1 - - Lockheed L100-30 2 0 21.581 9.367 43.2 18.7 - -
MD-11 1139 508 4.398 88.654 5,009.3 100,976.9 2,234.2 45,036.2 MD-80,1,2,3,7,8 127166 135876 4.969 19.279 631,887.9 2,451,633.3 675,167.8 2,619,553.4
MD-90 6997 1560 0.134 17.511 937.6 122,524.5 209.0 27,317.2 RJ-200ER/RJ-440 1 3406 1.72 3.748 1.7 3.7 5,858.3 12,765.7
Saab-Fairchd 340/B 61461 16488 0.701 1.155 43,084.2 70,987.5 11,558.1 19,043.6 TOTAL 388016 341045 1,431,245.7 6,282,271.1 1,079,459.9 5,771,362.5
Emissions (lbs) / LTO 3.69 16.19 3.17 16.92 Emissions (tons) / year 715.62 3,141.14 539.73 2,885.68 Emissions (tons) / day 1.96 8.61 1.48 7.91
Sources:* DOT, 2006, U.S. Department of Transportation, Research and Innovative Technology Administration, Bureau of Transportation Statistics

Attachment B.32005 Dallas Love Field Aircraft Emissions
Aircraft Dallas Love Field Annual LTOs in 2005 Emissions (lbs/LTO) LTO's based on the ERG Report LTO's based on the DOT 2006 annual report(ERG) (DOT) VOC NOx VOC, lbs NOx, lbs VOC, lbs NOx, lbs
A319 2 4.383 14.62 - - 8.8 29.2 B727-100C/QC 25 5.086 20.397 - - 127.2 509.9
B727-200 322 3.073 27.359 - - 989.5 8,809.6 B737-100/200 256 2.317 12.67 - - 593.2 3,243.5
B737-200C 20 1.991 14.343 - - 39.8 286.9 B737-300 15,002 17617 2.026 11.16 30,394.1 167,422.3 35,692.0 196,605.7 B737-400 10 1.631 12.99 - - 16.3 129.9 B737-500 15665 16603 1.389 15.898 21,758.7 249,042.2 23,061.6 263,954.5
B737-700/LR 4226 3353 2.099 15.895 8,870.4 67,172.3 7,037.9 53,295.9 B737-800 2 1.737 22.051 - - 3.5 44.1 B757-200 74 2.304 27.763 - - 170.5 2,054.5
B767-200/ER 400 7.976 46.46 - - 3,190.4 18,584.0 B767-300 403 7.976 46.46 3,214.3 18,723.4 - -
Canadair Reg-700 1 0.057 7.322 0.1 7.3 - - Cessna 208 Caravan 540 0.079 0.428 42.7 231.1 - -
Convair CV-580 4 9.7 1.052 - - 38.8 4.2 CL600 287 1.72 3.691 493.6 1,059.3 - -
CL601-3A 1 1.475 3.942 1.5 3.9 - - CL604 124 1.72 3.748 213.3 464.8 - -
Dassault Falcon 7 3.845 1.889 - - 26.9 13.2 Douglas DC-9-15F 21 3.99 10.523 - - 84.2 265.1 Douglas DC-9-30 7 14 4.008 12.624 27.9 73.7 55.9 147.3 Douglas DC-9-40 4 11.879 14.431 - - 47.5 57.7
Embraer-135 388 639 1.453 5.269 563.8 2,044.4 928.5 3,366.9 Embraer-145 2989 2944 1.054 6.054 3,150.4 18,095.4 3,103.0 17,823.0 Learjet 25B 175 8.494 1.065 1,486.5 186.4 - -
Learjet 35/36 1058 3.889 1.944 4,114.6 2,056.8 - - McDonald Douglas -80 475 4.969 19.279 2,360.3 9,157.5 - -
McDonald Douglas -80-81 174 4.969 19.279 864.6 3,354.5 - - McDonald Douglas -80-83 187 0 17.39 - 3,251.9 - -
MD-80-83 65 0 17.39 - 1,130.4 - - MD-80,1,2,3,7,8 11 4.969 19.279 - - 54.7 212.1
RJ-200ER/RJ-440 1 1.72 3.748 - - 1.7 3.7 Swearingen Merlin 1267 8.289 0.732 10,502.2 927.4 - -
TOTAL 43,034 42329 88,058.7 544,405.0 75,271.7 569,441.0 Emissions (lbs) / LTO 2.05 12.65 1.78 13.45 Emissions (tons) / day 0.12 0.75 0.10 0.78
Sources:* ERG, 2007, 2005 Emission Inventory Love Field Airport, Aviation Department, Environmental Affairs Group, May 30, 2007** DOT, 2006, U.S. Department of Transportation, Research and Innovative Technology Administration, Bureau of Transportation Statistics
Table 7-Aircraft departure scheduled, and performed, by community air carrier and aircraft type - 2005.

November 9, 2007
Ms. Jenny Danieau Transportation Planner North Central Texas Council of Governments P.O. Box 5888, Suite 200 Arlington, TX 76005-5888
Southwest Airlines Co. P.O. Box 36611, HDQ-1SE 2702 Love Field Drive, HDQ-1 SE Dallas, TX 75235 214-792-3572
RE: Information requested at the Aviation Partnership Meeting on October 19, 2007 at the offices ofthe North Central Texas Council of Governments
Dear Ms. Danieau:
I am writing in response to requests from the North Central Texas Council of Governments and the Texas Commission on Environmental Quality for data from Southwest Airlines regarding our operation at Love Field Airport in Dallas, Texas. The information requested at the October 19, 2007 meeting is provided below as well as in the enclosed attachments.
1. Aircraft taxi times - Southwest Airlines has estimated that the average taxi time for our aircraft at Love Field Airport is 5 minutes.
2. Percentage ofthrust used during take off- The average thrust used during take off under normal conditions by our aircraft at Love Field Airport is 85%.
3. Southwest Airlines Fleet- Please see Attachment A 4. Electrified GSE- Southwest Airlines has currently electrified 89% of the ground
support equipment available for electrification at Love Field Airport. That includes 33 baggage tugs, 28 beltloaders, 16 aircraft pushbacks, and 4 lavatory trucks. The original commitment under the MOU with the TCEQ was for electrification of75% of our 1996 ground equipment fleet by December of2005.
5. Gate electrification- Southwest Airlines completed our gate electrification at Love Field Airport on August 7, 2003.
6. The Wright Amendment Issues Contract limiting Love Field to a maximum of20 gates - Please see Attachment B, Article I, Paragraph 3
7. Average APU run time per LTO- Southwest Airlines aircraft APUs operate an average of 7 minutes per LTO at Love Field Airport.
Received
NOV 1 4 2007
TRANSPORTATION

Ms. Jenny Danieau North Central Texas Council of Governments Page 2
Should you need additional information or have questions regarding any of the information provided, please don't hesitate to contact me at (214) 792-3572.
Sincerely,
g~;;f(~ Elaine Karnes Environmental Manager Southwest Airlines Co.

6/28/2005 PAGE 1 OF 5
TAIL NO. N300SW
1 Spirit of K. Hawk N30iSW
2 Spirit of K. Hawk N302SW
3 Spirit of K. Hawk 4 N673M 5 N694SW 6 N692SW 7 N667SW 8 N674M
9 N675M 10 N661SW 11 N676SW 12 N303SW 13 N693SW 14 N688SW 15 N686SW 16 N657SW 17 N659SW 18 N660SW 19 N658SW 20 N662SW 21 N663SW 22 N304SW
23 N305SW 24 N306SW 25 N307SW 26 N309SW 27 N310SW 28 N689SW 29 N677M 30 N311SW 31 N312SW 32 N687SW 33 N313SW 34 N678M 35 N664WN 36 N685SW 37 N679M 38 N698SW 39 N672SW 40 N682SW 41 N665WN 42 N314SW 43 N315SW 44 N316SW
• West Pac Aircraft **EZ Jet Aircraft ***Transavia Aircraft
l
-300 FLEET STATUS SORTED BY LINE NUMBER

6/28/20G5 PAGE 2 OF 5
TAIL NO. 45 N308SA
46 N695SW
47 N318SW.
48 N680AA
49 N319SW
50 N320SW
51 N321SW
52 N340LV
53 N699SW
54 N322SW
55 N323SW
56 N324SW
57 N345SA
58 N325SW
59 N326SW
60 N327SW
61 N669SW
62 N691WN
63 N697SW
64 N317WN
65 N684WN
66 N328SW
67 N329SW
68 N696SW
69 N330SW
70 N690SW
71 N670SW
72 N671SW
73 N331SW
74 N332SW
75 N333SW
N334SW
76 Shamu I of Texas
77 N335SW
78 N336SW
79 N337SW
80 N338SW
81 N683SW
82 N339SW
83 N341SW
84 N342SW
85 N343SW
86 N344SW
87 N346SW
88 N347SW
89 N348SW
90 N349SW
• West Pac Aircraft
**EZ Jet Aircraft ***Transavia Aircraft
1
-300 FLEET STATUS SORTED BY LINE NUMBER

6/28/2005 PAGE 3 OF 5
TAIL NO. 91 N350SW 92 N351SW
N352SW 93 Lone Star I 94 N353SW 95 N354SW 96 N355SW 97 N356SW
98 N357SW 99 N358SW
100 N359SW 101 N360SW 102 N361SW 103 N362SW
N363SW Hero's of The
104 Heart
105 N364SW 106 N365SW 107 N366SW
108 N367SW
109 N368SW 110 N369SW 111 N370SW 112 N371SW
113 N372SW 114 N373SW
115 N374SW 116 N375SW 117 N376SW
118 N378SW
119 N379SW 120 N380SW 121 N382SW
N383SW 122 Arizona I
123 N384SW 124 N385SW 125 N386SW
126 N387SW 127 N388SW 128 N389SW 129 N390SW 130 N391SW
131 N392SW 132 N394SW 133 N395SW
• West Pac Aircraft .. EZ Jet Aircraft "*•Transavia Aircraft
I
-300 FLEET STATUS SORTED BY LINE NUMBER

6/28/2005 PAGE 4 OF 5
TAIL NO. 134 N396SW
135 N397SW
136 N398SW
137 N399WN
138 N600WN N601WN
139 Jack Vidal
140 N602SW
141 N603SW
142 N604SW
143 N605SW
144 N606SW N607SW
145 June Morris
146 N608SW N609SW
CALIFORNIA
147 ONE
148 N610WN
149 N611SW 150 N612SW
151 N613SW
152 N614SW
153 N615SW
154 N616SW
155 N617SW
156 N618WN
157 N619SW
158 N620SW
159 N621SW
160 N622SW
161 N623SW
162 N624SW
163 N625SW
164 N626SW
165 N627SW
166 N628SW N629SW
167 SILVER ONE
168 N630WN
169 N631SW
170 N632SW 171 N633SW
172 N634SW
173 N635SW
174 N636WN
175 N637SW
* West Pac Aircraft **EZ Jet Aircraft ***Transavia Aircraft
I
-300 FLEET STATUS SORTED BY LINE NUMBER
6/28/2005 PAGE 5 OF 5
TAIL NO. 176 N638SW 177 N639SW 178 N640SW 179 N641SW 180 N642WN 181 N643SW 182 N644SW 183 N645SW 184 N646SW
N647SW 185 TRIPLE CROWN 186 N648SW 187 N649SW 188 N650SW 189 N651SW 190 N652SW 191 N653SW 192 N654SW
193 N655WN 194 N656SW
• West Pac Aircraft **EZ Jet Aircraft ***T ransavia Aircraft
-300 FLEET STATUS SORTED BY LINE NUMBER

4/27/200~
PAGE 1'0F 1
TAIL NO. 1 N501SW 2 N502SW 3 N503SW 4 N504SW 5 N505SW 6 N506SW
N507SW 7 Shamu II 8 N508SW 9 N509SW
10 N510SW 11 N511SW 12 N512SW 13 N513SW 14 N514SW 15 N515SW 16 N519SW 17 N520SW 18 N521SW 19 N522SW 20 N523SW 21 N524SW 22 N525SW 23 N526SW 24 N527SW 25 N528SW
-500 FLEET STATUS SORTED BY LINE NUMBER

1 2 3 4 5 6 7 8 9
10 11
12 13
14
15 16 17
18 19
20 21 22 23 24 25 26 27
28 29 30 31
32 33
34
35
36 37 38 39 40
41
42
10/2/2007 PAGE t'OF 7
WIZARD: GPLINE OR CCCASOR cc
TAIL NO. N707SA N708SW N709SW N700GS N701GS N703SW N799SW N704SW N705SW N706SW N710SW N711HK
Herb Kelleher
N798SW N712SW Shamu
N713SW Shamu
N714CB N715SW N716SW N717SA N718SW N719SW N270WN N271LV N720WN N739GB N740SW N741SA N742SW Nolan Ryan
N743SW N723SW N724SW N725SW N726SW N744SW N745SW N727SW
Navada
N728SW N729SW N730SW N746SW N747SA N731SA
* Eastwind P **ILFC Aircrc
I
• 700 FLEET STATUS SORTED BY LINE NUMBER

43 44
45 46
47 48
49 50
51 52 53
54
55 56
57
58 59 60 61 62 63 64
65 66 67 68
69 70 71 72
73 74 75 76 77 78 79 80
81 82
83
84 85
66 87
10/212007 PAGE 2:0F 7
WIZARD: GPLINE OR CCCASOR cc
TAIL NO.
N732SW N733SA N734SA N748SW N749SW N735SA N736SA N737JW N738CB N750SA· N751SW N752SW N753SW N754SW N755SA N756SA N757LV N758SW N759GS N760SW N761RR N762SW N763SW N764SW N765SW N766SW N767SW N768SW N769SW N770SA N771SA N772SW N773SA N774SW N775SW N776WN N777QC N778SW N779SW N780SW N781WN
NEW MEXICO ONE
N782SA N783SW N784SW N785SW
* Eastwind P **ILFC Aircrc
I
-700 FLEET STATUS SORTED BY LINE NUMBER

88 89 90 91 92 93
94
95
96 97 98 99
100 101 102 103 104 105 106
107 108 109 110 111 112 113 114 115 116
117
118 119 120 121 122 123 124 125 126
127 128 129 130
10/2/2007 PAGE 30F 7
WIZARD: GPLINE OR CCCASOR cc
TAIL NO.
N786SW N787SA N788SA N789SW N790SW N791SW N792SW
Classic
N793SA Spirit One
N794SW N795SW N796SW N797MX N400WN N401WN N402WN N403WN N404WN N405WN N406WN N407WN N408WN N409WN N410WN N411WN N412WN N413WN N414WN N415WN N416WN N417WN
ROWNKJNG
N418WN WINNING
SPIRIT
N550WN N419WN N551WN N420WN N421LV N422WN N423WN N424WN N425LV N426WN N427WN N428WN
• Eastwind f. **ILFC Aircr;
I
-700 FLEET STATUS SORTED BY LINE NUMBER

131 132 133 134 135 136 137 138 139 140
141 142 143 144
145 146 147 148 149
150 151 152 153 154 155 156 157 158 .159
160 161 162 163 164 165 166 167 168 169 170 171 172 173
10/2/2007 PAGE40F7
WIZARD: GPLINE OR CCCAS OR cc
TAIL NO.
N429WN N430WN N431WN N432WN N433LV N434WN N435WN N436WN N437WN N438WN N439WN D.OGDEN
N440LV N441WN N442WN N443WN
Spirit of Hope
N444WN N445WN N446WN N447WN N448WN SPIRIT OF
KITTY HAWK
N449WN N450WN N451WN N452WN N453WN N454WN N455WN N456WN N457WN N458WN N459WN N460WN N461WN N462WN N463WN N464WN N465WN N466WN N467WN N468WN N469WN N470WN N286WN
* Eastwind A **ILFC Airct<
-700 FLEET STATUS SORTED BY LINE NUMBER

174 175 176 177 178 179 180 181 182 183 184 185
186 187 188 189 190 191 192 193 194 195 196 197 198 199
200 201 202
203
204 205 206 207 208 209 210 211 212 213 214 215
216 217 218
10/2/2007 PAGE 5t>F 7
WIZARD: GPLINE OR CCCASOR cc
TAIL NO.
N472WN N473WN N474WN N475WN N476WN N477WN N478WN N479WN N480WN N481WN N482WN N483WN N484WN N485WN N486WN N487WN N488WN N489WN N490WN N491WN N492WN N493WN N494WN N495WN N496WN N497WN N498WN N499WN N200WN N201LV Fred Jones
N202WN N203WN N204WN N205WN N206WN N207WN N208WN N209WN N210WN N211WN N212WN N213WN N214WN
Maryland One
N215WN N216WR
* l:!astwind P. **ILFC Aircn
-700 FLEET STATUS SORTED BY LINE NUMBER

219 220 221 222 223 224 225
226 227 228 229 230 231 232 233 234 235 236 237 238 239 240 241 242 243 244 245 246 247 248 249 250 251 252 253 254 255 256 257 258 259 260 261 262
10/2/2007 PAGE60F 7
WIZARD: GPLINE OR CCCAS OR C<
TAIL NO.
N217JC N218WN N219WN N220WN N221WN N222WN N223WN N224WN Slam Dunk
One
N225WN N226WN N227WN N228WN N229WN N230WN N231WN N232WN N233LV N234WN N235WN N236WN N237WN N238WN N239WN N240WN N241WN N242WN N243WN N244WN N245WN N246LV N247WN N248WN N249WN N250WN N251WN N252WN N253WN N254WN N255WN N256WN N257WN N258WN N259WN N260WN
* Eastwind A **ILFC Aircrc:
-700 FLEET STATUS SORTED BY LINE NUMBER

263 264 265 266 267 268 269 270 271 272 273 274 275 276 277 278 279 280 281 282 283 284 285 286 287 288 289
290 291 292 293 294 295 296
10/29/2007 PAGE 7 OF 7
WIZARD: GPLINE OR CCCASOR cr.r.Mm
TAIL NO.
N261WN N262WN N263WN N264LV N265WN N266WN N267WN N268WN N269WN N272WN N273WN N274WN N275WN N276WN N277WN N278WN N279WN N280WN N281WN N282WN N283WN N284WN N285WN N287WN N288WN N289CT N290WN N291WN N292WN N293WN N294WN N295WN N296WN N297WN
* Eastwind P **ILFC Aircn
-700 FLEET STATUS SORTED BY LINE NUMBER

··~ SOUTHWEST
AmericanAirlines·
CO:\TRACT
FORT WORTH ~
.. HIO:\G THE CIT\-· OF DALLAS. THE CITY OF FORT WORTH, SOCTHWEST AlRLI:\ES CO., A~IERlCA:\ AIRU:\ES, 1:\C., A:\D
DF\V 1:\TER:\ATIO\Al. AIRPORT BOARD 1:\CORPORATI:\G THE SLBSTA:\CE OF THE TER:VlS OF THE JL:\E 15,2006 JOI\T ST.-\TE:\lE:\T BETWEE:\ THE PARTIES TO RESOLVE
THE. "WRIGHT A:VIE:\DME:\T" ISSL ES
\VH E R F. AS. certain \kmb~rs o 1 the c:nited States Congress ha\ c introduced legislation w either repeal or further modify the restrictions o! the Wright Amendment. as amended by the 1997 Shelby Amendmem and the 2005 Amendment (herein referred tv as the "\Vright Amendment"). or prohibit commercial ai1· pass~ngcr service <H Dallas Lo,·e Field Airport ( "Lo\e Field"); and
WHEREAS. certain Congressiona l leaders infom1ed the Cities of Dallas and Fort \\'orth (collectively. the "Cities") that it would be preferable for the Cities tO present a local solution for addressing airport issues in the :\orth Central Texas region and particu larly. in the Dallas. Fort Worth metropolitan area. pri or to any !t1rther action bein g taken hy Congress that \\ Ould directly impact Jsiation senices in the region; and
WHEREAS. in response 10 various pending and proposed Congressiona l actions that would further aCf'ect. modify. or repeal the \\'right Amendment, the City Councils of Dallas and Fort \\.'orth. on \1arch 8, ~006 and :viarch 7, 2006. respccti\ eiy. pass~d a Concurrent Resolution (idcntiCi.::d as Dallas Resolution .\o. 06-0870 and Fo11 Worth Resoiu~ion .\o. 3319-03-200()). requesting members of the Cnited States Congress to rc:fram from taki ng any action regarding, or making any further amendments to. the Wright Amendment in order to allow the Cities an opportunity to work towards a local solution for addressing airport issues in the .\orth Centra l Texas region. and to presern a mutually agreed upon plan to the Conh:rress for its consideration: and
WHEREAS. tht- City ,;f Dallas, pursuant to Resolution ~o. 06-0997, adopted April 6. 2006. commissioned m1 Impact Analysisi\1astcr Plan Cpdate for Love Field by DMJM Aviation. Inc .. to provide updnted information and analysis as to aircraft noise. air quality, traffic impact, and economic impact at
Love Field if the Wright Amendment \\Crc rcp~aled or substantially modified; and
Vd-!EREAS. the Love Field Impact Analysis L'pdatc prepared by DMJ:Vl :\\iation. rnc. and GRA, Inc. round that, in the ahsence of the Wright Amendment, the overall impacts of operating 20 gates at Lon: Field under a "\"o \\' right Amendment sc~nario" are the most comparable to the em ironmcntal thresholds agreed to and cswblishcd in the 2001 \'l as ter Plan Impact Analysis 32 gate scenario \Vith the Wright Amendrnc:nr in piace; and
\\HEREAS. earlier this y;.;ar. the !lm1Qrablc Laura \1il1cr. \1ayor of Dallas, and the Honorablc . .\1ike \1oncrict~ .\1ayor of Fo rt Wonh. held a scric~ of meetings with interested parties in an effort to reach a local agreement regarding Lo\ c F1eld that wou ld end the prolonged and divisi\ e colltl·o, crsics het\veen the t\\·o Cities and that \\'Ou ld ser,·c and protect the interests or all citizens of the Dallas-Fon Worth area. including
-

residents :iving in the vicinity of Love Field, as well as busines~. consumer. a:HJ oth<..:r constituencies affected by the Love Fie;d contro\ ersies; ar:d
WHEREAS. after imestigation and analysis of the a\ailablc facts and giving due consideration to the economic. environmental. and personal \\ el fare and interests of their respective residents, the general public. and the holders of Df\V Airport Joint Revenue Bonds, the Cities of Dallas and fort Worth conferred. ddiberated. and agreed to a local soh.:tion regarding the Wright .-\mendment and related matters that best serves such interests gi\·en the ;ike1ihood that Congress could take action to repeal or substantially modify the Wright Arnendme::1t: and
\VHEREAS, the ,\fayors, in consultation with other leaders in the two cities. first \\ere able to reach a basic agreemcm between :hems<;;hes and with represcntati\·es of the Dallasifort \Vorth International Airport Board ( .. DFW Board"): and
WHEREAS. the ~•1ayors, rcpresentati">·es of the DF\V Board. and other go\emmental officials then met separately with Southwest Airlines and American Airlines to ad\·ise those airlines that the local governments wouid announce a local solution and recommend it to Congress and that they wanted the airlines to consent to, and i.!ndorse. the local solution; and
WHEREAS, the :Vfayors and representati\ es of the DFW Board thereafter conducted certain limited negotiations separately with South\vest Airlines and American Airlines; and
WHEREAS, Southwest Airlines and American Airlines concluded. separately, that the local solution reached among. and urged upon them by. the local governments \\ ould be favorably received by the Congress. and that under the circumstances presented, the airlines should support the effort ofthe Cities and the DF'vV Board and acquiesce in. and agree to support the local solution; and
\VHEREAS, lhe City Councils of Dallas and Fort Worth, on June 28, 2006 and July 11. 2006, respectively, passed a Concurrent Resoiution (identified as Dallas Resolution :\o. 06-1838 and Fort \Vorth Resolution '\o.J.3~·tl7-~~) and the DFV/ Board on June 29, 2006 passed Resolution :\o.2006-0§-21Q, approving the Joint Statement signed by the City of Dallas. City of Fort Worth, Southwest Airlines, American Airlines. and the DFW Board on June 15. 2006, authorizing the execution of this Contract between the Parties incorporating the substance of the Joint Statement. and requesting the Cnited States Congress to enact legislation consistent therewith:
Therefore, the Parties agree as follo\\ s:
ARTICLE I.
!. The City of Dallas, the City of Fort Worth, Southwest Airlines, American Airlines, and DF\V Board, (herein. th" "Panies.") agree to seek the enactment of legislation to allow for the full implementation of this Contract including, but not limited to, amending section 29 of the International Air Transportation Competition .-\ct of 1979. more commonly known as the "Wright Amendment .. and ultimately effect its repeal as Collows:
a. To :mmediately allow airlines serving LoYe Field to offer through ticketing between Love Field and any destinations (including international destinations) through any point :n Texas. '\e\\ \1exico, Oklahoma, Kansas. Arkansas, Louisiana, \1ississippi, ).1issouri, and Alabama, and to market such services;
F1nai Ccmtr~.:t Amm:g th~ Clt) of D~llao, C1t~ or Fort Worth, :-:iOLlt~wcs: Airlines, A:m:ricctn >.irlines. and IH·W Soc1rd to R¢:>r)Jvc lh~ '"\\right ,\n~~ndm~nt" l%u.::.
Page 2 of 1;
-
b. Except as provided herein. to eliminate all the remaining restrictions ,)n air scr\'ice trom LO\ e Field after eight years fro:~1 the enactmem of legislation: and
c. ro iimn charter tligh:s as set forth in Anicle II, Section 16 of this Contract.
2. The Parties agree thut non-swp international commercial passenger service to and from the DallasFort \Vorth area shall be limited exclusively to DF\V International Airport (""DF\V Airport"). The Cities shall work jointly to encourage ali such flights into DF\V Airpon.
3. The Parties agree that consistent with a re\ised Love Field .Y1aster Plan. based upon the 2006 Love Field Impact A.nalysis Cpdate prepared by D.YfJ\1 Aviation, Inc .. the number of gates available for passenger air senice at Lo\c Field \\ill be, as soon as practicable. reduced from the 32 gates envisioned in the 2001 Lo\·e Field \·laster Plan to 20 gates and that Love Field will thereafter be limited pem1anently w a maximum of 20 gates.
a. Airlines may not subdivide a "gate:· A gate shall consist ot' one passenger hold room and one passenger loading jet bridge supporting one aircraft parking space. and no hardstand operations. except as allowed herein, shall be pem1ittcd. ~othing shall preclude any airline from utilizing hardstands for RO:\ parking, maintenance, training, or for irregular operations (i.e. flights that were scheduled originally for one of the m enty available gates and cannot be accommodated thereon due to weather. maimenance or unforeseen emergencies), or other uses that do not involve passenger air scnice.
b. American Airlines and Southwest Airlines agree to voluntarily surrender gate rights under existing leases in order to reduce the number of gates as necessary to implement this agreement. During the four year period from the date the legislation as provided herein is signed into Jaw: Southwest Airlines shall have the preferemial use of 15 gates under its existing lease to be used for passenger operations; American Airlines shall have the preferential use of 3 gates under its existing lease tO be used fot passenger operations; and ExpressJet Airlines, Inc .. shall have the preferential use of 2 gates under its existing lease to be used for passenger operations. Thereafter, Southwest Airlines shall have the preferemial use of 16 gates under its existing lease to be used for passenger operations; American A:rlines shall ha\'e the preferential use of 2 gates under its existing lease to be used for passenger operations; and ExpressJet Airlines. Inc .. shall have the preferential use of 2 gates under its existing lease to be used for passenger operations. In consideration of Southwest Airlines· substantial divestment of gates at Lon' Field and the need to renovate or reconstruct significant portions of the concourses, Southwest Airlines shall have the sole discretion (after consultation with the City) to determine which of its gates it uses within its existing leasehold at Love Field during aU phases of reconstruction. L:pon the earlier of (i) the completion of the concourse renovation, or (ii) 4 years from the date the legislation as provided herein is signed into law. all Parties agree that facilities will be modified as necessary. up to and including demolition, to ensure that Love Field can accommodate only 20 gates for passenger service. To the extent a new entrant canier seeks to enter Love Field. the City of Dallas will seek voluntary accommodation from its existing carriers to accommodate !he new entrant service. If the existing carriers are not able or are not willing to accommodate the new entrant service. then the City of Dallas agrees to require the sharing of preferential lease gates. pursuan: to Dallas· existing lease agrt..'ements. To the extent that any existing airline gates leased at Love Field revert to the City of Dallas, these gates shall be converted to common use during the existing tem1 of the lease.
r;nGi Cor,Jrac: ·\nmn~ trc Cit! of Dallas. Ctty uf hm Wonh. SuuL"l\\cst Airlines, Am.::nc:m At rimes. and OFW Bo~rd to Rc~oi\e thl.' "Wright \nwndm~n(' lSStl~'
P.!;!<' .1 of I I
-

4. The City of Dallas agrees that it \\ill :1egotiate a voluntary noise curfe\\ at Lo\e Field precluding scheduling passenger airline l1ights bet\vecn 1 L p.m. and 6 a.m. Soutlm est Airlines and American Airlines shall emer i:1to agreements \\ith respect thereto with the City of Dailas.
5. The City of Dallas agrees that it will signific~mtiy redevelop portions of Love Field. including the modernil:ation of the mai:1 terminaL consistent with a revised Love Field \1aster Plan based upon the Love Field Impact .'\nalysis Cpdatr.: prepared by D\.U.\1 Aviation. lnc. (the "'Love Field \1odernization Progran1" or "LF\fP" ). In addition. the City agrees that it will acquire aU or a portion of the lease on the Lemmon A venue facility, up to and including condemnation, necessary to fultill its obligations under this Contract. The City of Dallas further agrees to the demolition of the gates at the Lemmon A\·enu~ facility immediately upon acquisition ofthc current lease to ensure that that facility can never again be used for passenger sen ice.
The Pa11ies agree that a minimum investment of$150 million and up to a maximum ofS200 million in 2006 dollars (the .. Spending Cap"), as adjusted for int1ation. \\ill he made by the City of Dallas for the LF\:1P, and that the capital and operating costs for the LF:\fP may be recovered through increased landing fees. space rental charges. or Passenger Facility Charges ("PFCs''). The Parties contemplate that financing the LFMP will include both the retirement of existing debt and the issuance of new debt for the LF:V1P.
The Spending Cap shall be exclusive of the costs connected with the acquisition and demolition of the Lemmon A venue gates and of the capital costs associated with the de·velopment and construction of a "people mover" connector to the DART mass transit system ("the Connector"). The costs for the acquisition and demolition of the Lemmon Awnue gates \Vill be recoven:d from airport users, but the capital costs for the Connector may not be included in airline tern1inal rents or landing fees, except as expressly prO\·icted for herein below. The City of Dallas may seek approval lO use PFC revenues for the Connector. and Southwest Airlines agrees to support such application. The City of Dallas shall. in addition. seek state, federal, DART. and any other available public funds to supplement such PFC funds; provided. however. that nothing herein shall obligate the City of Dallas to undertake the Connector project. l\otwithstanding the preceding, in the event PFC funds are not approved for the Connector. the City of Dallas may use airport funds tor the Connector: provided, however. if airport funds are used for the Connector. the City of Dallas shall be obligated to apply for. and tJse. PFCs ro pay for PFC eligible portions of the LFr'vfP. !J1 any 1.':\'ent, the combined total spending for both the LF~1P and the Connector, exclusive of PFC's. shall not exceed the Spending Cap, except as provided immediately below,
[n the event that PFCs are not approved for either the Connector or the LF\1P, as provided herein, terminal rents and landing fees may be used for such impro\ ements, thus exceeding the Spending Cap; provided. howe\ cr. that the Cily shall use its best efforts to seek and use PFCs, state, federaL DART, and any other available public funds (other than City of Dallas general funds) as the only sources of fu:~ding for the Connector and to avoid impacting terminal rents and landing fees,
Except as othcmise provided herein. capital costs in excess of the aforementioned Spending Cap that impact terminal rents and ianding fees shall be subject to agreement between Southwest Airlines and the City of Dallas, except that. follo'>ving consuitation with Southwest Airlines, the City of Dallas may proceed with necessary projects required for reasons of safety, security, norn1al maintenance and repair, or federal mandate, and such costs may be included in terminal rents and
F11ia! ColHrJc: .\mong r:h~ Cr; ,1f D~J:as, Cty or' Fort Worth. SouthlltSt Alrlm~s. Amen can Atr:incs. and Dl· \\ Boa;d to Rc$Oh e th~ "\\right ,\m~ndm~nr" lssu.:s
Pa!'e 4 of ll
-

landing fees. The operating rr.::scrvc of LO\ c Fkld shall nt?\ cr c:\cccd nne year" s opcratmg costs (l)pcrating and maintemmcc plus cieht sen:cc) during the term Southwest ;\ir!ines' lease.
To reco\ cr the costs of the LF:V1P. the City of Dallas sha;l negotiate amendments of the Leases of Tern1inai Building Premises pre\·ious:y entered into \\ ith Southwest Airlines. American Airlines, and ExpressJct Airlines, Ir~c and will also adopt City ordinances modifying the terminal rents and :anding fees :o be paid by airli:;,e ~isers of Love fi.eld.
Southwest Airlines and the City of Dallas shall agree on a phase-in of the LFMP and will decide which party wili fund and mar.age the consmJction of the LF\fP. South\\CSt Airlines· expenditures for its share of the LF\!P's capital costs shall be credited toward the minimum and maximum requirements< To the extent possible. the LF:v!P shall be completed by the expiration of the 8-year period.
6. The Cities agree that they \\ili both oppose efforts to initiate commercial passenger air service at any area airport other than DF\V Airport (and Love Field, subject to the provisions contained herein} dming the eight-year period. "( ommercial passengl.!r air service .. does not include a spaceport or air taxi sen icc as defined by Part 135 of the Federal A\'iation Regulations. The Cities agree to jointly oppose any attempts to repeal or further modify the Wright Amendment earlier than the eight-year period. To the extent any otht!r airpon within an eighty-mile radius of Love Field seeks to initiate scheduled commercial passenger serv1ce within this eight-year pe1iod, both the Cities agree to work diligently to bring that service to DFW Airport, or if that effort fails. then to airports O\\l1Cd by the Cities of Dallas and or Fort Worth.
7. The continuation of this Contract beyond December 31. 2006, is conditioned on Congress having enacted legislation prior thereto. allowing the Panics to implement the ten11S and spirit of this Contract. lt is the position of the Parties that Congress should not exempt additional states from the \\'right Amendment during the eight-year period before it is eliminated.
8. This Contract shall not be modified except upon mutual ai;,rreement of all of the Parties.
9. The Cities acknowledge their outstanding DF\\' Airport bond covenants, to rhe extent such covenants are legally enforceable. and nothing in this Contract is intended ro nor shall contravene such covenams. By the execution of this Contract, Soatlnvest Airlines does not surrender any of its rights to operate at Love Field except as explicitly outlined in this Contract.
1 0. If Southwest Airlines or its affiliate or code share panner (except for pLtblished'scheduled code share sen· ice from DFW Airport to Midv.ay Airport as of June 14. 2006) chooses to operate passenger service from another airport within an 80-mile radius of Lo\e Field in addition to its operations at Love Field, then ror e\ ery such gate which Southwest Airlines, its affiliate or code share partner, operates or uses at another airpon within this radius, South\\ est Airlines wi lJ voluntarily relinquish control of an equivalent n~unbcr of gates at Love Field, up to 8 gates and such gates shall be made available to other carriers. lf other caJTiers are not interested in these gates. then they can be made available to Southv~:st Airlines lor its use on a corr.mon use basis. This requirement to relinquish -gates shall expire in 2025. Hn::> pro\!sion shall not apply ro a code share partner not operating under South\\ est :\irlines· or its affiliates' cod.:: at an airport within this 80-mile radius.
r·,n~: Cvntr~.:' Among 1!1~ Cir) of D;,!la\. (:[: o:' rorr \\ o•1h. South\\c:,t Airl;nc:>. o\meric;;n Airlir:c'< and DF\\' Board to Rt~L)h..:' th..: "\\'right ,\trl~;i~::~icnt·· Issue~

11. If American Air1incs or its affiliate or code share partner chooses to operate passenger sen ice from another airport \\ itbn an 80-milc radius of Love field in addition to 1ts operations at Df\V Airpon and Love Field. then fore\ ery such gate \Vhich Ame1ican Airlines. its affiliate or code share partner. operates or uses at another airport within this radius except for DFW Airport and Love Field, American Airli1~es \\ill \ oluntarily relinquish control of an equivalent number of gates at Love field, up to one and one-half gates and such gates shall be made a\'ailable to other carriers. If other carriers arc not imerested :n :hese gates. then they can be made a\·ailable to American Airlines for its use on a common Ltsc ~asis. This requirement to relinquish gates shall expire in 2025. This pro\'ision shall not apply to a code share partner not operating under American Airlines· or its aftiliates· code at an airport within this 80-mile radius.
12. Each carrier shal I enter into separate agreements and take such actions. as necessary or appropriate, w implement its obligations Lmder this Conrract. Similarly, the Cities shall enter into such agreements and take such actions. as necessary or appropriate. to implement the Contract. All such agreements and actions arc subject to the requirements of law. Such agreements shall include amendments to: (i) American Aidinc{ Love Field tem1inallease: and (ii) Southv,:est Airlines· Love Field tem1inal lease. The City of Dallas shall develop a re\·ised Love Field .\tfaster Plan consistent \Vith this Con:ract.
13. In the event that Congress ar any time, enacts legislation that repeals the Wright Amendment sooner than the eight years identified in paragraph l.b. of Article I. herein, or authorizes service (except for through ticketing sen·ice as contemplated hy paragraph l.a. of Article I. herein) between Love Field and one or more domestic or intemarional destinations other than those currently allowed under the \Vright Amendment d~ring the eight year period. and if Southwest Airlines or its affiliate or code share partner commences non-stop service to or from Love Field to a destination not currently ailowed under the Wright Amendment then Southv .. :est Airlines \\ill volunta.rily relinquish control of 8 gates and st:ch gates will be made :nailablc to other carriers. If other carriers are not interested in these gates, then they can be made a\ailable to SoLttlw. .. est Airlines for their use on a common use basis. This pro\ ision shall not appl;. to a code ::;hare partner not operating under Southv,est Airlines· or its afliliates· code. Likewise. in the e\'ent that Congress. at any time, enacts legislation that repeals the Wright Amendment sooner than the eight years identified in parah,rraph 1.b. of Article I. herein, or authorizes service (except for through ticketing service as comemplated by paragraph l.a. of Artici.: I. herein) between Love Field and one or mor-: domestic or intcmational destinations other than those cLtrrcmly allm:~, ed under the \\'right Amendment during the eight year period, and if American Airlines or its a:ffiliate or code share partner commences non-stop service to or from Love Field to a destination not currently allO\\ cd under the Wright ,A,mendment. then American Airlines \vi!! voluntarily relinquish control of half of its gates and such gates will be made available to other carriers. If other cart·iers are not interested in these gates, then they can be made available to American Airlines for its use on a common use basis. This provision shall not apply to a code share partner not opl!rating under Am..:rican Airlines' or its affiliates' code.
14. The Parties hereb) represent to the Congress of the L'nited Stares. and to the Citizens of the DallasFort \Vorth area that they appro\e of and support the local solution as set forth in this Contract. The Parties each separately cov..::nam that they will support. encourage and seek the passage of legislation -necessary and appropriate to !mp:ement the tem1s and spirit of this Contract. The Parties each separately coYenant that they will oppose any legislative etrort that is inconsistent with the terms of this Contract.
!'ina: Contr:1cz '\~1on,t t!1~ City vf D:l!t3s. Cit)' ofF or. Worth. Soutb~st -\1rl:nes. Amcric:m A:r:mes. and CJF\\ Bo;,rc t() RcsOI\e :h-: "\\right ·\n:crh:m"nt" b,u~'
15. The Parries agree that the t1nal documentation to implement th1s locai solution shall be consistent with all federal rules, rc~ula:ions and la\\ s. The Parties agree that for this Contract to be binding, it must be executed by all parries no later than July 15:11
• 2006.
16. l f the l' .S. Cong:-css does not enact legislation by December 31, 2006. that would allovv· the Parties to implemer:t the tem1s and spirit or this Contract, including. but not limited to, the 20 gate restriction at LO\ c Fide, l 1'1en this Cor: tract is null and void unless all parties agree to extend this Contract
17. As part of this Contract. the City of Dallas agrees to grant American Airlines and Southv .. est Airlines options to extenc their existing terminal leases until 2028.
ARTICLE II. ADDITIO~AL PROVISIO:\S
1. SCBJECT TO FEDERAL GRA:\T ASSCR.A:;\CES. ETC. :\othing in this Contract shall require the City of Dallas. the City of Fort \Vorth or the DF\V Airport Board to take any action that would result in (i) the loss of eligibility for future Federal airport grants for either city or the DFW Airport Board or (ii) FAi1. disapproval of any Passenger Facility Charge (PFC) application for either city or the DF\V Airport Board, or (iii) either city or the DFW Airport Board being found to be in noncompliance with its existing obligations under Federal aviation law.
2. FL')JDt\G. Any capital spending obligations of the City of Dallas under this Contract for airport projects that require the expenditure of public funds or the creation of any monetary obligation shall be limir-:d obligations. payable solely from airport revenues or the proceeds of airport re\·enue bonds issued by or on behalf of the City of Dallas. such re\cnue bonds being payable and secured by the revenues dcri \'Cd from the ownership and operation of LO\ e Field. In order to satisfy its obligations hereunder. the City of Dallas agrees to usc best efforts to issue and sell revenue bonds in such amounts and on tem1s that are commercially reasonable in the credit markets. Sowhv,·cst Airlines and American Airlines hereby each agree to enter into such additional agreements that are necessary to facilitate the issuance of such revenue bonds. provided. hov.;ever, nothing herein shall obligate either airline to be an obligor or guarantor of such bonds. ~either the obligations under this Contract nor the obligations with respect to such revenue bonds shall constitute a debt of the City of Dallas payable from, or require the payr:.1ent or expenditure of funds of the City of Dallas from, ad valorem or other taxes imposed by the City of Dallas.
3. VE:\CE. The Parties agree that in the c\·cnt of any litigation in connection with this Contract, or should any legal action be necessary to enforce the tenns of this Contract, exclusive venue shall lie in either Dallas County, Texas or Tarrant County, Texas.
4, \Q:\-Ll:\B!LlTY FOR OTHER PARTIES' OBUGt\T!O~S. COSTS. A!\D ATTQR.\'EYS FEES. Each Party hereunder shall only be responsible and liable for its own obligations, costs, and attorneys fees in connection with the performance of this Contract. or any dispute or litigation that may arise in connectior: \\ ith this Con tract.
5. APPLICABLE LA \VS A:\D R.f..PJsESE\TATIO:t\S. This Contract is made subjecr to the provisions of the Charter and ordinan(;es of the cities of Dallas and Fort \Vorth. in existence as of the date hereof', and all applicable State and federal Jaws. Each City, as to itself only, represents and warrants that its existing Charter and ordinances do not preclude such City from executing this
Final Cor.rracr ·\mm;g ih~ C.ty of ~)~ila>. C'll;. ,,f t'on W:.nn, SouthiH'St Airilr1C'$. Amen can Airlines. und DF\\' Bo:trJ to R~sc1'1<.' the"\\ nght ,\m~ndmcn:'' lssu~s
-
Contract or performing its obligations under this Contract in accorda.::1cc '-Vith its tenns. American Airllnes. Southwest Airiines and the DF\\' Board. each as to itself only. represent and \Varrant that it has the fu11 power and authonty to enter into this Comract and perfom1 its obligations under this Contract in accorchmce: with its terms.
6. EFFECTIVI; D:~:n::. ::\otwithstar;ding anything to the contrary herein. the Parties agree that (i)
Sections 1, 7. 8. 9. 14. 15, and l6 of Artick Land all Sections of Article II. shall take effect as of the last date of execunon of this Contract by any of the Parties and (ii) the remaining Sections of Article I. shall take effect on the date that kgislation that would allow the Parties to implement the ten11S and spirit of this Con·.ract is signed into lav·:.
i. \'0\'-SEVERABlL!TY. (a) The tenns of this Contract arc not sen;rable. Therefore, in the event any one or more of the provisions contained in this Contract shali for any reason be held to be invalid, illegal, or unenforceable in any respect, then this Contract shall be considered null and void and unenforceable, except as othmvise may be agreed to by all Parties. (b) Notwithstanding paragraph (a) hereof, each Party shall use its best efforts to restore or replace the affected provisions so as to effectuate the original intent of the Parties.
8. CQL:\TERPARTS. This Contract may be executed in any number of counterparts, each of which shall be deemed an original and constitute one and the sarne instrwnent.
9. CAPTTO::\S. The captions to the various clauses of this Contract are for informational purposes only and shall not alter the substance of the tenns and conditions of this Contract.
10. SJ,;CCESSQRS A::\D ASSIG'\.JS: SC:BLESSEES. This Contract shall be binding upon and inure to the benefit of the Parties hereto and their respective successors and assigns. Furrher, the Parties agree that any sublessee or other entity who subleases or uses either American Airlines' or Southv.,est Airlin\!s· gates at Lo\e Field is subject to and bound by the tenns of this Contract. including, but not limited to, paragraph l3 of Article I.
11. :\QTHlRD PARTY BE:\EFIClARfES. The provisions of this Contract are solely for the benefit of the Parties hereto; and nothing in this Contract, express or implied, shall create or hrrant any benefit, or any legal or equitable tight, remedy, or claim hereunder. contractual or othenvise, to any other person or entity.
12. ;.iQTICES. All notices required or permitted under this Contract shall be personally delivered or mailed to the respective Parties by depositing same in the Cnited States mail, postage prepaid. at the addresses shown below, unless and umil the Parties are otherwise notified in writing of a new address by any Party. Mailed notices shall be deemed communicated as of fi\"e days after mailing.
If intended for the City of Dallas:
City .\1anager. City of Dallas City Hall, Room 4E\ 1500 .\1arilla Street Dallas. Texas 75201
With a copy to:
City Attorney, City of Dallas Dallas City HalL Rm. 7C;..J 1500 Marilla Street Dallas. Texas 75201
Fin3i Contract Amon" :he Ct!v or Dail;;s. Ctr\ of fo:1 Worth, South>l est Ai: lines. Amen can A;ritncs, and " DF\\" l3oar,~ ((l Resoivc th<: "\\right ,\n:endrn~nf· fss"~'
-

Jfmrendcd for :he City oi'Fon \\'onh:
C:ty :V!ana~cr. City ofF l)rl W onh l 000 Throckmorton Fort \\onh. Texas 76lu2
If intende<! for the Df\V ln\ernationa: Airport Board:
Chief Executive O:'r1cer DF\\' fmer:1ational Airport Board P.O. Drawer6194.28 32UO E. Airrield Drive DF\\' Airpon. TX 75261-9428
If intended for American Airlines. Inc.:
ChiefExecmive Ofticcr An1erican /\irlines. Inc. 4333 Amon Carter Bl\d .. \10 5621 fort \Vonh. Texas 76155
If intended for Southwest Airlines Co.:
Chief Executive Officer South\\ est Airlines Co. 2702 Love Field Drive Dallas, Texas 75.235
\\'ith a copy to:
City Attorney. C o·: For: \\'onh 1 GUO Throckmorton Fort Worth. Texas 76102
With copy to:
Legal Counsel DFW International Airpon Board P.O. Drawer 6 i 9428 3200 E. Airfield Drih: DFW Airport, TX 75261-9428
With copy to:
General Counsel American Airlines, Inc. 4333 Amon Carter Blvd .. MD 5618 Fort Worth, Texas 76155
\Vith copy to:
General Counse1 Southwest Airlines Co. 2702 Love Field Dri\e Dallas, Texas 75235
13. PARTiAL WAIVER OF GOVER:\:V1E\TAL l.\1\1V\!TY. The Cities and the DFW Board, by signing this Contract and to the extent pennincd by law. waive their respective immunity from suit by the Parties. but only "ith respect to a suit to enforce this Contract by a Party seeking a restraining order, preliminary or permanent injunctive relief~ specific pcrfom1ance, mandamus, or declaratory relief. The Cities a:1d the DF\V Board do not waiYe any other defense or bar against suit available to the Cities or the DF\V Board.
14. :-\0 I:\DIVIDC.AL lt"\BILJLJ.:. To the extent allowed by law, no of1icer. agent, employee, or representative of any of the Parties shall be liable in his or her individual capacity, nor shall such person be s~Jbjcct to personal lwbility arising under this Contract.
!5. U.\l!T A TIO:\ OF RE:V1EDIES. t::\DER ~0 CIRCL:V1STA:\CES SHALL A:\Y PARTY BE LIABLE TO A:\'{ OTHER PARTY HEREl:?\DER, I:\ CO:-\TRACT OR f\ TORT, FOR :v10:\ETARY DA,\1AGES RESCLTl:\G IX \VHOLE OR f:\ PART FOR A:\Y BREACH BY SUCH PARTY, WHETHER \EGLJGE:\T OR \VITH OR WITHOL'T FALL T 0:\ ITS PART, OF A:\Y'
F;~;~,u ContrJ.:-~ .\n;ong the Cir) ~-;( D~i1a:-.. Ci;:: ~_)f For: \\'or! h. Sou!h\\·-:;;t Ail'r;n(!'S. An11!rican A;rlm~s~ and Jr\\. B~}J:'~ to Rc~vh·e tb.: "\\ rigfn ,.~~~~~r ... :ir-rh::i! .. h~uc..;
-

PROVISJO'..; OF TH !S CO'\TRACT. PROVIDED, HO\VEVER. (:\'\D !'\ EXCHA'\()1:: FOR rHE FOREGOI'\G SE:'\TE'\CE}. 1'\ TH E E\'E'\T OF A'\ Y SCCH BReACH OR THREATE:\ED BREACH BY A'\Y PARTY. ALL PARTIES AGREE TH '\T EACH '\0'\-BREACHI'\G PARTY \VILL BE E'\T!TLED TO SEEK ALL EQCTTAB LE REYlEDIES I'\CLlDI'\G. WJTHOlT U\tl.ITA TIO:\. DECREES OF SPECIFIC PERFOR:V1A'\CE. RESTRAI'\1:\G ORDERS, WRlTS OF PRELI.\fl'\AR Y A'\ 0 PER\11:\:'\ E'\T 1:\JC'\CTTO'\ A'\D .\1A'\DA\-llS, .:\S WELL AS DECLAR.'-\ TORY RE LI EF. TO E:\FORCE THI S CO'\TR . .\.CT. PROVIDED. FCRTHER. AS A PREREQUS!TE TO TH E FJLL'\G OF A:\Y LA \VSUT BY A'..;'r' PARTY. ALL PARTIES SHALL [\GOOD FAITH SL'B \-1!T A'\'{ DISPLTE TO :\0:\-BI'\DI:\G \1EDLA.Tl0'\. WHlCH \-1CST BE CO:V1PLETED WlTH!:\ 60 DAYS FR0\1 THE DATE :\OTICE REQL EST!:\G \-lEDIA TIO:\ IS C0.\1.\f L'\.lCATE D PL RSLA:\T TO SECTlO:\ 12. OF ARTICLE II. OF THIS CO:\TRACT.
16. LOVE FIELD GE~RAL .AVIATIO:\. L .S. GOVER:\ME'\T FLIGHTS A'\D CHARTER FLIGHTS. '\othing in this Contract is intended to affect general aviat ion scnice at Love Field, including, but not limited to, t1i ghts to or from Love Field by general aviation aircraft for air taxi sen icc, pri\·ate or sport flying. aerial photography, crop dusting, business t1ying, medical evacuation, fl ight training. police or fire fighting, and similar general :n·iation purposes. or by aircraft operated by any agency of the L.S. Go\·cmment or by any airline under contract to any agency of the C.S. Government. Charter tlights at Lo\-e Field shall be limited to destinations within the 50 Cnited States and the District or Coiumbia and shall he limited to no more th<m ten per month per air carrier except as otherwise permitted by Section 29(c) of the Wright Amendment. AJ\ tlights operated by air carriers that lease terminal gate space shall depart !rom and arri ve at on~ or those leased gates. Charter tlights operated by ai r carriers that do not k asc tcm1inal space may operate from non-tenninal facilities or one of the 20 tcnn inal gates. For the purposes of this Contract, "charter i1ight" shall have the meaning currently gi ven in 14 C. F.R. 212.2 (2006). This limitation shall remain in effect per111anently_
I i. E:\TIRE AGRE E:V1E'\.T This Contract embodies the complete agreement of the Parties hereto relating to the matters in thi:; Contract: and except as otherwise provided herei n, cannot be modified \\i thout written agreement of ali the Parties. to be attached ro and made a pan of this Contract.
.i- 11' I ' .
EXECL~TED as of th is the L day of July. 2006.
CITY Of: DALLAS. TEX·\S APPROVED AS TO FOR\1 :
Perkins, Jr ., City Attomey
F ~ ~Ji Con : r~.:• .\ ;:;Jr.;.: rh~ C::y of Da:!~,. C:ty of Fori \\'or: h. Southwcs\ A<rlincs .. -\ mer:<';Jn A:rlmcs. ~r.d Dl ,. \\' Bo~lrd ~o Ke .;oh·e :h ~ "\\·d::.h l -\ li1i..' rhim.:r~ ;·· 1:--:W l!'..:
i' a;;c : I.J oz' I:
-

CITY OF FORT WORTH. TEXAS
DALLAS FORT \VORTH 1'\TER::\ATIO:\AL AIRPORT BOARD
A\1ERlCA~ AIRU\ES, 11\C.
APPROVED AS TO FOR.\1 :i.'\D LEGALITY:
APPROVED AS TO FO~v1:
(/~ ·--;;.
?-;:;--~---... --.~-~-~.:==-----Gary Keane. D, FW Legal Counsel
SOL:TH\VEST AIRLI:\ES CO.
Herben D. Kelleher, Executive Chairman
f'inai Com:-~~~ Among :h~ Cit: o( D:this. Ci:y o: Fon Wot1h. South\\ ~st Airl:ncs. American Alrilncs. and ~)f'\\ Bo~~d to Reswh.t thl! ··\\.'right Arner;r.Jmcm" 1'-l!'th.~!\
-

January 3, 2008
Ms. Theresa Pella, Manager Air Quality Planning Section Texas Commission on Environmental Quality P.O. Box 13087, MC 206 Austin, TX 78711-3087
Southwest Airlines Co. P.O. Box 36611, HDQ-1SE 2702 Love Field Drive, HDQ-1 SE Dallas, TX 75235 214-792-3572
RE: Final Dallas Love Field Projected Emissions Calculations for 2009 for the EightHour Ozone Attainment Demonstration for the State Implementation Plan Revision for the Dallas/Fort Worth (DFW) Area
Dear Ms. Pella:
Southwest Airlines Co. has been involved with the City of Dallas and the North Central Texas Council of Governments in the development of projected 2009 emissions calculations for aircraft and ground support equipment for Dallas Love Field. The projected emissions are for the Eight-Hour Ozone Attainment Demonstration for the State Implementation Plan Revision for the Dallas/Fort Worth (DFW) Area. This correspondence will serve as confirmation of our agreement with the final emissions calculations attributable to Southwest Airlines Co. being submitted by the North Central Texas Council of Governments.
Should you have any questions regarding this correspondence or the data submitted by Southwest Airlines Co. in support of these calculations, please don't hesitate to contact Elaine Kames at (214) 792-3572.
I
1 ~~ · own (./"Vicy President of Safety and Security
So thwest Airlines Co.
CC: Madhusudhan Venugopal, NCTCOG

March 21, 2008
Mr. Christopher W. Klaus Senior Program Manager North Central Texas Council of Governments 616 Six Flags Drive, Suite 200 Centerpoint 2 P.O. Box 5888 Arlington, Texas 76005-5888
Re: DFW Emissions Forecast
Dear Mr. Klaus:
DALLAS/FORT WORTH INTERNATIONAL AIRPORT
3200 EAST AIRFIELD DRIVE, P.O BOX 619428
DFW AIRPORT, TEXAS 75261-9428 www.dfwairport.com
T 972 574 8888 F 972 574 0000
We have reviewed the aviation activity and emissions forecast information for DFW Airport, prepared by NCTCOG and TCEO. That information is briefly summarized below:
2005 2009
DFW (L TO cycles) I 356.440 391 ,371 Aircraft Emissions (NOx - tpd) 10.20 11.20 GSE Emissions (NOx- tpd) 1.3
1.43 Source: NCTCOG
We concur that the operations forecast and emissions projections for 2005 and 2009 look reasonable and we are comfortable with these projections. Thank you for the chance to review this information and for your diligent work in SIP development efforts.
If you have any questions or need additional information, please contact David Hennessy at 972/973-5568.
Sincerely,
!~!~ Vice President - Environmental Affairs
cc: J . Crites, EVP Operations Division Gary Keane, Esq., General Counsel David Hennessy, Senior Planner EAD Theresa Pella, TCEO Peter Ogbeide, TCEO

Attachment C Model-Based Ozone Response Calculations
The availability of updated emissions information regarding reductions in airport emissions, DERCs, and backup generator emissions will reduce ozone in both the future case and control case. The impact of these changes in NOX emissions can be calculated using response data from previously run sensitivity tests in order to quantify the differences in ozone expected to result from the adjustments to the NOX emissions. Since the calculated response over the relatively small ranges used in the sensitivity tests is linear, these ozone adjustments can simply be added or subtracted from the original numbers in the SIP. However, for larger reductions, the ozone response to NOX is known to be a downward curve. The CAMX chemistry (and the real world) demonstrates a stronger response with more NOX reductions. Adding up the linear estimates understates the cumulative model response, and is therefore a conservative estimate of the total response to reductions. Additionally, a model-based analysis is provided to estimate the potential ozone reductions that could occur from an estimated TERP funding allotment for the DFW area. Model Linearity Over Small Ranges Figure 1: DFW Response to Non-Road NOX Reductions at Frisco and Denton shows the model response using data from EPA Region 6 model replication runs for the two controlling monitors in the DFW area, and indicates that the response is linear over these ranges.
TCEQ/Breitenbach February 21, 2008
DFW Response to Non-Road NOx ReductionsCombo 10, EPA Test Data
Frisco Trend Liney = -0.0363x + 89.274R2 = 0.9996
Denton Trend Liney = -0.058x + 88.763R2 = 0.9974
85.0
86.0
87.0
88.0
89.0
90.0
0 5 10 15 20 25 30 35 40 45
Percent Reduction in NOx
Ozo
ne (p
pb)
Frisco C31 Denton C56
Linear (Frisco C31) Linear (Denton C56)
DFW Response to Non-Road NOx Reductions Combo 10-EPA Test Data
Figure 1: DFW Response to Non-Road NOX Reductions at Frisco and Denton
C-1

In Figure 1: DFW Response to Non-Road NOX Reductions at Frisco and Denton NOX emissions reductions are calculated as a percentage change. A ten percent reduction corresponds to 10.7 tpd of NOX, 19 percent corresponds to 20.4 tpd, and 40 percent corresponds to 43 tpd. The colored lines in Figure 1: DFW Response to Non-Road NOX Reductions at Frisco and Denton show the actual model response and the black overprinted lines show the linear best fit to the data. From a visual perspective, the black lines are a very good fit to the data.
From a mathematical perspective, the r2 for the Frisco data is 0.9996, indicating that 99.96 percent of the variance can be accounted for with a straight line and only 0.04 percent of the variance is associated with curvature or other variables. Similarly, the r2 for Denton is 0.9974, indicating that 99.74 percent of the variance can be accounted for with a straight line and only 0.26 percent of the variance can be attributed to curvature. Therefore, for all practical purposes, the ozone response is linear over the range of NOX adjustments in these calculations. Figure 1: DFW Response to Non-Road NOX Reductions at Frisco and Denton also shows that the response (the slope) at the Denton monitor is steeper than at the Frisco monitor, indicating that the ozone response to NOX reductions is stronger at the Denton monitor than at the Frisco monitor. Numerically, the Frisco monitor slope is -0.036 and -0.058 at the Denton monitor. The difference in model response occurs because the winds during this episode blow from the urban core toward Denton more frequently than the winds blow toward the Frisco monitor. Model-based Ozone Response Calculations for Airports and Back-up Generators using EPA Non-Road Sensitivity Tests The EPA ran several different sensitivity tests to evaluate how the model responded to NOX reductions in different emissions categories. The TCEQ used the results of EPA Region 6 non-road sensitivity tests to determine the impact of NOX controls and adjustments in the DFW area for airport emissions and back-up generators. Table 1: EPA Non-Road Sensitivity Test Results shows the results of the EPA non-road sensitivity test. The EPA first replicated the TCEQ 2009 Combo 10 run to make sure the results were the same as those determined by the TCEQ. The second column of the table shows the eight-hour average ozone (in ppb) resulting from the Combo 10 run for every monitor in the DFW area. The third column of the table shows the ozone that resulted from the EPA test with 10.7 tons (10 percent) of NOX removed from the non-road sources inside the DFW nine-county nonattainment area. The fourth column shows the difference in ppb for every monitor as a result of the 10.7 tpd reduction. The last column of the table shows the model response factor in ppb/ton that results from dividing the ppb differences in the fourth column by 10.7 tpd.
C-2
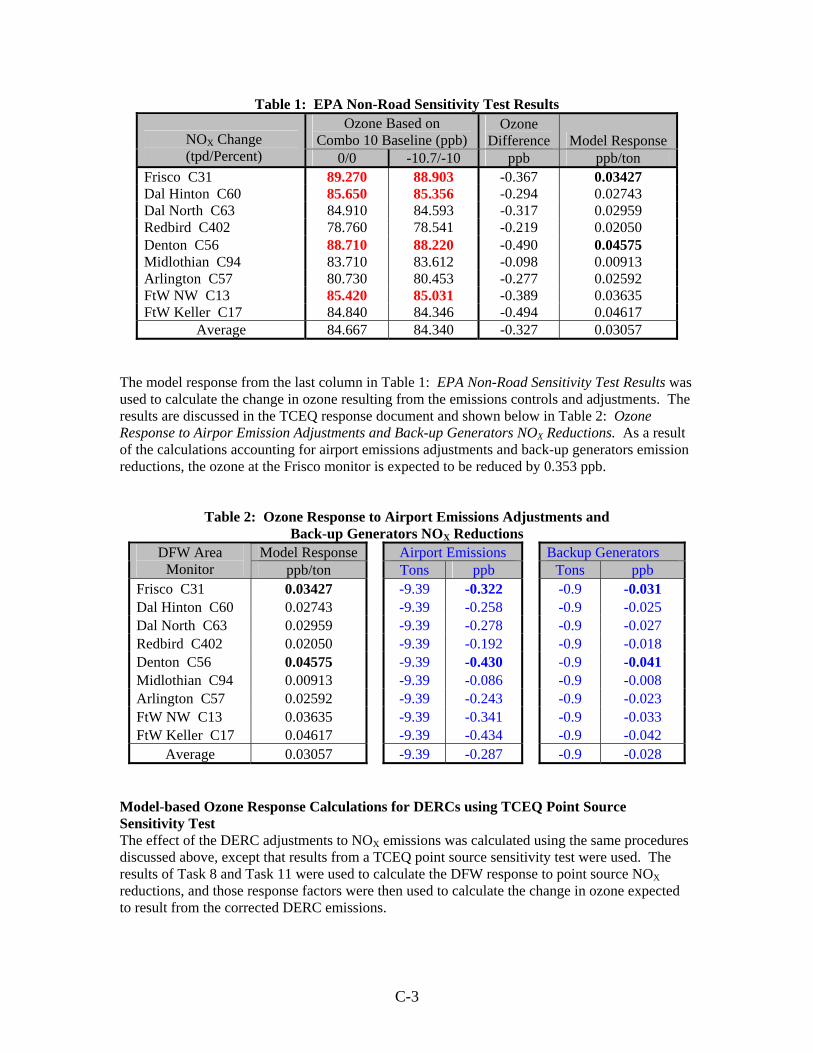
Table 1: EPA Non-Road Sensitivity Test Results Ozone Based on
Combo 10 Baseline (ppb) Ozone
Difference Model Response NOX Change (tpd/Percent) 0/0 -10.7/-10 ppb ppb/ton
Frisco C31 89.270 88.903 -0.367 0.03427 Dal Hinton C60 85.650 85.356 -0.294 0.02743 Dal North C63 84.910 84.593 -0.317 0.02959 Redbird C402 78.760 78.541 -0.219 0.02050 Denton C56 88.710 88.220 -0.490 0.04575 Midlothian C94 83.710 83.612 -0.098 0.00913 Arlington C57 80.730 80.453 -0.277 0.02592 FtW NW C13 85.420 85.031 -0.389 0.03635 FtW Keller C17 84.840 84.346 -0.494 0.04617
Average 84.667 84.340 -0.327 0.03057 The model response from the last column in Table 1: EPA Non-Road Sensitivity Test Results was used to calculate the change in ozone resulting from the emissions controls and adjustments. The results are discussed in the TCEQ response document and shown below in Table 2: Ozone Response to Airpor Emission Adjustments and Back-up Generators NOX Reductions. As a result of the calculations accounting for airport emissions adjustments and back-up generators emission reductions, the ozone at the Frisco monitor is expected to be reduced by 0.353 ppb.
Table 2: Ozone Response to Airport Emissions Adjustments and Back-up Generators NOX Reductions
Model Response Airport Emissions Backup Generators DFW Area Monitor ppb/ton Tons ppb Tons ppb
Frisco C31 0.03427 -9.39 -0.322 -0.9 -0.031 Dal Hinton C60 0.02743 -9.39 -0.258 -0.9 -0.025 Dal North C63 0.02959 -9.39 -0.278 -0.9 -0.027 Redbird C402 0.02050 -9.39 -0.192 -0.9 -0.018 Denton C56 0.04575 -9.39 -0.430 -0.9 -0.041 Midlothian C94 0.00913 -9.39 -0.086 -0.9 -0.008 Arlington C57 0.02592 -9.39 -0.243 -0.9 -0.023 FtW NW C13 0.03635 -9.39 -0.341 -0.9 -0.033 FtW Keller C17 0.04617 -9.39 -0.434 -0.9 -0.042
Average 0.03057 -9.39 -0.287 -0.9 -0.028 Model-based Ozone Response Calculations for DERCs using TCEQ Point Source Sensitivity Test The effect of the DERC adjustments to NOX emissions was calculated using the same procedures discussed above, except that results from a TCEQ point source sensitivity test were used. The results of Task 8 and Task 11 were used to calculate the DFW response to point source NOX reductions, and those response factors were then used to calculate the change in ozone expected to result from the corrected DERC emissions.
C-3

Table 3: Point Source Sensitivity Test NOX Emissions Data shows the weekday NOX emissions in tpd for Tasks 8 and 11, calculated for each source category. The last column calculates the difference in NOX for each emissions category. Since the only changes between the two runs were 15 tpd in point source emissions, and no changes occurred outside of the DFW area, Tasks 8 and 11 provide an accurate basis for evaluating the model response to point sources in the DFW area.
Table 3: Point Source Sensitivity Test NOX Emissions Data Source Categories Task 8 Task 11 Difference (tpd)
Inside DFW Reference area (16-county) On-Road Mobile 212 212 0.0 DFW Elevated Points 80.0 69.0 -11.0 DFW Low Level Points 10.0 6.0 -4.0 Area Sources 67 67 0.0 Non-road 123 123 0.0 Inside Sub-total 280.0 265.0 -15.0 Rest of Texas (outside DFW Reference Area) On-Road Mobile 691 691 0.0 DFW Elevated Points 1030 1030 0.0 DFW Low Level Points 73 73 0.0 Area Sources 467 467 0.0 Non-road 379 379 0.0 Outside Sub-total 1949.0 1949.0 0.0 Grand Total 2229.0 2214.0 -15.0
Table 4: Model Response to Point Source Reductions shows how the model responds to the 15 tpd of NOX reductions in Task 11 allocated to non-EGU, non-kiln point sources inside the DFW area. The calculation procedures are the same as described and used in Table 1. When the change in ozone between the two tasks is divided by the 15 tpd emissions change, the response factor calculated for the Frisco monitor is 0.02250 ppb/ton of NOX reduced.
Table 4: Model Response to Point Source Reductions
DFW Area Monitor Task 8 Task 11 Difference
(ppb) Model Response
ppb/ton Frisco C31 91.2 90.9 -0.34 0.02250 Hinton C60 87.6 87.2 -0.31 0.02083 Dallas N C63 87.0 86.7 -0.31 0.02083 Dallas Exec C402 79.7 79.3 -0.41 0.02750 Denton C56 89.6 89.3 -0.27 0.01833 Midlothian C94 84.5 83.9 -0.57 0.03833 Arlington C57 87.2 86.6 -0.59 0.03917 FtW NW C13 87.6 87.1 -0.50 0.03333 FtW Keller C17 86.0 85.7 -0.33 0.02167
Average 86.71 86.30 -0.40 0.02694
C-4

Table 5: Ozone Response to DERC Emissions Adjustment shows how the ozone would respond to flow-controls on DERC usage. The SIP modeling assumed that all the DERCs would be used in 2009, which is conservative and unrealistic. However, with flow control, the DERC usage can be constrained.
Table 5: Ozone Response to DERC Emissions Adjustment DFW Area
Monitor ppb/ton DERC Tons
DERC ppb
Frisco C31 0.02250 -17.2 -0.387 Hinton C60 0.02083 -17.2 -0.358 Dallas N C63 0.02083 -17.2 -0.358 Dallas Exec C402 0.02750 -17.2 -0.473 Denton C56 0.01833 -17.2 -0.315 Midlothian C94 0.03833 -17.2 -0.659 Arlington C57 0.03917 -17.2 -0.674 FtW NW C13 0.03333 -17.2 -0.573 FtW Keller C17 0.02167 -17.2 -0.373
Average 0.02694 -17.2 -0.463
The TCEQ anticipates that controlling DERC usage will reduce NOX in the DFW area by 17.2 tpd. At the Frisco Monitor, the ozone change is calculated by multiplying the Frisco response factor (0.02250) by the 17.2 tpd of NOX reduction, which reduces ozone by 0.387 ppb at the Frisco monitor. Since each of the individual adjustments is linear, and the aggregate response is not linear, the actual response is expected to be greater than the sum of the individual components. So, when these ozone adjustments are added together, they provide a conservative estimate of the total ozone response. Model-based Ozone Response Calculations for TERP using EPA Non-Road Sensitivity Tests In addition to determining the ozone response of NOX controls and adjustments for airport emissions and back-up generators, the TCEQ used the results of EPA Region 6 non-road sensitivity tests to estimate the possible impact on DFW area ozone by the estimated TERP program emissions reductions. In the example shown in Table 6: Estimated Ozone Response to TERP NOX Reductions the response factor in ppb/ton for each monitor is multiplied by the 14.2 tpd NOX reduction anticipated to result from the TERP program. It is anticipated that as a result, the ozone at the Frisco monitor would be reduced by 0.487 ppb.
C-5

C-6
Table 6: Estimated Ozone Response to TERP NOX Reductions Model Response TERP (Non-Road) DFW Area
Monitor ppb/ton Tons ppb Frisco C31 0.03427 -14.2 -0.487 Dal Hinton C60 0.02743 -14.2 -0.390 Dal North C63 0.02959 -14.2 -0.420 Redbird C402 0.02050 -14.2 -0.291 Denton C56 0.04575 -14.2 -0.650 Midlothian C94 0.00913 -14.2 -0.130 Arlington C57 0.02592 -14.2 -0.368 FtW NW C13 0.03635 -14.2 -0.516 FtW Keller C17 0.04617 -14.2 -0.656
Average 0.03057 -14.2 -0.434

Attachment D
Barnett Shale Oil And Gas Wells
including D-FW Ozone Monitors

281
Italy
PilotPoint
Greenville
DallasExecutive
DallasHinton
CleburneAirport
Parker Co
EagleMountain
Lake
Granbury
Kaufman
GrapevineFairway
RockwallHeath
DallasNorth
Arlington
Denton
MidlothianOFW
Frisco
Keller
Ft. WorthNorthwest
Freestone Anderson
Bosque
Comanche
Hill
SomervellNavarro
HendersonErath
HoodJohnson
Ellis
Kaufman
VanZandt
PaloPinto
Parker
Tarrant
DallasRockwall
Rains
CollinDenton
WiseHopkins
Hunt
Jack
Delta
FanninCooke GraysonMontagueClay Barnett ShaleOil and Gas Wells
including D-FW Ozone Monitors
This map was generated by the Chief Engineer's Office, Air Quality Planning Division of the Texas Commission on Environmental Quality. No claims are made to the accuracy or completeness of the data or to the suitability for a particular use. For information concerning this map, contact the Air Quality Division at (512) 239-1459. Raj Nadkarni (512) 239-1934
Source Data: Railroad Commision of Texas, Jan. 2008, WellsJan. 25, 2008
Texas Commission on Environmental QualityChief Engineer's OfficeAir Quality DivisionPO Box 13087 (Mail Code 164)Austin, Texas 78711-3087
Protecting Texas byReducing andPreventing Pollution
LegendDFW Ozone MonitorOilGasOil/GasPermitted
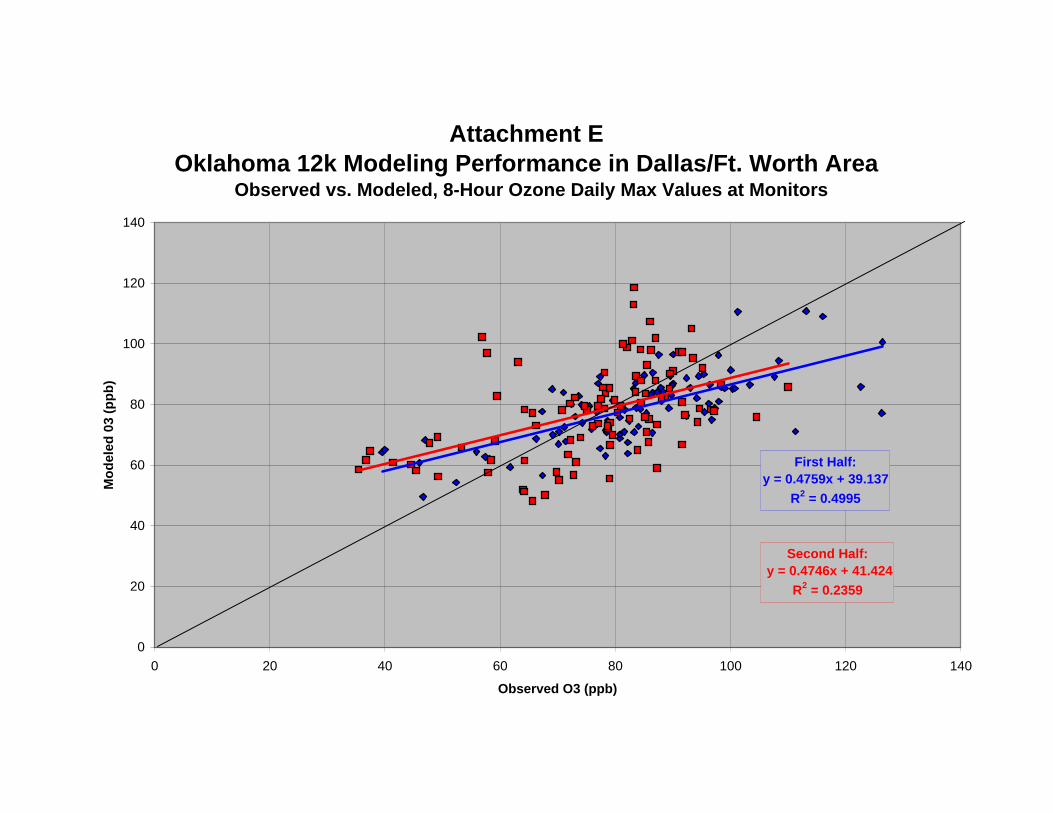
Attachment EOklahoma 12k Modeling Performance in Dallas/Ft. Worth Area
Observed vs. Modeled, 8-Hour Ozone Daily Max Values at Monitors
First Half: y = 0.4759x + 39.137
R2 = 0.4995
Second Half: y = 0.4746x + 41.424
R2 = 0.2359
0
20
40
60
80
100
120
140
0 20 40 60 80 100 120 140
Observed O3 (ppb)
Mod
eled
03
(ppb
)

TCEQ/Breitenbach Attachment F - 615DFWRRFAnalysis.xls
Attachment F DFW Average Relative Reduction Factors by Monitor
EPA Method, Exclude data if base case < 70 ppb, Ranked by Core RRF
0.8000
0.8500
0.9000
0.9500
1.0000
Weathe
rford
Denton
Eagle
Mt Lak
eFtW
Kell
erCleb
urne
Anna
FtW M
each
amGran
bury
Kaufm
anGrap
evine
Frisco
Rockw
allMidl
othian
Arlingto
n RO
Dallas
Execu
tive
Sunny
vale
Dallas
Nort
hDall
as H
inton
RR
F
Core Period RRF Extension RRF
Relatively Responsive Relatively Stiff, Unresponsive
Urban Core MonitorsDownWind Monitors