Embed Size (px)
Citation preview

Hydrothermal Liquefaction of
Lignocellulosic Biomass
By:
Nur Atiqah Nasir
The University of Sheffield
Faculty of Engineering
Department of Chemical and Biological Engineering
April 2019

A special dedication to:
My beloved and ever-inspiring late father Nasir Ali,
My lovely late mother Maryam Ahmad,
And all my brothers:
Nukman Nasir
Nasuha Nasir
Nasiruddin Nasir
Nuh Nasir
Nasreen Nasir
iii | P a g e
0.Acknowledgments
First and foremost, I would like to express my deepest gratitude and
appreciation to my supervisor, Dr James McGregor for his attention, guidance,
continues comments and patience throughout this PhD project.
I would like to convey my thanks to the technical staff in Department of
Chemical and Biological Engineering; Adrian Lumby, Andy Patrick, Duncan
Scofield, Usman Younis and Mark Jones who have been involve directly and
indirectly in completing my research project. Also, thanks to Ali Al- Shathr, Cynthia
Kartey, Ming Liu and all members in Catalysis Group, University of Sheffield that
assisted me in completion of this PhD. I also thankful to Malaysian government and
Universiti Sains Islam Malaysia (USIM) for the scholarship and financial support
during my study time in Sheffield.
My personal appreciation to all my family members especially my sister in-
law, Azmainie and all my brothers for their patient, love and the moral support,
especially after our father had passed away; which I consider all of that as something
beyond repayment. To those who helped me with advices and motivations (my
cousin, Dalina and my housemate, Ejok) thank you. Last but not least, a special
thanks to all my friends in Sheffield (Kamalliawati, Norfadhilah, Norhuda, Zati
Aqmar and TCC‘s group) and in Malaysia (Salmiah and Sarina), who always kept
me going in positive vibes.
iv | P a g e
0.Abstract
The introduction of a bio-refinery approach in producing bio-chemicals
represents a potential opportunity to cover the increased demand for fine chemicals
and reduce the societal dependence on fossil sources for petrochemicals.
Valorisation of lignocellulosic material for the production of renewable chemicals
has attracted much attention as such chemicals could significantly improve the
economics of bio-refineries. The present work has investigated the conversion of
brewer's spent grain (BSG), a raw material in the form of food industry wastes into
value-added chemical and biofuels. BSG represent around 85% of the total by-
products generated from the brewing industry and is available in large quantities
throughout the year; however its primary application has been limited to animal feed.
Despite this, due to its chemical composition, it has value as lignocellulosic rich
material. In this thesis, raw BSG has undergone physical and chemical
characterisation to determine the composition and selection of appropriate
technologies for their utilisation. BSG contains a high moisture content (approx. 75
wt. %). As a consequence, any application towards utilisation of this waste needs to
consider the best way to handle their moisture content. Hydrothermal liquefaction
(HTL) is the thermochemical conversion of biomass by processing in a hot,
pressurised water environment for sufficient time to break down the solid
biopolymeric structure to predominantly liquid components. The potential of HTL to
break down the lignocellulosic compounds was demonstrated by using both biomass
model components (cellulose and lignin) and real biomass, BSG. However, due to
the complex composition of real biomass, the product distribution obtained from
BSG HTL is significantly different when compared to the biomass model. The most
favourable processing condition identified based on both model and real biomass
systems were found to be 250 ºC, 30 min reaction time and 80 barg. Further
investigation on HTL shows, with the addition of methanol, ethanol and 2-propanol
in direct liquefaction reaction, the conversion and water-soluble oil (WSO) yield
increased significantly compared to the pure water system. The best conversion was
obtained by a methanol-water solvent system at 82%, while 2-propanol-water system
produces the highest WSO yield at 29%. Moreover, BSG biochar also shows a
potential to be used directly as solid fuel without the need for significant
modifications.
v | P a g e
Table of Contents
Acknowledgments .................................................................................................. iii
Abstract .................................................................................................................. iv
List of Figure .......................................................................................................... ix
List of Table .......................................................................................................... xv
List of Abbreviation ............................................................................................. xvii
Chapter 1: Introduction ............................................................................................ 2
1.0 Introduction ............................................................................................... 2
1.1 Renewable Sources: Biomass ..................................................................... 2
1.1.1 Brewer‘s spent grain (BSG) ................................................................ 4
1.2 Hydrothermal liquefaction (HTL) .............................................................. 4
1.3 Objectives of the research .......................................................................... 5
Chapter 2: Literature review..................................................................................... 7
2.0 Introduction ............................................................................................... 7
2.1 Biomass: A renewable feedstock ................................................................ 7
2.1.1 Lignocellulosic biomass resources ...................................................... 8
2.1.2 Composition of lignocellulosic biomass ............................................ 15
2.2 Biomass conversion technologies ............................................................. 20
2.2.1 Biochemical conversion .................................................................... 21
2.2.2 Thermochemical conversion ............................................................. 22
2.3 Brewers spent grain (BSG): A case study ................................................. 32
2.3.1 Potential application of BSG ............................................................. 34
2.4 Conclusion ............................................................................................... 36
Chapter 3: Research methodology .......................................................................... 39
3.0 Introduction ............................................................................................. 39
vi | P a g e
3.1 Liquefaction reaction set-up and procedure .............................................. 39
3.1.1 Reactor set-up ................................................................................... 39
3.1.2 Experimental procedure .................................................................... 41
3.2 Product determination .............................................................................. 42
3.2.1 Liquid product .................................................................................. 42
3.2.2 Product calibration ........................................................................... 46
3.2.3 Solid residue and definition of conversion ........................................ 52
3.3 Characterisation techniques...................................................................... 52
3.3.1 Thermogravimetric analysis- differential thermal analysis (TGA-DTA)
52
3.3.2 ATR-Fourier – Transform Infrared (ATR-FTIR) spectroscopy ......... 53
3.3.3 X-rayFluorescence(XRF) .................................................................. 54
3.3.4 C, H and N elemental analysis .......................................................... 56
Chapter 4: Characterisation of BSG ....................................................................... 58
4.0 Introduction ............................................................................................. 58
4.1 Experimental procedures .......................................................................... 58
4.1.1 Materials........................................................................................... 58
4.1.2 Stage one- BSG pre-treatment ........................................................... 59
4.1.3 Stage two – FTIR,proximate and ultimate analysis of BSG ............... 60
4.1.4 Stage three-Determination of BSG composition ................................ 63
4.2 Results and discussions ............................................................................ 65
4.2.1 The moisture content of raw BSG ..................................................... 65
4.2.2 Characterisation of BSG ................................................................... 67
4.2.3 BSG composition .............................................................................. 74
4.3 Conclusion ............................................................................................... 86
Chapter 5: Preliminary study on HTL .................................................................... 89
5.0 Introduction ............................................................................................. 89

vii | P a g e
5.1 Materials and methods ............................................................................. 89
5.1.1 Materials........................................................................................... 90
5.1.2 Method ............................................................................................. 90
5.1.3 Product analysis ................................................................................ 91
5.2 Result and discussion ............................................................................... 92
5.2.1 Single model system ......................................................................... 92
5.2.2 Binary model system ...................................................................... 100
5.3 Conclusion ............................................................................................. 106
Chapter 6: HTL of BSG ....................................................................................... 109
6.0 Introduction ........................................................................................... 109
6.1 Experimental ......................................................................................... 110
6.1.1 Materials......................................................................................... 110
6.1.2 Experimental procedure .................................................................. 110
6.2 Product analysis ..................................................................................... 112
6.2.1 Liquid products ............................................................................... 112
6.2.2 Solid residue and biochar yield ....................................................... 113
6.3 Results and discussion ........................................................................... 114
6.3.1 Liquid product distribution ............................................................. 114
6.3.2 Effect of the reaction time of BSG HTL .......................................... 119
6.4 Conclusion ............................................................................................. 124
Chapter 7: Liquefaction of BSG: Effect of solvent ............................................... 126
7.0 Introduction ........................................................................................... 126
7.1 Material and experimental procedure ..................................................... 126
7.1.1 Material .......................................................................................... 127
7.1.2 Experimental procedure .................................................................. 127
7.2 Analysis of the product obtain ................................................................ 128
7.2.1 Liquid product and bio-oil yield ...................................................... 128

viii | P a g e
7.2.2 Solid residue and biochar yield ....................................................... 128
7.3 Results and discussion ........................................................................... 129
7.3.1 Alcoholic solvents in direct liquefaction of BSG ............................. 129
7.3.2 Effect of liquefaction solvent on bio-char of BSG ........................... 137
7.4 Conclusion ............................................................................................. 142
Chapter 8: Conclusion and recommendation for future work ................................ 145
8.1 Conclusion ............................................................................................. 145
8.2 Recommendation for future work........................................................... 147
9. REFERENCES ............................................................................................ 150

ix | P a g e
0.List of Figure
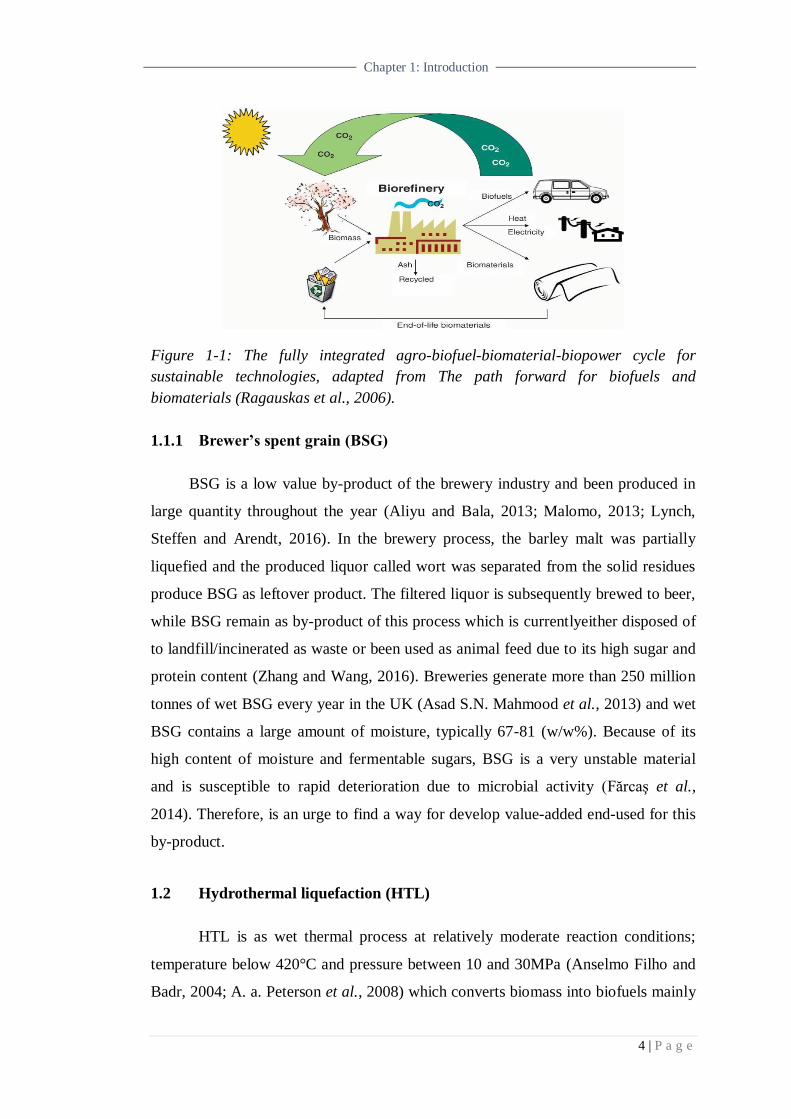
Figure 1-1: The fully integrated agro-biofuel-biomaterial-biopower cycle for
sustainable technologies, adapted from The path forward for biofuels and
biomaterials (Ragauskas et al., 2006). ...................................................................... 4
Figure 2-1: Summarize on two types of biomass feedstocks; starch and sugar crops
and lignocellulosic biomass...................................................................................... 8
Figure 2-2: Different type of forest biomass that can be supplied globally, adapted
from Achinas and Euverink, 2016. ......................................................................... 10
Figure 2-3: The general process in beer-brewing for production of beer and produce
BSG as by-product. ................................................................................................ 14
Figure 2-4: Structure of lignocellulosic materials; comprised of cellulose,
hemicellulose and lignin adapted from Genomics of cellulosic biofuels (Rubin,
2008). .................................................................................................................... 16
Figure 2-5: Chemical structure of cellulose chain connected together by β-1,4 -
glycosidic bonds and strong hydrogen bonds adapted from Lee, Hamid and Zain,
(2014). ................................................................................................................... 17
Figure 2-6:Chemical structure of xylan and glucomannan; the most existing
biopolymer present in hemicellulose fraction adapted from Lee, Hamid and Zain,
(2014). ................................................................................................................... 18
Figure 2-7: Chemical structure of lignin (p-coumaryl alcohol, coniferyl alcohol and
sinapyl alcohol) adapted from Lee, Hamid and Zain, (2014). ................................. 19
Figure 2-8: Biomass conversion technology for lignocellulosic biomass summarize
from McKendry, (2002), Tanger et al., (2013), Tekin, Karagöz and Bektaş, (2014)
and Kruse and Dahmen, (2015). ............................................................................. 21
Figure 2-9: Schematic diagram for biomass gasification adapted from Canabargro et
al., (2013) .............................................................................................................. 25
Figure 2-10: Overview of different hydrothermal biomass conversion processes
region referenced to the pressure-temperature phase diagram of water adapted from
Peterson et al.,(2008) and Kruse and Dahmen,(2015). ............................................ 26
Figure 2-11: Density, static dielectric constant, and ion dissociation constant (Kw) of
water at 30 MPa as a function of temperature. The dielectric constant ofwater drops
drastically as water is heated, and approaches that of a (room-temperature) non-polar
solvent at supercritical conditions (image and data adapted from Peterson et al.,(
2008)) ................................................................................................................... 27
Figure 2-12: Proposed mechanism of hydrothermal carbonisation from D-glucose
adapted from Tekin, Karagöz and Bektaş, (2014). .................................................. 28
x | P a g e
Figure 2-13: Simplified mechanism for conversion of cellulose/lignin to gaseous
products through aqueous intermediates at hydrothermal conditions of water adapted
from Güngören Madenoǧlu et al.,(2016). ............................................................... 30
Figure 2-14: Bio-oil platform bio refinery proposed by Xu (2014) and currently
under investigation. ................................................................................................ 31
Figure 2-15: Schematic representation of a barley kernel in longitudinal section
(adapted from Lewis and Young, 1995). ................................................................ 33
Figure 3-1: Photo of a) autoclave (Parker Autoclave Engineers) equipped with the
cooling system and b) SOLO Controller used for liquefaction reaction................... 40
Figure 3-2: Schematic diagram of the liquefaction reaction set-up. ......................... 40
Figure 3-3: Photo of 100 mL vessel used in the autoclave reaction system for current
work. ..................................................................................................................... 42
Figure 3-4: Basic components of a Gas Chromatograph-Mass Spectrometer Detector
(GCMS) instrument. .............................................................................................. 44
Figure 3-5:Diagram of a typical mass spectrometer configuration (Scienceaid, 2014).
.............................................................................................................................. 45
Figure 3-6: Calibration curve for guaiacol / 2- methoxy phenol with the value for
linear concentration regression, y = 1.067 x 10⁷x ................................................... 47
Figure 3-7: Calibration curve for 4 - ethyl- guaiacol / 4 - ethyl-2- methoxy phenol
with value for concentration linear regression, y = 1.271 x 10⁷x ............................. 48
Figure 3-8: Calibration curve for phenol with the value for linear concentration
regression, y = 0.822 x 10⁷x ................................................................................... 48
Figure 3-9: Calibration curve for glycerol with the value for linear concentration
regression, y = 0.511 x 10⁷x ................................................................................... 49
Figure 3-10: Calibration curve for acetic acid with the value for linear concentration
regression, y = 0.420 x10⁷x .................................................................................... 49
Figure 3-11: Calibration curve for furfural with the value for linear concentration
regression, y = 0.099 x 10⁷x ................................................................................... 50
Figure 3-12: Calibration curve for levulinic acid (LA) with the value for linear
concentration regression, y = 0.295 x 10⁷x ............................................................. 50
Figure 3-13: Calibration curve for 5-HMF with the value for linear concentration
regression, y = 0.725 x10⁷x .................................................................................... 51
Figure 3-14: Calibration curve for 2-pyrrolidinone with the value for linear
concentration regression, y = 0.699 x 10⁷x ............................................................. 51
Figure 3-15:A basic component of an FTIR spectrometer....................................... 54
xi | P a g e
Figure 3-16: Ionization of the K shell by an incident x-ray photon ......................... 55
Figure 3-17: Schematic of a simplified wavelength dispersive x-ray spectrometer .. 55
Figure 4-1: (a)Schematic depicting the ball motion inside the ball mill. Image
adapted from (Suryanarayana, 2001) and (b) BSG powder obtained after the milling
process ................................................................................................................... 60
Figure 4-2: Photo of the wet residue type of raw BSG used in this study. ............... 66
Figure 4-3: Weight percentage (wt. %) of moisture content in raw BSG used in
current experimental work. .................................................................................... 66
Figure 4-4: FTIR spectra of BSG used in this experimental study and their respective
wavenumber. ......................................................................................................... 68
Figure 4-5: (a) TGA and (b) DTG curves of BSG from proximate data analysis
conducted using thermogravimetric analysis at a temperature range of 30 °C to
950°C. .................................................................................................................... 70
Figure 4-6: Photo of BSG (a) before extraction (b) after extraction (extractive- free
BSG). Both samples underwent oven drying at 105°C for 24 hours. ....................... 75
Figure 4-7: Weight percentage (wt. %) of extractive content in BSG obtained by
Sohxlet extraction and using ethanol as solvent. Three replicate samples of BSG
were used for extractive content data analysis. ....................................................... 76
Figure 4-8: TGA and DTG curve of EF- BSG conducted using thermogravimetric
analysis at a temperature range 30 °C to 950 °C; (a) volatiles release region
represents the degradation of the lignocellulosic component, (b) full curve for
proximate analysis. ................................................................................................ 77
Figure 4-9: Comparison of FTIR spectra for (a) commercial cellulose vs
(b) extracted cellulose from BSG. .......................................................................... 79
Figure 4-10: Comparison of TGA/DTG curve of (a) commercial cellulose vs (b)
extracted cellulose from BSG ................................................................................. 81
Figure 4-11: Comparison of FTIR spectra of (a) commercial lignin vs. (b) extracted
lignin from BSG .................................................................................................... 82
Figure 4-12: Comparison of TGA/DTG curve of (a) commercial lignin vs
(b) extracted lignin from BSG conducted in the temperature range of 30 ºC to
950 ºC. ................................................................................................................... 84
Figure 4-13: The overall component of raw BSG based on characterisation technique
conducted in current work. ..................................................................................... 86
Figure 5-1: An overall flow chart for HTL reaction for model biomass conducted in
current chapter. ...................................................................................................... 90
xii | P a g e
Figure 5-2: GCMS chromatogram for liquid products of the HTL of cellulose.
Reaction conditions: microcrystalline cellulose = 0.1 g, distilled water = 10 mL, PHe=
80 barg, reaction temperature= 250 ºC and reaction time=30min. ........................... 93
Figure 5-3: The hydrolysis of cellulose is a process to break the β-1,4-glycosidic
bonds of the polymer which is the essential step for the conversion of cellulose to
produce glucose as a monomer unit (Huang and Fu, 2013). .................................... 94
Figure 5-4: Proposed reaction scheme for aqueous phase degradation of glucose in
HTL of cellulose to HMF, levulinic acid and furfural adapted from Yu, Lou and Wu,
(2008) and Weingarten, Conner and Huber (2012). ............................................... 95
Figure 5-5: Effect of reaction temperature on HTL of cellulose. Reaction conditions:
microcrystalline cellulose=0.1g, distilled water = 10 mL, initial He pressure at 20 °C
= 30 barg, reaction time = 30 min........................................................................... 96
Figure 5-6: Structural features of Kraft pine lignin. * indicates that no evidence for
the presence of either diphenylmethane or vinyl aryl ether linkages in Kraft lignin.
(Figure and justification were adapted from Zakzeski et al., (2010)). ...................... 98
Figure 5-7: GCMS chromatogram for liquid product obtained in HTL of lignin.
Reaction conditions: Kraft lignin = 0.1 g, distilled water= 10 mL, PHe= 80 barg,
reaction temperature=250 ºC and reaction time= 30 min. ....................................... 98
Figure 5-8: Proposed mechanism for the hydrothermal reaction of lignin adapted
from Wahyudiono, Sasaki and Goto, (2008), Bargbier et al., (2012) and Kang et al.,
(2013). ................................................................................................................... 99
Figure 5-9: Effect of reaction temperature in HTL of lignin. Reaction conditions:
Kraft lignin = 0.1 g, distilled water = 10 mL ,initial He pressure at 20 °C = 30 barg,
reaction time = 30 min. ........................................................................................ 100
Figure 5-10: GCMS chromatogram for liquid product obtained in HTL binary model
biomass system. Reaction conditions: Microcrystalline cellulose = 0.1 g, Kraft
lignin = 0.1 g, distilled water= 10mL, PHe= 80barg, reaction temperature=250 oC and
reaction time=30min. ........................................................................................... 101
Figure 5-11: Comparison of guaiacol concentrations produced in single and binary
HTL model biomass systems. Reaction conditions: Microcrystalline cellulose = 0.1 g,
Kraft lignin = 0.1 g, distilled water = 10 mL, initial He pressure at 20 °C = 30 barg
and reaction time=30min. ..................................................................................... 102
Figure 5-12: Comparison of acetic acid concentration produced in single (cellulose)
and binary HTL model biomass systems. Reaction conditions: microcrystalline
cellulose = 0.1 g, Kraft lignin = 0.1 g, distilled water = 10 mL, initial He supply = 30
barg and reaction time=30min. ............................................................................. 103
Figure 5-13: Effect of reaction time in binary model biomass system on (a)
components from lignin degradation (b) components from cellulose degradation.
Reaction conditions: microcrystalline cellulose = 0.1 g, Kraft lignin = 0.1 g, distilled
water = 10 mL, initial He supply = 30 barg and reaction temperature = 250 ºC. ... 104
xiii | P a g e
Figure 5-14: Simplified acidic and alkali pathway of hydrothermal conversion of
cellulose (Yin, Mehrotra and Tan, 2011) .............................................................. 106
Figure 6-1: An overall flow chart for the HTL process of real biomass, BSG ....... 110
Figure 6-2: The overall composition for5 g raw BSG used in current work based on
characterisation conducted in Chapter 4. .............................................................. 111
Figure 6-3: Reaction and separation procedure for BSG liquefaction process. ...... 111
Figure 6-4: Evaporation of the water solvent in the liquid product was conducted at
temperature 100 ºC. The liquid remains after the evaporation process was used to
obtain the water-soluble oil (WSO) for product yield. .......................................... 113
Figure 6-5: The drying process was conducted towards solid residue recovered after
the liquefaction by undergone oven dry heating at 105 ºC for 12 hours. The exact
amount of dried BSG after the process was used for residue and conversion yield.114
Figure 6-6: Total ion chromatogram of liquid phase product of HTL reaction from
BSG. Reaction conditions:rawBSG = 5 g, distilled water= 10mL, Initial He pressure
at 20 °C = 30 barg, reaction temperature= 300 ºC and reaction time=30min. ........ 115
Figure 6-7: Maillard reaction pathway adapted from Toor, Rosendahl and Rudolf,
(2011). ................................................................................................................. 117
Figure 6-8: Hydrolysis of triglycerides will produce one molecule of glycerol
together with three molecules of fatty acid. .......................................................... 118
Figure 6-9: The conversion, WSO yield and liquid amount obtained from BSG
HTLat different reaction time. Reaction condition: reaction temperature = 250ºC,
initial He pressure at 20ºC = 30 barg, 5 g of BSG, 8.75 mL of water. ................... 120
Figure 6-10: Acetic acid concentration at different reaction time obtained in HTL (a)
BSG system and (b) model biomass system. Reaction condition: reaction
temperature = 250 ºC, initial He pressure at 20 °C= 30 barg, real system = 5 g of
BSG, model system = 0.2 g model biomass. ......................................................... 121
Figure 6-11: (a) Guaiacol and (b) 4-ethylguaiacol concentration in HTL over
reaction time. Reaction condition: Reaction temperature = 250 ºC, initial He pressure
at 20 ºC = 30 barg, real system = 5 g of BSG, model system = 0.2 g model biomass.
............................................................................................................................ 122
Figure 6-12: Comparison on furfural concentration over reaction time between BSG
system and binary model system. Reaction condition: reaction temperature = 250 ºC,
initial He pressure at 20 ºC = 30 barg, real system = 5 g of BSG, model system = 0.2
g model biomass. ................................................................................................. 123
Figure 7-1: An overall flow chart for the effect of the different solvent system on
BSG liquefaction process. .................................................................................... 127
Figure 7-2: Comparison on(a) conversion and (b) WSO yield on direct liquefaction
of BSG under different solvent namely water (HTL), MeOH, EtOH and 2-PrOH.

xiv | P a g e
Reaction conditions: BSG:solvent wt% ratio=1:10,initial He pressure at 20 °C= 30
barg, reaction temperature=250 oC and reaction time=30min. .............................. 131
Figure 7-3: The dependence of dielectric constant at 25°C of different alcohols-
water-mixed solvent; (a) MeOH (b) EtOH (c) 2-PrOH (Åkerlöf, 1932). ............... 132
Figure 7-4: GCMS chromatogram on liquid product distribution for BSG
liquefaction under different solvent. Reaction conditions: BSG: solvent wt%
ratio=1:10, Initial He pressure at 20 °C = 30 barg, reaction temperature=250 oC and
reaction time = 30min. ......................................................................................... 134
Figure 7-5: Quantitative analysis on liquid product for BSG liquefaction under
different alcoholic-mixed solvent systems.. Reaction conditions: BSG: solvent wt%
ratio=1:10, Initial He pressure at 20 °C = 30 barg, reaction temperature=250 ºC and
reaction time = 30min. ......................................................................................... 137
Figure 7-6: Amount of solid residue/ biochar obtained under different liquefaction
solvent (alcohol: water, wt.%). Reaction conditions: BSG: solvent wt. % ratio=1:10,
Initial He pressure at 20 °C = 30 barg, reaction temperature=250 ºC and reaction
time = 30min........................................................................................................ 138
Figure 7-7: FTIR spectrum of BSG biomass and bio-char under different liquefaction
solvent. Reaction conditions: BSG: solvent wt. % ratio=1:10, PHe= 30 barg, reaction
temperature=250 ºC and reaction time = 30min. ................................................... 139
Figure 7-8: Peak for BSG biomass and bio-char at carbohydrate peak (1030 cm-1
)
under different liquefaction solvent. Reaction conditions: BSG: solvent wt. %
ratio=1:10, PHe= 30 barg, reaction temperature=250 ºC
and reaction time = 30min. 139
Figure 7-9: Proximate analysis of BSG biomass and BSG bio-char under different
liquefaction solvents. Reaction conditions: BSG: solvent wt.% ratio=1:10, Initial He
pressure at 20 °C = 30 barg, reaction temperature = 250 °C and reaction time =
30min. ................................................................................................................. 141
Figure 7-10: Van Krevelen diagram adapted from McKendry (2002) and plotted
point for the biochar obtained in current work under a different solvent system. ... 142
xv | P a g e
0.List of Table
Table 2-1: Solid waste generated from paper mills in paper and pulp industry
adapted from Bajpai, (2015). .................................................................................. 12
Table 2-2: Brewery waste products from small scale production adapted from
Thomas and Rahman, (2006) ................................................................................. 13
Table 2-3: Cellulose, hemicellulose and lignin composition in common
lignocellulosic materials adapted from Lee, Hamid and Zain, (2014) ..................... 15
Table 2-4: Range of main operating parameters for pyrolysis processes. ................ 23
Table 2-5: Chemical composition of brewers‘ spent grain (BSG) and germinated
barley foodstuff (GBF)........................................................................................... 34
Table 3-1: Characteristic of the column used for analysis of liquefaction sample by
GCMS ................................................................................................................... 43
Table 3-2: The program of the column oven temperature for chromatographic
analysis of liquefaction sample by GCMS .............................................................. 45
Table 3-3: Dilutions employed for the preparation of standard calibration using a
stock solution of liquid products ............................................................................ 47
Table 4-1: Equation parameters used for proximate analysis determination from the
TGA curve of BSG. ............................................................................................... 61
Table 4-2: FTIR absorbance band and polymer present in BSG according to the
literature (M.Schwanninnger, 2004)a, (Kubo and Kadla, 2005)
b and (Sills and
Gossett, 2012)c ....................................................................................................... 69
Table 4-3: Chemical composition of BSG used for current work and comparison
with other BSG from other studies, expressed in dry basis unit. ............................. 72
Table 4-4: FTIR absorbance bands and functional groups present in the structure of
extracted cellulose from BSG vs commercial cellulose........................................... 80
Table 4-5: Chemical characteristic of commercial lignin and extracted lignin from
BSG waste determinde from FTIR analysis ............................................................ 83
Table 4-6: Hemicellulose, cellulose and lignin content of extractives-free BSG
obtained for current work and comparison to other BSG ........................................ 85
Table 5-1: The column oven temperature programme used for GCMS analysis of the
liquid sample. ........................................................................................................ 91
Table 5-2: Recorded reaction pressure during the HTL of cellulose at different
temperatures and the amount of liquid product obtained. Reaction
xvi | P a g e
conditions:microcrystalline cellulose = 0.1 g, distilled water = 10 mL, initial He
pressure at 20 °C = 30 barg, reaction time = 30 min. .............................................. 95
Table 6-1: Major chemical composition in liquid product obtained in HTL of BSG.
Reaction conditions:raw BSG = 5 g, distilled water= 10mL, PHe= 30 barg, reaction
temperature=300 ºC and reaction time = 30min. ................................................... 116
Table 7-1: Summary of solvent density (at 20 °C), solvent amount and recorded
reaction pressure during liquefaction reaction of BSG. Reaction conditions:
BSG:solvent wt% ratio = 1:10, initial He pressure at 20 °C = 30 barg, reaction
temperature = 250 oC and reaction time = 30min. ................................................. 130
Table 7-2: Major chemical components in liquid product for BSG liquefaction under
different alcohols-water-mixed solvent; water (HTL), MeOH, EtOH and 2-PrOH
analysed by GCMS. ............................................................................................. 135
Table 7-3: Ultimate analysis and the atomic molar ratio of BSG biochars produce
under different liquefaction solvent. ..................................................................... 141
xvii | P a g e
0.List of Abbreviation
BSG - Brewer‘s spent grain
EtOH - Ethanol
EF-BSG - Extractive free BSG
FTIR - Fourier- Transform Infrared
GC - Gas chromatography
GCMS - Gas chromatography mass spectroscopy
H2SO4 - Sulphuric acid
HHV - Higher heating value
HMF - Hydroxymethylfurfural
HTC - Hydrothermal carbonisation
HTG - Hydrothermal gasification
HTL - Hydrothermal liquefaction
LA - Levulinic acid
MeOH - Methanol
NaOH - Sodium hydroxide
TG - Thermogravimetric
TGA - Thermogravimetric analysis
TGA-DTA - Thermogravimetric analysis-differential thermal analysis
PrOH - Propanol
Ppm - part permillion
SC - Supercritical state
SCW - Supercritical water
XRF - X-ray fluoresence
WSO - Water-soluble oil

CHAPTER 1
INTRODUCTION
2 | P a g e
Chapter 1: Introduction
1.Chapter 1: Introduction
1.0 Introduction
The world‘s energy use is complex and changing. Total energy use rises with
the increasing population and economic activity, and technological and commercial
innovations affect the type of energy used. As the result, the amount of energy used
varies throughout the world depending on both, technology and available resource
(BP, 2014). Technology development and industrialisation of mankind is growing
rapidly every day, reaching a new method to make use of the resources, in order to
provide better options for satisfying human needs. However, due to international
phenomena such as climate change as a result of greenhouse emissions or fossil fuel
shortages occurring are encouraging a divert towards sustainable development
(Fernando et al., 2006; Mohanty et al., 2014). Alternative energy resources, which
are cheap, renewable and do not cause pollution are highly needed to meet the
current demand for energy. Therefore, renewable sources such as solar, wind,
thermal, hydroelectric and biomass need to be alternated (Maity, 2015).
1.1 Renewable Sources: Biomass
An ideal source of renewable energy is one that can be replenished over a
relatively short period of time or is essentially supply-free. Resources such as coal,
natural gas and crude oil come from carbon dioxide, which was fixed by nature by
photosynthesis several million years ago. They are of limited supply, they can not be
replaced and therefore can not be renewed. Resources such as solar radiation, wind,
tides and biomass are considered to be renewable sources that are not in danger of
being over-exploited if properly managed. It is important to note, however, that
while the first three resources can be used as a renewable energy source, biomass can
be used to produce energy as well as chemicals and materials. (James H. Clark,
2011).
Biomass is a carbon neutral resource in its life cycle and can be converted
into convenient solid, liquid and gaseous fuels through different conversion
3 | P a g e
Chapter 1: Introduction
processes (Özbay et al., 2001). Biomass alone contributes to more than 50% of
world‘s renewable energy (Maity, 2015) and been used to meet a variety of energy
needs, including generating electricity, fuelling vehicles and providing process heat
for industries (Bridgwater, 1999, 2003).
According to Demirbaş, (2001) and Saxena, Adhikari and Goyal(2009),
biomass can be obtained from various sources and been categories as below:
i) Wastes: This category comprises wastes from agricultural production,
process waste from agro industries, crop residues, etc.
ii) Standing forests: This comprises various intermediate products and
residual wastes of different nature.
iii) Energy crops: This energy crop includes various edible and non-
edible crops.
There is considerable political and social pressure nowadays to reduce pollution
from industrial activities. Nearly all developed and underdeveloped countries try to
adapt to this reality by modifying their processes in order to recycle their residues
(Mussatto, Dragone and Roberto, 2006). Moreover, industrial ecology concepts and
circular economy have been considered leading principle for ‗zerowaste‘ society and
economy where wastes are used as raw material for new products and applications.
This is so called an industrial symbiosis (Ragauskas et al., 2006), in which the goal
is to use wastes from one sector as an input for other sectors as shown in Figure 1-1.
Besides, many industrial waste have the potential to be reused into other production
systems, e.g. bio-refineries (Forster-Carneiro et al., 2013a) in which when
comparing to other sources, wastes category would be the best and the most
environmentally friendly sources for the biomass. This represents not only a resource
problem but also an environmental and economic one, on top of being a moral
challenge for the modern society nowadays.
4 | P a g e
Chapter 1: Introduction
Figure 1-1: The fully integrated agro-biofuel-biomaterial-biopower cycle for
sustainable technologies, adapted from The path forward for biofuels and
biomaterials (Ragauskas et al., 2006).
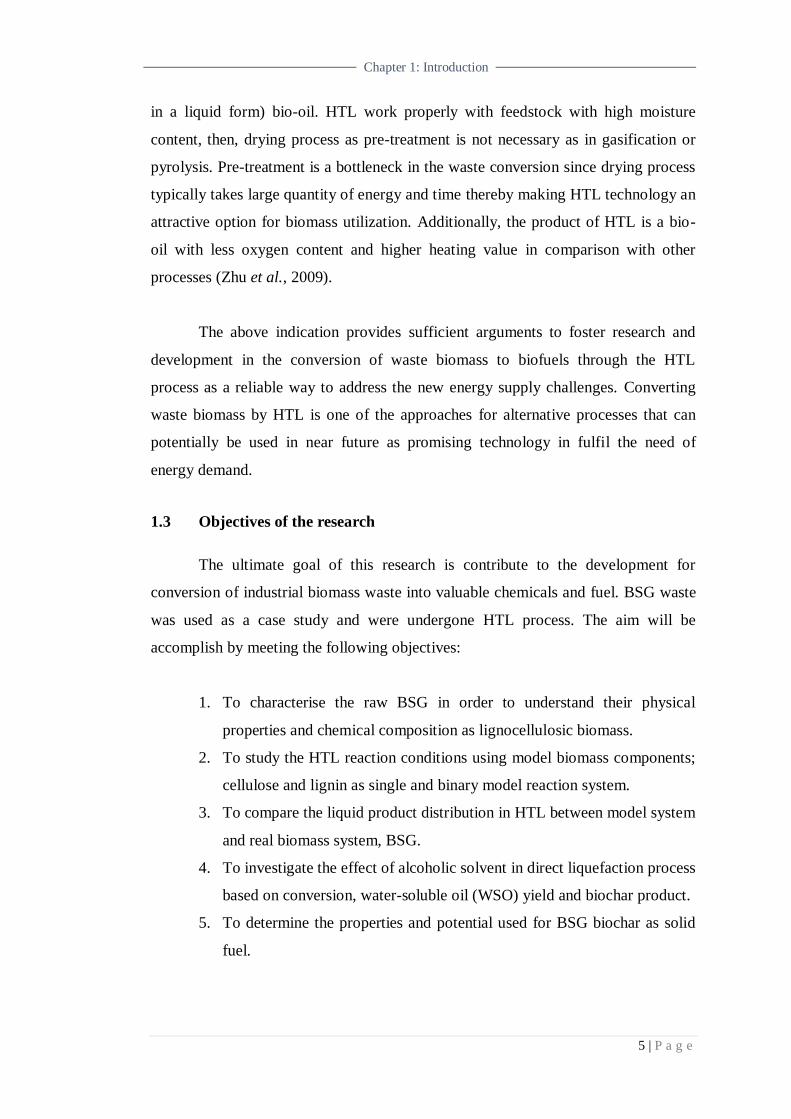
1.1.1 Brewer’s spent grain (BSG)
BSG is a low value by-product of the brewery industry and been produced in
large quantity throughout the year (Aliyu and Bala, 2013; Malomo, 2013; Lynch,
Steffen and Arendt, 2016). In the brewery process, the barley malt was partially
liquefied and the produced liquor called wort was separated from the solid residues
produce BSG as leftover product. The filtered liquor is subsequently brewed to beer,
while BSG remain as by-product of this process which is currentlyeither disposed of
to landfill/incinerated as waste or been used as animal feed due to its high sugar and
protein content (Zhang and Wang, 2016). Breweries generate more than 250 million
tonnes of wet BSG every year in the UK (Asad S.N. Mahmood et al., 2013) and wet
BSG contains a large amount of moisture, typically 67-81 (w/w%). Because of its
high content of moisture and fermentable sugars, BSG is a very unstable material
and is susceptible to rapid deterioration due to microbial activity (Fărcaş et al.,
2014). Therefore, is an urge to find a way for develop value-added end-used for this
by-product.
1.2 Hydrothermal liquefaction (HTL)
HTL is as wet thermal process at relatively moderate reaction conditions;
temperature below 420°C and pressure between 10 and 30MPa (Anselmo Filho and
Badr, 2004; A. a. Peterson et al., 2008) which converts biomass into biofuels mainly
5 | P a g e
Chapter 1: Introduction
in a liquid form) bio-oil. HTL work properly with feedstock with high moisture
content, then, drying process as pre-treatment is not necessary as in gasification or
pyrolysis. Pre-treatment is a bottleneck in the waste conversion since drying process
typically takes large quantity of energy and time thereby making HTL technology an
attractive option for biomass utilization. Additionally, the product of HTL is a bio-
oil with less oxygen content and higher heating value in comparison with other
processes (Zhu et al., 2009).
The above indication provides sufficient arguments to foster research and
development in the conversion of waste biomass to biofuels through the HTL
process as a reliable way to address the new energy supply challenges. Converting
waste biomass by HTL is one of the approaches for alternative processes that can
potentially be used in near future as promising technology in fulfil the need of
energy demand.
1.3 Objectives of the research
The ultimate goal of this research is contribute to the development for
conversion of industrial biomass waste into valuable chemicals and fuel. BSG waste
was used as a case study and were undergone HTL process. The aim will be
accomplish by meeting the following objectives:
1. To characterise the raw BSG in order to understand their physical
properties and chemical composition as lignocellulosic biomass.
2. To study the HTL reaction conditions using model biomass components;
cellulose and lignin as single and binary model reaction system.
3. To compare the liquid product distribution in HTL between model system
and real biomass system, BSG.
4. To investigate the effect of alcoholic solvent in direct liquefaction process
based on conversion, water-soluble oil (WSO) yield and biochar product.
5. To determine the properties and potential used for BSG biochar as solid
fuel.

CHAPTER 2
LITERATURE REVIEW
7 | P a g e
Chapter 2: Literature review
2.Chapter 2: Literature review
2.0 Introduction
Current growing industrialisation and motorisation of the world has led to a steep rise
in demand for petroleum-based fuels. It is necessary to develop renewable resources
in order to produce biofuels and biochemical for economic and sustainable
development due to over-consumption of petroleum sources (Lee, Hamid and Zain,
2014). The European Union has already approved environmental abuse legislation
and has begun to make greater efforts to find environmentally friendly materials
based on natural resources (Isikgor and Becer, 2015). Hence, the alternative solutions
in developing sustainable energy and fine chemicals should come from renewable
natural resources; which will decrease the current dependence on fossil resources,
and fixed the negative impact due to greenhouse gas (GHG) emission associated with
their use (Brennan and Owende, 2010; Borugadda and Goud, 2012). Climate change
is currently believed to be the most pressing global environmental issue (Atabani et
al., 2012) and as the result, it have stimulated the search for alternative sources
which is GHG mitigation and carbon neutral (Kumar et al., 2016).
2.1 Biomass: A renewable feedstock
Biomass refers to material of biological origin and can be derived from
growing plant or from animal manure (Babu, 2008). Compare to other sources for
renewable energies, biomass and biomass derived material was described as
―sleeping giant‖ due to its high worldwide availability, associated with limited
valuation (Déniel et al., 2016). Biomass has been labelled as an abundant carbon
neutral renewable source that can reduce CO2 emissions and atmospheric pollution.
Biomass plant derived was estimated to be produce about
1.3 × 10¹⁰
metric tons per annum which is energetically equivalent to about two-
thirds of the world‘s energy requirement (Ganesh D. Saratale, 2012). The biomass
materials been generated from available atmospheric CO2, water and sunlight
through biological photosynthesis process and represent a renewable and cheap
sources for a renewable feedstock.
8 | P a g e
Chapter 2: Literature review
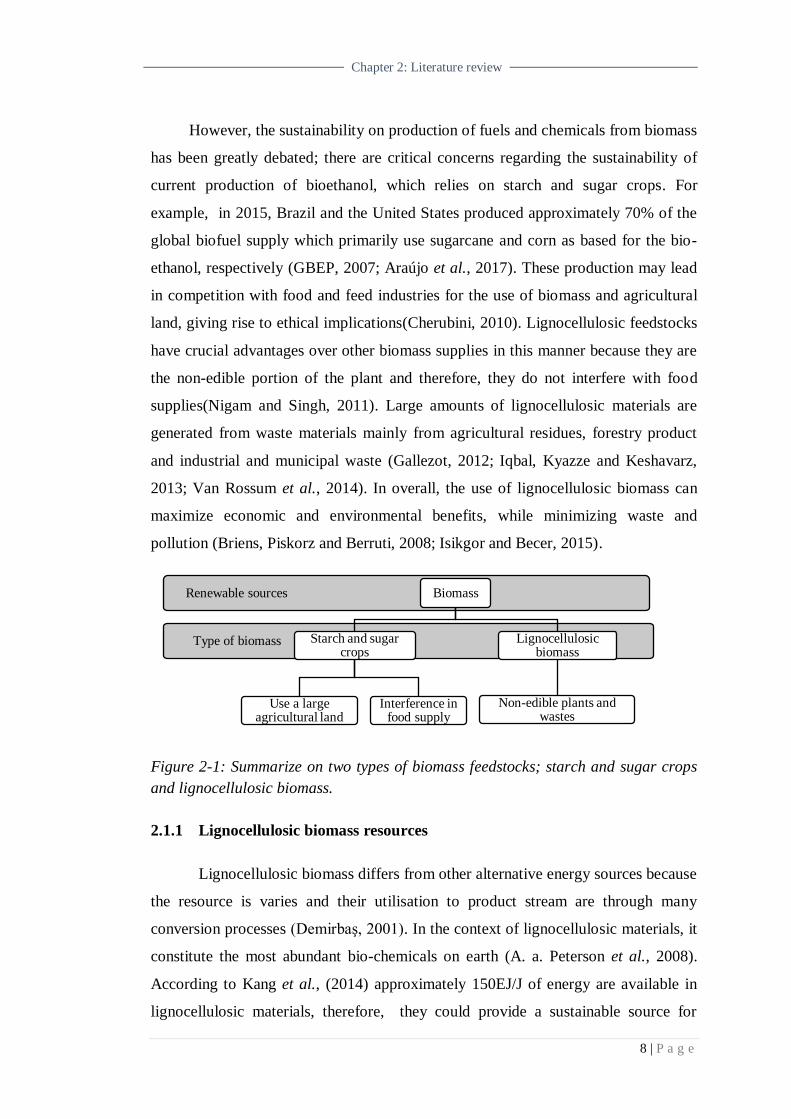
However, the sustainability on production of fuels and chemicals from biomass
has been greatly debated; there are critical concerns regarding the sustainability of
current production of bioethanol, which relies on starch and sugar crops. For
example, in 2015, Brazil and the United States produced approximately 70% of the
global biofuel supply which primarily use sugarcane and corn as based for the bio-
ethanol, respectively (GBEP, 2007; Araújo et al., 2017). These production may lead
in competition with food and feed industries for the use of biomass and agricultural
land, giving rise to ethical implications(Cherubini, 2010). Lignocellulosic feedstocks
have crucial advantages over other biomass supplies in this manner because they are
the non-edible portion of the plant and therefore, they do not interfere with food
supplies(Nigam and Singh, 2011). Large amounts of lignocellulosic materials are
generated from waste materials mainly from agricultural residues, forestry product
and industrial and municipal waste (Gallezot, 2012; Iqbal, Kyazze and Keshavarz,
2013; Van Rossum et al., 2014). In overall, the use of lignocellulosic biomass can
maximize economic and environmental benefits, while minimizing waste and
pollution (Briens, Piskorz and Berruti, 2008; Isikgor and Becer, 2015).
Figure 2-1: Summarize on two types of biomass feedstocks; starch and sugar crops
and lignocellulosic biomass.
2.1.1 Lignocellulosic biomass resources
Lignocellulosic biomass differs from other alternative energy sources because
the resource is varies and their utilisation to product stream are through many
conversion processes (Demirbaş, 2001). In the context of lignocellulosic materials, it
constitute the most abundant bio-chemicals on earth (A. a. Peterson et al., 2008).
According to Kang et al., (2014) approximately 150EJ/J of energy are available in
lignocellulosic materials, therefore, they could provide a sustainable source for
Type of biomass
Renewable sources Biomass
Starch and sugar crops
Use a large agricultural land
Interference in food supply
Lignocellulosic biomass
Non-edible plants and wastes

9 | P a g e
Chapter 2: Literature review
low-cost biofuel production (Sun and Cheng, 2002; Nagy, 2009). There are several
resource groups of lignocellulosic materials; (i) agricultural residues (palm trunk and
empty fruit bunch, corncobs, wheat straw, sugarcane bagasse, corn stover, coconut
husks, wheat rice, and empty fruit bunches); (ii) forest residues (hardwood and
softwood); (iii) energy crops (switch grass); (iv) food wastes; and (v) municipal and
industrial wastes (waste paper and demolition wood) (Lee, Hamid and Zain, 2014).
In current work, three general lignocellulosic resources were discussed, namely
agricultural waste (Section 2.1.1.1), forest woody feedstock (Section 2.1.1.2) and
municipal and industrial waste (Section 2.1.1.3).
2.1.1.1 Agricultural waste
An agricultural waste is an important category of live-stock sources with
great potential application in bio-refineries and is not opposed to the availability of
food. Agricultural waste can be refers to any lignocellulosic residue produced by
agri-food industries in their daily operations, such as roots, stalks, bark, bagasse,
leaves, straw residues, seeds, and animal residues (Forster-Carneiro et al., 2013b).
The available amount of agro-residues is estimated to be 1010 Mt. globally, which
corresponds to an energy value of 47 EJ (Gabrielle et al., 2007). The most abundant
lignocellulose agricultural residues are corncobs, corn stover, wheat, rice, barley
straw, sorghum stalks, coconut husks, sugarcane bagasse, switchgrass, pineapple and
banana leaves can be produce every year (Demain et al., 2005). Apart from
environmental point of view, agricultural residues help to prevent unsustainable tree
cutting which reduce the phenomenon of deforestation (Limayem and Ricke, 2012;
Achinas and Euverink, 2016). Because of their unique chemical composition,
abundant availability, renewable nature and low cost, agricultural waste materials are
economical and environmentally friendly as biomass feedstock (Bhatnagar and
Sillanpää, 2010).
2.1.1.2 Forest woody feedstock
Compared with agricultural biomass, woody biomass as a feedstock has many
advantages in terms of production, harvesting, storage, and transportation biomass
for conversion (Zhu and Pan, 2010). In addition, due to high lignin content and low
10 | P a g e
Chapter 2: Literature review
ash composition, forest biomass represents a valuable feedstocks for energy
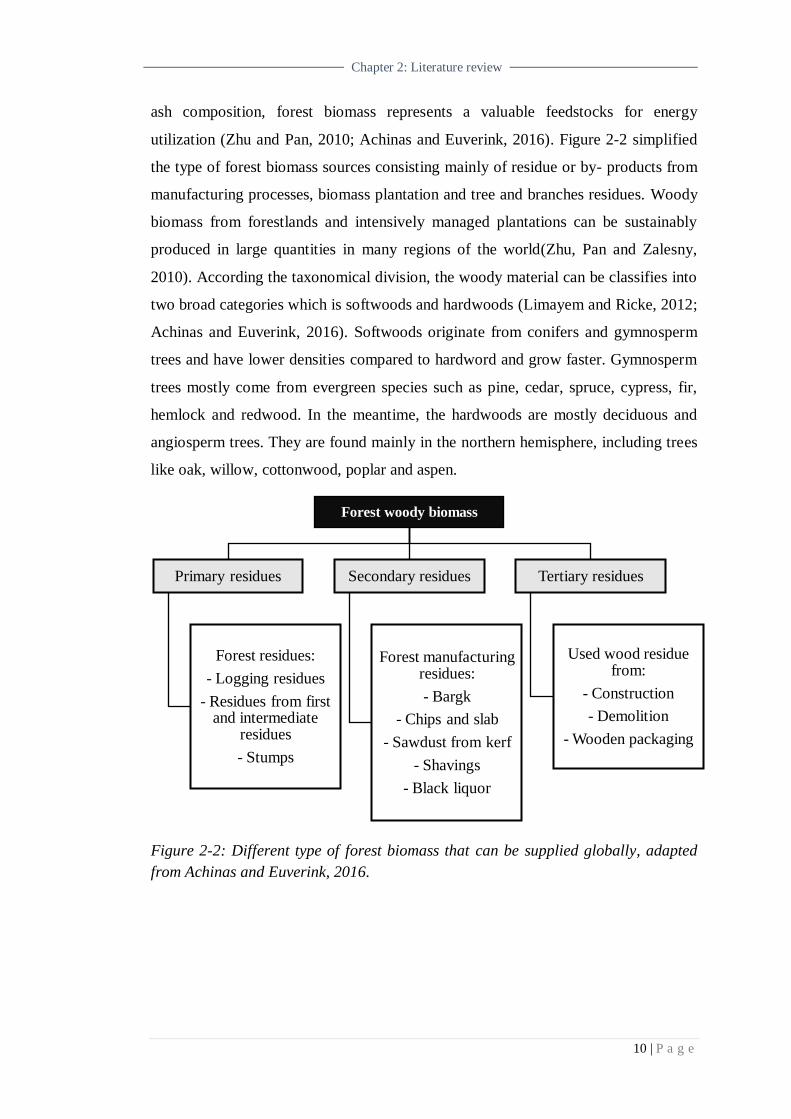
utilization (Zhu and Pan, 2010; Achinas and Euverink, 2016). Figure 2-2 simplified
the type of forest biomass sources consisting mainly of residue or by- products from
manufacturing processes, biomass plantation and tree and branches residues. Woody
biomass from forestlands and intensively managed plantations can be sustainably
produced in large quantities in many regions of the world(Zhu, Pan and Zalesny,
2010). According the taxonomical division, the woody material can be classifies into
two broad categories which is softwoods and hardwoods (Limayem and Ricke, 2012;
Achinas and Euverink, 2016). Softwoods originate from conifers and gymnosperm
trees and have lower densities compared to hardword and grow faster. Gymnosperm
trees mostly come from evergreen species such as pine, cedar, spruce, cypress, fir,
hemlock and redwood. In the meantime, the hardwoods are mostly deciduous and
angiosperm trees. They are found mainly in the northern hemisphere, including trees
like oak, willow, cottonwood, poplar and aspen.
Figure 2-2: Different type of forest biomass that can be supplied globally, adapted
from Achinas and Euverink, 2016.
Forest woody biomass
Primary residues
Forest residues:
- Logging residues
- Residues from first and intermediate
residues
- Stumps
Secondary residues
Forest manufacturing residues:
- Bargk
- Chips and slab
- Sawdust from kerf
- Shavings
- Black liquor
Tertiary residues
Used wood residue from:
- Construction
- Demolition
- Wooden packaging
11 | P a g e
Chapter 2: Literature review
2.1.1.3 Municipal and industrial waste
Municipal and industrial wastes is also a prospective way to produce biofuel
or bio-chemical (Achinas and Euverink, 2016). These materials can originate either
from residential or non-residential sources. The utilisation of this waste limits
environmental problems associated with the garbage household disposal, food-
processing by-products, processing papers, black liquors and pulps (Limayem and
Ricke, 2012). A significant volume of the industrial waste is discharged to public
sewers, streams, lakes, landfills, and other sinks at great cost to the industry and/or
the community that accepts these effluents; i.e. pulp and paper industry and brewery
factory.
The pulp and paper industry had processes a huge quantities of
lignocellulosic waste materials (Iqbal, Kyazze and Keshavarz, 2013). Most of the
resources of pulp and paper fibre are plant materials obtained from trees or
agricultural crops. These plant materials are harvested directly from wood, straw,
bamboo or residuals from other manufacturing processes (sawmill wood chips,
sugarcane bagasse fiber, cotton linter, etc), fibres recovered from recycle paper or
paperboard and second hand cloth (Gupta, 2007; Nigam and Singh, 2011). There are
three major processing steps are involve in paper production, i.e. i) pulping, ii)
bleaching and finally iii) paper production. Throughout this process, different types
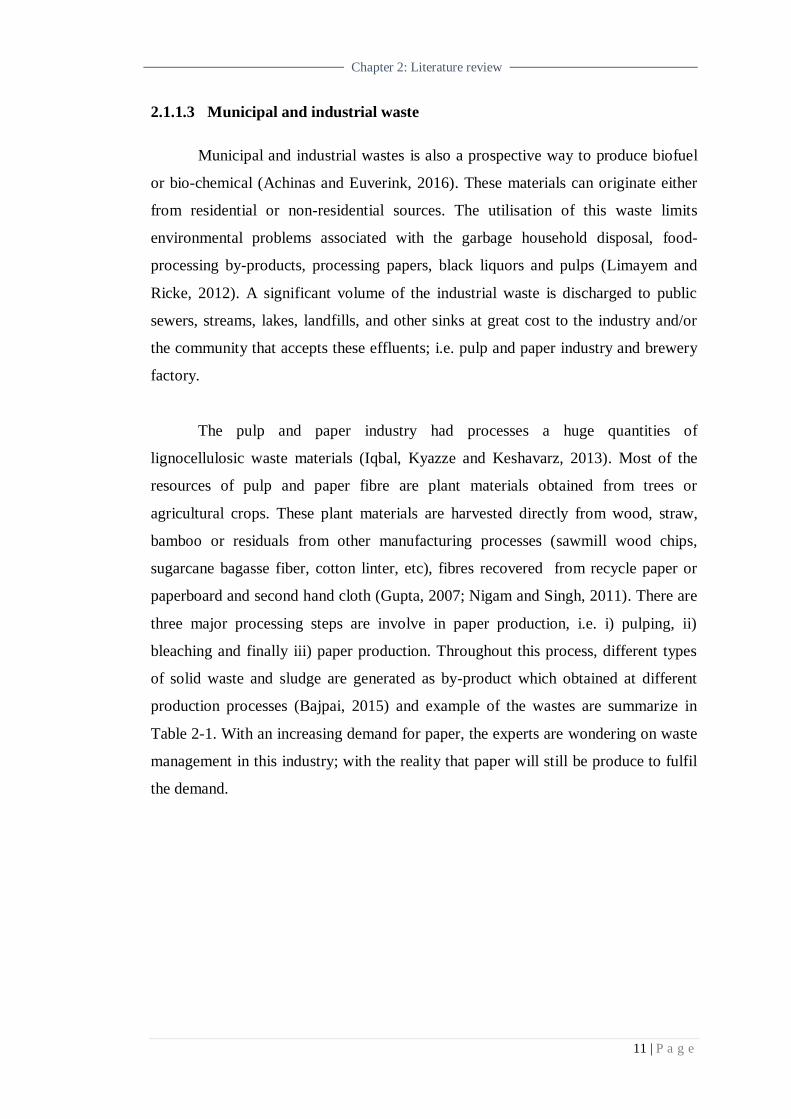
of solid waste and sludge are generated as by-product which obtained at different
production processes (Bajpai, 2015) and example of the wastes are summarize in
Table 2-1. With an increasing demand for paper, the experts are wondering on waste
management in this industry; with the reality that paper will still be produce to fulfil
the demand.
12 | P a g e
Chapter 2: Literature review
Table 2-1: Solid waste generated from paper mills in paper and pulp industry
adapted from Bajpai, (2015).
Besides, brewing industry also generates a large amounts of by-products and
wastes in each beer processing stages, such as water, brewery spent grain (BSG),
spent hops, yeast and etc. High volumes of waste material are discharged with every
brew; an example of waste from small scale brewery is listed in Table 2-2. From the
table, it can be seen that BSG and water are the most extensive problems (Thomas
and Rahman, 2006) with 3.4 million tonnes of BSG from this industry are produced
in the EU every year (Stojceska et al., 2008). A typical small brewery brewing 1500
litres three times a week and produce around two tons of spent grain in a week.
Meanwhile, for large regional breweries, 1,000HL beer per day been produce with 40
tons BSG per day need to be remove (Thomas and Rahman, 2006). Currently the
basic utilisation of this waste are in form of animal fodder or compost to the landfill
(Sežun et al., 2011; Asad S.N. Mahmood et al., 2013; Malomo, 2013). However,

13 | P a g e
Chapter 2: Literature review
these plant-derived waste co- products are known to contain significant amounts of
valuable components, which remain unexploited waste in the current processes; i.e.
lignocellulosic rich materials (Stojceska et al., 2008; Mussatto et al., 2010; Waters et
al., 2012; Mussatto, 2014). Besides, because if its high moisture and fermentable
sugar content, BSG becomes an environmental problem after a short time (7-10 days)
(El‐Shafey et al., 2004).
Table 2-2: Brewery waste products from small scale production adapted from
Thomas and Rahman, (2006)
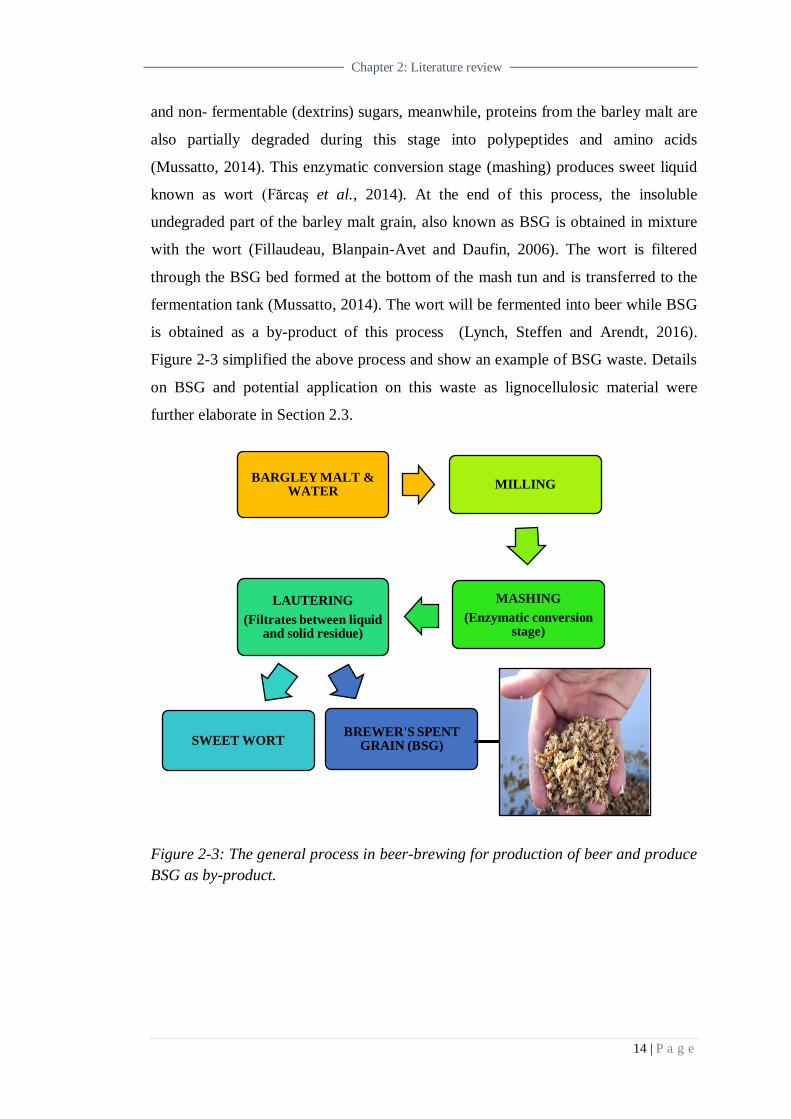
Briefly, in beer-brewing, the process are starts with the production of the
wort. Wort is a sugar-rich solution that will be used in the subsequent fermentation
stage to produce ethanol. To obtained wort, the milled barley malt is mixed with
water in a mash tun and the temperature of mash slowly increased from 37 to 78 ºC
to promote the enzymatic hydrolysis of malt constituents (Fărcaş et al., 2014). At this
stage, the malt starch were convert into fermentable (mainly maltose and maltotriose)
14 | P a g e
Chapter 2: Literature review
and non- fermentable (dextrins) sugars, meanwhile, proteins from the barley malt are
also partially degraded during this stage into polypeptides and amino acids
(Mussatto, 2014). This enzymatic conversion stage (mashing) produces sweet liquid
known as wort (Fărcaş et al., 2014). At the end of this process, the insoluble
undegraded part of the barley malt grain, also known as BSG is obtained in mixture
with the wort (Fillaudeau, Blanpain-Avet and Daufin, 2006). The wort is filtered
through the BSG bed formed at the bottom of the mash tun and is transferred to the
fermentation tank (Mussatto, 2014). The wort will be fermented into beer while BSG
is obtained as a by-product of this process (Lynch, Steffen and Arendt, 2016).
Figure 2-3 simplified the above process and show an example of BSG waste. Details
on BSG and potential application on this waste as lignocellulosic material were
further elaborate in Section 2.3.
Figure 2-3: The general process in beer-brewing for production of beer and produce
BSG as by-product.
BARGLEY MALT & WATER
MILLING
MASHING
(Enzymatic conversion stage)
LAUTERING
(Filtrates between liquid and solid residue)
SWEET WORTBREWER'S SPENT
GRAIN (BSG)
15 | P a g e
Chapter 2: Literature review
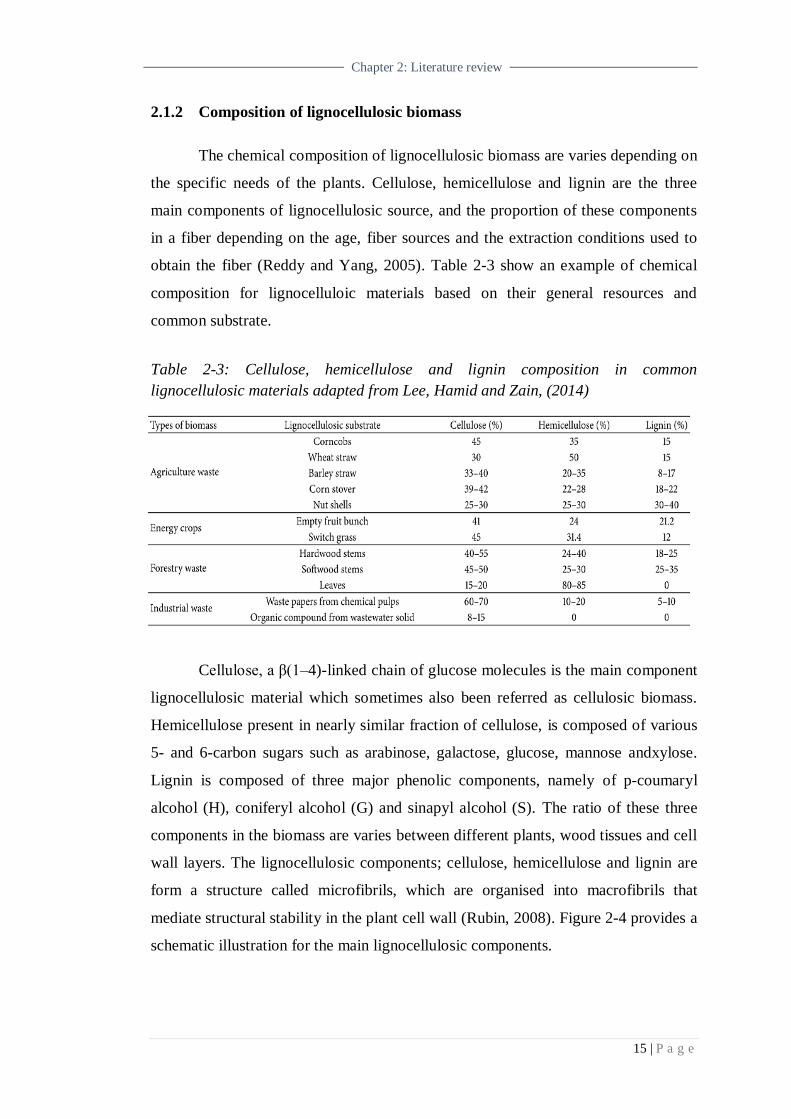
2.1.2 Composition of lignocellulosic biomass
The chemical composition of lignocellulosic biomass are varies depending on
the specific needs of the plants. Cellulose, hemicellulose and lignin are the three
main components of lignocellulosic source, and the proportion of these components
in a fiber depending on the age, fiber sources and the extraction conditions used to
obtain the fiber (Reddy and Yang, 2005). Table 2-3 show an example of chemical
composition for lignocelluloic materials based on their general resources and
common substrate.
Table 2-3: Cellulose, hemicellulose and lignin composition in common
lignocellulosic materials adapted from Lee, Hamid and Zain, (2014)
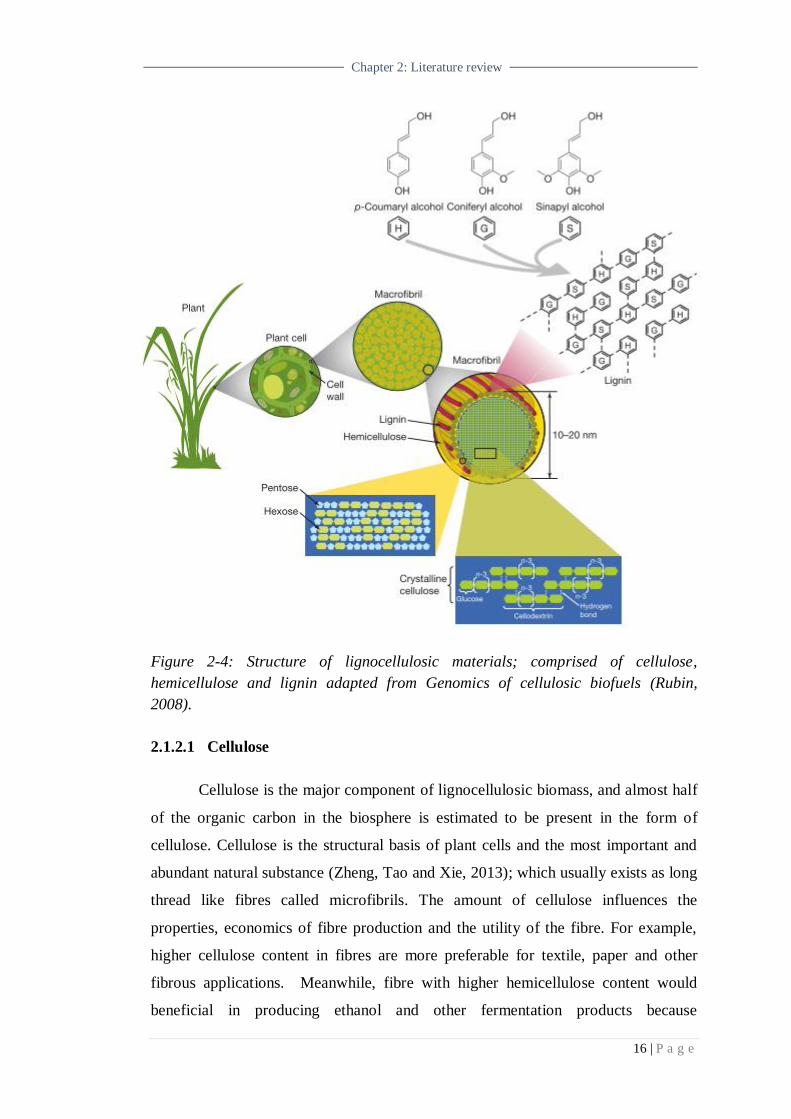
Cellulose, a β(1–4)-linked chain of glucose molecules is the main component
lignocellulosic material which sometimes also been referred as cellulosic biomass.
Hemicellulose present in nearly similar fraction of cellulose, is composed of various
5- and 6-carbon sugars such as arabinose, galactose, glucose, mannose andxylose.
Lignin is composed of three major phenolic components, namely of p-coumaryl
alcohol (H), coniferyl alcohol (G) and sinapyl alcohol (S). The ratio of these three
components in the biomass are varies between different plants, wood tissues and cell
wall layers. The lignocellulosic components; cellulose, hemicellulose and lignin are
form a structure called microfibrils, which are organised into macrofibrils that
mediate structural stability in the plant cell wall (Rubin, 2008). Figure 2-4 provides a
schematic illustration for the main lignocellulosic components.
16 | P a g e
Chapter 2: Literature review
Figure 2-4: Structure of lignocellulosic materials; comprised of cellulose,
hemicellulose and lignin adapted from Genomics of cellulosic biofuels (Rubin,
2008).
2.1.2.1 Cellulose
Cellulose is the major component of lignocellulosic biomass, and almost half
of the organic carbon in the biosphere is estimated to be present in the form of
cellulose. Cellulose is the structural basis of plant cells and the most important and
abundant natural substance (Zheng, Tao and Xie, 2013); which usually exists as long
thread like fibres called microfibrils. The amount of cellulose influences the
properties, economics of fibre production and the utility of the fibre. For example,
higher cellulose content in fibres are more preferable for textile, paper and other
fibrous applications. Meanwhile, fibre with higher hemicellulose content would
beneficial in producing ethanol and other fermentation products because
17 | P a g e
Chapter 2: Literature review
hemicellulose is relatively easily hydrolysable into fermentable sugars (Reddy and
Yang, 2005). Therefore, the value for the cellulosic materials are largely determine
by their end use applications (Reddy and Yang, 2005).
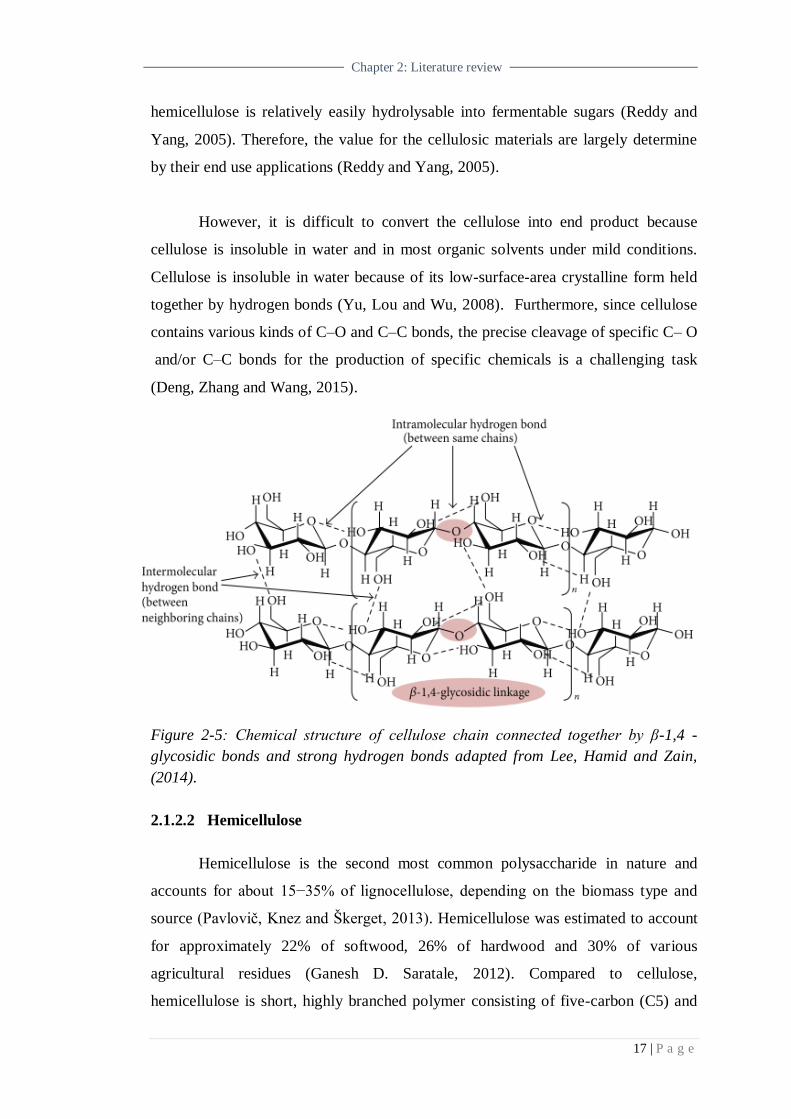
However, it is difficult to convert the cellulose into end product because
cellulose is insoluble in water and in most organic solvents under mild conditions.
Cellulose is insoluble in water because of its low-surface-area crystalline form held
together by hydrogen bonds (Yu, Lou and Wu, 2008). Furthermore, since cellulose
contains various kinds of C–O and C–C bonds, the precise cleavage of specific C– O
and/or C–C bonds for the production of specific chemicals is a challenging task
(Deng, Zhang and Wang, 2015).
Figure 2-5: Chemical structure of cellulose chain connected together by β-1,4 -
glycosidic bonds and strong hydrogen bonds adapted from Lee, Hamid and Zain,
(2014).
2.1.2.2 Hemicellulose
Hemicellulose is the second most common polysaccharide in nature and
accounts for about 15−35% of lignocellulose, depending on the biomass type and
source (Pavlovič, Knez and Škerget, 2013). Hemicellulose was estimated to account
for approximately 22% of softwood, 26% of hardwood and 30% of various
agricultural residues (Ganesh D. Saratale, 2012). Compared to cellulose,
hemicellulose is short, highly branched polymer consisting of five-carbon (C5) and
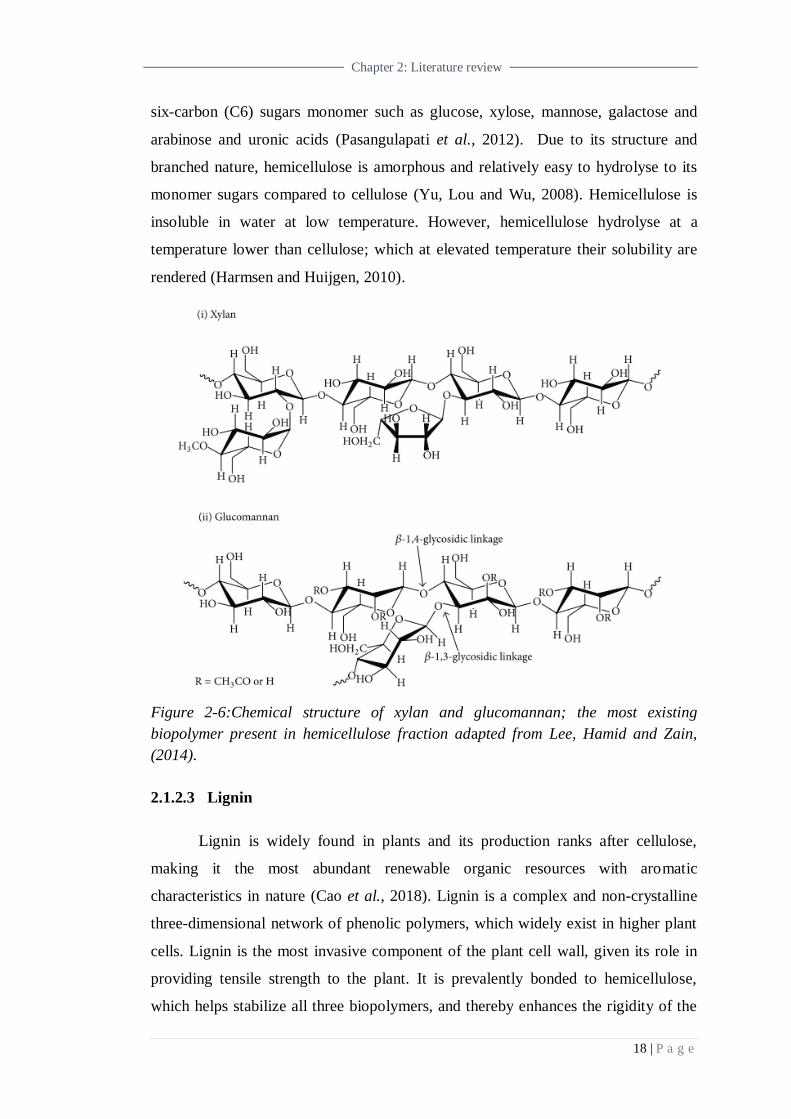
18 | P a g e
Chapter 2: Literature review
six-carbon (C6) sugars monomer such as glucose, xylose, mannose, galactose and
arabinose and uronic acids (Pasangulapati et al., 2012). Due to its structure and
branched nature, hemicellulose is amorphous and relatively easy to hydrolyse to its
monomer sugars compared to cellulose (Yu, Lou and Wu, 2008). Hemicellulose is
insoluble in water at low temperature. However, hemicellulose hydrolyse at a
temperature lower than cellulose; which at elevated temperature their solubility are
rendered (Harmsen and Huijgen, 2010).
Figure 2-6:Chemical structure of xylan and glucomannan; the most existing
biopolymer present in hemicellulose fraction adapted from Lee, Hamid and Zain,
(2014).
2.1.2.3 Lignin
Lignin is widely found in plants and its production ranks after cellulose,
making it the most abundant renewable organic resources with aromatic
characteristics in nature (Cao et al., 2018). Lignin is a complex and non-crystalline
three-dimensional network of phenolic polymers, which widely exist in higher plant
cells. Lignin is the most invasive component of the plant cell wall, given its role in
providing tensile strength to the plant. It is prevalently bonded to hemicellulose,
which helps stabilize all three biopolymers, and thereby enhances the rigidity of the
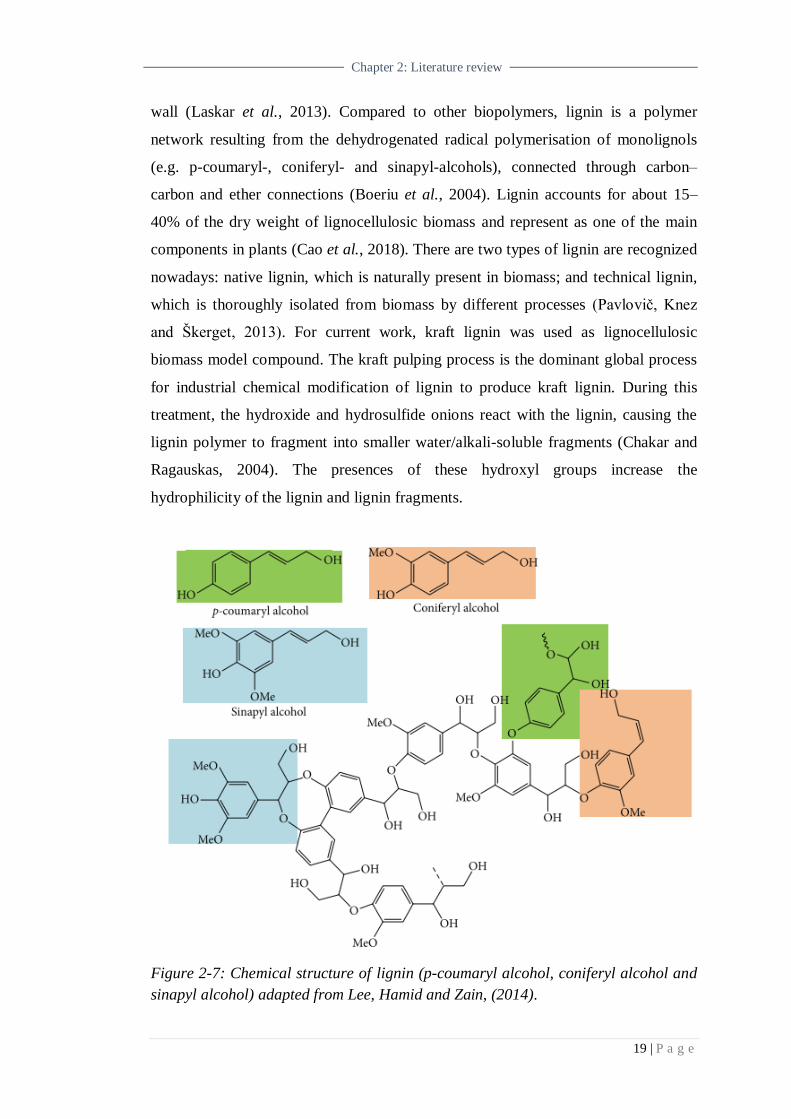
19 | P a g e
Chapter 2: Literature review
wall (Laskar et al., 2013). Compared to other biopolymers, lignin is a polymer
network resulting from the dehydrogenated radical polymerisation of monolignols
(e.g. p-coumaryl-, coniferyl- and sinapyl-alcohols), connected through carbon–
carbon and ether connections (Boeriu et al., 2004). Lignin accounts for about 15–
40% of the dry weight of lignocellulosic biomass and represent as one of the main
components in plants (Cao et al., 2018). There are two types of lignin are recognized
nowadays: native lignin, which is naturally present in biomass; and technical lignin,
which is thoroughly isolated from biomass by different processes (Pavlovič, Knez
and Škerget, 2013). For current work, kraft lignin was used as lignocellulosic
biomass model compound. The kraft pulping process is the dominant global process
for industrial chemical modification of lignin to produce kraft lignin. During this
treatment, the hydroxide and hydrosulfide onions react with the lignin, causing the
lignin polymer to fragment into smaller water/alkali-soluble fragments (Chakar and
Ragauskas, 2004). The presences of these hydroxyl groups increase the
hydrophilicity of the lignin and lignin fragments.
Figure 2-7: Chemical structure of lignin (p-coumaryl alcohol, coniferyl alcohol and
sinapyl alcohol) adapted from Lee, Hamid and Zain, (2014).

20 | P a g e
Chapter 2: Literature review
2.2 Biomass conversion technologies
Lignocellulosic biomass is a potential renewable resources which can be used
directly or indirectly to produce numerous biological and chemical products (Iqbal,
Kyazze and Keshavarz, 2013). Biomass can be converted into product streams using
a number of different processes. The choice of conversion process depends on
different factors; biomass feedstock type and properties, end-used requirements,
environmental standards and economic conditions (Saxena, Adhikari and Goyal,
2009a). According to Mckendry, (2002), biomass can be converted into three main
types of ‗bio-product‘:
i) Electrical/ heat energy
ii) Transport
iii) Chemical feedstock
In general, conversion of biomass can be divided into two main technologies;
i) biochemical technologies which degrades biomass with enzymes and
microorganisms, and ii) thermochemical conversion technologies which using heat to
breakdown the biomass polymer (McKendry, 2002b; Tekin, Karagöz and Bektaş,
2014). For biochemical process, the conversion were divided into three process
options; aerobic and anaerobic degradations, fermentation, and enzymatic hydrolysis.
Meanwhile, within thermo-chemical conversion four process options are available:
combustion, gasification, pyrolysis and hydrothermal processing (McKendry, 2002b;
Saxena, Adhikari and Goyal, 2009b; Canabargro et al., 2013; Tekin, Karagöz and
Bektaş, 2014).
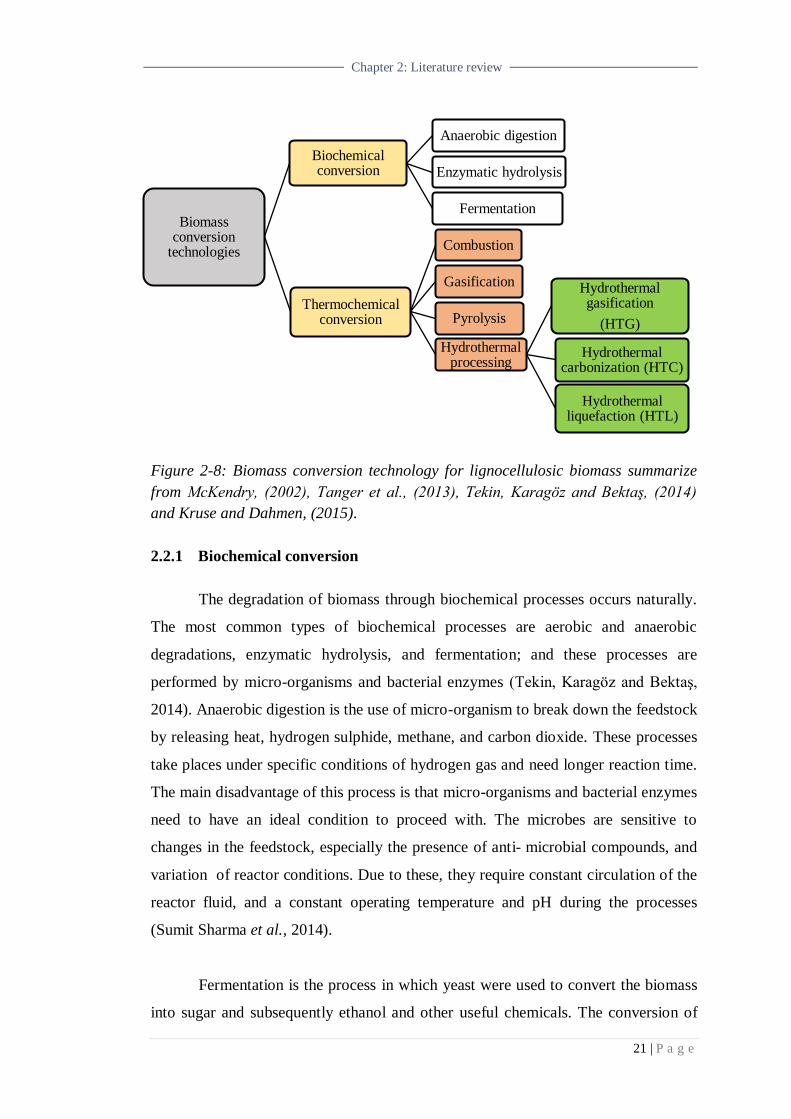
Hydrothermal processing is a thermochemical conversion that can be used to
produce liquid, gaseous and solid products from biomass (Tekin, Karagöz and
Bektaş, 2014; Kruse and Dahmen, 2015). Hydrothermal processing can be divided
into three different processing depending on the temperature and pressure conditions,
namely hydrothermal gasification (HTG), hydrothermal carbonisation (HTC) and
hydrothermal liquefaction (HTL) (Kruse and Dahmen, 2015). The summaries on
biomass conversion technology are shown in Figure 2-8.
21 | P a g e
Chapter 2: Literature review
Figure 2-8: Biomass conversion technology for lignocellulosic biomass summarize
from McKendry, (2002), Tanger et al., (2013), Tekin, Karagöz and Bektaş, (2014)
and Kruse and Dahmen, (2015).
2.2.1 Biochemical conversion
The degradation of biomass through biochemical processes occurs naturally.
The most common types of biochemical processes are aerobic and anaerobic
degradations, enzymatic hydrolysis, and fermentation; and these processes are
performed by micro-organisms and bacterial enzymes (Tekin, Karagöz and Bektaş,
2014). Anaerobic digestion is the use of micro-organism to break down the feedstock
by releasing heat, hydrogen sulphide, methane, and carbon dioxide. These processes
take places under specific conditions of hydrogen gas and need longer reaction time.
The main disadvantage of this process is that micro-organisms and bacterial enzymes
need to have an ideal condition to proceed with. The microbes are sensitive to
changes in the feedstock, especially the presence of anti- microbial compounds, and
variation of reactor conditions. Due to these, they require constant circulation of the
reactor fluid, and a constant operating temperature and pH during the processes
(Sumit Sharma et al., 2014).
Fermentation is the process in which yeast were used to convert the biomass
into sugar and subsequently ethanol and other useful chemicals. The conversion of
Biomass conversion
technologies
Biochemical conversion
Anaerobic digestion
Enzymatic hydrolysis
Fermentation
Thermochemical conversion
Combustion
Gasification
Pyrolysis
Hydrothermal processing
Hydrothermal gasification
(HTG)
Hydrothermal carbonization (HTC)
Hydrothermal liquefaction (HTL)
22 | P a g e
Chapter 2: Literature review
starch and sugar-based raw materials into bio-ethanol by fermentation is also used
for commercial purposes. However, due to the presence of long-chain polysaccharide
molecules, the conversion of lignocellulosic biomass (such as wood and grasses) is
more complex. These molecules requires acid or enzymatic hydrolysis before the
resulting sugars can be fermented to ethanol (McKendry, 2002b). The use of
fermentation to degrade lignocellulosic biomass therefore increase the cost of
processing and is not preferred commercially (Tekin, Karagöz and Bektaş, 2014).
2.2.2 Thermochemical conversion
Thermochemical conversion technologies are based on the thermal
breakdown of biomass to produce valuable chemicals and fuel. These processes do
not necessarily produce useful energy directly, in which under controlled temperature
and oxygen conditions, the original biomass feedstock may be converted into more
convenient forms of energy carriers, such as producer gas, oils or methanol (Sumit
Sharma et al., 2014). Thermochemical conversion technologies include combustion,
pyrolysis, gasification and hydrothermal processing.
2.2.2.1 Combustion
Biomass combustion is one of the earliest and fastest method for human
energy use. This process has been adapted as experimental technologies to produce
liquid transportation fuels and chemical feedstocks (Saxena, Adhikari and Goyal,
2009a). Currently, the direct combustion of biomass continues to be the dominant
pathway for bioenergy in worldwide (Bridgwater, 2003; Gaul, 2012). During
biomass combustion, hot gases were produces at temperatures around 800–1000 ºC.
Meanwhile, for complete combustion, the heat was produce as a result of the
oxidation of carbon- and hydrogen-rich biomass to CO2 and H2O. Any type of
biomass can be burned, however in practice, only feedstock with a moisture content
< 50 % are applicable for a feasible biomass combustion process (McKendry,
2002b). Due to these condition, the biomass with high moisture content need to go
for pre-dried process before been introduced to the process. Details on chemical
kinetics of combustion process are complex and imperfect combustion will result in
the release of intermediate compounds. This intermediate may resulted in
23 | P a g e
Chapter 2: Literature review
environmental air pollutants such as CH4, CO, with sulfur and nitrogen content cause
the emission of SOx and NOx (Tanger et al., 2013).
2.2.2.2 Pyrolysis
One of the promising routes in converting biomass feedstock is through
pyrolysis process. The pyrolysis technology can convert biomass into solid
(charcoal), liquid (tar and other organics, such as acetic acid, acetone and methanol)
and gaseous products (H2, CO2, CO). These products offer possible alternate sources
of energy. Pyrolysis is a process by which a biomass feedstock is thermally degraded
in the absence of oxygen/air (Babu, 2008). The pyrolysis can be divided into three
subclasses, namely conventional pyrolysis (slow pyrolysis), fast pyrolysis and flash
pyrolysis which depending on different operating conditions. Details on the operating
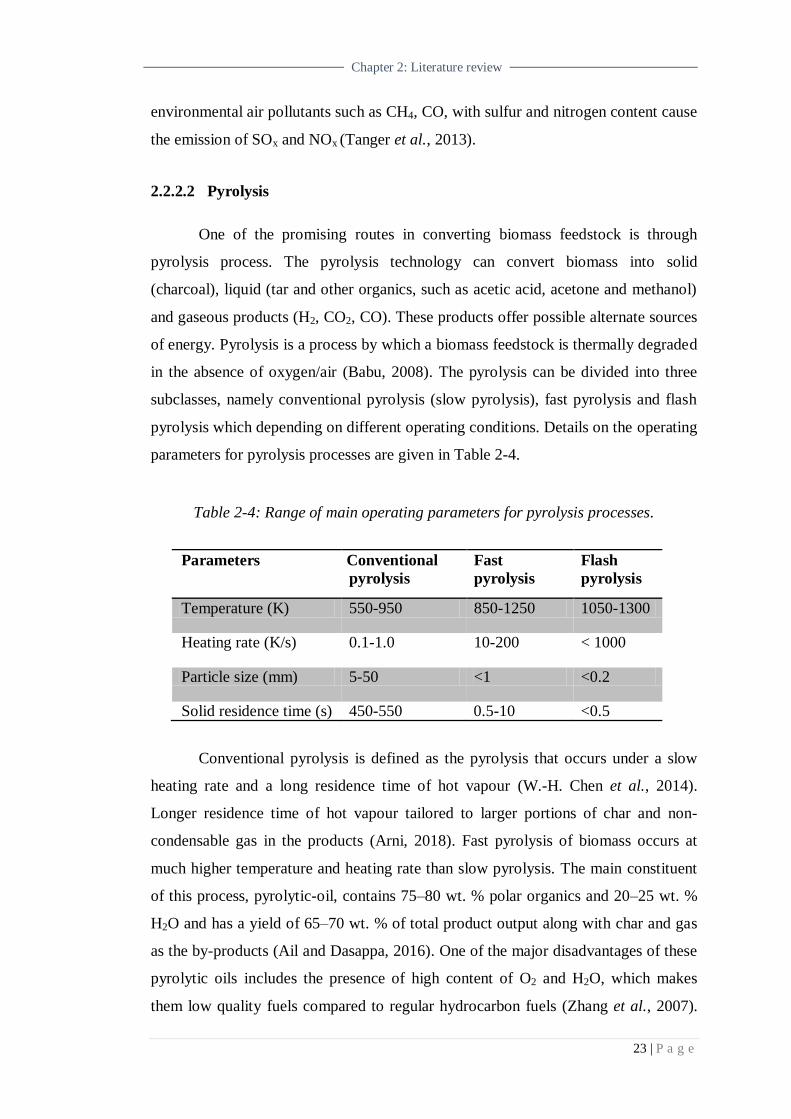
parameters for pyrolysis processes are given in Table 2-4.
Table 2-4: Range of main operating parameters for pyrolysis processes.
Parameters Conventional
pyrolysis
Fast
pyrolysis
Flash
pyrolysis
Temperature (K) 550-950 850-1250 1050-1300
Heating rate (K/s) 0.1-1.0 10-200 < 1000
Particle size (mm) 5-50 <1 <0.2
Solid residence time (s) 450-550 0.5-10 <0.5
Conventional pyrolysis is defined as the pyrolysis that occurs under a slow
heating rate and a long residence time of hot vapour (W.-H. Chen et al., 2014).
Longer residence time of hot vapour tailored to larger portions of char and non-
condensable gas in the products (Arni, 2018). Fast pyrolysis of biomass occurs at
much higher temperature and heating rate than slow pyrolysis. The main constituent
of this process, pyrolytic-oil, contains 75–80 wt. % polar organics and 20–25 wt. %
H2O and has a yield of 65–70 wt. % of total product output along with char and gas
as the by-products (Ail and Dasappa, 2016). One of the major disadvantages of these
pyrolytic oils includes the presence of high content of O2 and H2O, which makes
them low quality fuels compared to regular hydrocarbon fuels (Zhang et al., 2007).
24 | P a g e
Chapter 2: Literature review
Flash pyrolysis differs strongly from the conventional pyrolysis which performed
slowly with massive pieces of wood. Flash pyrolysis was conducted at high heating
rate using small particle size of feedstock which gives mostly gaseous products due
to its operating condition (Babu, 2008).
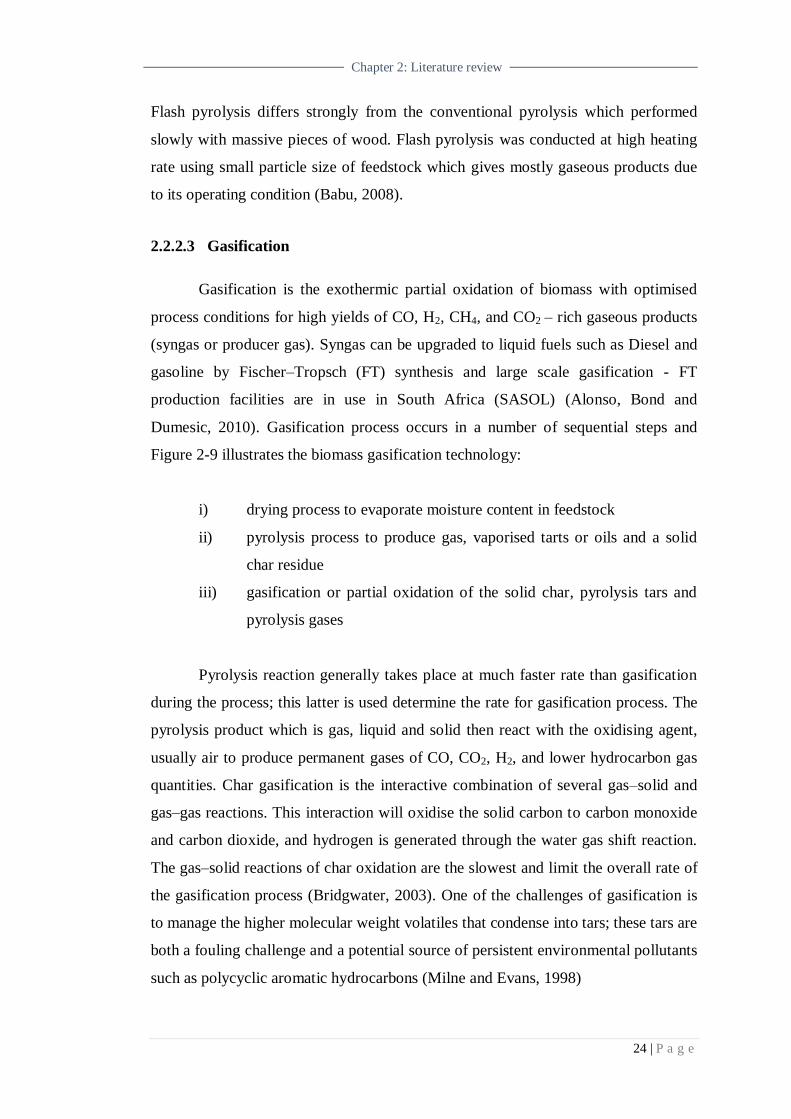
2.2.2.3 Gasification
Gasification is the exothermic partial oxidation of biomass with optimised
process conditions for high yields of CO, H2, CH4, and CO2 – rich gaseous products
(syngas or producer gas). Syngas can be upgraded to liquid fuels such as Diesel and
gasoline by Fischer–Tropsch (FT) synthesis and large scale gasification - FT
production facilities are in use in South Africa (SASOL) (Alonso, Bond and
Dumesic, 2010). Gasification process occurs in a number of sequential steps and
Figure 2-9 illustrates the biomass gasification technology:
i) drying process to evaporate moisture content in feedstock
ii) pyrolysis process to produce gas, vaporised tarts or oils and a solid
char residue
iii) gasification or partial oxidation of the solid char, pyrolysis tars and
pyrolysis gases
Pyrolysis reaction generally takes place at much faster rate than gasification
during the process; this latter is used determine the rate for gasification process. The
pyrolysis product which is gas, liquid and solid then react with the oxidising agent,
usually air to produce permanent gases of CO, CO2, H2, and lower hydrocarbon gas
quantities. Char gasification is the interactive combination of several gas–solid and
gas–gas reactions. This interaction will oxidise the solid carbon to carbon monoxide
and carbon dioxide, and hydrogen is generated through the water gas shift reaction.
The gas–solid reactions of char oxidation are the slowest and limit the overall rate of
the gasification process (Bridgwater, 2003). One of the challenges of gasification is
to manage the higher molecular weight volatiles that condense into tars; these tars are
both a fouling challenge and a potential source of persistent environmental pollutants
such as polycyclic aromatic hydrocarbons (Milne and Evans, 1998)
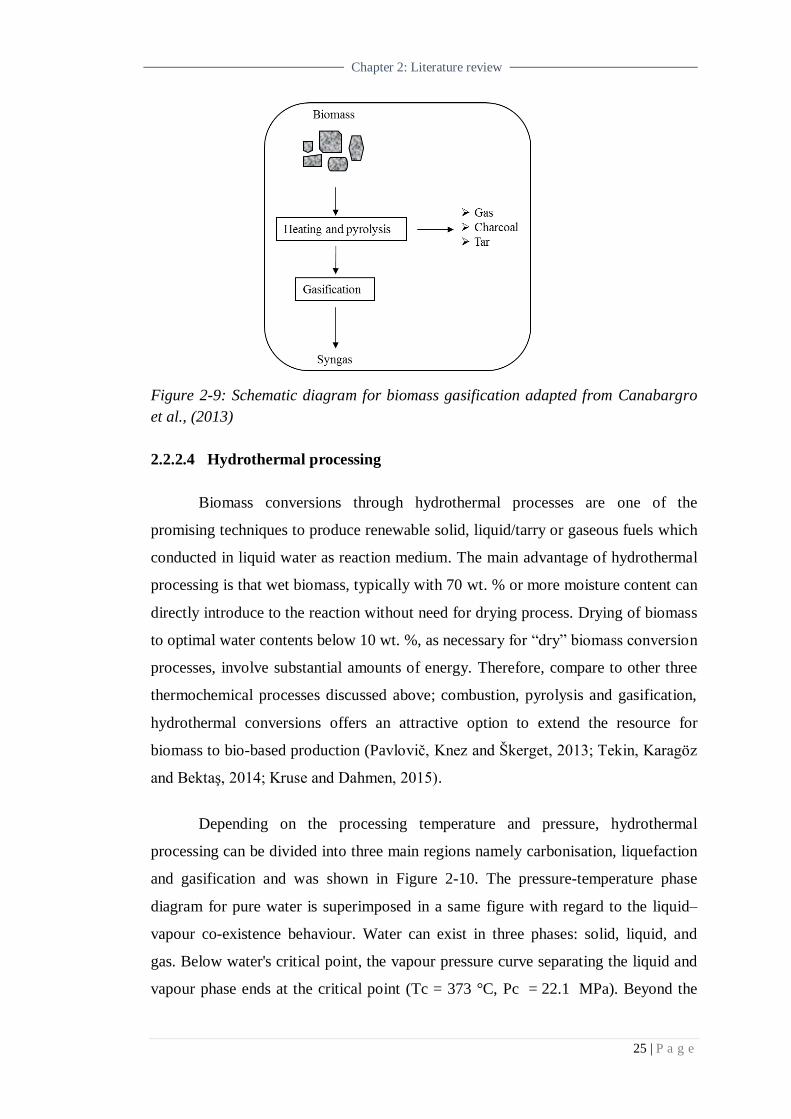
25 | P a g e
Chapter 2: Literature review
Figure 2-9: Schematic diagram for biomass gasification adapted from Canabargro
et al., (2013)
2.2.2.4 Hydrothermal processing
Biomass conversions through hydrothermal processes are one of the
promising techniques to produce renewable solid, liquid/tarry or gaseous fuels which
conducted in liquid water as reaction medium. The main advantage of hydrothermal
processing is that wet biomass, typically with 70 wt. % or more moisture content can
directly introduce to the reaction without need for drying process. Drying of biomass
to optimal water contents below 10 wt. %, as necessary for ―dry‖ biomass conversion
processes, involve substantial amounts of energy. Therefore, compare to other three
thermochemical processes discussed above; combustion, pyrolysis and gasification,
hydrothermal conversions offers an attractive option to extend the resource for
biomass to bio-based production (Pavlovič, Knez and Škerget, 2013; Tekin, Karagöz
and Bektaş, 2014; Kruse and Dahmen, 2015).
Depending on the processing temperature and pressure, hydrothermal
processing can be divided into three main regions namely carbonisation, liquefaction
and gasification and was shown in Figure 2-10. The pressure-temperature phase
diagram for pure water is superimposed in a same figure with regard to the liquid–
vapour co-existence behaviour. Water can exist in three phases: solid, liquid, and
gas. Below water's critical point, the vapour pressure curve separating the liquid and
vapour phase ends at the critical point (Tc = 373 °C, Pc = 22.1 MPa). Beyond the
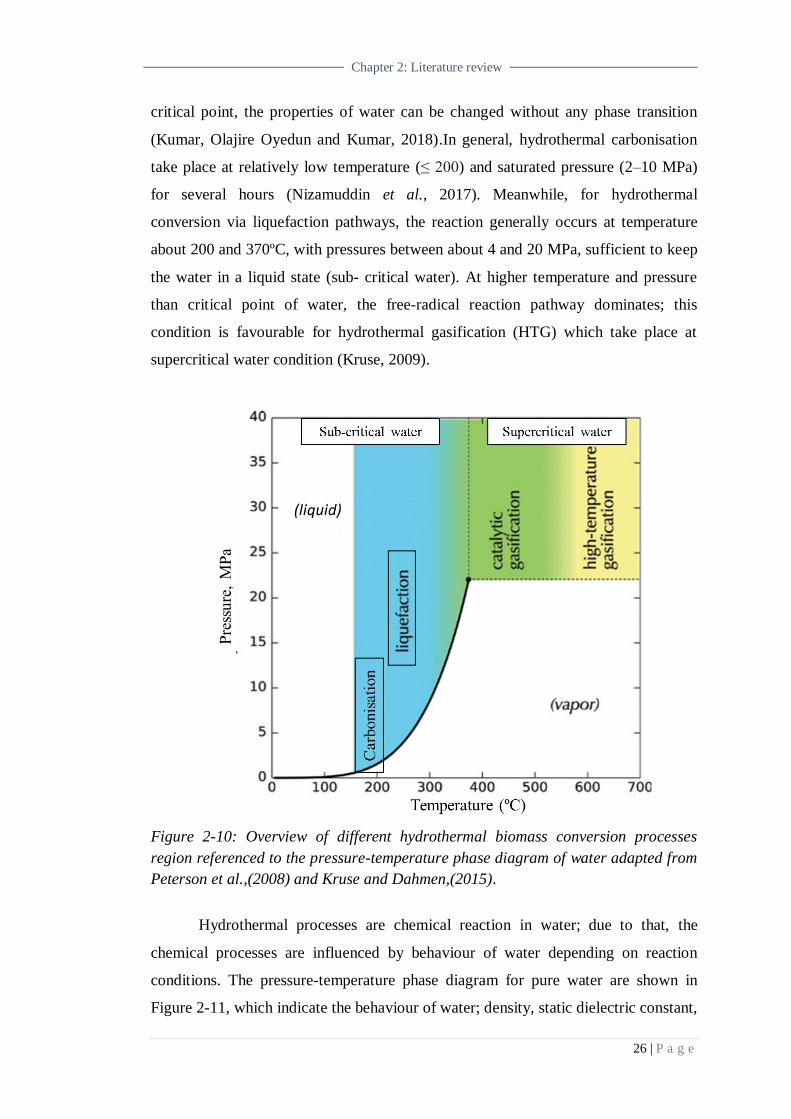
26 | P a g e
Chapter 2: Literature review
critical point, the properties of water can be changed without any phase transition
(Kumar, Olajire Oyedun and Kumar, 2018).In general, hydrothermal carbonisation
take place at relatively low temperature (≤ 200) and saturated pressure (2–10 MPa)
for several hours (Nizamuddin et al., 2017). Meanwhile, for hydrothermal
conversion via liquefaction pathways, the reaction generally occurs at temperature
about 200 and 370ºC, with pressures between about 4 and 20 MPa, sufficient to keep
the water in a liquid state (sub- critical water). At higher temperature and pressure
than critical point of water, the free-radical reaction pathway dominates; this
condition is favourable for hydrothermal gasification (HTG) which take place at
supercritical water condition (Kruse, 2009).
Figure 2-10: Overview of different hydrothermal biomass conversion processes
region referenced to the pressure-temperature phase diagram of water adapted from
Peterson et al.,(2008) and Kruse and Dahmen,(2015).
Hydrothermal processes are chemical reaction in water; due to that, the
chemical processes are influenced by behaviour of water depending on reaction
conditions. The pressure-temperature phase diagram for pure water are shown in
Figure 2-11, which indicate the behaviour of water; density, static dielectric constant,
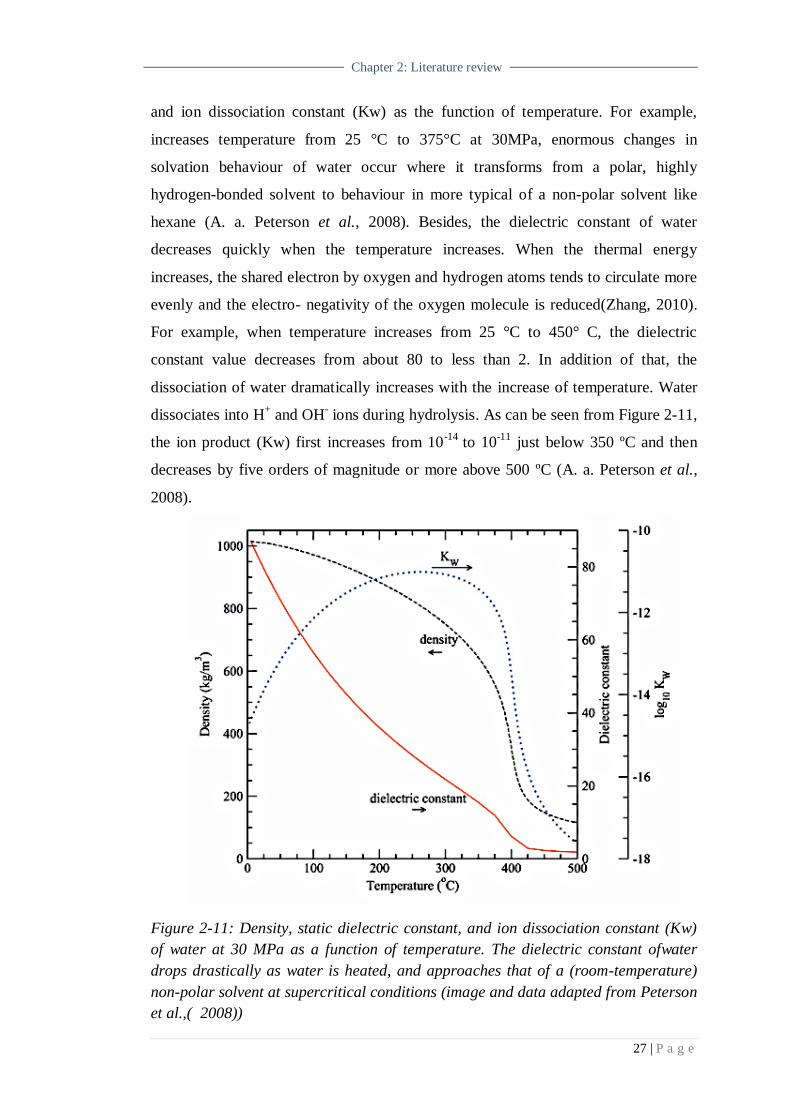
27 | P a g e
Chapter 2: Literature review
and ion dissociation constant (Kw) as the function of temperature. For example,
increases temperature from 25 °C to 375°C at 30MPa, enormous changes in
solvation behaviour of water occur where it transforms from a polar, highly
hydrogen-bonded solvent to behaviour in more typical of a non-polar solvent like
hexane (A. a. Peterson et al., 2008). Besides, the dielectric constant of water
decreases quickly when the temperature increases. When the thermal energy
increases, the shared electron by oxygen and hydrogen atoms tends to circulate more
evenly and the electro- negativity of the oxygen molecule is reduced(Zhang, 2010).
For example, when temperature increases from 25 °C to 450° C, the dielectric
constant value decreases from about 80 to less than 2. In addition of that, the
dissociation of water dramatically increases with the increase of temperature. Water
dissociates into H+ and OH
- ions during hydrolysis. As can be seen from Figure 2-11,
the ion product (Kw) first increases from 10-14
to 10-11
just below 350 ºC and then
decreases by five orders of magnitude or more above 500 ºC (A. a. Peterson et al.,
2008).
Figure 2-11: Density, static dielectric constant, and ion dissociation constant (Kw)
of water at 30 MPa as a function of temperature. The dielectric constant ofwater
drops drastically as water is heated, and approaches that of a (room-temperature)
non-polar solvent at supercritical conditions (image and data adapted from Peterson
et al.,( 2008))
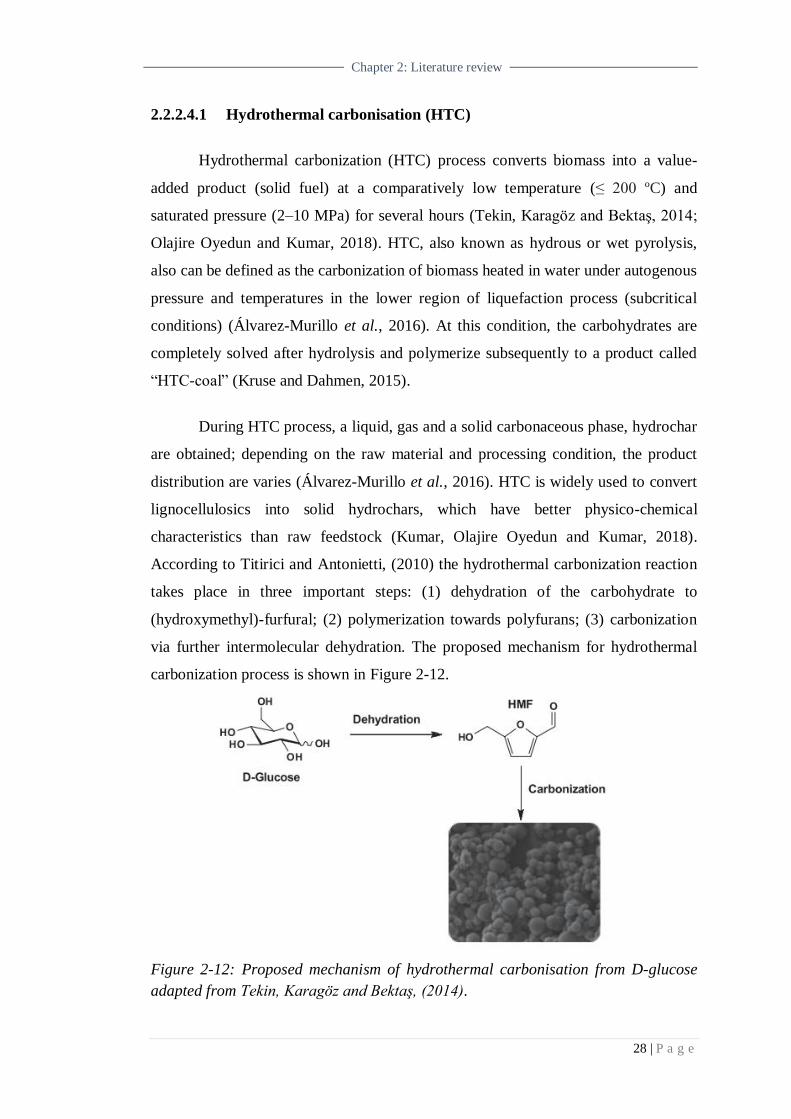
28 | P a g e
Chapter 2: Literature review
2.2.2.4.1 Hydrothermal carbonisation (HTC)
Hydrothermal carbonization (HTC) process converts biomass into a value-
added product (solid fuel) at a comparatively low temperature (≤ 200 ºC) and
saturated pressure (2–10 MPa) for several hours (Tekin, Karagöz and Bektaş, 2014;
Olajire Oyedun and Kumar, 2018). HTC, also known as hydrous or wet pyrolysis,
also can be defined as the carbonization of biomass heated in water under autogenous
pressure and temperatures in the lower region of liquefaction process (subcritical
conditions) (Álvarez-Murillo et al., 2016). At this condition, the carbohydrates are
completely solved after hydrolysis and polymerize subsequently to a product called
―HTC-coal‖ (Kruse and Dahmen, 2015).
During HTC process, a liquid, gas and a solid carbonaceous phase, hydrochar
are obtained; depending on the raw material and processing condition, the product
distribution are varies (Álvarez-Murillo et al., 2016). HTC is widely used to convert
lignocellulosics into solid hydrochars, which have better physico-chemical
characteristics than raw feedstock (Kumar, Olajire Oyedun and Kumar, 2018).
According to Titirici and Antonietti, (2010) the hydrothermal carbonization reaction
takes place in three important steps: (1) dehydration of the carbohydrate to
(hydroxymethyl)-furfural; (2) polymerization towards polyfurans; (3) carbonization
via further intermolecular dehydration. The proposed mechanism for hydrothermal
carbonization process is shown in Figure 2-12.
Figure 2-12: Proposed mechanism of hydrothermal carbonisation from D-glucose
adapted from Tekin, Karagöz and Bektaş, (2014).
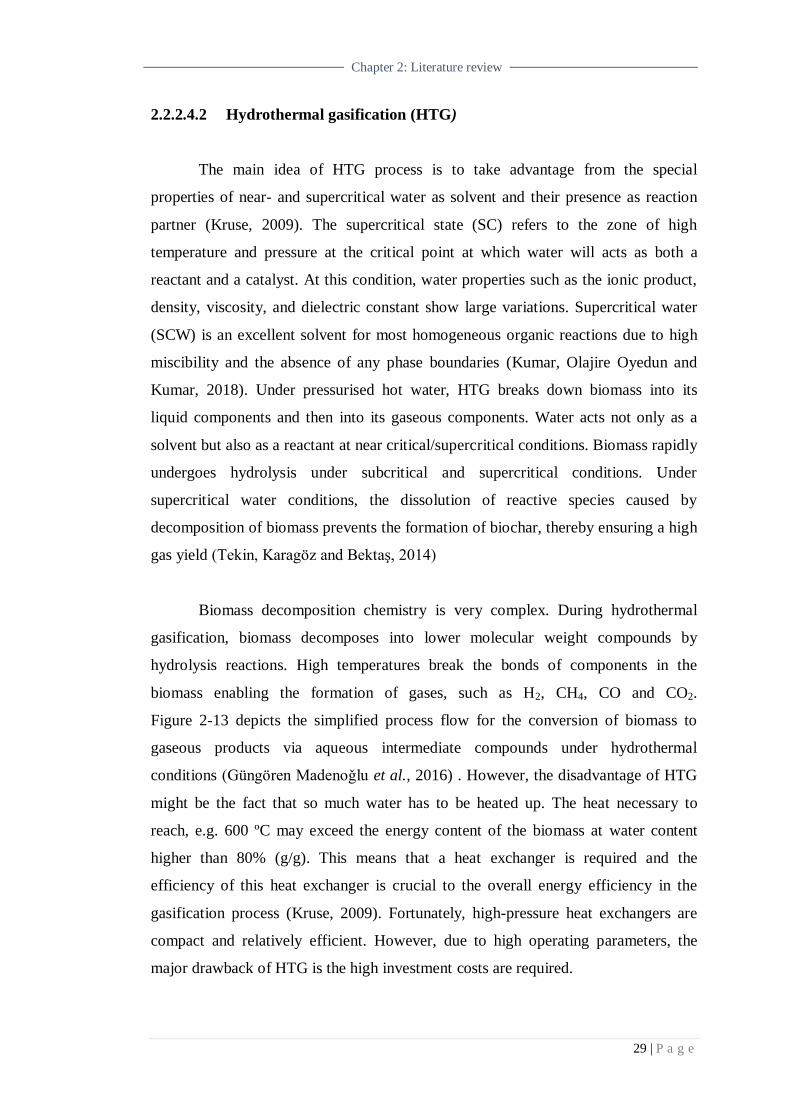
29 | P a g e
Chapter 2: Literature review
2.2.2.4.2 Hydrothermal gasification (HTG)
The main idea of HTG process is to take advantage from the special
properties of near- and supercritical water as solvent and their presence as reaction
partner (Kruse, 2009). The supercritical state (SC) refers to the zone of high
temperature and pressure at the critical point at which water will acts as both a
reactant and a catalyst. At this condition, water properties such as the ionic product,
density, viscosity, and dielectric constant show large variations. Supercritical water
(SCW) is an excellent solvent for most homogeneous organic reactions due to high
miscibility and the absence of any phase boundaries (Kumar, Olajire Oyedun and
Kumar, 2018). Under pressurised hot water, HTG breaks down biomass into its
liquid components and then into its gaseous components. Water acts not only as a
solvent but also as a reactant at near critical/supercritical conditions. Biomass rapidly
undergoes hydrolysis under subcritical and supercritical conditions. Under
supercritical water conditions, the dissolution of reactive species caused by
decomposition of biomass prevents the formation of biochar, thereby ensuring a high
gas yield (Tekin, Karagöz and Bektaş, 2014)
Biomass decomposition chemistry is very complex. During hydrothermal
gasification, biomass decomposes into lower molecular weight compounds by
hydrolysis reactions. High temperatures break the bonds of components in the
biomass enabling the formation of gases, such as H2, CH4, CO and CO2.
Figure 2-13 depicts the simplified process flow for the conversion of biomass to
gaseous products via aqueous intermediate compounds under hydrothermal
conditions (Güngören Madenoǧlu et al., 2016) . However, the disadvantage of HTG
might be the fact that so much water has to be heated up. The heat necessary to
reach, e.g. 600 ºC may exceed the energy content of the biomass at water content
higher than 80% (g/g). This means that a heat exchanger is required and the
efficiency of this heat exchanger is crucial to the overall energy efficiency in the
gasification process (Kruse, 2009). Fortunately, high-pressure heat exchangers are
compact and relatively efficient. However, due to high operating parameters, the
major drawback of HTG is the high investment costs are required.
30 | P a g e
Chapter 2: Literature review
Figure 2-13: Simplified mechanism for conversion of cellulose/lignin to gaseous
products through aqueous intermediates at hydrothermal conditions of water
adapted from Güngören Madenoǧlu et al.,(2016).
2.2.2.4.3 Hydrothermal liquefaction (HTL)
HTL is the thermochemical conversion of biomass into liquid fuels by
processing in a hot, pressurised water environment for sufficient time to break down
the solid biopolymeric structure to mainly liquid components. Hydrothermal
technologies are broadly defined as chemical and physical transformations in
medium-temperature (200–400°C), with high-pressure (5–40 MPa) water (A.
Peterson et al., 2008). The HTL of total biomass yields a range of different products
including bio-crude oil, aqueous dissolved chemicals, solid residue, and gas. HTL
product yields and properties vary significantly according to the feedstocks
processed as well as the reaction conditions employed (Jazrawi et al., 2015).
Although the product distribution in bio-oil varies with the composition of the raw
material and process conditions, the same groups of compounds are detected in
almost all HTL bio-oils (Pavlovič, Knez and Škerget, 2013). The liquid oils contain a
range of chemicals including carboxylic acids, alcohols, aldehydes, esters, ketones,
sugars, lignin-derived phenols, furans, etc. (Stöcker, 2008).
At present, HTL and pyrolysis are two principle thermochemical conversion
technologies to upgrade biomass feedstocks to biofuels (Kruse and Dahmen, 2015;
Zhu et al., 2015). Xu (2014) have proposed the bio-oil platform in bio refinery and it
was illustrated in Figure 2-14.
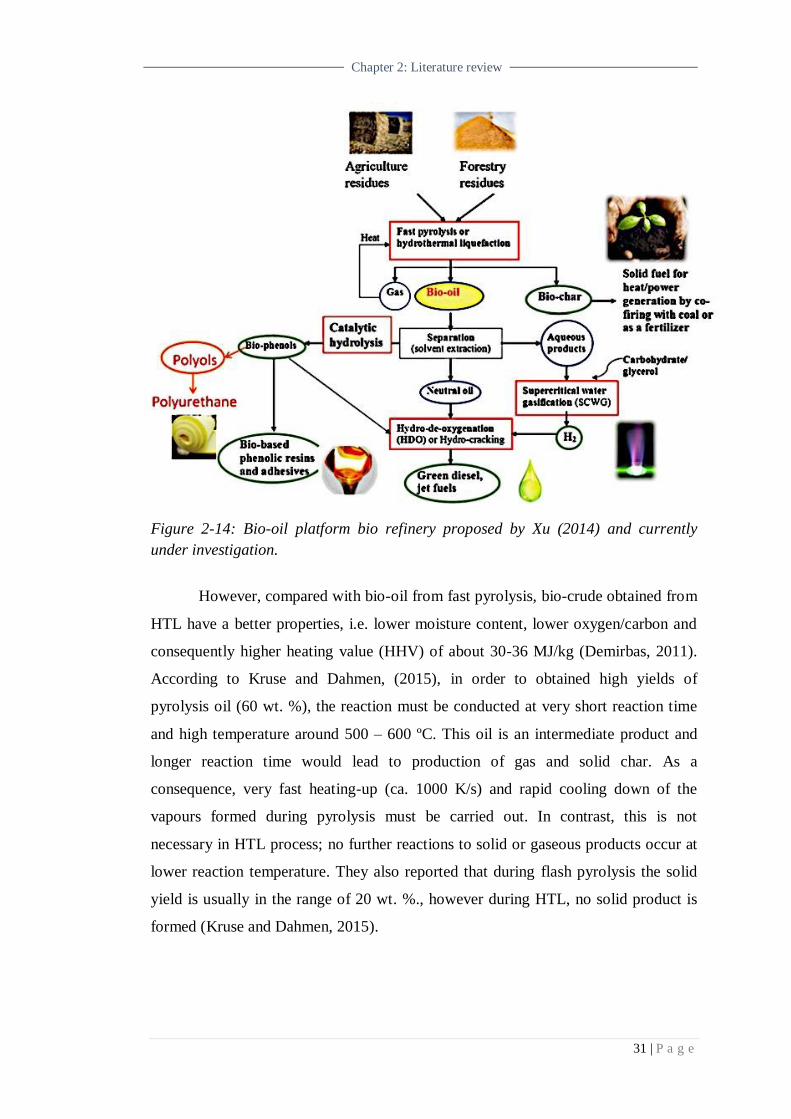
31 | P a g e
Chapter 2: Literature review
Figure 2-14: Bio-oil platform bio refinery proposed by Xu (2014) and currently
under investigation.
However, compared with bio-oil from fast pyrolysis, bio-crude obtained from
HTL have a better properties, i.e. lower moisture content, lower oxygen/carbon and
consequently higher heating value (HHV) of about 30-36 MJ/kg (Demirbas, 2011).
According to Kruse and Dahmen, (2015), in order to obtained high yields of
pyrolysis oil (60 wt. %), the reaction must be conducted at very short reaction time
and high temperature around 500 – 600 ºC. This oil is an intermediate product and
longer reaction time would lead to production of gas and solid char. As a
consequence, very fast heating-up (ca. 1000 K/s) and rapid cooling down of the
vapours formed during pyrolysis must be carried out. In contrast, this is not
necessary in HTL process; no further reactions to solid or gaseous products occur at
lower reaction temperature. They also reported that during flash pyrolysis the solid
yield is usually in the range of 20 wt. %., however during HTL, no solid product is
formed (Kruse and Dahmen, 2015).
32 | P a g e
Chapter 2: Literature review
Most of the biomass sources are wet, and their moisture content can be at the
range up to 95wt. %. In most methods for biomass upgrading, the feed must be dried
before processing (Akia, Yazdani and Motaee, 2014). HTL reaction takes place in
subcritical water as the reaction medium; thus biomass feedstock can be treated
directly without the need for energy-consuming drying process (Zhu et al., 2015; de
Caprariis et al., 2017). Water also has a lower dielectric constant, lower viscosity,
and a higher ionic product than normal water in subcritical condition. The
combination of these factors results in higher solubility of organic compounds and
increased reaction rates of base and acid-catalysed reactions (Laine, 2015). In turns,
these properties make subcritical water as an excellent medium for converting
biomass-derived organic molecules into value-added liquid products (Kruse and
Dinjus, 2007). On top of that, the density, dissociation and solubility of water change
significantly with higher temperature and greatly affect co-existing reaction and rate
of reaction. By controlling the temperature of the HTL reaction, the desired reactions
to liquid biofuels production can be shifted. Overall, HTL offers an advantage and
flexible technology in utilising various biomass feedstocks to produce liquid biofuel
compare to other thermochemical method. Current study focuses on the HTL of
brewer‘s spent grain (BSG) as lignocellulosic biomass.
2.3 Brewers spent grain (BSG): A case study
Barley grain is rich in starch and proteins and consists of the germ (embryo),
the endosperm (comprising the aleurone and starchy endosperm) and the grain
coverings; as the main components. The grain cover can further be divided into the
seed coat, the pericarp layers and the husk as shown in Figure 2-15. The pericarp is
waterproof and waxy, and the seed coat acts as a semi-permeable membrane. The
pericarp–seed coat interface effectively defines the exterior and the interior of the
kernel (Mussatto, Dragone and Roberto, 2006). The husk provides external grain
protection, and is a multi-layered, dead tissue consisting mainly of lignocellulosic
cell walls, but also contains small amounts of proteins, resins and tannins (Lewis and
Young, 1995; VenturiniFilho and Cereda, 2001).
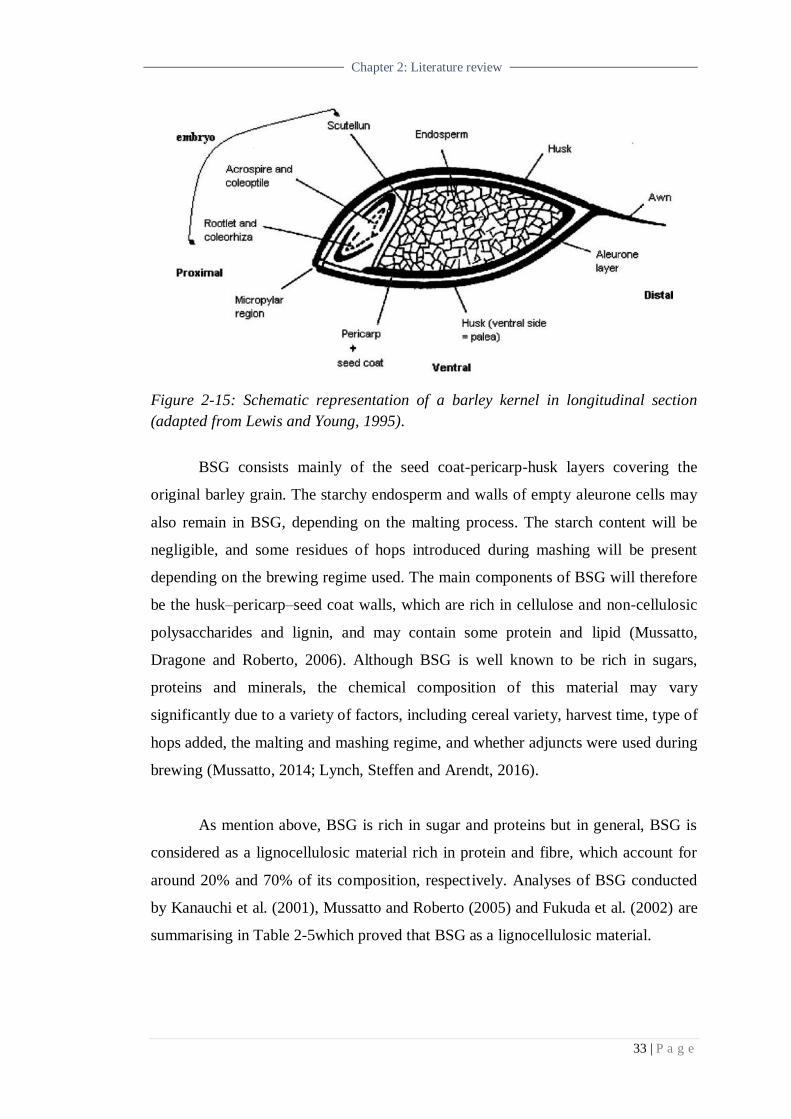
33 | P a g e
Chapter 2: Literature review
Figure 2-15: Schematic representation of a barley kernel in longitudinal section
(adapted from Lewis and Young, 1995).
BSG consists mainly of the seed coat-pericarp-husk layers covering the
original barley grain. The starchy endosperm and walls of empty aleurone cells may
also remain in BSG, depending on the malting process. The starch content will be
negligible, and some residues of hops introduced during mashing will be present
depending on the brewing regime used. The main components of BSG will therefore
be the husk–pericarp–seed coat walls, which are rich in cellulose and non-cellulosic
polysaccharides and lignin, and may contain some protein and lipid (Mussatto,
Dragone and Roberto, 2006). Although BSG is well known to be rich in sugars,
proteins and minerals, the chemical composition of this material may vary
significantly due to a variety of factors, including cereal variety, harvest time, type of
hops added, the malting and mashing regime, and whether adjuncts were used during
brewing (Mussatto, 2014; Lynch, Steffen and Arendt, 2016).
As mention above, BSG is rich in sugar and proteins but in general, BSG is
considered as a lignocellulosic material rich in protein and fibre, which account for
around 20% and 70% of its composition, respectively. Analyses of BSG conducted
by Kanauchi et al. (2001), Mussatto and Roberto (2005) and Fukuda et al. (2002) are
summarising in Table 2-5which proved that BSG as a lignocellulosic material.
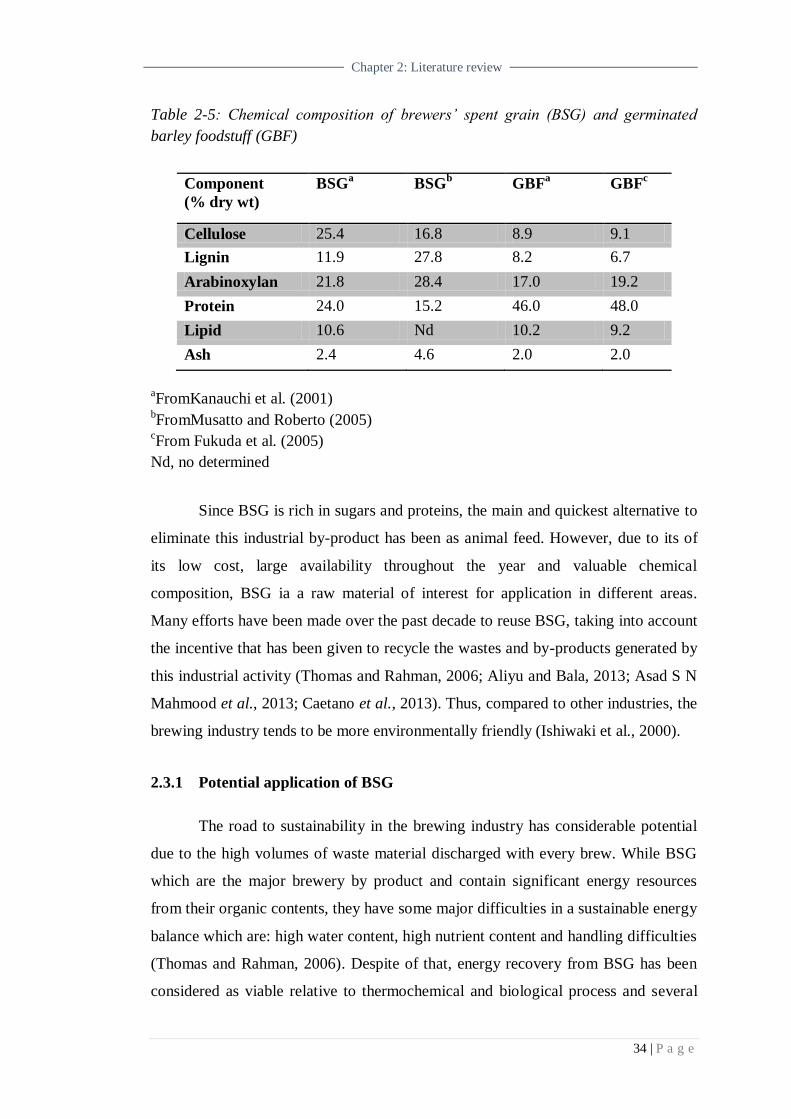
34 | P a g e
Chapter 2: Literature review
Table 2-5: Chemical composition of brewers’ spent grain (BSG) and germinated
barley foodstuff (GBF)
Component
(% dry wt)
BSGa BSG
b GBF
a GBF
c
Cellulose 25.4 16.8 8.9 9.1
Lignin 11.9 27.8 8.2 6.7
Arabinoxylan 21.8 28.4 17.0 19.2
Protein 24.0 15.2 46.0 48.0
Lipid 10.6 Nd 10.2 9.2
Ash 2.4 4.6 2.0 2.0
aFromKanauchi et al. (2001)
bFromMusatto and Roberto (2005)
cFrom Fukuda et al. (2005)
Nd, no determined
Since BSG is rich in sugars and proteins, the main and quickest alternative to
eliminate this industrial by-product has been as animal feed. However, due to its of
its low cost, large availability throughout the year and valuable chemical
composition, BSG ia a raw material of interest for application in different areas.
Many efforts have been made over the past decade to reuse BSG, taking into account
the incentive that has been given to recycle the wastes and by-products generated by
this industrial activity (Thomas and Rahman, 2006; Aliyu and Bala, 2013; Asad S N
Mahmood et al., 2013; Caetano et al., 2013). Thus, compared to other industries, the
brewing industry tends to be more environmentally friendly (Ishiwaki et al., 2000).
2.3.1 Potential application of BSG
The road to sustainability in the brewing industry has considerable potential
due to the high volumes of waste material discharged with every brew. While BSG
which are the major brewery by product and contain significant energy resources
from their organic contents, they have some major difficulties in a sustainable energy
balance which are: high water content, high nutrient content and handling difficulties
(Thomas and Rahman, 2006). Despite of that, energy recovery from BSG has been
considered as viable relative to thermochemical and biological process and several
35 | P a g e
Chapter 2: Literature review
alternatives had been proposed for BSG use in energy production, including in
ethanol production, biogas production, and also thermochemical conversion
(pyrolysis, combustion). The production of energy from BSG is been drive by the
energy crisis that the world is currently experiencing (Mussatto, 2014).
Thermochemical conversion technologies such as pyrolisis and combustion
of biomass material are one of the promising alternative methods to generate energy
from BSG. With the net and gross calorific values of 18.64 and 20.14 MJ kg−1
dry
mass respectively of BSG (Russ et al., 2005), and its reflect BSG as an interesting
raw material to produce energy by combustion. The combustion process of BGS
need pre-drainage of spent grain to moisture content lower than 550 g kg−1
. The heat
generated by combustion of the BSG could be used to support the energetic demand
of breweries in a brewery-integrated system(Mussatto, 2014). Nevertheless,
combustion of BSG will generates the emission of particles and toxic gaseous
emitted during combustion of dried BSG contain nitrogen and SOx(S.I. Mussatto et
al., 2006; Weger et al., 2014) and it is crucial to take a special care when performing
the combustion of BSG in order to minimizes this problem.
An alternative possibility for energy production from BSG is by anaerobic
fermentation. Several studies have reported the possibility of producing biogas from
BSG (Ezeonu & Okaka, 1996; Sežun et al., 2011) by this method and it is been
considered especially suitable for obtaining thermal energy in breweries with few
disadvantages towards environmental effects. Research conducted by (Ezeonu and
Okaka, 1996), evaluated the process kinetic and digestion efficiency of biogas
anaerobic batch fermentation of BSG which resulted in the production of biogas with
a total yield of 3476 cm3 per 100 g BSG after 15 days of digestion. Nonetheless, the
biogas production from BSG is hindered by the presence of lignin and it is at the
same time the limiting step for the complete degradation of the substrate (Sežun et
al., 2011). This inhibition is not prevented even by submitting BSG to mechanical,
thermochemical or chemical pre-treatments. The biogas production from BSG is
therefore a research area that merits great attention in order to develop a stable
production process.
36 | P a g e
Chapter 2: Literature review
During the last decade, an interest in established a competitive process for
ethanol production led to an significant impact of research in this area due to BSG
was considered as a promising raw material for this application(White et al., 2008).
Currently, ethanol production is at high levels for worldwide demanding and corn is
main raw material used for this purpose. However, since feedstock is an essentially
food, this scenario need an urge to change. Being evaluated in different kinds of
processes, BSG had been considered owing a great potential to produce ethanol due
to high content of hemicelluloses and cellulose fraction(White, Yohannan and
Walker, 2008; Xiros and Christakopoulos, 2009). BSG are rich source of
lignocellulose, such as the hemicellulose and cellulose which may be converted to
fermentable sugar for production of bioethanol. For the production of ethanol, some
pre-treatment may involve for example ultrasonication,acid treatment, enzymatic
hydrolysis, or microwave digestion, in which need to be consider as main challenge
for industrial sector nowadays(Mussatto, 2014). The pre-treatment steps for the raw
material areessentialto make the extraction of glucose from cellulose easier and for
ensuing use as a carbon source for fermentation process.
Recent research on BSG was done by Mahmood et al., (2013) using a
commercial reforming catalyst in a catalytic reforming reactor directly coupled to a
batch fixed bed pyrolysis reactor. It is proved that BSG can produce high yield of
bio- oil together with gas product by using thermochemical conversion. However,
either the combustion or pyrolysis, both of these technologies require pre-dried out
before the rest of the waste can go for the reaction, which would entail higher energy
and longer reaction times. Liquefaction conversion, which is a thermal process at
relatively moderate reaction conditions (temperature below 400°C and pressure
between 1 and 30MPa, generally in the presence of a catalyst) offers a great potential
to be applied for conversion of BSG.
2.4 Conclusion
The energy content in biomass or the waste products from harvesting or
processing of biomass could be diverted into renewable energy and biofuels. The
conversion of biomass to potential product stream can be achieved primarily via
biochemical and thermochemical processes. The thermochemical processes is a
37 | P a g e
Chapter 2: Literature review
promising technology that can convert biomass to valuable products and suitable for
different industrial applications.
The gasification and pyrolysis processes are complex and depends on several
factors such as composition of lignocellulosic material, heating rate and moisture
content. Most of the biomass sources are wet, and their moisture content can be at the
range up to 95 wt. %. Due to this, the biomass feedstock needs to go for drying
stages before been introduced to the biomass upgrading process. It should be noted
that the final cost of bio-products not just based on the price of the starting feedstock,
but it also depends heavily upon the processing cost. The latter may be decreased by
reducing the number of synthesis steps and improving their yields, but a judicious
choice of biomass conversion strategy could be essential to achieve a cost-effective
development of biomass utilisation towards bio-products (Gallezot, 2012).
Hydrothermal technologies have ability to process high moisture content
biomass waste without prior dewatering. This technology processing can be divided
into three main process namely hydrothermal carbonisation, hydrothermal
liquefaction and hydrothermal gasification; depending on the processing parameter.
In current work, the study will focus on hydrothermal liquefaction reactions using
BSG to produce liquid biofuel and valuable chemicals. Current applications of BSG
are basically limited to animal feeding because of its high protein and fiber content
or simply as landfill. Due to these, developing a new technique to utilise this agro-
industrial by-product is a great interest since BSG is produced in large quantities
throughout the year.

3
4 5 CHAPTER 3
RESEARCH
METHODOLOGY:
EXPERIMENTAL WORK
AND ANALYTICAL
TECHNIQUES
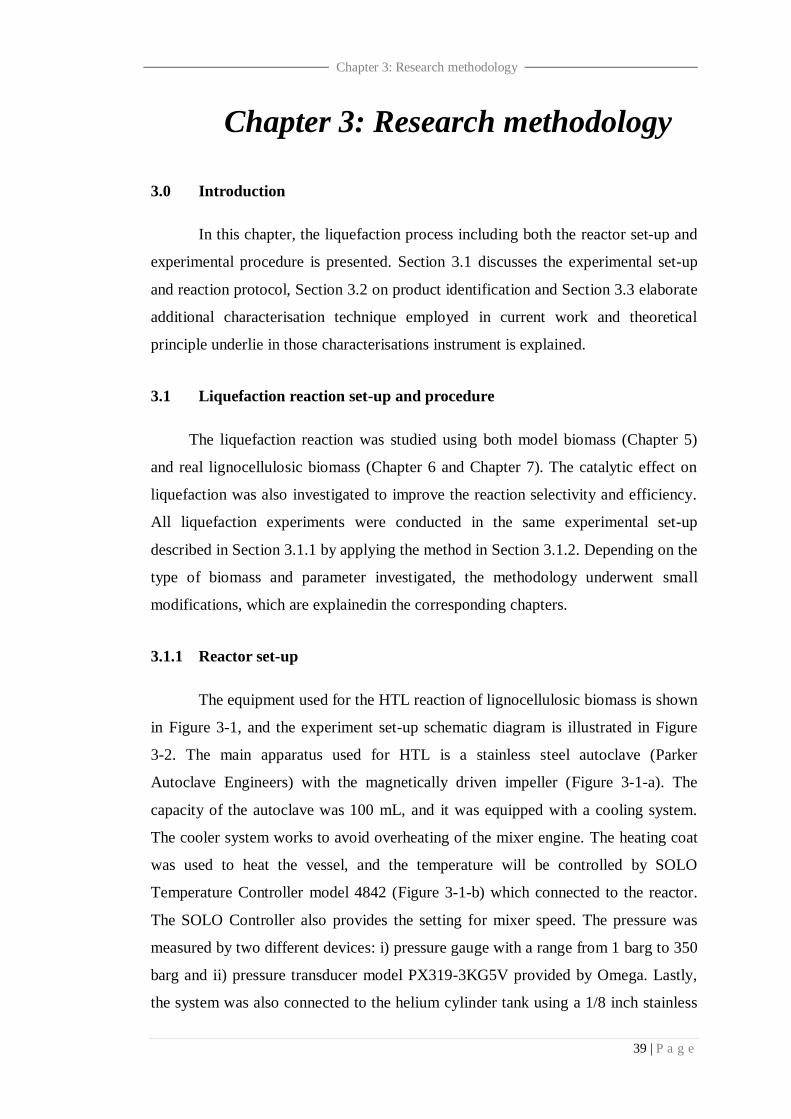
39 | P a g e
Chapter 3: Research methodology
3.Chapter 3: Research methodology
3.0 Introduction
In this chapter, the liquefaction process including both the reactor set-up and
experimental procedure is presented. Section 3.1 discusses the experimental set-up
and reaction protocol, Section 3.2 on product identification and Section 3.3 elaborate
additional characterisation technique employed in current work and theoretical
principle underlie in those characterisations instrument is explained.
3.1 Liquefaction reaction set-up and procedure
The liquefaction reaction was studied using both model biomass (Chapter 5)
and real lignocellulosic biomass (Chapter 6 and Chapter 7). The catalytic effect on
liquefaction was also investigated to improve the reaction selectivity and efficiency.
All liquefaction experiments were conducted in the same experimental set-up
described in Section 3.1.1 by applying the method in Section 3.1.2. Depending on the
type of biomass and parameter investigated, the methodology underwent small
modifications, which are explainedin the corresponding chapters.
3.1.1 Reactor set-up
The equipment used for the HTL reaction of lignocellulosic biomass is shown
in Figure 3-1, and the experiment set-up schematic diagram is illustrated in Figure
3-2. The main apparatus used for HTL is a stainless steel autoclave (Parker
Autoclave Engineers) with the magnetically driven impeller (Figure 3-1-a). The
capacity of the autoclave was 100 mL, and it was equipped with a cooling system.
The cooler system works to avoid overheating of the mixer engine. The heating coat
was used to heat the vessel, and the temperature will be controlled by SOLO
Temperature Controller model 4842 (Figure 3-1-b) which connected to the reactor.
The SOLO Controller also provides the setting for mixer speed. The pressure was
measured by two different devices: i) pressure gauge with a range from 1 barg to 350
barg and ii) pressure transducer model PX319-3KG5V provided by Omega. Lastly,
the system was also connected to the helium cylinder tank using a 1/8 inch stainless
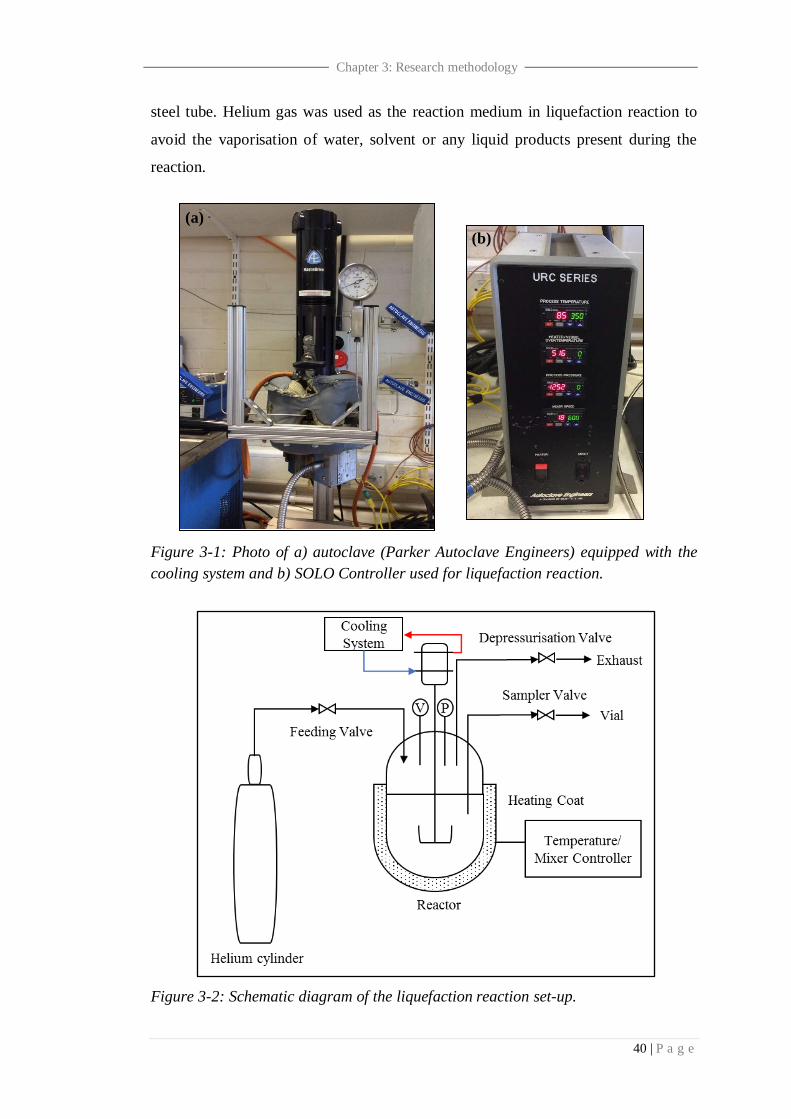
40 | P a g e
Chapter 3: Research methodology
steel tube. Helium gas was used as the reaction medium in liquefaction reaction to
avoid the vaporisation of water, solvent or any liquid products present during the
reaction.
Figure 3-1: Photo of a) autoclave (Parker Autoclave Engineers) equipped with the
cooling system and b) SOLO Controller used for liquefaction reaction.
Figure 3-2: Schematic diagram of the liquefaction reaction set-up.
(a)
(b)
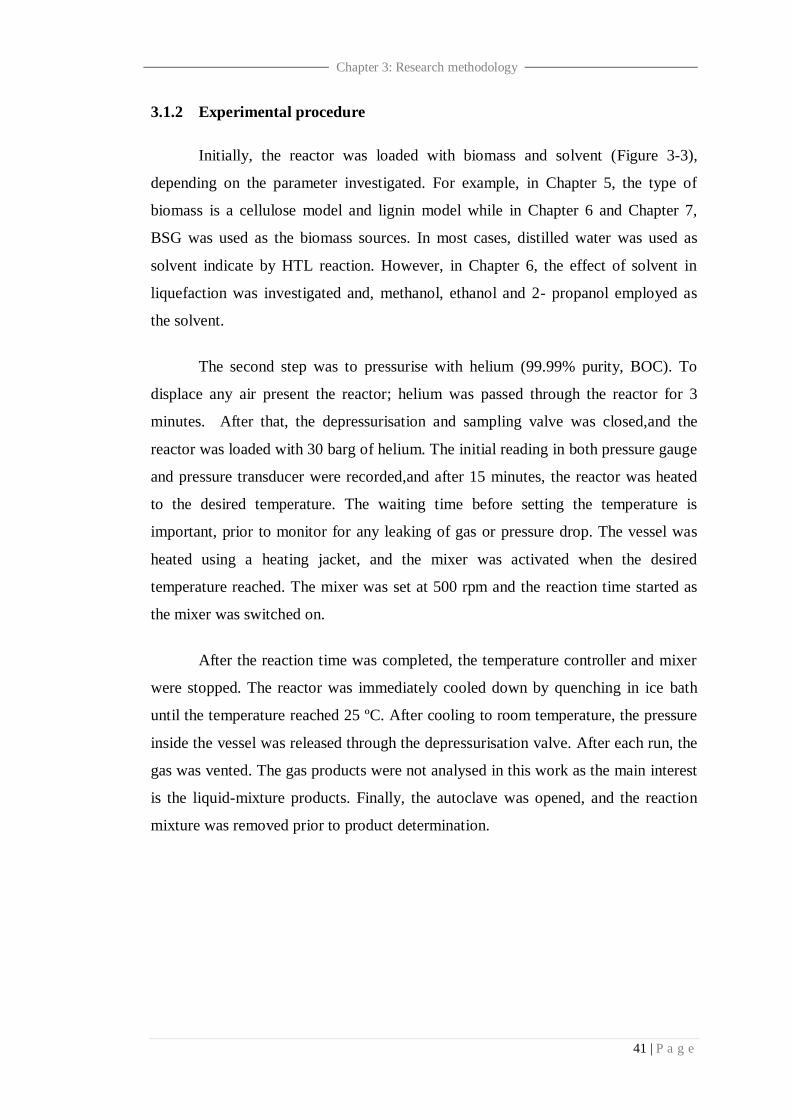
41 | P a g e
Chapter 3: Research methodology
3.1.2 Experimental procedure
Initially, the reactor was loaded with biomass and solvent (Figure 3-3),
depending on the parameter investigated. For example, in Chapter 5, the type of
biomass is a cellulose model and lignin model while in Chapter 6 and Chapter 7,
BSG was used as the biomass sources. In most cases, distilled water was used as
solvent indicate by HTL reaction. However, in Chapter 6, the effect of solvent in
liquefaction was investigated and, methanol, ethanol and 2- propanol employed as
the solvent.
The second step was to pressurise with helium (99.99% purity, BOC). To
displace any air present the reactor; helium was passed through the reactor for 3
minutes. After that, the depressurisation and sampling valve was closed,and the
reactor was loaded with 30 barg of helium. The initial reading in both pressure gauge
and pressure transducer were recorded,and after 15 minutes, the reactor was heated
to the desired temperature. The waiting time before setting the temperature is
important, prior to monitor for any leaking of gas or pressure drop. The vessel was
heated using a heating jacket, and the mixer was activated when the desired
temperature reached. The mixer was set at 500 rpm and the reaction time started as
the mixer was switched on.
After the reaction time was completed, the temperature controller and mixer
were stopped. The reactor was immediately cooled down by quenching in ice bath
until the temperature reached 25 ºC. After cooling to room temperature, the pressure
inside the vessel was released through the depressurisation valve. After each run, the
gas was vented. The gas products were not analysed in this work as the main interest
is the liquid-mixture products. Finally, the autoclave was opened, and the reaction
mixture was removed prior to product determination.
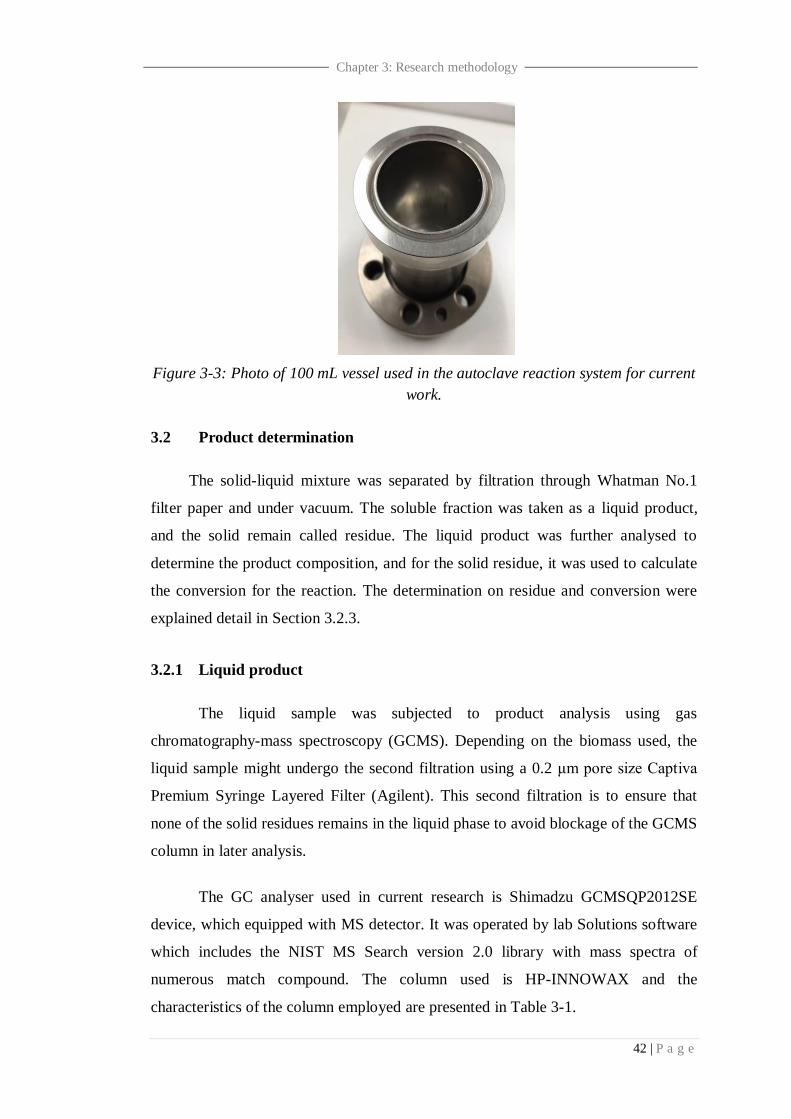
42 | P a g e
Chapter 3: Research methodology
Figure 3-3: Photo of 100 mL vessel used in the autoclave reaction system for current
work.
3.2 Product determination
The solid-liquid mixture was separated by filtration through Whatman No.1
filter paper and under vacuum. The soluble fraction was taken as a liquid product,
and the solid remain called residue. The liquid product was further analysed to
determine the product composition, and for the solid residue, it was used to calculate
the conversion for the reaction. The determination on residue and conversion were
explained detail in Section 3.2.3.
3.2.1 Liquid product
The liquid sample was subjected to product analysis using gas
chromatography-mass spectroscopy (GCMS). Depending on the biomass used, the
liquid sample might undergo the second filtration using a 0.2 μm pore size Captiva
Premium Syringe Layered Filter (Agilent). This second filtration is to ensure that
none of the solid residues remains in the liquid phase to avoid blockage of the GCMS
column in later analysis.
The GC analyser used in current research is Shimadzu GCMSQP2012SE
device, which equipped with MS detector. It was operated by lab Solutions software
which includes the NIST MS Search version 2.0 library with mass spectra of
numerous match compound. The column used is HP-INNOWAX and the
characteristics of the column employed are presented in Table 3-1.
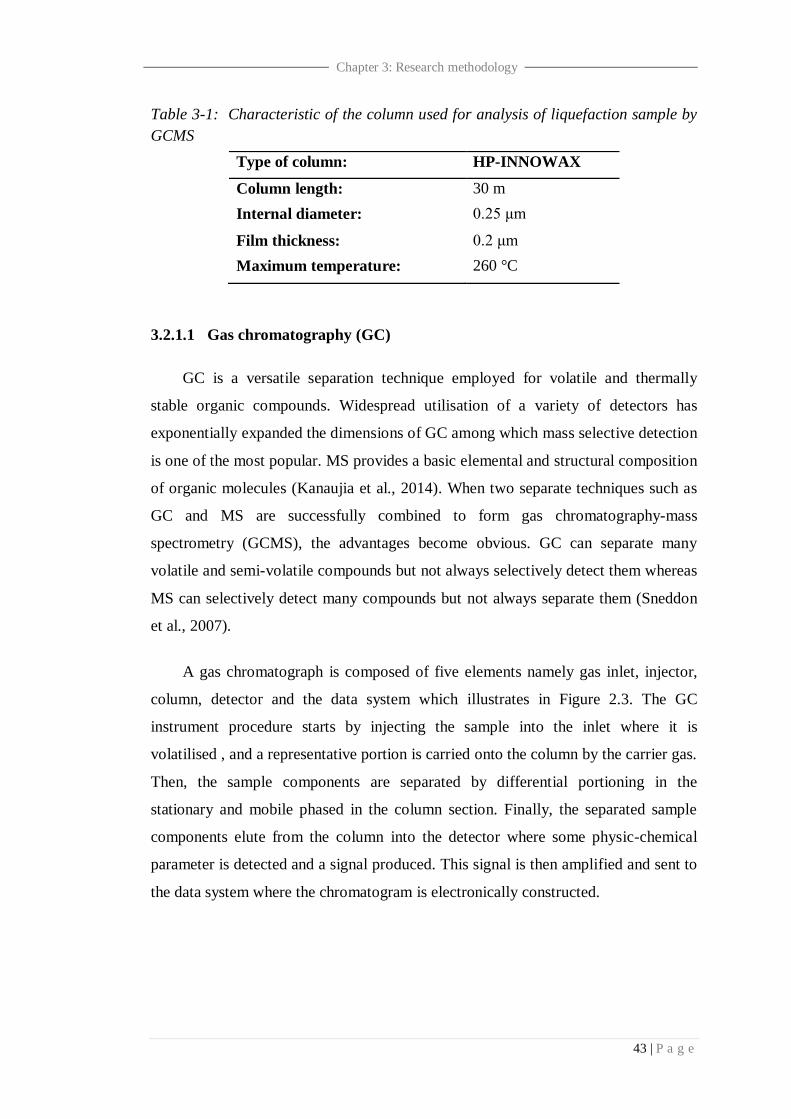
43 | P a g e
Chapter 3: Research methodology
Table 3-1: Characteristic of the column used for analysis of liquefaction sample by
GCMS
3.2.1.1 Gas chromatography (GC)
GC is a versatile separation technique employed for volatile and thermally
stable organic compounds. Widespread utilisation of a variety of detectors has
exponentially expanded the dimensions of GC among which mass selective detection
is one of the most popular. MS provides a basic elemental and structural composition
of organic molecules (Kanaujia et al., 2014). When two separate techniques such as
GC and MS are successfully combined to form gas chromatography-mass
spectrometry (GCMS), the advantages become obvious. GC can separate many
volatile and semi-volatile compounds but not always selectively detect them whereas
MS can selectively detect many compounds but not always separate them (Sneddon
et al., 2007).
A gas chromatograph is composed of five elements namely gas inlet, injector,
column, detector and the data system which illustrates in Figure 2.3. The GC
instrument procedure starts by injecting the sample into the inlet where it is
volatilised , and a representative portion is carried onto the column by the carrier gas.
Then, the sample components are separated by differential portioning in the
stationary and mobile phased in the column section. Finally, the separated sample
components elute from the column into the detector where some physic-chemical
parameter is detected and a signal produced. This signal is then amplified and sent to
the data system where the chromatogram is electronically constructed.
Type of column: HP-INNOWAX
Column length: 30 m
Internal diameter: 0.25 μm
Film thickness: 0.2 μm
Maximum temperature: 260 °C
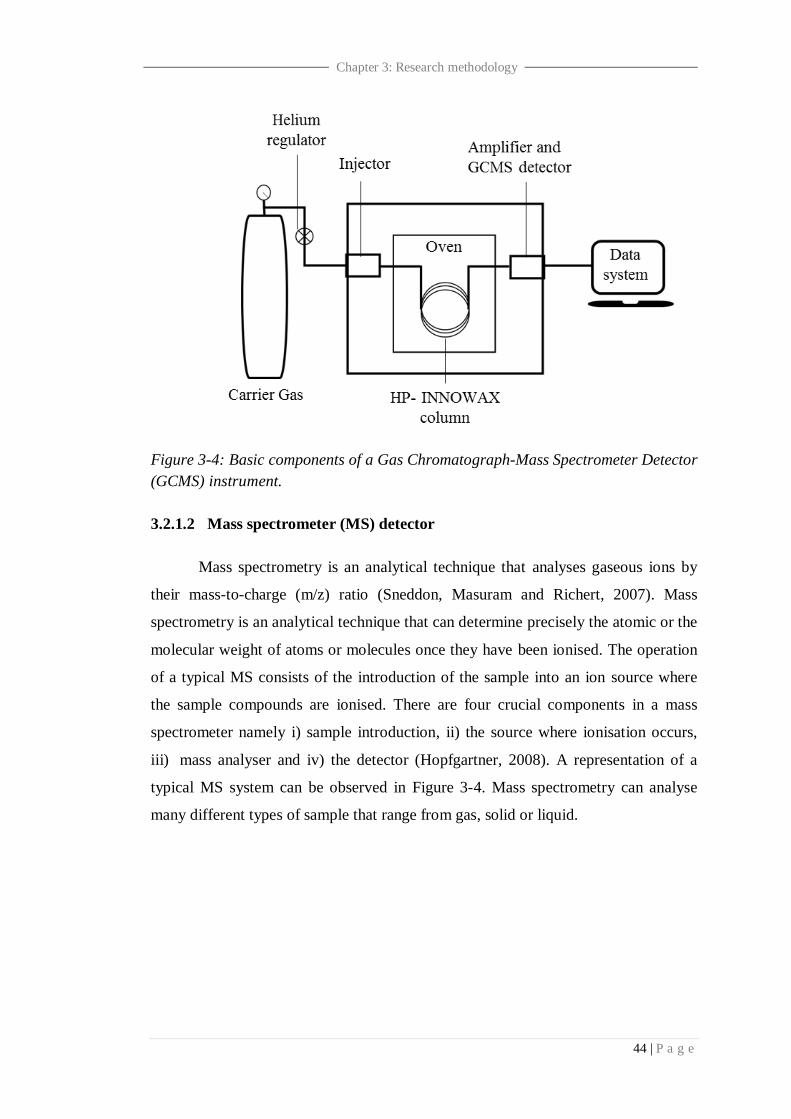
44 | P a g e
Chapter 3: Research methodology
Figure 3-4: Basic components of a Gas Chromatograph-Mass Spectrometer Detector
(GCMS) instrument.
3.2.1.2 Mass spectrometer (MS) detector
Mass spectrometry is an analytical technique that analyses gaseous ions by
their mass-to-charge (m/z) ratio (Sneddon, Masuram and Richert, 2007). Mass
spectrometry is an analytical technique that can determine precisely the atomic or the
molecular weight of atoms or molecules once they have been ionised. The operation
of a typical MS consists of the introduction of the sample into an ion source where
the sample compounds are ionised. There are four crucial components in a mass
spectrometer namely i) sample introduction, ii) the source where ionisation occurs,
iii) mass analyser and iv) the detector (Hopfgartner, 2008). A representation of a
typical MS system can be observed in Figure 3-4. Mass spectrometry can analyse
many different types of sample that range from gas, solid or liquid.
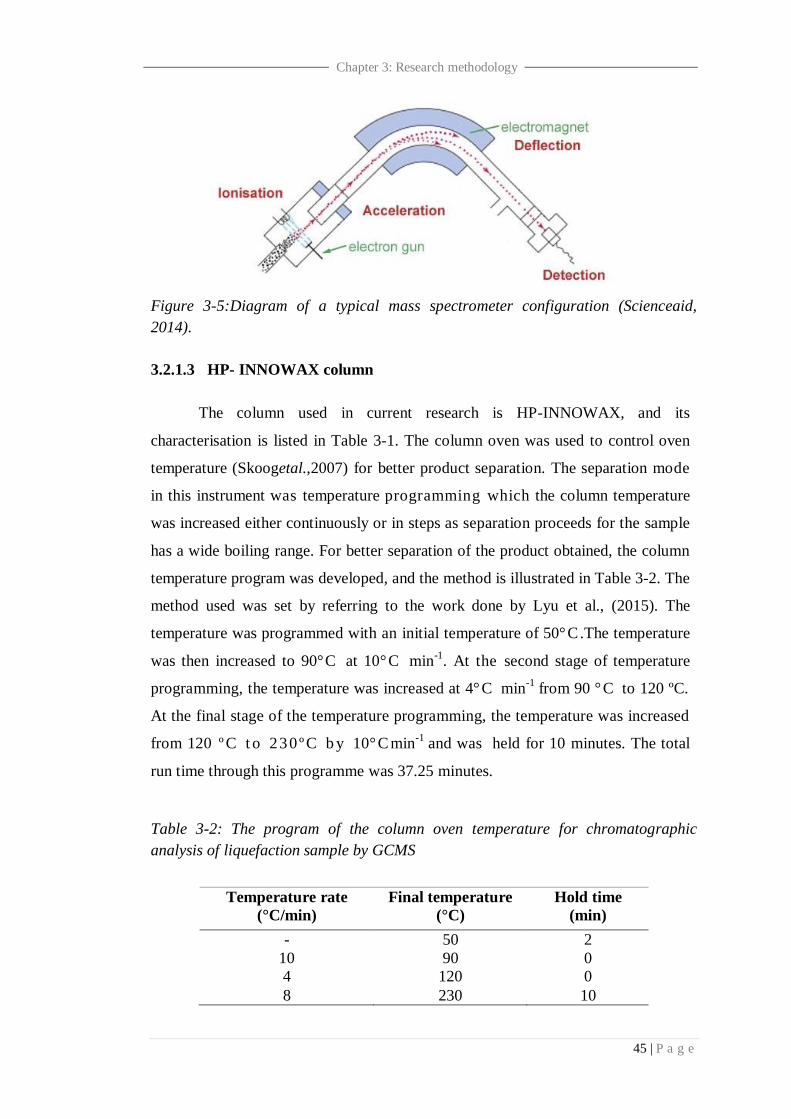
45 | P a g e
Chapter 3: Research methodology
Figure 3-5:Diagram of a typical mass spectrometer configuration (Scienceaid,
2014).
3.2.1.3 HP- INNOWAX column
The column used in current research is HP-INNOWAX, and its
characterisation is listed in Table 3-1. The column oven was used to control oven
temperature (Skoogetal.,2007) for better product separation. The separation mode
in this instrument was temperature programming which the column temperature
was increased either continuously or in steps as separation proceeds for the sample
has a wide boiling range. For better separation of the product obtained, the column
temperature program was developed, and the method is illustrated in Table 3-2. The
method used was set by referring to the work done by Lyu et al., (2015). The
temperature was programmed with an initial temperature of 50°C.The temperature
was then increased to 90°C at 10°C min-1
. At the second stage of temperature
programming, the temperature was increased at 4°C min-1
from 90 °C to 120 ºC.
At the final stage of the temperature programming, the temperature was increased
from 120 º C t o 230 º C b y 10°C min-1
and was held for 10 minutes. The total
run time through this programme was 37.25 minutes.
Table 3-2: The program of the column oven temperature for chromatographic
analysis of liquefaction sample by GCMS
Temperature rate
(°C/min)
Final temperature
(°C)
Hold time
(min)
- 50 2
10 90 0
4 120 0
8 230 10
46 | P a g e
Chapter 3: Research methodology
The amount of sample injected was 0.3 µL and was injected using an
autosampler. The concentration of the product obtained was determined by
re-calibrating the data with the standard calibration.
3.2.2 Product calibration
Calibration standards were prepared to quantitatively determine the
concentration of the compound in the liquid product. GCMS calibration curves were
prepared using the method detailed in Table 3-2. The compounds calibrated were:
guaiacol (≥ 99, Sigma-Aldrich), 4 -ethyl-guaiacol (99%, Sigma-Aldrich), phenol
(>99.5 %, Sigma Aldrich), furfural (99%, Sigma-Aldrich), levulinic acid (99%,
Sigma- Aldrich), 5-HMF (99%, Sigma-Aldrich), glycerol (99%, Sigma-Aldrich),2-
pyrrolidinone (99%, Sigma-Aldrich) and acetic acid (> 99 %, Acros Organics).
Calibration standards with different concentrations were prepared by series of
dilutions of the stock solution. The quantity of compound used for the preparation of
the stock solution was selected based on their solubility in water, and this
concentration solution should be in the concentration range for the target compound.
Details on dilution for the stock solution are presented in Table 3-3. The product
concentration was measured using linear regression as follows:
𝑦 = 𝑚𝑥 + 𝐶
Where;
y = area of reactant or products under the peak curve
m = is the gradient or products calibration curve
x = the products concentration
C= point at which the line crosses the y-axis
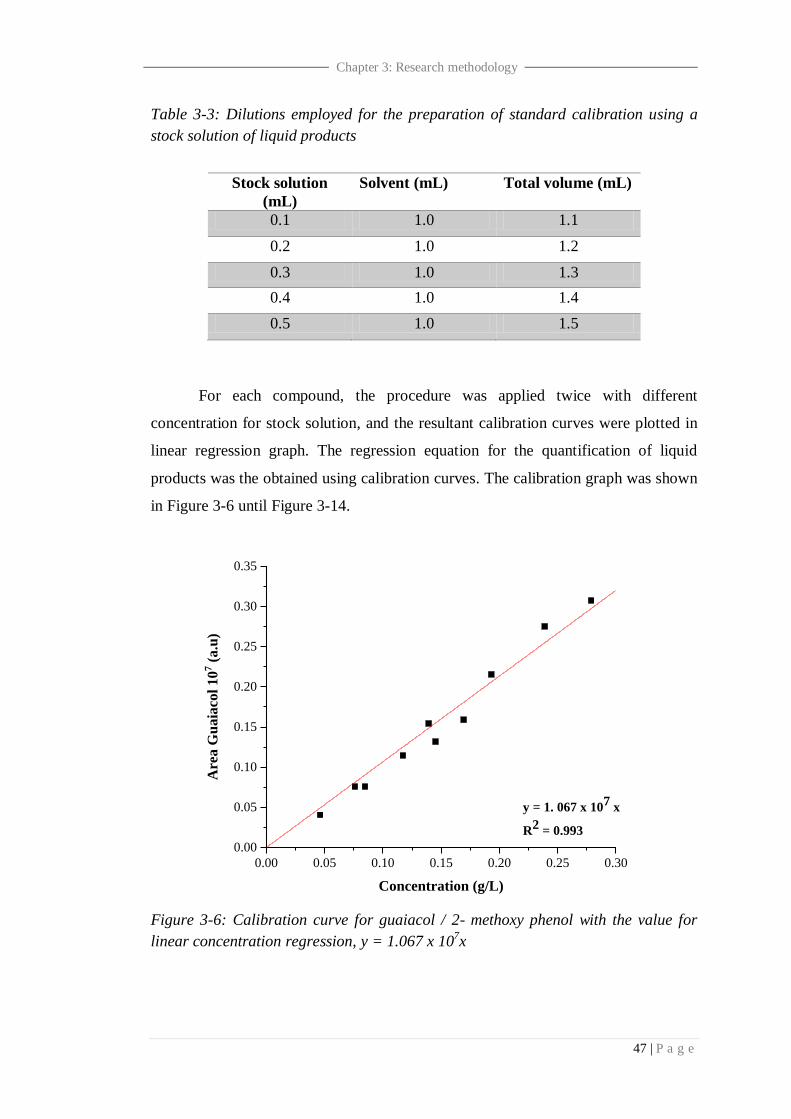
47 | P a g e
Chapter 3: Research methodology
Table 3-3: Dilutions employed for the preparation of standard calibration using a
stock solution of liquid products
Stock solution
(mL)
Solvent (mL) Total volume (mL)
0.1 1.0 1.1
0.2 1.0 1.2
0.3 1.0 1.3
0.4 1.0 1.4
0.5 1.0 1.5
For each compound, the procedure was applied twice with different
concentration for stock solution, and the resultant calibration curves were plotted in
linear regression graph. The regression equation for the quantification of liquid
products was the obtained using calibration curves. The calibration graph was shown
in Figure 3-6 until Figure 3-14.
Figure 3-6: Calibration curve for guaiacol / 2- methoxy phenol with the value for
linear concentration regression, y = 1.067 x 107x
0.00 0.05 0.10 0.15 0.20 0.25 0.30
0.00
0.05
0.10
0.15
0.20
0.25
0.30
0.35
Are
a G
uaia
col
10
7 (
a.u
)
Concentration (g/L)
y = 1. 067 x 107
x
R2
= 0.993

48 | P a g e
Chapter 3: Research methodology
Figure 3-7: Calibration curve for 4 - ethyl- guaiacol / 4 - ethyl-2- methoxy phenol
with value for concentration linear regression, y = 1.271 x 10⁷x
Figure 3-8: Calibration curve for phenol with the value for linear concentration
regression, y = 0.822 x 107x
0.00 0.05 0.10 0.15 0.20 0.25 0.30
0.00
0.05
0.10
0.15
0.20
0.25
0.30
0.35
0.40
Are
a 4
-eth
yl-
gu
aia
col
10
7 (
a.u
)
Concentration (g/L)
y = 1.271 x 10⁷
x
R2
= 0.998
0.0 0.2 0.4 0.6 0.8 1.0 1.2 1.4
0.0
0.2
0.4
0.6
0.8
1.0
1.2
Are
a P
hen
ol
10
7 (a
.u)
Concentration (g/L)
y = 0.822 x 10⁷
x
R2
= 0.997

49 | P a g e
Chapter 3: Research methodology
Figure 3-9: Calibration curve for glycerol with the value for linear concentration
regression, y = 0.511 x 10⁷x
Figure 3-10: Calibration curve for acetic acid with the value for linear
concentration regression, y = 0.420 x107x
0.0 0.5 1.0 1.5 2.0 2.5 3.0
0.0
0.2
0.4
0.6
0.8
1.0
1.2
1.4
1.6
Are
a G
lyce
rol
10
7 (a
.u)
Concentration (g/L)
y = 0.511 x 10⁷ x
R2 = 0.998
0 2 4 6 8 10 12 14 16
0
1
2
3
4
5
6
Are
a A
ceti
c a
cid
10
7 (a
.u)
Concentration (g/L)
y = 0.420 x 10⁷
x
R2
= 0.995
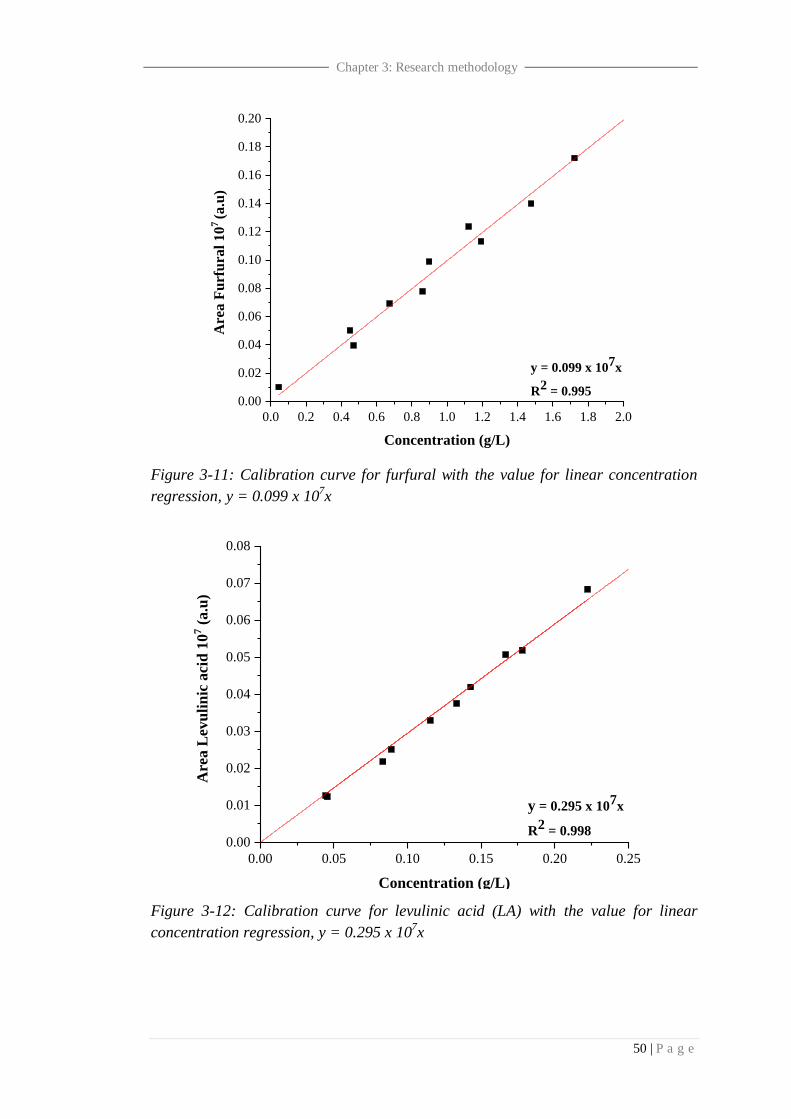
50 | P a g e
Chapter 3: Research methodology
Figure 3-11: Calibration curve for furfural with the value for linear concentration
regression, y = 0.099 x 10⁷x
Figure 3-12: Calibration curve for levulinic acid (LA) with the value for linear
concentration regression, y = 0.295 x 107x
0.0 0.2 0.4 0.6 0.8 1.0 1.2 1.4 1.6 1.8 2.0
0.00
0.02
0.04
0.06
0.08
0.10
0.12
0.14
0.16
0.18
0.20
Are
a F
urf
ura
l 10
7 (a
.u)
Concentration (g/L)
y = 0.099 x 10⁷
x
R2
= 0.995
0.00 0.05 0.10 0.15 0.20 0.25
0.00
0.01
0.02
0.03
0.04
0.05
0.06
0.07
0.08
Are
a L
evu
lin
ic a
cid
10
7 (
a.u
)
Concentration (g/L)
y = 0.295 x 10⁷x
R2 = 0.998
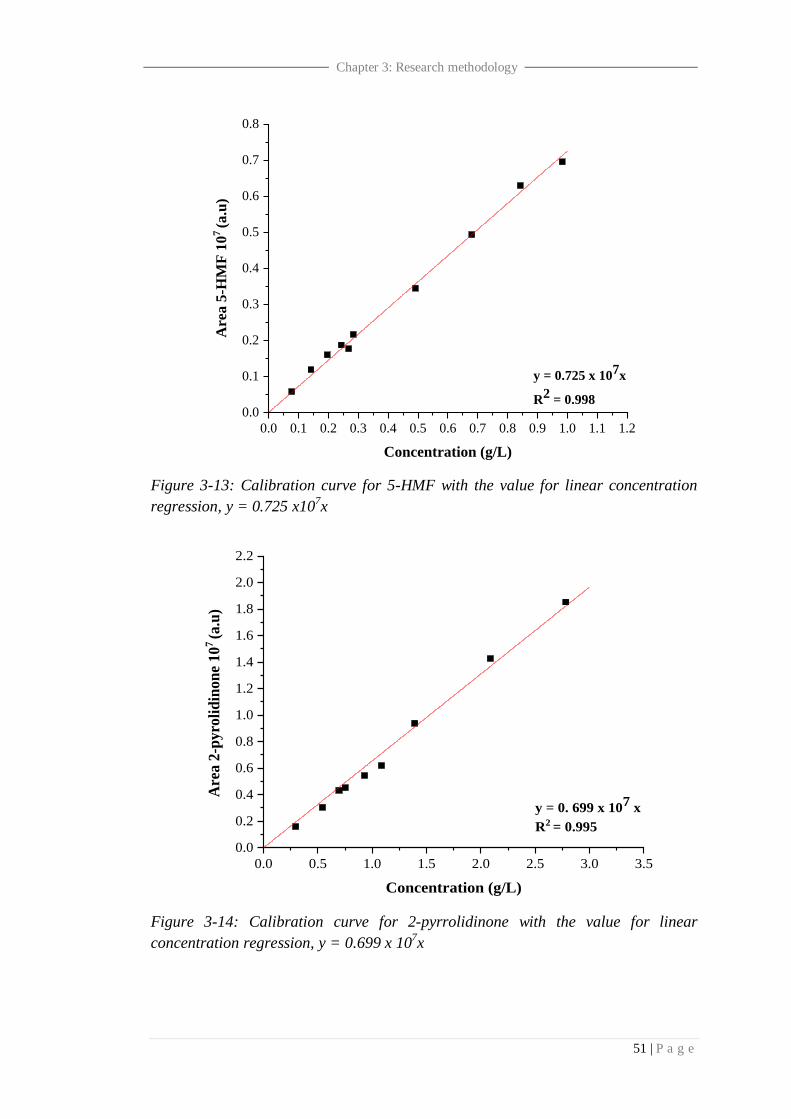
51 | P a g e
Chapter 3: Research methodology
Figure 3-13: Calibration curve for 5-HMF with the value for linear concentration
regression, y = 0.725 x10⁷x
Figure 3-14: Calibration curve for 2-pyrrolidinone with the value for linear
concentration regression, y = 0.699 x 107x
0.0 0.1 0.2 0.3 0.4 0.5 0.6 0.7 0.8 0.9 1.0 1.1 1.2
0.0
0.1
0.2
0.3
0.4
0.5
0.6
0.7
0.8
Are
a 5
-HM
F 1
07
(a.u
)
Concentration (g/L)
y = 0.725 x 10⁷
x
R2
= 0.998
0.0 0.5 1.0 1.5 2.0 2.5 3.0 3.5
0.0
0.2
0.4
0.6
0.8
1.0
1.2
1.4
1.6
1.8
2.0
2.2
Are
a 2
-py
roli
din
on
e 1
07
(a.u
)
Concentration (g/L)
y = 0. 699 x 107 x
R2 = 0.995
52 | P a g e
Chapter 3: Research methodology
3.2.3 Solid residue and definition of conversion
Liquefaction is a thermo-chemical process that converts biomass into a liquid
product, bio-oil (Stöcker, 2008). Thus, the focus on current work is the liquid
obtained resulted from liquefying product of feedstock. However, throughout the
process, there is a solid residue present after the reaction. The remaining solid was
dried at 105 oC in an oven for 24 h to obtain the constant weight. The determination
of residue yield and conversion were defined as the weight percentage of the biomass
input (Nazari et al., 2015) and was calculated as follow:
𝐑𝐞𝐬𝐢𝐝𝐮𝐞 𝐲𝐢𝐞𝐥𝐝 % =weight of residue
weight of the biomass input x 100%
𝐂𝐨𝐧𝐯𝐞𝐫𝐬𝐢𝐨𝐧 (%) = 100 –Residue (%)
3.3 Characterisation techniques
The biomass and liquefaction products were subjected to several
characterisation techniques to study their chemical and physical properties. The data
from these characterisations are useful to understand the relationship between the
properties of biomass and the product in the liquefaction reaction. In this research,
the characterisation techniques used are thermogravimetric analysis-differential
thermal analysis (TGA-DTA), Fourier-transform infrared (FTIR) spectroscopy, C, H
and N elemental analyser (FLASH 2000), X-ray fluorescence (XRF) and bomb
calorimetry. In the current section, brief theoretical principles behind the
characterisation techniques used in current work are explained.
3.3.1 Thermogravimetric analysis- differential thermal analysis (TGA-DTA)
Thermogravimetric analysis is a technique in which the mass of substances
is monitored as a function of temperature or time. Additionally, the sample
specimen is also subjected to a controlled atmosphere during the temperature
programme (Perkin Elmer, 2004). A TGA consists of a micro sample pan that is
supported by a precision balance. The pan is placed inside the furnace and is
heated or cooled during the experiment. The microbalance is connected to the
53 | P a g e
Chapter 3: Research methodology
thermal analysis processing system to get a plot of weight loss versus temperature.
A sample purge gas controls the sample environment. This gas may be inert or a
reactive gas that flows over the sample andexits through an exhaust.
In the present work, TGA-DTA was used to study the thermal properties of
biomass and solid residue obtained after the liquefaction reaction. The TG and DTA
curves for the samples were obtained by TGA 4000 simultaneous thermal analyser
up to 1000 °C. Two thermograms were obtained from this instrument, the TGA
thermogram indicating the weight loss and energy loss and the DTA thermogram
indicating the absorption or evolution of heat. For analysis, the sample in the form
of powder was placed in an alumina covered crucible, while an empty crucible
being the reference. In current work, nitrogen was used as an inert gas, and the air
was set as an active gas. The temperature used was in the range of 30 ºC and 950 ºC,
with constant heating rate and gradually isothermic programme depending on the
research parameter.
3.3.2 ATR-Fourier – Transform Infrared (ATR-FTIR) spectroscopy
Infrared spectroscopy is a technique based on the vibrations of the atoms of a
molecule. An infrared spectrum is commonly obtained by passing infrared radiation
through a sample and determining what fraction of the incident radiation is absorbed
in particular energy. The energy at which any peak in an absorption spectrum
appears corresponds to the frequency of vibration of a part of a sample molecule.
Fourier- transform infrared (FTIR) spectroscopy is based on the idea of the
interference of radiation between two beams to yield an interferogram. The latter is a
signal produced as a function of the change of path length between the two beams.
The two domains of distance and frequency are interconvertible by the mathematical
method of Fourier- transformation. The basic component of the FTIR spectrometer is
shown schematically in Figure 3-15. The radiation emerging from the source is
passed through an interferometer to the sample before reaching a detector. Upon
amplification of the signal, in which high-frequency contributions have been
eliminated by a filter, the data are converted to digital by an analogue-to-digital
converter and transferred to the computer for Fourier- transformation (Stuart, 2004).
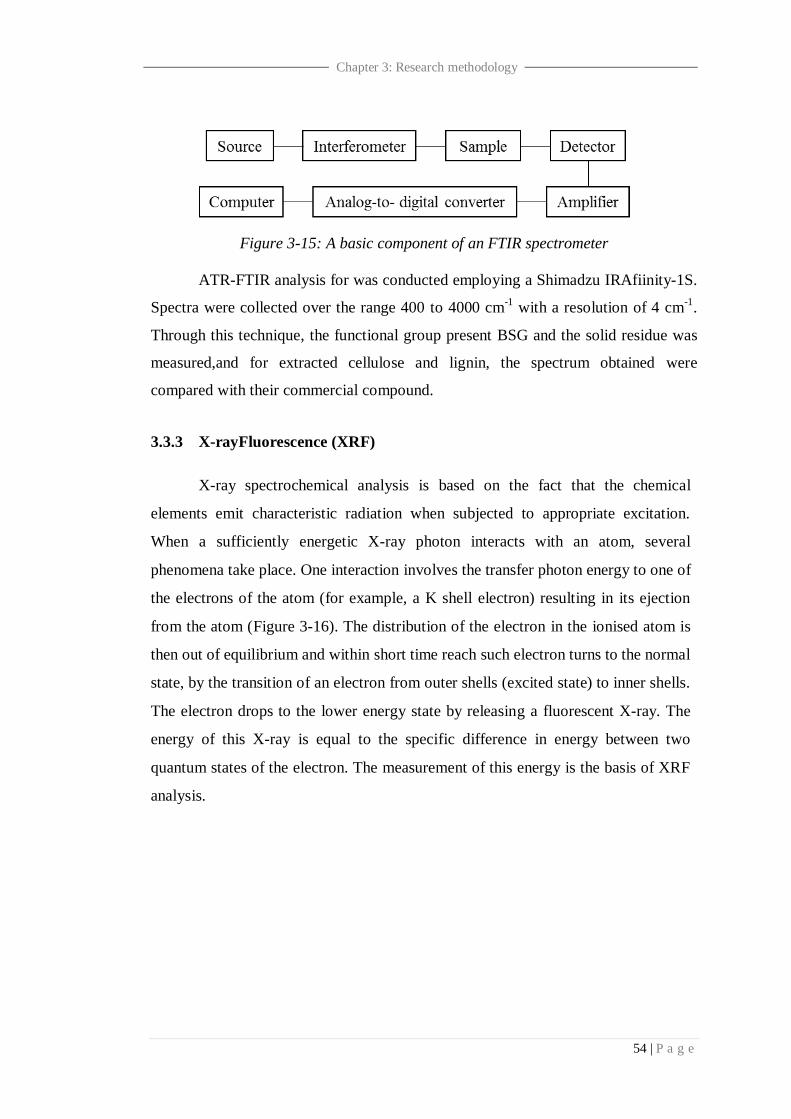
54 | P a g e
Chapter 3: Research methodology
Figure 3-15: A basic component of an FTIR spectrometer
ATR-FTIR analysis for was conducted employing a Shimadzu IRAfiinity-1S.
Spectra were collected over the range 400 to 4000 cm-1
with a resolution of 4 cm-1
.
Through this technique, the functional group present BSG and the solid residue was
measured,and for extracted cellulose and lignin, the spectrum obtained were
compared with their commercial compound.
3.3.3 X-rayFluorescence (XRF)
X-ray spectrochemical analysis is based on the fact that the chemical
elements emit characteristic radiation when subjected to appropriate excitation.
When a sufficiently energetic X-ray photon interacts with an atom, several
phenomena take place. One interaction involves the transfer photon energy to one of
the electrons of the atom (for example, a K shell electron) resulting in its ejection
from the atom (Figure 3-16). The distribution of the electron in the ionised atom is
then out of equilibrium and within short time reach such electron turns to the normal
state, by the transition of an electron from outer shells (excited state) to inner shells.
The electron drops to the lower energy state by releasing a fluorescent X-ray. The
energy of this X-ray is equal to the specific difference in energy between two
quantum states of the electron. The measurement of this energy is the basis of XRF
analysis.
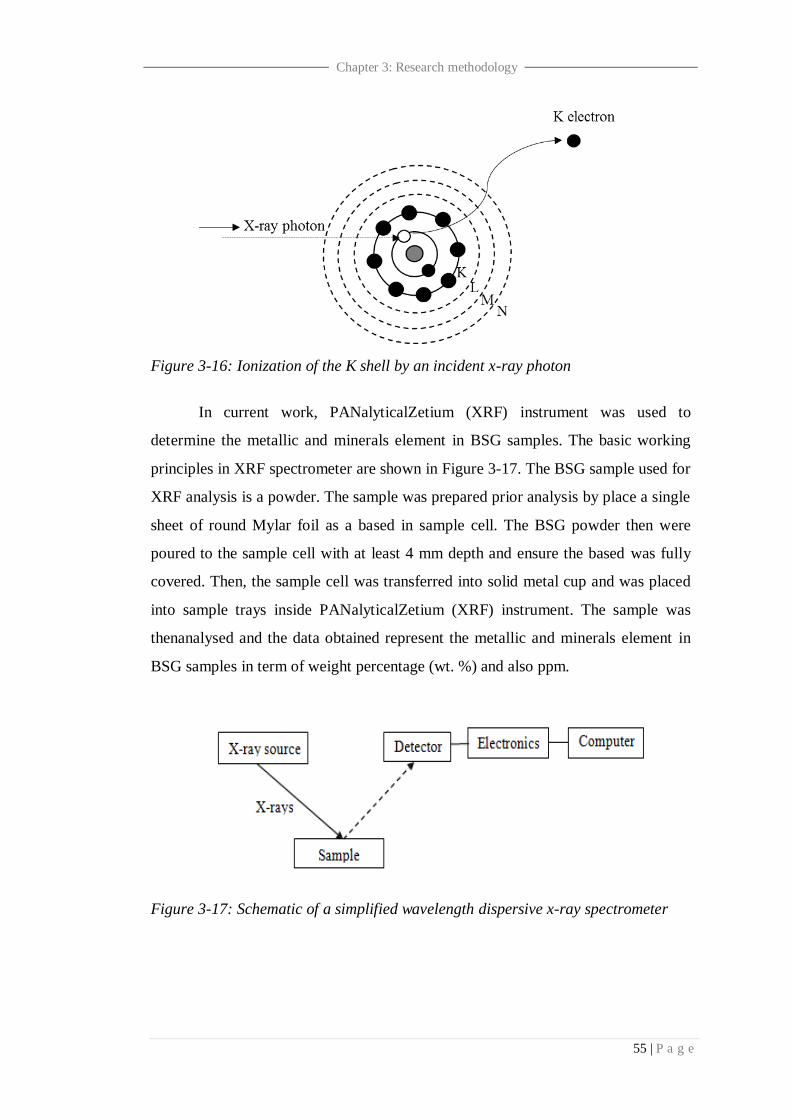
55 | P a g e
Chapter 3: Research methodology
Figure 3-16: Ionization of the K shell by an incident x-ray photon
In current work, PANalyticalZetium (XRF) instrument was used to
determine the metallic and minerals element in BSG samples. The basic working
principles in XRF spectrometer are shown in Figure 3-17. The BSG sample used for
XRF analysis is a powder. The sample was prepared prior analysis by place a single
sheet of round Mylar foil as a based in sample cell. The BSG powder then were
poured to the sample cell with at least 4 mm depth and ensure the based was fully
covered. Then, the sample cell was transferred into solid metal cup and was placed
into sample trays inside PANalyticalZetium (XRF) instrument. The sample was
thenanalysed and the data obtained represent the metallic and minerals element in
BSG samples in term of weight percentage (wt. %) and also ppm.
Figure 3-17: Schematic of a simplified wavelength dispersive x-ray spectrometer
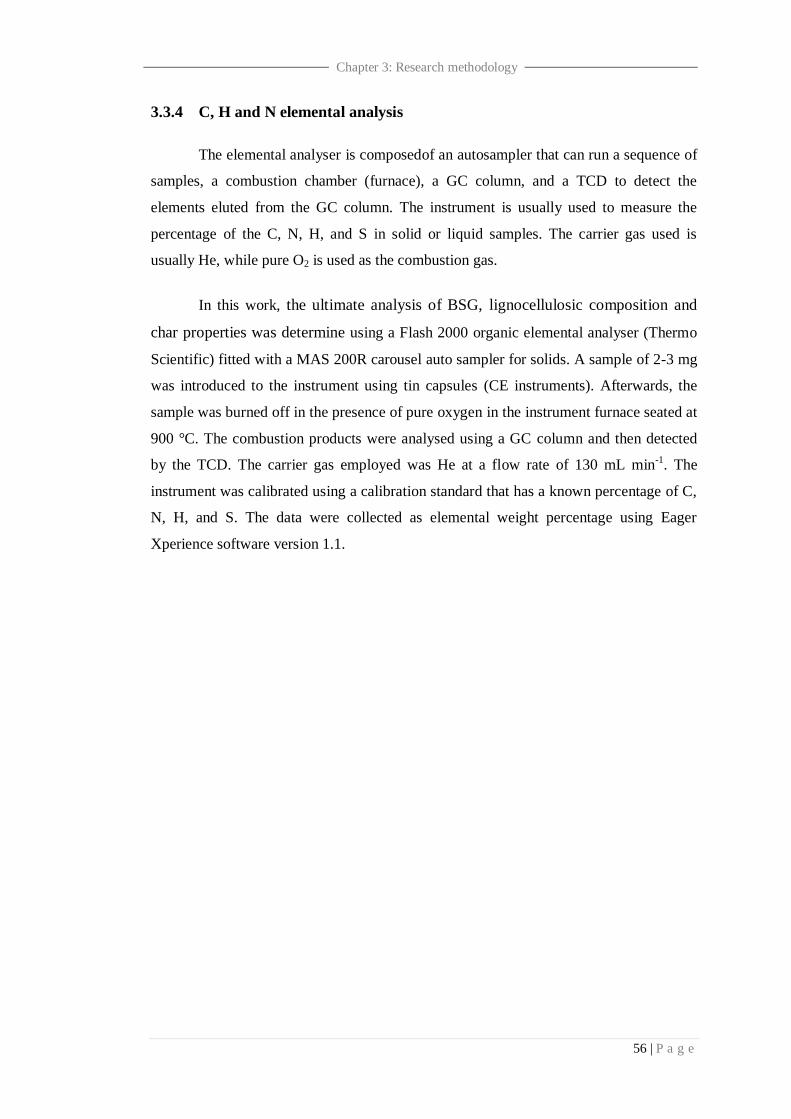
56 | P a g e
Chapter 3: Research methodology
3.3.4 C, H and N elemental analysis
The elemental analyser is composedof an autosampler that can run a sequence of
samples, a combustion chamber (furnace), a GC column, and a TCD to detect the
elements eluted from the GC column. The instrument is usually used to measure the
percentage of the C, N, H, and S in solid or liquid samples. The carrier gas used is
usually He, while pure O2 is used as the combustion gas.
In this work, the ultimate analysis of BSG, lignocellulosic composition and
char properties was determine using a Flash 2000 organic elemental analyser (Thermo
Scientific) fitted with a MAS 200R carousel auto sampler for solids. A sample of 2-3 mg
was introduced to the instrument using tin capsules (CE instruments). Afterwards, the
sample was burned off in the presence of pure oxygen in the instrument furnace seated at
900 °C. The combustion products were analysed using a GC column and then detected
by the TCD. The carrier gas employed was He at a flow rate of 130 mL min-1. The
instrument was calibrated using a calibration standard that has a known percentage of C,
N, H, and S. The data were collected as elemental weight percentage using Eager
Xperience software version 1.1.
CHAPTER 4
A CASE STUDY:
CHARACTERISATION
OF
BREWER’S SPENT
GRAIN (BSG)
58 | P a g e
Chapter 4: Characterisation of BSG
4.Chapter 4: Characterisation of BSG
4.0 Introduction
The identification of physical and chemical characteristics is the most crucial
step in determining the selection of appropriate technologies for biomass utilization
(Vassilev et al., 2010). A complete understanding of both physical and chemical
characteristics of BSG will determine the properties, quality and potential application
of this waste. In this chapter, three types of characterisation methods have been used
on raw BSG. The first stage is the BSG pre-treatment, which involves the
determination of the moisture content and the ball milling process. The second stage
of the BSG characterisation will focus on the chemical characteristic of BSG using
FTIR, proximate and ultimate analysis. The third stage then focuses on the
components of BSG, which are cellulose and lignin. In this final stage, the BSG went
through several degradation processes to break the polymer structure down before
extracting its main components. Ranges of thermal and spectroscopic
characterisation techniques were also employed in this stage and comparisons of the
quality, structure, and nature of the extracted components with their respective
commercial compounds were made.
4.1 Experimental procedures
4.1.1 Materials
The materials used in this work were ethanol (Sigma – Aldrich, ≥ 99%),
sodium acetate anhydrous (Sigma – Aldrich, ≥ 99%), sodium chloride (missing
supplier), acetone (Alfa Aeser, 99.5%), sulphuric acid (Sigma – Aldrich, percentage),
sodium hydroxide (Sigma – Aldrich, 97+%), distilled water (produced in an Elga
reservoir of 75 L), microcrystalline cellulose (Avicel® PH-101, Sigma Aldrich), and
kraft lignin (Low sulfonate content lignin, Sigma Aldrich).
59 | P a g e
Chapter 4: Characterisation of BSG
4.1.2 Stage one- BSG pre-treatment
In the current work, BSG underwent two stages of pre-treatment; drying and
ball milling. Dry BSG was obtained in the first stage of pre-treatment and in the
second stage, BSG power was obtained.
The procedure used to determine the moisture content of the raw BSG was
adopted from Samuelsson, Burvall, and Jirjis (2006)and British Standard BS EN
14774-3:2009 (Asad S N Mahmood et al., 2013) and involved using oven drying in
air. The experiments used samples of the material as received and measured to 0.1 g
accuracy. For this analysis, approximately 5 g of raw BSG were measured and placed
into the evaporator glassware with the oven temperature set at 105 ºC. Four replicates
of raw BSG samples were prepared for each batch of the drying process. BSG was
dried to a constant weight, which was accomplished within 24 h drying time. The
weight difference between the raw BSG and the dry BSG was calculated and gave
the moisture content of the samples.
Prior to chemical analysis (FTIR, proximate and ultimate analysis), the raw
BSG was subjected into two stages of pre-treatment, which were drying and milling.
The drying process must be conducted before the milling process. Bargakat, de Vries
and Rouau (2013) investigated the effect of the moisture content on the milling
process. They concluded that a lower moisture content produced finer particles of the
biomass, which results in a more accurate analysis of the data. Furthermore, the
grinding energy also decreased significantly as the moisture content was reduced.
The milling process was conducted using a Retsch PM100 planetary ball mill.
The grinding bowl and the supporting disc of the planetary ball mill rotated in
opposite directions which produced corresponding centrifugal forces. As a result of
this, a friction effect was produced by the movement of the milling balls down the
inside wall of the bowl (Suryanarayana, 2001).
Figure 4-1 shows a schematic depicting the ball motion inside the ball mill.
As a consequence of the friction, the material was milled into a coarser powder. With
continuous cycles of the milling process, finer or nanoscale powder was produced.
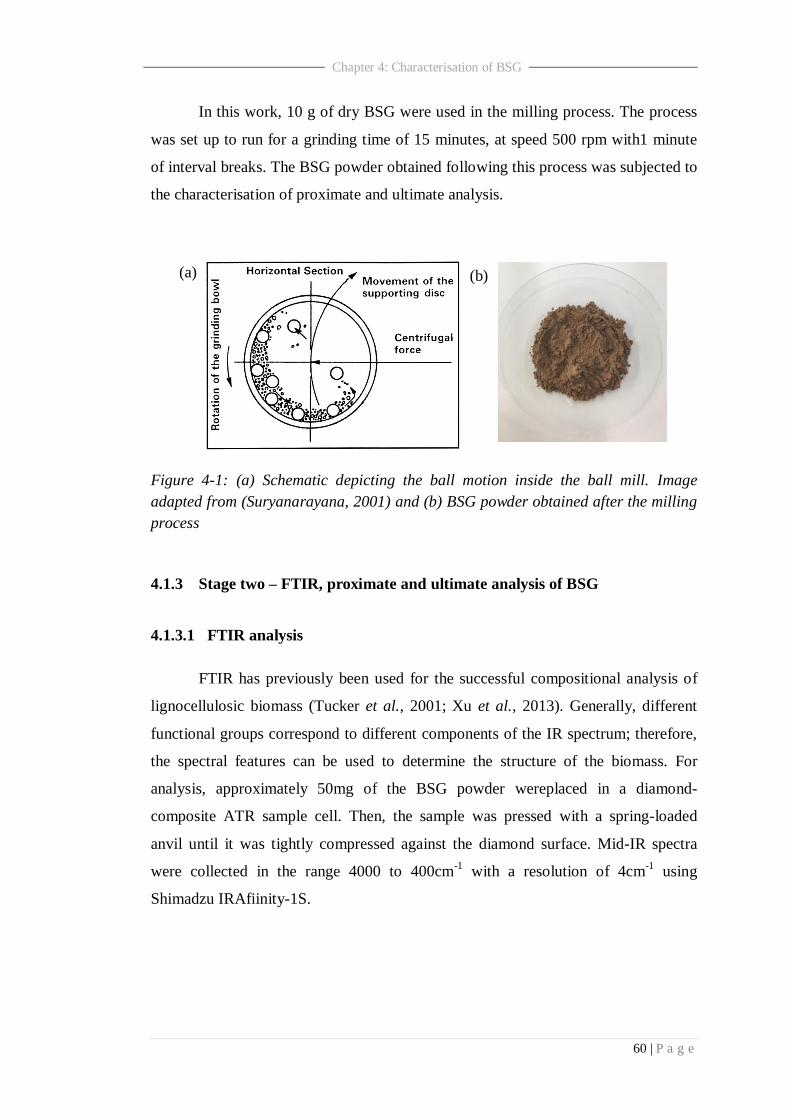
60 | P a g e
Chapter 4: Characterisation of BSG
In this work, 10 g of dry BSG were used in the milling process. The process
was set up to run for a grinding time of 15 minutes, at speed 500 rpm with1 minute
of interval breaks. The BSG powder obtained following this process was subjected to
the characterisation of proximate and ultimate analysis.
Figure 4-1: (a) Schematic depicting the ball motion inside the ball mill. Image
adapted from (Suryanarayana, 2001) and (b) BSG powder obtained after the milling
process
4.1.3 Stage two – FTIR, proximate and ultimate analysis of BSG
4.1.3.1 FTIR analysis
FTIR has previously been used for the successful compositional analysis of
lignocellulosic biomass (Tucker et al., 2001; Xu et al., 2013). Generally, different
functional groups correspond to different components of the IR spectrum; therefore,
the spectral features can be used to determine the structure of the biomass. For
analysis, approximately 50mg of the BSG powder wereplaced in a diamond-
composite ATR sample cell. Then, the sample was pressed with a spring-loaded
anvil until it was tightly compressed against the diamond surface. Mid-IR spectra
were collected in the range 4000 to 400cm-1
with a resolution of 4cm-1
using
Shimadzu IRAfiinity-1S.
(a) (b)
61 | P a g e
Chapter 4: Characterisation of BSG
4.1.3.2 Proximate analysis method
The proximate analysis conducted was adapted from the work presented by
Garcia et al., (2013) and Carrier, Loppinet-Serani and Denux, (2011). They both
applied thermal analysis as a proximate analysis method and have successfully
proved that TGA can be applied to determine biomass composition. Thermal analysis
can be defined as methods that measure the property of substances when subjected to
a controlled temperature. In this work, thermal decomposition of BSG was applied
and predominantly focused on the moisture, volatile matter, fixed carbon and ash
content. Data obtained was used to calculate several parameters using the equations
indicated in Table 4-1 (Anukam et al., 2017).
Table 4-1: Equation parameters used for proximate analysis determination from the
TGA curve of BSG.
Parameter Equation
Moisture content 𝑰𝒏𝒊𝒕𝒊𝒂𝒍 𝑴𝒂𝒔𝒔 − 𝑫𝒓𝒚 𝑴𝒂𝒔𝒔
𝑰𝒏𝒊𝒕𝒊𝒂𝒍 𝑴𝒂𝒔𝒔 𝐱 𝟏𝟎𝟎
Volatile matter content 𝑽𝒐𝒍𝒂𝒕𝒊𝒍𝒆 𝑴𝒂𝒔𝒔
𝑰𝒏𝒊𝒕𝒊𝒂𝒍 𝑴𝒂𝒔𝒔 𝐱 𝟏𝟎𝟎
Fixed carbon
[ 𝑭𝒊𝒙𝒆𝒅 𝒄𝒂𝒓𝒃𝒐𝒏 𝒎𝒂𝒔𝒔]
𝑰𝒏𝒊𝒕𝒊𝒂𝒍 𝑴𝒂𝒔𝒔 𝒙 𝟏𝟎𝟎
Ash
[ 𝑨𝒔𝒉 𝒎𝒂𝒔𝒔]
𝑰𝒏𝒊𝒕𝒊𝒂𝒍 𝑴𝒂𝒔𝒔 𝒙 𝟏𝟎𝟎
For this analysis, 20-25 mg of BSG powder were measured and analysed
using the TGA instrument analyser; the PerkinElmer TGA4000. The initial
parameters used for this analysis were a flow rate of 20.0 ml/min of nitrogen and
40.0 ml/min of oxygen heating of 30 to 50 ºC/min, with the temperature been held
for several stages until the temperature reached 950 ºC.
62 | P a g e
Chapter 4: Characterisation of BSG
The moisture content was determined by the weight loss at a temperature
close to 100 ºC to 110 ºC, while the volatiles content was indicated by the mass
evolved between a temperature of 110 ºC to700 ºC (Saldarriaga et al., 2015). At a
temperature of 900 ºC, the gas flow was switched from nitrogen to oxygen to allow
the full combustion of carbon-containing species (COx, CxHy and tars) and char
oxidation (Garcia et al., 2013), which leads to the determination of the fixed carbon
content.
In some other works, the fixed carbon content was determined by the
differences between moisture, volatiles and ash (Tanger et al., 2013). However, the
effect of ash on the fixed carbon content produces a possible limitation in
determining a stable fraction. This is due to the decreasing measured weight of ash
leading to inflated values for the fixed carbon determined via subtraction. (Crombie
et al., 2013). Due to this fact, the fixed carbon content in this work was determined
based on mass loss through the combustion process. Finally, after heating the sample
to approximately 950 ºC, the remaining mass in the crucible was considered to be
only ash and represented the same value as indicated by the differences of moisture,
volatiles and fixed carbon. In conclusion, the ash content represents the inorganic
part of the biomass left after complete combustion (Garcia, 2012).
4.1.3.3 Ultimate analysis method
BSG was subjected to elemental analysis using two methods; firstly, the C,H,
N and S components of BSG were measured using FLASH 2000,and secondly, the
metallic and mineral components were determined using XRF. FLASH 2000
measured the nuclear properties of BSG through mass spectroscopy. The XRF used
the electronic properties of the components as basis for the analysis. By combining
both methods, all the individual elements present in the BSG were identified apart
from oxygen.
In most cases, the amount of oxygen was determined by subtracting the sum
of the amount of C,H,N, and S from 100% (Nanda et al., 2013; Mussatto, 2014;
Anukam et al., 2017), but there are some disagreements to this approach, mostly
coming from different opinions on whether or not to include the percentage of ash.
The analysis of C, H, N, S was done through complete combustion in an active
63 | P a g e
Chapter 4: Characterisation of BSG
atmosphere and the sample was reduced to a group of gases such as CO2,H2O, N2
and SO2, which permitted the simultaneous determination of carbon, hydrogen,
nitrogen, and sulphur in the organic material (García et al., 2012). This mode of
analysis did not detect the presence of ash which is generally indicated by inorganic
material. Many authors included the ash when calculating the oxygen value which
can be obtained from the proximate analysis (Gai et al., 2015; Jazrawi et al., 2015;
Nazari et al., 2015). In this work, the oxygen percentage in BSG was determined by
considering the ash and was calculated by the difference between 100 and the sum of
C, H, N and ash, assuming negligible sulphur content. The equation used is as
follows:
𝑂 = 100 − (𝐶 + 𝐻 +N + ash) Equation 4-1
4.1.4 Stage three-Determination of BSG composition
4.1.4.1 Soxhlet extraction procedure
The extractive content of BSG was determined in accordance with Tappi 204
cm- 97 (Technical Association of Pulp and Paper Industry, 1997)by using Soxhlet
extraction. Firstly, 5 g of dry BSG was measured and was put in to the extraction
thimble before been placed inside a Soxhlet glass filter. 150 mL of ethanol was used
as a solvent and was placed in the receiving flask on the Soxhlet apparatus. The
Soxhlet apparatus was assembled with a condenser to avoid any evaporation of the
solvent. The reflux temperature was set at 78-80ºC (boiling point of ethanol) for 12 h
in order to optimize the removal of the extraction content of BSG. When the reflux
time was reached, the heating plate was turned off, and the apparatus was cooled to
room temperature. After 30 minutes, the thimble was removed from the Soxhlet glass
filter, and the BSG was placed into the evaporator glassware before being dried in
the oven at a temperature of 105 ºC for 3 h. The extractive content was calculated by
the mass loss of the dry BSG sample before and after the extraction process. The
BSG obtained after this process was called extractives-free BSG (EF - BSG) and was
used for determination of the BSG composition.
64 | P a g e
Chapter 4: Characterisation of BSG
4.1.4.2 Cellulose extraction procedure
The hemicellulose and cellulose composition of BSG was extracted from EF-
BSG using two stages, as adapted from Carrier, Loppinet-Serani, and Denux (2011).
The first stage was to obtain the holocellulose from EF-BSG in which the ideal
holocellulose should only contain cellulose and hemicellulose. The second step was
to hydrolyse and degrade the hemicellulose from holocellulose and therefore, the
solid that remained should represent the cellulose content of BSG.
The first stage in obtaining holocellulose was to add 4 g of EF- BSG to
160 mL of sodium acetate solution (1 M), and heat the mixture at the temperature of
75 ºC for 6 h using a hot plate. After 3 h of heating, 4 mL of sodium chloride (1M)
was added, and the heating was continued for another 3 h. The use of this solution
was to allow the degradation of lignin present in EF- BSG, which then led to the
remaining solid being lignin free BSG (Rodríguez-Gutiérrez et al., 2014). After that,
the mixture was cooled down and filtered using vacuum filtration. 500 mL of
distilled water was used to wash the solid residue obtained and the solid residue was
then placed into evaporator glassware. The solid was dried in the oven at the
temperature of 105 ºC for 24 h; the weight of the solid residue obtained after the
drying process represented the holocellulose content.
The second stage involved the extraction of the cellulose from the
holocellulose and was conducted following the procedures as suggested by Carrier,
Loppinet-Serani, and Denux (2011). By definition, the cellulose obtained in this
work was the α-cellulose in which the residue of holocellulose insoluble in
17.5 wt.% NaOH solution. Firstly, the holocellulose obtained from the first
extraction was added to 100 mL of NaOH with a concentration of 17.5 wt. %. Then,
the mixture was stirred at 200 rpm for 30 minutes at room temperature. After the
contact period ends, the solid residue was filtered and washed with 400 mL of
distilled water. The residue was then put in to the beaker and then15 mL of 10 wt. %
acetic acid solution was added to optimize the holocellulose hydrolysis. Finally, the
solid residue was filtered and washed with 500 mL of hot water and was dried at
105 ºC for 24 h. The dry solid residue represented the cellulose content of BSG. The
hemicellulose content was determined gravimetrically by the weight difference

65 | P a g e
Chapter 4: Characterisation of BSG
between the holocellulose and the cellulose obtained. Throughout the process, the
hemicelluloses were more readily hydrolysed compared with the cellulose because of
its branched and amorphous nature.
4.1.4.3 Lignin extraction procedure
The lignin content of the current BSG samples was determined in accordance
with Tappi T222 om-88 (Tappi, 2011) and the extracted lignin is known as ―Klason
lignin". This method was used with the objective of retrieving the acid-insoluble
lignin contained in the biomass (Chimica and Uni, 2010).
The first step in extracting the lignin involves mixing 1 g of EF- BSG with
15 mL of 72 wt. % H2SO4. The mixture was stirred at 200 rpm for 2 h at room
temperature. This step was to hydrolyse and solubilise the carbohydrate content of
the BSG (Carrier, Loppinet-Serani and Denux, 2011). After 2 h, 560 mL of distilled
water was added to the mixture, and this reduced the H2SO4 to 3 wt. %. The diluted
sample was further boiled at the temperature of 100 ºC for the next 4 h. The mixture
was then separated using vacuum filtration, and the lignin which was the solid
residue was washed using distilled water until it reached a neutral pH. Finally, the
solid was placed into the evaporator glassware and dried in the oven at the
temperature of 105 ºC for 24 h. The solid residue obtained following this process
represented the lignin content of the BSG.
4.2 Results and discussions
4.2.1 The moisture content of raw BSG
BSG used in this work was a wet residue type, which was obtained after
separation from the wort during the lautering stage (Poerschmann et al., 2014). This
insoluble waste was composed of a husk-pericarp barley grain together with minor
fragments of endosperm (Mussatto et al., 2010). The grains were dark brown in color
and wet (El‐Shafey et al., 2004), which may have resulted from the leftover wort that
remained in the grain during the filtration stage. The shape of the spent grain was
non-uniform and ripped which may have been due to the grinding process of the malt
prior to mashing (Mussatto, 2014). The spent grain was also sticky and clammy

66 | P a g e
Chapter 4: Characterisation of BSG
which may have been caused by the incomplete conversion of starch into maltose
during the mashing process (Iserentant, 1995). Figure 4-2 shows the BSG used in this
research. It was used in the experimental work without any pre- treatment or
modification, except those mentioned in the previous sections.
Figure 4-2: Photo of the wet residue type of raw BSG used in this study.
It is known that raw BSG has high moisture content; therefore it is essential
to measure the exact amount of moisture present in this waste. The determination of
the moisture content in raw BSG will reveal the amount of water associated with this
waste. This step is also useful to calculate the solid content/ conversion on one
consistent basis (i.e., dry weight basis).
Figure 4-3: Weight percentage (wt. %) of moisture content in raw BSG used in
current experimental work.
Batch 1 Batch 2 Batch 3
0
10
20
30
40
50
60
70
80
90
100
Mois
ture
con
ten
t (w
t.%
)

67 | P a g e
Chapter 4: Characterisation of BSG
As shown in Figure 4-3, the mean value for the moisture content of the BSG is
74.7wt. % with the relative standard deviation of 3.2 %.Based on these results, the
moisture content represents about three quarters of the raw BSG weight, which is in
agreement with the findings reported by other researchers studying wet BSG.
Mussatto, Dragone and Roberto (2006) stated that wet BSG from a lauter tun
contained about 77-81% (w/w) of moisture. Moreover, Fărcaş et al., (2014) also
wrote that wet spent grain contained about 70 to 80% water content. El‐Shafey et al.,
(2004) claimed that wet BSG was a perishable product (difficult to preserve under
environmental conditions) due to its high moisture content (75–80%). Due to the fact
that raw BSG contains high moisture and sugar, the BSG easily deteriorates through
microbial activity leading to difficulties in storing, transporting and handling
(El‐Shafey et al., 2004; Weger et al., 2014). This highlights the importance of
finding a way to make the most out of this waste by maximising the use of their high
moisture content.
4.2.2 Characterisation of BSG
Another critical factor that needs to be considered when utilising this waste is
its chemical characteristics; the selection of the biomass conversion technology
depends on the nature and composition of the biomass (Kumar, Olajire Oyedun and
Kumar, 2018). Section 4.1.3.1.2.2 will focus on the chemical characterisation of
BSG based on the FTIR spectroscopy and the proximate and ultimate data.
4.2.2.1 FTIR spectra of BSG
ATR- FTIR spectroscopy was employed in this study to obtain information
regarding the type of functional group and polymer present in the solid waste. The IR
spectrum of the BSG is as shown in Figure 4-4 with the value for each significant
peak was labelled.

68 | P a g e
Chapter 4: Characterisation of BSG
Figure 4-4: FTIR spectra of BSG used in this experimental study and their respective
wavenumber.
From the figure, it is shown that the most prominent peak is around 1036 cm-1
which may be due to C-O, C=C and C-C-O deformation or stretching vibrations of
the different polymers in the BSG. This is a common feature for lignocellulosic
biomass but most notably in the spectra for cellulose (Fan, Dai and Huang, 2012).
The peaks which appear in the region between 1300 cm-1
and 1636 cm-1
mainly
represent the lignin polymer band which originate from C-H bending and aromatic
C-C stretching (Nanda et al., 2013). The stretching of the carbonyl group at 1730 cm-
1in the spectrum represents the ketone, aldehyde or carboxylic acid, mainly from
hemicelluloses (Sills and Gossett, 2012). There is a strong broad band which appears
around 3331 cm−1
, which is attributed to different O–H stretching modes. According
to Nanda et al., (2013) the intramolecular hydrogen bond in a phenolic group in
lignin is observed at around 3568–3577 cm−1
. While, for cellulose, the
intramolecular hydrogen bond vibration appears at around 3432 cm−1
or at 3342 cm−1
.
Based on these observations, it can be deduced that the BSG spectrum shows typical
peak of lignocellulosic materials which are cellulose, hemicellulose and lignin.
Details of each peak and their associated polymer present in the BSG are summarised
in Table 4-2.
4000 3600 3200 2800 2400 2000 1600 1200 800 400
50
60
70
80
90
100
Tra
nsm
itta
nce
(%
)
Wavelength (cm-1)
3331
2930 2847
1381
1159
1036
899
669
1516
1730
1636

69 | P a g e
Chapter 4: Characterisation of BSG
Table 4-2: FTIR absorbance band and polymer present in BSG according to the
literature (M.Schwanninnger, 2004)a, (Kubo and Kadla, 2005)
b and (Sills and
Gossett, 2012)c
Wavenumber (cm-1
) Functional group/ Band
assignment
Polymer present in
biomass
669 C-H out of a plane Cellulosea
899 COC, CCO and CCH
deformation and stretching
Cellulosea
1036 C-O, C=C and C-C-O
stretching
Cellulosea,
hemicelluloseclignin
b
1159 C-O-C asymmetrical
stretching
Cellulosea, hemicellulose
c
1381 C-H bending Cellulosea,
hemicelluloseclignin
b
1516 Aromatic C-C ring stretching Ligninb
1636 Aromatic C-C ring stretching Ligninb
1730 Ketone/aldehyde C=O stretch Hemicellulosec
2847 Tertiary CH group Ligninb
2930 C-H stretching Cellulosea, lignin
b
3331 OH- stretching Cellulosea, lignin
b
4.2.2.2 Proximate and ultimate analysis of BSG
The proximate analysis determined by TGA methods separates the biomass
into four categories. These are namely; moisture, volatile matter, fixed carbon and
ash based on their weight loss (Tanger et al., 2013). Figure 4-5 shows the TG and
DTG curves with three significant slopes representing the pyrolytic degradation and
decomposition behavior of the BSG used in this study. Similar curves were also
found in other biomass that were subjected to TGA analysis (Nanda et al., 2013;
Anukam et al., 2017); the initial weight loss was due to their moisture content while
the final weight loss was due to the volatile matter caused by the degradation of the
fibrous material in the biomass.
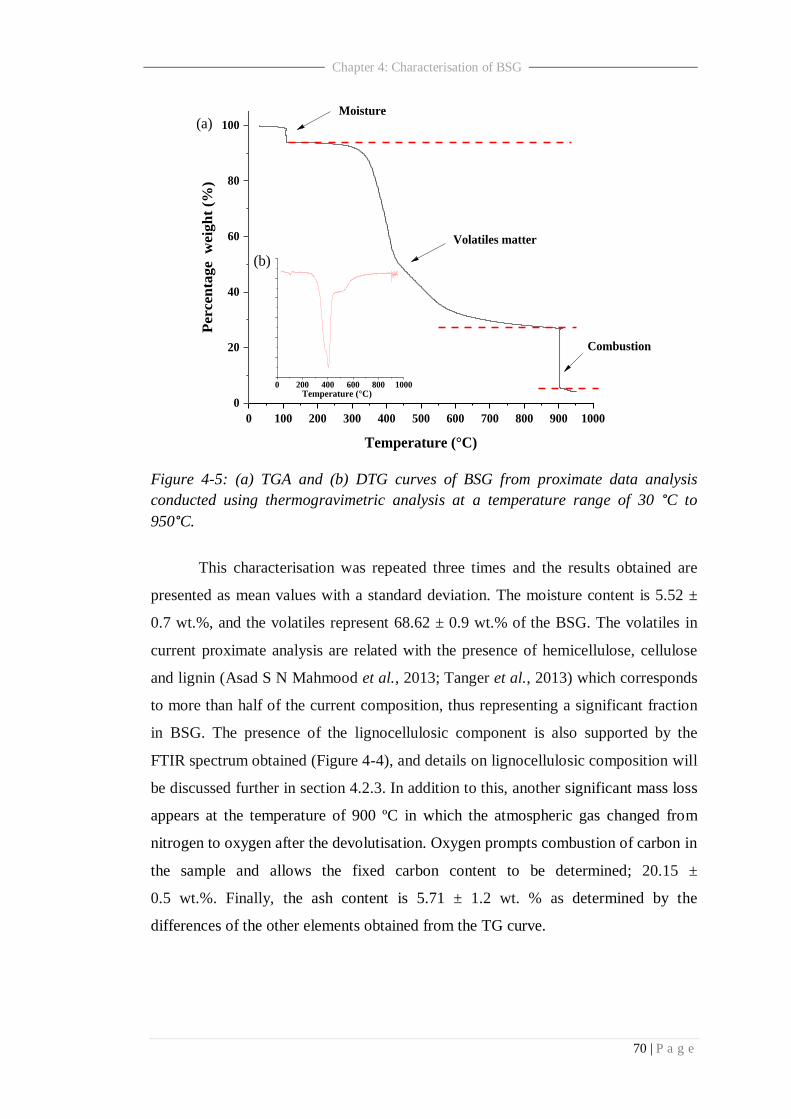
70 | P a g e
Chapter 4: Characterisation of BSG
Figure 4-5: (a) TGA and (b) DTG curves of BSG from proximate data analysis
conducted using thermogravimetric analysis at a temperature range of 30 °C to
950°C.
This characterisation was repeated three times and the results obtained are
presented as mean values with a standard deviation. The moisture content is 5.52 ±
0.7 wt.%, and the volatiles represent 68.62 ± 0.9 wt.% of the BSG. The volatiles in
current proximate analysis are related with the presence of hemicellulose, cellulose
and lignin (Asad S N Mahmood et al., 2013; Tanger et al., 2013) which corresponds
to more than half of the current composition, thus representing a significant fraction
in BSG. The presence of the lignocellulosic component is also supported by the
FTIR spectrum obtained (Figure 4-4), and details on lignocellulosic composition will
be discussed further in section 4.2.3. In addition to this, another significant mass loss
appears at the temperature of 900 ºC in which the atmospheric gas changed from
nitrogen to oxygen after the devolutisation. Oxygen prompts combustion of carbon in
the sample and allows the fixed carbon content to be determined; 20.15 ±
0.5 wt.%. Finally, the ash content is 5.71 ± 1.2 wt. % as determined by the
differences of the other elements obtained from the TG curve.
0 100 200 300 400 500 600 700 800 900 1000
0
20
40
60
80
100
Temperature (°C)
Percen
tage w
eig
ht
(%)
Moisture
Volatiles matter
Combustion
(b)
0 200 400 600 800 1000Temperature (°C)
(a)
71 | P a g e
Chapter 4: Characterisation of BSG
According to Garcia et al., (2013), as the future of biomass energy conversion
appears to be optimistic, the proximate analysis is one of the most reliable
characterisation methods to predict the behaviour of a biomass as a fuel. The
following values are essential; moisture, volatile matter and fixed carbon content, as
they affect both the combustion behaviour as well as the plant design. For example,
high moisture values decrease the combustion yield, while high volatile matter/fixed
carbon ratios are related to the fuel‘s reactivity. On the other hand, the ash content
affects the combustion rate and influences corrosion and slag formation (Y.D Singh
2017).
Biomass feedstock is also described in terms of ultimate analysis based on its
relative content of individual elements. This individual profile is a unique
fundamental code that characterise and determines the properties, quality, potential
applications and the environmental problems related to any fuel (Vassilev et al.,
2010). For example, C, H and O elements are related to the components of the cell
wall (Tanger et al., 2013), and these affect the fuel efficiency. The correlation
between (H/C) and (O/C) element ratios has been simplified by the Van Krevelen
diagram (McKendry, 2002b) as shown in Figure 7-10. According to the diagram, the
lower the ratio, the higher the energy content of the biomass. A material with a
relatively low O/C ratio has a greater energy density and higher HHV due to there
being more chemical energy in C-C bonds than in C-O bonds (Y.D Singh 2017).
Meanwhile, the presence of minerals and elemental ions in the biomass are
related to the ash content. Mussatto (2014) found that due to a higher mineral content
in the BSG from Brazilian barley malt, the mass of ash was four times higher
compared to BSG from Irish barley malt. The chemical composition of the ash can
bring significant operational problems. Apart from lowering the heating value of the
biomass and changing the distribution of the products, mineral and elemental ions
will interfere with the operation of thermo-chemical equipment. This is especially
true for combustion processes, where the ash can react to form a `slag'; a liquid phase
formed at elevated temperatures, which can then reduce plant throughput and result
in increased operation costs (McKendry, 2002a). Table 4-3 summarises the chemical
composition of the BSG used in this work based on the individual elements studied.
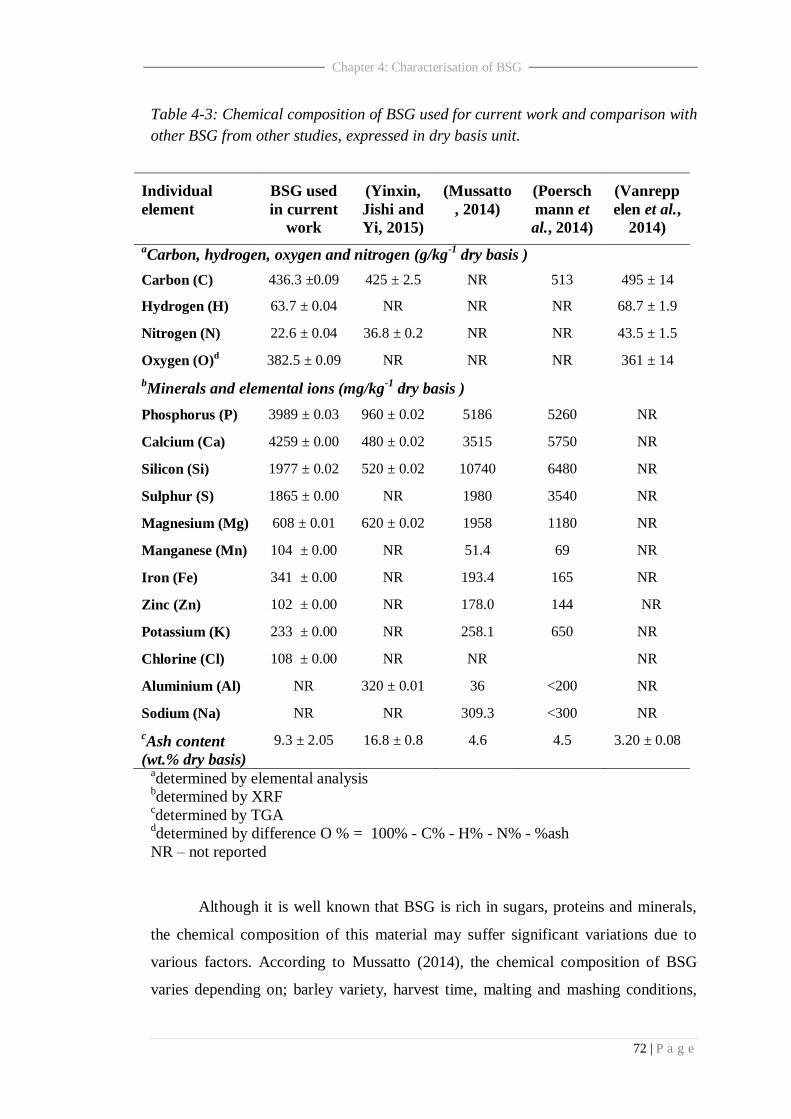
72 | P a g e
Chapter 4: Characterisation of BSG
Table 4-3: Chemical composition of BSG used for current work and comparison with
other BSG from other studies, expressed in dry basis unit.
Individual
element
BSG used
in current
work
(Yinxin,
Jishi and
Yi, 2015)
(Mussatto
, 2014)
(Poersch
mann et
al., 2014)
(Vanrepp
elen et al.,
2014)
aCarbon, hydrogen, oxygen and nitrogen (g/kg
-1 dry basis )
Carbon (C) 436.3 ±0.09 425 ± 2.5 NR 513 495 ± 14
Hydrogen (H) 63.7 ± 0.04 NR NR NR 68.7 ± 1.9
Nitrogen (N) 22.6 ± 0.04 36.8 ± 0.2 NR NR 43.5 ± 1.5
Oxygen (O)d 382.5 ± 0.09 NR NR NR 361 ± 14
bMinerals and elemental ions (mg/kg
-1 dry basis )
Phosphorus (P) 3989 ± 0.03 960 ± 0.02 5186 5260 NR
Calcium (Ca) 4259 ± 0.00 480 ± 0.02 3515 5750 NR
Silicon (Si) 1977 ± 0.02 520 ± 0.02 10740 6480 NR
Sulphur (S) 1865 ± 0.00 NR 1980 3540 NR
Magnesium (Mg) 608 ± 0.01 620 ± 0.02 1958 1180 NR
Manganese (Mn) 104 ± 0.00 NR 51.4 69 NR
Iron (Fe) 341 ± 0.00 NR 193.4 165 NR
Zinc (Zn) 102 ± 0.00 NR 178.0 144 NR
Potassium (K) 233 ± 0.00 NR 258.1 650 NR
Chlorine (Cl) 108 ± 0.00 NR NR NR
Aluminium (Al) NR 320 ± 0.01 36 <200 NR
Sodium (Na) NR NR 309.3 <300 NR
cAsh content
(wt.% dry basis)
9.3 ± 2.05 16.8 ± 0.8 4.6 4.5 3.20 ± 0.08
adetermined by elemental analysis
bdetermined by XRF
cdetermined by TGA
ddetermined by difference O % = 100% - C% - H% - N% - %ash
NR – not reported
Although it is well known that BSG is rich in sugars, proteins and minerals,
the chemical composition of this material may suffer significant variations due to
various factors. According to Mussatto (2014), the chemical composition of BSG
varies depending on; barley variety, harvest time, malting and mashing conditions,
73 | P a g e
Chapter 4: Characterisation of BSG
and type of adjuncts added during the brewing process. As can be seen from
Table 4-3, the main elements in BSG are composed of carbon, hydrogen, nitrogen
and oxygen. The overall ratio of these elements is significantly related to the
biochemical components of BSG which are the protein and the fibres (cellulose,
hemicellulose and lignin) (Mussatto and Roberto, 2005). The main elemental
sequence of BSG obtained in this study is in agreement with other researchers‘ which
is carbon > oxygen > hydrogen > nitrogen. Generally, carbon represents the major
contribution to the overall heating process, and the carbon content of the fuel is
estimated via the composition of lignin, hemicellulose and cellulose (Gollakota,
Kishore and Gu, 2018).
BSG also contains a variety of minerals elements, including phosphorus,
calcium, silicon, sulphur, magnesium, manganese, iron, zinc, potassium, chlorine,
aluminium and sodium, at levels up to 10740 mg/kg of dry weight. Phosphorus and
calcium are the minerals present in the highest amounts in the BSG used in this
study, being 3989 mg/kg and 4259 mg/kg respectively. Similarly, Meneses et al.,
(2013) reported that phosphorus represents up to 6000 mg/kg dry weight of the BSG
and calcium is 3600 mg mg/kg. This is notably higher than other reported cereals
such as rice, oat and wheat straw (Mussatto, 2014) in which the use of BSG has also
been proposed in human nutrition (Mussatto, Dragone and Roberto, 2006; Waters et
al., 2012). However, BSG is too granular for direct addition to food. Therefore, BSG
must first be converted to flour and should undergo several stages of pre-treatment.
In other studies, silicon has been reported as the most abundant mineral in the BSG,
being 10740 mg/kg or 6480 mg/kg and is followed by other minerals such as sulphur,
magnesium, manganese, potassium and sodium, as shown in Table 4-3 by both
authors Mussatto (2014) and Poerschmann et al., (2014). Minerals present in the
biomass are also responsible for the concentration of the ash content (Anukam et al.,
2017). They cause problems during thermo-chemical processes as the material will
form a liquid slag during combustion and form solid deposits as it cools down. The
elements Na, K, Mg, Ca as well as Cl, S and Si are the most problematic (Miles et
al., 1996), and the combination of alkali metals with silica can form alkali silicates
(McKendry, 2002b).A low amount of sulphur will minimise SOX pollution from
gasification or combustion systems and avoids catalyst poisoning in fast pyrolysis
74 | P a g e
Chapter 4: Characterisation of BSG
systems. A low level of nitrogen, which contributes to NOX emissions, is good for
similar reasons. High levels of nitrogen can be problematic for the quality of liquid
fuel products from fast pyrolysis (Tanger et al., 2013).
Results obtained from FTIR spectrum, proximate and ultimate analysis
provide a tremendous amount of information about the BSG characteristics, both
qualitatively as well as quantitatively. The ash content of the BSG from the
proximate analysis, for example, is related to the mineral content, as detected from
the ultimate analysis. The FTIR spectrum of BSG shows a characteristic of
lignocellulosic biomass. Through the proximate analysis, the decomposition
behaviour proves that the major components are the volatile matter which indicates
the presence of lignocellulosic biomass in the BSG. Section 4.2.3 will focus on the
lignocellulosic biomass content, including cellulose, hemicellulose and lignin.
4.2.3 BSG composition
The different chemical component in biomass influences the chemical
reactivity differently. Lignocellulosic biomass contains various amounts of cellulose,
hemicellulose, lignin and also a small amount of other extractives (McKendry,
2002a). Therefore, it is crucial to know the chemical composition of this complex
biomass to enable the process of converting the biomass into the green fuels or
valuable chemicals (Carrier, Loppinet-Serani and Denux, 2011). For example, the
relative proportions of cellulose and lignin are one of the determining factors in
identifying the suitability of biomass for subsequent processing as energy crops
(McKendry, 2002a). In this section, the chemical compositions of BSG are discussed
in detail and the extracted compositions are subjected to TGA, FTIR and elemental
analysis as characterisation methods.
4.2.3.1 Extractive free (EF) BSG
Prior to determination of the BSG composition, it is necessary to conduct an
experiment to remove any compounds which are not part of the biomass (extractive
content). Extractives are a heterogeneous group of substances which can be extracted
from biomass by means of polar or non-polar solvents (Telmo and Lousada, 2011).
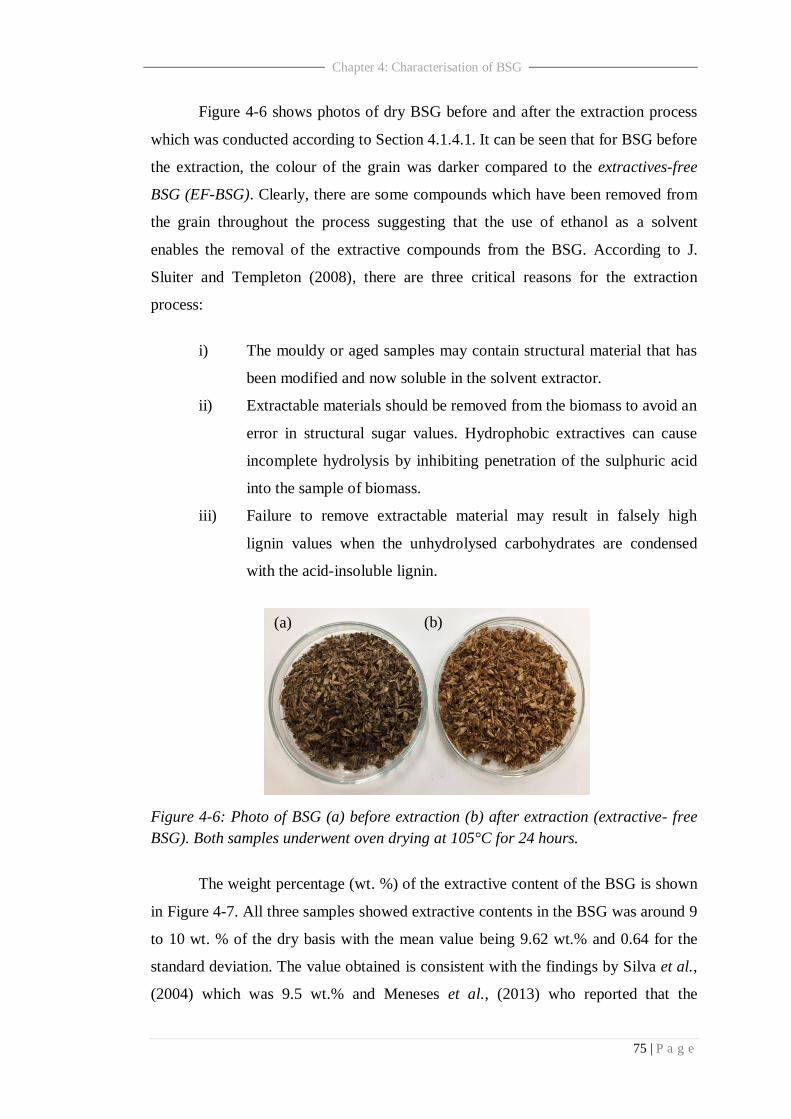
75 | P a g e
Chapter 4: Characterisation of BSG
Figure 4-6 shows photos of dry BSG before and after the extraction process
which was conducted according to Section 4.1.4.1. It can be seen that for BSG before
the extraction, the colour of the grain was darker compared to the extractives-free
BSG (EF-BSG). Clearly, there are some compounds which have been removed from
the grain throughout the process suggesting that the use of ethanol as a solvent
enables the removal of the extractive compounds from the BSG. According to J.
Sluiter and Templeton (2008), there are three critical reasons for the extraction
process:
i) The mouldy or aged samples may contain structural material that has
been modified and now soluble in the solvent extractor.
ii) Extractable materials should be removed from the biomass to avoid an
error in structural sugar values. Hydrophobic extractives can cause
incomplete hydrolysis by inhibiting penetration of the sulphuric acid
into the sample of biomass.
iii) Failure to remove extractable material may result in falsely high
lignin values when the unhydrolysed carbohydrates are condensed
with the acid-insoluble lignin.
Figure 4-6: Photo of BSG (a) before extraction (b) after extraction (extractive- free
BSG). Both samples underwent oven drying at 105°C for 24 hours.
The weight percentage (wt. %) of the extractive content of the BSG is shown
in Figure 4-7. All three samples showed extractive contents in the BSG was around 9
to 10 wt. % of the dry basis with the mean value being 9.62 wt.% and 0.64 for the
standard deviation. The value obtained is consistent with the findings by Silva et al.,
(2004) which was 9.5 wt.% and Meneses et al., (2013) who reported that the
(a) (b)
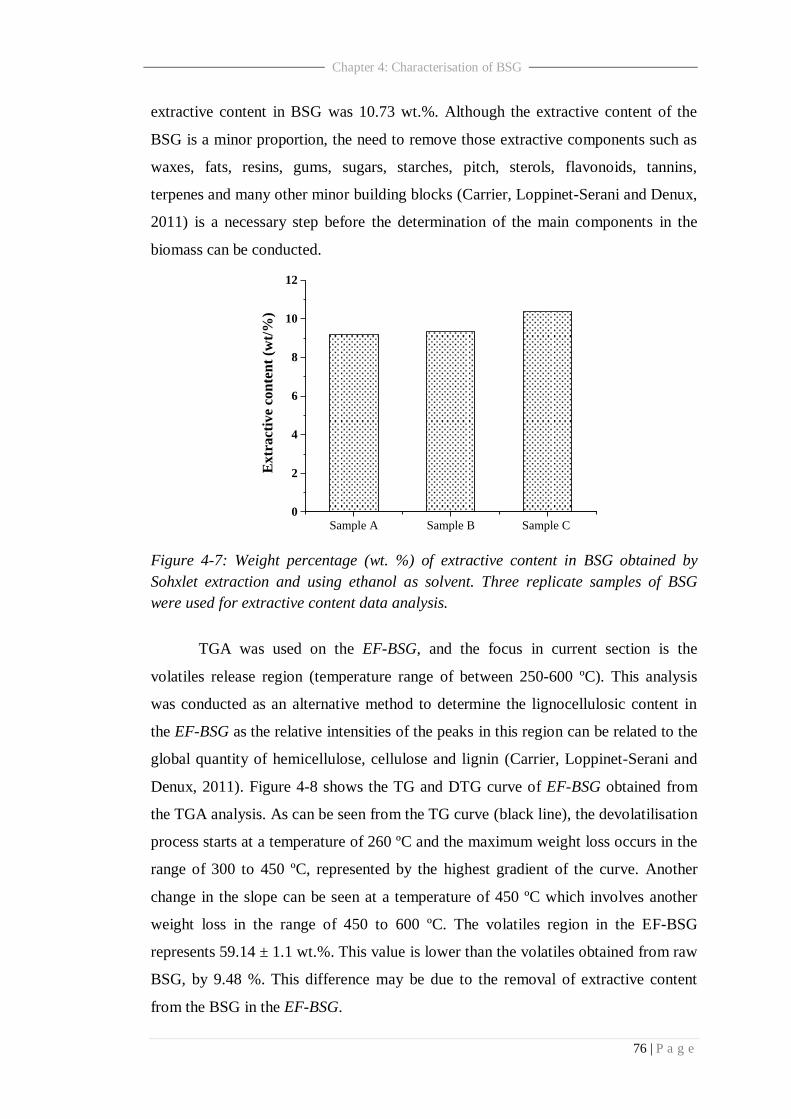
76 | P a g e
Chapter 4: Characterisation of BSG
extractive content in BSG was 10.73 wt.%. Although the extractive content of the
BSG is a minor proportion, the need to remove those extractive components such as
waxes, fats, resins, gums, sugars, starches, pitch, sterols, flavonoids, tannins,
terpenes and many other minor building blocks (Carrier, Loppinet-Serani and Denux,
2011) is a necessary step before the determination of the main components in the
biomass can be conducted.
Figure 4-7: Weight percentage (wt. %) of extractive content in BSG obtained by
Sohxlet extraction and using ethanol as solvent. Three replicate samples of BSG
were used for extractive content data analysis.
TGA was used on the EF-BSG, and the focus in current section is the
volatiles release region (temperature range of between 250-600 ºC). This analysis
was conducted as an alternative method to determine the lignocellulosic content in
the EF-BSG as the relative intensities of the peaks in this region can be related to the
global quantity of hemicellulose, cellulose and lignin (Carrier, Loppinet-Serani and
Denux, 2011). Figure 4-8 shows the TG and DTG curve of EF-BSG obtained from
the TGA analysis. As can be seen from the TG curve (black line), the devolatilisation
process starts at a temperature of 260 ºC and the maximum weight loss occurs in the
range of 300 to 450 ºC, represented by the highest gradient of the curve. Another
change in the slope can be seen at a temperature of 450 ºC which involves another
weight loss in the range of 450 to 600 ºC. The volatiles region in the EF-BSG
represents 59.14 ± 1.1 wt.%. This value is lower than the volatiles obtained from raw
BSG, by 9.48 %. This difference may be due to the removal of extractive content
from the BSG in the EF-BSG.
Sample A Sample B Sample C 0
2
4
6
8
10
12E
xtr
act
ive
con
ten
t (w
t/%
)
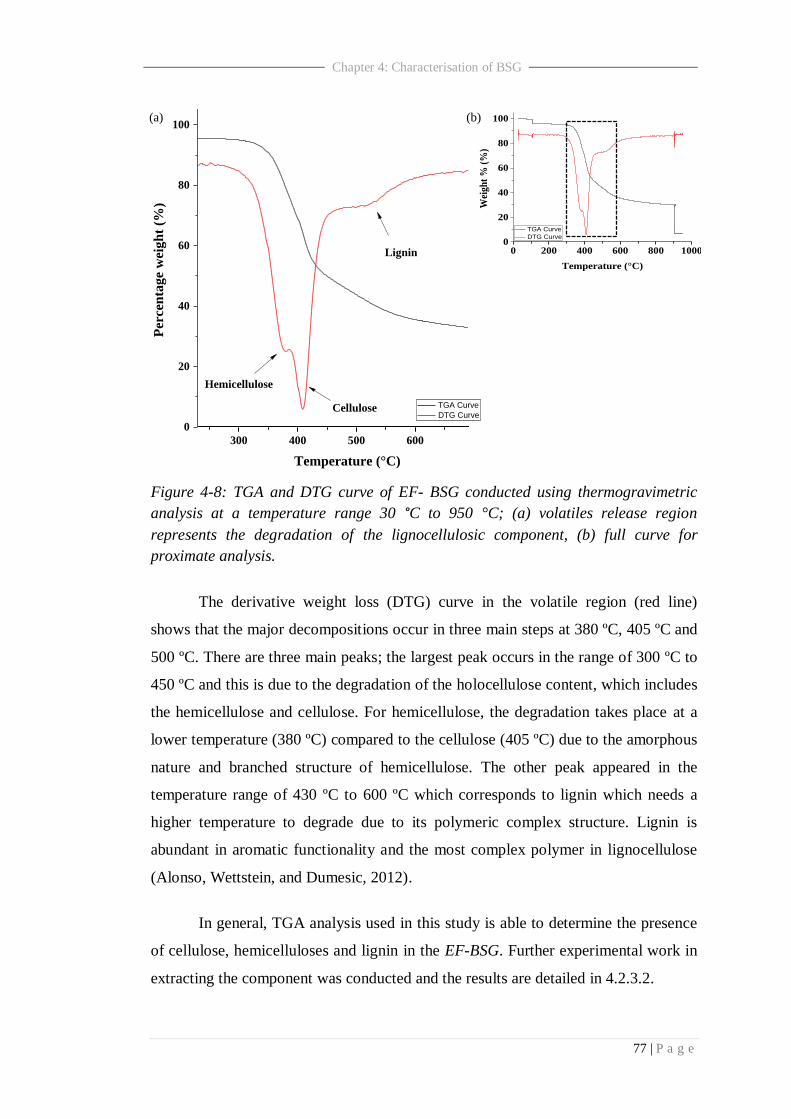
77 | P a g e
Chapter 4: Characterisation of BSG
Figure 4-8: TGA and DTG curve of EF- BSG conducted using thermogravimetric
analysis at a temperature range 30 °C to 950 °C; (a) volatiles release region
represents the degradation of the lignocellulosic component, (b) full curve for
proximate analysis.
The derivative weight loss (DTG) curve in the volatile region (red line)
shows that the major decompositions occur in three main steps at 380 ºC, 405 ºC and
500 ºC. There are three main peaks; the largest peak occurs in the range of 300 ºC to
450 ºC and this is due to the degradation of the holocellulose content, which includes
the hemicellulose and cellulose. For hemicellulose, the degradation takes place at a
lower temperature (380 ºC) compared to the cellulose (405 ºC) due to the amorphous
nature and branched structure of hemicellulose. The other peak appeared in the
temperature range of 430 ºC to 600 ºC which corresponds to lignin which needs a
higher temperature to degrade due to its polymeric complex structure. Lignin is
abundant in aromatic functionality and the most complex polymer in lignocellulose
(Alonso, Wettstein, and Dumesic, 2012).
In general, TGA analysis used in this study is able to determine the presence
of cellulose, hemicelluloses and lignin in the EF-BSG. Further experimental work in
extracting the component was conducted and the results are detailed in 4.2.3.2.
300 400 500 600
0
20
40
60
80
100
0 200 400 600 800 10000
20
40
60
80
100
TGA Curve
DTG Curve
Temperature (°C)
Wei
gh
t %
(%
)
TGA Curve
DTG Curve
Temperature (°C)
Per
cen
tage
wei
gh
t (%
)
Hemicellulose
Cellulose
Lignin
(a) (b)
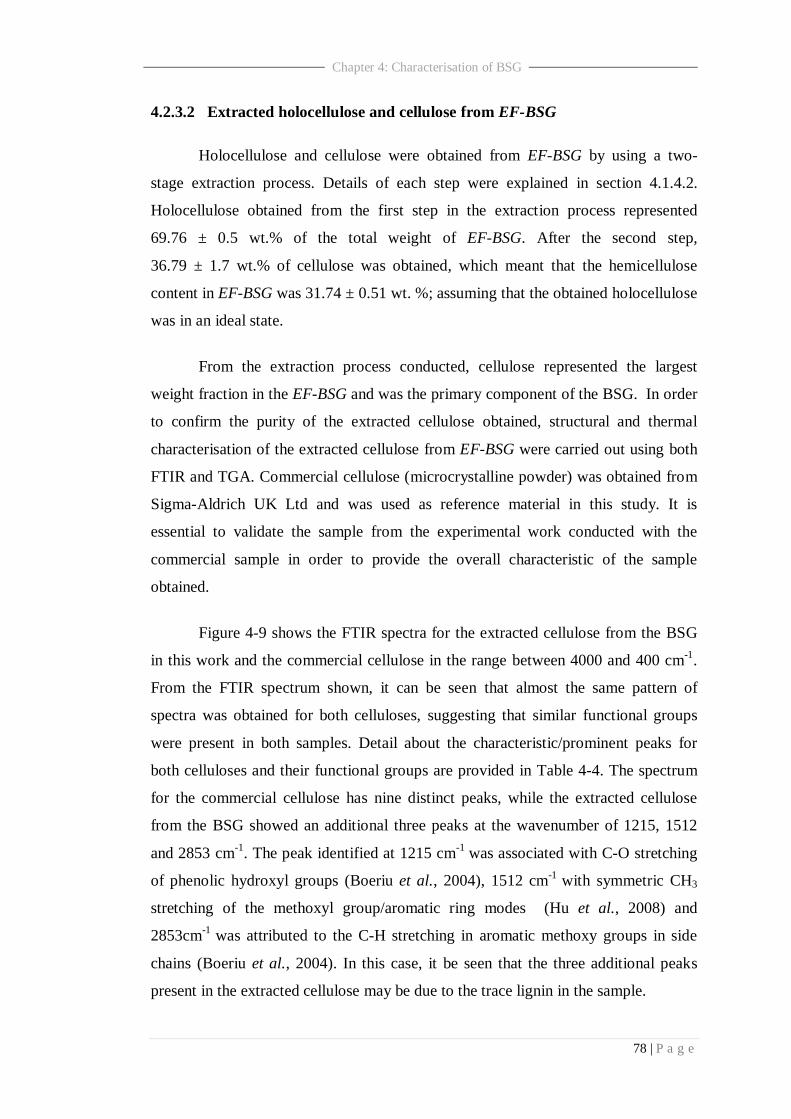
78 | P a g e
Chapter 4: Characterisation of BSG
4.2.3.2 Extracted holocellulose and cellulose from EF-BSG
Holocellulose and cellulose were obtained from EF-BSG by using a two-
stage extraction process. Details of each step were explained in section 4.1.4.2.
Holocellulose obtained from the first step in the extraction process represented
69.76 ± 0.5 wt.% of the total weight of EF-BSG. After the second step,
36.79 ± 1.7 wt.% of cellulose was obtained, which meant that the hemicellulose
content in EF-BSG was 31.74 ± 0.51 wt. %; assuming that the obtained holocellulose
was in an ideal state.
From the extraction process conducted, cellulose represented the largest
weight fraction in the EF-BSG and was the primary component of the BSG. In order
to confirm the purity of the extracted cellulose obtained, structural and thermal
characterisation of the extracted cellulose from EF-BSG were carried out using both
FTIR and TGA. Commercial cellulose (microcrystalline powder) was obtained from
Sigma-Aldrich UK Ltd and was used as reference material in this study. It is
essential to validate the sample from the experimental work conducted with the
commercial sample in order to provide the overall characteristic of the sample
obtained.
Figure 4-9 shows the FTIR spectra for the extracted cellulose from the BSG
in this work and the commercial cellulose in the range between 4000 and 400 cm-1
.
From the FTIR spectrum shown, it can be seen that almost the same pattern of
spectra was obtained for both celluloses, suggesting that similar functional groups
were present in both samples. Detail about the characteristic/prominent peaks for
both celluloses and their functional groups are provided in Table 4-4. The spectrum
for the commercial cellulose has nine distinct peaks, while the extracted cellulose
from the BSG showed an additional three peaks at the wavenumber of 1215, 1512
and 2853 cm-1
. The peak identified at 1215 cm-1
was associated with C-O stretching
of phenolic hydroxyl groups (Boeriu et al., 2004), 1512 cm-1
with symmetric CH3
stretching of the methoxyl group/aromatic ring modes (Hu et al., 2008) and
2853cm-1
was attributed to the C-H stretching in aromatic methoxy groups in side
chains (Boeriu et al., 2004). In this case, it be seen that the three additional peaks
present in the extracted cellulose may be due to the trace lignin in the sample.
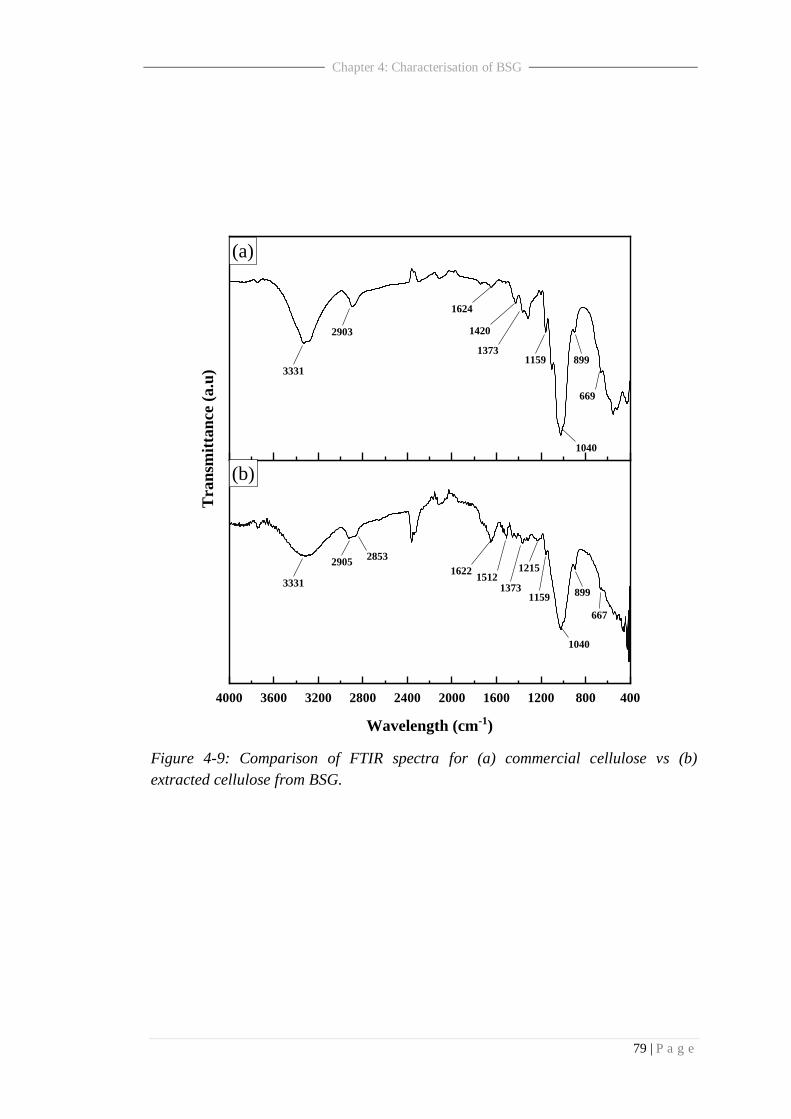
79 | P a g e
Chapter 4: Characterisation of BSG
Figure 4-9: Comparison of FTIR spectra for (a) commercial cellulose vs (b)
extracted cellulose from BSG.
4000 3600 3200 2800 2400 2000 1600 1200 800 400
Tra
nsm
itta
nce
(a.u
)
(a)
2903
899
1040
669
33311159
1373
1420
1624
Wavelength (cm-1)
(b)
2905
1512
899
1040
3331
11591373
1622
667
12152853
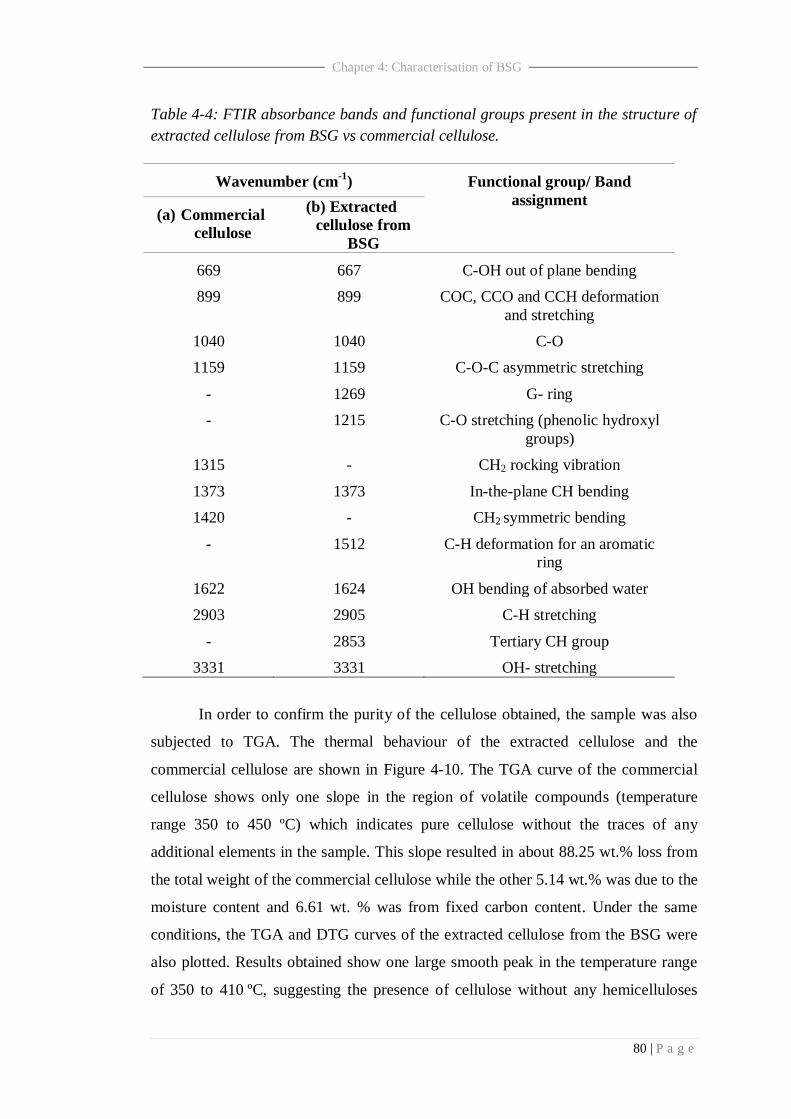
80 | P a g e
Chapter 4: Characterisation of BSG
Table 4-4: FTIR absorbance bands and functional groups present in the structure of
extracted cellulose from BSG vs commercial cellulose.
Wavenumber (cm-1
) Functional group/ Band
assignment (a) Commercial
cellulose
(b) Extracted
cellulose from
BSG
669 667 C-OH out of plane bending
899 899 COC, CCO and CCH deformation
and stretching
1040 1040 C-O
1159 1159 C-O-C asymmetric stretching
- 1269 G- ring
- 1215 C-O stretching (phenolic hydroxyl
groups)
1315 - CH2 rocking vibration
1373 1373 In-the-plane CH bending
1420 - CH2 symmetric bending
- 1512 C-H deformation for an aromatic
ring
1622 1624 OH bending of absorbed water
2903 2905 C-H stretching
- 2853 Tertiary CH group
3331 3331 OH- stretching
In order to confirm the purity of the cellulose obtained, the sample was also
subjected to TGA. The thermal behaviour of the extracted cellulose and the
commercial cellulose are shown in Figure 4-10. The TGA curve of the commercial
cellulose shows only one slope in the region of volatile compounds (temperature
range 350 to 450 ºC) which indicates pure cellulose without the traces of any
additional elements in the sample. This slope resulted in about 88.25 wt.% loss from
the total weight of the commercial cellulose while the other 5.14 wt.% was due to the
moisture content and 6.61 wt. % was from fixed carbon content. Under the same
conditions, the TGA and DTG curves of the extracted cellulose from the BSG were
also plotted. Results obtained show one large smooth peak in the temperature range
of 350 to 410 ºC, suggesting the presence of cellulose without any hemicelluloses
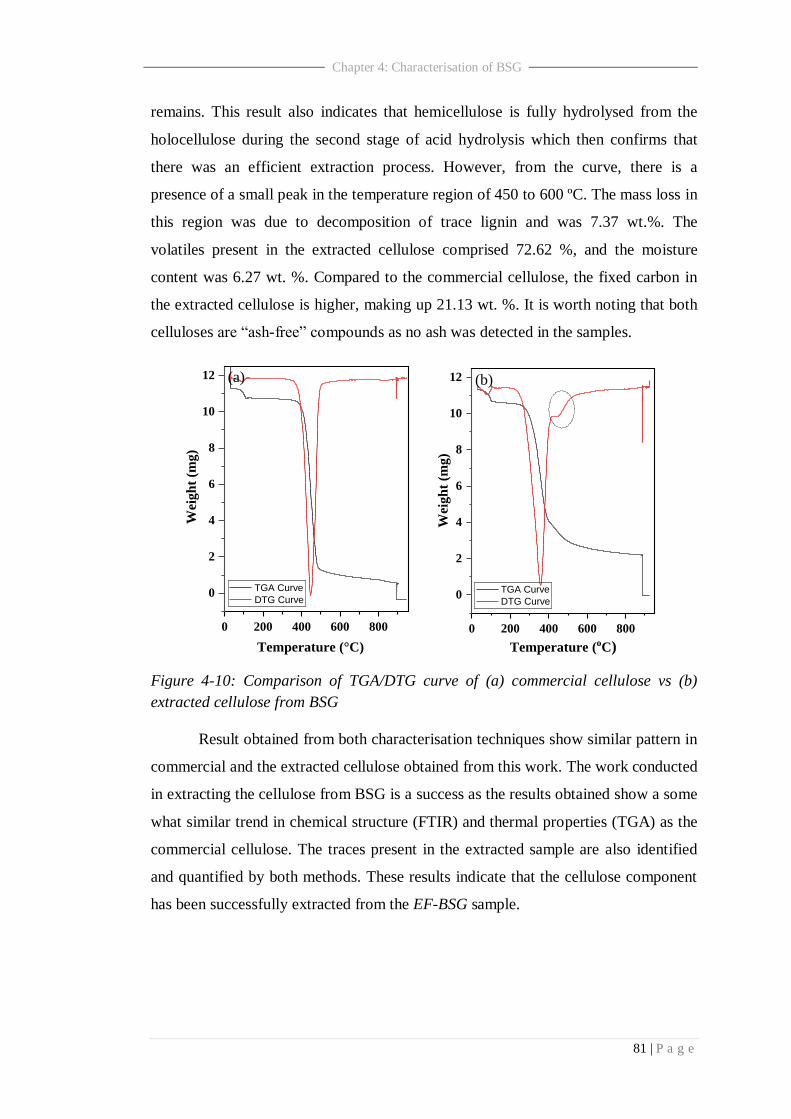
81 | P a g e
Chapter 4: Characterisation of BSG
remains. This result also indicates that hemicellulose is fully hydrolysed from the
holocellulose during the second stage of acid hydrolysis which then confirms that
there was an efficient extraction process. However, from the curve, there is a
presence of a small peak in the temperature region of 450 to 600 ºC. The mass loss in
this region was due to decomposition of trace lignin and was 7.37 wt.%. The
volatiles present in the extracted cellulose comprised 72.62 %, and the moisture
content was 6.27 wt. %. Compared to the commercial cellulose, the fixed carbon in
the extracted cellulose is higher, making up 21.13 wt. %. It is worth noting that both
celluloses are ―ash-free‖ compounds as no ash was detected in the samples.
Figure 4-10: Comparison of TGA/DTG curve of (a) commercial cellulose vs (b)
extracted cellulose from BSG
Result obtained from both characterisation techniques show similar pattern in
commercial and the extracted cellulose obtained from this work. The work conducted
in extracting the cellulose from BSG is a success as the results obtained show a some
what similar trend in chemical structure (FTIR) and thermal properties (TGA) as the
commercial cellulose. The traces present in the extracted sample are also identified
and quantified by both methods. These results indicate that the cellulose component
has been successfully extracted from the EF-BSG sample.
0 200 400 600 800
0
2
4
6
8
10
12
Temperature (°C)
Wei
gh
t (m
g)
TGA Curve
DTG Curve
(b)(a)
0 200 400 600 800
0
2
4
6
8
10
12
TGA Curve
DTG Curve
Temperature (oC)
Wei
gh
t (m
g)

82 | P a g e
Chapter 4: Characterisation of BSG
4.2.3.3 Extracted lignin from BSG
Lignin was extracted from the EF-BSG according to the method in section
4.1.4.3, and the amount of the lignin present in the sample was 28.85 ± 0.3 wt.% .
Lignin represents one of the three major components of lignocellulosic biomass,
however, this compound has received little attention relative to cellulose with regards
to its valorisation (Zakzeski et al., 2010). In this section, the characteristics of lignin
were studied using two characterisation methods: FTIR and TGA analysis. The
properties of the extracted lignin were also compared with commercial lignin. The
reference lignin used in this work was the Kraft lignin type with low sulfonate
content, purchased from Sigma-Aldrich UK Ltd.
Figure 4-11: Comparison of FTIR spectra of (a) commercial lignin vs. (b) extracted
lignin from BSG
Figure 4-11 shows the FTIR spectrum obtained for both lignin samples in the
range of 4000 to 400 cm-1
. The FTIR spectra reflect the chemical structure as well as
the purity of the lignin. The commercial lignin shows a broad band at 3418 cm−1
which is attributed to the hydroxyl groups in phenolic and aliphatic structures while
4000 3600 3200 2800 2400 2000 1600 1200 800 400
(a)
3418
1503
1464
2951
1269
11421215
1597
2851
1034
Tra
nsm
itta
nce
(a.u
)
Wavelength (cm-1)
(b)
3316 2947
1117
1142
854 816
2851
1034
1715
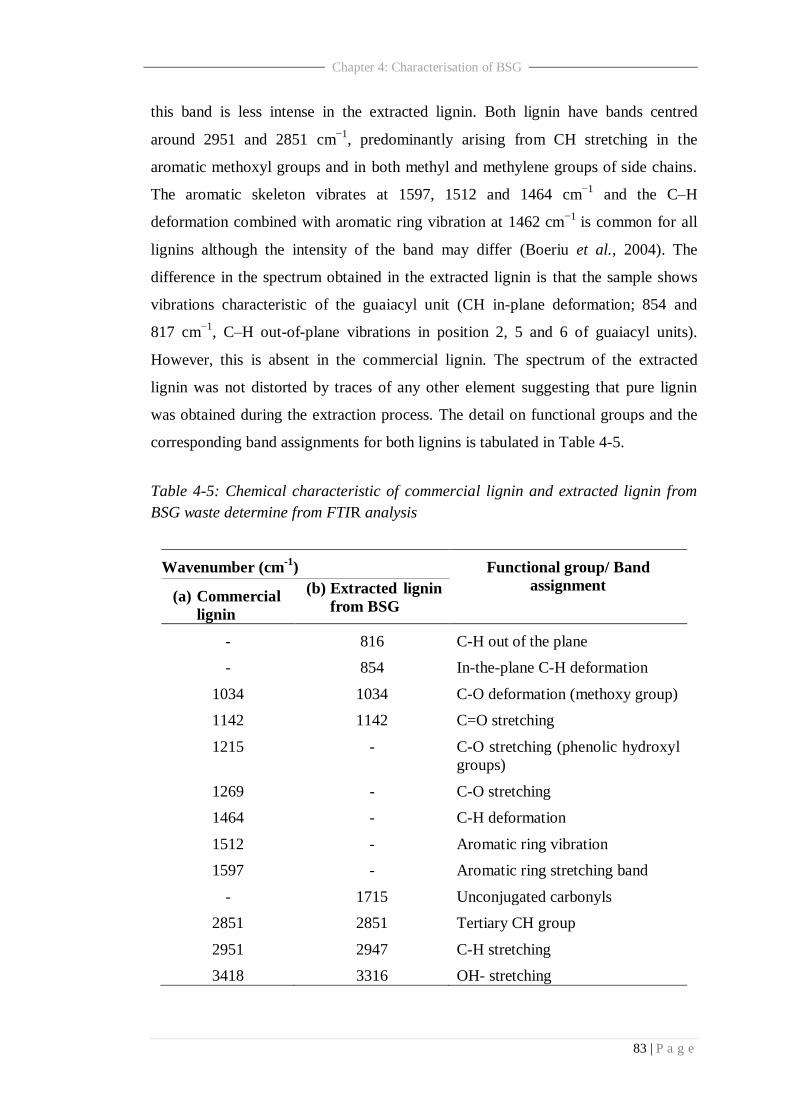
83 | P a g e
Chapter 4: Characterisation of BSG
this band is less intense in the extracted lignin. Both lignin have bands centred
around 2951 and 2851 cm−1
, predominantly arising from CH stretching in the
aromatic methoxyl groups and in both methyl and methylene groups of side chains.
The aromatic skeleton vibrates at 1597, 1512 and 1464 cm−1
and the C–H
deformation combined with aromatic ring vibration at 1462 cm−1
is common for all
lignins although the intensity of the band may differ (Boeriu et al., 2004). The
difference in the spectrum obtained in the extracted lignin is that the sample shows
vibrations characteristic of the guaiacyl unit (CH in-plane deformation; 854 and
817 cm−1
, C–H out-of-plane vibrations in position 2, 5 and 6 of guaiacyl units).
However, this is absent in the commercial lignin. The spectrum of the extracted
lignin was not distorted by traces of any other element suggesting that pure lignin
was obtained during the extraction process. The detail on functional groups and the
corresponding band assignments for both lignins is tabulated in Table 4-5.
Table 4-5: Chemical characteristic of commercial lignin and extracted lignin from
BSG waste determine from FTIR analysis
Wavenumber (cm-1
) Functional group/ Band
assignment (a) Commercial
lignin
(b) Extracted lignin
from BSG
- 816 C-H out of the plane
- 854 In-the-plane C-H deformation
1034 1034 C-O deformation (methoxy group)
1142 1142 C=O stretching
1215 - C-O stretching (phenolic hydroxyl
groups)
1269 - C-O stretching
1464 - C-H deformation
1512 - Aromatic ring vibration
1597 - Aromatic ring stretching band
- 1715 Unconjugated carbonyls
2851 2851 Tertiary CH group
2951 2947 C-H stretching
3418 3316 OH- stretching
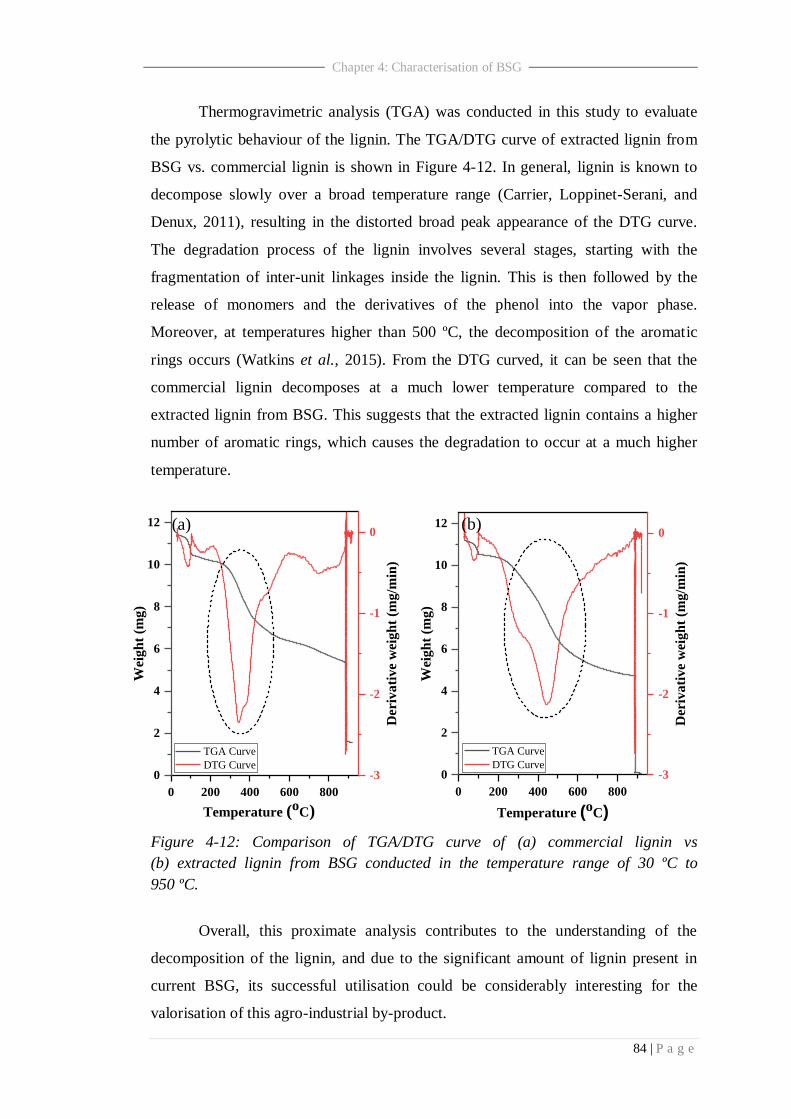
84 | P a g e
Chapter 4: Characterisation of BSG
Thermogravimetric analysis (TGA) was conducted in this study to evaluate
the pyrolytic behaviour of the lignin. The TGA/DTG curve of extracted lignin from
BSG vs. commercial lignin is shown in Figure 4-12. In general, lignin is known to
decompose slowly over a broad temperature range (Carrier, Loppinet-Serani, and
Denux, 2011), resulting in the distorted broad peak appearance of the DTG curve.
The degradation process of the lignin involves several stages, starting with the
fragmentation of inter-unit linkages inside the lignin. This is then followed by the
release of monomers and the derivatives of the phenol into the vapor phase.
Moreover, at temperatures higher than 500 ºC, the decomposition of the aromatic
rings occurs (Watkins et al., 2015). From the DTG curved, it can be seen that the
commercial lignin decomposes at a much lower temperature compared to the
extracted lignin from BSG. This suggests that the extracted lignin contains a higher
number of aromatic rings, which causes the degradation to occur at a much higher
temperature.
Figure 4-12: Comparison of TGA/DTG curve of (a) commercial lignin vs
(b) extracted lignin from BSG conducted in the temperature range of 30 ºC to
950 ºC.
Overall, this proximate analysis contributes to the understanding of the
decomposition of the lignin, and due to the significant amount of lignin present in
current BSG, its successful utilisation could be considerably interesting for the
valorisation of this agro-industrial by-product.
0 200 400 600 800
0
2
4
6
8
10
12
TGA Curve
DTG Curve
Temperature (oC)
Wei
gh
t (m
g)
-3
-2
-1
0
Der
iva
tiv
e w
eig
ht
(mg
/min
)
(a) (b)
0 200 400 600 800
0
2
4
6
8
10
12
TGA Curve
DTG Curve
Temperature (oC)
Wei
gh
t (m
g)
-3
-2
-1
0
Der
iva
tiv
e w
eig
ht
(mg
/min
)
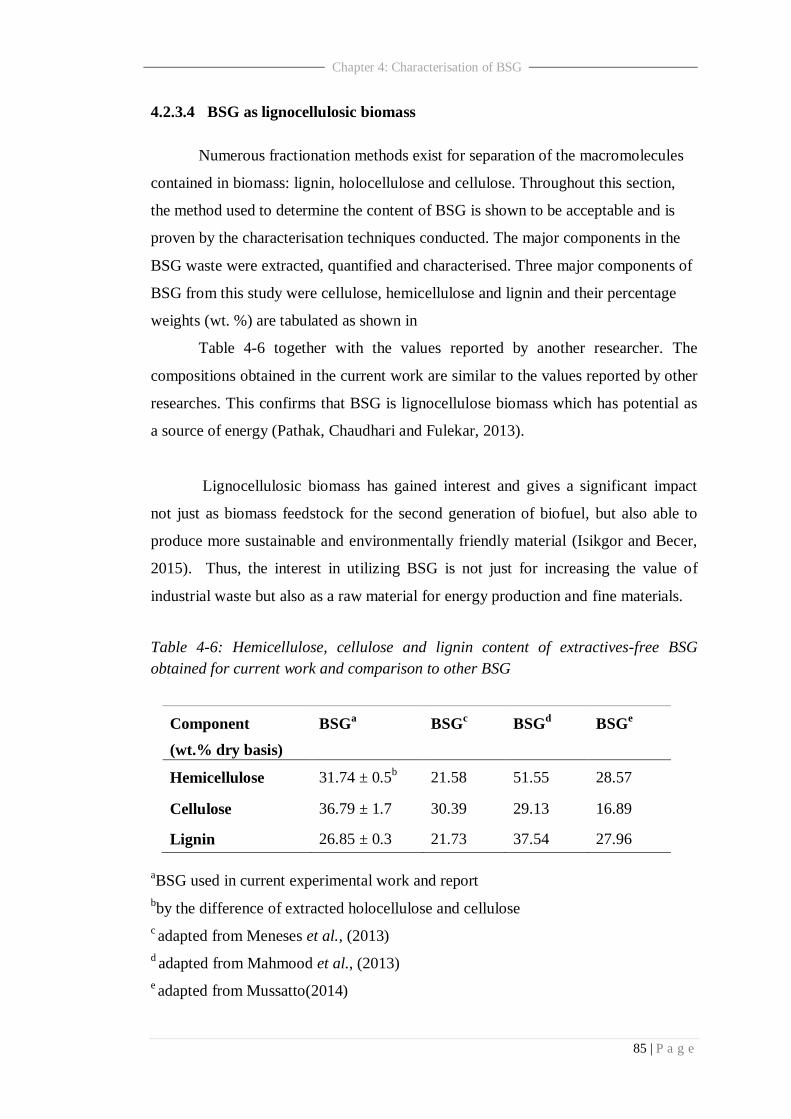
85 | P a g e
Chapter 4: Characterisation of BSG
4.2.3.4 BSG as lignocellulosic biomass
Numerous fractionation methods exist for separation of the macromolecules
contained in biomass: lignin, holocellulose and cellulose. Throughout this section,
the method used to determine the content of BSG is shown to be acceptable and is
proven by the characterisation techniques conducted. The major components in the
BSG waste were extracted, quantified and characterised. Three major components of
BSG from this study were cellulose, hemicellulose and lignin and their percentage
weights (wt. %) are tabulated as shown in
Table 4-6 together with the values reported by another researcher. The
compositions obtained in the current work are similar to the values reported by other
researches. This confirms that BSG is lignocellulose biomass which has potential as
a source of energy (Pathak, Chaudhari and Fulekar, 2013).
Lignocellulosic biomass has gained interest and gives a significant impact
not just as biomass feedstock for the second generation of biofuel, but also able to
produce more sustainable and environmentally friendly material (Isikgor and Becer,
2015). Thus, the interest in utilizing BSG is not just for increasing the value of
industrial waste but also as a raw material for energy production and fine materials.
Table 4-6: Hemicellulose, cellulose and lignin content of extractives-free BSG
obtained for current work and comparison to other BSG
Component
(wt.% dry basis)
BSGa BSG
c BSG
d BSG
e
Hemicellulose 31.74 ± 0.5b 21.58 51.55 28.57
Cellulose 36.79 ± 1.7 30.39 29.13 16.89
Lignin 26.85 ± 0.3 21.73 37.54 27.96
aBSG used in current experimental work and report
bby the difference of extracted holocellulose and cellulose
c adapted from Meneses et al., (2013)
d adapted from Mahmood et al., (2013)
e adapted from Mussatto(2014)
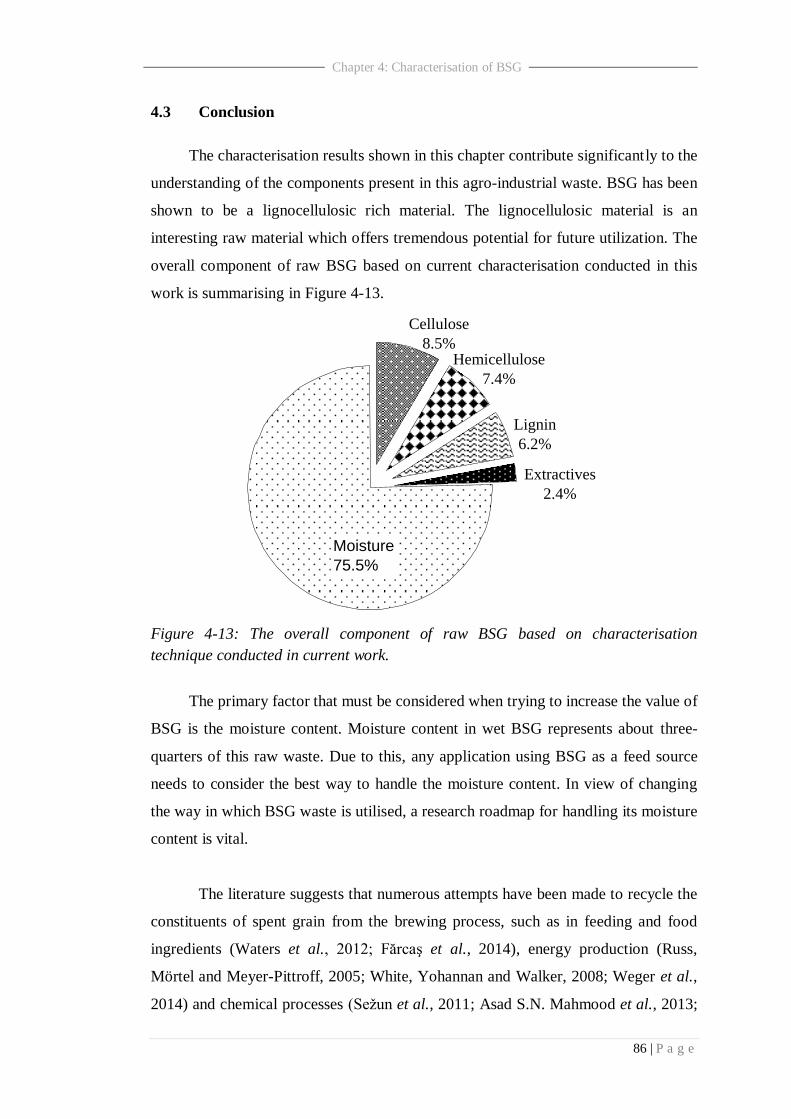
86 | P a g e
Chapter 4: Characterisation of BSG
4.3 Conclusion
The characterisation results shown in this chapter contribute significantly to the
understanding of the components present in this agro-industrial waste. BSG has been
shown to be a lignocellulosic rich material. The lignocellulosic material is an
interesting raw material which offers tremendous potential for future utilization. The
overall component of raw BSG based on current characterisation conducted in this
work is summarising in Figure 4-13.
Figure 4-13: The overall component of raw BSG based on characterisation
technique conducted in current work.
The primary factor that must be considered when trying to increase the value of
BSG is the moisture content. Moisture content in wet BSG represents about three-
quarters of this raw waste. Due to this, any application using BSG as a feed source
needs to consider the best way to handle the moisture content. In view of changing
the way in which BSG waste is utilised, a research roadmap for handling its moisture
content is vital.
The literature suggests that numerous attempts have been made to recycle the
constituents of spent grain from the brewing process, such as in feeding and food
ingredients (Waters et al., 2012; Fărcaş et al., 2014), energy production (Russ,
Mörtel and Meyer-Pittroff, 2005; White, Yohannan and Walker, 2008; Weger et al.,
2014) and chemical processes (Sežun et al., 2011; Asad S.N. Mahmood et al., 2013;
Moisture
75.5%
Extractives
2.4%
Lignin
6.2%
Hemicellulose
7.4%
Cellulose
8.5%

87 | P a g e
Chapter 4: Characterisation of BSG
Malomo, 2013). However, in spite of all the possible applications described, BSG
use is still limited; mainly it is used as animal feed or ends up in landfill. For this
reason, the development of new techniques to optimize this agro-industrial by-
product is of great interest since BSG is produced in large quantities throughout the
year.
.

CHAPTER 5
PRELIMINARY STUDY
ON HYDROTHERMAL
LIQUEFACTION (HTL)
REACTION

89 | P a g e
Chapter 5: Preliminary study on HTL
5.Chapter 5: Preliminary study on HTL
5.0 Introduction
In chapter 4, it was shown that brewers spent grain (BSG) is lignocellulosic
biomass with high moisture content. The moisture can represent up to 75 wt. % of
the total weight of the BSG. Wet biomass that contains > 50wt.% water is generally
considered as an unattractive feedstock due to increased transport costs, energy
consumption, and also environmental considerations related to unpleasant odours and
large numbers of pathogens (Pavlovič, Knez and Škerget, 2013). For this reason, the
best way to utilise this waste is by treatment with a hydrothermal liquefaction (HTL)
reaction. HTL is the thermo-chemical conversion of biomass into liquid fuels by
processing in a hot, pressurised aqueous environment for sufficient time to break
down the solid biopolymeric structure to mainly liquid components (Gollakota,
Kishore and Gu, 2018). HTL uses subcritical water as the reaction medium and, as
such, this process can be used for high moisture containing biomass without the need
for a drying process (Elliott et al., 2014).
This chapter presents investigations into HTL using two biomass models. A
preliminary study is conducted in which these model systems are used in HTL; a
mixture of cellulose and lignin was used in multi-component system to mimic the
real biomass. The main objective of the current chapter is to understand the reaction
pathway and behaviour of these major components during the HTL reaction. The
study will focus on the effect of reaction temperature and reaction time on the liquid
product obtained. The findings in this chapter will create a better understanding of
the use of the HTL reaction and its eventual application to with real biomass systems.
5.1 Materials and methods
Details on materials used were listed in section 5.1.1. The experimental work
involves the HTL reaction set-up and product analysis was elaborate in detail in
section 5.1.2 and 5.1.3.

90 | P a g e
Chapter 5: Preliminary study on HTL
5.1.1 Materials
The cellulose model used is microcrystalline cellulose (Avicel® PH-101,
Sigma Aldrich), while Kraft lignin (low sulfonate content lignin, Sigma Aldrich) was
used as for lignin. Other materials used in the current work are compressed helium
gas (BOC, 99.99%) and distilled water (produced in an Elga reservoir of 75 L).
5.1.2 Method
The experimental set-up employed has generally been explained in Section
3.2. In the current section, the biomass used is microcrystalline cellulose and Kraft
lignin. 0.1 g model biomass with 10 mL of distilled water was loaded into the
autoclave. The air trap in the reactor was purged, and 30 barg of helium gas was used
to pressurise the reactor. The desired temperature was set, and the mixer was set to
stir at 500 rpm. After the reaction was complete, the mixer was stopped, and the
reaction was quenched by placing the reactor in an ice bath. When the temperature
reached approximately to 25 ºC, the pressure was released and the reaction products
were recovered. The overall process taken in current work is simplified in Figure 5-1.
Figure 5-1: An overall flow chart for HTL reaction for model biomass conducted in
current chapter.
Model biomass
components Water as
solvent
Liquefaction process
Reaction mixture
Vacuum
filtration Liquid
product GCMS
analysis
Solid
residue
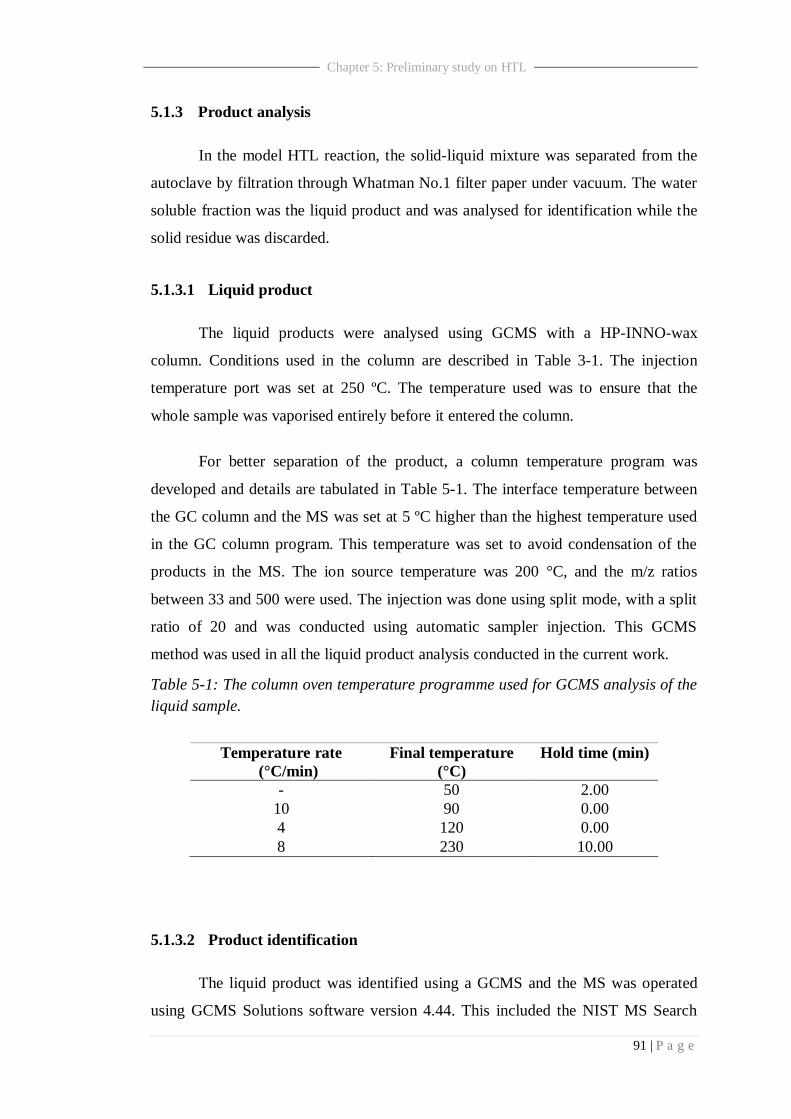
91 | P a g e
Chapter 5: Preliminary study on HTL
5.1.3 Product analysis
In the model HTL reaction, the solid-liquid mixture was separated from the
autoclave by filtration through Whatman No.1 filter paper under vacuum. The water
soluble fraction was the liquid product and was analysed for identification while the
solid residue was discarded.
5.1.3.1 Liquid product
The liquid products were analysed using GCMS with a HP-INNO-wax
column. Conditions used in the column are described in Table 3-1. The injection
temperature port was set at 250 ºC. The temperature used was to ensure that the
whole sample was vaporised entirely before it entered the column.
For better separation of the product, a column temperature program was
developed and details are tabulated in Table 5-1. The interface temperature between
the GC column and the MS was set at 5 ºC higher than the highest temperature used
in the GC column program. This temperature was set to avoid condensation of the
products in the MS. The ion source temperature was 200 °C, and the m/z ratios
between 33 and 500 were used. The injection was done using split mode, with a split
ratio of 20 and was conducted using automatic sampler injection. This GCMS
method was used in all the liquid product analysis conducted in the current work.
Table 5-1: The column oven temperature programme used for GCMS analysis of the
liquid sample.
Temperature rate
(°C/min)
Final temperature
(°C)
Hold time (min)
- 50 2.00
10 90 0.00
4 120 0.00
8 230 10.00
5.1.3.2 Product identification
The liquid product was identified using a GCMS and the MS was operated
using GCMS Solutions software version 4.44. This included the NIST MS Search
92 | P a g e
Chapter 5: Preliminary study on HTL
version 2.0 library with mass spectra of several compounds, thereby allowing the
identification of the reaction products. The products were labelled based on their
mass spectra and the peak areas were quantified. The confirmation on the target
product was determined based on the concurrence of retention times between the
calibration standards and the experimental data, which were confirmed by MS
spectrum.
5.2 Result and discussion
The discussion will focused on two different model biomass systems; single
and binary (mixture of cellulose and lignin) based on their liquid product
composition. The comparison was made between these two systems and effect of
reaction temperature and time in HTL of biomass model compound were also
presented.
5.2.1 Single model system
Effect of HTL reaction temperature on lignin and cellulose was conducted in
single model system. The results obtained were elaborate in details in this section.
5.2.1.1 HTL of cellulose
Cellulose was chosen as the model material in the current work as it
represents the major component of the lignocellulosic biomass of interest, BSG.
Cellulose is often used as a model compound and offers a good starting point for the
more complex biomass materials used in various other studies (Kumar and Gupta,
2008; Hegner et al., 2010; Liu et al., 2012). Cellulose is composed of glucose units
connected by β- 1,4- glucosidic bonds and is linked via strong inter-molecular and
intra-molecular hydrogen bonding (Pasangulapati et al., 2012). This structure is
responsible for cellulose resistance towards depolymerisation under mild conditions
in conventional solvents (Tekin, Karagöz and Bektaş, 2014).
In the current work, HTL of cellulose was conducted at different reaction
temperatures Figure 5-2 shows an example GC chromatogram for the liquid product
obtained. The results show that cellulose decomposes into several water-soluble
products with furfural, levulinic acid (LA) and hydroxymethylfurfural (HMF) as the

93 | P a g e
Chapter 5: Preliminary study on HTL
main liquid phase products. It was reported that the primary step for cellulose
decomposition in HTL is hydrolysis, which then produces oligosaccharides and
monosaccharides (Yu, Lou and Wu, 2008; Yin and Tan, 2012) . Figure 5-3 show a
simplified schematic of the hydrolysis process for the cellulose polymer in HTL.
Water at elevated temperatures and pressure can both break up the hydrogen-bound
crystalline structure and hydrolyse the β-1,4-glucosidic bonds, resulting in the
production of glucose monomers (A. A. Peterson et al., 2008). However, sugars, e.g.,
glucose, may be easily decomposed to form stable products, such as
hydroxymethylfurfural (HMF), during HTL (Yu, Lou and Wu, 2008).
Figure 5-2: GCMS chromatogram for liquid products of the HTL of cellulose.
Reaction conditions: microcrystalline cellulose = 0.1 g, distilled water = 10 mL,
PHe= 80 barg, reaction temperature= 250 ºC and reaction time=30min.
5 10 15 20 25 30 35
0
2
4
6
8
10
O
OH
Retention time (min)
Ab
solu
te I
nte
nsi
ty/1
05
(a.u
)
Fu
rfura
l
4-o
xo-p
enta
no
ic a
cid (
LA
)
Hy
dro
xym
ethy
lfurf
ura
l
HO
O
CH3
O
Ace
tic
acid
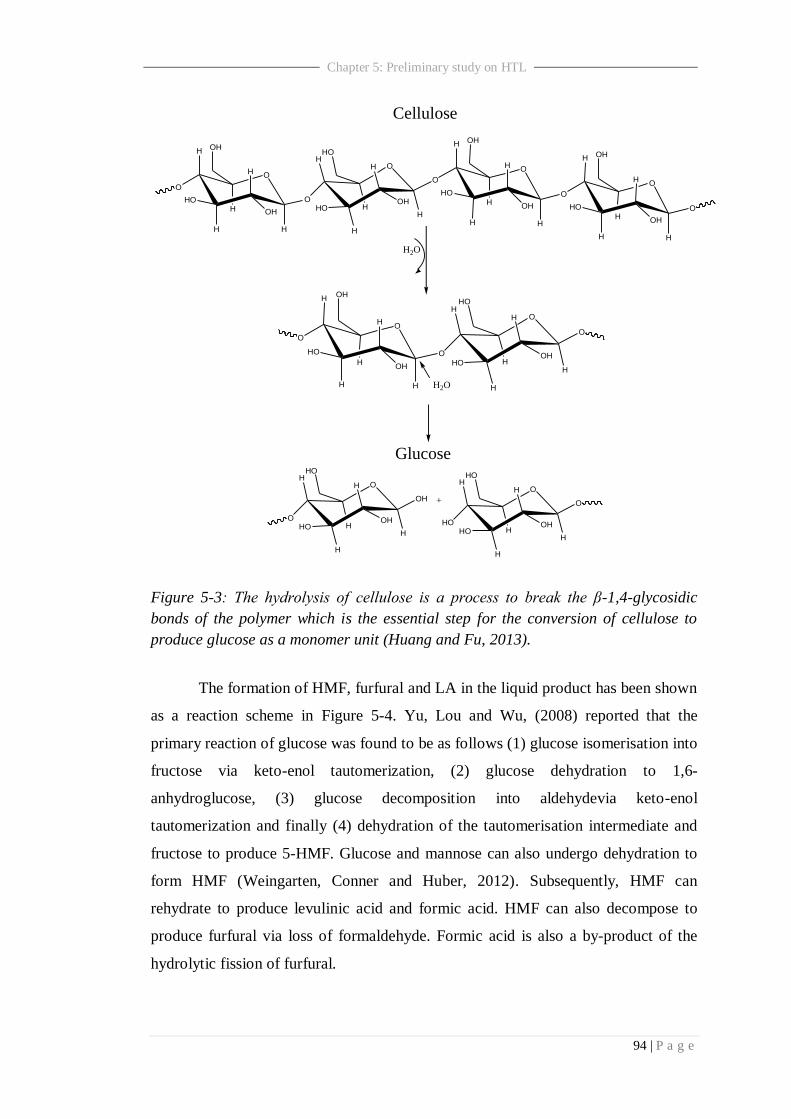
94 | P a g e
Chapter 5: Preliminary study on HTL
O
H
O
H
HO
H
H
OHH
OH
OH
O
H
HO
H
H
OHH
HO
O
H
O
H
HO
H
H
OHH
OH
O
H
O
H
HO
H
H
OHHO
OH
O
H
O
H
HO
H
H
OHH
OH
OH
O
H
HO
H
H
OHH
O
HO
H2O
H2O
OH
O
H
HO
H
H
OHH
OH
HO
OH
HO
H
HO
H
H
OHH
O
HO
+
Cellulose
Glucose
Figure 5-3: The hydrolysis of cellulose is a process to break the β-1,4-glycosidic
bonds of the polymer which is the essential step for the conversion of cellulose to
produce glucose as a monomer unit (Huang and Fu, 2013).
The formation of HMF, furfural and LA in the liquid product has been shown
as a reaction scheme in Figure 5-4. Yu, Lou and Wu, (2008) reported that the
primary reaction of glucose was found to be as follows (1) glucose isomerisation into
fructose via keto-enol tautomerization, (2) glucose dehydration to 1,6-
anhydroglucose, (3) glucose decomposition into aldehydevia keto-enol
tautomerization and finally (4) dehydration of the tautomerisation intermediate and
fructose to produce 5-HMF. Glucose and mannose can also undergo dehydration to
form HMF (Weingarten, Conner and Huber, 2012). Subsequently, HMF can
rehydrate to produce levulinic acid and formic acid. HMF can also decompose to
produce furfural via loss of formaldehyde. Formic acid is also a by-product of the
hydrolytic fission of furfural.
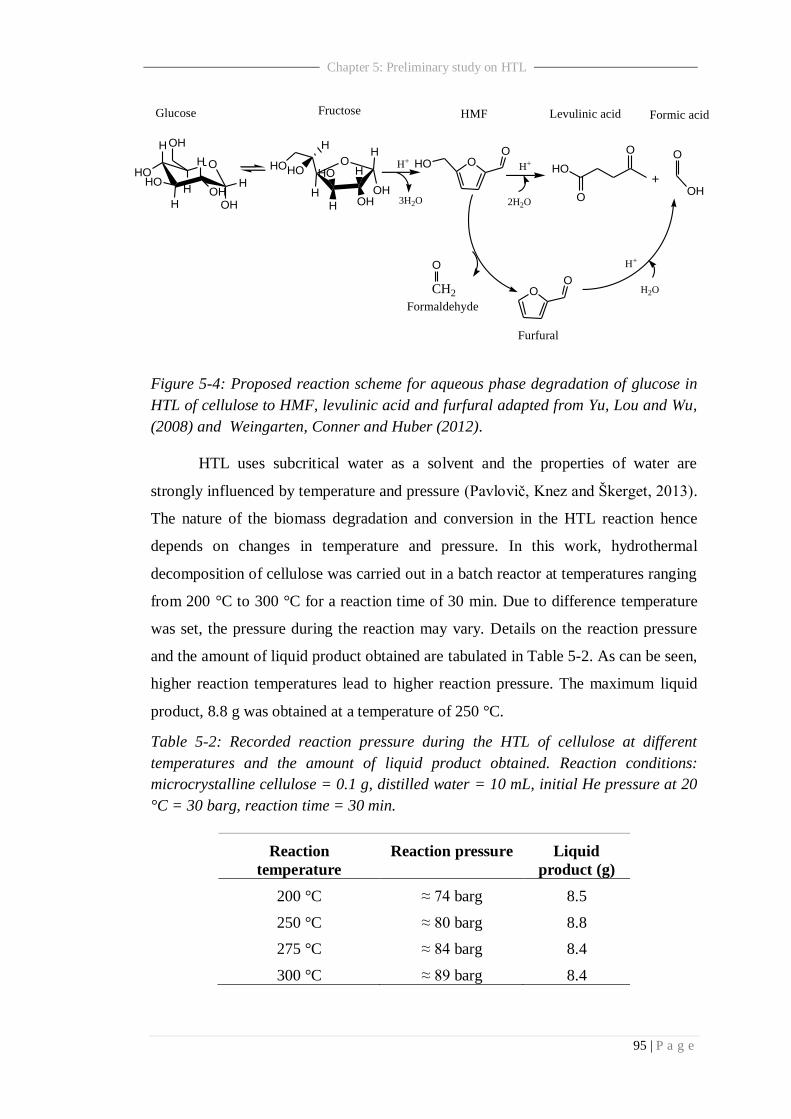
95 | P a g e
Chapter 5: Preliminary study on HTL
O
H
HO
H
HO
H
OHOHH
H
OH
OH
H
HH OH
HO HO
H
HOHO
Glucose Fructose
OHOO
HO
O
O
+
CH2
O
OO
3H2O 2H2O
H+H+
O
OH
Formaldehyde
HMF Levulinic acid Formic acid
H2O
H+
Furfural
Figure 5-4: Proposed reaction scheme for aqueous phase degradation of glucose in
HTL of cellulose to HMF, levulinic acid and furfural adapted from Yu, Lou and Wu,
(2008) and Weingarten, Conner and Huber (2012).
HTL uses subcritical water as a solvent and the properties of water are
strongly influenced by temperature and pressure (Pavlovič, Knez and Škerget, 2013).
The nature of the biomass degradation and conversion in the HTL reaction hence
depends on changes in temperature and pressure. In this work, hydrothermal
decomposition of cellulose was carried out in a batch reactor at temperatures ranging
from 200 °C to 300 °C for a reaction time of 30 min. Due to difference temperature
was set, the pressure during the reaction may vary. Details on the reaction pressure
and the amount of liquid product obtained are tabulated in Table 5-2. As can be seen,
higher reaction temperatures lead to higher reaction pressure. The maximum liquid
product, 8.8 g was obtained at a temperature of 250 °C.
Table 5-2: Recorded reaction pressure during the HTL of cellulose at different
temperatures and the amount of liquid product obtained. Reaction conditions:
microcrystalline cellulose = 0.1 g, distilled water = 10 mL, initial He pressure at 20
°C = 30 barg, reaction time = 30 min.
Reaction
temperature
Reaction pressure Liquid
product (g)
200 °C ≈ 74 barg 8.5
250 °C ≈ 80 barg 8.8
275 °C ≈ 84 barg 8.4
300 °C ≈ 89 barg 8.4
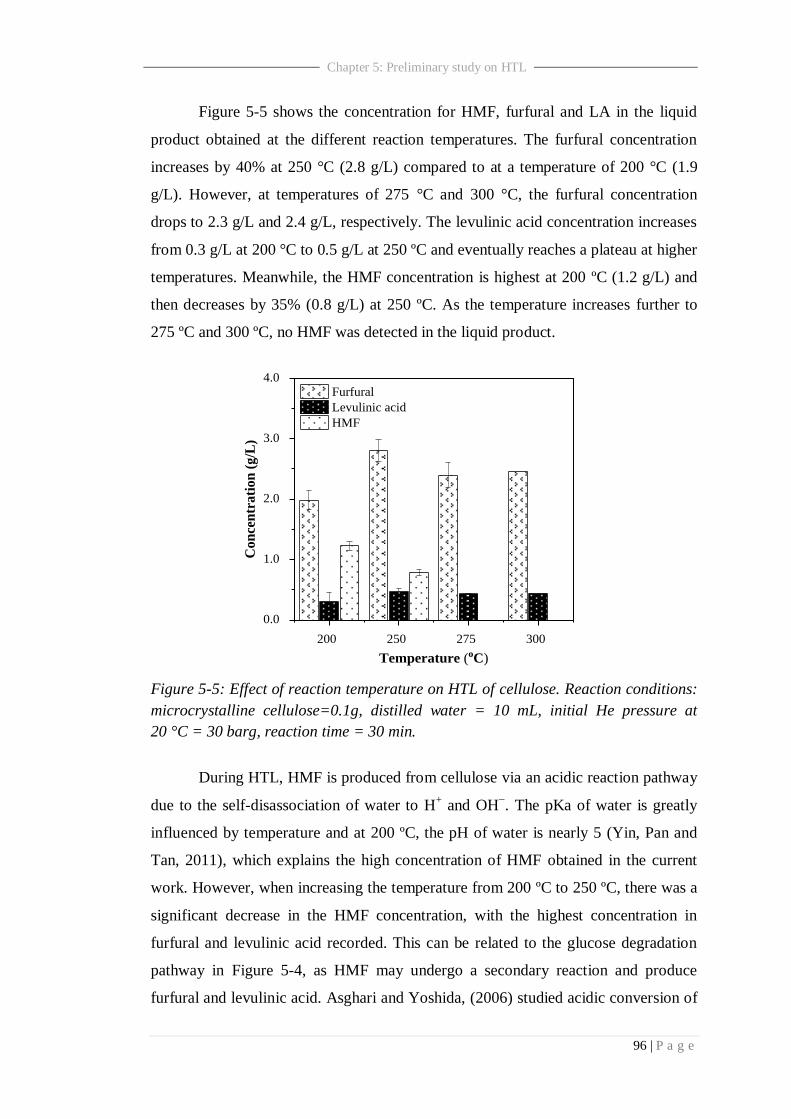
96 | P a g e
Chapter 5: Preliminary study on HTL
Figure 5-5 shows the concentration for HMF, furfural and LA in the liquid
product obtained at the different reaction temperatures. The furfural concentration
increases by 40% at 250 °C (2.8 g/L) compared to at a temperature of 200 °C (1.9
g/L). However, at temperatures of 275 °C and 300 °C, the furfural concentration
drops to 2.3 g/L and 2.4 g/L, respectively. The levulinic acid concentration increases
from 0.3 g/L at 200 °C to 0.5 g/L at 250 ºC and eventually reaches a plateau at higher
temperatures. Meanwhile, the HMF concentration is highest at 200 ºC (1.2 g/L) and
then decreases by 35% (0.8 g/L) at 250 ºC. As the temperature increases further to
275 ºC and 300 ºC, no HMF was detected in the liquid product.
Figure 5-5: Effect of reaction temperature on HTL of cellulose. Reaction conditions:
microcrystalline cellulose=0.1g, distilled water = 10 mL, initial He pressure at
20 °C = 30 barg, reaction time = 30 min.
During HTL, HMF is produced from cellulose via an acidic reaction pathway
due to the self-disassociation of water to H+ and OH
−. The pKa of water is greatly
influenced by temperature and at 200 ºC, the pH of water is nearly 5 (Yin, Pan and
Tan, 2011), which explains the high concentration of HMF obtained in the current
work. However, when increasing the temperature from 200 ºC to 250 ºC, there was a
significant decrease in the HMF concentration, with the highest concentration in
furfural and levulinic acid recorded. This can be related to the glucose degradation
pathway in Figure 5-4, as HMF may undergo a secondary reaction and produce
furfural and levulinic acid. Asghari and Yoshida, (2006) studied acidic conversion of
200 250 275 300
0.0
1.0
2.0
3.0
4.0
Co
nce
ntr
ati
on
(g
/L)
Temperature (oC)
Furfural
Levulinic acid
HMF
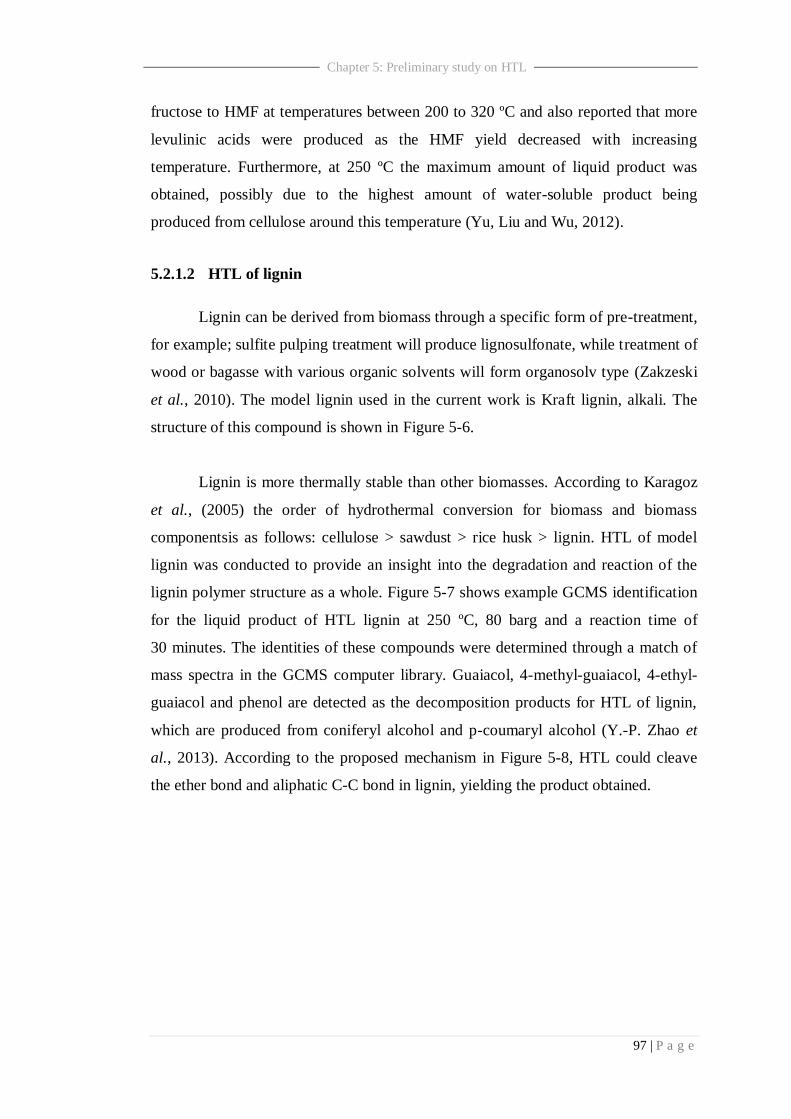
97 | P a g e
Chapter 5: Preliminary study on HTL
fructose to HMF at temperatures between 200 to 320 ºC and also reported that more
levulinic acids were produced as the HMF yield decreased with increasing
temperature. Furthermore, at 250 ºC the maximum amount of liquid product was
obtained, possibly due to the highest amount of water-soluble product being
produced from cellulose around this temperature (Yu, Liu and Wu, 2012).
5.2.1.2 HTL of lignin
Lignin can be derived from biomass through a specific form of pre-treatment,
for example; sulfite pulping treatment will produce lignosulfonate, while treatment of
wood or bagasse with various organic solvents will form organosolv type (Zakzeski
et al., 2010). The model lignin used in the current work is Kraft lignin, alkali. The
structure of this compound is shown in Figure 5-6.
Lignin is more thermally stable than other biomasses. According to Karagoz
et al., (2005) the order of hydrothermal conversion for biomass and biomass
componentsis as follows: cellulose > sawdust > rice husk > lignin. HTL of model
lignin was conducted to provide an insight into the degradation and reaction of the
lignin polymer structure as a whole. Figure 5-7 shows example GCMS identification
for the liquid product of HTL lignin at 250 ºC, 80 barg and a reaction time of
30 minutes. The identities of these compounds were determined through a match of
mass spectra in the GCMS computer library. Guaiacol, 4-methyl-guaiacol, 4-ethyl-
guaiacol and phenol are detected as the decomposition products for HTL of lignin,
which are produced from coniferyl alcohol and p-coumaryl alcohol (Y.-P. Zhao et
al., 2013). According to the proposed mechanism in Figure 5-8, HTL could cleave
the ether bond and aliphatic C-C bond in lignin, yielding the product obtained.
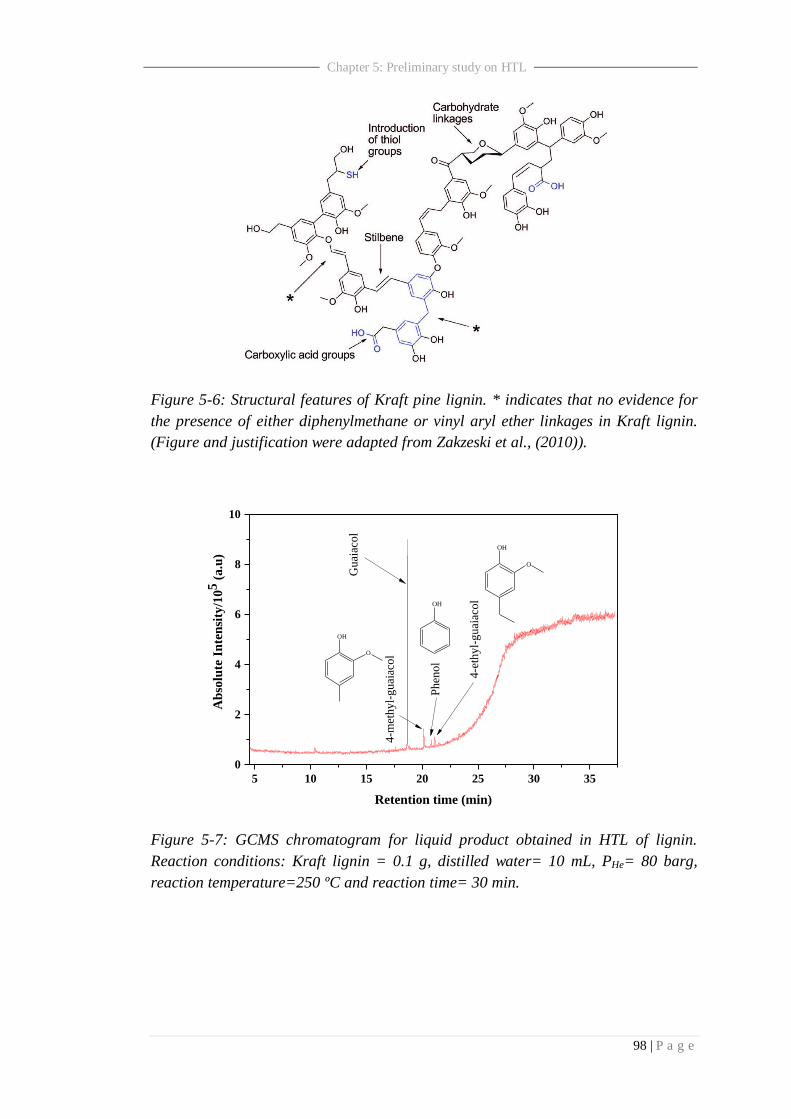
98 | P a g e
Chapter 5: Preliminary study on HTL
Figure 5-6: Structural features of Kraft pine lignin. * indicates that no evidence for
the presence of either diphenylmethane or vinyl aryl ether linkages in Kraft lignin.
(Figure and justification were adapted from Zakzeski et al., (2010)).
Figure 5-7: GCMS chromatogram for liquid product obtained in HTL of lignin.
Reaction conditions: Kraft lignin = 0.1 g, distilled water= 10 mL, PHe= 80 barg,
reaction temperature=250 ºC and reaction time= 30 min.
5 10 15 20 25 30 35
0
2
4
6
8
10
Ab
solu
te I
nte
nsi
ty/1
05
(a.u
)
Retention time (min)
Gu
aiac
ol
Ph
eno
l
4-e
thy
l-g
uai
aco
lOH
OH
O
4-m
eth
yl-
gu
aiac
ol
OH
O
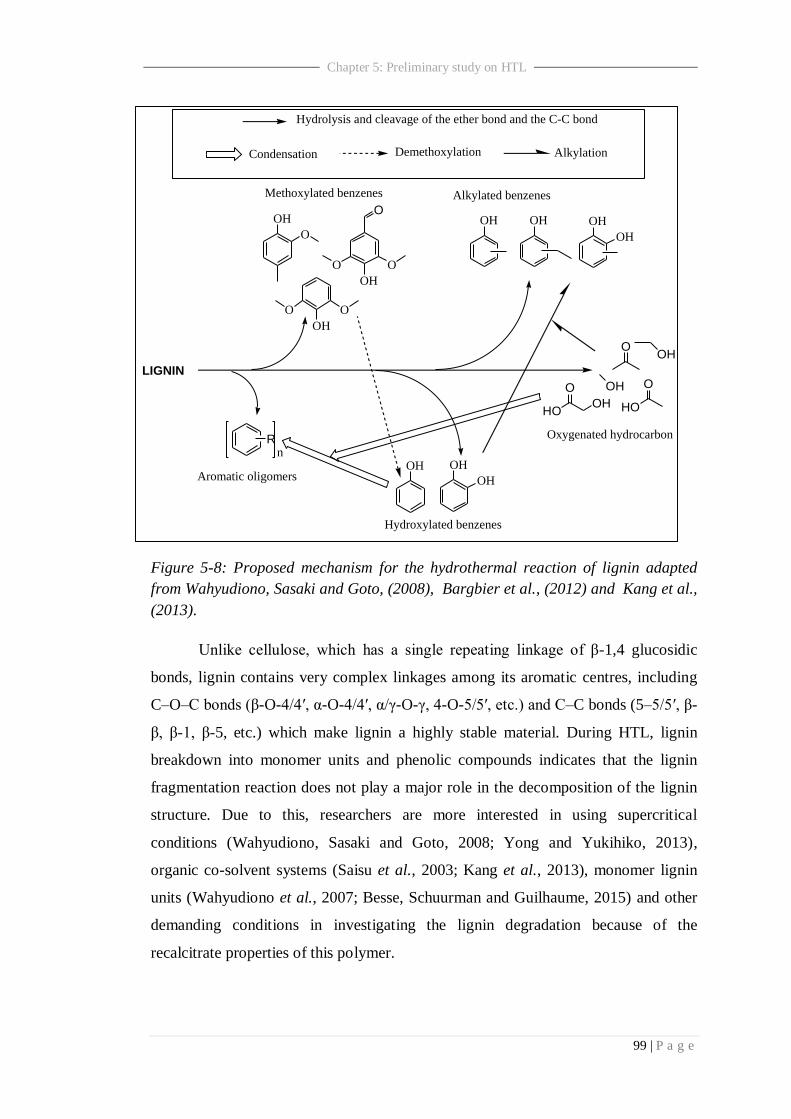
99 | P a g e
Chapter 5: Preliminary study on HTL
Figure 5-8: Proposed mechanism for the hydrothermal reaction of lignin adapted
from Wahyudiono, Sasaki and Goto, (2008), Bargbier et al., (2012) and Kang et al.,
(2013).
Unlike cellulose, which has a single repeating linkage of β-1,4 glucosidic
bonds, lignin contains very complex linkages among its aromatic centres, including
C–O–C bonds (β-O-4/4′, α-O-4/4′, α/γ-O-γ, 4-O-5/5′, etc.) and C–C bonds (5–5/5′, β-
β, β-1, β-5, etc.) which make lignin a highly stable material. During HTL, lignin
breakdown into monomer units and phenolic compounds indicates that the lignin
fragmentation reaction does not play a major role in the decomposition of the lignin
structure. Due to this, researchers are more interested in using supercritical
conditions (Wahyudiono, Sasaki and Goto, 2008; Yong and Yukihiko, 2013),
organic co-solvent systems (Saisu et al., 2003; Kang et al., 2013), monomer lignin
units (Wahyudiono et al., 2007; Besse, Schuurman and Guilhaume, 2015) and other
demanding conditions in investigating the lignin degradation because of the
recalcitrate properties of this polymer.
OH
O
OH
OO
O
OH
OO
Rn
OH OH
OH
OH OH OH
OH
LIGNIN
OH
OH
HO
O
OH HO
O
O
Methoxylated benzenes
Hydroxylated benzenes
Aromatic oligomers
Alkylated benzenes
Oxygenated hydrocarbon
Hydrolysis and cleavage of the ether bond and the C-C bond
Condensation Demethoxylation Alkylation

100 | P a g e
Chapter 5: Preliminary study on HTL
In the current work, HTL of lignin was conducted at three different
temperatures and the results are shown inFigure 5-9. At a temperature of 200 ºC,
only guaiacol is present as water soluble product with a concentration of 30 mg/L. As
the temperature is increased to 250 ºC, depolymerisation of lignin produces
4-ethyl guaiacol (7 mg/L) and phenol (8 mg/L) together with guaiacol (0.2 g/L).
Further increases in temperature to 300 ºC resulting in the concentration of
phenolics increasing to 0.4 g/L, 17 mg/L and 30 mg/L for guaiacol, 4-ethylguaicol
and phenol, respectively. This study indicates that the depolymerisation
(endothermic) of lignin through a hydrolysis reaction can be promoted at a higher
temperature to overcome the activation energy barrier.
Figure 5-9: Effect of reaction temperature in HTL of lignin. Reaction conditions:
Kraft lignin = 0.1 g, distilled water = 10mL, initial He pressure at 20 °C = 30 barg,
reaction time = 30 min.
5.2.2 Binary model system
In order to understand HTL of biomass in more detail, a binary model
biomass system was used. The binary model is a mixture of both cellulose and lignin
in and mimics the composition of real biomass more closely. Figure 5-10 shows an
example of GCMS for the liquid product of HTL of the binary model biomass
system at 250 ºC, 80 barg and at a reaction time of 30 minutes. As can be seen from
the figure, the liquid obtained is a complex mixture of chemical products. Compared
with its separate constituent components (cellulose and lignin) from the earlier single
Lignin 200 Lignin 250 Lignin 3000.0
0.1
0.2
0.3
0.4
Con
cen
trati
on
(g/L
)
Temperature (oC)
Guaiacol
4-ethyl- guaiacol
Phenol
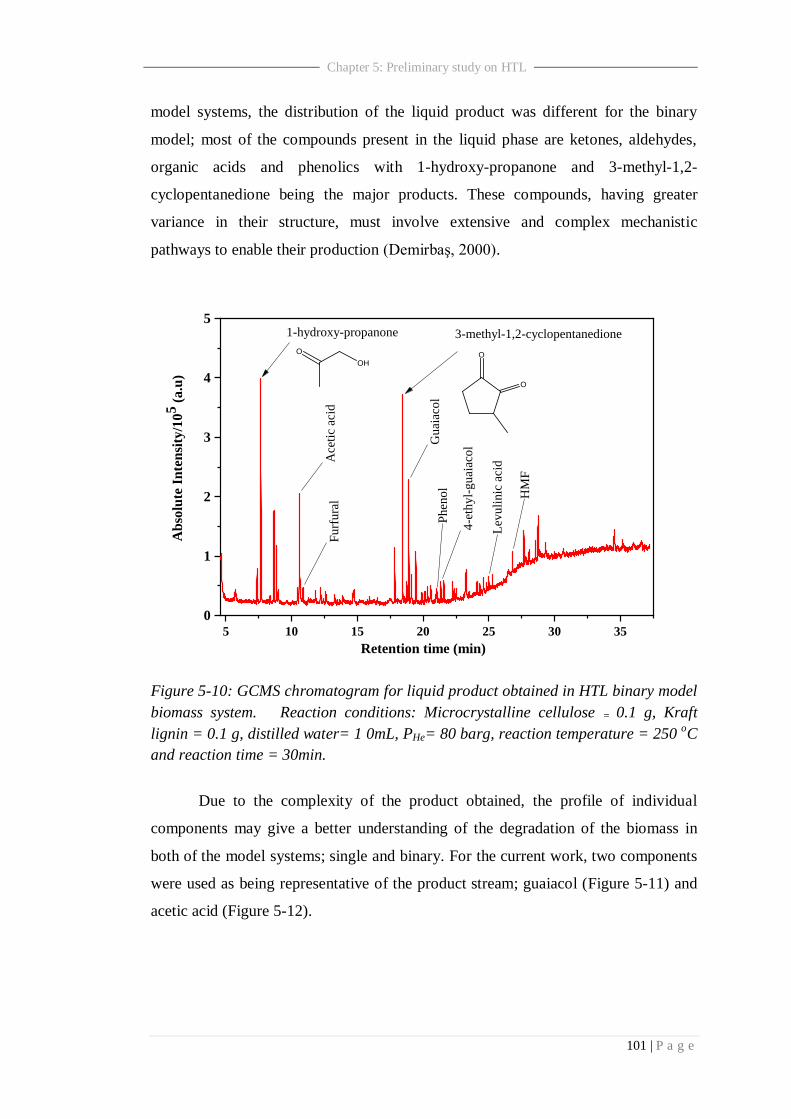
101 | P a g e
Chapter 5: Preliminary study on HTL
model systems, the distribution of the liquid product was different for the binary
model; most of the compounds present in the liquid phase are ketones, aldehydes,
organic acids and phenolics with 1-hydroxy-propanone and 3-methyl-1,2-
cyclopentanedione being the major products. These compounds, having greater
variance in their structure, must involve extensive and complex mechanistic
pathways to enable their production (Demirbaş, 2000).
Figure 5-10: GCMS chromatogram for liquid product obtained in HTL binary model
biomass system. Reaction conditions: Microcrystalline cellulose = 0.1 g, Kraft
lignin = 0.1 g, distilled water= 1 0mL, PHe= 80 barg, reaction temperature = 250 oC
and reaction time = 30min.
Due to the complexity of the product obtained, the profile of individual
components may give a better understanding of the degradation of the biomass in
both of the model systems; single and binary. For the current work, two components
were used as being representative of the product stream; guaiacol (Figure 5-11) and
acetic acid (Figure 5-12).
5 10 15 20 25 30 35
0
1
2
3
4
5
O
O
O
OH
Ab
solu
te I
nte
nsi
ty/1
05 (a
.u)
Retention time (min)
1-hydroxy-propanone 3-methyl-1,2-cyclopentanedioneA
ceti
c ac
idF
urf
ura
l
Gu
aiac
ol
Ph
eno
l
4-e
thy
l-g
uai
aco
l
HM
F
Lev
uli
nic
aci
d
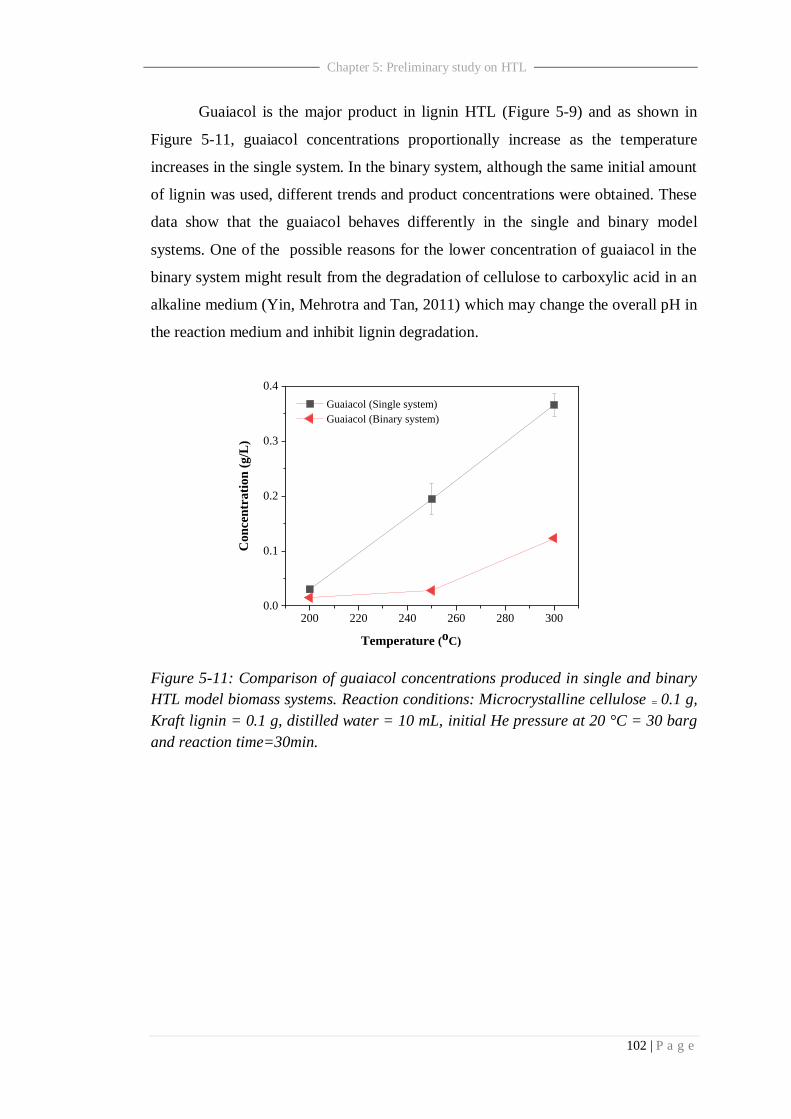
102 | P a g e
Chapter 5: Preliminary study on HTL
Guaiacol is the major product in lignin HTL (Figure 5-9) and as shown in
Figure 5-11, guaiacol concentrations proportionally increase as the temperature
increases in the single system. In the binary system, although the same initial amount
of lignin was used, different trends and product concentrations were obtained. These
data show that the guaiacol behaves differently in the single and binary model
systems. One of the possible reasons for the lower concentration of guaiacol in the
binary system might result from the degradation of cellulose to carboxylic acid in an
alkaline medium (Yin, Mehrotra and Tan, 2011) which may change the overall pH in
the reaction medium and inhibit lignin degradation.
Figure 5-11: Comparison of guaiacol concentrations produced in single and binary
HTL model biomass systems. Reaction conditions: Microcrystalline cellulose = 0.1 g,
Kraft lignin = 0.1 g, distilled water = 10 mL, initial He pressure at 20 °C = 30 barg
and reaction time=30min.
200 220 240 260 280 3000.0
0.1
0.2
0.3
0.4
Co
nce
ntr
ati
on
(g
/L)
Temperature (oC)
Guaiacol (Single system)
Guaiacol (Binary system)

103 | P a g e
Chapter 5: Preliminary study on HTL
Figure 5-12: Comparison of acetic acid concentration produced in single (cellulose)
and binary HTL model biomass systems. Reaction conditions: microcrystalline
cellulose = 0.1 g, Kraft lignin = 0.1 g, distilled water = 10 mL, initial He supply = 30
barg and reaction time=30min.
It has previously been that there are two possible formation mechanisms for
the acidic derivatives during liquefaction of biomass: i) cellulose is hydrolysed to
produce furan derivatives and the further decomposition of these products leads to
the formation of acetic fragments which a source for the acidic compounds; ii) small
functional groups cracked from lignin monomers could also be the sources of acidic
compounds (Karagöz et al., 2004; Y.-P. Zhao et al., 2013).
Figure 5-12 shows the comparison on acetic acid concentration produce in
HTL of cellulose and HTL of binary model biomass system. In single system, acetic
acid concentration decrease by 2 % at 250 °C ( 119 mg/L) compare to temperature
200 ºC (122 mg/L) and further increase in reaction temperature to 275 ºC the
concentration drop by 17% to 98 mg/L. At temperature 300 °C, lowest concentration
was recorded for acetic acid in single system at 90 mg/L. Meanwhile, for binary
system, increase temperature from 250 °C to 300 °C acetic acid concentration
increased by 3%, to 82 mg/L from 79 mg/L. The possible explanation for these
phenomena is that acetic acid production in the single system might only depend on
the breakdown of glucose monomer which may fully decompose as temperature
increase. Meanwhile, for a binary system, this compound may result from both
200 220 240 260 280 300
0.08
0.10
0.12
0.14
Con
cen
tra
tio
n (
g/L
)
Temperature (oC)
Acetic acid (Single system)
Acetic acid (Binary system)
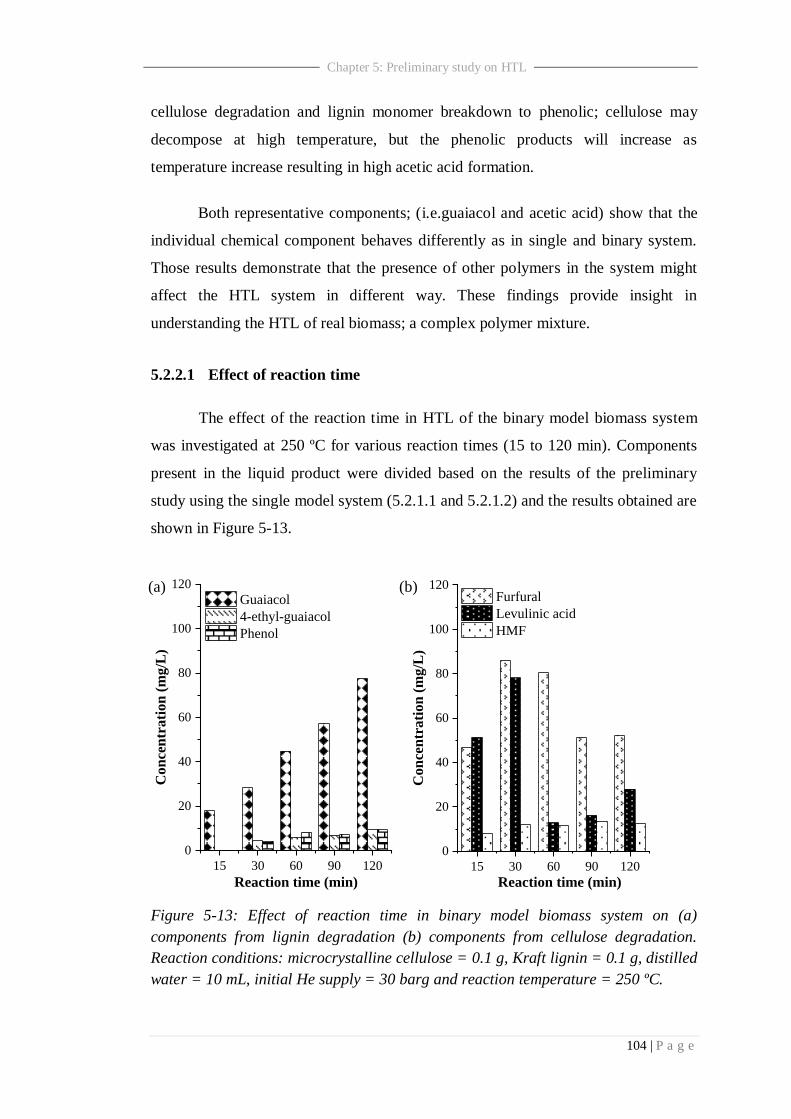
104 | P a g e
Chapter 5: Preliminary study on HTL
cellulose degradation and lignin monomer breakdown to phenolic; cellulose may
decompose at high temperature, but the phenolic products will increase as
temperature increase resulting in high acetic acid formation.
Both representative components; (i.e.guaiacol and acetic acid) show that the
individual chemical component behaves differently as in single and binary system.
Those results demonstrate that the presence of other polymers in the system might
affect the HTL system in different way. These findings provide insight in
understanding the HTL of real biomass; a complex polymer mixture.
5.2.2.1 Effect of reaction time
The effect of the reaction time in HTL of the binary model biomass system
was investigated at 250 ºC for various reaction times (15 to 120 min). Components
present in the liquid product were divided based on the results of the preliminary
study using the single model system (5.2.1.1 and 5.2.1.2) and the results obtained are
shown in Figure 5-13.
Figure 5-13: Effect of reaction time in binary model biomass system on (a)
components from lignin degradation (b) components from cellulose degradation.
Reaction conditions: microcrystalline cellulose = 0.1 g, Kraft lignin = 0.1 g, distilled
water = 10 mL, initial He supply = 30 barg and reaction temperature = 250 ºC.
15 30 60 90 120
0
20
40
60
80
100
120
Con
cen
trati
on
(m
g/L
)
Reaction time (min)
Guaiacol
4-ethyl-guaiacol
Phenol
(a) (b)
15 30 60 90 120
0
20
40
60
80
100
120
Con
cen
trati
on
(m
g/L
)
Reaction time (min)
Furfural
Levulinic acid
HMF
105 | P a g e
Chapter 5: Preliminary study on HTL
Figure 5-13 (a) shows the concentration for guaiacol, 4-ethylguaiacol and
phenol obtained in the binary model liquid product over time. At 15 min reaction
time, only guaiacol is present as a lignin fragmentation product but when the reaction
time increases from 30 min to 120 min, all three phenolics show an increase in their
concentration with time. A similar trend was obtained by Wahyudiono, Sasaki and
Goto (2008); the authors studied the lignin decomposition at times ranging from
0 to 250 min and reported that yields of phenol, m,p-cresol and o-cresol increased
gradually with the reaction time. However, Pińkowska, Wolak and Złocińska, (2012)
reported that for alkali lignin hydrothermal decomposition, the yields of phenol and
creosol isomers did not proportionally change with time, which was probably due to
gasification and/or repolymerisation.
Figure 5-13 (b) shows the concentration of furfural, levulinic acid and HMF
over the reaction time as a result of the HTL of the binary model biomass. These
three components are the major compounds detected in cellulose degradation in the
single system, so it is interesting to study details of these components. The results
show that the reaction time affects the individual components differently. For
furfural, the maximum concentration is obtained at 30 min reaction time (86 mg/L)
and decreases substantially with further increases in time. For HMF, the
concentration increased by 50 % to 12 mg/L after changing the reaction time from 15
min to 30 min and reached a plateau after that time. For levulinic acid, a high
concentration was obtained at a reaction time of 15 min (50 mg/L) whilst the
optimum concentration was obtained at 30 min (78 mg/L). Furthering increases to
the reaction time after this point saw the concentration of the levulinic acid
drastically decrease. However, at longer times still, the levulinic acid concentration
starts to increase again. Overall, a reaction time of 30 min appears to be optimum for
production of furfural, levulinic acid and HMF in the binary model system.
Relating to the mechanism for glucose degradation in Figure 5-4, HMF will
undergo a secondary reaction to produce furfural and levulinic acid in the aqueous
solution. However, in the current work, the addition of alkali lignin into the binary
system may change the reaction pathway for the glucose. Figure 5-14 show a
simplified schematic of the acidic and alkali pathways of the hydrothermal
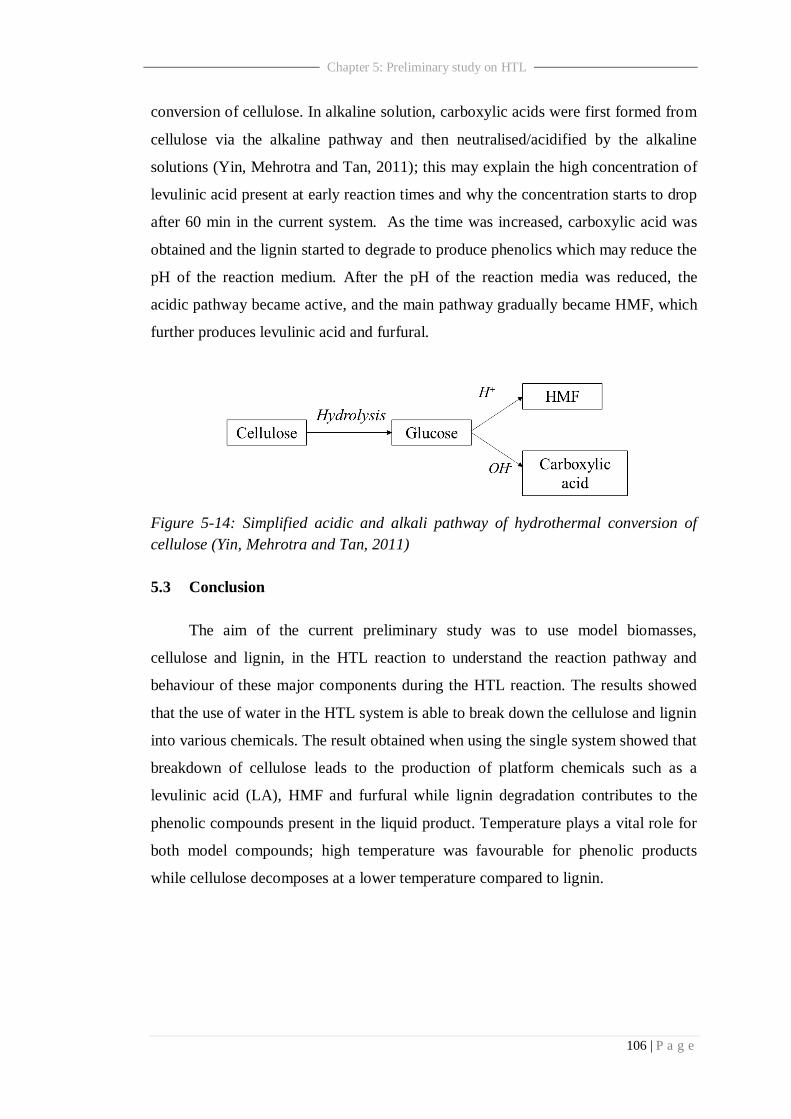
106 | P a g e
Chapter 5: Preliminary study on HTL
conversion of cellulose. In alkaline solution, carboxylic acids were first formed from
cellulose via the alkaline pathway and then neutralised/acidified by the alkaline
solutions (Yin, Mehrotra and Tan, 2011); this may explain the high concentration of
levulinic acid present at early reaction times and why the concentration starts to drop
after 60 min in the current system. As the time was increased, carboxylic acid was
obtained and the lignin started to degrade to produce phenolics which may reduce the
pH of the reaction medium. After the pH of the reaction media was reduced, the
acidic pathway became active, and the main pathway gradually became HMF, which
further produces levulinic acid and furfural.
Figure 5-14: Simplified acidic and alkali pathway of hydrothermal conversion of
cellulose (Yin, Mehrotra and Tan, 2011)
5.3 Conclusion
The aim of the current preliminary study was to use model biomasses,
cellulose and lignin, in the HTL reaction to understand the reaction pathway and
behaviour of these major components during the HTL reaction. The results showed
that the use of water in the HTL system is able to break down the cellulose and lignin
into various chemicals. The result obtained when using the single system showed that
breakdown of cellulose leads to the production of platform chemicals such as a
levulinic acid (LA), HMF and furfural while lignin degradation contributes to the
phenolic compounds present in the liquid product. Temperature plays a vital role for
both model compounds; high temperature was favourable for phenolic products
while cellulose decomposes at a lower temperature compared to lignin.

107 | P a g e
Chapter 5: Preliminary study on HTL
The binary model system was used to mimic real biomass and it shows that by
having a complex polymer in the system, a complex mixture of chemical products is
obtained. Due to the greater variance in the product obtained, the HTL binary model
reaction system must involve extensive and complex mechanistic pathways. An
example has been given to show that each compound may be involved in different
reaction pathways compared to the single model reaction.
CHAPTER 6
A CASE STUDY:
HYDROTHERMAL
LIQUEFACTION (HTL)
OF BREWER’S SPENT
GRAIN (BSG)

109 | P a g e
Chapter 6: HTL of BSG
6. Chapter 6: HTL of BSG
6.0 Introduction
In Chapter 5, cellulose and lignin were used as model system to mimic
lignocellulosic biomass and applied in HTL. It was shown that HTL converted
cellulose into three product major product; namely furfural, levulinic acid (LA) and
hydromethylfurfural (HMF). Thermal degradation of lignin in hot compressed water
is believed to proceed via cleavage of the ether and methylene bridge connecting the
structural units, thereby producing phenolic compounds in the liquefied product. By
combining both model compounds, the product distribution showed a different
pattern from the single component systems as a result of the chemical properties of
both polymers. The potential of HTL to break down the lignocellulosic compounds
was therefore demonstrated.
The liquefaction of model biomass compounds can inform the selection of
experimental parameters and provide the necessary theoretical basis for liquefaction
of biomass. However, the composition of real biomass is more complex than a binary
mixture of lignin and cellulose and its mechanism of transformation is not yet clear
(Gao et al., 2011). In this chapter, HTL was conducted using raw BSG investigating
the product distribution and compared with the biomass model system. The
conversion, water-soluble oil (WSO) product and total product quantity were also
reported. Two different aspects have been investigated:
i) Liquid product distribution
ii) Effect of reaction time on BSG HTL
To the author‘s best knowledge, this reaction system which involves raw BSG
as real biomass in direct HTL process is reported here for the first time.
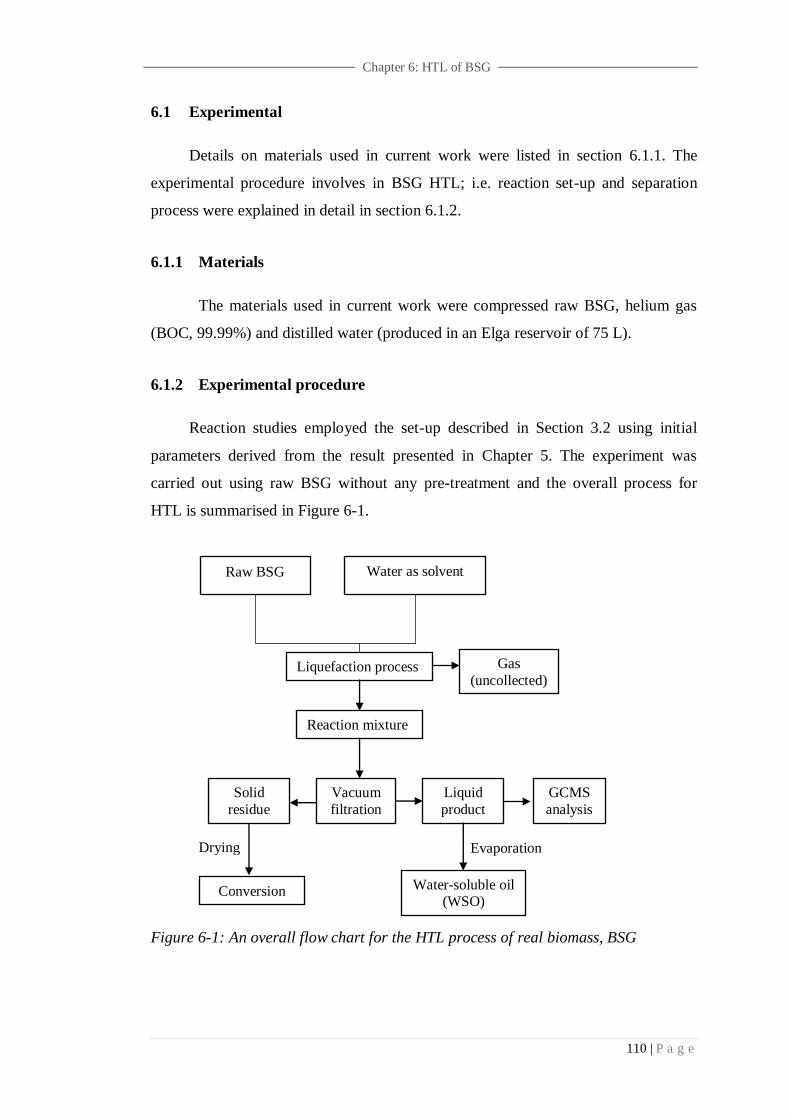
110 | P a g e
Chapter 6: HTL of BSG
6.1 Experimental
Details on materials used in current work were listed in section 6.1.1. The
experimental procedure involves in BSG HTL; i.e. reaction set-up and separation
process were explained in detail in section 6.1.2.
6.1.1 Materials
The materials used in current work were compressed raw BSG, helium gas
(BOC, 99.99%) and distilled water (produced in an Elga reservoir of 75 L).
6.1.2 Experimental procedure
Reaction studies employed the set-up described in Section 3.2 using initial
parameters derived from the result presented in Chapter 5. The experiment was
carried out using raw BSG without any pre-treatment and the overall process for
HTL is summarised in Figure 6-1.
Figure 6-1: An overall flow chart for the HTL process of real biomass, BSG
Raw BSG Water as solvent
Liquefaction process
Reaction mixture
Vacuum
filtration Liquid
product GCMS
analysis
Water-soluble oil (WSO)
Solid
residue
Conversion
Drying Evaporation
Gas
(uncollected)
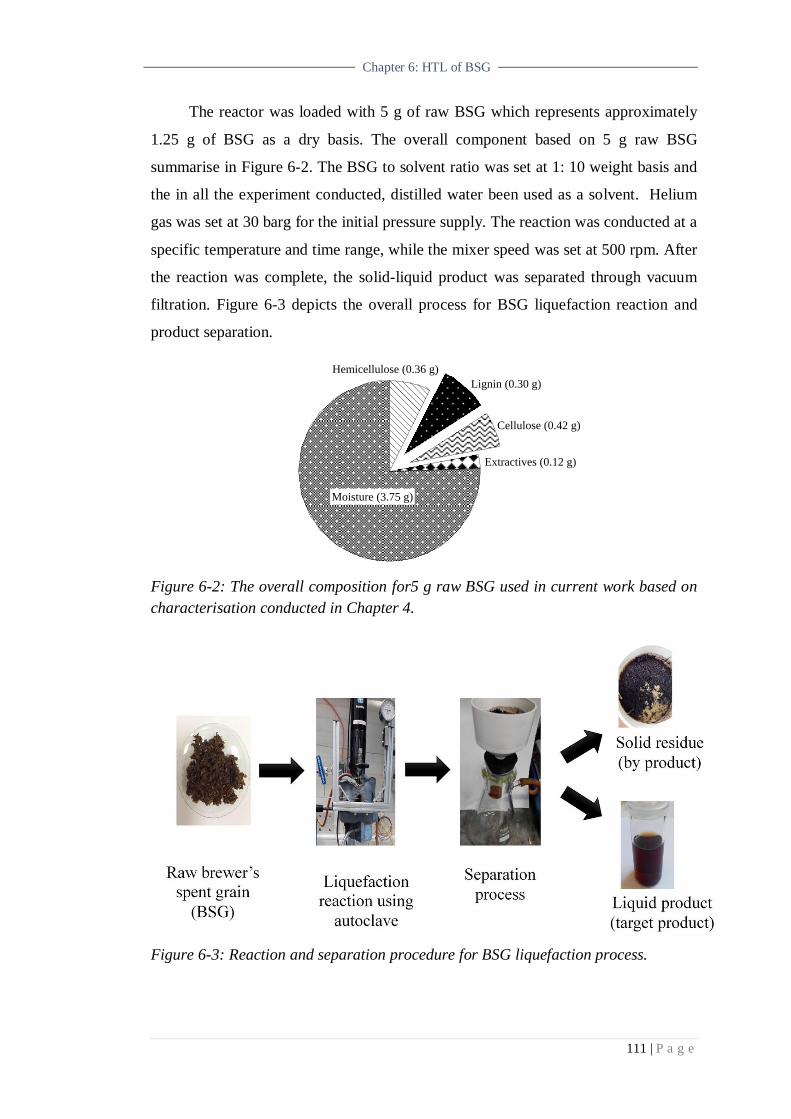
111 | P a g e
Chapter 6: HTL of BSG
The reactor was loaded with 5 g of raw BSG which represents approximately
1.25 g of BSG as a dry basis. The overall component based on 5 g raw BSG
summarise in Figure 6-2. The BSG to solvent ratio was set at 1: 10 weight basis and
the in all the experiment conducted, distilled water been used as a solvent. Helium
gas was set at 30 barg for the initial pressure supply. The reaction was conducted at a
specific temperature and time range, while the mixer speed was set at 500 rpm. After
the reaction was complete, the solid-liquid product was separated through vacuum
filtration. Figure 6-3 depicts the overall process for BSG liquefaction reaction and
product separation.
Figure 6-2: The overall composition for5 g raw BSG used in current work based on
characterisation conducted in Chapter 4.
Figure 6-3: Reaction and separation procedure for BSG liquefaction process.
Lignin (0.30 g)
Cellulose (0.42 g)
Extractives (0.12 g)
Hemicellulose (0.36 g)
Moisture (3.75 g)

112 | P a g e
Chapter 6: HTL of BSG
6.2 Product analysis
After the separation process, water-soluble fraction was taken as a liquid
product and the solid residue was used to determine the residue and conversion yield.
Details on liquid product analysis were explained in Section 6.2.1 while, the solid
residue recovery process were elaborated in Section 6.2.2.
6.2.1 Liquid products
The liquid product obtained after the separation stage was used for product
identification using GCMS without further modification. This liquid product is
typically malodorous and dark in colour (Figure 6-4). The second filtration using
microsyringe filter was conducted towards the liquid product before the sample was
injected to GCMS. This step is to remove the remaining solid particles in the liquid
product and to make sure that only liquid sample was injected in GCMS. The
presence of the solid particle in the injected sample can cause damage to the GC
column. The column used for the current analysis is HP-INNO-wax, and the details
on the procedure taken are discussed in Section 5.1.3.1.
The recovered liquid product after the GCMS analysis underwent evaporation to
obtain the bio-oil, in current work defined as water-soluble oil (WSO). The water
was evaporated by heating in the oil bath or by using direct heating on the hot plate
at temperature of 100 ºC. With the intention of calculating the WSO yield, the weight
of the empty flask or beaker was recorded prior to the process and the liquid product.
The weight difference of the flask before and after the process was used to determine
the amount of the WSO obtained. Figure 6-4 shows the liquid product and the WSO
obtained after the evaporation process. It should be noted that the WSO obtained
after the evaporation process was not recovered as the bio-oil is highly viscous and
strongly adheres to the wall of the container (Figure 6-4). This however is not the
limitation in the research as:
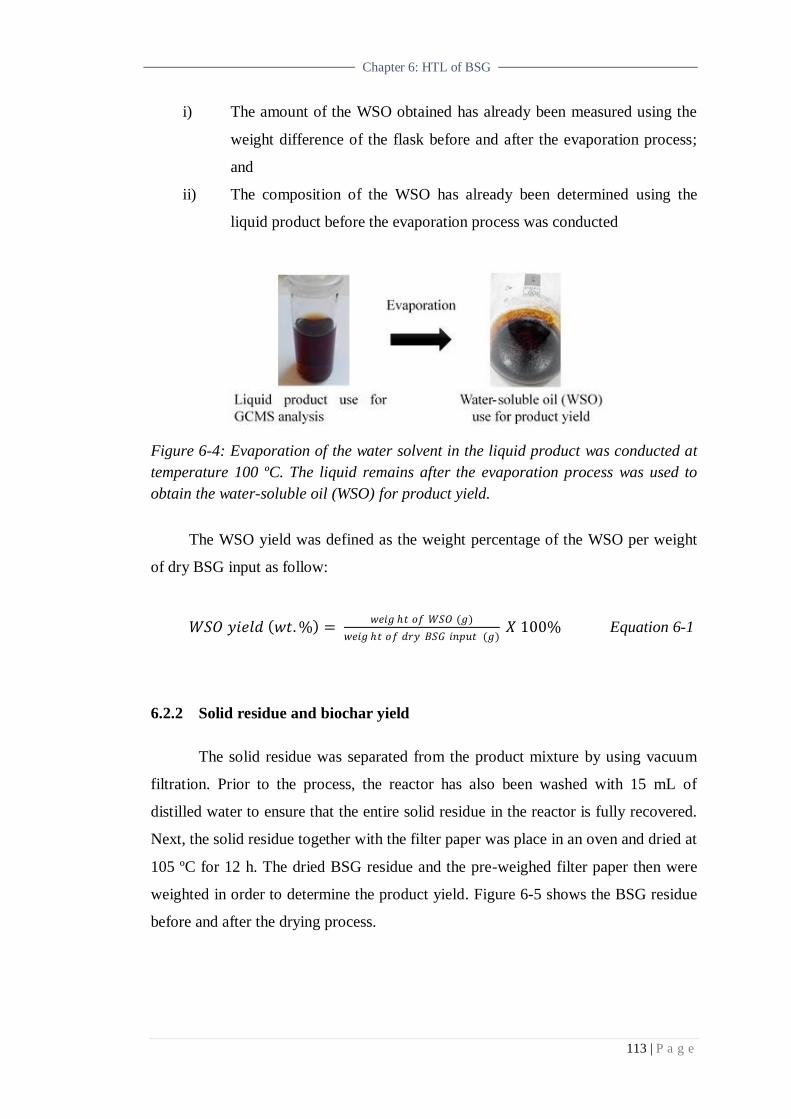
113 | P a g e
Chapter 6: HTL of BSG
i) The amount of the WSO obtained has already been measured using the
weight difference of the flask before and after the evaporation process;
and
ii) The composition of the WSO has already been determined using the
liquid product before the evaporation process was conducted
Figure 6-4: Evaporation of the water solvent in the liquid product was conducted at
temperature 100 ºC. The liquid remains after the evaporation process was used to
obtain the water-soluble oil (WSO) for product yield.
The WSO yield was defined as the weight percentage of the WSO per weight
of dry BSG input as follow:
𝑊𝑆𝑂 𝑦𝑖𝑒𝑙𝑑 𝑤𝑡. % = 𝑤𝑒𝑖𝑔 𝑡 𝑜𝑓 𝑊𝑆𝑂 (𝑔)
𝑤𝑒𝑖𝑔 𝑡 𝑜𝑓 𝑑𝑟𝑦 𝐵𝑆𝐺 𝑖𝑛𝑝𝑢𝑡 (𝑔) 𝑋 100% Equation 6-1
6.2.2 Solid residue and biochar yield
The solid residue was separated from the product mixture by using vacuum
filtration. Prior to the process, the reactor has also been washed with 15 mL of
distilled water to ensure that the entire solid residue in the reactor is fully recovered.
Next, the solid residue together with the filter paper was place in an oven and dried at
105 ºC for 12 h. The dried BSG residue and the pre-weighed filter paper then were
weighted in order to determine the product yield. Figure 6-5 shows the BSG residue
before and after the drying process.
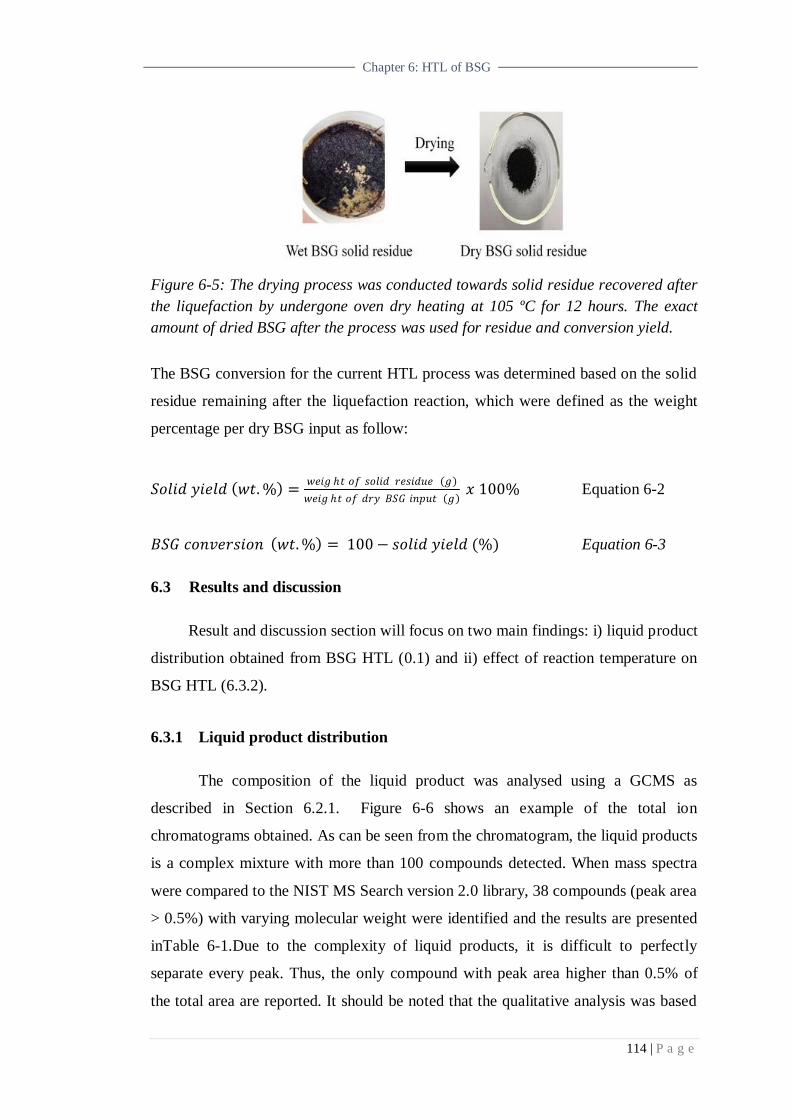
114 | P a g e
Chapter 6: HTL of BSG
Figure 6-5: The drying process was conducted towards solid residue recovered after
the liquefaction by undergone oven dry heating at 105 ºC for 12 hours. The exact
amount of dried BSG after the process was used for residue and conversion yield.
The BSG conversion for the current HTL process was determined based on the solid
residue remaining after the liquefaction reaction, which were defined as the weight
percentage per dry BSG input as follow:
𝑆𝑜𝑙𝑖𝑑 𝑦𝑖𝑒𝑙𝑑 𝑤𝑡. % =𝑤𝑒𝑖𝑔 𝑡 𝑜𝑓 𝑠𝑜𝑙𝑖𝑑 𝑟𝑒𝑠𝑖𝑑𝑢𝑒 𝑔
𝑤𝑒𝑖𝑔 𝑡 𝑜𝑓 𝑑𝑟𝑦 𝐵𝑆𝐺 𝑖𝑛𝑝𝑢𝑡 𝑔 𝑥 100% Equation 6-2
𝐵𝑆𝐺 𝑐𝑜𝑛𝑣𝑒𝑟𝑠𝑖𝑜𝑛 𝑤𝑡. % = 100 − 𝑠𝑜𝑙𝑖𝑑 𝑦𝑖𝑒𝑙𝑑 (%) Equation 6-3
6.3 Results and discussion
Result and discussion section will focus on two main findings: i) liquid product
distribution obtained from BSG HTL (0.1) and ii) effect of reaction temperature on
BSG HTL (6.3.2).
6.3.1 Liquid product distribution
The composition of the liquid product was analysed using a GCMS as
described in Section 6.2.1. Figure 6-6 shows an example of the total ion
chromatograms obtained. As can be seen from the chromatogram, the liquid products
is a complex mixture with more than 100 compounds detected. When mass spectra
were compared to the NIST MS Search version 2.0 library, 38 compounds (peak area
> 0.5%) with varying molecular weight were identified and the results are presented
inTable 6-1.Due to the complexity of liquid products, it is difficult to perfectly
separate every peak. Thus, the only compound with peak area higher than 0.5% of
the total area are reported. It should be noted that the qualitative analysis was based
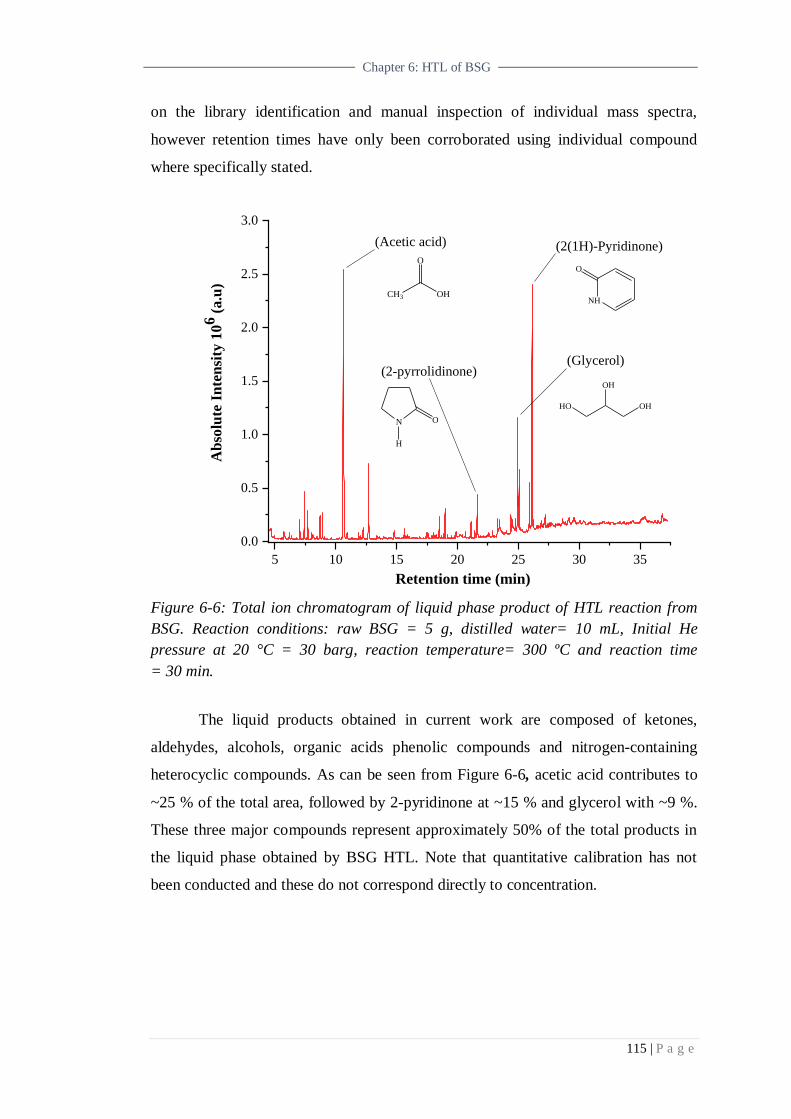
115 | P a g e
Chapter 6: HTL of BSG
on the library identification and manual inspection of individual mass spectra,
however retention times have only been corroborated using individual compound
where specifically stated.
Figure 6-6: Total ion chromatogram of liquid phase product of HTL reaction from
BSG. Reaction conditions: raw BSG = 5 g, distilled water= 10 mL, Initial He
pressure at 20 °C = 30 barg, reaction temperature= 300 ºC and reaction time
= 30 min.
The liquid products obtained in current work are composed of ketones,
aldehydes, alcohols, organic acids phenolic compounds and nitrogen-containing
heterocyclic compounds. As can be seen from Figure 6-6, acetic acid contributes to
~25 % of the total area, followed by 2-pyridinone at ~15 % and glycerol with ~9 %.
These three major compounds represent approximately 50% of the total products in
the liquid phase obtained by BSG HTL. Note that quantitative calibration has not
been conducted and these do not correspond directly to concentration.
5 10 15 20 25 30 35
0.0
0.5
1.0
1.5
2.0
2.5
3.0
CH3 OH
O
N
H
O
HO OH
OH
Ab
solu
te I
nte
nsi
ty 1
06 (
a.u
)
Retention time (min)
(Acetic acid)
(2-pyrrolidinone)(Glycerol)
(2(1H)-Pyridinone)
NH
O
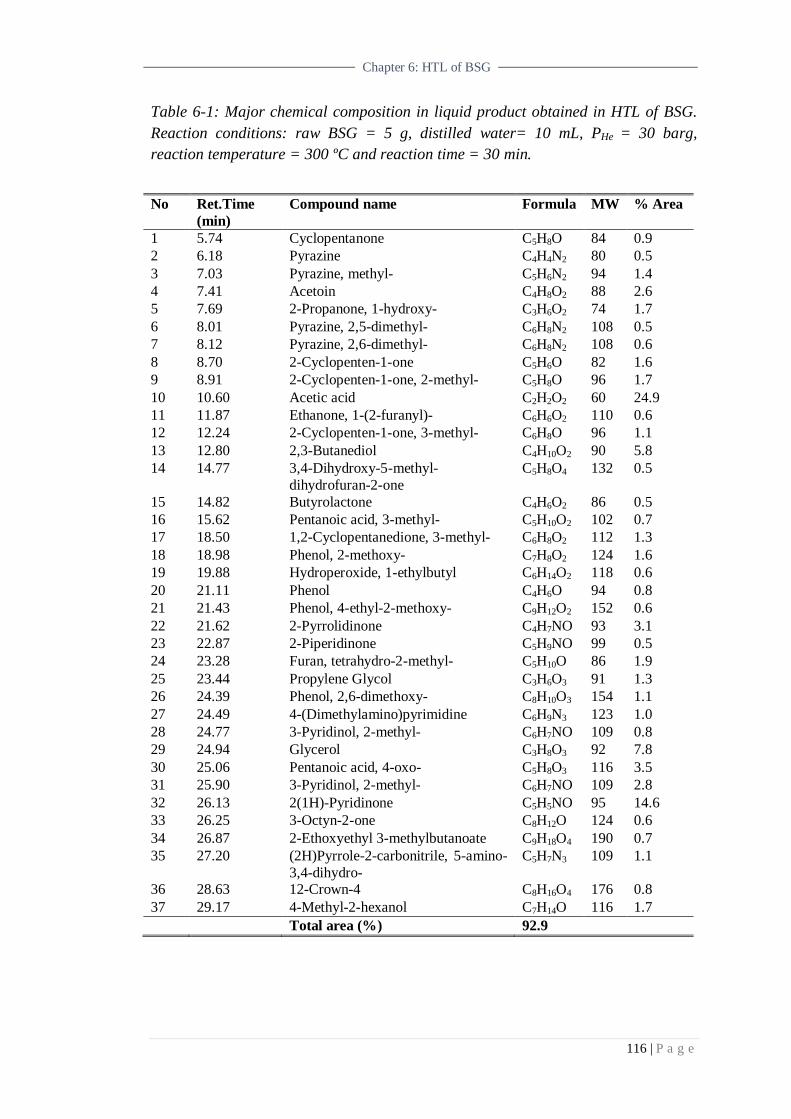
116 | P a g e
Chapter 6: HTL of BSG
Table 6-1: Major chemical composition in liquid product obtained in HTL of BSG.
Reaction conditions: raw BSG = 5 g, distilled water= 10 mL, PHe = 30 barg,
reaction temperature = 300 ºC and reaction time = 30 min.
No Ret.Time
(min)
Compound name Formula MW % Area
1 5.74 Cyclopentanone C5H8O 84 0.9
2 6.18 Pyrazine C4H4N2 80 0.5
3 7.03 Pyrazine, methyl- C5H6N2 94 1.4
4 7.41 Acetoin C4H8O2 88 2.6
5 7.69 2-Propanone, 1-hydroxy- C3H6O2 74 1.7
6 8.01 Pyrazine, 2,5-dimethyl- C6H8N2 108 0.5
7 8.12 Pyrazine, 2,6-dimethyl- C6H8N2 108 0.6
8 8.70 2-Cyclopenten-1-one C5H6O 82 1.6
9 8.91 2-Cyclopenten-1-one, 2-methyl- C5H8O 96 1.7
10 10.60 Acetic acid C2H2O2 60 24.9
11 11.87 Ethanone, 1-(2-furanyl)- C6H6O2 110 0.6
12 12.24 2-Cyclopenten-1-one, 3-methyl- C6H8O 96 1.1
13 12.80 2,3-Butanediol C4H10O2 90 5.8
14 14.77 3,4-Dihydroxy-5-methyl-
dihydrofuran-2-one
C5H8O4 132 0.5
15 14.82 Butyrolactone C4H6O2 86 0.5
16 15.62 Pentanoic acid, 3-methyl- C5H10O2 102 0.7
17 18.50 1,2-Cyclopentanedione, 3-methyl- C6H8O2 112 1.3
18 18.98 Phenol, 2-methoxy- C7H8O2 124 1.6
19 19.88 Hydroperoxide, 1-ethylbutyl C6H14O2 118 0.6
20 21.11 Phenol C4H6O 94 0.8
21 21.43 Phenol, 4-ethyl-2-methoxy- C9H12O2 152 0.6
22 21.62 2-Pyrrolidinone C4H7NO 93 3.1
23 22.87 2-Piperidinone C5H9NO 99 0.5
24 23.28 Furan, tetrahydro-2-methyl- C5H10O 86 1.9
25 23.44 Propylene Glycol C3H6O3 91 1.3
26 24.39 Phenol, 2,6-dimethoxy- C8H10O3 154 1.1
27 24.49 4-(Dimethylamino)pyrimidine C6H9N3 123 1.0
28 24.77 3-Pyridinol, 2-methyl- C6H7NO 109 0.8
29 24.94 Glycerol C3H8O3 92 7.8
30 25.06 Pentanoic acid, 4-oxo- C5H8O3 116 3.5
31 25.90 3-Pyridinol, 2-methyl- C6H7NO 109 2.8
32 26.13 2(1H)-Pyridinone C5H5NO 95 14.6
33 26.25 3-Octyn-2-one C8H12O 124 0.6
34 26.87 2-Ethoxyethyl 3-methylbutanoate C9H18O4 190 0.7
35 27.20 (2H)Pyrrole-2-carbonitrile, 5-amino-
3,4-dihydro-
C5H7N3 109 1.1
36 28.63 12-Crown-4 C8H16O4 176 0.8
37 29.17 4-Methyl-2-hexanol C7H14O 116 1.7
Total area (%) 92.9
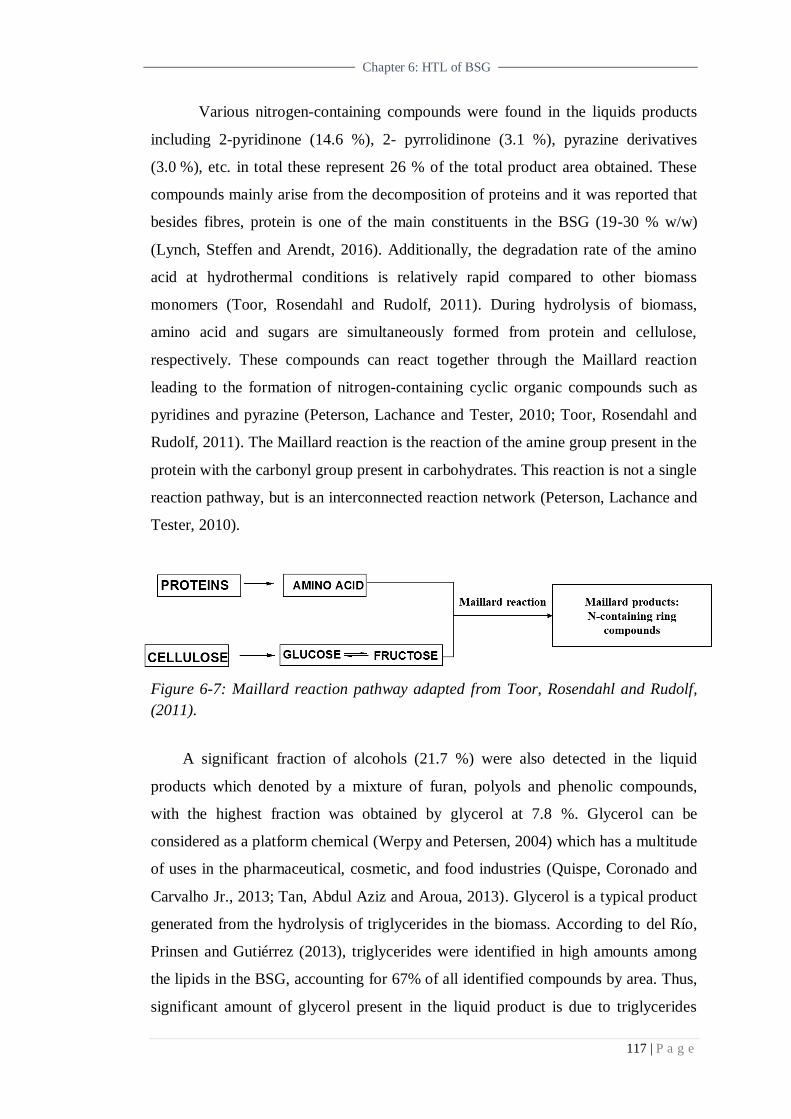
117 | P a g e
Chapter 6: HTL of BSG
Various nitrogen-containing compounds were found in the liquids products
including 2-pyridinone (14.6 %), 2- pyrrolidinone (3.1 %), pyrazine derivatives
(3.0 %), etc. in total these represent 26 % of the total product area obtained. These
compounds mainly arise from the decomposition of proteins and it was reported that
besides fibres, protein is one of the main constituents in the BSG (19-30 % w/w)
(Lynch, Steffen and Arendt, 2016). Additionally, the degradation rate of the amino
acid at hydrothermal conditions is relatively rapid compared to other biomass
monomers (Toor, Rosendahl and Rudolf, 2011). During hydrolysis of biomass,
amino acid and sugars are simultaneously formed from protein and cellulose,
respectively. These compounds can react together through the Maillard reaction
leading to the formation of nitrogen-containing cyclic organic compounds such as
pyridines and pyrazine (Peterson, Lachance and Tester, 2010; Toor, Rosendahl and
Rudolf, 2011). The Maillard reaction is the reaction of the amine group present in the
protein with the carbonyl group present in carbohydrates. This reaction is not a single
reaction pathway, but is an interconnected reaction network (Peterson, Lachance and
Tester, 2010).
Figure 6-7: Maillard reaction pathway adapted from Toor, Rosendahl and Rudolf,
(2011).
A significant fraction of alcohols (21.7 %) were also detected in the liquid
products which denoted by a mixture of furan, polyols and phenolic compounds,
with the highest fraction was obtained by glycerol at 7.8 %. Glycerol can be
considered as a platform chemical (Werpy and Petersen, 2004) which has a multitude
of uses in the pharmaceutical, cosmetic, and food industries (Quispe, Coronado and
Carvalho Jr., 2013; Tan, Abdul Aziz and Aroua, 2013). Glycerol is a typical product
generated from the hydrolysis of triglycerides in the biomass. According to del Río,
Prinsen and Gutiérrez (2013), triglycerides were identified in high amounts among
the lipids in the BSG, accounting for 67% of all identified compounds by area. Thus,
significant amount of glycerol present in the liquid product is due to triglycerides
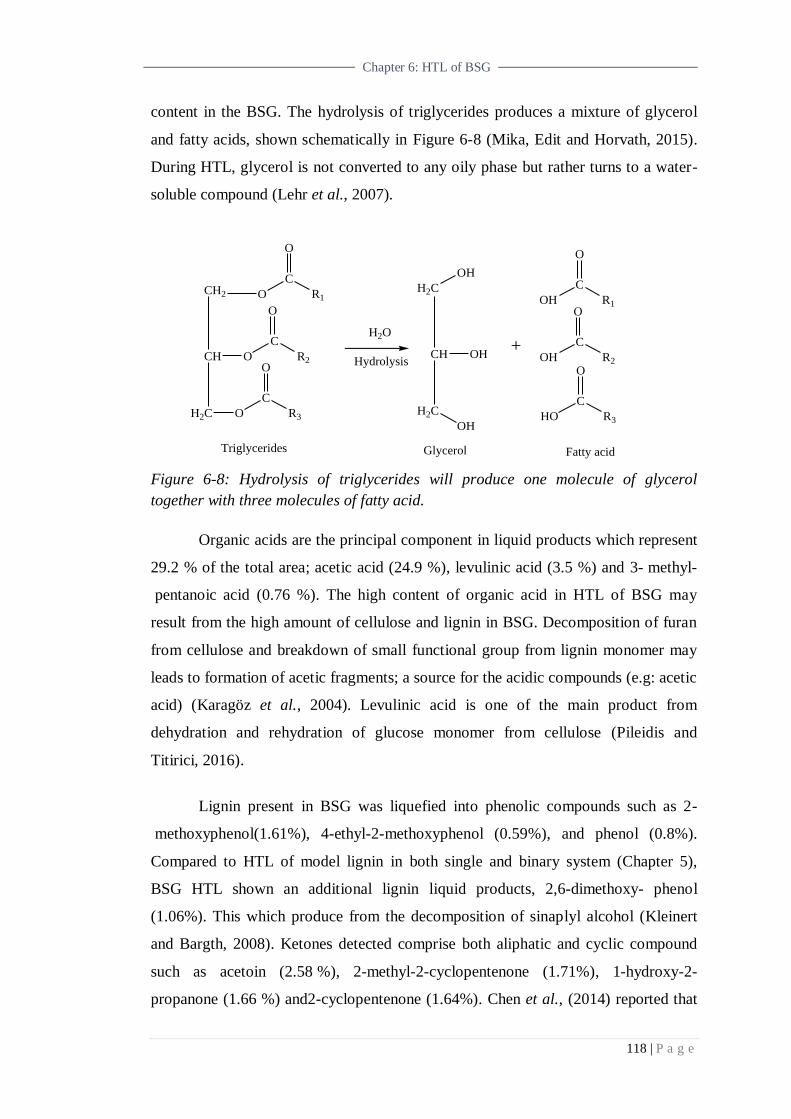
118 | P a g e
Chapter 6: HTL of BSG
content in the BSG. The hydrolysis of triglycerides produces a mixture of glycerol
and fatty acids, shown schematically in Figure 6-8 (Mika, Edit and Horvath, 2015).
During HTL, glycerol is not converted to any oily phase but rather turns to a water-
soluble compound (Lehr et al., 2007).
C
O
CH2
CH
O
H2C
O
O
C
R2
O
C
R3
O
R1
H2O
H2C
CH
H2C
OH
OH
OH
C
O
OH
OH
C
R2
O
C
R3
O
R1
HO
Hydrolysis
Triglycerides Glycerol Fatty acid
+
Figure 6-8: Hydrolysis of triglycerides will produce one molecule of glycerol
together with three molecules of fatty acid.
Organic acids are the principal component in liquid products which represent
29.2 % of the total area; acetic acid (24.9 %), levulinic acid (3.5 %) and 3- methyl-
pentanoic acid (0.76 %). The high content of organic acid in HTL of BSG may
result from the high amount of cellulose and lignin in BSG. Decomposition of furan
from cellulose and breakdown of small functional group from lignin monomer may
leads to formation of acetic fragments; a source for the acidic compounds (e.g: acetic
acid) (Karagöz et al., 2004). Levulinic acid is one of the main product from
dehydration and rehydration of glucose monomer from cellulose (Pileidis and
Titirici, 2016).
Lignin present in BSG was liquefied into phenolic compounds such as 2-
methoxyphenol(1.61%), 4-ethyl-2-methoxyphenol (0.59%), and phenol (0.8%).
Compared to HTL of model lignin in both single and binary system (Chapter 5),
BSG HTL shown an additional lignin liquid products, 2,6-dimethoxy- phenol
(1.06%). This which produce from the decomposition of sinaplyl alcohol (Kleinert
and Bargth, 2008). Ketones detected comprise both aliphatic and cyclic compound
such as acetoin (2.58 %), 2-methyl-2-cyclopentenone (1.71%), 1-hydroxy-2-
propanone (1.66 %) and2-cyclopentenone (1.64%). Chen et al., (2014) reported that

119 | P a g e
Chapter 6: HTL of BSG
ketones were primarily derived from monosaccharides generated from the
decomposition of holocellulose, however they may transform to alcohols and acids
since they are relatively unstable under hydrothermal condition.
As to the product obtained is a complex mixture, it is challenging to measure
each compound quantitatively. In an effort to evaluate the HTL of BSG in current
work, the quantitative analysis was conducted to acetic acid, furfural, guaiacol and 4-
ethylguaiacol; products obtained in the preliminary study in Chapter 5. The binary
model biomass system, which is used to mimic the real biomass system, was also
used to compare with the BSG HTL. In addition, the conversion, WSO yield and
total liquid product obtained on BSG HTL were also reported.
6.3.2 Effect of the reaction time of BSG HTL
In Chapter 5, preliminary studies on binary model biomass systems have
shown that the reaction time influences the degradation on cellulose and lignin in a
different way; longer times are favourable for phenolics products while cellulose
degradation products more selective at lower reaction times. In the current section,
the effect of reaction time on BSG HTL was studied in the range of 15 min to 120
min. The conversion, WSO yield and liquid product obtained at different reaction
time are shown in Figure 6-9.
Those data show shows that upon increasing the reaction time from 15 min to
30 min, there is a significant increase in both conversion and WSO yield of the BSG
HTL reaction. The conversion increased from 58 % to 73 %, while WSO yield
reached 22 % at 30 min compared to 12% at 15 min. As the reaction time was
extended, the conversion decrease to 69 %, 62% and 59 % for 60 min, 90 min and
120 min, respectively which related in increase in biochar yield. A similar trend was
obtained for the WSO yield; maximum yield was obtained at 30 min, however,
increasing time beyond this point causes a reduction in WSO production. For liquid
products, the maximum mass was obtained at 30 min (9.7 g) and slightly decreased
as the time was extended to 60 min (8.8 g) and underwent sudden decrease to 7.2 g at
120 min. Result show that the amount of liquid product is proportional with WSO
yield obtained in the system.
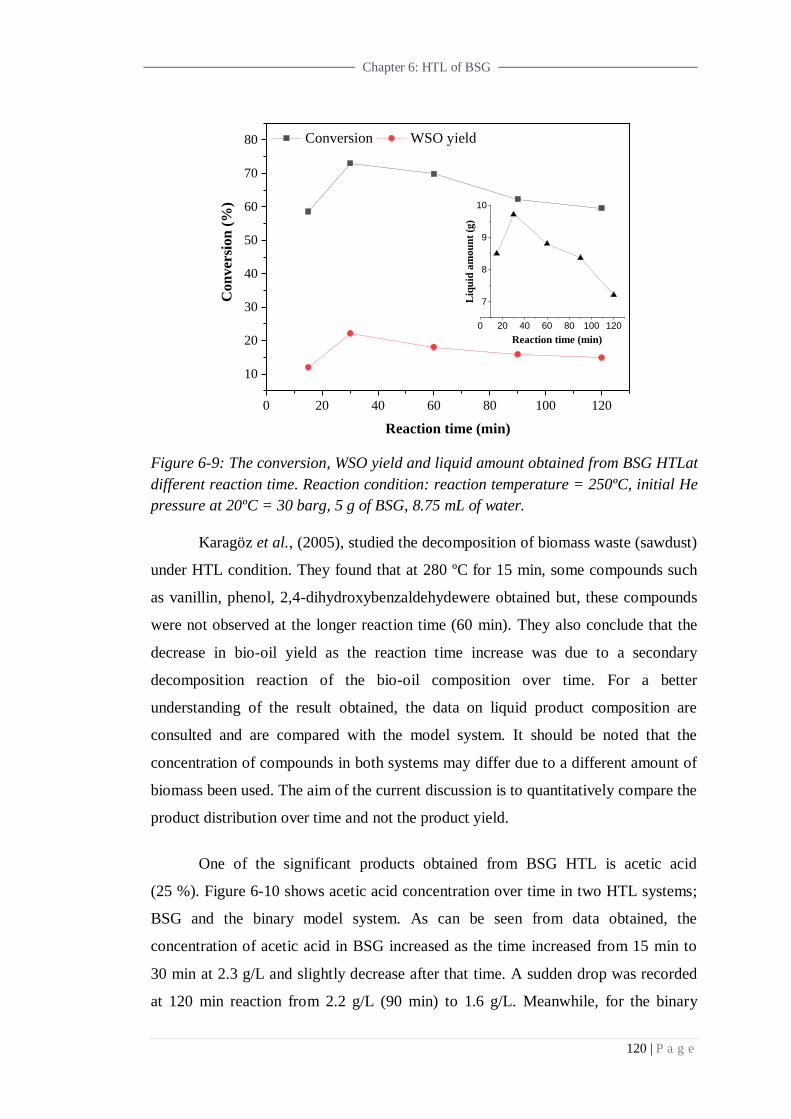
120 | P a g e
Chapter 6: HTL of BSG
Figure 6-9: The conversion, WSO yield and liquid amount obtained from BSG HTLat
different reaction time. Reaction condition: reaction temperature = 250ºC, initial He
pressure at 20ºC = 30 barg, 5 g of BSG, 8.75 mL of water.
Karagöz et al., (2005), studied the decomposition of biomass waste (sawdust)
under HTL condition. They found that at 280 ºC for 15 min, some compounds such
as vanillin, phenol, 2,4-dihydroxybenzaldehydewere obtained but, these compounds
were not observed at the longer reaction time (60 min). They also conclude that the
decrease in bio-oil yield as the reaction time increase was due to a secondary
decomposition reaction of the bio-oil composition over time. For a better
understanding of the result obtained, the data on liquid product composition are
consulted and are compared with the model system. It should be noted that the
concentration of compounds in both systems may differ due to a different amount of
biomass been used. The aim of the current discussion is to quantitatively compare the
product distribution over time and not the product yield.
One of the significant products obtained from BSG HTL is acetic acid
(25 %). Figure 6-10 shows acetic acid concentration over time in two HTL systems;
BSG and the binary model system. As can be seen from data obtained, the
concentration of acetic acid in BSG increased as the time increased from 15 min to
30 min at 2.3 g/L and slightly decrease after that time. A sudden drop was recorded
at 120 min reaction from 2.2 g/L (90 min) to 1.6 g/L. Meanwhile, for the binary
0 20 40 60 80 100 120
10
20
30
40
50
60
70
80
0 20 40 60 80 100 120
7
8
9
10
Con
ver
sion
(%
)
Reaction time (min)
Conversion WSO yield
Liq
uid
am
ou
nt
(g)
Reaction time (min)

121 | P a g e
Chapter 6: HTL of BSG
model system, the maximum concentration is obtained at 120 min (0.2 g/L) and the
concentration is relatively increased over time, with a small dip at 90 min (0.12 g/L).
Acetic acid formation may correlate directly with other species present, e.g.:
decomposition of hemicelluloses and cellulose (Liu et al., 2013) and functional
groups cracked from lignin monomers could be the sources for acidic compounds(Y.
P. Zhao et al., 2013).
Figure 6-10: Acetic acid concentration at different reaction time obtained in HTL (a)
BSG system and (b) model biomass system. Reaction condition: reaction temperature
= 250 ºC, initial He pressure at 20 °C= 30 barg, real system = 5 g of BSG, model
system = 0.2 g model biomass.
Figure 6-11 shows the concentration as s function of reaction time for two
phenolic compounds obtained from the lignin monomer; guaiacol and 4-
ethylguaiacol. For the binary model system, the result show that concentration for
both phenolics increase over time, with maximum concentration obtained at the
maximum reaction time studied; 120 min. The concentrations obtained are 77 mg/L
and 15 mg/L, for guaiacol and 4-ethyl-guaiacol respectively. However, in the BSG
system, the results show that increasing reaction time may help the formation of
phenolics up to a point, but that the concentration reduces at longer reaction times.
Guaiacol shows the highest concentration at 90 min reaction time (168 mg/L), while
for 4-ethylguaiacol, the optimum concentration is 50 mg/L at 60 min. The result
0 20 40 60 80 100 120
1.0
1.5
2.0
2.5
3.0
0 20 40 60 80 100 120
0.0
0.1
0.2
0.3
Con
cen
trati
on
(g/L
)
Reaction time (min)
BSG system Binary model system
Con
cen
trati
on
(g/L
)
Reaction time (min)
(a) (b)
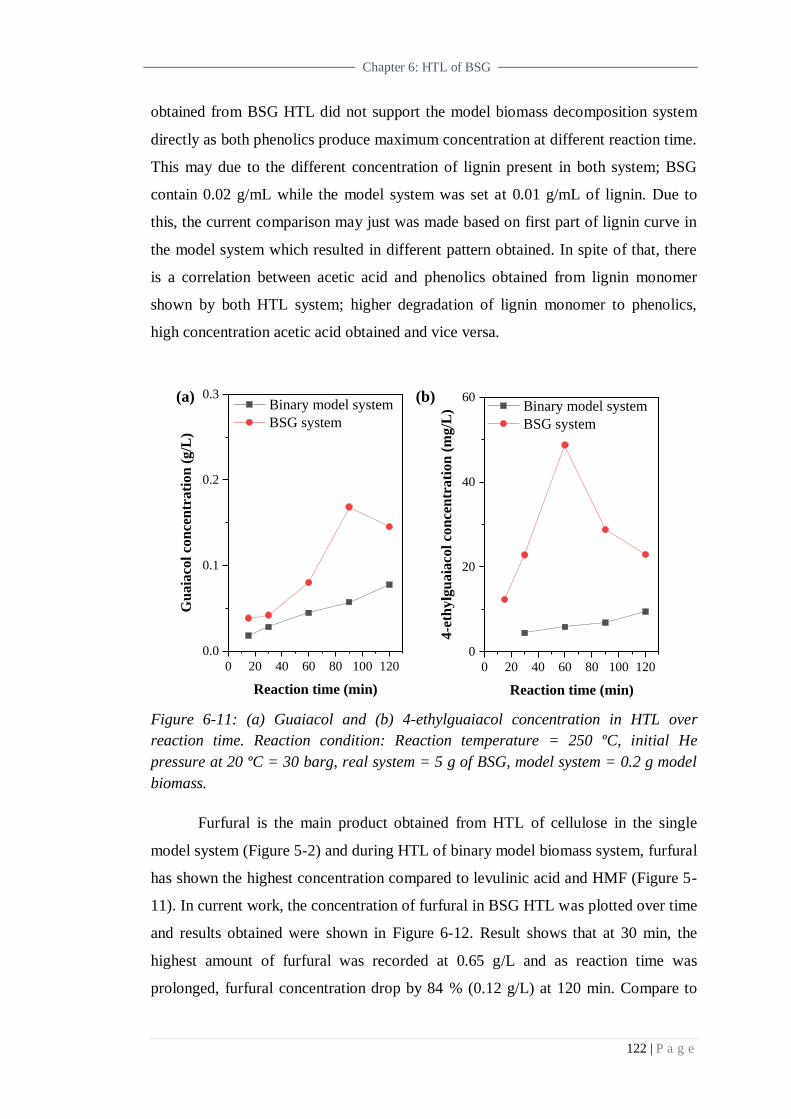
122 | P a g e
Chapter 6: HTL of BSG
obtained from BSG HTL did not support the model biomass decomposition system
directly as both phenolics produce maximum concentration at different reaction time.
This may due to the different concentration of lignin present in both system; BSG
contain 0.02 g/mL while the model system was set at 0.01 g/mL of lignin. Due to
this, the current comparison may just was made based on first part of lignin curve in
the model system which resulted in different pattern obtained. In spite of that, there
is a correlation between acetic acid and phenolics obtained from lignin monomer
shown by both HTL system; higher degradation of lignin monomer to phenolics,
high concentration acetic acid obtained and vice versa.
Figure 6-11: (a) Guaiacol and (b) 4-ethylguaiacol concentration in HTL over
reaction time. Reaction condition: Reaction temperature = 250 ºC, initial He
pressure at 20 ºC = 30 barg, real system = 5 g of BSG, model system = 0.2 g model
biomass.
Furfural is the main product obtained from HTL of cellulose in the single
model system (Figure 5-2) and during HTL of binary model biomass system, furfural
has shown the highest concentration compared to levulinic acid and HMF (Figure 5-
11). In current work, the concentration of furfural in BSG HTL was plotted over time
and results obtained were shown in Figure 6-12. Result shows that at 30 min, the
highest amount of furfural was recorded at 0.65 g/L and as reaction time was
prolonged, furfural concentration drop by 84 % (0.12 g/L) at 120 min. Compare to
0 20 40 60 80 100 120
0.0
0.1
0.2
0.3
0 20 40 60 80 100 120
0
20
40
60
Gu
aia
col
con
cen
tra
tio
n (
g/L
)
Reaction time (min)
Binary model system
BSG system
(a) (b)
4-e
thy
lgu
aia
col
con
cen
tra
tio
n (
mg
/L)
Reaction time (min)
Binary model system
BSG system
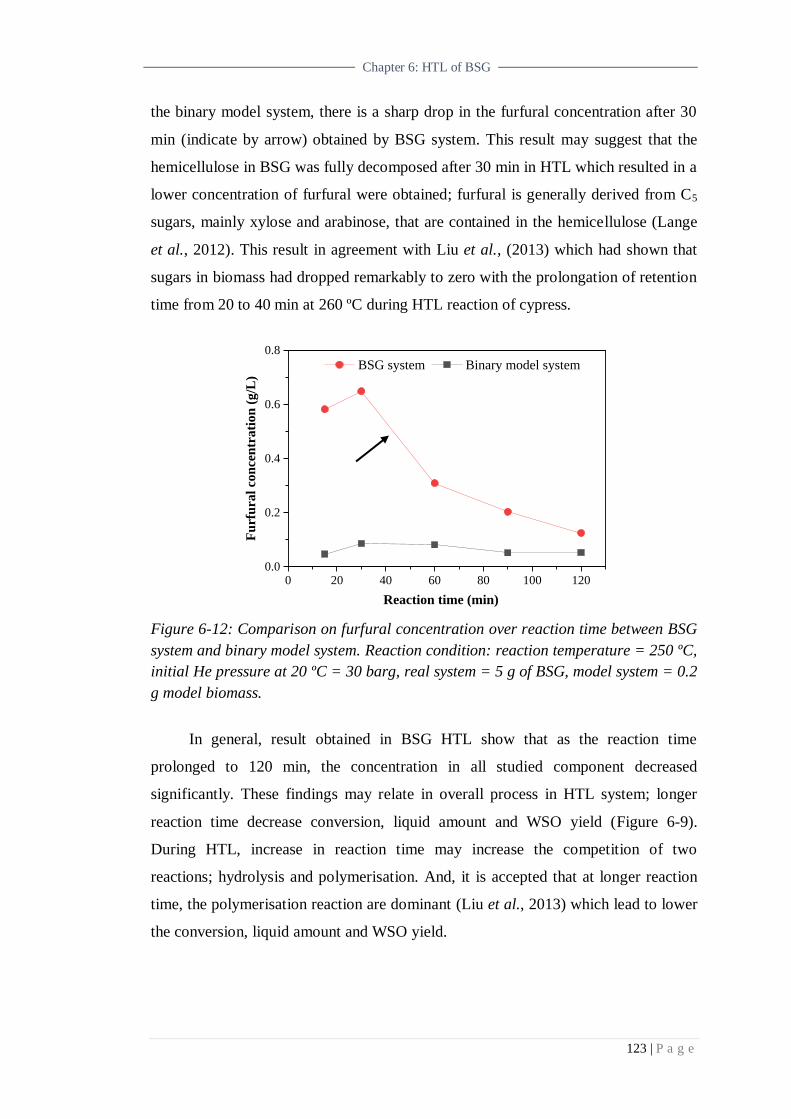
123 | P a g e
Chapter 6: HTL of BSG
the binary model system, there is a sharp drop in the furfural concentration after 30
min (indicate by arrow) obtained by BSG system. This result may suggest that the
hemicellulose in BSG was fully decomposed after 30 min in HTL which resulted in a
lower concentration of furfural were obtained; furfural is generally derived from C5
sugars, mainly xylose and arabinose, that are contained in the hemicellulose (Lange
et al., 2012). This result in agreement with Liu et al., (2013) which had shown that
sugars in biomass had dropped remarkably to zero with the prolongation of retention
time from 20 to 40 min at 260 ºC during HTL reaction of cypress.
Figure 6-12: Comparison on furfural concentration over reaction time between BSG
system and binary model system. Reaction condition: reaction temperature = 250 ºC,
initial He pressure at 20 ºC = 30 barg, real system = 5 g of BSG, model system = 0.2
g model biomass.
In general, result obtained in BSG HTL show that as the reaction time
prolonged to 120 min, the concentration in all studied component decreased
significantly. These findings may relate in overall process in HTL system; longer
reaction time decrease conversion, liquid amount and WSO yield (Figure 6-9).
During HTL, increase in reaction time may increase the competition of two
reactions; hydrolysis and polymerisation. And, it is accepted that at longer reaction
time, the polymerisation reaction are dominant (Liu et al., 2013) which lead to lower
the conversion, liquid amount and WSO yield.
0 20 40 60 80 100 1200.0
0.2
0.4
0.6
0.8
Fu
rfu
ral
con
cen
tra
tio
n (
g/L
)
Reaction time (min)
BSG system Binary model system
(a)
124 | P a g e
Chapter 6: HTL of BSG
6.4 Conclusion
In summary, the product distribution obtained from real biomass is
significantly different when compared to the model biomass (Chapter 5). The
presence of other components in BSG such as protein and triglycerides leads to the
production or various products which were not detected in the pure cellulose and
lignin model system.
At this point, comparison made based on liquid products; acetic acid, guaiacol,
4-ethyl-guaiacol and furfural show the behaviour of this particular component in
model system does not represent the actual biomass system; BSG. The presence of
other complex polymers in BSG in addition to cellulose and lignin, may direct those
compound to a more complex reaction pathway. Besides, the fraction of cellulose
and lignin in real biomass should be identified for the better comparison towards the
model system. The discussion may limited to just particular components in BSG
HTL but, it somehow may related the overall product obtained in the system;
conversion and WSO yield.
In conclusion, while hydrothermal technologies have been shown to handle a
range of feedstock compositions, in actuality, the processes are susceptible to the
individual makeup of the feedstocks and must be tailored to the chemistry taking
place as a result of the feedstock composition and processing condition.
CHAPTER 7
LIQUEFACTION OF
BREWER’S SPENT
GRAIN (BSG):
EFFECT OF SOLVENT
126 | P a g e
Chapter 7: Liquefaction of BSG: Effect of solvent
7.Chapter 7: Liquefaction of BSG:
Effect of solvent
7.0 Introduction
Throughout Chapter 5 and 6, it was shown that the use of water in HTL
processes was able to break down lignocellulosic material into various value-added
chemicals. Breakdown of cellulose lead to the production of platform chemicals such
as levulinic acid, furfural and HMF, while lignin degradation contributes to the
phenolic compounds presents in the liquid obtained. Chapter 6 summarised that the
use of BSG as real biomass in liquefaction directed the product distribution into a
different pattern from the model component due to the chemical complexity of
biomass polymers.
The main difference between liquefaction technology and other thermochemical
conversion processes (combustion, pyrolysis and gasification) is that water or other
suitable solvents must be adopted as the reaction medium (Huang and Yuan, 2015).
The liquefaction of biomass with an appropriate solvent is a process that can produce
fuel additives and other valuable chemicals, simultaneously (Liu and Zhang, 2008).
In a biomass liquefaction process, the presence of the solvent promotes such
reactions as solvolysis, hydration, and pyrolysis, which helps achieve better
fragmentation of biomass and enhancing dissolution of reaction intermediates. Given
this, the effect of different solvent towards BSG liquefaction process was
investigated. In this chapter, the reaction process focusing on direct liquefaction of
BSG in different solvents and their effect on the product distribution and the biochar
obtained is reported.
7.1 Material and experimental procedure
Details on materials used in current work are listed in Section 7.1.1. The
experimental procedure involved in studying the effect of solvent in direct BSG
liquefaction; i.e. the reaction set-up, is explained in Section 7.1.2.
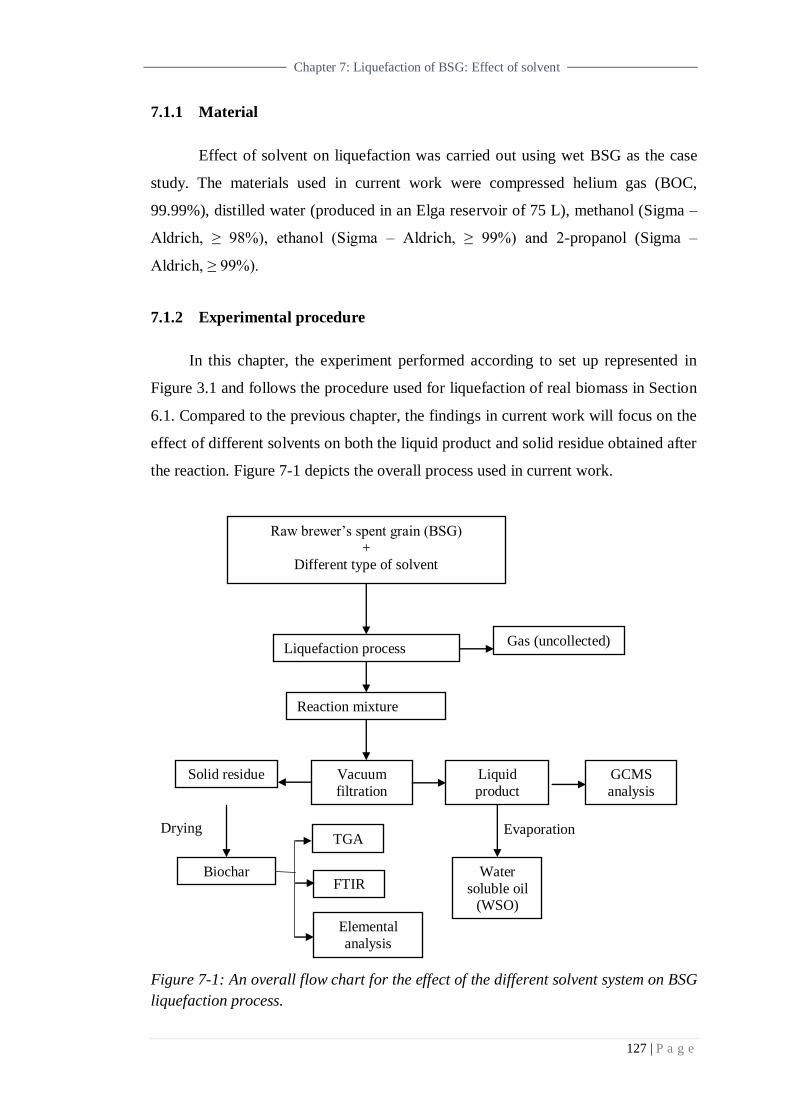
127 | P a g e
Chapter 7: Liquefaction of BSG: Effect of solvent
7.1.1 Material
Effect of solvent on liquefaction was carried out using wet BSG as the case
study. The materials used in current work were compressed helium gas (BOC,
99.99%), distilled water (produced in an Elga reservoir of 75 L), methanol (Sigma –
Aldrich, ≥ 98%), ethanol (Sigma – Aldrich, ≥ 99%) and 2-propanol (Sigma –
Aldrich, ≥ 99%).
7.1.2 Experimental procedure
In this chapter, the experiment performed according to set up represented in
Figure 3.1 and follows the procedure used for liquefaction of real biomass in Section
6.1. Compared to the previous chapter, the findings in current work will focus on the
effect of different solvents on both the liquid product and solid residue obtained after
the reaction. Figure 7-1 depicts the overall process used in current work.
Figure 7-1: An overall flow chart for the effect of the different solvent system on BSG
liquefaction process.
Raw brewer‘s spent grain (BSG)
+ Different type of solvent
Liquefaction process
Reaction mixture
Vacuum
filtration Liquid
product GCMS
analysis
Water
soluble oil (WSO)
Solid residue
Biochar
Drying Evaporation TGA
FTIR
Elemental
analysis
Gas (uncollected)

128 | P a g e
Chapter 7: Liquefaction of BSG: Effect of solvent
The liquefaction process was studied using four different solvents, namely
water, methanol (MeOH), ethanol (EtOH) and 2-propanol (2-PrOH) under identical
experimental conditions. For parameter control, the results obtained from Chapter 6
were consulted. The reaction was conducted at temperature 250 ºC for 30 minutes
reaction time, and the mixer speed was set at 500 rpm. Firstly, the reactor was loaded
with approximately 5 g of raw BSG and the BSG: solvent ratio was set at 1:10 wt. %
for both distilled water and the alcoholic solvents. Before the reaction takes place,
the air trapped in the reactor was purged out, and the reactor was loaded with 35 barg
of helium prior to the reaction. After 30 minutes reaction time, the reaction, and the
mixture of the solid-liquid product was separate using vacuum filtration. The soluble
fraction was taken as liquid product while the insoluble solid residue was pointed as
biochar.
7.2 Analysis of the product obtain
In the current chapter, the characterisation on liquid product and solid residues
obtained after BSG liquefaction is presented. Details on liquid product analysis are
given in Section 7.2.1, while the solid residue was used to determine the biochar and
conversion yield as described in Section 7.2.2.
7.2.1 Liquid product and bio-oil yield
The liquid product obtained after the separation was injected to GCMS for
product identification. The column used is HP-INNO-wax, and the details on the
procedure taken are elaborated in Section 6.2.1. After the analysis, the solvent was
removed from the liquid product to obtain the WSO, the yield of which was
calculated using Equation 6.1.
7.2.2 Solid residue and biochar yield
The solid remained after the separation was used to determine the biochar
yield and conversion for the reaction. The procedure taken to recover the solid
product and the drying process were explained in Section 6.2.2. The determination
on biochar yield and conversion were calculated using Equation 6.2 and Equation
6.3, respectively. The biochars obtained underwent several characterisation methods

129 | P a g e
Chapter 7: Liquefaction of BSG: Effect of solvent
to investigate their physical and chemical properties for the potential to be used as
the solid fuel. The range of characterisation techniques included TGA, elemental
analysis and FTIR spectroscopy.
7.3 Results and discussion
The discussion of results focuses on two main findings in the current chapter:
i) effect of solvent in conversion, WSO yield and product distribution (7.3.1) and
ii) effect of solvent on BSG biochar. Details on both findings and explanation on the
result obtained will be discussed in detail.
7.3.1 Alcoholic solvents in direct liquefaction of BSG
Although water is the most commonly used medium for liquefaction reaction,
using water as a solvent has the following drawbacks:
i) The critical value for water (374oC, 22.1 MPa) means that the
subcritical water liquefaction process requires challenging operative
conditions (C.Ji 2017, Yuan 2007)
ii) Bio- oil obtained from aqueous HTL contains a high amount of oxygen
and nitrogen, and thus limits its application for transport fuel
(C. Ji,2017)
To ease this severe requirement of reaction condition and enhance the quality
of bio-oil, addition of various organic solvent with lower critical value and dielectric
constant to subcritical water have been adopted for liquefaction including alcohol
(MeOH, EtOH, butanol and phenol) (Huang and Yuan, 2015), glycerol (Hassan and
Shukry, 2008), acetone and 1,4- dioxane (C. Ji 2017). It has been shown that a
mixture of organic solvent-water has a synergistic effect on the liquefaction of
biomass. Compared to water as a sole solvent, the mixed solvent will decrease the
critical temperature and pressure of reaction system leading to higher conversion and
alsoimproves the quality of bio-oil products (Y.-P. Zhao et al., 2013; Lai et al.,
2018). Additionally, the mixed alcohol-water solvents have also previously been
investigated in a range of processes (Li et al., 2014; McGregor et al., 2015; Bye et
al., 2017). These solvent systems have been shown to behave as a non-ideal mixture
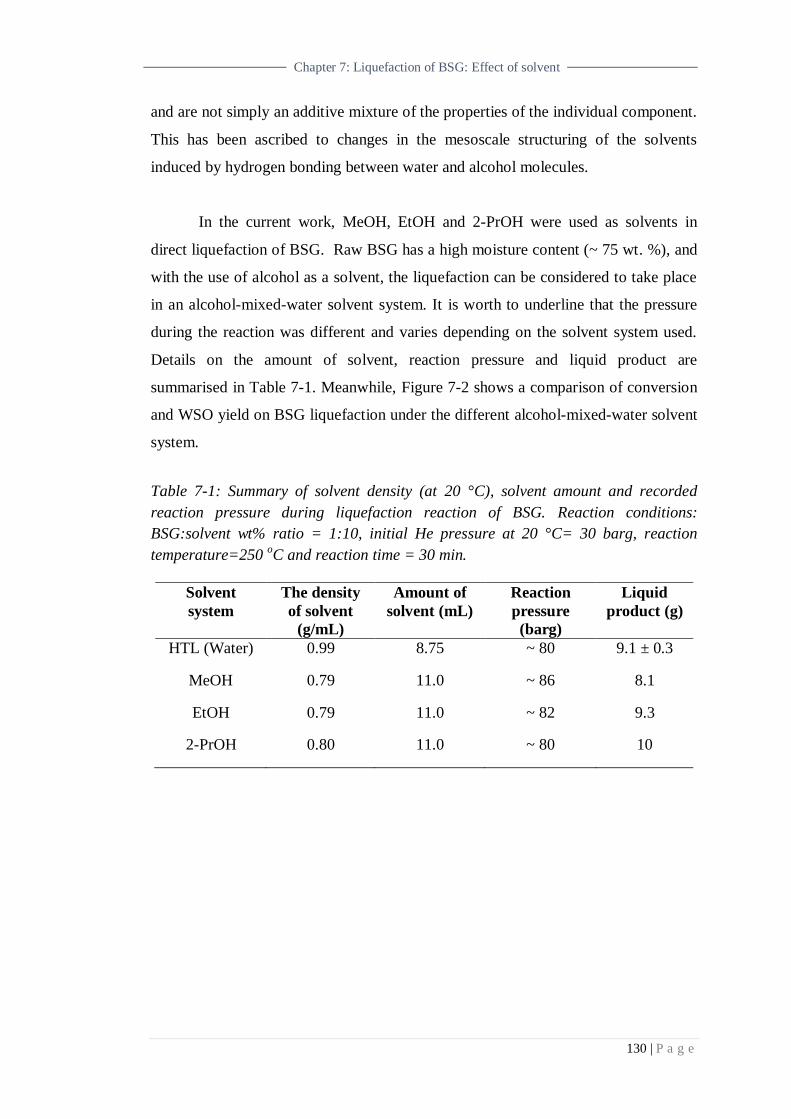
130 | P a g e
Chapter 7: Liquefaction of BSG: Effect of solvent
and are not simply an additive mixture of the properties of the individual component.
This has been ascribed to changes in the mesoscale structuring of the solvents
induced by hydrogen bonding between water and alcohol molecules.
In the current work, MeOH, EtOH and 2-PrOH were used as solvents in
direct liquefaction of BSG. Raw BSG has a high moisture content (~ 75 wt. %), and
with the use of alcohol as a solvent, the liquefaction can be considered to take place
in an alcohol-mixed-water solvent system. It is worth to underline that the pressure
during the reaction was different and varies depending on the solvent system used.
Details on the amount of solvent, reaction pressure and liquid product are
summarised in Table 7-1. Meanwhile, Figure 7-2 shows a comparison of conversion
and WSO yield on BSG liquefaction under the different alcohol-mixed-water solvent
system.
Table 7-1: Summary of solvent density (at 20 °C), solvent amount and recorded
reaction pressure during liquefaction reaction of BSG. Reaction conditions:
BSG:solvent wt% ratio = 1:10, initial He pressure at 20 °C= 30 barg, reaction
temperature=250 oC and reaction time = 30 min.
Solvent
system
The density
of solvent
(g/mL)
Amount of
solvent (mL)
Reaction
pressure
(barg)
Liquid
product (g)
HTL (Water) 0.99 8.75 ~ 80 9.1 ± 0.3
MeOH 0.79 11.0 ~ 86 8.1
EtOH 0.79 11.0 ~ 82 9.3
2-PrOH 0.80 11.0 ~ 80 10
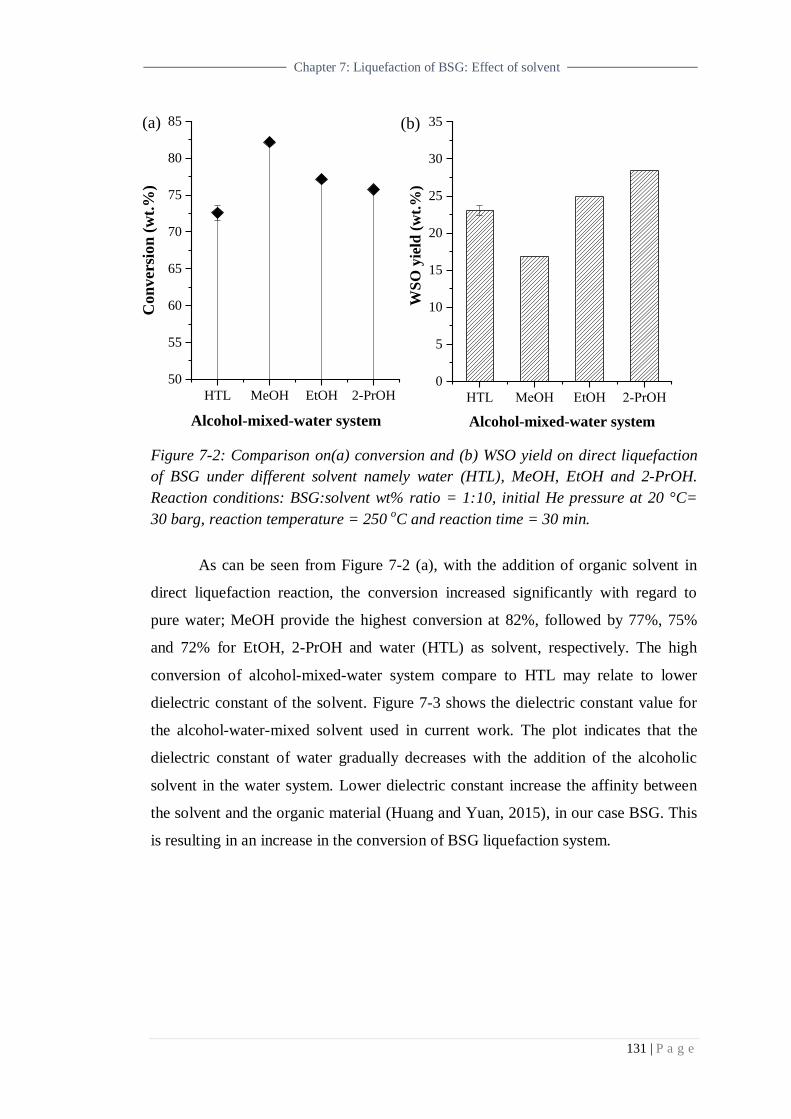
131 | P a g e
Chapter 7: Liquefaction of BSG: Effect of solvent
Figure 7-2: Comparison on(a) conversion and (b) WSO yield on direct liquefaction
of BSG under different solvent namely water (HTL), MeOH, EtOH and 2-PrOH.
Reaction conditions: BSG:solvent wt% ratio = 1:10, initial He pressure at 20 °C=
30 barg, reaction temperature = 250 oC and reaction time = 30 min.
As can be seen from Figure 7-2 (a), with the addition of organic solvent in
direct liquefaction reaction, the conversion increased significantly with regard to
pure water; MeOH provide the highest conversion at 82%, followed by 77%, 75%
and 72% for EtOH, 2-PrOH and water (HTL) as solvent, respectively. The high
conversion of alcohol-mixed-water system compare to HTL may relate to lower
dielectric constant of the solvent. Figure 7-3 shows the dielectric constant value for
the alcohol-water-mixed solvent used in current work. The plot indicates that the
dielectric constant of water gradually decreases with the addition of the alcoholic
solvent in the water system. Lower dielectric constant increase the affinity between
the solvent and the organic material (Huang and Yuan, 2015), in our case BSG. This
is resulting in an increase in the conversion of BSG liquefaction system.
HTL MeOH EtOH 2-PrOH
50
55
60
65
70
75
80
85
Con
ver
sio
n (
wt.
%)
Alcohol-mixed-water system
HTL MeOH EtOH 2-PrOH
0
5
10
15
20
25
30
35
WS
O y
ield
(w
t.%
)Alcohol-mixed-water system
(a) (b)
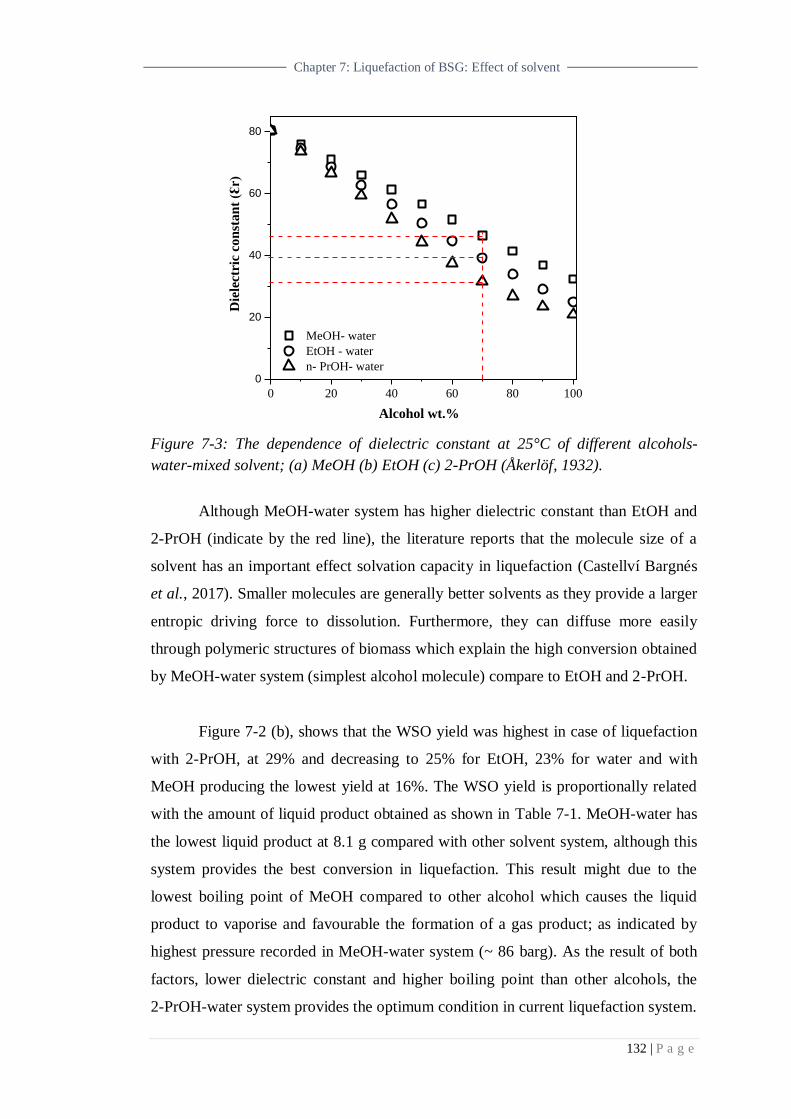
132 | P a g e
Chapter 7: Liquefaction of BSG: Effect of solvent
Figure 7-3: The dependence of dielectric constant at 25°C of different alcohols-
water-mixed solvent; (a) MeOH (b) EtOH (c) 2-PrOH (Åkerlöf, 1932).
Although MeOH-water system has higher dielectric constant than EtOH and
2-PrOH (indicate by the red line), the literature reports that the molecule size of a
solvent has an important effect solvation capacity in liquefaction (Castellví Bargnés
et al., 2017). Smaller molecules are generally better solvents as they provide a larger
entropic driving force to dissolution. Furthermore, they can diffuse more easily
through polymeric structures of biomass which explain the high conversion obtained
by MeOH-water system (simplest alcohol molecule) compare to EtOH and 2-PrOH.
Figure 7-2 (b), shows that the WSO yield was highest in case of liquefaction
with 2-PrOH, at 29% and decreasing to 25% for EtOH, 23% for water and with
MeOH producing the lowest yield at 16%. The WSO yield is proportionally related
with the amount of liquid product obtained as shown in Table 7-1. MeOH-water has
the lowest liquid product at 8.1 g compared with other solvent system, although this
system provides the best conversion in liquefaction. This result might due to the
lowest boiling point of MeOH compared to other alcohol which causes the liquid
product to vaporise and favourable the formation of a gas product; as indicated by
highest pressure recorded in MeOH-water system (~ 86 barg). As the result of both
factors, lower dielectric constant and higher boiling point than other alcohols, the
2-PrOH-water system provides the optimum condition in current liquefaction system.
0 20 40 60 80 100
0
20
40
60
80
MeOH- water
EtOH - water
n- PrOH- water
Die
lect
ric
con
stan
t (Ɛ
r)
Alcohol wt.%
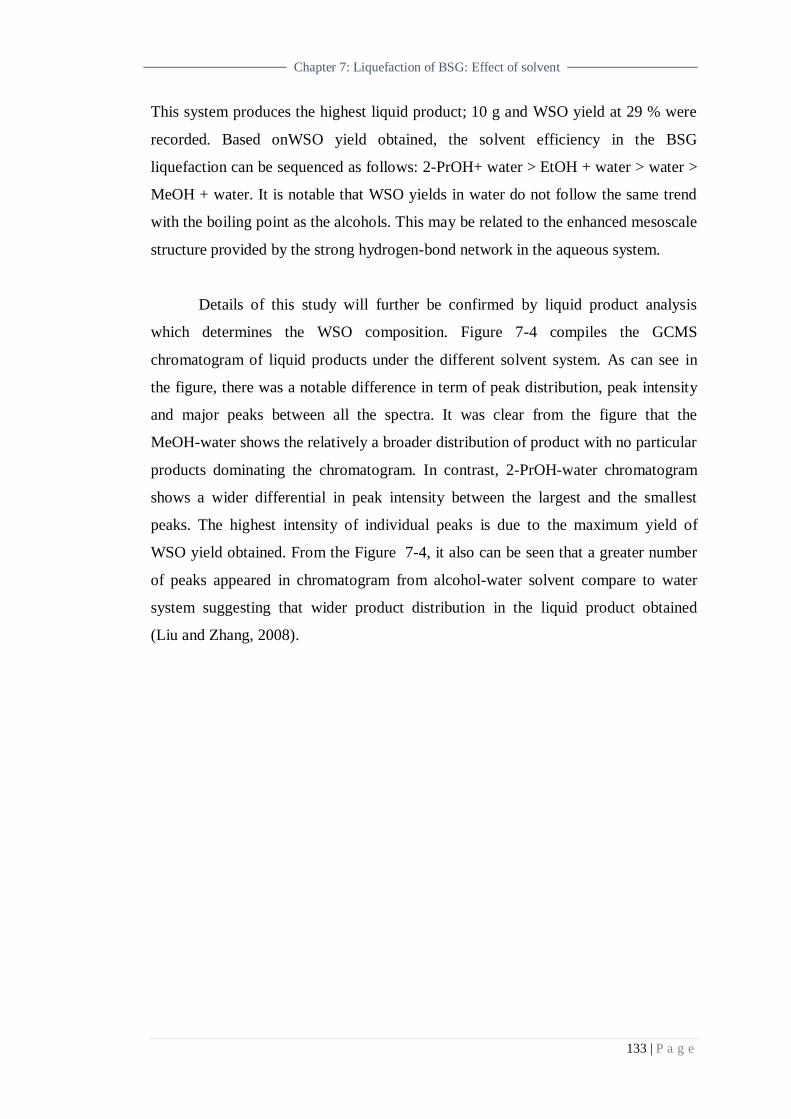
133 | P a g e
Chapter 7: Liquefaction of BSG: Effect of solvent
This system produces the highest liquid product; 10 g and WSO yield at 29 % were
recorded. Based onWSO yield obtained, the solvent efficiency in the BSG
liquefaction can be sequenced as follows: 2-PrOH+ water > EtOH + water > water >
MeOH + water. It is notable that WSO yields in water do not follow the same trend
with the boiling point as the alcohols. This may be related to the enhanced mesoscale
structure provided by the strong hydrogen-bond network in the aqueous system.
Details of this study will further be confirmed by liquid product analysis
which determines the WSO composition. Figure 7-4 compiles the GCMS
chromatogram of liquid products under the different solvent system. As can see in
the figure, there was a notable difference in term of peak distribution, peak intensity
and major peaks between all the spectra. It was clear from the figure that the
MeOH-water shows the relatively a broader distribution of product with no particular
products dominating the chromatogram. In contrast, 2-PrOH-water chromatogram
shows a wider differential in peak intensity between the largest and the smallest
peaks. The highest intensity of individual peaks is due to the maximum yield of
WSO yield obtained. From the Figure 7-4, it also can be seen that a greater number
of peaks appeared in chromatogram from alcohol-water solvent compare to water
system suggesting that wider product distribution in the liquid product obtained
(Liu and Zhang, 2008).

134 | P a g e
Chapter 7: Liquefaction of BSG: Effect of solvent
Figure 7-4: GCMS chromatogram on liquid product distribution for BSG
liquefaction under different solvent. Reaction conditions: BSG: solvent wt%
ratio=1:10, Initial He pressure at 20 °C = 30 barg, reaction temperature=250 oC
and reaction time = 30min.
The chromatogram peaks were identified, and the area under the graph was
measured for product identification and qualitative analysis. Details on the identified
compounds based on retention time, chemical name and their percentage area were
tabulated in Table 7-1. It is important to note that the values illustrated in the table do
not represent the actual concentration but indicate the product composition
associated with each solvent based on library identification and manual inspection of
individual mass spectra. Due to the complexity of the liquid product, it is difficult to
perfectly separate every peak. Thus, only those compounds with peak area (%)
higher than 1% are shown on the table.
5 10 15 20 25 30 35
0
1
2
3
4 HTL (Water)
Ab
solu
te I
nte
nsi
ty /
10
6 [
a.u
]
Retention time (min)
5 10 15 20 25 30 35
0
1
2
3
4 MeOH + water
Ab
solu
te I
nte
nsi
ty /
10
6 [
a.u
]
Rentention time (min)
5 10 15 20 25 30 35
0
1
2
3
4 EtOH + water
Ab
solu
te I
nte
nsi
ty /
10
6 [
a.u
]
Retention time (min)
2-p
yri
din
on
e
12-hydroxy-9-octadecenoic acid- methyl ester
n-H
exad
ecan
oic
aci
d
5 10 15 20 25 30 35
0
1
2
3
4 2-propanol + water
Ab
solu
te I
nte
nsi
ty /
10
6 [
a.u
]
Retention time (min)
n-H
exad
ecan
oic
aci
dn
-Hex
adec
ano
ic a
cid
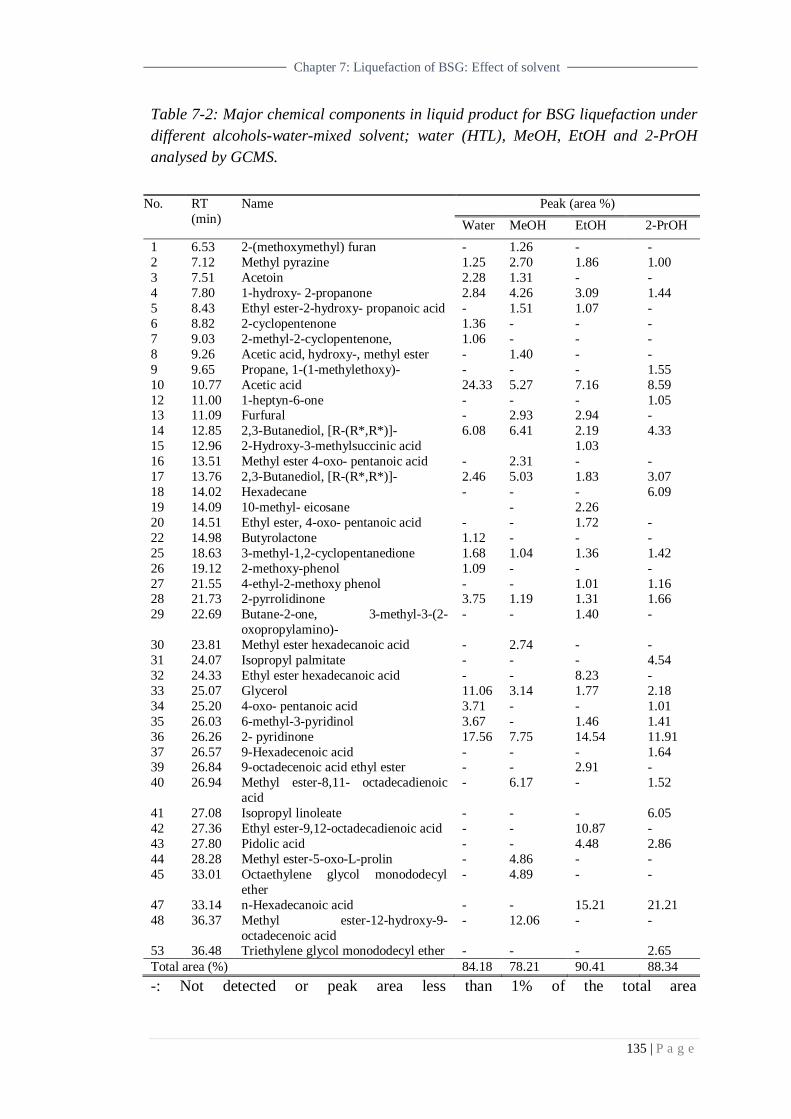
135 | P a g e
Chapter 7: Liquefaction of BSG: Effect of solvent
Table 7-2: Major chemical components in liquid product for BSG liquefaction under
different alcohols-water-mixed solvent; water (HTL), MeOH, EtOH and 2-PrOH
analysed by GCMS.
No. RT
(min)
Name Peak (area %)
Water MeOH EtOH 2-PrOH
1 6.53 2-(methoxymethyl) furan - 1.26 - -
2 7.12 Methyl pyrazine 1.25 2.70 1.86 1.00
3 7.51 Acetoin 2.28 1.31 - -
4 7.80 1-hydroxy- 2-propanone 2.84 4.26 3.09 1.44
5 8.43 Ethyl ester-2-hydroxy- propanoic acid - 1.51 1.07 -
6 8.82 2-cyclopentenone 1.36 - - -
7 9.03 2-methyl-2-cyclopentenone, 1.06 - - -
8 9.26 Acetic acid, hydroxy-, methyl ester - 1.40 - -
9 9.65 Propane, 1-(1-methylethoxy)- - - - 1.55
10 10.77 Acetic acid 24.33 5.27 7.16 8.59
12 11.00 1-heptyn-6-one - - - 1.05 13 11.09 Furfural - 2.93 2.94 -
14 12.85 2,3-Butanediol, [R-(R*,R*)]- 6.08 6.41 2.19 4.33
15 12.96 2-Hydroxy-3-methylsuccinic acid 1.03
16 13.51 Methyl ester 4-oxo- pentanoic acid - 2.31 - -
17 13.76 2,3-Butanediol, [R-(R*,R*)]- 2.46 5.03 1.83 3.07
18 14.02 Hexadecane - - - 6.09
19 14.09 10-methyl- eicosane - 2.26
20 14.51 Ethyl ester, 4-oxo- pentanoic acid - - 1.72 -
22 14.98 Butyrolactone 1.12 - - -
25 18.63 3-methyl-1,2-cyclopentanedione 1.68 1.04 1.36 1.42
26 19.12 2-methoxy-phenol 1.09 - - -
27 21.55 4-ethyl-2-methoxy phenol - - 1.01 1.16 28 21.73 2-pyrrolidinone 3.75 1.19 1.31 1.66
29 22.69 Butane-2-one, 3-methyl-3-(2-
oxopropylamino)-
- - 1.40 -
30 23.81 Methyl ester hexadecanoic acid - 2.74 - -
31 24.07 Isopropyl palmitate - - - 4.54
32 24.33 Ethyl ester hexadecanoic acid - - 8.23 -
33 25.07 Glycerol 11.06 3.14 1.77 2.18
34 25.20 4-oxo- pentanoic acid 3.71 - - 1.01
35 26.03 6-methyl-3-pyridinol 3.67 - 1.46 1.41
36 26.26 2- pyridinone 17.56 7.75 14.54 11.91
37 26.57 9-Hexadecenoic acid - - - 1.64 39 26.84 9-octadecenoic acid ethyl ester - - 2.91 -
40 26.94 Methyl ester-8,11- octadecadienoic
acid
- 6.17 - 1.52
41 27.08 Isopropyl linoleate - - - 6.05
42 27.36 Ethyl ester-9,12-octadecadienoic acid - - 10.87 -
43 27.80 Pidolic acid - - 4.48 2.86
44 28.28 Methyl ester-5-oxo-L-prolin - 4.86 - -
45 33.01 Octaethylene glycol monododecyl
ether
- 4.89 - -
47 33.14 n-Hexadecanoic acid - - 15.21 21.21
48 36.37 Methyl ester-12-hydroxy-9-
octadecenoic acid
- 12.06 - -
53 36.48 Triethylene glycol monododecyl ether - - - 2.65
Total area (%) 84.18 78.21 90.41 88.34
-: Not detected or peak area less than 1% of the total area
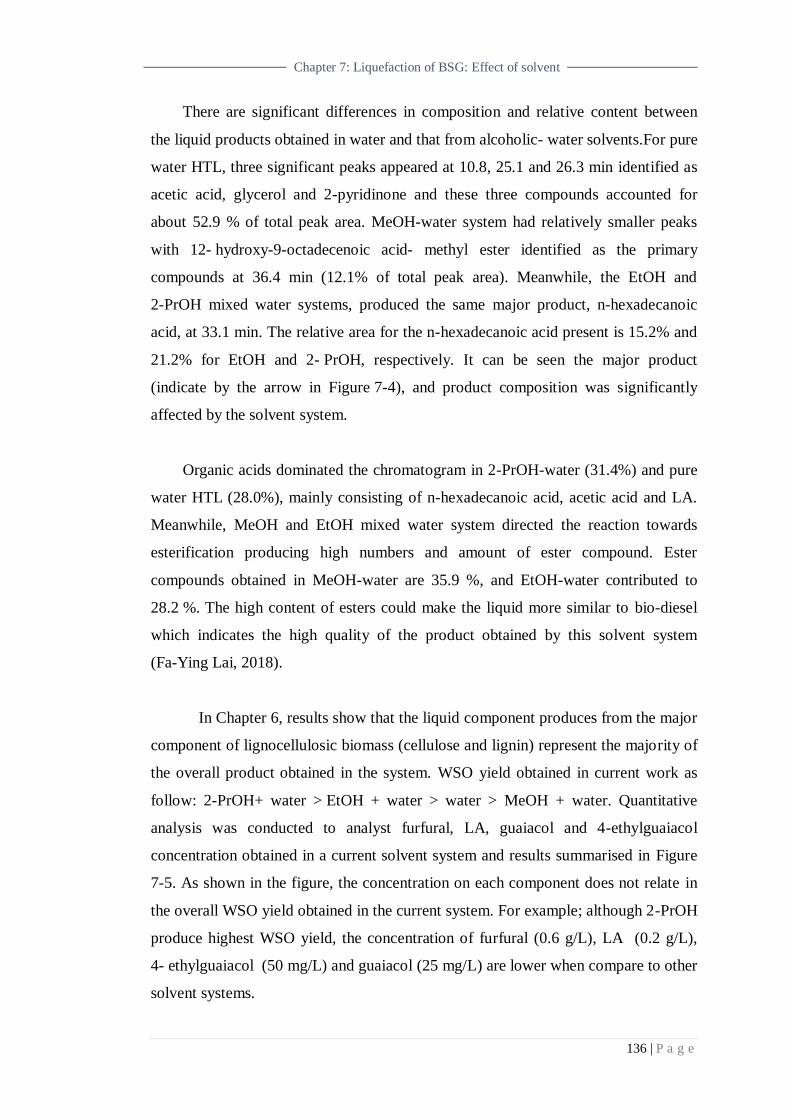
136 | P a g e
Chapter 7: Liquefaction of BSG: Effect of solvent
There are significant differences in composition and relative content between
the liquid products obtained in water and that from alcoholic- water solvents.For pure
water HTL, three significant peaks appeared at 10.8, 25.1 and 26.3 min identified as
acetic acid, glycerol and 2-pyridinone and these three compounds accounted for
about 52.9 % of total peak area. MeOH-water system had relatively smaller peaks
with 12- hydroxy-9-octadecenoic acid- methyl ester identified as the primary
compounds at 36.4 min (12.1% of total peak area). Meanwhile, the EtOH and
2-PrOH mixed water systems, produced the same major product, n-hexadecanoic
acid, at 33.1 min. The relative area for the n-hexadecanoic acid present is 15.2% and
21.2% for EtOH and 2- PrOH, respectively. It can be seen the major product
(indicate by the arrow in Figure 7-4), and product composition was significantly
affected by the solvent system.
Organic acids dominated the chromatogram in 2-PrOH-water (31.4%) and pure
water HTL (28.0%), mainly consisting of n-hexadecanoic acid, acetic acid and LA.
Meanwhile, MeOH and EtOH mixed water system directed the reaction towards
esterification producing high numbers and amount of ester compound. Ester
compounds obtained in MeOH-water are 35.9 %, and EtOH-water contributed to
28.2 %. The high content of esters could make the liquid more similar to bio-diesel
which indicates the high quality of the product obtained by this solvent system
(Fa-Ying Lai, 2018).
In Chapter 6, results show that the liquid component produces from the major
component of lignocellulosic biomass (cellulose and lignin) represent the majority of
the overall product obtained in the system. WSO yield obtained in current work as
follow: 2-PrOH+ water > EtOH + water > water > MeOH + water. Quantitative
analysis was conducted to analyst furfural, LA, guaiacol and 4-ethylguaiacol
concentration obtained in a current solvent system and results summarised in Figure
7-5. As shown in the figure, the concentration on each component does not relate in
the overall WSO yield obtained in the current system. For example; although 2-PrOH
produce highest WSO yield, the concentration of furfural (0.6 g/L), LA (0.2 g/L),
4- ethylguaiacol (50 mg/L) and guaiacol (25 mg/L) are lower when compare to other
solvent systems.

137 | P a g e
Chapter 7: Liquefaction of BSG: Effect of solvent
Figure 7-5: Quantitative analysis on liquid product for BSG liquefaction under
different alcoholic-mixed solvent systems.. Reaction conditions: BSG: solvent wt%
ratio=1:10, Initial He pressure at 20 °C = 30 barg, reaction temperature = 250 ºC
and reaction time = 30min.
These current findings show that the nature of the liquefaction solvent has a
significant influence on the composition and abundance of liquid product (Liu and
Zhang, 2008; Y. P. Zhao et al., 2013; Singh et al., 2015). Apparently, the uses of
water or organic solvents as liquefaction solvent have their advantages and
disadvantages. In consideration of this fact, the chosen of solvents in liquefaction
was depend on the final product of interest and also cost-effective of the process.
7.3.2 Effect of liquefaction solvent on bio-char of BSG
Solvent does not only affect the composition and liquid products, but it also
has a remarkable effect on the biochar in the liquefaction reaction. Biochar yield as
the function of the different type of solvent is shown in Figure 7-6. Among studied
solvent system, the lowest yield of biochar present in MeOH-water (17.8%) followed
EtOH- water (22.8%), 2-PrOH-water (24.2%) and pure water HTL produce highest
HTL MeOH EtOH 2-PrOH
0.0
0.5
1.0
1.5
2.0
HTL MeOH EtOH 2-PrOH
0.0
0.5
1.0
HTL MeOH EtOH 2-PrOH
0.00
0.05
0.10
HTL MeOH EtOH 2-PrOH
0.00
0.05
0.10
0.15
0.20
Furfural Levulinic acid
Guaiacol4-ethylguaiacol
Co
nce
ntr
ati
on
(g/L
)
Co
nce
ntr
ati
on
(g/L
)C
on
cen
tra
tion
(g/L
)
Co
nce
ntr
ati
on
(g/L
)
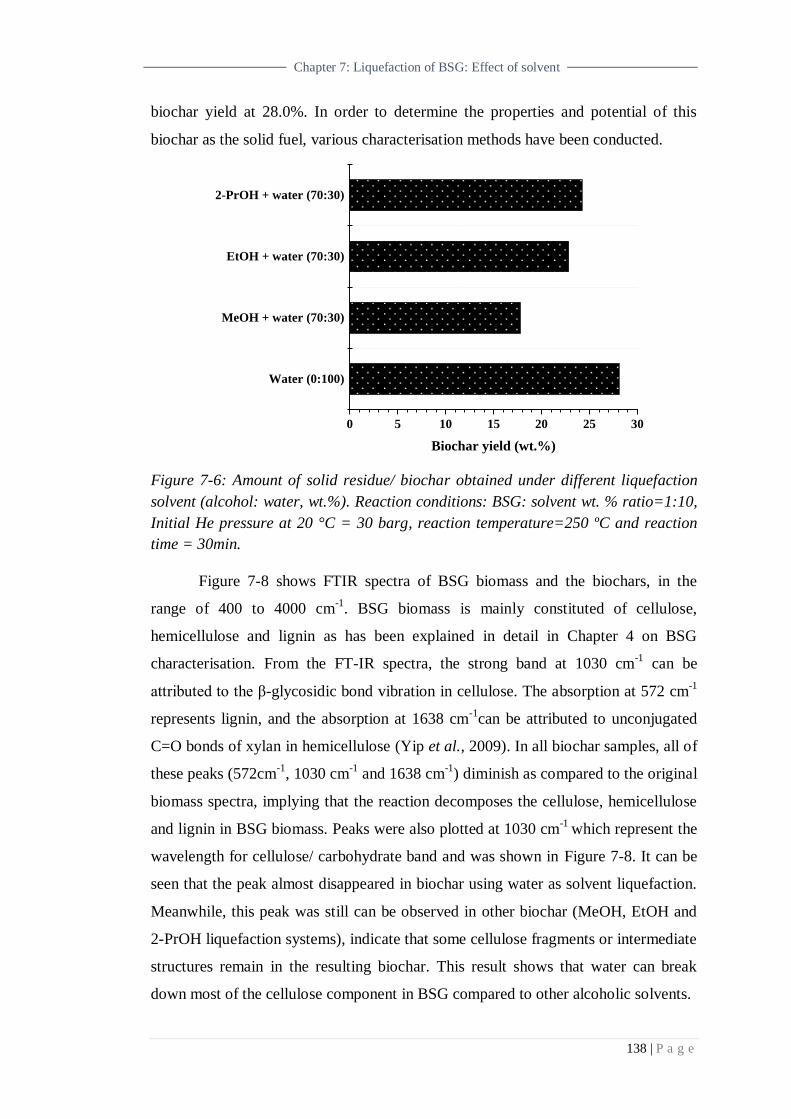
138 | P a g e
Chapter 7: Liquefaction of BSG: Effect of solvent
biochar yield at 28.0%. In order to determine the properties and potential of this
biochar as the solid fuel, various characterisation methods have been conducted.
Figure 7-6: Amount of solid residue/ biochar obtained under different liquefaction
solvent (alcohol: water, wt.%). Reaction conditions: BSG: solvent wt. % ratio=1:10,
Initial He pressure at 20 °C = 30 barg, reaction temperature=250 ºC and reaction
time = 30min.
Figure 7-8 shows FTIR spectra of BSG biomass and the biochars, in the
range of 400 to 4000 cm-1
. BSG biomass is mainly constituted of cellulose,
hemicellulose and lignin as has been explained in detail in Chapter 4 on BSG
characterisation. From the FT-IR spectra, the strong band at 1030 cm-1
can be
attributed to the β-glycosidic bond vibration in cellulose. The absorption at 572 cm-1
represents lignin, and the absorption at 1638 cm-1
can be attributed to unconjugated
C=O bonds of xylan in hemicellulose (Yip et al., 2009). In all biochar samples, all of
these peaks (572cm-1
, 1030 cm-1
and 1638 cm-1
) diminish as compared to the original
biomass spectra, implying that the reaction decomposes the cellulose, hemicellulose
and lignin in BSG biomass. Peaks were also plotted at 1030 cm-1
which represent the
wavelength for cellulose/ carbohydrate band and was shown in Figure 7-8. It can be
seen that the peak almost disappeared in biochar using water as solvent liquefaction.
Meanwhile, this peak was still can be observed in other biochar (MeOH, EtOH and
2-PrOH liquefaction systems), indicate that some cellulose fragments or intermediate
structures remain in the resulting biochar. This result shows that water can break
down most of the cellulose component in BSG compared to other alcoholic solvents.
Water (0:100)
MeOH + water (70:30)
EtOH + water (70:30)
2-PrOH + water (70:30)
0 5 10 15 20 25 30
Biochar yield (wt.%)
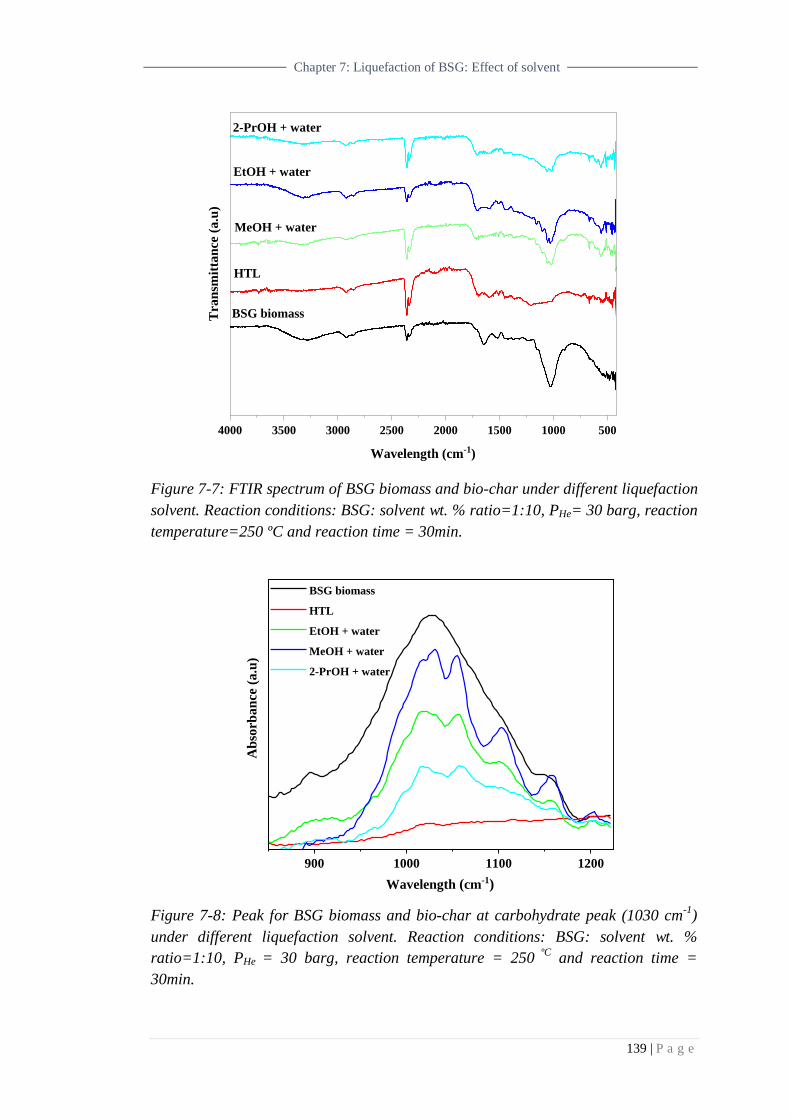
139 | P a g e
Chapter 7: Liquefaction of BSG: Effect of solvent
Figure 7-7: FTIR spectrum of BSG biomass and bio-char under different liquefaction
solvent. Reaction conditions: BSG: solvent wt. % ratio=1:10, PHe= 30 barg, reaction
temperature=250 ºC and reaction time = 30min.
Figure 7-8: Peak for BSG biomass and bio-char at carbohydrate peak (1030 cm-1
)
under different liquefaction solvent. Reaction conditions: BSG: solvent wt. %
ratio=1:10, PHe = 30 barg, reaction temperature = 250 ºC
and reaction time =
30min.
4000 3500 3000 2500 2000 1500 1000 500
Tra
nsm
itta
nce (
a.u
)
Wavelength (cm-1)
BSG biomass
HTL
MeOH + water
EtOH + water
2-PrOH + water
900 1000 1100 1200
Ab
sorb
an
ce (
a.u
)
Wavelength (cm-1)
BSG biomass
HTL
EtOH + water
MeOH + water
2-PrOH + water
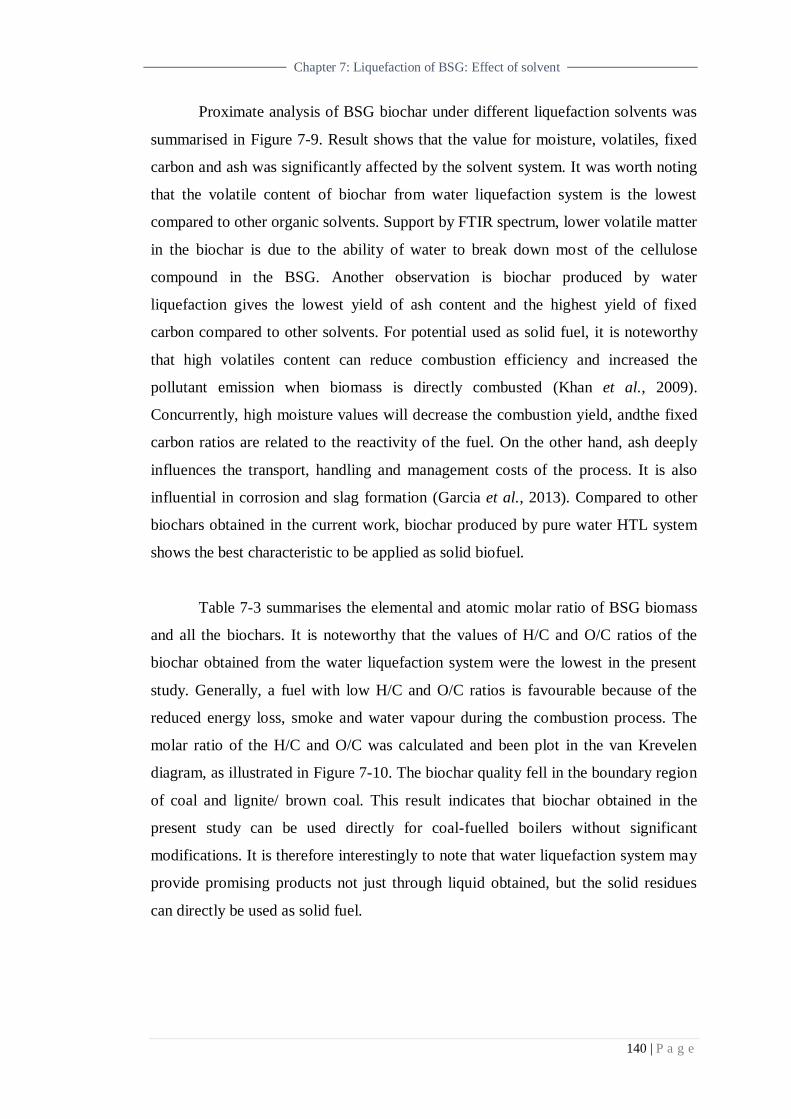
140 | P a g e
Chapter 7: Liquefaction of BSG: Effect of solvent
Proximate analysis of BSG biochar under different liquefaction solvents was
summarised in Figure 7-9. Result shows that the value for moisture, volatiles, fixed
carbon and ash was significantly affected by the solvent system. It was worth noting
that the volatile content of biochar from water liquefaction system is the lowest
compared to other organic solvents. Support by FTIR spectrum, lower volatile matter
in the biochar is due to the ability of water to break down most of the cellulose
compound in the BSG. Another observation is biochar produced by water
liquefaction gives the lowest yield of ash content and the highest yield of fixed
carbon compared to other solvents. For potential used as solid fuel, it is noteworthy
that high volatiles content can reduce combustion efficiency and increased the
pollutant emission when biomass is directly combusted (Khan et al., 2009).
Concurrently, high moisture values will decrease the combustion yield, andthe fixed
carbon ratios are related to the reactivity of the fuel. On the other hand, ash deeply
influences the transport, handling and management costs of the process. It is also
influential in corrosion and slag formation (Garcia et al., 2013). Compared to other
biochars obtained in the current work, biochar produced by pure water HTL system
shows the best characteristic to be applied as solid biofuel.
Table 7-3 summarises the elemental and atomic molar ratio of BSG biomass
and all the biochars. It is noteworthy that the values of H/C and O/C ratios of the
biochar obtained from the water liquefaction system were the lowest in the present
study. Generally, a fuel with low H/C and O/C ratios is favourable because of the
reduced energy loss, smoke and water vapour during the combustion process. The
molar ratio of the H/C and O/C was calculated and been plot in the van Krevelen
diagram, as illustrated in Figure 7-10. The biochar quality fell in the boundary region
of coal and lignite/ brown coal. This result indicates that biochar obtained in the
present study can be used directly for coal-fuelled boilers without significant
modifications. It is therefore interestingly to note that water liquefaction system may
provide promising products not just through liquid obtained, but the solid residues
can directly be used as solid fuel.

141 | P a g e
Chapter 7: Liquefaction of BSG: Effect of solvent
Figure 7-9: Proximate analysis of BSG biomass and BSG bio-char under different
liquefaction solvents. Reaction conditions: BSG: solvent wt.% ratio=1:10, Initial He
pressure at 20 °C = 30 barg, reaction temperature = 250 °C and reaction time =
30min.
Table 7-3: Ultimate analysis and the atomic molar ratio of BSG biochars produce
under different liquefaction solvent.
Individual element
and the molar ratio
Biochar produce in a different solvent system
HTL (water) MeOH-water
mixed
EtOH-water
mixed
2-PrOH-water
mixed
Ultimate analysis (wt. %)a
Carbon (C) 63.1 ± 1.6 54.8 ± 0.8 48.8 ± 0.5 55.1 ± 0.3
Hydrogen (H) 5.2 ± 0.1 5.3 ± 0.3 4.43 ± 0.3 4.2 ± 0.2
Nitrogen (N) 3.5 ± 0.5 3.8 ± 0.5 3.31 ± 0.1 4.3 ± 0.6
Oxygen (O)b 23.9 ± 2.0 28.8 ± 0.1 28.6 ± 0.1 25.9 ± 0.7
H/C and O/C ratio (molar ratio)
H/C ratio 0.99 1.17 1.09 0.91
O/C ratio 0.29 0.38 0.44 0.35
a: reported in mean ± SD value
b: were calculated by diff of C, H, N and ash
BSG biomass Water Methanol Ethanol 2-propanol0
20
40
60
80
100
Per
cen
tage
wei
gh
t (w
t.%
)
Alcohol-mixed solvent system
Ash Fixed carbon Volatile Moisture
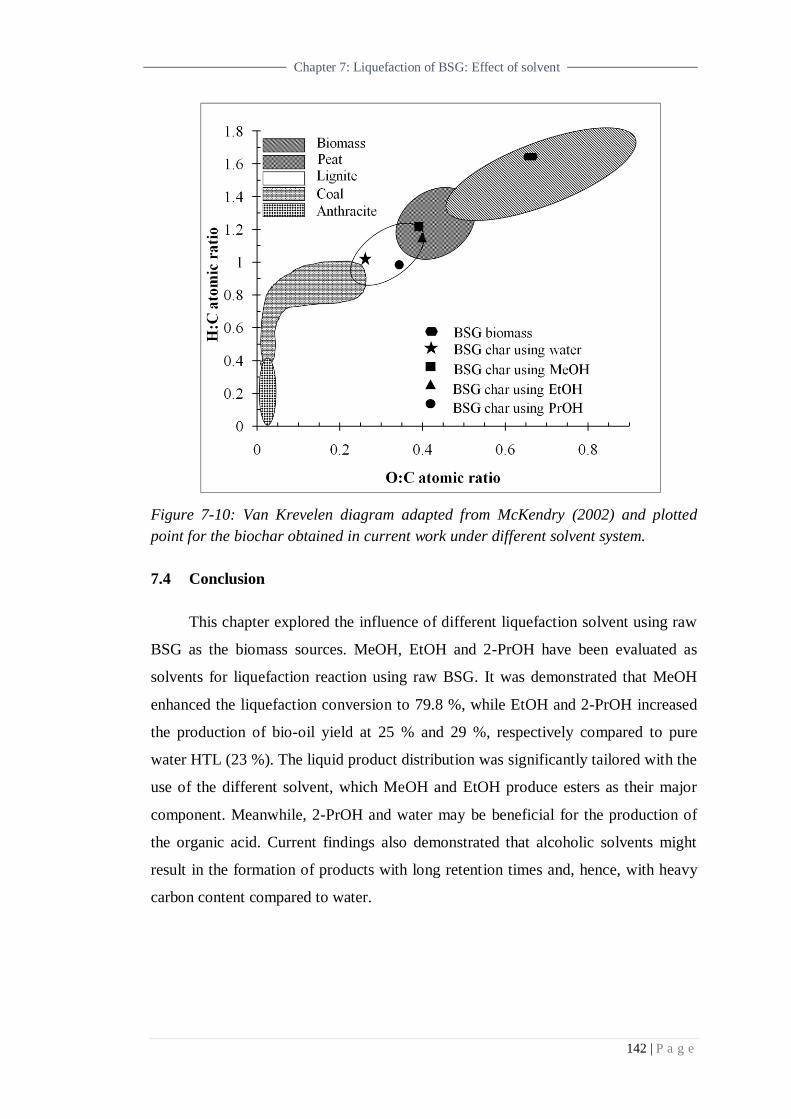
142 | P a g e
Chapter 7: Liquefaction of BSG: Effect of solvent
Figure 7-10: Van Krevelen diagram adapted from McKendry (2002) and plotted
point for the biochar obtained in current work under different solvent system.
7.4 Conclusion
This chapter explored the influence of different liquefaction solvent using raw
BSG as the biomass sources. MeOH, EtOH and 2-PrOH have been evaluated as
solvents for liquefaction reaction using raw BSG. It was demonstrated that MeOH
enhanced the liquefaction conversion to 79.8 %, while EtOH and 2-PrOH increased
the production of bio-oil yield at 25 % and 29 %, respectively compared to pure
water HTL (23 %). The liquid product distribution was significantly tailored with the
use of the different solvent, which MeOH and EtOH produce esters as their major
component. Meanwhile, 2-PrOH and water may be beneficial for the production of
the organic acid. Current findings also demonstrated that alcoholic solvents might
result in the formation of products with long retention times and, hence, with heavy
carbon content compared to water.
143 | P a g e
Chapter 7: Liquefaction of BSG: Effect of solvent
In order for the potential biochar for biofuel benefit to be fully realised, the
proximate and ultimate analysis has been conducted. Among all the solvents, the
biochar produced by pure water HTL system shows the best quality as the solid fuel
obtained through this study. The biochar quality fell in the boundary region of coal
and lignite/ brown coal which can be used directly for coal-fuelled boilers without
significant modifications.
Overall, the most significant conclusion to emerge from this study is that
solvents are the key parameters that affect liquid product/ bio-oil and biochar
obtained in the liquefaction process.

CHAPTER 8
CONCLUSION AND
RECOMMENDATION
FOR FUTURE WORK
145 | P a g e
Chapter 8: Conclusion and recommendation for future work
8. Chapter 8: Conclusion and
recommendation for future work
8.1 Conclusion
The aim of this thesis to contribute a better understanding on the HTL process for
lignocellulosic material by using both systems; model biomass and BSG as real
biomass. This chapter summarises the significant conclusions of the experimental
work conducted in each chapter for current work. Based on the result obtained on
characterisation and reaction studies, the following points have been concluded;
i) A case study: BSG characterisation
Throughout this chapter, the major components of BSG waste were
extracted, quantified and characterised. The characterisation results have
shown that BSG is a lignocellulosic rich material with high moisture
content; 75.5 wt.% moisture, 8.5 wt.% cellulose, 7.4 wt.% hemicellulose,
6.5 wt.% lignin and 2.4 wt.% extractives content. The properties of
extracted cellulose and lignin were compare with commercial samples via
several characterisation techniques; FTIR spectroscopy, TGA and
elemental analysis. The overall composition of raw BSG used in current
work has also been compared with the values reported by other
researchers showing a high level of similarity. This chapter contributes a
significant understanding of components present in this agro-industrial
waste and thereby indicating possible routes for their utilisation.
ii) Preliminary study on HTL
The aim for the current preliminary study is to use model biomass;
cellulose and lignin in HTL to understand the reaction pathway and
behaviour of this major lignocellulosic component during HTL based on
their liquid product. The experiment was conducted in a single component
system and binary system to mimic real biomass. The results show that
146 | P a g e
Chapter 8: Conclusion and recommendation for future work
the used of water in HTL system able to break down the cellulose and
lignin into various chemical. Temperature plays a vital role for both
model compounds; high temperature was favourable for phenolics
products while cellulose decomposes at a lower temperature as compared
to lignin. The most favourable temperature for HTL was at 250 ºC.
iii) A case study: HTL of BSG
The liquid product obtained from HTL of BSG consist of a
complex mixture of mainly carbon, oxygen, hydrogen and nitrogen which
includes a multitude of carboxylic acids, aldehydes, alcohols, ketones,
phenols and also pyrazines. The product distribution obtained from real
biomass is significantly different when compared to the model biomass;
the composition of real biomass is more complicated than a binary
mixture of lignin and cellulose. These data strongly suggest that caution
should be taken when evaluating results obtained from research on the
model system as real biomass behave very differently. BSG HTL was
studied in the range of 15 min to 120 min reaction time, and the data
show that upon increasing the reaction time from 15 min to 30 min, there
is a significant increase in both conversion (73%) and WSO yield (22%)
in the BSG HTL reaction. However, increasing time beyond this point
causes a reduction in conversion and WSO production. Results also show
that the amount of liquid product is proportional with WSO yield obtained
in the system.
iv) Direct liquefaction of BSG: Effect of solvent
In a biomass liquefaction process, the presence of solvent promotes
such reactions as solvolysis, hydration, and pyrolysis, which helps
achieve better fragmentation of biomass and enhances dissolution of
reaction intermediates. In this chapter, the reaction process focusing on
direct liquefaction of BSG in different solvents and their effect on the
product distribution and the biochar obtained was investigated. The
147 | P a g e
Chapter 8: Conclusion and recommendation for future work
results show that with the addition of an organic solvent in direct
liquefaction reaction, the conversion increased significantly; MeOH-water
system provides the highest conversion at 82 %, followed by 77 %, 75 %
and 72 % for EtOH- water, 2-PrOH-water and water as the solvent,
respectively. It was found that the 2-PrOH-water system provides the
most favourable conditions of those studied with the highest liquid
product (10 g) and WSO yield (29 %) recorded. Based onWSO yield
obtained, the solvent efficiency in the BSG liquefaction can be sequenced
as follows: 2- PrOH- water > EtOH-water > water >MeOH-water. Further
investigation on BSG biochar as potential solid fuel also conducted by
undergone several characterisation techniques; FTIR spectroscopy,
proximate and ultimate analysis. Based on Van Krevelen plots, biochar
obtained in the present study can be used directly for coal-fuelled boilers
without the need for any modifications.
The overall data presented in this current work demonstrates that HTL process are
possible to use as an excellent conversion method for BSG to produce a useful
chemicals and valuable product. This process is meant to provide a conversion for
BSG waste which consists very high moisture content without drying and by
maintaining a liquid water processing medium as a green solvent.
8.2 Recommendation for future work
Results obtained in current work demonstrated the potential of direct
liquefaction in converting BSG as lignocellulosic biomass into useful chemicals.
However, further research is required to overcome the limitation in currents findings.
The following recommendation can be made to improve and continue the work
reported in here:
i) Further improved in separation and determination of the liquefaction
products is one of the main task, which should be considered in the
future work. Current method taken for analysing just the aqueous and
solid products seems need to be improved. For example, all the product
obtain throughout the liquefaction reaction should be taken into
148 | P a g e
Chapter 8: Conclusion and recommendation for future work
consideration and should be analyse (gas phase, liquid phase and solid
phase). These results may crucial to be determine qualitative and
quantitativelyfor better understanding into this liquefaction processes.
ii) In Chapter 7, it was shown that the addition of alcohol solvent
enhanced the production of liquid product and WSO yield in
liquefaction. Further research in solvent selection; i.e. type of solvent,
varying the mol ratio between water and solvent may be beneficial in
optimising this process.
iii) In the present work, the liquefaction reactions are conducted in non-
catalytic system. Water at subcritical condition is believe to act as both;
acidic and basic catalyst through self-dissociation at elevated
temperature. However, the used proper catalyst can improve the
liquefaction efficiency by suppressing char and tar formation (Toor,
Rosendahl and Rudolf, 2011; Stocker, 2013) andalso improve liquid
products quality (Huesemann et al., 2010). On top of that, by using
heterogeneous catalysts in the processes, it probably be an added value
to HTL. Duan& Savage, 2011, in their research found that the bio-
crude produced from liquefaction with Pd/C, Pt/ C, Ru/C, and
CoMo/Al2O3 flowed easily and were much less viscous than the bio-
crudes from uncatalysed or zeolite-catalysed liquefaction. Besides, they
also find that the different catalysts had different effects on the gas
yields and composition, which are Ni and Ru were the most effective
materials for increasing H2 yields and highest production of CH4.
iv) In regards to catalytic liquefaction, the liquefaction product and
potential catalyst should undergo characterisation in order to
understand the chemical and physical characteristic of the catalyst.
These characterisation methods will help in designing the desired
catalyst with high activity and selectivity. A combination of an active
catalyst and optimum reaction conditions must be developed and
confirmed by this characterization stages. The range of characterisation
149 | P a g e
Chapter 8: Conclusion and recommendation for future work
techniques used will provide different information on properties of
catalyst:
SEM-EDX and TEM: useful to understand the morphology and
elemental dispersion on the surface of the prepared catalyst.
Besides, EDX will provide the elemental composition on the
surface of the catalyst.
Nitrogen Adsorption (NA) and BET: the available method to
determine the wide range of pore size and pore volume
distribution of porous material catalyst which might effect in
catalytic selectivity in liquefaction process.
XRD: used to measure the structure of the catalyst and their
degree of crystallinity
v) Once the catalyst and the optimization of reaction conditions are developed,
this reaction can be apply to the other lignocellulosic biomass and their
product distribution should be recorded and compared. This stage will
contribute to a significant finding in this research which involves the
versatility of the liquefaction reaction conditions towards other
lignocellulosic biomass. Examples for other biomass waste are pine needle,
corn cob and potato peeling.
vi) Another interesting factor in biomass conversion is the applicability and
effectiveness of high-pressure CO2 and CO2–H2O technology for biomass
pretreatment. This system offer a potential as an alternative to conventional
methods such as acid-catalysed and water-only reactions and it has been
reviewed by (Relvas et al., 2015). They found that with presence of CO2 in
hydrothermal processes, it does allow in situ formation of acidic
environment, which promotes acid-catalyzed hydrolysis of biomass-derived
and without the typical disadvantages of acid-catalyzed reactions. In this
respect, (Van Walsum et al, 2007) also observed that the addition of CO2 to
water-only reactions allowed to hydrolyse pure xylan to produce xylose
oligomers at lower temperatures and at shorter holding times in comparison
to those obtained with autohydrolysis (water-only) technology.

150 | P a g e
9.REFERENCES
Achinas, S. and Euverink, G. J. W. (2016) ‗Consolidated briefing of biochemical
ethanol production from lignocellulosic biomass‘, Electronic Journal of
Biotechnology. Elsevier B.V., 23, pp. 44–53. doi: 10.1016/j.ejbt.2016.07.006.
Ail, S. S. and Dasappa, S. (2016) ‗Biomass to liquid transportation fuel via Fischer
Tropsch synthesis – Technology review and current scenario‘, Renewable and
Sustainable Energy Reviews, 58, pp. 267–286. doi: 10.1016/j.rser.2015.12.143.
Åkerlöf, G. (1932) ‗Dielectric constants of some organic solvent-water mixtures at
various temperatures‘, Journal of the American Chemical Society, 54(11), pp. 4125–
4139. doi: 10.1021/ja01350a001.
Akia, M., Yazdani, F. and Motaee, E. (2014) ‗A review on conversion of biomass to
biofuel by nanocatalysts‘, Biofuel Research …, 1, pp. 16–25. Available at:
http://www.biofueljournal.com/article_4747_0.html.
Aliyu, S. and Bala, M. (2013) ‗Brewer‘s spent grain: A review of its potentials and
applications‘, African Journal of Biotechnology, 10(3), pp. 324–331. doi:
10.4314/ajb.v10i3.
Alonso, D. M., Bond, J. Q. and Dumesic, J. A. (2010) ‗Catalytic conversion of
biomass to biofuels‘, Green Chemistry, 12(9), pp. 1493–1513. doi:
10.1039/c004654j.
Alonso, D. M., Wettstein, S. G. and Dumesic, J. a (2012) ‗Bimetallic catalysts for
upgrading of biomass to fuels and chemicals.‘, Chemical Society reviews, 41(24), pp.
8075–98. doi: 10.1039/c2cs35188a.
Álvarez-Murillo, A. et al. (2016) ‗Generation of biofuel from hydrothermal
carbonization of cellulose. Kinetics modelling‘, Energy, 94, pp. 600–608. doi:
10.1016/j.energy.2015.11.024.
Anselmo Filho, P. and Badr, O. (2004) ‗Biomass resources for energy in North-
Eastern Brazil‘, Applied Energy, 77(1), pp. 51–67. doi: 10.1016/S0306-
2619(03)00095-3.
Anukam, A. I. et al. (2017) ‗Studies on Characterization of Corn Cob for Application
in a Gasification Process for Energy Production‘, Journal of Chemistry, 2017. doi:
10.1155/2017/6478389.
Araújo, K. et al. (2017) ‗Global Biofuels at the Crossroads: An Overview of
Technical, Policy, and Investment Complexities in the Sustainability of Biofuel
Development‘, Agriculture, 7(4), p. 32. doi: 10.3390/agriculture7040032.
151 | P a g e
Arni, S. Al (2018) ‗Comparison of slow and fast pyrolysis for converting biomass
into fuel‘, 124, pp. 197–201.
Asghari, F. S. and Yoshida, H. (2006) ‗Acid-catalyzed production of 5-
hydroxymethyl furfural from D-fructose in subcritical water‘, Industrial and
Engineering Chemistry Research, 45(7), pp. 2163–2173. doi: 10.1021/ie051088y.
Atabani, A. E. et al. (2012) ‗A comprehensive review on biodiesel as an alternative
energy resource and its characteristics‘, Renewable and Sustainable Energy Reviews.
Elsevier Ltd, 16(4), pp. 2070–2093. doi: 10.1016/j.rser.2012.01.003.
Babu, B. V (2008) ‗Biomass pyrolysis : a state-of- the-art review‘, 031, pp. 393–414.
doi: 10.1002/bbb.
Bajpai, P. (2015) ‗Management of pulp and paper mill waste‘, Management of Pulp
and Paper Mill Waste, pp. 1–197. doi: 10.1007/978-3-319-11788-1.
Barakat, A., de Vries, H. and Rouau, X. (2013) ‗Dry fractionation process as an
important step in current and future lignocellulose biorefineries: A review‘,
Bioresource Technology. Elsevier Ltd, 134, pp. 362–373. doi:
10.1016/j.biortech.2013.01.169.
Barbier, J. et al. (2012) ‗Hydrothermal conversion of lignin compounds. A detailed
study of fragmentation and condensation reaction pathways‘, Biomass and
Bioenergy, 46, pp. 479–491. doi: 10.1016/j.biombioe.2012.07.011.
Besse, X., Schuurman, Y. and Guilhaume, N. (2015) ‗Hydrothermal conversion of
lignin model compound eugenol‘, Catalysis Today, 258, pp. 270–275. doi:
10.1016/j.cattod.2014.12.010.
Bhatnagar, A. and Sillanpää, M. (2010) ‗Utilization of agro-industrial and municipal
waste materials as potential adsorbents for water treatment-A review‘, Chemical
Engineering Journal, 157(2-3), pp. 277–296. doi: 10.1016/j.cej.2010.01.007.
Boeriu, C. G. et al. (2004) ‗Characterisation of structure-dependent functional
properties of lignin with infrared spectroscopy‘, Industrial Crops and Products,
20(2), pp. 205–218. doi: 10.1016/j.indcrop.2004.04.022.
Borugadda, V. B. and Goud, V. V. (2012) ‗Biodiesel production from renewable
feedstocks: Status and opportunities‘, Renewable and Sustainable Energy Reviews,
16(7), pp. 4763–4784. doi: 10.1016/j.rser.2012.04.010.
BP (2014) BP Energy Outlook 2035.
Brennan, L. and Owende, P. (2010) ‗Biofuels from microalgae-A review of
technologies for production, processing, and extractions of biofuels and co-products‘,
Renewable and Sustainable Energy Reviews, 14(2), pp. 557–577. doi:
10.1016/j.rser.2009.10.009.

152 | P a g e
Bridgwater, a (2003) ‗Renewable fuels and chemicals by thermal processing of
biomass‘, Chemical Engineering Journal, 91(2-3), pp. 87–102. Available at:
http://linkinghub.elsevier.com/retrieve/pii/S1385894702001420.
Bridgwater, a. V. (1999) ‗Principles and practice of biomass fast pyrolysis processes
for liquids‘, Journal of Analytical and Applied Pyrolysis, 51(1), pp. 3–22. doi:
10.1016/S0165-2370(99)00005-4.
Briens, C., Piskorz, J. and Berruti, F. (2008) ‗Biomass Valorization for Fuel and
Chemicals Production -- A Review‘, International Journal of Chemical Reactor
Engineering, 6(1). doi: 10.2202/1542-6580.1674.
Bye, J. W. et al. (2017) ‗Analysis of Mesoscopic Structured 2-Propanol/Water
Mixtures Using Pressure Perturbation Calorimetry and Molecular Dynamic
Simulation‘, Journal of Solution Chemistry. Springer US, 46(1), pp. 175–189. doi:
10.1007/s10953-016-0554-y.
Caetano, N. S. et al. (2013) ‗Bioethanol from Brewer ‘ s Spent Grains : Acid
Pretreatment Optimization‘, 35, pp. 1021–1026. doi: 10.3303/CET1335170.
Canabarro, N. et al. (2013) ‗Thermochemical processes for biofuels production from
biomass‘, Sustainable Chemical Processes, 1(1), p. 22. doi: 10.1186/2043-7129-1-
22.
Cao, L. et al. (2018) ‗Lignin valorization for the production of renewable chemicals:
State-of-the-art review and future prospects‘, Bioresource Technology. Elsevier,
269(June), pp. 465–475. doi: 10.1016/j.biortech.2018.08.065.
De Caprariis, B. et al. (2017) ‗Hydrothermal liquefaction of biomass: Influence of
temperature and biomass composition on the bio-oil production‘, Fuel. Elsevier Ltd,
208, pp. 618–625. doi: 10.1016/j.fuel.2017.07.054.
Carrier, M., Loppinet-Serani, A. and Denux, D. (2011) ‗Thermogravimetric analysis
as a new method to determine the lignocellulosic composition of biomass‘, Biomass
and Bioenergy, 35(1), pp. 298–307. doi: 10.1016/j.biombioe.2010.08.067.
Castellví Barnés, M. et al. (2017) ‗Wood Liquefaction: Role of Solvent‘, Industrial
and Engineering Chemistry Research, 56(3), pp. 635–644. doi:
10.1021/acs.iecr.6b04086.
Chakar, F. S. and Ragauskas, A. J. (2004) ‗Review of current and future softwood
kraft lignin process chemistry‘, Industrial Crops and Products, 20(2), pp. 131–141.
doi: 10.1016/j.indcrop.2004.04.016.
Chen, H. I. and Chang, H. Y. (2004) ‗Homogeneous precipitation of cerium dioxide
nanoparticles in alcohol/water mixed solvents‘, Colloids and Surfaces A:
Physicochemical and Engineering Aspects, 242(1-3), pp. 61–69. doi:
10.1016/j.colsurfa.2004.04.056.

153 | P a g e
Chen, W. T. et al. (2014) ‗Hydrothermal liquefaction of mixed-culture algal biomass
from wastewater treatment system into bio-crude oil‘, Bioresource Technology, 152,
pp. 130–139. doi: 10.1016/j.biortech.2013.10.111.
Chen, W.-H. et al. (2014) ‗Thermochemical conversion of microalgal biomass into
biofuels: A review.‘, Bioresource technology, 184, pp. 314–327. doi:
10.1016/j.biortech.2014.11.050.
Cherubini, F. (2010) ‗The biorefinery concept: Using biomass instead of oil for
producing energy and chemicals‘, Energy Conversion and Management, 51(7), pp.
1412–1421. doi: 10.1016/j.enconman.2010.01.015.
Chimica, I. and Uni, V. (2010) ‗Biomass Screening for the Production of Furfural via
Thermal Decomposition‘, pp. 2658–2671.
Crombie, K. et al. (2013) ‗The effect of pyrolysis conditions on biochar stability as
determined by three methods‘, GCB Bioenergy, 5(2), pp. 122–131. doi:
10.1111/gcbb.12030.
Demain, A. L. et al. (2005) ‗Cellulase, Clostridia, and Ethanol‘, 69(1), pp. 124–154.
doi: 10.1128/MMBR.69.1.124.
Demirbas, A. (2011) ‗Competitive liquid biofuels from biomass‘, Applied Energy.
Elsevier Ltd, 88(1), pp. 17–28. doi: 10.1016/j.apenergy.2010.07.016.
Demirbaş, A. (2000) ‗Mechanisms of liquefaction and pyrolysis reactions of
biomass‘, Energy Conversion and Management, 41(6), pp. 633–646. doi:
10.1016/S0196-8904(99)00130-2.
Demirbaş, A. (2001) ‗Biomass resource facilities and biomass conversion processing
for fuels and chemicals‘, Energy Conversion and Management, 42(11), pp. 1357–
1378. doi: 10.1016/S0196-8904(00)00137-0.
Deng, W., Zhang, Q. and Wang, Y. (2015) ‗Catalytic transformation of cellulose and
its derived carbohydrates into chemicals involving C-C bond cleavage‘, Journal of
Energy Chemistry, 24(5), pp. 595–607. doi: 10.1016/j.jechem.2015.08.016.
Déniel, M. et al. (2016) ‗Energy valorisation of food processing residues and model
compounds by hydrothermal liquefaction‘, Renewable and Sustainable Energy
Reviews, 54, pp. 1632–1652. doi: 10.1016/j.rser.2015.10.017.
Elliott, D. C. et al. (2014) ‗Bioresource Technology Hydrothermal liquefaction of
biomass : Developments from batch to continuous process‘, Bioresource Technology.
Elsevier Ltd, 178, pp. 147–156. doi: 10.1016/j.biortech.2014.09.132.
El‐Shafey, E. I. et al. (2004) ‗Dewatering of Brewer‘s Spent Grain Using a
Membrane Filter Press: A Pilot Plant Study‘, Separation Science and Technology,
39(14), pp. 3237–3261. doi: 10.1081/SS-200028775.
154 | P a g e
Ezeonu, F. C. and Okaka, a. N. C. (1996) ‗Process kinetics and digestion efficiency
of anaerobic batch fermentation of brewer‘s spent grains (BSG)‘, Process
Biochemistry, 31(1), pp. 7–12. doi: 10.1016/0032-9592(94)00064-6.
Fan, M., Dai, D. and Huang, B. (2012) ‗Fourier Transform Infrared Spectroscopy for
Natural Fibres‘, Fourier Transform - Materials Analysis. doi: 10.5772/35482.
Fărcaş, A. et al. (2014) ‗Brewers ‘ spent grain – A new potential ingredient for
functional foods‘, Journal of Agroalimentary Processes and Technologies, 20(2), pp.
137–141.
Fernando, S. et al. (2006) ‗Biorefineries: Current Status, Challenges, and Future
Direction‘, Energy & Fuels, 20(4), pp. 1727–1737. doi: 10.1021/ef060097w.
Fillaudeau, L., Blanpain-Avet, P. and Daufin, G. (2006) ‗Water, wastewater and
waste management in brewing industries‘, Journal of Cleaner Production, 14(5), pp.
463–471. doi: 10.1016/j.jclepro.2005.01.002.
Forster-Carneiro, T. et al. (2013a) ‗Biorefinery study of availability of agriculture
residues and wastes for integrated biorefineries in Brazil‘, Resources, Conservation
and Recycling. Elsevier B.V., 77, pp. 78–88. doi: 10.1016/j.resconrec.2013.05.007.
Forster-Carneiro, T. et al. (2013b) ‗Biorefinery study of availability of agriculture
residues and wastes for integrated biorefineries in Brazil‘, Resources, Conservation
and Recycling. Elsevier B.V., 77, pp. 78–88. doi: 10.1016/j.resconrec.2013.05.007.
G. Peter Van Walsum (2007) ‗Effect of Dissolved Co2 on Accumulation of Organic
Acids in Liquid Hot Water Pretrheated Biomass Hydrolyzates‘, 136, pp. 301–312.
Gabrielle, B. et al. (2007) ‗Life-cycle assessment of straw use in bio-ethanol
production : a case-study based on biophysical modelling production : a case-study
based on biophysical modelling . Environment and Arable Crops Research Unit ,
Institut National de la.‘
Gai, C. et al. (2015) ‗Characterization of aqueous phase from the hydrothermal
liquefaction of Chlorella pyrenoidosa‘, Bioresource Technology. Elsevier Ltd, 184,
pp. 328–335. doi: 10.1016/j.biortech.2014.10.118.
Gallezot, P. (2012) ‗Conversion of biomass to selected chemical products‘, Chem.
Soc. Rev., 41(4), pp. 1538–1558. doi: 10.1039/C1CS15147A.
Ganesh D. Saratale (2012) ‗Lignocellulosics to ethanol: The future of the chemical
and energy industry‘, African Journal of Biotechnology, 11(5), pp. 1002–1013. doi:
10.5897/AJB10.897.
Gao, Y. et al. (2011) ‗Characterization of products from hydrothermal liquefaction
and carbonation of biomass model compounds and real biomass‘, Journal of Fuel
Chemistry and Technology. Institute of Coal Chemistry, Chinese Academy of
Sciences, 39(12), pp. 893–900. doi: 10.1016/S1872-5813(12)60001-2.
155 | P a g e
Garcia, R. et al. (2013) ‗Biomass proximate analysis using thermogravimetry‘,
Bioresource Technology. Elsevier Ltd, 139, pp. 1–4. doi:
10.1016/j.biortech.2013.03.197.
García, R. et al. (2012) ‗Characterization of Spanish biomass wastes for energy use‘,
Bioresource Technology, 103(1), pp. 249–258. doi: 10.1016/j.biortech.2011.10.004.
Gaul, M. (2012) ‗Energy for Sustainable Development An analysis model for small-
scale rural energy service pathways — Applied to Jatropha -based energy services in
Sumbawa , Indonesia‘, Energy for Sustainable Development. International Energy
Initiative, 16(3), pp. 283–296. doi: 10.1016/j.esd.2012.05.001.
GBEP (2007) ‗A Review of the Current State of Bioenergy Development in G8 +5
Countries‘, Environment, pp. 1–276. Available at: www.globalbioenergy.org.
Gollakota, A. R. K., Kishore, N. and Gu, S. (2018) ‗A review on hydrothermal
liquefaction of biomass‘, Renewable and Sustainable Energy Reviews, 81(April
2017), pp. 1378–1392. doi: 10.1016/j.rser.2017.05.178.
Güngören Madenoǧlu, T. et al. (2016) ‗Hydrothermal gasification of biomass model
compounds (cellulose and lignin alkali) and model mixtures‘, Journal of
Supercritical Fluids, 115, pp. 79–85. doi: 10.1016/j.supflu.2016.04.017.
Gupta, N. (2007) EFFECT OF VARIOUS FILLERS ON PHYSICAL AND OPTICAL
PROPERTIES OF AGRO-STRAW PAPERS. THAPAR UNIVERSITY, India.
Harmsen, P. and Huijgen, W. (2010) ‗Literature Review of Physical and Chemical
Pretreatment Processes for Lignocellulosic Biomass‘, Energy, (September), pp. 1–49.
Available at: http://www.ecn.nl/docs/library/report/2010/e10013.pdf.
Hassan, E. B. M. and Shukry, N. (2008) ‗Polyhydric alcohol liquefaction of some
lignocellulosic agricultural residues‘, Industrial Crops and Products, 27(1), pp. 33–
38. doi: 10.1016/j.indcrop.2007.07.004.
Hegner, J. et al. (2010) ‗Conversion of cellulose to glucose and levulinic acid via
solid-supported acid catalysis‘, Tetrahedron Letters. Elsevier Ltd, 51(17), pp. 2356–
2358. doi: 10.1016/j.tetlet.2010.02.148.
Hopfgartner, G. (2008) ‗Theory and Instrumentation of Mass Spectrometry‘, in
Ramanathan, R. (ed.) Mass Spectrometry in Drug Metabolism and Disposition: Basic
Principles and Applications, pp. 275–293. doi: 10.1002/9780470409817.
Hu, S. et al. (2008) ‗Characterization of char from rapid pyrolysis of rice husk‘, Fuel
Processing Technology. Elsevier B.V., 89(11), pp. 1096–1105. doi:
10.1016/j.fuproc.2008.05.001.
Huang, H. and Yuan, X. (2015) ‗Recent progress in the direct liquefaction of typical
biomass‘, Progress in Energy and Combustion Science, 49, pp. 59–80. doi:
10.1016/j.pecs.2015.01.003.

156 | P a g e
Huang, Y.-B. and Fu, Y. (2013) ‗Hydrolysis of cellulose to glucose by solid acid
catalysts‘, Green Chemistry, 15(5), p. 1095. doi: 10.1039/c3gc40136g.
Huesemann, M. et al. (2010) Biofuels from Microalgae and Seaweeds, Biomass to
Biofuels: Strategies for Global Industries. doi: 10.1002/9780470750025.ch8.
Iqbal, H. M. N., Kyazze, G. and Keshavarz, T. (2013) ‗Advances in the valorization
of lignocellulosic materials by biotechnology: An overview‘, BioResources, 8(2), pp.
3157–3176.
Iserentant, D. (1995) ‗Beers: Recent Technological Innovation in Brewing‘, in
Piggott, J. R., Lea, A. G. H. (ed.) Fermented Baverage Production. First Edit.
Chapman & Hall, pp. 45–62. doi: 10.1007/978-1-4615-0187-9_3.
Isikgor, F. H. and Becer, C. R. (2015) ‗Lignocellulosic biomass: a sustainable
platform for the production of bio-based chemicals and polymers‘, Polym. Chem.
Royal Society of Chemistry, 6(25), pp. 4497–4559. doi: 10.1039/C5PY00263J.
J. Sluiter, A. A. S. R. R. C. S. and Templeton, D. (2008) ‗Determination of
Extractives in Biomass: Laboratory Analytical Procedure (LAP); Issue Date
7/17/2005 - 42619.pdf‘, Technical Report NREL/TP-510-42619, (January), pp. 1–9.
doi: NREL/TP-510-42621.
James H. Clark, F. D. (2011) ‗Introduction to Chemicals from Biomass (Google
eBook)‘, in, p. 198. Available at: http://books.google.com/books?id=h-
57eVISZDIC&pgis=1.
Jazrawi, C. et al. (2015) ‗Two-stage hydrothermal liquefaction of a high-protein
microalga‘, Algal Research. Elsevier B.V., 8, pp. 15–22. doi:
10.1016/j.algal.2014.12.010.
Kanaujia, P. K. et al. (2014) ‗Review of analytical strategies in the production and
upgrading of bio-oils derived from lignocellulosic biomass‘, Journal of Analytical
and Applied Pyrolysis. Elsevier B.V., 105, pp. 55–74. doi:
10.1016/j.jaap.2013.10.004.
Kang, Q. et al. (2014) ‗Bioethanol from Lignocellulosic Biomass: Current Findings
Determine Research Priorities‘, The Scientific World Journal, 2014(Ci), pp. 1–13.
doi: 10.1155/2014/298153.
Kang, S. et al. (2013) ‗Hydrothermal conversion of lignin: A review‘, Renewable
and Sustainable Energy Reviews, 27, pp. 546–558. doi: 10.1016/j.rser.2013.07.013.
Karagoz, S. et al. (2005) ‗Comparative studies of oil compositions produced from
sawdust , rice husk , lignin and cellulose by hydrothermal treatment‘, 84, pp. 875–
884. doi: 10.1016/j.fuel.2005.01.004.
Karagöz, S. et al. (2004) ‗Low-temperature hydrothermal treatment of biomass:
Effect of reaction parameters on products and boiling point distributions‘, Energy
and Fuels, 18(1), pp. 234–241. doi: 10.1021/ef030133g.
157 | P a g e
Karagöz, S. et al. (2005) ‗Low-temperature catalytic hydrothermal treatment of wood
biomass: Analysis of liquid products‘, Chemical Engineering Journal, 108, pp. 127–
137. doi: 10.1016/j.cej.2005.01.007.
Khan, A. A. et al. (2009) ‗Biomass combustion in fluidized bed boilers: Potential
problems and remedies‘, Fuel Processing Technology. Elsevier B.V., 90(1), pp. 21–
50. doi: 10.1016/j.fuproc.2008.07.012.
Kleinert, M. and Barth, T. (2008) ‗Phenols from lignin‘, Chemical Engineering and
Technology, 31(5), pp. 736–745. doi: 10.1002/ceat.200800073.
Kruse, A. (2009) ‗Hydrothermal biomass gasification‘, Journal of Supercritical
Fluids, 47(3), pp. 391–399. doi: 10.1016/j.supflu.2008.10.009.
Kruse, A. and Dahmen, N. (2015) ‗Water - A magic solvent for biomass conversion‘,
Journal of Supercritical Fluids, 96, pp. 36–45. doi: 10.1016/j.supflu.2014.09.038.
Kruse, A. and Dinjus, E. (2007) ‗Hot compressed water as reaction medium and
reactant. Properties and synthesis reactions‘, Journal of Supercritical Fluids, 39(3),
pp. 362–380. doi: 10.1016/j.supflu.2006.03.016.
Kubo, S. and Kadla, J. F. (2005) ‗Hydrogen bonding in lignin: A fourier transform
infrared model compound study‘, Biomacromolecules, 6(5), pp. 2815–2821. doi:
10.1021/bm050288q.
Kumar, M., Olajire Oyedun, A. and Kumar, A. (2018) ‗A review on the current
status of various hydrothermal technologies on biomass feedstock‘, Renewable and
Sustainable Energy Reviews. Elsevier Ltd, 81(May 2017), pp. 1742–1770. doi:
10.1016/j.rser.2017.05.270.
Kumar, R. et al. (2016) ‗Recent updates on lignocellulosic biomass derived ethanol -
A review‘, Biofuel Research Journal, 3(1), pp. 347–356. doi:
10.18331/BRJ2016.3.1.4.
Kumar, S. and Gupta, R. B. (2008) ‗Hydrolysis of Microcrystalline Cellulose in
Subcritical and Supercritical Water in a Continuous Flow Reactor‘, pp. 9321–9329.
Lai, F. ying et al. (2018) ‗Liquefaction of sewage sludge in ethanol-water mixed
solvents for bio-oil and biochar products‘, Energy, 148, pp. 629–641. doi:
10.1016/j.energy.2018.01.186.
Laine, C. (2015) ‗Hydrothermal refining of biomass — an overview and future
perspectives‘, Tappi Journal, 14(3), pp. 195–207.
Lange, J. P. et al. (2012) ‗Furfural-A promising platform for lignocellulosic
biofuels‘, ChemSusChem, 5(1), pp. 150–166. doi: 10.1002/cssc.201100648.
Laskar, D. D. et al. (2013) ‗Pathways for biomass-derived lignin to hydrocarbon
fuels †‘, pp. 602–626. doi: 10.1002/bbb.
158 | P a g e
Lee, H. V, Hamid, S. B. a and Zain, S. K. (2014) ‗Conversion of Lignocellulosic
Biomass to Nanocellulose: Structure and Chemical Process‘, 2014. doi:
10.1155/2014/631013.
Lehr, V. et al. (2007) ‗Catalytic dehydration of biomass-derived polyols in sub- and
supercritical water‘, Catalysis Today, 121(1-2), pp. 121–129. doi:
10.1016/j.cattod.2006.11.014.
Li, R. et al. (2014) ‗Mesoscopic structuring and dynamics of alcohol/water solutions
probed by terahertz time-domain spectroscopy and pulsed field gradient nuclear
magnetic resonance‘, Journal of Physical Chemistry B, 118(34), pp. 10156–10166.
doi: 10.1021/jp502799x.
Limayem, A. and Ricke, S. C. (2012) ‗Lignocellulosic biomass for bioethanol
production: Current perspectives, potential issues and future prospects‘, Progress in
Energy and Combustion Science, 38(4), pp. 449–467. doi:
10.1016/j.pecs.2012.03.002.
Liu, H. M. et al. (2013) ‗Understanding the mechanism of cypress liquefaction in
hot-compressed water through characterization of solid residues‘, Energies, 6(3), pp.
1590–1603. doi: 10.3390/en6031590.
Liu, W. et al. (2012) ‗Efficient Conversion of Cellulose to Glucose, Levulinic Acid,
and Other Products in Hot Water Using SO 2 as a Recoverable Catalyst‘, Industrial
and Engineering Chemistry Research, 51, pp. 15503–15508. doi: 10.1021/ie302317t.
Liu, Z. and Zhang, F.-S. (2008) ‗Effects of various solvents on the liquefaction of
biomass to produce fuels and chemical feedstocks‘, Energy Conversion and
Management, 49(12), pp. 3498–3504. doi: 10.1016/j.enconman.2008.08.009.
Lynch, K. M., Steffen, E. J. and Arendt, E. K. (2016) ‗Brewers‘ spent grain: a review
with an emphasis on food and health‘, Journal of the Institute of Brewing, 122(4), pp.
553–568. doi: 10.1002/jib.363.
M.Schwanninnger (2004) ‗Effect of short-time vibratory ball milling on the shape of
FT-IR spectra of wood and cellulose‘, Vibrational Spectroscopy, (36), pp. 23–40.
doi: 10.15713/ins.mmj.3.
Mahmood, A. S. N. et al. (2013) ‗The intermediate pyrolysis and catalytic steam
reforming of Brewers spent grain‘, Journal of Analytical and Applied Pyrolysis, 103,
pp. 328–342. doi: 10.1016/j.jaap.2012.09.009.
Mahmood, A. S. N. et al. (2013) ‗The intermediate pyrolysis and catalytic steam
reforming of Brewers spent grain‘, in Journal of Analytical and Applied Pyrolysis,
pp. 328–342.
Maity, S. K. (2015) ‗Opportunities, recent trends, and challenges of integrated
biorefinery: Part I‘, Renewable Sustainable Energy Rev. Elsevier, 43, pp. 1427–1445.
doi: 10.1016/j.rser.2014.11.092.

159 | P a g e
Malomo, O. (2013) ‗The Use of Brewer′S Spent Grains in the Cultivation of Some
Fungal Isolates‘, International Journal of Nutrition and Food Sciences, 2(1), p. 5.
doi: 10.11648/j.ijnfs.20130201.12.
McGregor, J. et al. (2015) ‗Structure and dynamics of aqueous 2-propanol: A THz-
TDS, NMR and neutron diffraction study‘, Physical Chemistry Chemical Physics.
Royal Society of Chemistry, 17(45), pp. 30481–30491. doi: 10.1039/c5cp01132a.
Mckendry, P. (2002) ‗Energy production from biomass ( Part 1 ): Overview of
biomass‘, 83(February), pp. 37–46. doi: 10.1016/S0960-8524(01)00118-3.
McKendry, P. (2002a) ‗Energy production from biomass (part 1): Overview of
biomass‘, Bioresource Technology, 83(1), pp. 37–46. doi: 10.1016/S0960-
8524(01)00118-3.
McKendry, P. (2002b) ‗Energy production from biomass (part 2): Conversion
technologies‘, Bioresource Technology, 83(1), pp. 47–54. doi: 10.1016/S0960-
8524(01)00119-5.
Meneses, N. G. T. et al. (2013) ‗Influence of extraction solvents on the recovery of
antioxidant phenolic compounds from brewer‘s spent grains‘, Separation and
Purification Technology. Elsevier B.V., 108, pp. 152–158. doi:
10.1016/j.seppur.2013.02.015.
Mika, T. L., Edit, C. and Horvath, I. T. (2015) ‗The role of water in catalytic
biomass-based technologies to produce chemicals and fuels‘, Catalysis Today, 247,
pp. 33–46. doi: 10.1016/j.cattod.2014.10.043.
Miles, T. R. et al. (1996) ‗Boiler deposits from firing biomass fuels‘, Biomass and
Bioenergy, 10(2-3), pp. 125–138. doi: 10.1016/0961-9534(95)00067-4.
Milne, T. A. and Evans, R. J. (1998) ‗Biomass Gasifier ― Tars ‖: Their Nature ,
Formation , and Conversion Biomass Gasifier ― Tars ‖: Their Nature , Formation ,
and Conversion‘, (November).
Mohanty, P. et al. (2014) ‗Synthesis of green fuels from biogenic waste through
thermochemical route – The role of heterogeneous catalyst: A review‘, Renewable
and Sustainable Energy Reviews, 38, pp. 131–153. doi: 10.1016/j.rser.2014.05.011.
Mussatto, S. I. et al. (2010) ‗Production, characterization and application of activated
carbon from brewer‘s spent grain lignin.‘, Bioresource technology. Elsevier Ltd,
101(7), pp. 2450–7. doi: 10.1016/j.biortech.2009.11.025.
Mussatto, S. I. (2014) ‗Brewer‘s spent grain: a valuable feedstock for industrial
applications.‘, Journal of the science of food and agriculture, 94(7), pp. 1264–75.
doi: 10.1002/jsfa.6486.
Mussatto, S. I., Dragone, G. and Roberto, I. C. (2006) ‗Brewers‘ spent grain:
generation, characteristics and potential applications‘, Journal of Cereal Science,
43(1), pp. 1–14. doi: 10.1016/j.jcs.2005.06.001.
160 | P a g e
Mussatto, S. I. and Roberto, I. C. (2005) ‗Acid hydrolysis and fermentation of
brewer‘s spent grain to produce xylitol‘, Journal of the Science of Food and
Agriculture, 85(December 2004), pp. 2453–2460. doi: 10.1002/jsfa.2276.
Nagy, M. (2009) Biofuels from lignin and novel biodiesel analysis. Georgia Institute
of Technology.
Nanda, S. et al. (2013) ‗Characterization of North American Lignocellulosic
Biomass and Biochars in Terms of their Candidacy for Alternate Renewable Fuels‘,
Bioenergy Research, 6(2), pp. 663–677. doi: 10.1007/s12155-012-9281-4.
Nazari, L. et al. (2015) ‗Hydrothermal liquefaction of woody biomass in hot-
compressed water: Catalyst screening and comprehensive characterization of bio-
crude oils‘, Fuel. Elsevier Ltd, 162, pp. 74–83. doi: 10.1016/j.fuel.2015.08.055.
Nigam, P. S. and Singh, A. (2011) ‗Production of liquid biofuels from renewable
resources‘, Progress in Energy and Combustion Science. Elsevier Ltd, 37(1), pp. 52–
68. doi: 10.1016/j.pecs.2010.01.003.
Nizamuddin, S. et al. (2017) ‗An overview of e ff ect of process parameters on
hydrothermal carbonization of biomass‘, 73(December 2016), pp. 1289–1299. doi:
10.1016/j.rser.2016.12.122.
Özbay, N. et al. (2001) ‗Biocrude from biomass: pyrolysis of cottonseed cake‘,
Renewable Energy, 24(3-4), pp. 615–625. doi: 10.1016/S0960-1481(01)00048-9.
Pasangulapati, V. et al. (2012) ‗Effects of cellulose, hemicellulose and lignin on
thermochemical conversion characteristics of the selected biomass‘, Bioresource
Technology, 114, pp. 663–669. doi: 10.1016/j.biortech.2012.03.036.
Pathak, B., Chaudhari, S. and Fulekar, M. H. (2013) ‗Biomass - Resource for
Sustainable Development‘, 2(6), pp. 271–289.
Pavlovič, I., Knez, Ž. and Škerget, M. (2013) ‗Hydrothermal reactions of agricultural
and food processing wastes in sub- and supercritical water: A review of
fundamentals, mechanisms, and state of research‘, Journal of Agricultural and Food
Chemistry, 61(34), pp. 8003–8025. doi: 10.1021/jf401008a.
Perkin Elmer (2004) ‗Thermogravimetric Analysis (TGA)‘, Perkin Elmer, (June), pp.
3–19. doi: 10.1198/tech.2005.s328.
Peterson, A. a. et al. (2008) ‗Thermochemical biofuel production in hydrothermal
media: A review of sub- and supercritical water technologies‘, Energy &
Environmental Science, 1(1), p. 32. doi: 10.1039/b810100k.
Peterson, A. A. et al. (2008) ‗Thermochemical biofuel production in hydrothermal
media: A review of sub- and supercritical water technologies‘, Energy &
Environmental Science, 1(1), p. 32. doi: 10.1039/b810100k.
161 | P a g e
Peterson, A. A., Lachance, R. P. and Tester, J. W. (2010) ‗Kinetic evidence of the
maillard reaction in hydrothermal biomass processing: Glucose-glycine interactions
in high-temperature, high-pressure water‘, Industrial and Engineering Chemistry
Research, 49(5), pp. 2107–2117. doi: 10.1021/ie9014809.
Pileidis, F. D. and Titirici, M. M. (2016) ‗Levulinic Acid Biorefineries: New
Challenges for Efficient Utilization of Biomass‘, ChemSusChem, 9(6), pp. 562–582.
doi: 10.1002/cssc.201501405.
Pińkowska, H., Wolak, P. and Złocińska, A. (2012) ‗Hydrothermal decomposition of
alkali lignin in sub- and supercritical water‘, Chemical Engineering Journal, 187, pp.
410–414. doi: 10.1016/j.cej.2012.01.092.
Poerschmann, J. et al. (2014) ‗Bioresource Technology Characterization of biocoals
and dissolved organic matter phases obtained upon hydrothermal carbonization of
brewer ‘ s spent grain‘, Bioresource Technology, 164, pp. 162–169. doi:
10.1016/j.biortech.2014.04.052.
Quispe, C. a. G., Coronado, C. J. R. and Carvalho Jr., J. a. (2013) ‗Glycerol:
Production, consumption, prices, characterization and new trends in combustion‘,
Renewable and Sustainable Energy Reviews. Elsevier, 27, pp. 475–493. doi:
10.1016/j.rser.2013.06.017.
Ragauskas, A. J. et al. (2006) ‗The path forward for biofuels and biomaterials.‘,
Science (New York, N.Y.), 311(5760), pp. 484–489. doi: 10.1126/science.1114736.
Reddy, N. and Yang, Y. (2005) ‗Biofibers from agricultural byproducts for industrial
applications‘, Trends in Biotechnology, 23(1), pp. 22–27. doi:
10.1016/j.tibtech.2004.11.002.
Relvas, F. M., Morais, A. R. C. and Bogel-Lukasik, R. (2015) ‗Selective hydrolysis
of wheat straw hemicellulose using high-pressure CO 2 as catalyst‘, RSC Adv. Royal
Society of Chemistry, 5(90), pp. 73935–73944. doi: 10.1039/C5RA14632A.
Del Río, J. C., Prinsen, P. and Gutiérrez, A. (2013) ‗Chemical composition of lipids
in brewer‘s spent grain: A promising source of valuable phytochemicals‘, Journal of
Cereal Science, 58(2), pp. 248–254. doi: 10.1016/j.jcs.2013.07.001.
Rodríguez-Gutiérrez, G. et al. (2014) ‗Properties of lignin, cellulose, and
hemicelluloses isolated from olive cake and olive stones: Binding of water, oil, bile
acids, and glucose‘, Journal of Agricultural and Food Chemistry, 62(36), pp. 8973–
8981. doi: 10.1021/jf502062b.
Van Rossum, G. et al. (2014) ‗Liquefaction of lignocellulosic biomass: Solvent,
process parameter, and recycle oil screening‘, ChemSusChem, 7(1), pp. 253–259.
doi: 10.1002/cssc.201300297.
Rubin, E. M. (2008) ‗Genomics of cellulosic biofuels.‘, Nature, 454(7206), pp. 841–
845. doi: 10.1038/nature07190.

162 | P a g e
Russ, W., Mörtel, H. and Meyer-Pittroff, R. (2005) ‗Application of spent grains to
increase porosity in bricks‘, Construction and Building Materials, 19(2), pp. 117–
126. doi: 10.1016/j.conbuildmat.2004.05.014.
Saisu, M. et al. (2003) ‗Conversion of lignin with supercritical water-phenol
mixtures‘, Energy and Fuels, 17(4), pp. 922–928. doi: 10.1021/ef0202844.
Saldarriaga, J. F. et al. (2015) ‗Fast characterization of biomass fuels by
thermogravimetric analysis (TGA)‘, Fuel. Elsevier Ltd, 140, pp. 744–751. doi:
10.1016/j.fuel.2014.10.024.
Samuelsson, R., Burvall, J. and Jirjis, R. (2006) ‗Comparison of different methods
for the determination of moisture content in biomass‘, Biomass and Bioenergy,
30(11), pp. 929–934. doi: 10.1016/j.biombioe.2006.06.004.
Saxena, R. C., Adhikari, D. K. and Goyal, H. B. (2009a) ‗Biomass-based energy fuel
through biochemical routes: A review‘, Renewable and Sustainable Energy Reviews,
13(1), pp. 167–178. doi: 10.1016/j.rser.2007.07.011.
Saxena, R. C., Adhikari, D. K. and Goyal, H. B. (2009b) ‗Biomass-based energy fuel
through biochemical routes: A review‘, Renewable and Sustainable Energy Reviews,
13(1), pp. 167–178. doi: 10.1016/j.rser.2007.07.011.
Sežun, M. et al. (2011) ‗Anaerobic digestion of brewery spent grain in a semi-
continuous bioreactor: Inhibition by phenolic degradation products‘, Acta Chimica
Slovenica, 58(1), pp. 158–166.
Sills, D. L. and Gossett, J. M. (2012) ‗Using FTIR to Predict Saccharification From
Enzymatic Hydrolysis of Alkali-Pretreated Biomasses‘, 109(2), pp. 353–362. doi:
10.1002/bit.23314.
Silva, J. P. et al. (2004) ‗Adsorption of acid orange 7 dye in aqueous solutions by
spent brewery grains‘, Separation and Purification Technology, 40(3), pp. 309–315.
doi: 10.1016/j.seppur.2004.03.010.
Singh, R. et al. (2015) ‗Conversion of rice straw to monomeric phenols under
supercritical methanol and ethanol.‘, Bioresource technology. Elsevier Ltd, 188, pp.
280–6. doi: 10.1016/j.biortech.2015.01.001.
Sneddon, J., Masuram, S. and Richert, J. C. (2007) ‗Gas Chromatography‐Mass
Spectrometry‐Basic Principles, Instrumentation and Selected Applications for
Detection of Organic Compounds‘, Analytical Letters, 40(6), pp. 1003–1012. doi:
10.1080/00032710701300648.
Stocker, M. (2013) ‗Catalytic Hydrotreatment of Bio-Oils for High-Quality Fuel
Production‘, (Chapter 11), pp. 351–396. Available at: https://doi.org/10.1016/B978-
0-444-56330-9.00011-5.
163 | P a g e
Stöcker, M. (2008) ‗Biofuels and biomass-to-liquid fuels in the biorefinery: catalytic
conversion of lignocellulosic biomass using porous materials.‘, Angewandte Chemie
(International ed. in English), 47(48), pp. 9200–11. doi: 10.1002/anie.200801476.
Stojceska, V. et al. (2008) ‗The recycling of brewer‘s processing by-product into
ready-to-eat snacks using extrusion technology‘, Journal of Cereal Science, 47(3),
pp. 469–479. doi: 10.1016/j.jcs.2007.05.016.
Stuart, B. H. (2004) Infrared Spectroscopy: Fundamentals and Applications, Wiley.
doi: 10.1002/0470011149.
Sumit Sharma et al. (2014) ‗Biomass Conversion Technologies for Renewable
Energy and Fuels: A Review Note.‘, IOSR Journal of Mechanical and Civil
Engineering (IOSR-JMCE), 11(2), pp. 28–35. Available at:
http://www.iosrjournals.org/iosr-jmce/papers/vol11-issue2/Version-
3/C011232835.pdf.
Sun, Y. and Cheng, J. (2002) ‗Hydrolysis of lignocellulosic materials for ethanol
production: A review‘, Bioresource Technology, 83, pp. 1–11. doi: 10.1016/S0960-
8524(01)00212-7.
Suryanarayana, C. (2001) ‗Mechanical alloying and milling‘, Progress in Materials
Science, 46(1-2), pp. 1–184. doi: 10.1016/S0079-6425(99)00010-9.
Tan, H. W., Abdul Aziz, a. R. and Aroua, M. K. (2013) ‗Glycerol production and its
applications as a raw material: A review‘, Renewable and Sustainable Energy
Reviews, 27, pp. 118–127. doi: 10.1016/j.rser.2013.06.035.
Tanger, P. et al. (2013) ‗Biomass for thermochemical conversion: targets and
challenges‘, Frontiers in Plant Science, 4(July), pp. 1–20. doi:
10.3389/fpls.2013.00218.
Technical Association of Pulp and Paper Industry (1997) ‗T204 cm-97. Solvent
extractives of wood and pulp.‘, TAPPI test methods, p. 12. doi: 10.5772/916.
Tekin, K., Karagöz, S. and Bektaş, S. (2014) ‗A review of hydrothermal biomass
processing‘, Renewable and Sustainable Energy Reviews, 40, pp. 673–687. doi:
10.1016/j.rser.2014.07.216.
Telmo, C. and Lousada, J. (2011) ‗The explained variation by lignin and extractive
contents on higher heating value of wood‘, Biomass and Bioenergy, 35(5), pp. 1663–
1667. doi: 10.1016/j.biombioe.2010.12.038.
Thomas, K. R. and Rahman, P. K. S. M. (2006) ‗Brewery wastes . Strategies for
sustainability . A review‘, Aspects of Applied Biology, 80, pp. 147–153.
Titirici, M. M. and Antonietti, M. (2010) ‗Chemistry and materials options of
sustainable carbon materials made by hydrothermal carbonization‘, Chemical Society
Reviews, 39(1), pp. 103–116. doi: 10.1039/b819318p.
164 | P a g e
Toor, S. S., Rosendahl, L. and Rudolf, A. (2011) ‗Hydrothermal liquefaction of
biomass: A review of subcritical water technologies‘, Energy, 36(5), pp. 2328–2342.
doi: 10.1016/j.energy.2011.03.013.
Tucker, M. P. et al. (2001) ‗Fourier transform infrared quantitative analysis of sugars
and lignin in pretreated softwood solid residues‘, Applied Biochemistry and
Biotechnology - Part A Enzyme Engineering and Biotechnology, 91-93, pp. 51–61.
doi: 10.1385/ABAB:91-93:1-9:51.
Vanreppelen, K. et al. (2014) ‗Activated carbon from pyrolysis of brewer‘s spent
grain: Production and adsorption properties‘, Waste Management and Research,
32(7), pp. 634–645. doi: 10.1177/0734242X14538306.
Vassilev, S. V. et al. (2010) ‗An overview of the chemical composition of biomass‘,
Fuel, 89(5), pp. 913–933. doi: 10.1016/j.fuel.2009.10.022.
Wahyudiono et al. (2007) ‗Decomposition of a lignin model compound under
hydrothermal conditions‘, Chemical Engineering and Technology, 30(8), pp. 1113–
1122. doi: 10.1002/ceat.200700066.
Wahyudiono, Sasaki, M. and Goto, M. (2008) ‗Recovery of phenolic compounds
through the decomposition of lignin in near and supercritical water‘, Chemical
Engineering and Processing: Process Intensification, 47(9-10), pp. 1609–1619. doi:
10.1016/j.cep.2007.09.001.
Waters, D. M. et al. (2012) ‗Fibre, protein and mineral fortification of wheat bread
through milled and fermented brewer‘s spent grain enrichment‘, European Food
Research and Technology, 235(5), pp. 767–778. doi: 10.1007/s00217-012-1805-9.
Watkins, D. et al. (2015) ‗Extraction and characterization of lignin from different
biomass resources‘, Journal of Materials Research and Technology. Korea Institute
of Oriental Medicine, 4(1), pp. 26–32. doi: 10.1016/j.jmrt.2014.10.009.
Weger, A. et al. (2014) ‗Solid Biofuel Production by Mechanical Pre-Treatment of
Brewers ‘ Spent Grain‘, 37, pp. 661–666. doi: 10.3303/CET1437111.
Weingarten, R., Conner, W. C. and Huber, G. W. (2012) ‗Production of levulinic
acid from cellulose by hydrothermal decomposition combined with aqueous phase
dehydration with a solid acid catalyst‘, Energy and Environmental Science, 5(6), pp.
7559–7574. doi: 10.1039/c2ee21593d.
Werpy, T. and Petersen, G. (2004) ‗Top Value Added Chemicals from Biomass
Volume I — Results of Screening for Potential Candidates from Sugars and
Synthesis Gas Top Value Added Chemicals From Biomass Volume I : Results of
Screening for Potential Candidates‘, Other Information: PBD: 1 Aug 2004, p.
Medium: ED; Size: 76 pp. pages. doi: 10.2172/15008859.
White, J. S., Yohannan, B. K. and Walker, G. M. (2008) ‗Bioconversion of brewer‘s
spent grains to bioethanol‘, FEMS Yeast Research, 8(7), pp. 1175–1184. doi:
10.1111/j.1567-1364.2008.00390.x.

165 | P a g e
Xiros, C. and Christakopoulos, P. (2009) ‗Enhanced ethanol production from
brewer‘s spent grain by a Fusarium oxysporum consolidated system.‘, Biotechnology
for biofuels, 2(1), p. 4. doi: 10.1186/1754-6834-2-4.
Xu, C. C. et. al (2014) Application of Hydrothermal Reactions to Biomass
Conversion. Edited by F. Jin. Springer. doi: 10.1007/978-3-642-54458-3.
Xu, F. et al. (2013) ‗Qualitative and quantitative analysis of lignocellulosic biomass
using infrared techniques: A mini-review‘, Applied Energy, 104, pp. 801–809. doi:
10.1016/j.apenergy.2012.12.019.
Yin, S., Mehrotra, A. K. and Tan, Z. (2011) ‗Alkaline hydrothermal conversion of
cellulose to bio-oil: Influence of alkalinity on reaction pathway change‘, Bioresource
Technology, 102(11), pp. 6605–6610. doi: 10.1016/j.biortech.2011.03.069.
Yin, S., Pan, Y. and Tan, Z. (2011) ‗Hydrothermal conversion of cellulose to 5-
hydroxymethyl furfural‘, International Journal of Green Energy, 8(2), pp. 234–247.
doi: 10.1080/15435075.2010.548888.
Yin, S. and Tan, Z. (2012) ‗Hydrothermal liquefaction of cellulose to bio-oil under
acidic, neutral and alkaline conditions‘, Applied Energy, 92, pp. 234–239. doi:
10.1016/j.apenergy.2011.10.041.
Yinxin, Z., Jishi, Z. and Yi, M. (2015) ‗Preparation and Application of Biochar from
Brewery ` s Spent Grain and Sewage Sludge‘, pp. 14–19.
Yip, J. et al. (2009) ‗Comparative study of liquefaction process and liquefied
products from bamboo using different organic solvents‘, Bioresource Technology,
100(24), pp. 6674–6678. doi: 10.1016/j.biortech.2009.07.045.
Yong, T. L. K. and Yukihiko, M. (2013) ‗Kinetic analysis of guaiacol conversion in
sub- and supercritical water‘, Industrial and Engineering Chemistry Research,
52(26), pp. 9048–9059. doi: 10.1021/ie4009748.
Yu, Y., Liu, D. and Wu, H. (2012) ‗Characterization of water-soluble intermediates
from slow pyrolysis of cellulose at low temperatures‘, Energy and Fuels, 26(12), pp.
7331–7339. doi: 10.1021/ef3013097.
Yu, Y., Lou, X. and Wu, H. (2008) ‗Some Recent Advances in Hydrolysis of
Biomass in Hot-Compressed Water and Its Comparisons with Other Hydrolysis
Methods‘, Energy and Fuels, 22(1), pp. 46–60. doi: 10.1021/ef700292p.
Zakzeski, J. et al. (2010) ‗The catalytic valorization of lignin for the production of
renewable chemicals‘, Chemical Reviews, 110(6), pp. 3552–3599. doi:
10.1021/cr900354u.
Zhang, J. and Wang, Q. (2016) ‗Sustainable mechanisms of biochar derived from
brewers ‘ spent grain and sewage sludge for ammonia e nitrogen capture‘, Journal of
Cleaner Production, 112, pp. 3927–3934. doi: 10.1016/j.jclepro.2015.07.096.
166 | P a g e
Zhang, Q. et al. (2007) ‗Review of biomass pyrolysis oil properties and upgrading
research‘, Energy Conversion and Management, 48(1), pp. 87–92. doi:
10.1016/j.enconman.2006.05.010.
Zhang, Y. (2010) Hydrothermal Liquefaction to Convert Biomass into Crude Oil,
Biofuels from Agricultural Wastes and Byproducts. doi:
10.1002/9780813822716.ch10.
Zhao, Y. P. et al. (2013) ‗Synergic effect of methanol and water on pine
liquefaction‘, Bioresource Technology. Elsevier Ltd, 142, pp. 504–509. doi:
10.1016/j.biortech.2013.05.028.
Zhao, Y.-P. et al. (2013) ‗Synergic effect of methanol and water on pine
liquefaction.‘, Bioresource technology, 142, pp. 504–9. doi:
10.1016/j.biortech.2013.05.028.
Zheng, C. Y., Tao, H. X. and Xie, X. A. (2013) ‗Distribution and characterizations of
liquefaction of celluloses in sub- and super-critical ethanol‘, BioResources, 8(1), pp.
648–662.
Zhou, C.-H. et al. (2011) ‗Catalytic conversion of lignocellulosic biomass to fine
chemicals and fuels.‘, Chemical Society reviews, 40(11), pp. 5588–617. doi:
10.1039/c1cs15124j.
Zhu, J. Y. and Pan, X. J. (2010) ‗Woody biomass pretreatment for cellulosic ethanol
production: Technology and energy consumption evaluation‘, Bioresource
Technology. Elsevier Ltd, 101(13), pp. 4992–5002. doi:
10.1016/j.biortech.2009.11.007.
Zhu, J. Y., Pan, X. and Zalesny, R. S. (2010) ‗Pretreatment of woody biomass for
biofuel production: Energy efficiency, technologies, and recalcitrance‘, Applied
Microbiology and Biotechnology, 87(3), pp. 847–857. doi: 10.1007/s00253-010-
2654-8.
Zhu, Z. et al. (2009) ‗Analysis of product distribution and characteristics in
hydrothermal liquefaction of Barley Straw in Subcritical and Supercritical water‘,
Environmental Progress, 28(3), pp. 404–409.
Zhu, Z. et al. (2015) ‗Influence of alkali catalyst on product yield and properties via
hydrothermal liquefaction of barley straw‘, Energy, 80, pp. 284–292. doi:
10.1016/j.energy.2014.11.071.