Embed Size (px)
Citation preview
HYDROTHERMAL CONVERSION OF LIGNOCELLULOSIC BIOMASS TO BIO-OILS
by
JING GAN
B.S., University of Science and Technology, Beijing, 2003 M.S., China Agricultural University, 2006
AN ABSTRACT OF A DISSERTATION
submitted in partial fulfillment of the requirements for the degree
DOCTOR OF PHILOSOPHY
Department of Biological and Agricultural Engineering College of Engineering
KANSAS STATE UNIVERSITY Manhattan, Kansas
2012
Abstract
Corncobs were used as the feedstock to investigate the effect of operating conditions and
crude glycerol (solvent) on bio-oil production. The highest bio-oil yield of 33.8% on the basis of
biomass dry weight was obtained at 305°C, 20 min retention time, 10% biomass content, 0.5%
catalyst loading. At selected conditions, bio-oil yield based on the total weight of corn cobs and
crude glycerol increased to 36.3% as the crude glycerol/corn cobs ratio increased to 5.
Furthermore, the optimization of operating conditions was conducted via response surface
methodology. A maximum bio-oil yield of 41.3% was obtained at 280°C, 12min, 21% biomass
content, and 1.56% catalyst loading. A highest bio-oil carbon content of 74.8% was produced at
340°C with 9% biomass content. A maximum carbon recovery of 25.2% was observed at 280°C,
12min, 21% biomass content, and 1.03% catalyst loading.
The effect of biomass ecotype and planting location on bio-oil production were studied
on big bluestems. Significant differences were found in the yield and elemental composition of
bio-oils produced from big bluestem of different ecotypes and/or planting locations. Generally,
the IL ecotype and the Carbondale, IL and Manhattan, KS planting locations gave higher bio-oil
yield, which can be attributed to the higher total cellulose and hemicellulose content and/or the
higher carbon but lower oxygen contents in these feedstocks. Bio-oil from the IL ecotype also
had the highest carbon and lowest oxygen contents, which were not affected by the planting
location.
In order to better understand the mechanisms of hydrothermal conversion, the interaction
effects between cellulose, hemicellulose and lignin in hydrothermal conversion were studied.
Positive interaction between cellulose and lignin, but negative interaction between cellulose and
hemicellulose were observed. No significant interaction was found between hemicelluose and
lignin. Hydrothermal conversion of corncobs, big bluestems, switchgrass, cherry, pecan, pine,
hazelnut shell, and their model biomass also were conducted. Bio-oil yield increased as real
biomass cellulose and hemicellulose content increased, but an opposite trend was observed for
low lignin content model biomass.
HYDROTHERMAL CONVERSION OF LIGNOCELLULOSIC BIOMASS TO BIO-OILS
by
JING GAN
B.S., University of Science and Technology, Beijing, 2003 M.S., China Agricultural University, 2006
A DISSERTATION
submitted in partial fulfillment of the requirements for the degree
DOCTOR OF PHILOSOPHY
Department of Biological and Agricultural Engineering College of Engineering
KANSAS STATE UNIVERSITY Manhattan, Kansas
2012
Approved by: Approved by: Co-Major Professor Co-Major Professor Dr. Wenqiao Yuan Dr. Donghai Wang

Copyright
JING GAN
2012

Abstract
Corncobs were used as the feedstock to investigate the effect of operating conditions and
crude glycerol (solvent) on bio-oil production. The highest bio-oil yield of 33.8% on the basis of
biomass dry weight was obtained at 305°C, 20 min retention time, 10% biomass content, 0.5%
catalyst loading. At selected conditions, bio-oil yield based on the total weight of corn cobs and
crude glycerol increased to 36.3% as the crude glycerol/corn cobs ratio increased to 5.
Furthermore, the optimization of operating conditions was conducted via response surface
methodology. A maximum bio-oil yield of 41.3% was obtained at 280°C, 12min, 21% biomass
content, and 1.56% catalyst loading. A highest bio-oil carbon content of 74.8% was produced at
340°C with 9% biomass content. A maximum carbon recovery of 25.2% was observed at 280°C,
12min, 21% biomass content, and 1.03% catalyst loading.
The effect of biomass ecotype and planting location on bio-oil production were studied
on big bluestems. Significant differences were found in the yield and elemental composition of
bio-oils produced from big bluestem of different ecotypes and/or planting locations. Generally,
the IL ecotype and the Carbondale, IL and Manhattan, KS planting locations gave higher bio-oil
yield, which can be attributed to the higher total cellulose and hemicellulose content and/or the
higher carbon but lower oxygen contents in these feedstocks. Bio-oil from the IL ecotype also
had the highest carbon and lowest oxygen contents, which were not affected by the planting
location.
In order to better understand the mechanisms of hydrothermal conversion, the interaction
effects between cellulose, hemicellulose and lignin in hydrothermal conversion were studied.
Positive interaction between cellulose and lignin, but negative interaction between cellulose and
hemicellulose were observed. No significant interaction was found between hemicelluose and
lignin. Hydrothermal conversion of corncobs, big bluestems, switchgrass, cherry, pecan, pine,
hazelnut shell, and their model biomass also were conducted. Bio-oil yield increased as real
biomass cellulose and hemicellulose content increased, but an opposite trend was observed for
low lignin content model biomass.
vi
Table of Contents
Table of Contents ......................................................................................................................... vi
List of Figures................................................................................................................................ x
List of Tables ............................................................................................................................... xii
Acknowledgements .................................................................................................................... xiii
Dedication ................................................................................................................................... xiv
Chapter 1 - Introduction* ............................................................................................................ 1
1.1 General background.............................................................................................................. 2
1.2 Hydrothermal conversion ..................................................................................................... 3
1.3 Problem statement................................................................................................................. 5
1.4 Research objectives............................................................................................................... 6
References................................................................................................................................... 8
Chapter 2 - Literature Review*................................................................................................. 10
2.1 Effects of operating parameters on lignocellulosic biomass HTC ..................................... 11
2.1.1 Effect of temperature on HTC ..................................................................................... 11
2.1.2 Effect of retention time on HTC .................................................................................. 12
2.1.3 Effect of catalyst on HTC ............................................................................................ 12
2.1.4 Effect of solvent on HTC............................................................................................. 13
2.2 Effects of lignocellulosic biomass components on its HTC............................................... 14
2.2.1 Cellulose HTC ............................................................................................................. 14
2.2.2 Hemicellulose HTC ..................................................................................................... 15
2.2.3 Lignin HTC.................................................................................................................. 16
2.2.4 Effect of cellulose content on bio-oil production at neutral conditions....................... 16
2.2.5 Effect of hemicellulose content on bio-oil yield at neutral conditions ........................ 17
2.2.6 Effect of lignin content on bio-oil yield at neutral conditions ..................................... 18
2.2.7 Effect of cellulose content on bio-oil yield at alkaline conditions............................... 19
2.2.8 Effect of hemicellulose content on bio-oil yield at alkaline conditions....................... 20
2.2.9 Effect of lignin content on bio-oil yield at alkaline conditions.................................... 21
References................................................................................................................................. 23
vii
Chapter 3 - Hydrothermal Conversion of Corn Cobs and Crude Glycerol*........................ 28
3.1 Introduction......................................................................................................................... 29
3.2 Materials and Methods........................................................................................................ 30
3.2.1 Materials ...................................................................................................................... 30
3.2.2 Biomass chemical composition analysis...................................................................... 31
3.2.3 Apparatus and process ................................................................................................. 31
3.2.4 Product analysis ........................................................................................................... 34
3.3 Results and Discussion ....................................................................................................... 35
3.3.1 Effect of operating temperature ................................................................................... 35
3.3.2 Effect of retention time ................................................................................................ 36
3.3.3 Effect of biomass content............................................................................................. 37
3.3.4 Effect of catalyst loading ............................................................................................. 38
3.3.5 Products under selected conditions.............................................................................. 39
3.3.6 Effect of crude glycerol................................................................................................ 40
3.4 Conclusions......................................................................................................................... 44
References................................................................................................................................. 45
Chapter 4 - Operating Conditions Optimization for Bio-oil Production from Corn Cobs
Hydrothermal Conversion .................................................................................................. 50
4.1 Introduction......................................................................................................................... 51
4.2 Materials and Methods........................................................................................................ 52
4.2.1. Materials ..................................................................................................................... 52
4.2.2 Apparatus and process ................................................................................................. 52
4.2.3 Product Analysis .......................................................................................................... 53
4.2.4 Experimental design, analysis and model fitting ......................................................... 54
4.3 Results and discussion ........................................................................................................ 55
4.3.1. Model equations for bio-oil yield, carbon content and carbon recovery .................... 55
4.3.2. Response surface analysis for bio-oil yield................................................................. 59
4.3.3 Response surface analysis for bio-oil carbon content.................................................. 61
4.3.4 Response surface analysis for bio-oil carbon recovery................................................ 63
4.3.5 Optimization and validation......................................................................................... 65
4.3.6 Bio-oil properties ......................................................................................................... 66
viii
4.4 Conclusion .......................................................................................................................... 67
Reference .................................................................................................................................. 69
Chapter 5 - Hydrothermal Conversion of Big Bluestem for Bio-oil Production: the Effect of
Ecotype and Planting Location*......................................................................................... 72
5.1 Introduction......................................................................................................................... 73
5.2 Materials and Methods........................................................................................................ 74
5.2.1. Feedstock preparation ................................................................................................. 74
5.2.2 HTC apparatus and experimental procedure................................................................ 76
5.2.3 Analytical tests............................................................................................................. 76
5.3 Results and Discussion ....................................................................................................... 77
5.3.1 The effect of ecotype and planting location on bio-oil yield ....................................... 77
5.3.2 Effects of ecotype and planting location on bio-oil carbon and oxygen content......... 79
5.3.3 The effect of ecotype and planting location on big bluestem chemical and elemental
compositions ......................................................................................................................... 84
5.3.4 Correlations between feedstock compositions and bio-oil yield ................................. 85
5.3.5 Comparison of bio-oil production from big bluestem, switchgrass, and corncobs...... 89
5.4 Conclusions......................................................................................................................... 91
References................................................................................................................................. 92
Chapter 6 - Hydrothermal Conversion of Cellulose, Hemicellulose, and Lignin: Influence of
Operating Conditions and Their Interactions .................................................................. 95
6.1 Introduction......................................................................................................................... 96
6.2 Materials and Methods........................................................................................................ 98
6.2.1 Materials ...................................................................................................................... 98
6.2.2 HTC apparatus and experimental procedure................................................................ 99
6.2.3 Analytical tests............................................................................................................. 99
6.3 Results and discussion ...................................................................................................... 100
6.3.1 Effect of operating conditions.................................................................................... 100
6.3.2 Interaction effects between pure cellulose, hemicelluose, and lignin........................ 104
6.3.3 HTC of real and model biomass ................................................................................ 108
6.4 Conclusion ........................................................................................................................ 111
References............................................................................................................................... 112

ix
Chapter 7 - Conclusions and Recommendations ................................................................... 116
7.1 Conclusions....................................................................................................................... 116
7.2 Recommendations............................................................................................................. 118
Chapter 8 - Contributions........................................................................................................ 120

x
List of Figures
Figure 1.1 Primary routes for biofuels conversion ......................................................................... 3
Figure 2.1 Structure of cellulose................................................................................................... 14
Figure 2.2 Hydrothermal conversion pathways of xylan.............................................................. 15
Figure 2.3 Structure units of lignin ............................................................................................... 16
Figure 2.4 Effect of cellulose content on bio-oil yield at neutral conditions................................ 17
Figure 2.5 Effect of hemicellulose content on bio-oil yield at neutral conditions........................ 18
Figure 2.6 Effect of lignin content on bio-oil yield at neutral conditions..................................... 19
Figure 2.7 Effect of cellulose content on bio-oil yield at alkaline conditions .............................. 20
Figure 2.8 Effect of hemicellulose content on bio-oil yield at alkaline conditions ...................... 20
Figure 2.9 Effect of lignin content on bio-oil yield at alkali conditions....................................... 21
Figure 3.1 Temperature profile for hydrothermal conversion ..................................................... 32
Figure 3.2 Procedures for hydrothermal conversion product separation..................................... 33
Figure 3.3 Effect of reaction temperature on corn cob hydrothermal conversion ....................... 36
Figure 3.4 Effect of retention time on corn cob hydrothermal conversion.................................. 37
Figure 3.5 Effect of biomass content on corn cob hydrothermal conversion .............................. 38
Figure 3.6 Effect of catalyst loading on corn cob hydrothermal conversion............................... 39
Figure 3.7 Product distribution of hydrothermal conversion of corn cobs with crude glycerol at
the selected operating conditions .......................................................................................... 42
Figure 3.8 Effect of crude glycerol on mole percentage of gases produced at the selected
operating conditions.............................................................................................................. 43
Figure 3.9 Effect of crude glycerol on bio-oil elements at the selected operating conditions..... 43
Figure 4.1 Contour plot for the effects of temperature and retention time on bio-oil yield ......... 60
Figure 4.2 Contour plot for the effects of temperature and biomass content on bio-oil yield...... 61
Figure 4.3 Contour plot for the effects of temperature and biomass content on bio-oil carbon
content................................................................................................................................... 62
Figure 4.4 Contour plot for the effects of temperature and retention time on bio-oil carbon
recovery................................................................................................................................. 64

xi
Figure 4.5 Contour plot for the effects of temperature and biomass content on bio-oil carbon
recovery................................................................................................................................. 64
Figure 4.6 Contour plot for the effects of retention time and catalyst loading on bio-oil carbon
recovery................................................................................................................................. 65
Figure 5.1 Comparison of bio-oil yields of different ecotypes in each planting location, grouped
by planting location............................................................................................................... 78
Figure 5.2 Comparisons of bio-oil yield in different planting locations, grouped by ecotype .... 79
Figure 5.3 Comparisons of bio-oil carbon (A) and oxygen (B) contents of different ecotypes
grouped by planting location ................................................................................................ 81
Figure 5.4 Comparisons of bio-oil C (A) and O (B) contents in different planting locations,
grouped by ecotype ............................................................................................................... 83
Figure 5.5 Effect of the total amount of cellulose and hemicellulose in big bluestem on bio-oil
yield....................................................................................................................................... 87
Figure 5.6 Effect of big bluestem C content (A) and O content (B) on bio-oil yield ................... 88
Figure 6.1 Effect of operating temperature on bio-oil production from cellulose and xylose
hydrothermal conversion .................................................................................................... 101
Figure 6.2 Effect of retention time on bio-oil production from cellulose and xylose hydrothermal
conversion ........................................................................................................................... 102
Figure 6.3 Effect of biomass content on bio-oil production from cellulose and xylose
hydrothermal conversion .................................................................................................... 103
Figure 6.4 Effect of catalyst loading on bio-oil production from cellulose and xylose
hydrothermal conversion .................................................................................................... 104
Figure 6.5 Effect of cellulose and xylose content on their mixture hydrothermal conversion... 106
Figure 6.6 Effect of cellulose and lignin content on their mixture hydrothermal conversion .... 107
Figure 6.7 Effect of xylose and lignin content on their mixture of hydrothermal conversion ... 108
Figure 6.8 Effect of cellulose and hemicellulose content on bio-oil yield ................................. 110
Figure 6.9 First Figure in Chapter 1Effect of biomass lignin content on bio-oil yield............... 111
xii
List of Tables
Table 1.1 Property comparison between pyrolysis oil and HTC oil............................................... 4
Table 1.2 Hydrothermal conversion of common types of lignocellulosic biomass........................ 5
Table 3.1 Chemical content of feedstock (corn cobs) compared with that of char and aqueous
products resulting from HTC at 305°C, 20 min retention time, 10% biomass content, and
0.5% catalyst loading ............................................................................................................ 40
Table 4.1 Experimental range and levels of independent variables.............................................. 54
Table 4.2 Small central composite design matrix with actual response for bio-oil yield, bio-oil
carbon content, and bio-oil carbon recovery......................................................................... 56
Table 4.3 Analysis of variance for the regression models ............................................................ 58
Table 4.4 Optimization and validation for bio-oil yield, bio-oil carbon content, and carbon
recovery................................................................................................................................. 66
Table 4.5 Elemental composition and heating value of corn cobs and bio-oils ...........................67
Table 5.1 The seed collection site and planting location of big bluestem .................................... 75
Table 5.2 Two-way ANOVA test of the effect of ecotype and planting location on bio-oil yield
and elemental composition ................................................................................................... 84
Table 5.3 Chemical and elemental compositions of big bluestem (wt% db)................................86
Table 5.4 Comparison of bio-oil production between big bluestem, switchgrass, and corncobs. 90
Table 5.5 Identification of compounds by GC-MS in bio-oil from big bluestem, switchgrass, and
corncobs ................................................................................................................................ 91
Table 6.1 Chemical compositions of real and model biomass.................................................... 109

xiii
Acknowledgements
I would like to express my deep appreciation to my major advisor, Dr. Wenqiao Yuan,
for his financial support and patient guidance. With his knowledge, constructive suggestions,
passion for work, kindness, patience and encouragement, I could develop the research assembled
in this dissertation. Thanks for providing me so many opportunities and positive influence on my
study and world view, which will benefit me all through my life.
I want to acknowledge my co-major advisor, Dr. Donghai Wang, for his valuable
guidance and encouragement. He provided many lab equipments, which largely contributed to
this dissertation.
I would like to thank the other members of my supervisory committee, Dr. Keith Hohn,
and Dr. Ron Madl, for their valuable comments, suggestions, and help. I also appreciate Dr.
Christopher Sorensen for serving as the chairperson for the examining committee.
Special acknowledgement to the faculty and staff in the Department of Biological and
Agricultural Engineering: Dr. Joseph P. Harner, Department Head; Dr. Naiqian Zhang, Graduate
Program Director; Ms. Barb Moore, Mr. Randy Erickson, and Mr. Darrel Oard for their help and
guidance in all the administrative and academic activities related to this research.
Special thanks to Dr. Nathan O. Nelson at Department of Agronomy, Kansas State
University, and Dr. Loretta Johnson at Department of Biology, Kansas State University, for their
cooperation and technical support on biomass preparation.
I want to express my gratitude to all the students and visiting scholars in Dr. Yuan’s
research group for helping me to do my experiments, Mr. Arthur James, Mr. Marcelo Coronado,
etc. Special thanks to Mr. Ke Zhang, Mr. Ningbo Li and Dr. Xiaorong Wu in Dr.Wang’s group
for helping me to analyze chemical and elemental compositions of biomass and bio-oils.
I also want to appreciate all my other friends for their precious friendship and good times
we spent together, especially Dr. Naiqian Zhang in KSU, Dr. Ning Wang in OSU, as well as
their families, students and friends. To all my roommates during the past five years, especially Li
Guo, they stood my bad mood and gave me comfort when I am upset.
Profound appreciation goes to my parents, my brother and sister for their unconditional
love, understanding, support, and encouragement.

xiv
Dedication
This work is dedicated to my family and all my teachers.
1
Chapter 1 - Introduction*
Abstract
Biofuels have received great attention due to the rapid depletion of crude oil and
environmental problems associated with fossil fuel use. Biofuels derived from lignocellulosic
biomass are promising alternatives to fossil fuel. Lignocellulsic biomass can be converted to
biofuels by gasification, pyrolysis, and hydrothermal conversion, whose advantages and
disadvantages were summarized. Among these technologies, hydrothermal conversion of
lignocellulosic biomass to bio-oils offers major economic, environmental, and strategic benefits.
The general background of hydrothermal conversion and problems associated with hydrothermal
conversion were reviewed. The objectives of this dissertation also were listed in this chapter.
*1.1 and 1.2 have been published in a review paper.
Gan, J., Yuan W. 2012. The Effect of biomass on bio-oil production via hydrothermal conversion. Xiu S.N., Oil:
production, consumption and environmental impact. NOVA Science Publishers, Inc., NY.

2
1.1 General background
According to International Energy Outlook 2008, the world liquid fuel consumption in
2030 could increase to 113 million barrels per day from 84 million barrels per day in 2005. The
United States currently consumes more than 140 billion gallons of transportation fuels annually.
The burning of fossil fuels significantly increases the level of CO2 in the atmosphere. The
transportation sector was responsible for about 25% of worldwide CO2 emissions and it will
increase to nearly 50% of the total emissions by 2030. Therefore, it is necessary to produce
alternatives to fossil fuels. Biofuels have received great attention due to the rapid depletion of
crude oil and environmental problems associated with fossil fuel use. Biofuels play an increasing
role to reduce CO2 emissions since CO2 can be fixed by photosynthesis during biomass growth.
Global biofuels production increased rapidly over the last decade. Around 68 billion liters
bioethanol and 15 billion liters biodiesel were produced globally in 2008, which are typical first
generation biofuels (IEA, 2009). Bioethanol is mainly derived from corn and sugar cane through
starch or sugar fermentation. Biodiesel is produced through transesterification of vegetable oils,
residual oils and fats (Naik et al., 2010). The commercial first generation biofuels can offer some
CO2 benefits and reduce stress of energy security. However, they face heavy criticism now
because they compete with food production. Therefore, second generation biofuels produced
from lignocellulosic biomass is a good option because they do not compete with food crops,
could significantly reduce CO2 production, and have abundant feedstock. DOE and USDA
projected that the U.S. biomass resources annually could provide around 1.3 billion dry tons of
lignocellulosic biomass for biofuels production, which would meet about 40% of the annual U.S.
fuel demand for transportation. The biomass includes agricultural residue, forestry residue, and
perennial grass (Perlack et al., 2005).
Conversion of lignocellulosic biomass to biofuels offers major economic, environmental,
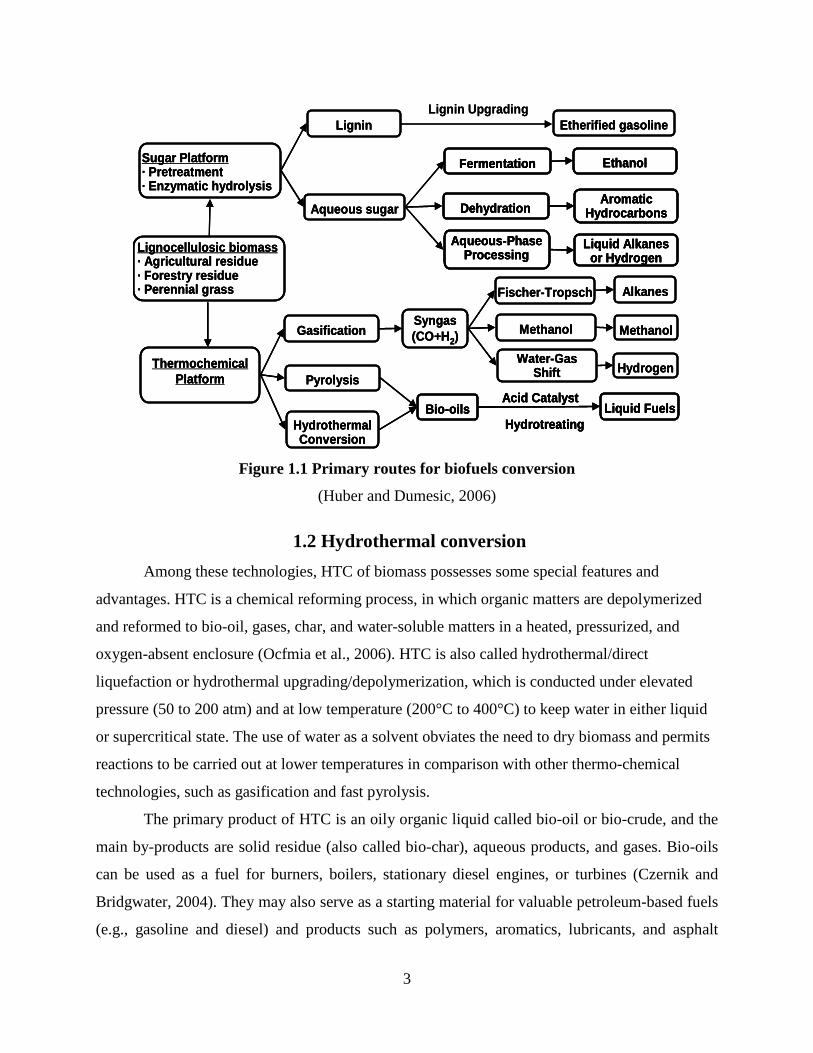
and strategic benefits. As shown in Figure 1.1, there are two primary routes in such a project: the
sugar platform (or biochemical processing) and the thermochemical platform. Cellulosic ethanol
falls into the sugar platform, wherein biomass is hydrolyzed to fermentable sugars which are
further processed to ethanol or chemicals. In the thermochemical platform, biomass is converted
into synthesis gas through gasification or bio-oils through pyrolysis and hydrothermal conversion
(HTC), which can be further upgraded to liquid fuels (e.g., gasoline and diesel fuel) and other
chemicals.
3
Lignin Upgrading
Lignocellulosic biomass· Agricultural residue· Forestry residue· Perennial grass
Sugar Platform· Pretreatment· Enzymatic hydrolysis
Lignin Etherified gasoline
Aqueous sugar
Fermentation
Dehydration
Aqueous-Phase Processing
Ethanol
Aromatic Hydrocarbons
Liquid Alkanesor Hydrogen
ThermochemicalPlatform
GasificationSyngas(CO+H2)
Fischer-Tropsch
Methanol
Water-GasShift
Alkanes
Methanol
Pyrolysis
HydrothermalConversion
Bio-oilsAcid Catalyst
HydrotreatingLiquid Fuels
Hydrogen
Lignocellulosic biomass· Agricultural residue· Forestry residue· Perennial grass
Sugar Platform· Pretreatment· Enzymatic hydrolysis
Lignin Etherified gasoline
Aqueous sugar
Fermentation
Dehydration
Aqueous-Phase Processing
Fermentation
Dehydration
Aqueous-Phase Processing
Ethanol
Aromatic Hydrocarbons
Liquid Alkanesor Hydrogen
Ethanol
Aromatic Hydrocarbons
Liquid Alkanesor Hydrogen
ThermochemicalPlatform
GasificationSyngas(CO+H2)
Fischer-Tropsch
Methanol
Water-GasShift
Alkanes
Methanol
Pyrolysis
HydrothermalConversion
Bio-oilsAcid Catalyst
HydrotreatingLiquid FuelsBio-oils
Acid Catalyst
HydrotreatingLiquid Fuels
Hydrogen
Figure 1.1 Primary routes for biofuels conversion
(Huber and Dumesic, 2006)
1.2 Hydrothermal conversion
Among these technologies, HTC of biomass possesses some special features and
advantages. HTC is a chemical reforming process, in which organic matters are depolymerized
and reformed to bio-oil, gases, char, and water-soluble matters in a heated, pressurized, and
oxygen-absent enclosure (Ocfmia et al., 2006). HTC is also called hydrothermal/direct
liquefaction or hydrothermal upgrading/depolymerization, which is conducted under elevated
pressure (50 to 200 atm) and at low temperature (200°C to 400°C) to keep water in either liquid
or supercritical state. The use of water as a solvent obviates the need to dry biomass and permits
reactions to be carried out at lower temperatures in comparison with other thermo-chemical
technologies, such as gasification and fast pyrolysis.
The primary product of HTC is an oily organic liquid called bio-oil or bio-crude, and the
main by-products are solid residue (also called bio-char), aqueous products, and gases. Bio-oils
can be used as a fuel for burners, boilers, stationary diesel engines, or turbines (Czernik and
Bridgwater, 2004). They may also serve as a starting material for valuable petroleum-based fuels
(e.g., gasoline and diesel) and products such as polymers, aromatics, lubricants, and asphalt

4
(Zhang et al., 2007; Peterson et al., 2008). For comparison, bio-oils can also be made by fast
pyrolysis, which occurs at atmospheric pressure under higher temperatures (~500 ºC) with very
short residence times (<2 s). Although fast pyrolysis oils have the advantage of short residence
times and lower capital costs (Huber et al., 2006), oils produced from HTC typically have more
desirable qualities than fast pyrolysis oils. As shown in Table 1.1, HTC oils typically have much
lower oxygen and moisture contents, and consequently much higher energy value, as compared
to oils from fast pyrolysis. Moreover, both dry and wet biomass can be used as feedstock in
HTC. Drying the feedstock is not needed in HTC, which makes it especially suitable for
naturally wet biomass. In addition, HTC is a net energy process. The energy balance of swine
manure HTC by a continuous reactor system has been calculated by Kim (2006). The energy
gain based on bio-oil heating value and energy consumption for reactants heating is about 3
without energy loss, and 1.2 with energy loss.
Table 1.1 Property comparison between pyrolysis oil and HTC oil
(Huber et al., 2006)
Property Pyrolysis oil HTC oil
Moisture content, wt% 15-30 5.1
Specific gravity 1.2 1.1
Carbon (wt%) 54-58 73
Hydrogen (wt%) 5.5-7.0 8
Oxygen (wt%) 35-40 16
Elemental composition:
High heating value (MJ kg-1) 16-19 34
Many types of lignocellulosic biomass such as wood, straws, stalks, shells, and husks
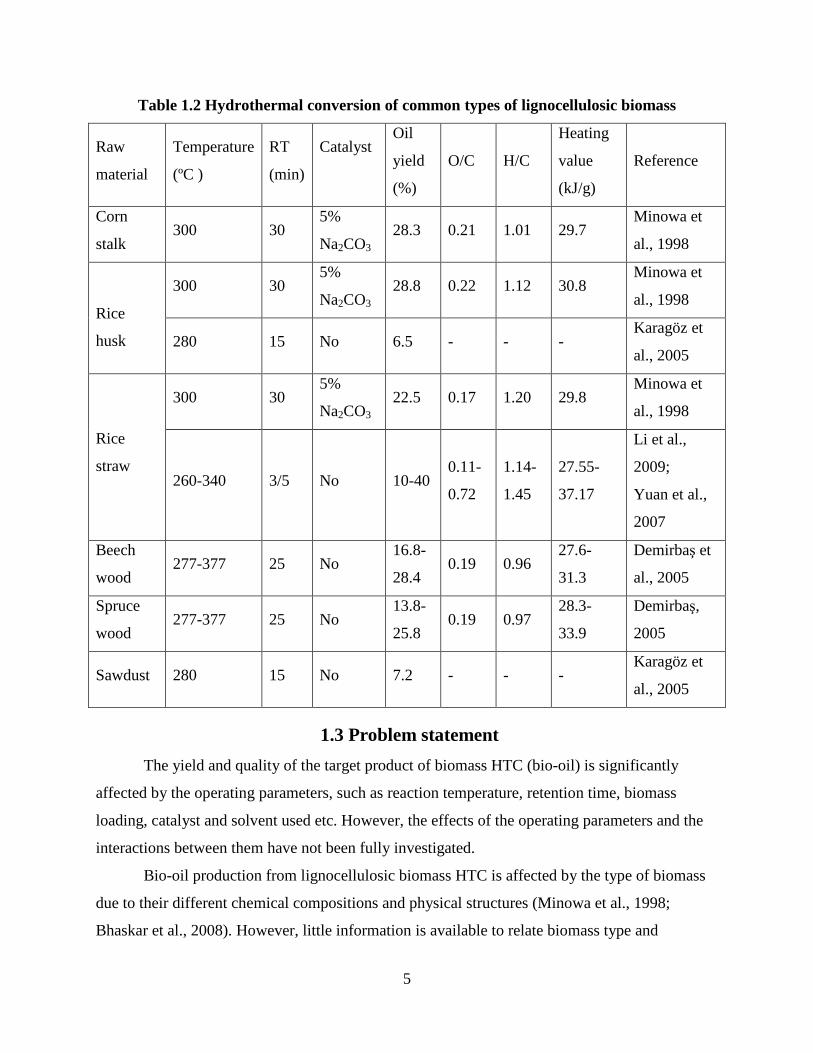
have been successfully converted into bio-oils through HTC. Table 1.2 summarizes the yield and
quality of bio-oils from HTC of some common types of lignocellulosic biomass. Yield ranged
from 6.5% to 28.8%, while H/C ratio and O/C ratio were in the range of 0.96 to 1.45 and 0.11 to
0.72, respectively. Large variances of bio-oil yield and quality indicate that either biomass type
or operating conditions, or both, significantly affect biomass HTC. However, it is still not clear
which factor is dominant and how they affect the process.
5
Table 1.2 Hydrothermal conversion of common types of lignocellulosic biomass
Raw
material
Temperature
(ºC )
RT
(min)
Catalyst
Oil
yield
(%)
O/C H/C
Heating
value
(kJ/g)
Reference
Corn
stalk 300 30
5%
Na2CO3 28.3 0.21 1.01 29.7
Minowa et
al., 1998
300 30 5%
Na2CO3 28.8 0.22 1.12 30.8
Minowa et
al., 1998
Rice
husk 280 15 No 6.5 - - - Karagöz et
al., 2005
300 30 5%
Na2CO3 22.5 0.17 1.20 29.8
Minowa et
al., 1998
Rice
straw
260-340 3/5 No 10-40
0.11-
0.72
1.14-
1.45
27.55-
37.17
Li et al.,
2009;
Yuan et al.,
2007
Beech
wood 277-377 25 No
16.8-
28.4 0.19 0.96
27.6-
31.3
Demirbaş et
al., 2005
Spruce
wood 277-377 25 No
13.8-
25.8 0.19 0.97
28.3-
33.9
Demirbaş,
2005
Sawdust 280 15 No 7.2 - - - Karagöz et
al., 2005
1.3 Problem statement
The yield and quality of the target product of biomass HTC (bio-oil) is significantly
affected by the operating parameters, such as reaction temperature, retention time, biomass
loading, catalyst and solvent used etc. However, the effects of the operating parameters and the
interactions between them have not been fully investigated.
Bio-oil production from lignocellulosic biomass HTC is affected by the type of biomass
due to their different chemical compositions and physical structures (Minowa et al., 1998;
Bhaskar et al., 2008). However, little information is available to relate biomass type and

6
characteristics to HTC performance. Chemical reactions in HTC process mainly include
hydrolysis, solvolysis, cracking, depolymerization, hydrogenation, decarboxylation,
condensation, and repolymerization etc. (Chornet and Overend, 1985; Zhang et al., 1999). But
the mechanisms and kinetics of HTC process are not well understood yet.
Bio-oil made through lignocellulosic biomass HTC usually has high viscosity, poor
quality and are of low yield, which limit the application of this technology. Bio-oil production
from lignocellulosic biomass can be improved by using organic solvents. Researchers have
generated bio-oils with low viscosity and high yield from organic solvents, especially crude
glycerol (Demirbas, 2000; Xiu et al., 2010, 2011). Xiu and coworkers (2010, 2011) have
reported that bio-oil yield dramatically increased and its quality was improved by the use of
crude glycerol in swine manure HTC process. But the effectiveness and mechanisms of crude
glycerol on the bio-oil production from gnocellulosic biomass have not been studied. Crude
glycerol is a low-value (e.g., <2 cents per pound) by-product of biodiesel production and is
sometimes treated as waste. Because of the rapid growth of the biodiesel industry, the quantity of
crude glycerol produced is becoming considerable (e.g., >200 million lb per year); treatment and
possible use of this by-product are topics of urgent importance.
1.4 Research objectives
The goal of this research is to improve the yield and quality of bio-oil produced from
hydrothermal conversion (HTC) of lignocellulosic biomass, which is affected by operating
conditions (temperature, retention time, biomass content, and catalyst loading), solvent, biomass
ecotype and planting location, as well as biomass chemical and elemental compositions. Specific
objectives and approaches are as follows:
1) To investigate the effect of operating conditions and crude glycerol on the yield and quality
of bio-oil produced from corncobs HTC.
2) To optimize the operating conditions for bio-oil production from corncobs HTC via
response surface methodology, and investigate the interaction effects among these
operating conditions.
3) To study the effect of biomass ecotype and planting location on bio-oil production. Three
ecotypes (CKS, EKS, IL) and one cultivar (KAW) of big bluestem (Andropogon gerardii)

7
that were planted in three locations (Hays, KS; Manhattan, KS; and Carbondale, IL) will be
converted to bio-oil via hydrothermal conversion.
4) To investigate the effect of biomass chemical compositions on bio-oil production.
Lignocellulosic biomass is mainly composed of cellulose, hemicellulose and lignin.
Decomposition behaviors of the three compounds and their interactions in HTC process
will be investigated using pure cellulose, hemicellulose, lignin and their mixtures as
feedstock. Then, HTC of typical real lignocellulosic biomass and their model biomass will
be carried out.

8
References
Bhaskar, T., Sera, A., Muto, A., and Sakata, Y. (2008). Hydrothermal upgrading of wood biomass: Influence of the addition of K2CO3 and cellulose/lignin ratio. Fuel 87(10-11), 2236-2242.
Czernik, S., and Bridgwater, A. V. (2004). Overview of applications of biomass fast pyrolysis oil. Energy and Fuels 18(2), 590-598.
Chornet, E. and Overend, R. P. (1985). Biomass liquefaction: An overview. In: Fundamentals of thermochemical biomass conversion. Overend, R. P., Milne, T. A., Mudge, L. K. (Eds). New York: Elsevier Applied Science 967-1002.
Demirbas, A. (2000). Conversion of biomass using glycerin to liquid fuel for blending gasoline as alternative engine fuel. Energy Conversion and Management 41(16), 1741-1748.
Demibas, A. (2005). Thermochemical conversion of biomass to liquid products in the aqueous medium. Energy Sources 27, 1235-1243.
Demirbas, A., and Celik, A. (2005). Degradation of poplar and spruce wood chips using alkaline glycerol. Energy Sources, Part A 27(11), 1073-1084.
Huber, G. W., Iborra, S., and Corma, A. (2006). Synthesis of transportation fuels from biomass: chemistry, catalysts, and engineering. Chem. Rev. 106, 4044-4098.
IEA (2009), World Energy Outlook 2009, OECD/IEA, Paris.
Karagöz, S., Bhaskar, T., Muto, A. and Sakata, Y. (2005). Comparative studies of oil compositions produced from sawdust, rice husk, lignin and cellulose by hydrothermal treatment. Fuel 84(7-8), 875-884.
Ocfemia, K. S. (2005). Hydrothermal process of swine manure to oil using a continuous reactor system. Doctoral dissertation. University of Illinois at Urbana-Champaign.
Li, H., Yuan, X., Zeng, G., Tong, J., Yan, Y., Cao, H., Wang, L., Cheng, M., Zhang, J., and Yang, D. (2009). Liquefaction of rice straw in sub- and supercritical 1, 4-dioxane-water mixture. Fuel Processing Technology 90(5), 657-663.
Minowa, T., Kondo, T., and Sudirjo, S. T. (1998). Thermochemical liquefaction of Indonesian biomass residues. Biomass and Bioenergy 14 (5-6), 517-524.
Naik, S. N., Goud, V. V., Rout, P. K., and Dalai, A. K. (2010). Production of first and second generation biofuels: A comprehensive review. Renewable and Sustainable Energy Reviews 14(2), 578-597.
Ocfmia, K. S., Zhang, Y., and Funk, T. (2006). Hydrothermal processing of swine manure into oil using a continuous reaction system: Development and testing. Transaction of the ASABE 49(2), 533-541.

9
Perlack, R. D, Wright, L. L., Turhollow, A. F., Graham, R. L., Stokes, B. J., and Erbach, D. C. (2005). Biomass as feedstock for a bioenergy and bioproducts industry: The technical feasibility of a billion-ton annual supply. Sponsored by USDOE and USDA 2005.
Peterson, A. A., Vogel, F., Lachance, R. P., Fröling, M., Antal Jr., M. J., and Tester, J. W. (2008). Thermochemical biofuel production in hydrothermal media: A review of suband supercritical water technologies. Energy and Environmental Science 1, 32-65.
Xiu, S., Shabazi, A., Shirley, V., Mims, M. R., and Wallace, C. W. (2010). Effectiveness and mechanisms of crude glycerol on the biofuels production from swine manure through hydrothermal pyrolysis. Journal of Analytical and Applied Pyrolysis 87(2), 194-198.
Xiu. S., Shahbazi, A., Shirley, V. B., and Wang, L. (2011). Swine manure/crude glycerol co-liquefaction: Physical properties and chemical analysis of bio-oil product. Bioresour. Technol. 102(2), 1928-32.
Yuan, X. Z., Li, H., Zeng, G. M., Tong, J. Y., and Xie, W. (2007). Sub- and supercritical liquefaction of rice straw in the presence of ethanol-water and 2-propanol-water mixture. Energy 32(11), 2081-2088.
Zhang, Q., J. Chang, T. Wang, and Y. Xu. (2007). Review of biomass pyrolysis oil properties and upgrading research. Energy Conversion and Management 48(1): 87-92.
Zhang, Y., Riskowski, G., and Funk, T. (1999). Thermochemical conversion of swine manure to produce fuel and reduce waste. Illinois Council on Food and Agricultural Research, December, University of Illinois, Urbana, IL.

10
Chapter 2 - Literature Review*
Abstract
Bio-oil production from lignocellulosic biomass via hydrothermal conversion (HTC) was
studied widely. Bio-oil production from lignocellulosic biomass HTC was significantly affected
by the operating conditions (temperature, retention time, biomass content, catalyst used) and
solvents used, which were reviewed in this chapter. Hydrothermal conversion of lignocellulosic
biomass was also affected by biomass chemical compositions, whose main compounds are
cellulose, hemicellulose and lignin. The conversion processes of cellulose, hemicellulose, and
lignin, and their effects on bio-oil production were reviewed, separately.
*2.2 has been published in a review paper.
Gan, J., Yuan W. 2012. The Effect of biomass on bio-oil production via hydrothermal conversion. Xiu S.N., Oil:
production, consumption and environmental impact. NOVA Science Publishers, Inc., NY.

11
2.1 Effects of operating parameters on lignocellulosic biomass HTC
The operating parameters of HTC include reaction temperature, retention time, biomass
loading, pressure, carry gas, catalyst and solvent used, in which reaction temperature, retention
time, catalyst and solvent used have significant effects on biomass HTC. Their effects on bio-oil
yield and quality will be discussed respectively.
2.1.1 Effect of temperature on HTC
Many researchers have studied the influence of temperature on biomass HTC. Bio-oil
formation from lignocellulosic biomass mainly occurred at the temperature range of 200 to
420℃, in which bio-oil yield increased with increasing reaction temperature, and then decreased
as temperature increased further (Ogi et al., 1994; Minowa et al., 1998a; Zhong and Wei, 2004;
Qian et al., 2007; Yuan et al., 2007; Xu and Lad, 2008; Xu and Lancaster 2008; Liu and Zhang,
2008). It should be interpreted by a competition between depolymerization and repolymerization/
condensation during lignocellulosic biomass HTC. As temperature increased, the
depolymerization of the polymers into a liquid oil-rich phase would become easier. But a further
increase of the temperature might promote the decomposition of these fragments into gaseous
products and repolymerization/ condensation of the intermediates into char. It was confirmed by
many researchers. Yuan et al., (2009) found that bio-oil formation from straw HTC without
catalyst mainly occurred between 250℃ and 300℃, but high molecular compounds were
produced by repolymerization when temperature further increased to 310℃. When pure cellulose
was used as HTC feedstock, the maximum oil yield occurred at 300℃ (Minowa et al., 1998).
Moreover, Xu and Lancaster (2008) proposed that water soluble oil was converted into heavy oil
as temperature increased from 250℃ to 350℃. As the temperature increased further to 380℃,
heavy oil yield decreased, but more char and gas were produced might due to the condensation,
repolymerization or cracking reaction of the intermediates. Thus, below a critical temperature,
the decomposition reaction is dominant. Above this critical temperature, it is the other way
round, repolymerization becomes predominant.
The optimum temperature for bio-oil production from lignocellulosic biomass HTC
varied case by case because the different chemical composition and operating conditions. Zhang
and Wei (2004) found that the optimal temperature of wood HTC shifted to a higher value as the
lignin content increased due to the good thermal stability of lignin.
12
2.1.2 Effect of retention time on HTC
Reaction retention time is another important operating parameter. Most researchers
agreed that there was a critical retention time for the highest oil yield from biomass HTC. Bio-oil
yield decreased at a prolonged retention time, which could be explained by the cracking of bio-
oil or intermediate products to gases and formation of chars by condensation, cyclization, and
repolymerization (Xu and Etcheverry, 2008; Li et al., 2009).
2.1.3 Effect of catalyst on HTC
Biomass HTC was significantly affected by the kinds of catalyst and catalyst loading.
Alkali catalysts and iron-based catalysts have been widely in biomass HTC to enhance the bio-
oil yield. The effect of alkaline catalysts on lignocellulosic biomass HTC has been studied by
many researchers (Song et al., 2004; Tomoko Ogi et al., 1985; Selhan Karagoz et al., 2004;
2005a; 2005b; Xu and Lad, 2008). Ogi et al. (1985) investigated the effect of nine catalysts
(CaCO3, Ca(OH)2, Na2CO3, NaOH, HCOONa, NaCl, K2CO3, KOH and HCOOK) on HTC of
woody biomass at 300°C with 2.0MPa initial pressure. The results indicated that alkali and
alkaline earth salts except chloride promoted wood HTC. Potassium and sodium salts had no
significant difference on the bio-oil yield. Karagoz et al. (2004; 2005a; 2005b) also found that
the alkali and alkaline salts enhanced bio-oil formation from wood HTC at 280°C for 15min, but
they suggested that catalytic activity of these catalysts shown a priority sequence of
K2CO3>KOH> Na2CO3>NaOH >RbOH>CsCO3>RbCO3>CsOH based on heavy oil yield. HTC
of woody biomass in sub- and super-critical ethanol with 5 wt% FeS or FeSO4 as catalyst was
conducted by Xu and Etcheverry (2008). They found that both catalysts improved the bio-oil
formation when temperature increased from 220°C to 350°C. The highest bio-oil yield of 63%
was obtained at 350°C for 40min with 5 wt% FeSO4 and 5MPa initial pressure of H2. These
catalysts used in biomass promoted the bio-oil formation by suppressing the char formation from
oil (Minowa et al., 1998a).
Furthermore, the catalytic activity of catalysts was dependent on reaction temperature.
Xu and Etcheverry (2008) found that iron-based catalyst were more active at higher temperature.
The optimum reaction temperature for woody biomass HTC was dropped from 350°C to 300°C
by Ba(OH)2, Ca(OH)2 and FeSO4 (Xu and Lad, 2008).

13
Alkali salts promoted the conversion of biomass to bio-oil through HTC, but the bio-oil
yield decreased with the addition of an excessive amount of catalyst. Ogi and his co-workers
(1985) used Quercus serrata thunb as feedstock, and K2CO3 as catalyst to study the effect of
catalyst loading on wood HTC. They found that the bio-oil yield increased from 5.0% to 26.2%
as alkali catalyst loading increased from 0 to 1.4%. However, when the catalyst loading further
increased, the bio-oil yield decreased. This phenomenon also observed by other researchers
(Bhaskar et al., 2008) when cypress was used as feedstock with alkali salt catalyst. Contrarily,
the char yield of cypress HTC decreased firstly and then increased as the increasing alkali
catalyst loading (Bhaskar et al., 2008). It indicated that severe alkali condition suppressed the
bio-oil production from lignin, but promoted the char formation from the intermediate products
of lignin decomposition by condensation and repolymerization.
Suzuki and Nakamura (1988) proposed the following reasons to explain this
phenomenon: (1) high alkali concentration accelerated the formation of solids from some oil
fraction through repolymerization; (2) alkali salts that generated by the reaction of catalyst and
some oil fraction dissolved in an aqueous phase; (3) high pH also enhanced the formation of
materials that was easily soluble in an aqueous phase.
2.1.4 Effect of solvent on HTC
Water is the cheapest and most common medium in HTC, but the bio-oil obtained from
lignocellulose HTC with water is a viscous tarry lump with high oxygen content and low heating
value, which can not be utilized directly. Fortunately, Researchers have generated bio-oils with
low viscosity and high yield by using organic solvents such as ethyl acetate (Demirbas, 2000a),
acetone (Heitz et al., 1994; Liu and Zhang, 2008), 2-propanol (Ogi et al., 1994), and butanol
(Ogi et al., 1993), but these solvents are expensive. Glycerol (glycerine) can be used as an
organic solvent for biomass delignification (Demirbas, 1992; 2008; Demirbas and Celik, 2005;
Kücük, 2005) and to significantly improve the performance of liquefaction in the conversion of
biomass into bio-oil (Demirbas, 2000b; Xiu et al., 2010).
The HTC of pinewood in the presence of three solvents (water, acetone and ethanol) was
studied in a 200mL autoclave by Liu and Zhang (2008) in the conditions of temperature rang
250°C to 450°C, starting pressure 1MPa with argon, and retention time 20min. Their results
showed that the behaviors of biomass HTC in organic solvents were similar with that in water,
14
and the solvent efficiency in pinewood HTC was in an order of: ethanol>acetone>water.
Furthermore, Yao et al. (1994) reported that biomass liquefaction with mixed solvent was more
significantly promoted than that with sole solvent because the mixed solvents had a synergistic
capability to enhance the biomass liquefaction and suppress the solid residue formation.
2.2 Effects of lignocellulosic biomass components on its HTC
2.2.1 Cellulose HTC
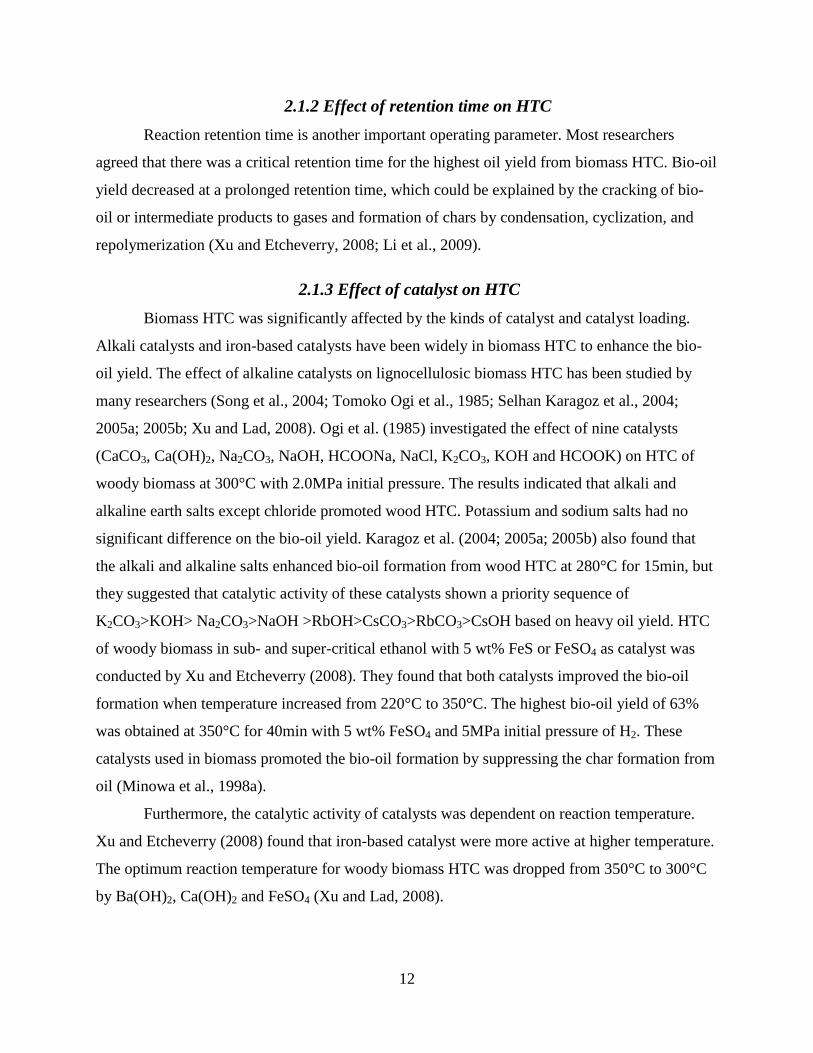
Cellulose is a long linear chain polymer of glucose, which was strung together by ß-
glycosidic linkages. The structure of cellulose is presented in Figure 2.1. The high degree of
hydrogen bonding between cellulose chains makes cellulose more stable and resistant to
chemical attack in comparison with hemicellulose.
Figure 2.1 Structure of cellulose
Cellulose is converted into bio-oil by HTC through hydrolysis and decomposition.
Glucose is the main product of cellulose hydrolysis (Bobleter, 1994). Then, glucose is
decomposed to organic acid (i.e. acetic acid, formic acid, lactic acid, levulinic acid), aldehydes
and aromatic chemicals by Retro Aldol reaction, Dehydration, Benzilic acid rearrangement and
hydration (Antal et al., 1990a; 1990b; Kabyemela et al., 1997;1999; Srokol et al., 2004; Aida et
al., 2007; Takeuchi et al., 2008; Kishida et al., 2006; Girisuta et al., 2006; Luijkx et al., 1993).
The conversion pathways of cellulose changed with acidic, neutral and alkaline conditions.
Under acidic conditions, 5-HMF (5-Hydroxymethyl-furfural) and levulinic acid are the main
products of cellulose HTC. levulinic acid is produced from 5-HMF by hydration. Under alkaline
conditions, the main conversion products are formic acid, acetic acid and lactic acids, which are
produced from the intermediates glycolaldehyde, glyceraldehydes, and pyruvaldehyde. Under
neutral conditions, both acidic and alkaline pathway exist (Yin and Tan, 2012).
When pure cellulose was used as HTC feedstock without catalyst, it was found to
decompose quickly between 240 and 270°C. The formation of bio-oil from cellulose HTC
15
started at 240°C, and bio-oil yield reached its highest level at 300°C, but then decreased as
temperature further increased. With 5% alkali catalyst, cellulose is decomposed quickly between
260 and 300°C, and bio-oil yield almost kept constant when temperature was higher than 300°C
(Minowa, et al., 1998a).
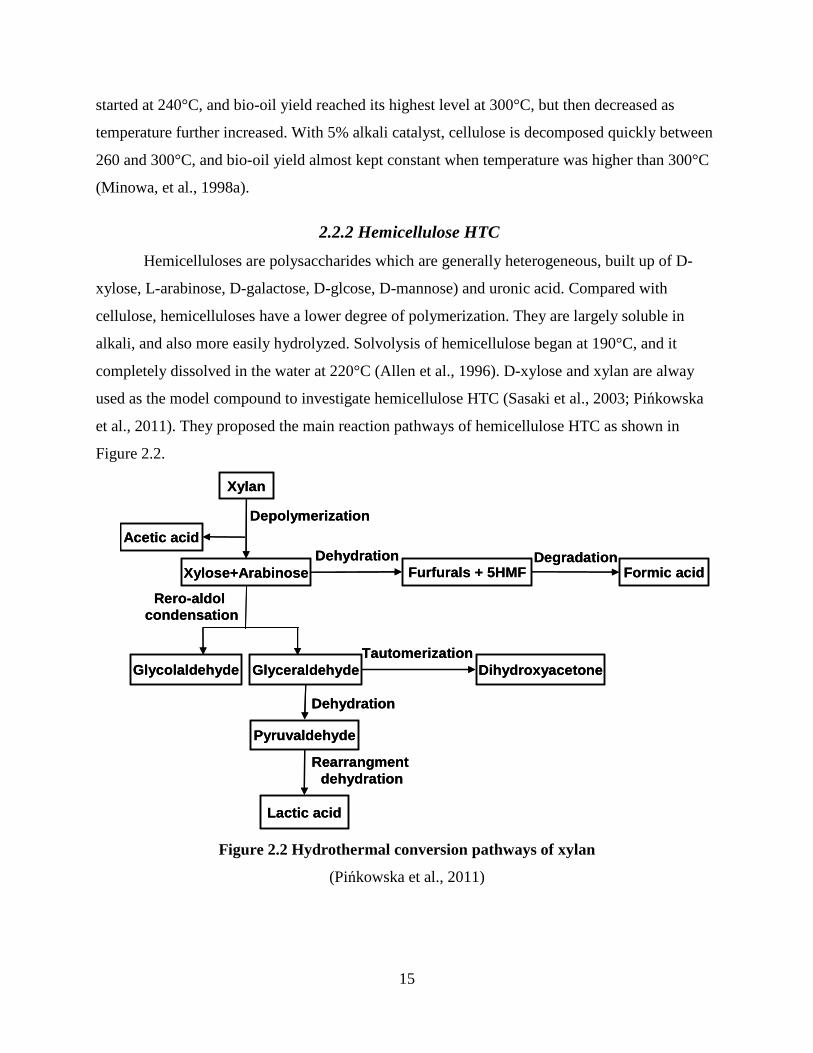
2.2.2 Hemicellulose HTC
Hemicelluloses are polysaccharides which are generally heterogeneous, built up of D-
xylose, L-arabinose, D-galactose, D-glcose, D-mannose) and uronic acid. Compared with
cellulose, hemicelluloses have a lower degree of polymerization. They are largely soluble in
alkali, and also more easily hydrolyzed. Solvolysis of hemicellulose began at 190°C, and it
completely dissolved in the water at 220°C (Allen et al., 1996). D-xylose and xylan are alway
used as the model compound to investigate hemicellulose HTC (Sasaki et al., 2003; Pińkowska
et al., 2011). They proposed the main reaction pathways of hemicellulose HTC as shown in
Figure 2.2.
Xylan
Xylose+Arabinose
Acetic acid
Furfurals + 5HMF
Tautomerization
Dehydration
Rero-aldolcondensation
Glycolaldehyde Glyceraldehyde Dihydroxyacetone
Pyruvaldehyde
Dehydration
Lactic acid
Rearrangmentdehydration
Depolymerization
DegradationFormic acid
Xylan
Xylose+Arabinose
Acetic acid
Furfurals + 5HMF
Tautomerization
Dehydration
Rero-aldolcondensation
Glycolaldehyde Glyceraldehyde Dihydroxyacetone
Pyruvaldehyde
Dehydration
Lactic acid
Rearrangmentdehydration
Depolymerization
DegradationFormic acid
Figure 2.2 Hydrothermal conversion pathways of xylan
(Pińkowska et al., 2011)
16
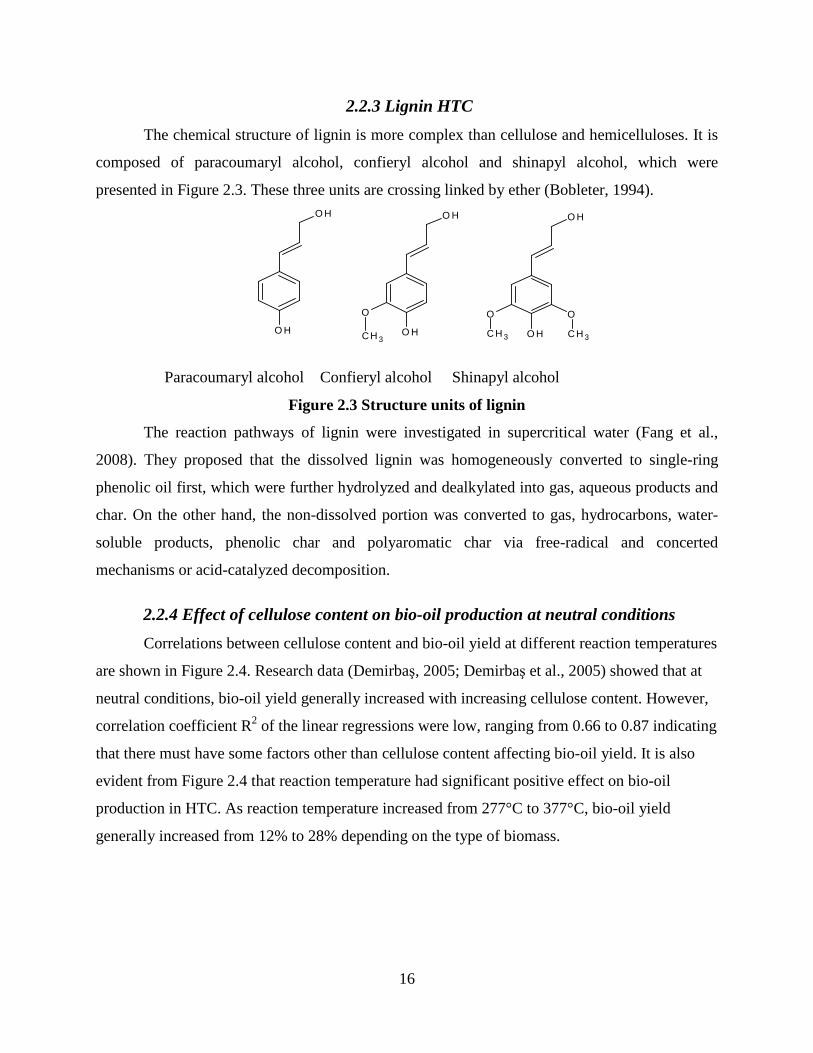
2.2.3 Lignin HTC
The chemical structure of lignin is more complex than cellulose and hemicelluloses. It is
composed of paracoumaryl alcohol, confieryl alcohol and shinapyl alcohol, which were
presented in Figure 2.3. These three units are crossing linked by ether (Bobleter, 1994). O H
O H
O H
O H
O
CH 3
O H
O H
O
CH 3
O
CH 3
Paracoumaryl alcohol Confieryl alcohol Shinapyl alcohol
Figure 2.3 Structure units of lignin
The reaction pathways of lignin were investigated in supercritical water (Fang et al.,
2008). They proposed that the dissolved lignin was homogeneously converted to single-ring
phenolic oil first, which were further hydrolyzed and dealkylated into gas, aqueous products and
char. On the other hand, the non-dissolved portion was converted to gas, hydrocarbons, water-
soluble products, phenolic char and polyaromatic char via free-radical and concerted
mechanisms or acid-catalyzed decomposition.
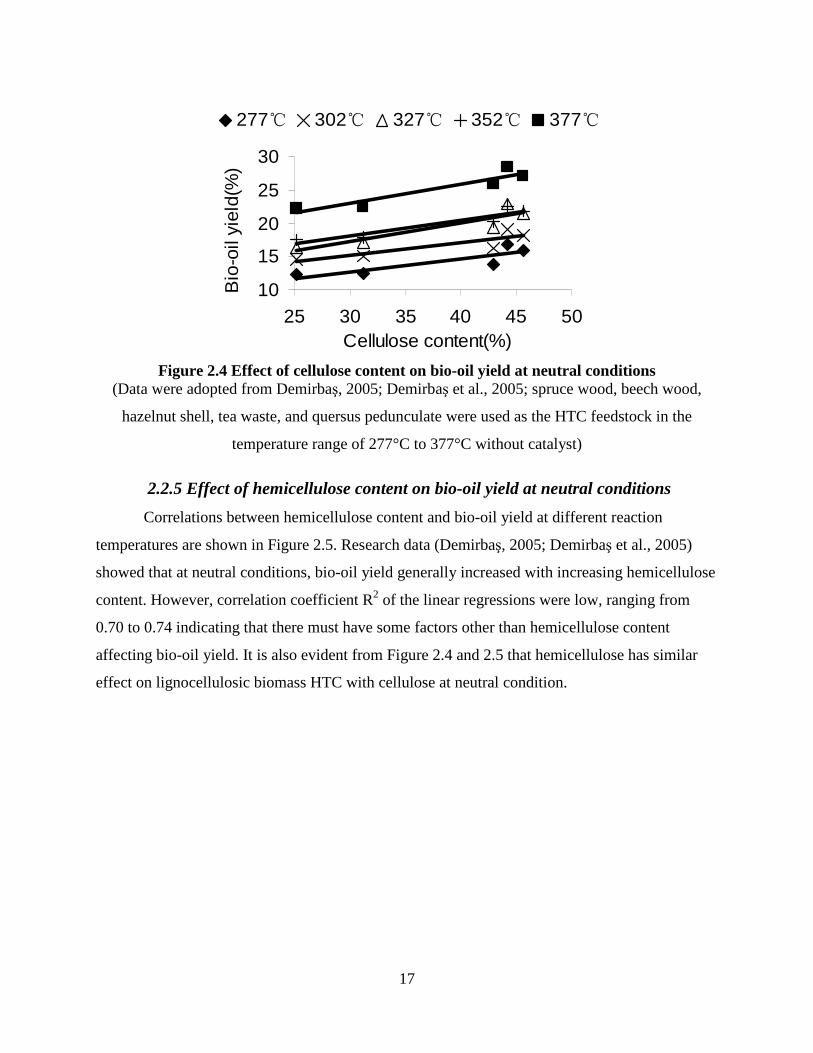
2.2.4 Effect of cellulose content on bio-oil production at neutral conditions
Correlations between cellulose content and bio-oil yield at different reaction temperatures
are shown in Figure 2.4. Research data (Demirbaş, 2005; Demirbaş et al., 2005) showed that at
neutral conditions, bio-oil yield generally increased with increasing cellulose content. However,
correlation coefficient R2 of the linear regressions were low, ranging from 0.66 to 0.87 indicating
that there must have some factors other than cellulose content affecting bio-oil yield. It is also
evident from Figure 2.4 that reaction temperature had significant positive effect on bio-oil
production in HTC. As reaction temperature increased from 277°C to 377°C, bio-oil yield
generally increased from 12% to 28% depending on the type of biomass.
17
10
15
20
25
30
25 30 35 40 45 50Cellulose content(%)
Bio
-oil
yiel
d(%
)
277℃ 302℃ 327℃ 352℃ 377℃
Figure 2.4 Effect of cellulose content on bio-oil yield at neutral conditions (Data were adopted from Demirbaş, 2005; Demirbaş et al., 2005; spruce wood, beech wood,
hazelnut shell, tea waste, and quersus pedunculate were used as the HTC feedstock in the
temperature range of 277°C to 377°C without catalyst)
2.2.5 Effect of hemicellulose content on bio-oil yield at neutral conditions
Correlations between hemicellulose content and bio-oil yield at different reaction
temperatures are shown in Figure 2.5. Research data (Demirbaş, 2005; Demirbaş et al., 2005)
showed that at neutral conditions, bio-oil yield generally increased with increasing hemicellulose
content. However, correlation coefficient R2 of the linear regressions were low, ranging from
0.70 to 0.74 indicating that there must have some factors other than hemicellulose content
affecting bio-oil yield. It is also evident from Figure 2.4 and 2.5 that hemicellulose has similar
effect on lignocellulosic biomass HTC with cellulose at neutral condition.

18
10
15
20
25
30
22 24 26 28 30 32 34Hemicellulose content(%)
Bio
-oil
yiel
d(%
)
277℃ 302℃ 327℃ 352℃ 377℃
Figure 2.5 Effect of hemicellulose content on bio-oil yield at neutral conditions
(Data were adopted from Demirbaş, 2005; Demirbaş et al., 2005; spruce wood, beech wood,
hazelnut shell, tea waste, and quersus pedunculate were used as the HTC feedstock in the
temperature range of 277°C to 377°C without catalyst)
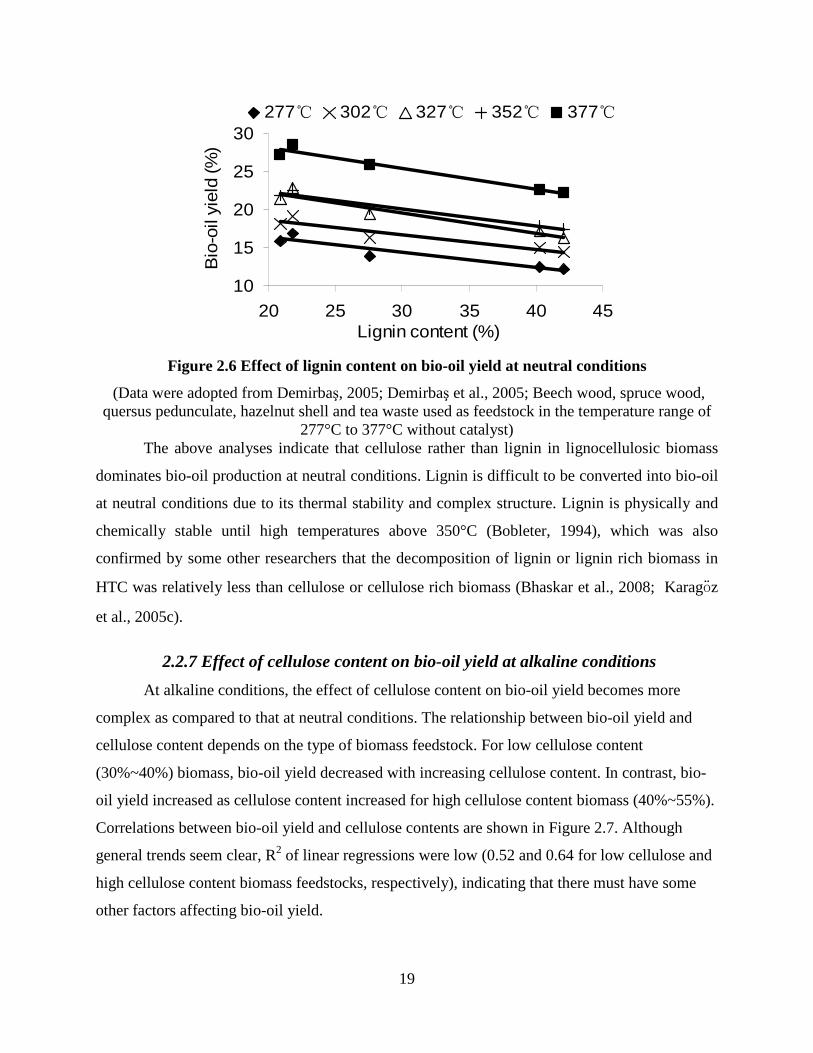
2.2.6 Effect of lignin content on bio-oil yield at neutral conditions
Lignin is composed of paracoumaryl alcohol, confieryl alcohol and shinapyl alcohol.
These three components are cross-linked by ethers (Bobleter, 1994). Compared to cellulose,
lignin content has opposite effect on bio-oil production. Research results showed that bio-oil
yield decreased with increasing lignin content without catalyst (Demirbaş, 2005; Demirbaş et al.,
2005), which are shown in Figure 2.6 by correlations between lignin content and bio-oil yield.
The correlation coefficients were in the range of 0.84 to 0.96, indicating a strong negative
correlation between lignin content and bio-oil yield. In addition, Zhong and Wei (2004) found
that the yield of bio-oil produced from woody biomass HTC generally decreased with increasing
lignin content in the temperature range of 280°C to 340°C without catalyst. Bhaskar et al. (2008)
also found that cherry with higher lignin content produced less bio-oil than cypress with lower
lignin content at 280°C without catalyst.
19
10
15
20
25
30
20 25 30 35 40 45Lignin content (%)
Bio
-oil
yiel
d (%
)
277℃ 302℃ 327℃ 352℃ 377℃
Figure 2.6 Effect of lignin content on bio-oil yield at neutral conditions
(Data were adopted from Demirbaş, 2005; Demirbaş et al., 2005; Beech wood, spruce wood, quersus pedunculate, hazelnut shell and tea waste used as feedstock in the temperature range of
277°C to 377°C without catalyst) The above analyses indicate that cellulose rather than lignin in lignocellulosic biomass
dominates bio-oil production at neutral conditions. Lignin is difficult to be converted into bio-oil
at neutral conditions due to its thermal stability and complex structure. Lignin is physically and
chemically stable until high temperatures above 350°C (Bobleter, 1994), which was also
confirmed by some other researchers that the decomposition of lignin or lignin rich biomass in
HTC was relatively less than cellulose or cellulose rich biomass (Bhaskar et al., 2008; Karagöz
et al., 2005c).
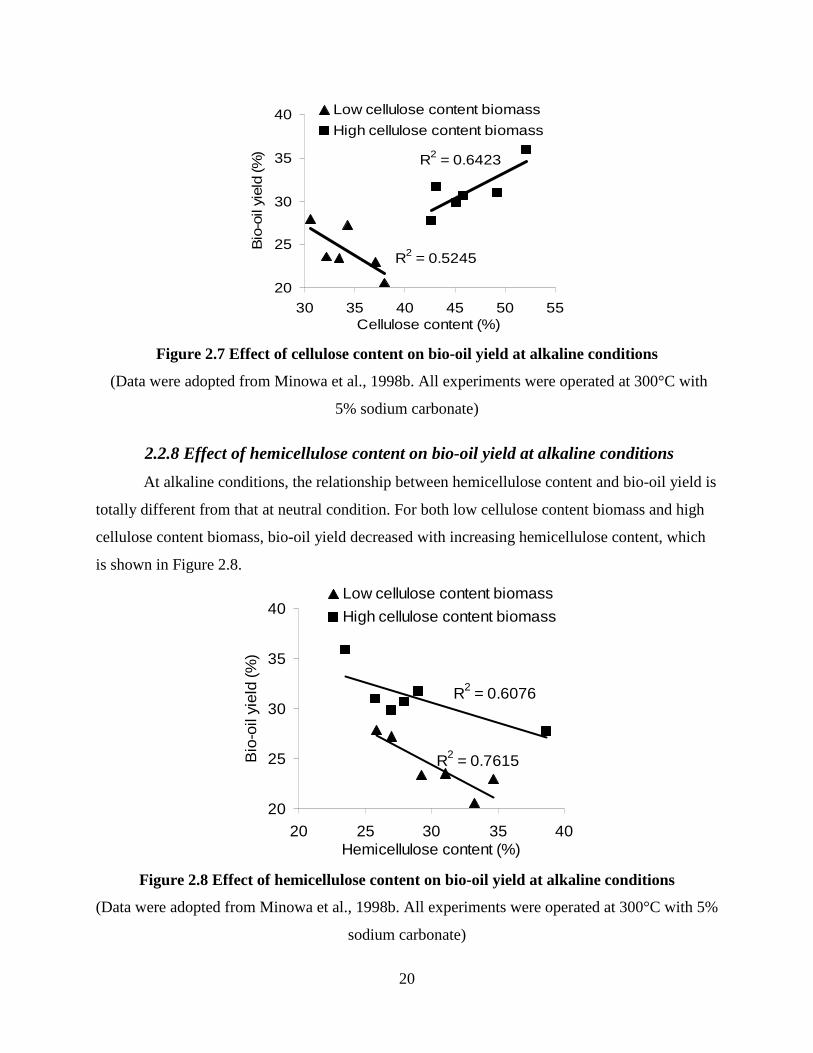
2.2.7 Effect of cellulose content on bio-oil yield at alkaline conditions
At alkaline conditions, the effect of cellulose content on bio-oil yield becomes more
complex as compared to that at neutral conditions. The relationship between bio-oil yield and
cellulose content depends on the type of biomass feedstock. For low cellulose content
(30%~40%) biomass, bio-oil yield decreased with increasing cellulose content. In contrast, bio-
oil yield increased as cellulose content increased for high cellulose content biomass (40%~55%).
Correlations between bio-oil yield and cellulose contents are shown in Figure 2.7. Although
general trends seem clear, R2 of linear regressions were low (0.52 and 0.64 for low cellulose and
high cellulose content biomass feedstocks, respectively), indicating that there must have some
other factors affecting bio-oil yield.
20
R2 = 0.5245
R2 = 0.6423
20
25
30
35
40
30 35 40 45 50 55Cellulose content (%)
Bio
-oil
yiel
d (%
)
Low cellulose content biomass
High cellulose content biomass
Figure 2.7 Effect of cellulose content on bio-oil yield at alkaline conditions
(Data were adopted from Minowa et al., 1998b. All experiments were operated at 300°C with
5% sodium carbonate)
2.2.8 Effect of hemicellulose content on bio-oil yield at alkaline conditions
At alkaline conditions, the relationship between hemicellulose content and bio-oil yield is
totally different from that at neutral condition. For both low cellulose content biomass and high
cellulose content biomass, bio-oil yield decreased with increasing hemicellulose content, which
is shown in Figure 2.8.
R2 = 0.7615
R2 = 0.6076
20
25
30
35
40
20 25 30 35 40Hemicellulose content (%)
Bio
-oil
yiel
d (%
)
Low cellulose content biomass
High cellulose content biomass
Figure 2.8 Effect of hemicellulose content on bio-oil yield at alkaline conditions
(Data were adopted from Minowa et al., 1998b. All experiments were operated at 300°C with 5%
sodium carbonate)

21
2.2.9 Effect of lignin content on bio-oil yield at alkaline conditions
At alkaline conditions, the relationship between lignin content and bio-oil yield is totally
different from that at neutral conditions. A study showed that bio-oil yield increased with
increasing lignin content at alkaline conditions (Minowa et al., 1998b) which is presented in
Figure 2.9. The high values of R2 (about 0.95) indicate a strong positive correlation between
lignin content and bio-oil yield. This was also confirmed by others. For example, Zhong and Wei
(1994) found that the maximum bio-oil yields of four kinds of woody biomass generally
increased as lignin content increased with 10wt% catalyst over 280°C. Bhasker et al. (2008)
found that cherry with higher lignin content produced more bio-oil than cypress with lower
lignin content at 280°C with alkali catalyst.
R2 = 0.9514
R2 = 0.9468
20
25
30
35
40
10 15 20 25 30 35 40 45 50 55
Lignin content(%)
Bio
-oil
yiel
d (%
)
Low cellulose content biomass
High cellulose content biomass
Figure 2.9 Effect of lignin content on bio-oil yield at alkali conditions
(Data were adopted from Minowa et al., 1998b. All experiments were operated at 300°C with 5% sodium carbonate)
It can also be seen from Figure 2.9 that bio-oil yields obtained from high-cellulose
content biomass were higher than those from low-cellulose content biomass at the same lignin
content, which cannot be explained by the sole effect of cellulose content. This is possibly due to
the difference in the physical structure of the two categories of biomass feedstocks. Low-
cellulose biomass (e.g., leaves) may have a cellulose-lignin structure that is difficult to be broken
up at alkaline conditions for bio-oil formation. They may also contain cellulose and/or lignin that
are not appropriate for bio-oil production. Vice versa, high-cellulose biomass (e.g., hard wood)

22
may have a physical structure or cellulose/lignin that are suitable for bio-oils. More
investigations are needed to understand these phenomena.
The effect of cellulose, hemicellulose and lignin content on bio-oil production via HTC
summarized above is based on a few researches. It might be just fit for special conditions. Thus,
more work needs to do to figure out the common influence. In addition, there is little literature
on interactions between cellulose-derived chemicals, hemicellulose-derived chemicals and
lignin-derived chemicals. Thus, the decomposition behaviors of cellulose, hemicelluloses, lignin,
and many kinds of natural lignocellulosic biomass will be studied in this project.
23
References
Aida, T. M., Tajima, K., Watanabe, M., Saito, Y., Kuroda, K., Nonaka, T., Hattori, H., Smith Jr, R. L, and Arai, K. (2007). Reaction of D-fructose in water at temperatures up to 400°C and pressures up to 100 MPa. Journal of Supercritical Fluids 42(1), 110-119.
Allen, S. G., Kam, L. C., Zemann, A. J., and Antal Jr, M. J. (1996). Fractionation of sugar cane with hot, compressed, liquid water. Ind. Eng. Chem. Res. 35, 2709-2715.
Antal Jr, M. J., Mok, W. S. L., and Richards, G. N. (1990a). Four-carbon model compoundsfor the reactions of sugars in water at high temperature. Carbohydrate Research 199(1), 111-115.
Antal Jr, M. J., Mok, W. S. L., and Richards, G. N. (1990b). Mechanism of formation of 5-(hudroxymethyl)-2-furaldehyde from d-fructose and sucrose. Carbohydrate Research 199(1), 91-109.
Bhaskar, T., Sera, A., Muto, A., and Sakata, Y. (2008). Hydrothermal upgrading of wood biomass: Influence of the addition of K2CO3 and cellulose/lignin ratio. Fuel 87(10-11), 2236-2242.
Bobleter, O. (1994). Hydrothermal degradation of polymers derived from plants. Progress inPolymer Science (Oxford) 19, 797-841.
Chiellini, E., Cinelli, P., Ilieva, V. I., Imam, S. H., and Lawton, J. W. (2009).Environmentally compatible foamed articles based on potato starch, corn fiber, and poly (vinyl alcohol). Journal of Cellular Plastics 45(1), 17–32.
Czernik, S., and Bridgwater, A. V. (2004). Overview of applications of biomass fast pyrolysis oil. Energy and Fuels 18(2), 590-598.
Chornet E, and R. P. Overend (1985). Biomass liquefaction: An overview. In: Fundamentals of thermochemical biomass conversion. Overend, R. P, Milne, T. A., Mudge, L. K. (Eds). New York: Elsevier Applied Science 967-1002.
Demirbas, A. (1992). Conversion of wood to liquid products using alkaline glycerol. Fuel Science Technology Int. 10(2), 173-184.
Demirbas, A. (2000a). Effect of lignin content on aqueous liquefaction products of biomass. Energy Conversion and Management 41(15), 1601-1607.
Demirbas, A. (2000b). Conversion of biomass using glycerin to liquid fuel for blending gasoline as alternative engine fuel. Energy Conversion and Management 41(16), 1741-1748.
Demibas, A. (2005). Thermochemical conversion of biomass to liquid products in the aqueous medium. Energy Sources 27, 1235-1243.

24
Demirbas, A. (2008). Liquefaction of biomass using glycerol. Energy Sources, Part A 30(12), 1120-1126.
Demirbas, A., and Celik, A. (2005). Degradation of poplar and spruce wood chips using alkaline glycerol. Energy Sources, Part A 27(11), 1073-1084.
Demirbas, A, Balat, M., and Bozbas, K. (2005). Direct and catalytic liquefaction of wood species in aqueous solution. Energy Sources 27, 271-277.
FAO. (2008). FAOSTAT statistics database. Available at: faostat.fao.org/site/567/DesktopDefault.aspx?PageID=567.
Fang, Z., Sato, T., Smith Jr., R. L., Inomata, H., Arai, K., and Kozinski, J. A. (2008). Reaction chemistry and phase behavior of lignin in high-temperature and supercritical water. Bioresource Technology 99, 3424-3430.
Girisuta, B., Janssen, L. P. B. M., and Heeres, H. J. (2006). A kinetic study on the decomposition of 5-hydroxymethylfurfural into levulinic acid. Green Chemistry 8(8), 701-709.
Heitz, M., Brown, A., and Chornet, E. (1994). Solvent effects on liquefaction: Solubilization profiles of a Canadian prototype wood, Populus deltoids, in the presence of different solvents. The Canadian Journal of Chemical Engineering 72(6), 1021-1027.
Huber, G. W., and Dumesic, J. A. (2006). An overview of aqueous-phase catalytic processes for production of hydrogen and alkanes in a biorefinery. Catalysis Today 111(1-2), 119-132.
Huber, G. W., Iborra, S., and Corma, A. (2006). Synthesis of transportation fuels from biomass: chemistry, catalysts, and engineering. Chem. Rev. 106, 4044-4098.
Kabyemela, B. M. (1997). Degradation kinetics of dihydroxyacetone and glyceraldehydes in subcritical and supercritical water. Industrial and Engineering Chemistry Research 36(6), 2025-2030.
Kabyemela, B. M., Adschiri, T., Malaluan, R. M., and Arai, K. (1999). Glucose and fructose decomposition in subcritical and supercritical water: Detailed reaction pathway, mechanisms, and kinetics. Industrial and Engineering Chemistry Research 38(8), 2888-2895.
Karagöz, S., Bhaskar, T., Muto, A., and Sakata, Y. (2004). Effect of Rb and Cs carbonates for production of phenols from liquefaction of wood biomass. Fuel 83, 2293-2299.
Karagöz, S., Bhaskar, T., Muto, A., Sakata, Y., Oshiki, T., and Kishimoto, T. (2005a). Low temperature catalytic hydrothermal treatment of wood biomass: analysis of liquid products. Chemical Engineering Journal 108, 127-137.
Karagöz, S., Bhaskar, T., Muto, A., and Sakata, Y. (2005b). Catalytic hydrothermal treatment of pine wood biomass: effect of RbOH and CsOH on product distribution. Journal of Chemical Technology and Biotechnology 80, 1097-1102.
25
Karagöz, S, Bhaskar, T., Muto, A., and Sakata, Y. (2005c). Comparative studies of oil compositions produced from sawdust, rice husk, lignin and cellulose by hydrothermal treatment. Fuel 84(7-8), 875-884.
Kishida, H., Jin, F., Yan, X., Moriya, T., and Enomoto, H. (2006). Formation of lactic acid from glycolaldehyde by alkaline hydrothermal reaction. Carbohydrate Research 341(15), 2619-2623.
Kücük, M. M. (2005). Delignification of biomass using alkaline glycerol. Energy Sources, Part A 27(13), 1245-1255.
Li, H., Yuan, X., Zeng, G., Tong, J., Yan, Y., Cao, H., Wang L., Cheng, M., Zhang, J., and Yang, D. (2009). Liquefaction of rice straw in sub- and supercritical 1, 4-dioxane-water mixture. Fuel Processing Technology 90(5), 657-663.
Liu, Z., and Zhang, F. S. (2008). Effect of various solvents on the liquefaction of biomass to produce fuels and chemical feedstocks. Energy Conversion and Management 49(12), 3498-3504.
Luijkx, G. C. A, Van Rantwijk, F., and Van Bekkum, H. (1993). Hydrothermal formation of 1,2,4-benzenetriol from 5-hydroxymethyl-2-furaldehyde and D-fructose. Carbohydrate Research 242, 131-139.
Minowa, T., Zhen, F., and Ogi, T. (1998a). Cellulose decomposition in hot-compressed water with alkali or nickel catalyst. The Journal of Supercritical Fluids 13(1-3), 253-259.
Minowa, T., Kondo, T., and Sudirjo, S. T. (1998b). Thermochemical liquefaction of Indonesian biomass residues. Biomass and Bioenergy 14 (5-6), 517-524.
Ogi, T., Minowa, T., Dote, Y., and Yokoyama, S. Y. (1994). Characterization of oil produced by the direct liquefaction of Japanese oak in an aqueous 2-propanol solvent system. Biomass and Bioenergy 7(1-6), 193-199.
Ogi, T., and Yokoyama, S. Y. (1993). Liquid fuel production from woody biomass by direct liquefaction. Sekiyu Gakkaishi 36, 73-84.
Ogi, T., Yokoyama, S. Y., and Koguchi, K. (1985). Direct liquefaction of wood by alkali and alkaline earth salt in an aqueous phase. Chemistry letters 1199-1202.
Perlack, R. D., Wright, L. L., Turhollow, A. F., Graham, R. L., Stokes, B. J., and Erbach, D. C. (2005). Biomass as feedstock for a bioenergy and bioproducts industry: The technical feasibility of a billion-ton annual supply. Sponsored by USDOE and USDA 2005.
Peterson, A. A., Vogel, F., Lachance, R. P., Fröling, M., Antal Jr, M. J., and Tester, J. W. (2008). Thermochemical biofuel production in hydrothermal media: A review of suband supercritical water technologies. Energy and Environmental Science 1, 32-65.

26
Pińkowska, H., Wolak, P., and Zlocińska, A. (2011). Hydrothermal decomposition of xylan as a model substance for plant biomass waste- Hydrothermolysis in subcritical water. Biomass Bioenergy 35, 3902-3912.
Qian, Y., Zuo, C., Tan, J., and He, J. (2007). Structural analysis of bio-oils from sub-and supercritical water liquefaction of woody biomass. Energy 32, 196-202.
Raveendraw, K., Ganesh, A., and Khilart, K. C. (1995). Influence of mineral matter on biomass pyrolysis characteristics. Fuel 74(12), 1812-1822.
Sasaki, M., Hayakawa, T., Arai, K., and Adichiri, T. (2003). Measurement of the rate of retroaldol condensation of D-xylose in subcritical and supercritical water. Presented at the Proceeding of the 7th International Symposium on Hydrothermal Reactions. 169-172.
Sluiter, A., Hames, B., Ruiz, R., Scarlata, C., Sluiter, J., Templeton, D., and Crocker, D. (2008). Determination of structural carbohydrates and lignin in biomass. Colorado: NREL/MRI.
Song, C., Hu, H., Zhu, S., Wang, G., and Chen, G. (2004). Nonisothermal catalytic liquefaction of corn stalk in subcritical and supercritical water. Energy and Fuels 18, 90-96.
Srokol, Z,. Bouche, A. G, Van Estrik, A., Strik, R. C. J., Mashmeyer, T., and Peters, J. A. (2004). Hydrothermal upgrading of biomass to biofuels; studies on some monosaccharide model compounds. Carbohydrate Research 339(10), 1717-1726.
Suzuki, A., and Nakamura, T. (1988). Conversion of sewage sludge to heavy oil by direct thermochemical liquefaction. Journal of Chemical Engineering of Japan 21(3), 288-293.
Takeuchi, Y., Jin, F., Tohji, K., and Enomoto, H. (2008). Acid catalytic hydrothermal conversion of carbohydrate biomass into useful substances. Journal of Materials Science 43(7), 2472-2475.
Xiu, S., Shabazi, A., Shirley, V., Mims, M. R., and Wallace, C. W. (2010). Effectiveness and mechanisms of crude glycerol on the biofuels production from swine manure through hydrothermal pyrolysis. Journal of Analytical and Applied Pyrolysis 87(2), 194-198.
Xu, C., and Lancaster, J. (2008). Conversion of secondary pulp/paper sludge powder to liquid oil products for energy recovery by direct liquefaction in hot-compressed water. Water Research 42(6-7), 1571-1582.
Xu, C., and Lad, N. (2008). Production of heavy oils with high caloric values by direct liquefaction of woody biomass in sub/near-critical water. Energy and Fuels 22, 635-642.
Xu, C., and Etcheverry, T. (2008). Hydro-liquefaction of woody biomass in sub- and super-critical ethanol with iron-based catalysts. Fuel 87(3), 335-345.
Yao, Y., Yoshioka, M., and Shiraishi, N. (1994). Soluble properties of liquefied biomass prepared in organic solvents I. The soluble behavior of liquefied biomass in various diluents. Mokuzai Gakkaishi 40(2), 176-184.

27
Yin, S., and Tan, Z. (2012). Hydrothermal liquefaction of cellulose to bio-oil under acidic, neutral and alkaline conditions. Applied Energy 92, 234-239.
Yu, F., Ruan, R., Chen, P., Deng, S., Liu, Y., and Lin, X. (2007). Liquefaction of corn cobs with supercritical water treatment. Transactions of the ASABE 50(1), 175-180.
Yuan, X. Z., Li, H., Zeng, G. M., Tong, J. Y., and Xie, W. (2007). Sub- and supercritical liquefaction of rice straw in the presence of ethanol-water and 2-propanol-water mixture. Energy 32(11), 2081-2088.
Yuan, X. Z., Tong, J. Y., Zeng, G. M., Li, H., and Xie, W. (2009). Comparative studies of products obtained at different temperatures during straw liquefaction by hot compressed water. Energy and Fuels 23, 3262-3267.
Zhang, Q., Chang, J., Wang, T., and Xu, Y. (2007). Review of biomass pyrolysis oil properties and upgrading research. Energy Conversion and Management 48(1), 87-92.
Zhang, Y., Riskowski, G., and Funk, T. (1999). Thermochemical conversion of swine manure to produce fuel and reduce waste. Illinois Council on Food and Agricultural Research, December, University of Illinois, Urbana, IL.
Zhang, B., Keitz, M. V., and Kenneth, V. (2008). Maximizing the liquid fuel yield in a biorefining process. Biotechnology and Bioengineering 101(5), 903-912.
Zhong, C., and Wei, X. (2004). A comparative experimental study on the liquefaction of wood. Energy 29(11), 1731-1741.
28
Chapter 3 - Hydrothermal Conversion of Corn Cobs and Crude
Glycerol*
Abstract
The effect of operating parameters including reaction temperature, retention time,
biomass content, and catalyst loading on bio-oil yield from hydrothermal conversion of corn
cobs was investigated. The highest bio-oil yield of 33.8% on the basis of biomass dry weight was
obtained at 305°C, 20 min retention time, 10% biomass content, and 0.5% catalyst loading on a
total reactant weight basis. At selected conditions, the effect of crude glycerol on bio-oil yield
and quality was studied. Bio-oil yield based on the total weight of corn cobs and crude glycerol
remained almost constant at approximately 24% when the ratio of crude glycerol/corn cobs was
below 3. When more crude glycerol was added, bio-oil yield dramatically increased to 36.3%. H2
molar percentage in the gas product increased from 11.1% to 27.5% as the crude glycerol/corn
cobs ratio increased from 0 to 5. Bio-oil quality in terms of density and viscosity was also
enhanced; however, oxygen content in bio-oil increased from 15.5% to 19.9%.
* Results have been published.
Gan, J., Yuan W., Nelson N. O., Agudelo S. C. 2010. Hydrothermal conversion of corn cobs and crude glycerol.
Biological Engineering 2(4):197-210.
29
3.1 Introduction
Hydrothermal conversion (HTC), also called hydrothermal/direct liquefaction or
hydrothermal upgrading/depolymerization, is a promising method for converting biomass into
bio-oil. It is a chemical reforming process in which organic matters are depolymerized and
reformed in a heated, pressurized, oxygen-free enclosure. The process is usually conducted under
elevated pressure (700 to 3,000 psi) and at lower temperatures (200°C to 400°C) than other
thermochemical conversion methods, such as gasification and fast pyrolysis. Use of water as a
solvent in HTC obviates the need to dry biomass and permits reactions to be carried out at lower
temperatures. Moreover, both dry and wet biomass can be used as feedstock in HTC. The
primary product of HTC is an oily organic liquid called bio-oil or bio-crude, and the main by-
products are solid residue (also called bio-char), aqueous products, and gases. Bio-oils can be
used as a fuel for burners, boilers, stationary diesel engines, or turbines (Czernik and Bridgwater,
2004). They may also serve as a starting material for valuable petroleum-based fuels (e.g.,
gasoline and diesel) and products such as polymers, aromatics, lubricants, and asphalt (Zhang et
al., 2007; Peterson et al., 2008). For comparison, bio-oils can also be made by fast pyrolysis,
which occurs at atmospheric pressure under higher temperatures (~500 ºC) with short residence
times (<2 s). Although fast pyrolysis oils have the advantage of short residence times and lower
capital costs (Huber et al., 2006), oils produced from HTC typically have more desirable
qualities than fast pyrolysis oils. As shown in Table 1.1, HTC oils typically have much lower
oxygen and moisture contents, and consequently have higher energy value and better stability, as
compared to oils from fast pyrolysis. Moreover, drying the feedstock is not needed in HTC,
which makes it especially suitable for naturally wet or high moisture content biomass.
Corn-based products or by-products are usually a good source for second generation
biofuels production because corn is one of the most widely planted crops in the world. Annual
worldwide corn production is about 6.95 × 10¹¹ kg, and approximately 50% of that is produced
in the United States, mostly in the central states (FAO, 2008). Corn cobs are an important by-
product of corn production. About 18 kg of corn cobs are produced from every 100 kg of corn
grain (Chiellini et al., 2009). Although corn cobs have been studied as a feedstock for HTC (Yu
et al., 2007; Zhang et al., 2008), bio-oil production from corn cobs HTC has not been fully
investigated or optimized. Considering that the yield and quality of bio-oil are strongly
dependent on factors such as feedstock characteristics, operating temperature, retention time, and

30
biomass content, it is necessary to study how these factors can affect bio-oil production via HTC
processes.
Bio-oils obtained from biomass HTC are usually very viscous, which makes them
difficult to transport, handle, and use. Researchers have generated bio-oils with low viscosity and
high yield by using organic solvents such as ethyl acetate (Demirbas, 2000a), acetone (Heitz et
al., 1994; Liu and Zhang, 2008), 2-propanol (Ogi et al., 1994), and butanol (Ogi and Yokoyama,
1993), but these solvents are expensive. Glycerol can be used as an organic solvent for biomass
delignification (Demirbas, 1992; 2008; Demirbas and Celik, 2005; Kücük, 2005) and to
significantly improve the performance of liquefaction in the conversion of biomass into bio-oil
(Demirbas, 2000b; Xiu et al., 2010). Crude glycerol is a low-value by-product of biodiesel
production and is sometimes treated as a waste. Approximately 0.8 lb of crude glycerol is made
for each gallon of biodiesel produced. Because of the rapid growth of the biodiesel industry, the
quantity of crude glycerol produced is becoming considerable (e.g., >200 million lb per year);
treatment and possible use of this by-product are topics of urgent importance.
With the final goal of improving the yield and quality of bio-oil from HTC of corn cobs,
the objective of this study was to understand the effect of HTC operating parameters including
reaction temperature, retention time, and biomass content and using crude glycerol as an organic
solvent on bio-oil production from corn cobs. This work is distinguished from previous work on
corn cobs HTC (Yu et al., 2007; Zhang et al., 2008) in that the bio-oil yield instead of
liquefaction yield was studied under various operating conditions. Liquefaction yield simply
calculates the fraction of biomass that is converted into liquid products, which does not reflect
how much bio-oil is actually made. In this study, major products including bio-oil, biochar, and
gas were separated and characterized. Moreover, crude glycerol was used as a unique solvent and
feedstock for bio-oil production.
3.2 Materials and Methods
3.2.1 Materials
Commercially available corn cobs were obtained from Kaytee Products, Inc. (Chilton,
Wisc.). Before the experiments, corn cobs were ground in a rotary cutting mill (model SM2000,
Retsch, Inc., Newtown, Pa.) with a 1.0 mm screen. In order to keep all samples free of moisture,
corn cobs were dried at 49°C overnight before grinding and HTC experiments.
31
Crude glycerol was made via transesterification of food-grade vegetable oil in the
laboratory. A premixed solution containing 7 g of NaOH and 200 mL of methanol was added to
each liter of oil. The mixture was continuously agitated and heated (50°C) for 1 h. The products
(biodiesel and glycerol) were transferred to a separating funnel and let stand for 5 h for more
complete reaction and separation. Crude glycerol in the bottom layer (pH ~9) was then drained
from the funnel and used in the experiments. Such lab-scale biodiesel production and glycerol
separation processes are commonly used (Thompson and He, 2006; Coronado et al., 2008) and
generate a crude glycerol that contains 63 to 68 wt% glycerol (from pure vegetable oils), with the
rest being mainly soap, methanol, and small amounts of catalyst whose concentrations may vary
(Thompson and He, 2006; Xiu et al., 2010).
3.2.2 Biomass chemical composition analysis
Compositions of corn cobs were determined according to laboratory analytical
procedures developed by the National Renewable Energy Laboratory (Sluiter et al., 2005; Sluiter
et al., 2008). All data are on the biomass dry weight basis. Briefly, after water and ethanol
extraction, the sample was soaked in 72% sulfuric acid at 30 °C for 1 h with constant stirring,
followed by dilution to a 4% acid solution and heating for another hour at 120 °C. The aqueous
products and solid residue of the pretreatment process were separated by vacuum filtration. The
filtrate was adjusted to neutral by calcium carbonate, then the sugar contents of the filtrate were
measured by high-performance liquid chromatography (Shimadzu, Kyoto, Japan), and acid-
soluble lignin content in the filtrate was detected by a UV-visible spectrophotometer (BioMate 3,
Thermo Electron Corporation, Madison, WI). The solid residue was dried and combusted. The
weight difference between the dry residue and combustion residue was reported as acid-insoluble
lignin. Corn cob contains 35.6% cellulose, 29.9% hemicellulose, 14.2% lignin, and 12.8%
extractive.
3.2.3 Apparatus and process
A 1.8 L high-temperature high-pressure reactor (model 4578, Parr Instrument Co.,
Moline, Ill.) equipped with a magnetic stirrer, serpentine cooling coil, reflux/take-off condenser
assembly, and bottom drain valve was used for all experiments. The reactor was made of T316
stainless steel with an extreme operation capability of 5,000 psi and 500°C.
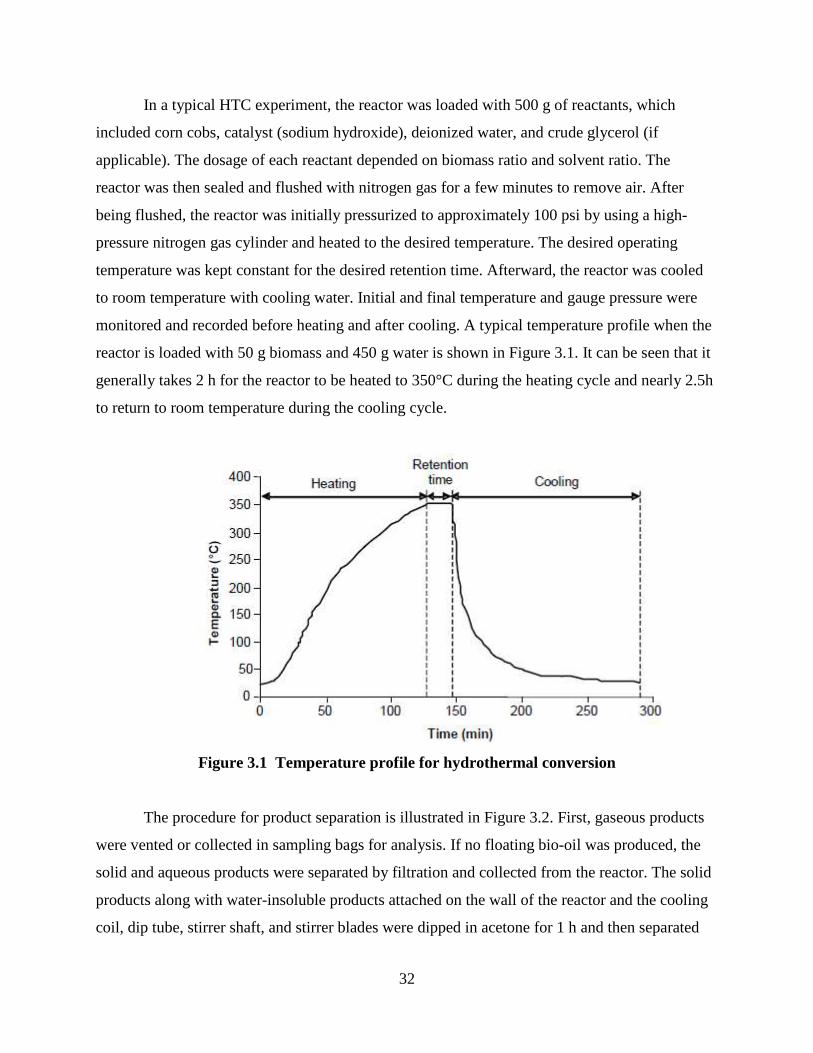
32
In a typical HTC experiment, the reactor was loaded with 500 g of reactants, which
included corn cobs, catalyst (sodium hydroxide), deionized water, and crude glycerol (if
applicable). The dosage of each reactant depended on biomass ratio and solvent ratio. The
reactor was then sealed and flushed with nitrogen gas for a few minutes to remove air. After
being flushed, the reactor was initially pressurized to approximately 100 psi by using a high-
pressure nitrogen gas cylinder and heated to the desired temperature. The desired operating
temperature was kept constant for the desired retention time. Afterward, the reactor was cooled
to room temperature with cooling water. Initial and final temperature and gauge pressure were
monitored and recorded before heating and after cooling. A typical temperature profile when the
reactor is loaded with 50 g biomass and 450 g water is shown in Figure 3.1. It can be seen that it
generally takes 2 h for the reactor to be heated to 350°C during the heating cycle and nearly 2.5h
to return to room temperature during the cooling cycle.
Figure 3.1 Temperature profile for hydrothermal conversion
The procedure for product separation is illustrated in Figure 3.2. First, gaseous products
were vented or collected in sampling bags for analysis. If no floating bio-oil was produced, the
solid and aqueous products were separated by filtration and collected from the reactor. The solid
products along with water-insoluble products attached on the wall of the reactor and the cooling
coil, dip tube, stirrer shaft, and stirrer blades were dipped in acetone for 1 h and then separated

33
by vacuum filtration with Whatman No. 1 filter papers (25 µm nominal pore size). The solvent-
soluble portion was then evaporated in a rotary evaporator at 60°C to remove solvent (Xiu et al.,
2010). The remaining product was solvent-soluble heavy oil. The solvent-insoluble portion was
oven dried to obtain residual solid, called bio-char. If floating heavy bio-oil was generated, the
oil was decanted before separation of residual solids and liquid products. The following
separation process was the same as that without floating bio-oil. The aqueous products were not
considered as bio-oil and were not separated or characterized in this study. All experiments were
performed in duplicate, and data were expressed as average values.
Figure 3.2 Procedure for hydrothermal conversion product separation
Definitions of bio-oil and yield measurement methods differ among laboratories.
Sometimes liquefaction rate is used; in other cases, water-soluble light oil, water-insoluble heavy
oil, free-floating oil, or their combinations are taken into account. In this article, the term “bio-
34
oil” refers to water-insoluble heavy oil and floating oil when applicable. Yields of products were
defined as follows:
Gas+Aqueous product yield (% ) =
W eight of (feedstock-char-biooil) 100%
W eight of (corn cobs+crude glycerol)×
(3-1)
Bio-oil yield (% )=
W eight of b io-oil 100%
W eight of (corn cobs+crude glycerol)×
(3-2)
Char yield (% )=
W eight of char 100%
W eight of( corn cobs+crude glycerol)×
(3-3)
3.2.4 Product analysis
Gas in the reactor was collected from the outlet of the sampling valve with a 500-ml
Tedlar sampling bag (CEL Scientific Corporation, Santa Fe Springs, CA). Molar concentrations
of H2, CO2, CO, and CH4 were analyzed using an SRI 8610s gas chromatograph equipped with a
thermal conductivity detector and a HAYESEP T 90/80 column (SRI Instruments, Torrance,
CA). Helium was used as the carrier gas. Temperature programmed step-heating was performed
as follows: 30°C for 2 min, then 10°C/min to 120°C, and 120°C for 2min. The elements of bio-
oil (CHNOS) were determined by Columbia Analytical Services (Kelso, WA) via standard
Ultimate analysis.
Four char samples were collected from independent HTC experiments conducted at
selected conditions and analyzed for chemical components. Total P, K, Ca, Mg, S, Fe, Mn, Zn,
and Cu were determined in char through HNO3 – H2O2 digestion according to EPA method SW-
848 3050B (USEPA, 1996). Each char was analyzed five times with 95% confidence intervals
of < 10% for the duplicate analysis of all elements (< 5% for most). The digest solution was
analyzed with inductively coupled plasma optical emission spectroscopy. Total C and N in the
char were determined through combustion with an EA 1110 CN elemental analyzer (CE
Instruments, Rodano, Italy). Three samples of aqueous products and feedstock were similarly
analyzed for total elemental analysis.

35
3.3 Results and Discussion
3.3.1 Effect of operating temperature
Operating temperature is one of the most important factors in HTC. In this experiment,
HTC of corn cobs without crude glycerol was conducted for 40 min with 20% corn cobs (total
reactants weight basis; biomass + water + catalyst) and 2% sodium hydroxide (biomass dry
weight basis). When operating temperature increased from 280°C to 350°C, the corresponding
pressure in the reactor increased from 1210 to 2720 psi. Yields of products are presented in
Figure 3.3. Bio-oil yield initially slowly increased with increasing reaction temperature and then
slightly decreased when reaction temperature increased further. Other researchers have also
observed similar phenomenon when woody biomass (Ogi et al., 1994; Qu et al., 2003; Zhong
and Wei, 2004; Qian et al., 2007; Liu and Zhang, 2008; Xu and Lad, 2008), rice straw (Yuan et
al., 2007), cellulose (Minowa et al., 1998), algae (Zhou et al., 2010; Brown et al., 2010; Jena et
al., 2011), secondary pulp/paper sludge (Xu and Lancaster, 2008), swine manure (He et al.,
2001) and cattle manure (Yin et al., 2010) were used as feedstock. This result should be
interpreted as a competition between depolymerization and repolymerization or condensation
during HTC. As temperature increases, depolymerization of the polymers into a liquid oil-rich
phase would become possible. But as temperature further increased, the bio-oil yield began to
decrease duo to the formation of char by repolymerization/ condensation of bio-oil (Xu and
Lancaster, 2008) and gas production from bio-oil steam reforming (Aktaş et al., 2009; Xu and
Lancaster, 2008; Jena et al., 2011; Zhou et al., 2010).
As temperature increased from 280°C to 320°C, gas and aqueous products yield
increased from 57.4% to 62.3%, but char yield decreased from 16.6% to 10.2%. However, when
reaction temperature further increased from 320°C to 350°C, yield of gas and aqueous products
decreased to 62.1% but char yield increased to 20.8%. These results indicate that the
intermediates were repolymerized into char at higher temperatures. Similar phenomenon was
also observed by other researches (Xu and Lancaster, 2008; Zhong and Wei, 2004). In this study,
the maximum bio-oil yield of 28.1% was obtained at a reaction temperature of 305°C.
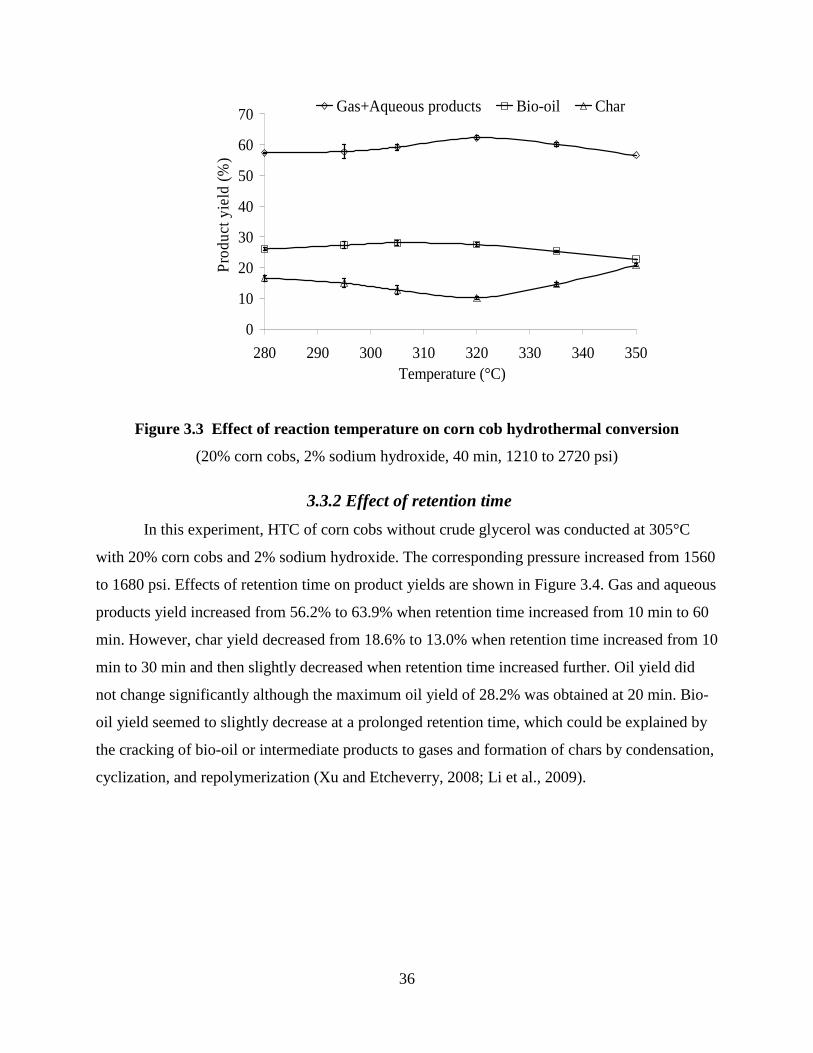
36
0
10
20
30
40
50
60
70
280 290 300 310 320 330 340 350Temperature (°C)
Pro
duct
yie
ld (
%)
Gas+Aqueous products Bio-oil Char
Figure 3.3 Effect of reaction temperature on corn cob hydrothermal conversion
(20% corn cobs, 2% sodium hydroxide, 40 min, 1210 to 2720 psi)
3.3.2 Effect of retention time
In this experiment, HTC of corn cobs without crude glycerol was conducted at 305°C
with 20% corn cobs and 2% sodium hydroxide. The corresponding pressure increased from 1560
to 1680 psi. Effects of retention time on product yields are shown in Figure 3.4. Gas and aqueous
products yield increased from 56.2% to 63.9% when retention time increased from 10 min to 60
min. However, char yield decreased from 18.6% to 13.0% when retention time increased from 10
min to 30 min and then slightly decreased when retention time increased further. Oil yield did
not change significantly although the maximum oil yield of 28.2% was obtained at 20 min. Bio-
oil yield seemed to slightly decrease at a prolonged retention time, which could be explained by
the cracking of bio-oil or intermediate products to gases and formation of chars by condensation,
cyclization, and repolymerization (Xu and Etcheverry, 2008; Li et al., 2009).

37
0
10
20
30
40
50
60
70
10 20 30 40 50 60
Retention time (min)
Pro
duct
yie
ld (
%)
Gas+Aqueous products Bio-oil Char
Figure 3.4 Effect of retention time on corn cob hydrothermal conversion
(20% corn cobs, 2% sodium hydroxide, 305°C, 1560 to 1680 psi)
3.3.3 Effect of biomass content
In this experiment, the reactor was loaded with 500 g of reactants, which included corn
cobs, catalyst (sodium hydroxide), and deionized water. Biomass content (5% to 20%) was
determined based on total reactants weight, and 2% catalyst loading on the biomass dry weight
basis was used. When biomass content increased, water content decreased. The reaction
conditions were set at 305°C for 20 min retention time. The effect of biomass content on product
yields is shown in Figure 3.5. When biomass content increased from 5% to 10%, gas and
aqueous products yield decreased from 70.7% to 59.1% and bio-oil yield increased from 26.2%
to 31.8%. As biomass content further increased, gas and aqueous products yield and bio-oil yield
changed only slightly. Char yield steadily increased from 3.2% to 15.1% when biomass content
increased from 5% to 20%. It is speculated that higher water content improves gas and aqueous
products formation and biomass depolymerization, and vice versa. Previous researchers reported
that liquefaction yield decreased as biomass content increased because of the decreasing water
content (Aida et al., 2002; Park and Gloyna, 1997; Mausumura et al., 1999; Yu et al., 2007). In
this study, the highest bio-oil yield of 31.8% was obtained at 10% biomass content.
However, different conclusions were obtained by other research. When woody biomass
HTC occurred at neutral condition, similar phenomenon was observed in the temperature range
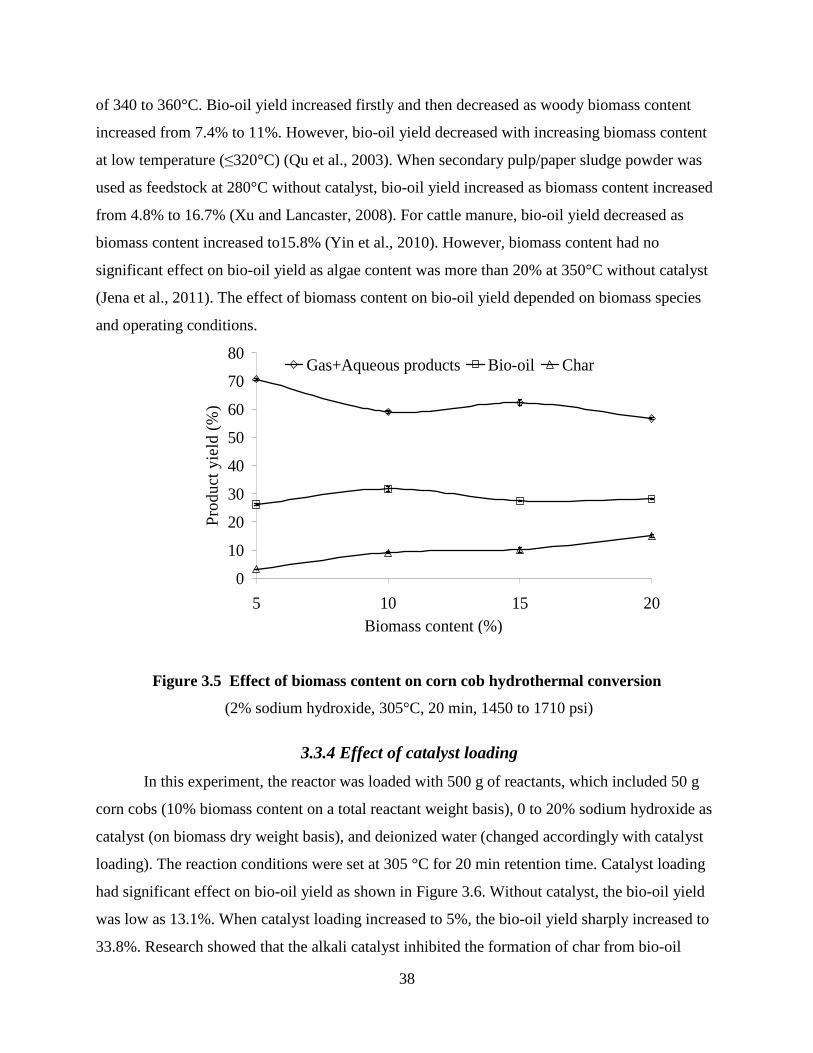
38
of 340 to 360°C. Bio-oil yield increased firstly and then decreased as woody biomass content
increased from 7.4% to 11%. However, bio-oil yield decreased with increasing biomass content
at low temperature (≤320°C) (Qu et al., 2003). When secondary pulp/paper sludge powder was
used as feedstock at 280°C without catalyst, bio-oil yield increased as biomass content increased
from 4.8% to 16.7% (Xu and Lancaster, 2008). For cattle manure, bio-oil yield decreased as
biomass content increased to15.8% (Yin et al., 2010). However, biomass content had no
significant effect on bio-oil yield as algae content was more than 20% at 350°C without catalyst
(Jena et al., 2011). The effect of biomass content on bio-oil yield depended on biomass species
and operating conditions.
0
10
20
30
40
50
60
70
80
5 10 15 20Biomass content (%)
Pro
duct
yie
ld (
%)
Gas+Aqueous products Bio-oil Char
Figure 3.5 Effect of biomass content on corn cob hydrothermal conversion
(2% sodium hydroxide, 305°C, 20 min, 1450 to 1710 psi)
3.3.4 Effect of catalyst loading
In this experiment, the reactor was loaded with 500 g of reactants, which included 50 g
corn cobs (10% biomass content on a total reactant weight basis), 0 to 20% sodium hydroxide as
catalyst (on biomass dry weight basis), and deionized water (changed accordingly with catalyst
loading). The reaction conditions were set at 305 °C for 20 min retention time. Catalyst loading
had significant effect on bio-oil yield as shown in Figure 3.6. Without catalyst, the bio-oil yield
was low as 13.1%. When catalyst loading increased to 5%, the bio-oil yield sharply increased to
33.8%. Research showed that the alkali catalyst inhibited the formation of char from bio-oil

39
(Karagöz et al., 2006; Minowa et al., 1998). Thus, bio-oil yield increased as catalyst loading
increased to 5%. However, the bio-oil yield decreased when catalyst loading further increased,
which might due to the enhanced cracking and dehydration of the bio-oil to gases and water
soluble products with excessive alkali catalyst. In this study, the highest bio-oil yield of 33.8%
was obtained with 5% catalyst loading on a biomass dry weight basis or 0.5% on a total reactants
weight basis. Similar results were reported in previous studies on the woody biomass HTC with
alkali catalyst (Ogi et al., 1985; Karagöz et al., 2006; Bhaskar et al., 2008), as well as sewage
sludge (Yokoyama et al., 1987; Suzuki et al., 1988), and barley stillage (Dote et al., 1991).
However, Alkali catalyst had little catalytic effect on bio-oil production from alage HTC,
because alage contained a considerable amount of sodium (Dote et al., 1994; Minowa et al.,
1995; Zhou et al., 2010).
0
10
20
30
40
50
60
70
80
0 5 10 15 20Catalyst loading (%)
Pro
duct
yie
ld (
%)
Gas+Aqueous products Bio-oil Char
Figure 3.6 Effect of catalyst loading on corn cob hydrothermal conversion
(305°C, 10% biomass content, 20 min, 1470 to 1510 psi)
3.3.5 Products under selected conditions
Products of corn cob hydrothermal conversion obtained at 305°C reaction temperature for
20 min retention time with 10% biomass content (on a total reactant weight basis) and 2%
catalyst loading (on biomass dry weight basis) were analyzed in this section. At these conditions,
gas and aqueous products, bio-oil, and char yields were 63.3%%, 33.8%, and 2.9%, respectively.
The main elements in bio-oil obtained at the selected conditions were C, H, and O
(77.5%, 8.44%, and 13.76% weight percentage, respectively). Elliott and Schiefelbein (1989)

40
found 72.6% C, 8.0% H, and 16.3% O in high-pressure liquefaction bio-oil. The bio-oil in our
study contained slightly higher C but lower O, perhaps because we used different feedstock and
operating conditions.
Applying the char or aqueous product to soils from which the feedstock was removed can
potentially return nutrients and C, thus avoiding soil degradation from biomass removal and
potentially increasing C sequestration. The concentration of all elements except K was greater in
the char than in the feedstock (Table 3.1). Potassium was contained primarily in the aqueous
products along with small amounts of other nutrients. Other studies have also shown that the
majority of nutrients from the feedstock are concentrated in char (Mullen et al., 2010). Char C
content in the present study was relatively high compared with that observed in other studies,
which has ranged from 390 to 820 g C kg-1 char depending on feedstock and combustion
processes (Mullen et al., 2010; Gaskin et al., 2008). Because of its high C content, char from
HTC may be beneficial for C sequestration if land applied (Laird, 2008), but this would be
dependant on long-term stability of the char-based C. Because nutrients are concentrated in the
char, it may be a beneficial nutrient source depending on availability of the nutrients once char is
placed in soil.
Table 3.1 Chemical content of feedstock (corn cobs) compared with that of char and
aqueous products resulting from HTC at 305°C, 20 min retention time, 10% biomass
content, and 2% catalyst loading
C[a] N[a] P K Ca Mg S Fe Mn Zn Cu feedstock 442 5.8 332 6,848 135 253 179 19 4.5 13.1 1.6
char 811 6.9 937 899 1,191 486 575 164 55.1 161 24.3 aqueous 19 0.6 33 2,081 31 43 30 85 0.9 3.9 0.0
[a] C and N are in units of g kg-1; all other chemicals are in units of mg kg-1.
Gas obtained at the selected conditions contained carbon dioxide, carbon monoxide,
hydrogen, and methane. Carbon dioxide was the dominant gas (80.9% mole percentage),
followed by hydrogen (11.1%) and carbon monoxide (7.7%). Methane was the least prevalent
gas (0.47%).
3.3.6 Effect of crude glycerol
Glycerol is a trihydric alcohol that boils with decomposition at 290°C under normal
pressure and is miscible with water and ethanol (Perry and Green, 1997). Experiments in this
portion of the study were all conducted at 305°C reaction temperature, 20 min retention time,

41
10% biomass content (on a total reactants weight basis), and 2% NaOH (biomass dry weight
basis). Less catalyst was used duo to the alkali crude glycerol. Water was substituted with an
equivalent amount of crude glycerol. The ratio of glycerol to corn cobs increased from 0 to 5.
3.3.6.1 Effect of crude glycerol on product yields
When crude glycerol was used as feedstock without corn cobs, only aqueous and gaseous
products were produced. Kishida et al. (2005) and Shen et al. (2009) studied HTC of glycerol
with an alkaline catalyst. They found that glycerol was easily converted into lactic acid,
pyruvaldehyde, acetic acid, and formic acid by alkaline HTC at 300°C, and a very high lactic
acid yield of 90% was obtained. No heavy oil was produced from glycerol-only HTC because
final products are water soluble short-chain chemicals.
The effect of crude glycerol on product yields and weights is shown in Figure 3.7. The
weight of bio-oil increased as the increasing ratio of crude glycerol/corn cobs, which indicates
that crude glycerol also contributed to bio-oil formation in the HTC process. However, crude
glycerol had no significant effect on bio-oil yield when the ratio of crude glycerol/corn cobs was
below 3. Then, bio-oil yield dramatically increased to 36.3% when the ratio increased to 4 or
above. The reasons for the rapid rise of bio-oil yield at high crude glycerol/corn cobs ratios are
not clear. One possible explanation is that when crude glycerol concentration is high enough
(e.g. at crude glycerol/corn cobs ratios of 4 or above), it might serve as a solvent or delignifier to
damage/destroy the physical structure of the biomass and consequently enhance bio-oil yield.
The water-soluble intermediates of glycerol and corn cobs HTC might also cross-react with each
other. Such interactions might improve bio-oil formation when appropriate amounts of crude
glycerol are used. This hypothesis was tested true on a different biomass, swine manure, in
studies performed by Xiu and colleagues, who found that cross-reactions between swine manure
and crude glycerol significantly affected the HTC process (Xiu et al., 2011) and use of crude
glycerol dramatically increased bio-oil yield (Xiu et al., 2010). Although corn cobs are different
from swine manure, a similar effect of crude glycerol on the HTC process may exist and needs to
be further investigated.
No solid residue or char was found when crude glycerol was used, which implies that
crude glycerol improved the conversion of corn cobs. Demirbas (1985) also found that the
liquefaction yield of wood was 100% at temperatures greater than 600 K when glycerol was
used. Glycerol used as an organic solvent improved biomass liquefaction via dilignification
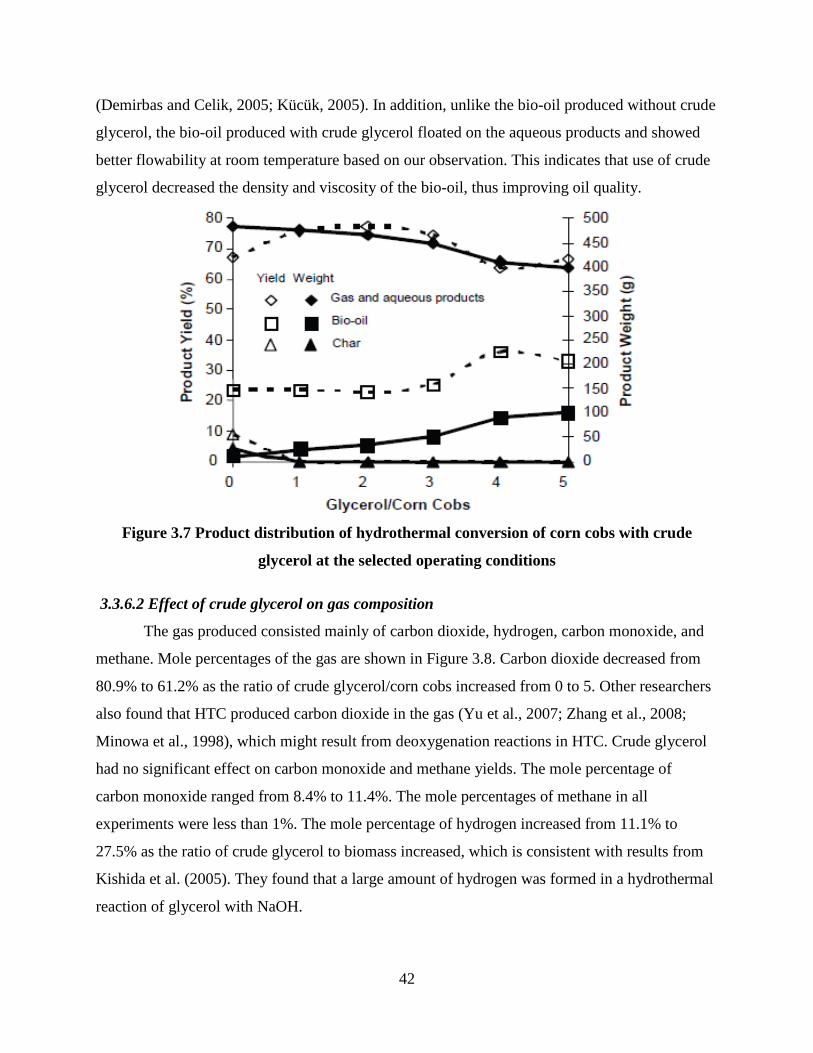
42
(Demirbas and Celik, 2005; Kücük, 2005). In addition, unlike the bio-oil produced without crude
glycerol, the bio-oil produced with crude glycerol floated on the aqueous products and showed
better flowability at room temperature based on our observation. This indicates that use of crude
glycerol decreased the density and viscosity of the bio-oil, thus improving oil quality.
Figure 3.7 Product distribution of hydrothermal conversion of corn cobs with crude
glycerol at the selected operating conditions
3.3.6.2 Effect of crude glycerol on gas composition
The gas produced consisted mainly of carbon dioxide, hydrogen, carbon monoxide, and
methane. Mole percentages of the gas are shown in Figure 3.8. Carbon dioxide decreased from
80.9% to 61.2% as the ratio of crude glycerol/corn cobs increased from 0 to 5. Other researchers
also found that HTC produced carbon dioxide in the gas (Yu et al., 2007; Zhang et al., 2008;
Minowa et al., 1998), which might result from deoxygenation reactions in HTC. Crude glycerol
had no significant effect on carbon monoxide and methane yields. The mole percentage of
carbon monoxide ranged from 8.4% to 11.4%. The mole percentages of methane in all
experiments were less than 1%. The mole percentage of hydrogen increased from 11.1% to
27.5% as the ratio of crude glycerol to biomass increased, which is consistent with results from
Kishida et al. (2005). They found that a large amount of hydrogen was formed in a hydrothermal
reaction of glycerol with NaOH.

43
Figure 3.8 Effect of crude glycerol on mole percentage of gases produced at the selected
operating conditions
3.3.6.3 Effect of crude glycerol on bio-oil elements
Bio-oil produced from corn cobs and crude glycerol HTC contained mainly C, O, and H
(Figure 3.9). As glycerol/corn cobs ratio increased from 0 to 5, the amount of H did not change
significantly. Carbon decreased from 77.5% to 65.8%, whereas O increased from 13.8% to
19.9%, resulting in greater ratios of O/C. It is well known that bio-oil heating value decreases as
oxygen content increase (Kotz and Treichel, 1996; He, 2000; Xiu et al., 2010). Thus, crude
glycerol had a negative effect on bio-oil quality from the standpoint of oxygen content and
heating value.
Figure 3.9 Effect of crude glycerol on bio-oil elements at the selected operating conditions

44
3.4 Conclusions
Without adding crude glycerol, maximum bio-oil yield of 33.8% was obtained at 305°C
reaction temperature, 20 min retention time, 10% biomass content, and 0.5% catalyst loading (on
total reactants weight basis). The effect of crude glycerol on corn cob HTC was investigated at
305°C for 20min with 10% corncobs and 0.2% catalyst loading. Bio-oil yield based on the total
weight of corn cobs and crude glycerol almost remained constant when the ratio of crude
glycerol/corn cobs was below 3 but dramatically increased to 36.3% when the crude glycerol
ratio increased to 4. H2 in the gas product also increased from 11.1% to 27.5% as the crude
glycerol to biomass ratio increased from 0 to 5. In addition, the bio-oil with better flowability
floated on the aqueous products once crude glycerol was added, indicating reduced oil density
and viscosity, and thus better quality. As the crude glycerol to biomass ratio increased from 0 to
5, oxygen content in bio-oil increased from 13.8% to 19.9%, carbon decreased from 77.5% to
65.8%, and hydrogen had no significant change. Thus, crude glycerol had at least two effects on
biomass HTC: It increased bio-oil yield and quality in terms of low viscosity and density, but the
oxygen content of bio-oil slightly increased as more crude glycerol was used.

45
References
Aida, T. M., Sato, T., Sekiguchi, G., Adschiri, T., and Arai, K. (2002). Extraction of Taiheiyo coal with supercritical water-phenol mixtures. Fuel 81(11-12), 1453-1461.
Aktaş, S., Karakaya, M., and Avci, A. K. (2009).Thermodynamic analysis of steam assisted conversions of bio-oil components to synthesis gas. Int. J. Hydrogen Energy 34, 1752-1759.
Bhaskar, T., Sera, A., Muto, A., and Sakata, Y. (2008). Hydrothermal upgrading of wood biomass: Influence of the addition of K2CO3 and cellulose/lignin ratio. Fuel 87, 2236–2242.
Chiellini, E., Cinelli, P., Ilieva, V. I., Imam, S. H., and Lawton, J. W. (2009). Environmentally compatible foamed articles based on potato starch, corn fiber, and poly (vinyl alcohol). Journal of Cellular Plastics 45(1), 17–32.
Coronado, M., Yuan, W., Wang, D., and Dowell, F. E. (2008). Predicting the concentration and specific gravity of biodiesel-diesel blends using near-infrared spectroscopy. Applied Eng. In Agric. 25(2), 217-221.
Czernik, S., and Bridgwater, A. V. (2004). Overview of applications of biomass fast pyrolysis oil. Energy and Fuels 18(2), 590-598.
Demirbas, A. (1985). A new method on wood liquefaction. Chim. Acta. Turcica. 13: 363–368.
Demirbas, A. (1992). Conversion of wood to liquid products using alkaline glycerol. Fuel Science Technology Int. 10(2), 173-184.
Demirbas, A. (2000a). Effect of lignin content on aqueous liquefaction products of biomass. Energy Conversion and Management 41(15), 1601-1607.
Demirbas, A. (2000b). Conversion of biomass using glycerin to liquid fuel for blending gasoline as alternative engine fuel. Energy Conversion and Management 41(16), 1741-1748.
Demirbas, A. (2008). Liquefaction of biomass using glycerol. Energy Sources, Part A 30(12), 1120-1126.
Demirbas, A., and Celik, A. (2005). Degradation of poplar and spruce wood chips using alkaline glycerol. Energy Sources, Part A 27(11), 1073-1084.
Dote, Y., Yokoyama, S., Ogi, T., Minowa, T., and Murakami, M. (1991). Liquefaction of barley stillage and upgrading of primary oil. Biomass Bioenergy 1, 55-60.
Dote, Y., Sawayama, S., Inoue, S., Minowa, T., and Yokoyama, S. (1994). Recovery of liquid fuel from hydrocarbon-rich microalgae by thermochemical liquefaction. Fuel 1855-1857.
Elliott, D. C., and Schiefelbein, G. F. (1989). Liquid hydrocarbon fuels from biomass. Preprints of Papers-American Chemical Society, Division of Fuel Chemistry 34(4), 1160-1166.

46
FAO. (2008). FAOSTAT statistics database. Available at: faostat.fao.org/site/567/DesktopDefault.aspx?PageID=567.
Gaskin, J. W., Steiner, C., Harris, K., Das, K. C., and Bibens, B. (2008). Effect of low-temperature pyrolysis conditions on biochar for agricultural use. Transactions of the ASABE 51(6), 2061-2069.
He, B. J. (2000). Thermochemical conversions of swine manure to produce liquid fuel and reduce waste. Doctoral dissertation. Urbana, Illinois: University of Illinois at Urbana–Champaign, Department of Agricultural Engineering.
Heitz, M., Brown, A., and Chornet, E. (1994). Solvent effects on liquefaction: Solubilization profiles of a Canadian prototype wood, Populus deltoids, in the presence of different solvents. The Canadian Journal of Chemical Engineering 72(6), 1021-1027.
Huber, G. W., Iborra, S., and Corma, A. (2006). Synthesis of Transportation Fuels from Biomass: Chemistry, Catalysts, and Engineering. Chem. Rev. 106, 4044-4098.
Jena, U., Das, K. C, and Kastner, J. R. (2011)Effect of operating conditions of thermochemical liquefaction on biocrude production from Spriulina platensis. Bioresour. Technol. 102, 6221-6229.
Karagöz, S., Bhaskar, T., Muto, A., and Sakata, Y. (2006). Hydrothermal upgrading of biomass: Effect of K2CO3 concentration and biomass/water ratio on products distribution. Bioresour. Technol. 97, 90-98.
Kishida, H., Jin, F., Zhou, Z., Moriya, T., and Enomoto, H. (2005). Conversion of glycerin into lactic acid by alkaline hydrothermal reaction. Chemistry Letters 34(11), 1560-1561.
Kotz, J. C., and Treichel Jr., P. (1996). Chemistry and Chemical Reactivity, 3rd ed., New York, N.Y.: Saunders College Pub. 288–293
Kücük, M. M. (2005). Delignification of biomass using alkaline glycerol. Energy Sources, Part A 27(13), 1245-1255.
Laird, D. A. (2008). The charcoal vision: A win-win-win scenario for simultaneously producing bioenergy, permanently sequestering carbon, while improving soil and water quality. Agronomy Journal 100(1), 178-181.
Li, H., Yuan, X., Zeng, G., Tong, J., Yan, Y., Cao, H., Wang, L., Cheng, M., Zhang, J., and Yang, D. (2009). Liquefaction of rice straw in sub- and supercritical 1, 4-dioxane-water mixture. Fuel Processing Technology 90(5), 657-663.
Liu, Z., and Zhang, F. S. (2008). Effect of various solvents on the liquefaction of biomass to produce fuels and chemical feedstocks. Energy Conversion and Management 49(12), 3498-3504.
47
Matsumura, Y., Nonaka, H., Yokura, H., Tsutsumi, A., and Yoshida, K. (1999). Co-liquefaction of coal and cellulose in supercritical water. Fuel 78(9), 1049-1056.
Minowa, T., Yokoyama, S., Kishimoto, M., and Okakurat, T. (1995). Oil production from algal cells of Dunaliella tertiolecta by direct thermochemical liquefaction. Fuel 12, 1735-1738.
Minowa, T., Zhen, F., and Ogi, T. (1998). Cellulose decomposition in hot-compressed water with alkali or nickel catalyst. The Journal of Supercritical Fluids 13(1-3), 253-259.
Mullen, C. A., Boateng, A. A., Goldberg, N. M., Lima, I. M., Laird, D. A., and Hicks, K. B. (2010). Bio-oil and bio-char production from corn cobs and stover by fast pyrolysis. Biomass and Bioenergy 34(1), 67-74.
Ogi, T., Yokoyama, S., and Koguchi, K. (1985). Direct liquefaction of wood by alkali and alkaline earth salt in an aqueous phase. Chemistry letters 1199-1202.
Ogi, T., and Yokoyama, S. Y. (1993). Liquid fuel production from woody biomass by direct liquefaction. Sekiyu Gakkaishi 36, 73-84.
Ogi, T., Minowa, T., Dote, Y., and Yokoyama, S. Y. (1994). Characterization of oil produced by the direct liquefaction of Japanese oak in an aqueous 2-propanol solvent system. Biomass and Bioenergy 7(1-6), 193-199.
Park, S., and Gloyna, E. F. (1997). Statistical study of the liquefaction of used rubber tyre in supercritical water. Fuel 76(11), 999-1003.
Perry, R. H., and Green, D. W. (1997). Perry’s Chemical Engineers’ Handbook. 7th ed. New York: McGraw-Hill.
Peterson, A. A., Vogel, F., Lachance, R. P., Fröling, M., Antal Jr., M. J., and Tester, J. W. (2008). Thermochemical biofuel production in hydrothermal media: A review of sub- and supercritical water technologies. Energy and Environmental Science 1, 32-65.
Qian, Y., Zuo, C., Tan, J., and He, J. (2007). Structural analysis of bio-oils from sub-and supercritical water liquefaction of woody biomass. Energy 32, 196-202.
Qu, Y., Wei, X., and Zhong, C. (2003). Experimental study on the direct liquefaction of Cunninghamia lanceolata in Water. Energy 28, 597-606.
Shen, Z., Jin, F., Zhang, Y., Wu, B., Kishita, A., Tohji, K., and Kishida, H. (2009). Effect of alkaline catalysts on hydrothermal conversion of glycerin into lactic acid. Ind. And Eng. Chem. Res. 48(19), 8920-8925.
Sluiter, A., Ruiz, R., Scarlata, C., Sluiter, J., and Templeton, D. (2005). Determination of extractives in biomass. NREL/TP-510-42619. Golden, Colo.: National Renewable Energy Laboratory.
48
Sluiter, A., Hames, B., Ruiz, R., Scarlata, C., Sluiter, J., Templeton, D., and Crocker, D. (2008). Determination of structural carbohydrates and lignin in biomass. NREL/TP-510-42618. Golden, Colo.: National Renewable Energy Laboratory.
Suzuki, A., and Nakamura, T. (1988). Conversion of sewage sludge to heavy oil by direct thermochemical liquefaction. J. Chem. Eng. Jpn. 21, 288-293.
Thompson, J. C., and He, B.B. (2006). Characterization of crude glycerol from biodiesel production from multiple feedstocks. Applied Eng. In Agric. 22(2), 261-265.
USEPA. 3rd ed.(1996). SW-846 Method 8000: Test methods for evaluating solid waste, physical/chemical methods. Washington, DC: USEPA.
Xiu, S., Shabazi, A., Shirley, V., Mims, M. R., and Wallace, C. W. (2010). Effectiveness and mechanisms of crude glycerol on the biofuels production from swine manure through hydrothermal pyrolysis. Journal of Analytical and Applied Pyrolysis 87(2), 194-198.
Xiu, S., Shahbazi, A., Shirley, V. B., and Wang, L. (2011). Swine manure/crude glycerol co-liquefaction: Physical properties and chemical analysis of bio-oil product. Bioresour. Technol. 102(2), 1928-1932.
Xu, C., and Lancaster, J. (2008). Conversion of secondary pulp/paper sludge powder to liquid oil products for energy recovery by direct liquefaction in hot-compressed water. Water Research 42(6-7), 1571-1582.
Xu, C., and Lad, N. (2008). Production of heavy oils with high caloric values by direct liquefaction of woody biomass in sub/near-critical water. Energy and Fuels 22, 635-642.
Xu, C., and Etcheverry, T. (2008). Hydro-liquefaction of woody biomass in sub- and super-critical ethanol with iron-based catalysts. Fuel 87(3), 335-345.
Yin, S., Dolan, R., Harris, M., Tan, Z. (2010). Subcritical hydrothermal liquefaction of cattle manure to bio-oil: Effect of conversion parameters on bio-oil yield and characterization of bio-oil. Bioresour. Technol. 101, 3657-3664.
Yokoyama, S., Suzuki, A., Murakamit, M., Ogi, T., Koguchi, K., and Nakamura, E. (1987). Liquid fuel production from sewage sludge by catalytic conversion using sodium carbonate. Fuel 66, 1150-1155.
Yu, F., Ruan, R., Chen, P., Deng S., Liu, Y., and Lin, X. (2007). Liquefaction of corn cobs with supercritical water treatment. Transactions of the ASABE 50(1), 175-180.
Yuan, X. Z., Li, H., Zeng, G. M., Tong, J. Y., and Xie, W. (2007). Sub- and supercritical liquefaction of rice straw in the presence of ethanol-water and 2-propanol-water mixture. Energy 32(11), 2081-2088.
49
Yuan, X. Z., Tong, J. Y., Zeng, G. M., Li, H., and Xie, W. (2009). Comparative studies of products obtained at different temperatures during straw liquefaction by hot compressed water. Energy and Fuels 23, 3262-3267.
Zhang, B., Keitz, M. V., and Kenneth, V. (2008). Maximizing the liquid fuel yield in a biorefining process. Biotechnology and Bioengineering 101(5), 903-912.
Zhang, Q., Chang, J., Wang, T., and Xu, Y. (2007). Review of biomass pyrolysis oil properties and upgrading research. Energy Conversion and Management 48(1), 87-92.
Zhong, C., and Wei, X. (2004). A comparative experimental study on the liquefaction of wood. Energy 29(11), 1731-1741.
Zhou, D., Zhang, L., Zhang, S., Fu, H., and Chen, J. (2010). Hydrothermal liquefaction of macroalgae Enteromorpha prolifera to bio-oil. Energy Fuels 24, 4050-4061.
50
Chapter 4 - Operating Conditions Optimization for Bio-oil
Production from Corn Cobs Hydrothermal Conversion
Abstract
The effects of reaction temperature, retention time, biomass content, and catalyst loading
on bio-oil yield, carbon content, and carbon recovery of corn cobs hydrothermal conversion were
investigated and optimized via response surface methodology. Higher bio-oil yield and carbon
recovery could be obtained at low temperature for short retention time with high biomass content
and moderate alkaline catalyst loading. A maximum bio-oil yield of 41.3% was obtained at
280°C, 12min, 21% biomass content, and 1.56% catalyst loading. A maximum carbon recovery
of 25.2% was observed at 280°C, 12min, 21% biomass content, and 1.03% catalyst loading. Bio-
oil carbon content was only affected by temperature and biomass content. A highest bio-oil
carbon content of 74.8% was produced at 340°C with 9% biomass content. The predicted bio-oil
yield, carbon content and carbon recovery were confirmed well by the validation experiments. 2-
Ethylhexyl mercaptoacetate and 1-Hexanol, 2-ethyl- were the dominant compounds of bio-oil.

51
4.1 Introduction
Biofuels have attracted more and more attention in the past decades due to the depletion
of crude oil and carbon dioxide emission from fossil fuel combustion. However, the
sustainability of the first generation biofuels (sugarcane ethanol, starch-based or ‘corn’ ethanol,
biodiesel and pure plant oil) has faced heavy criticism because they might endanger food
production (IEA, 2010). Therefore, the second generation biofuels produced from lignocellulosic
biomass is a good option, which also called lignocellulosic biofuels. They do not compete with
food production, and have abundant feedstock. In the US, about 1.3 billion dry tons of
lignocellulosic biomass can be sustainably produced annually (Perlack et al., 2005).
Hydrothermal conversion (HTC) is a promising method to convert lignocellulosic
biomass to the second generation biofuels or valuable chemicals, in which biomass is
depolymerized to gaseous, aqueous, bio-oil (or biocrude), and solid products in a heated,
pressurized, and oxygen-free reactor at the presence of water or other solvents. Compared with
other thermochemical conversion technologies, like gasification and fast pyrolysis, HTC is
conducted at lower temperature, and does require feedstock drying owe to the use of water or
solvents. Important chemicals, like furans, phenol, acetic acid, and levulinic acid can be
separated from HTC aqueous products (Luo et al., 2010; Shen et al., 2011; Wang et al., 2012).
HTC bio-oil can be used as a fuel for stationary diesel engines, burners, boilers, or turbines
(Czernik and Bridgwater, 2004), or further upgraded to liquids similar to diesel and jet fuel via
hydrodeoxygenation (Demirbas, 2011). It also can serve as a starting material for valuable
chemical products such as polymers, aromatics, lubricants, and asphalt (Peterson et al., 2008).
Furthermore, HTC oils typically have much lower oxygen and moisture contents, higher
hydrogen content, and consequently much higher heating value than pyrolysis oils (Huber and
Dumesic, 2006).
Dedicated energy crops and residues are the main categories of feedstocks for
lignocellulosic biofuels production (IEA, 2010). Conversion of agricultural residues to biofuels
offers major energy security, environmental, and strategic benefits because they are compatible
with food production. In addition, production of second-generation biofuels based on agricultural
residues would add value to the agricultural by-products, and then could be beneficial to farmers.
Currently, around 5.1 billion dry tons of agricultural residues are produced globally (IEA, 2010).
Corn cobs are usually a good source for second generation biofuels production because corn is

52
one of the most widely planted crops in the world. Corn cobs are an important by-product of corn
production. Every 100 kg of corn grain can produce about 18 kg of corn cobs (Chiellini et al.,
2009). Annual worldwide corn production is about 6.95 × 10¹¹ kg, and approximately 50% of
that is produced in the United States, mostly in the central states (FAO, 2008).
The effects of operating conditions including temperature, retention time, biomass
content, and catalyst loading on gaseous, aqueous, and solid products production from corn cobs
HTC have been studied (Yu et al., 2007; Zhang et al., 2008). However, the optical operating
conditions for bio-oil production from corn cobs HTC and the interaction effects between these
factors have not been fully investigated. Response surface methodology (RSM) is an effective
optimization tool to identify the effect of many factors and their interactions on the response
using relatively few experiments. The objectives of this study are to optimize the operating
conditions including temperature, retention time, biomass content, and catalyst loading on bio-oil
production from corn cobs HTC via RSM in terms of bio-oil yield, bio-oil carbon content, and
carbon recovery, and to investigate the interactions between these factors.
4.2 Materials and Methods
4.2.1. Materials
Commercially available corn cobs were obtained from Kaytee Products Inc. (Chilton,
WI) and ground using a Retsch SM2000 rotary cutting mill (Retsch Inc., Newtown, PA) with a
1.0 mm screen. Before experiment, the ground corn cobs were dried at 105 ºC for 24h.
4.2.2 Apparatus and process
A 1.8 L Parr model 4578 high-temperature high-pressure reactor (Parr Instrument
Company, Moline, IL) was used for all experiments. In a typical HTC experiment, the reactor
was loaded with 500 g of reactants, which included corn cobs, catalyst (sodium hydroxide), and
deionized water. The dosage of each reactant depended on biomass content and catalyst loading
(on a total reactant weight basis). The reactor was flushed and initially pressurized to 100 psi by
using a high pressure nitrogen gas cylinder after the reactant load. Then, the reactor was heated
to the desired temperature, and kept for the desired retention time. Afterward, the reactor was
cooled to room temperature with cooling water.

53
After the HTC experiment, gaseous products were vented. The solid and liquid products
were collected from the reactor and separated by filtration. Bio-oil was separated from the solid
products via acetone wash. The solvent soluble portion is then evaporated in a rotary evaporator
at 60 °C to remove acetone, and the remaining product is bio-oil. More details of the
experimental apparatus and procedure can be found in Chapter 3.
4.2.3 Product Analysis
The chemical composition of corn cobs used in this study was determined according to
laboratory analytical procedures developed by the National Renewable Energy Laboratory
(Sluiter et al., 2005; Sluiter et al., 2008). Briefly, after water and ethanol extraction, the sample
was soaked in 72% sulfuric acid at 30 °C for 1 h with constant stirring, followed by dilution to a
4% acid solution and heating for another hour at 120 °C. The aqueous products and solid residue
of the pretreatment process were separated by vacuum filtration. The filtrate was adjusted to
neutral by calcium carbonate, then the sugar contents of the filtrate were measured by high-
performance liquid chromatographic, and acid soluble lignin content in the filtrate was detected
by UV-visible spectrophotometer. The solid residue was dried and combusted. The weight
difference between the dry residue and combustion residue was reported as acid insoluble lignin.
All data are on the biomass dry weight basis. Corn cob contains 35.6% cellulose, 29.9%
hemicellulose, 14.2% lignin, and 12.8% extractive.
The elemental compositions of feedstock and produced bio-oils were analyzed by a
CHNS/O elemental analyzer (Elmer Perkin 2400, CT, USA). Each sample was placed in a tared
tin capsule (PerkinElmer, N2411255) and precisely weighed using a PerkinElmer AD6
Autobalance. The weight of each sample was around 2 mg. samples encapsulated in tin were
then inserted to the combustion zone automatically from the autosampler.
The heating values of feedstock and bio-oil were determined by a calorimeter (IKA,
C200, NC, USA). After weighing out about 1g feedstock or bio-oil directly into a crucible with
an accuracy of 0.1mg, the crucible was inserted into the crucible holder of the decomposition
vessel. The sealed decomposition vessel was filled oxygen for approximate 30s at 30bar by
oxygen station, and then be placed into the inner vessel of calorimeter for fully automatic
measurement.
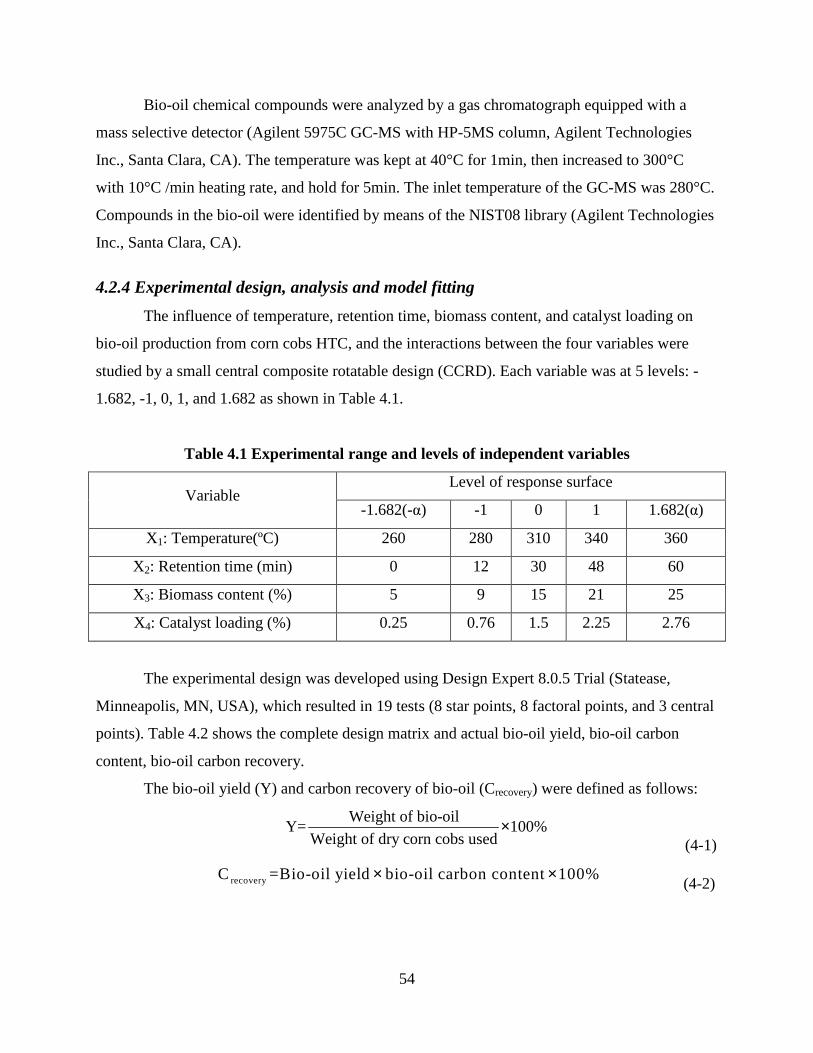
54
Bio-oil chemical compounds were analyzed by a gas chromatograph equipped with a
mass selective detector (Agilent 5975C GC-MS with HP-5MS column, Agilent Technologies
Inc., Santa Clara, CA). The temperature was kept at 40°C for 1min, then increased to 300°C
with 10°C /min heating rate, and hold for 5min. The inlet temperature of the GC-MS was 280°C.
Compounds in the bio-oil were identified by means of the NIST08 library (Agilent Technologies
Inc., Santa Clara, CA).
4.2.4 Experimental design, analysis and model fitting
The influence of temperature, retention time, biomass content, and catalyst loading on
bio-oil production from corn cobs HTC, and the interactions between the four variables were
studied by a small central composite rotatable design (CCRD). Each variable was at 5 levels: -
1.682, -1, 0, 1, and 1.682 as shown in Table 4.1.
Table 4.1 Experimental range and levels of independent variables
Level of response surface Variable
-1.682(-α) -1 0 1 1.682(α)
X1: Temperature(ºC) 260 280 310 340 360
X2: Retention time (min) 0 12 30 48 60
X3: Biomass content (%) 5 9 15 21 25
X4: Catalyst loading (%) 0.25 0.76 1.5 2.25 2.76
The experimental design was developed using Design Expert 8.0.5 Trial (Statease,
Minneapolis, MN, USA), which resulted in 19 tests (8 star points, 8 factoral points, and 3 central
points). Table 4.2 shows the complete design matrix and actual bio-oil yield, bio-oil carbon
content, bio-oil carbon recovery.
The bio-oil yield (Y) and carbon recovery of bio-oil (Crecovery) were defined as follows:
Weight of bio-oilY= 100%
Weight of dry corn cobs used×
(4-1)
recoveryC =Bio-oil yield bio-oil carbon content 100%× × (4-2)
55
The data were then fit to the following second-order polynomial equation to investigate
the effect of independent variables in terms of linear, quadratic and interactions:
4 4 42
01 1 1
i i ii i ij i ji i i i j
Y X a X a X a X X= = = <
= + + +∑ ∑ ∑∑ (4-3)
where Y is bio-oil yield (%), bio-oil carbon content (%) or bio-oil carbon recovery (%); X0
stands for the model intercept; X1, X2, X3, X4 are the levels of temperature, retention time,
biomass content, and catalyst loading, respectively; ai…aij are the regression coefficients. The
Design Expert 8.0.5 software was used to analyze the data. The significance of each model
parameter was determined by an F-test with α=0.05 level.
4.3 Results and discussion
4.3.1. Model equations for bio-oil yield, carbon content and carbon recovery
The results of experimental runs are presented in Table 4.2. At different combinations of
the variables, bio-oil yield varied between 16.1% and 39.2% (dbw), bio-oil carbon content
increased from 58.9% to 75.6% (on a bio-oil weight basis), and bio-oil carbon recovery lay
between 11.3% and 25.2%.
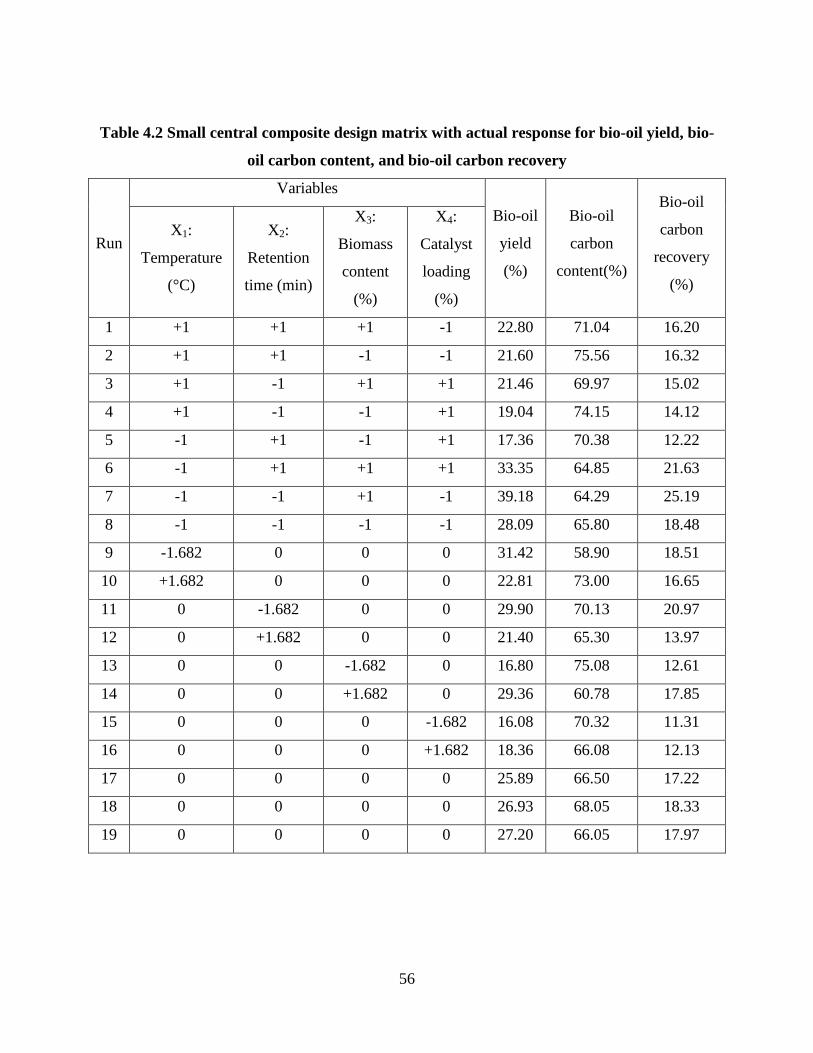
56
Table 4.2 Small central composite design matrix with actual response for bio-oil yield, bio-
oil carbon content, and bio-oil carbon recovery
Variables
Run X1:
Temperature
(°C)
X2:
Retention
time (min)
X3:
Biomass
content
(%)
X4:
Catalyst
loading
(%)
Bio-oil
yield
(%)
Bio-oil
carbon
content(%)
Bio-oil
carbon
recovery
(%)
1 +1 +1 +1 -1 22.80 71.04 16.20
2 +1 +1 -1 -1 21.60 75.56 16.32
3 +1 -1 +1 +1 21.46 69.97 15.02
4 +1 -1 -1 +1 19.04 74.15 14.12
5 -1 +1 -1 +1 17.36 70.38 12.22
6 -1 +1 +1 +1 33.35 64.85 21.63
7 -1 -1 +1 -1 39.18 64.29 25.19
8 -1 -1 -1 -1 28.09 65.80 18.48
9 -1.682 0 0 0 31.42 58.90 18.51
10 +1.682 0 0 0 22.81 73.00 16.65
11 0 -1.682 0 0 29.90 70.13 20.97
12 0 +1.682 0 0 21.40 65.30 13.97
13 0 0 -1.682 0 16.80 75.08 12.61
14 0 0 +1.682 0 29.36 60.78 17.85
15 0 0 0 -1.682 16.08 70.32 11.31
16 0 0 0 +1.682 18.36 66.08 12.13
17 0 0 0 0 25.89 66.50 17.22
18 0 0 0 0 26.93 68.05 18.33
19 0 0 0 0 27.20 66.05 17.97
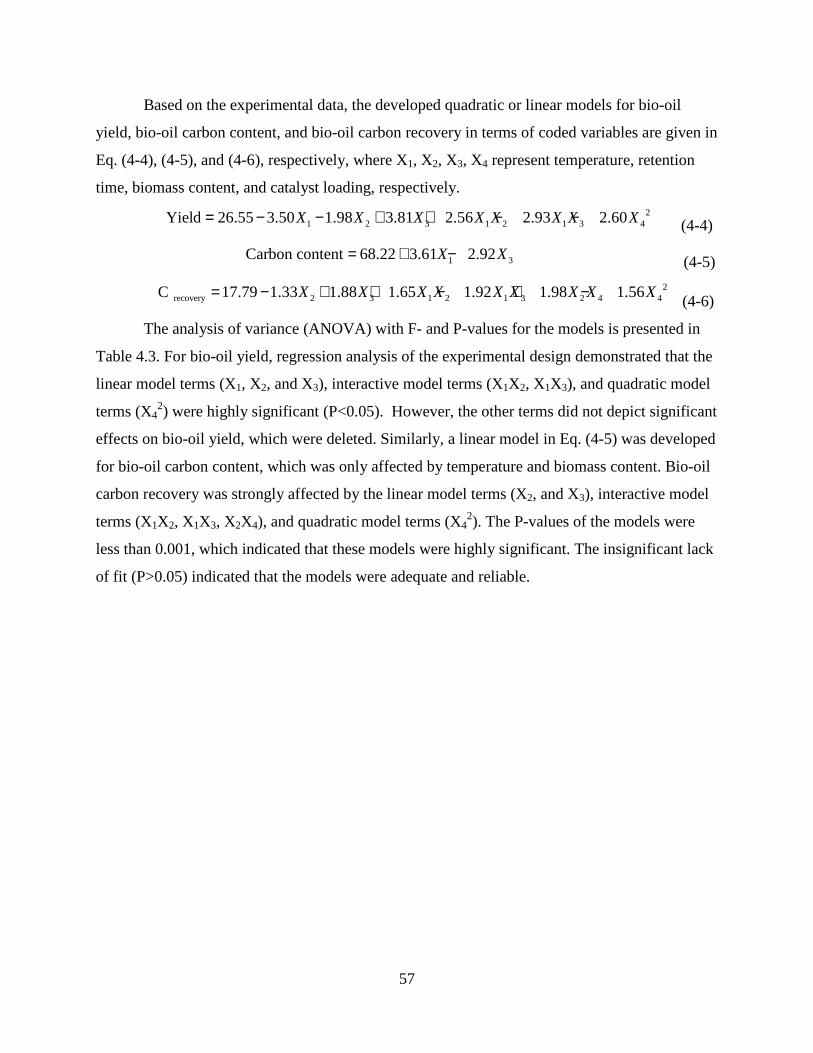
57
Based on the experimental data, the developed quadratic or linear models for bio-oil
yield, bio-oil carbon content, and bio-oil carbon recovery in terms of coded variables are given in
Eq. (4-4), (4-5), and (4-6), respectively, where X1, X2, X3, X4 represent temperature, retention
time, biomass content, and catalyst loading, respectively.
2
1 2 3 1 2 1 3 4Yield 26.55 3.50 1.98 3.81 2.56 2.93 2.60X X X X X X X X= − − + + − − (4-4)
1 3Carbon content 68.22 3.61 2.92X X= + − (4-5)
2
recovery 2 3 1 2 1 3 2 4 4C 17.79 1.33 1.88 1.65 1.92 1.98 1.56X X X X X X X X X= − + + − + − (4-6)
The analysis of variance (ANOVA) with F- and P-values for the models is presented in
Table 4.3. For bio-oil yield, regression analysis of the experimental design demonstrated that the
linear model terms (X1, X2, and X3), interactive model terms (X1X2, X1X3), and quadratic model
terms (X42) were highly significant (P<0.05). However, the other terms did not depict significant
effects on bio-oil yield, which were deleted. Similarly, a linear model in Eq. (4-5) was developed
for bio-oil carbon content, which was only affected by temperature and biomass content. Bio-oil
carbon recovery was strongly affected by the linear model terms (X2, and X3), interactive model
terms (X1X2, X1X3, X2X4), and quadratic model terms (X42). The P-values of the models were
less than 0.001, which indicated that these models were highly significant. The insignificant lack
of fit (P>0.05) indicated that the models were adequate and reliable.
58
Table 4.3 Analysis of variance for the regression models
Bio-oil yield Source Sum of squares DF Mean square F value P value Model 632.52 6 105.42 17.81 < 0.0001
X1 165.95 1 165.95 28.04 0.0002 X2 53.09 1 53.09 8.97 0.0112 X3 196.67 1 196.67 33.23 <0.0001
X1X2 52.33 1 52.33 8.84 0.0116 X1X3 68.80 1 68.80 11.63 0.0052 X4
2 95.68 1 95.68 16.17 0.0017 Residual 71.01 12 5.92 - -
Lack of fit 70.06 10 7.01 14.64 0.066 Pure error 0.96 2 0.48
Corrected total 703.54 18 R2 0.90
Bio-oil carbon content Source Sum of squares DF Mean square F value P value Model 291.93 2 145.96 27.02 <0.0001
X1 176.40 1 176.40 32.65 <0.0001 X3 115.53 1 115.53 21.39 0.0003
Residual 86.43 16 5.40 - - Lack of fit 84.23 14 6.02 5.47 0.1652 Pure error 2.20 2 1.10
Corrected total 378.36 18 R2 0.77
Bio-oil carbon recovery Source Sum of squares DF Mean square F value P value Model 189.96 6 31.66 9.26 0.0006
X2 24.29 1 24.29 7.11 0.0206 X3 48.41 1 48.41 14.16 0.0027
X1X2 21.78 1 21.78 6.37 0.0267 X1X3 29.41 1 29.41 8.61 0.0125 X2X4 31.44 1 31.44 9.20 0.0104 X4
2 34.62 1 34.62 10.13 0.0079 Residual 41.01 12 3.42 - -
Lack of fit 40.37 10 4.04 12.59 0.076 Pure error 0.64 2 0.32
Corrected total 230.97 18 R2 0.82
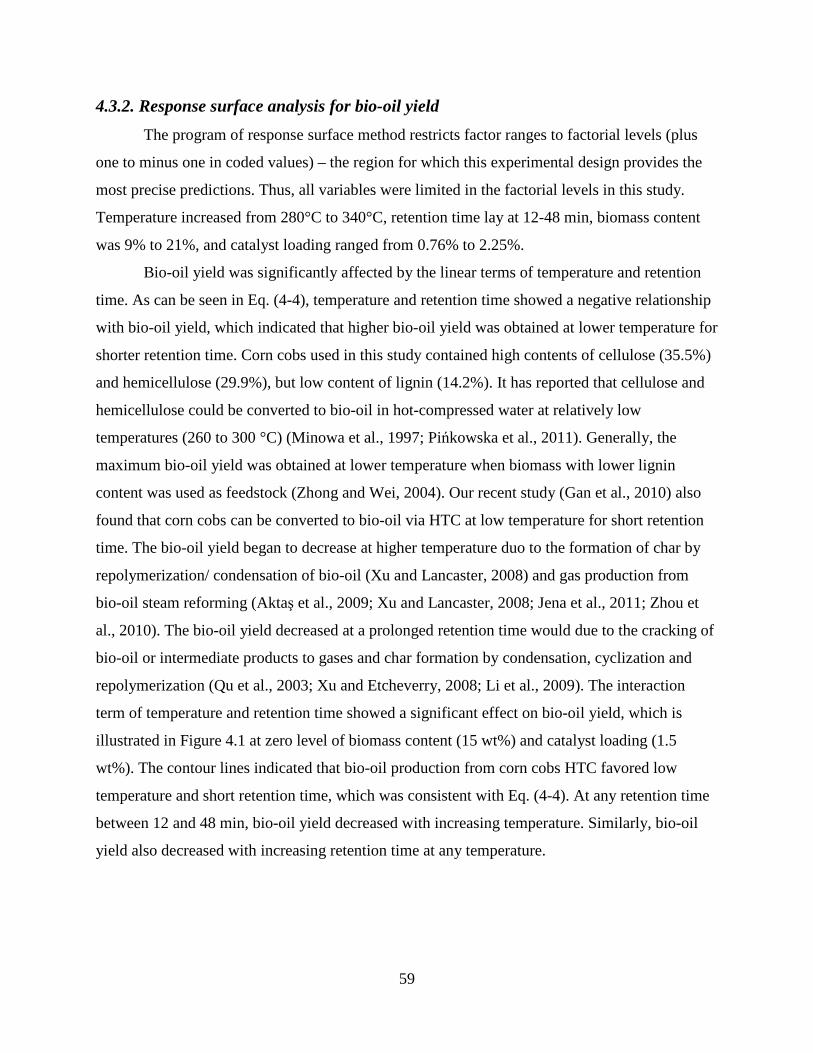
59
4.3.2. Response surface analysis for bio-oil yield
The program of response surface method restricts factor ranges to factorial levels (plus
one to minus one in coded values) – the region for which this experimental design provides the
most precise predictions. Thus, all variables were limited in the factorial levels in this study.
Temperature increased from 280°C to 340°C, retention time lay at 12-48 min, biomass content
was 9% to 21%, and catalyst loading ranged from 0.76% to 2.25%.
Bio-oil yield was significantly affected by the linear terms of temperature and retention
time. As can be seen in Eq. (4-4), temperature and retention time showed a negative relationship
with bio-oil yield, which indicated that higher bio-oil yield was obtained at lower temperature for
shorter retention time. Corn cobs used in this study contained high contents of cellulose (35.5%)
and hemicellulose (29.9%), but low content of lignin (14.2%). It has reported that cellulose and
hemicellulose could be converted to bio-oil in hot-compressed water at relatively low
temperatures (260 to 300 °C) (Minowa et al., 1997; Pińkowska et al., 2011). Generally, the
maximum bio-oil yield was obtained at lower temperature when biomass with lower lignin
content was used as feedstock (Zhong and Wei, 2004). Our recent study (Gan et al., 2010) also
found that corn cobs can be converted to bio-oil via HTC at low temperature for short retention
time. The bio-oil yield began to decrease at higher temperature duo to the formation of char by
repolymerization/ condensation of bio-oil (Xu and Lancaster, 2008) and gas production from
bio-oil steam reforming (Aktaş et al., 2009; Xu and Lancaster, 2008; Jena et al., 2011; Zhou et
al., 2010). The bio-oil yield decreased at a prolonged retention time would due to the cracking of
bio-oil or intermediate products to gases and char formation by condensation, cyclization and
repolymerization (Qu et al., 2003; Xu and Etcheverry, 2008; Li et al., 2009). The interaction
term of temperature and retention time showed a significant effect on bio-oil yield, which is
illustrated in Figure 4.1 at zero level of biomass content (15 wt%) and catalyst loading (1.5
wt%). The contour lines indicated that bio-oil production from corn cobs HTC favored low
temperature and short retention time, which was consistent with Eq. (4-4). At any retention time
between 12 and 48 min, bio-oil yield decreased with increasing temperature. Similarly, bio-oil
yield also decreased with increasing retention time at any temperature.
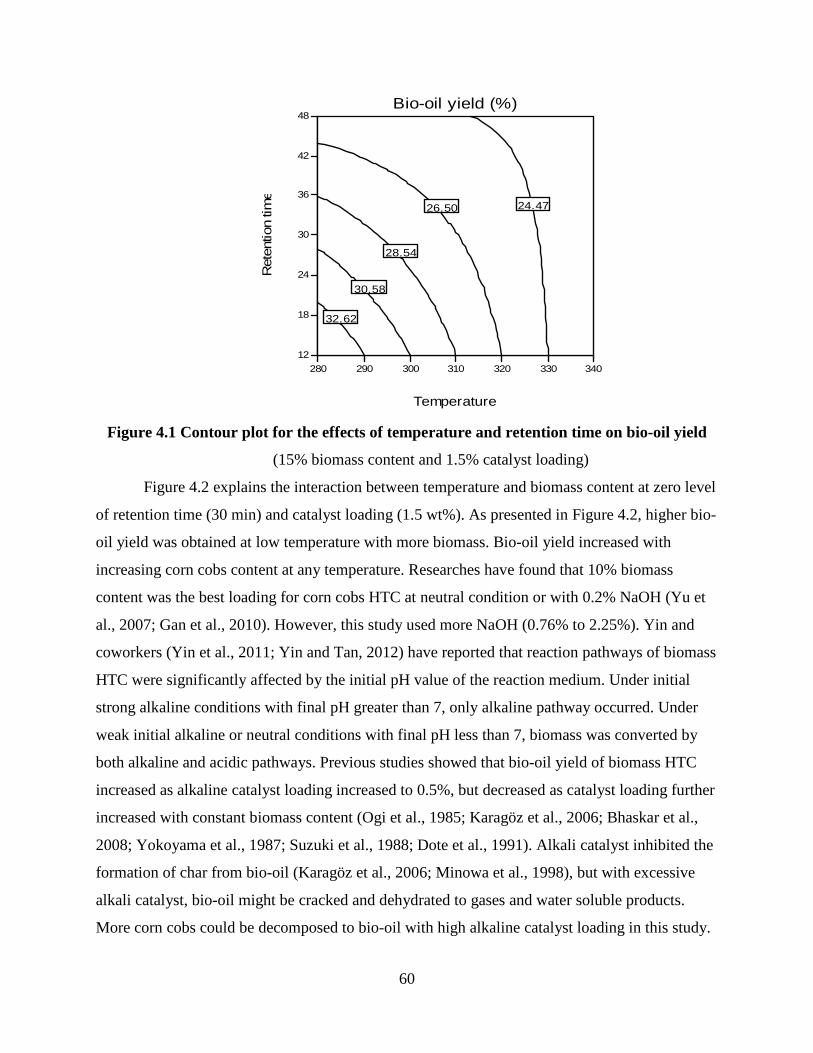
60
280 290 300 310 320 330 340
12
18
24
30
36
42
48Bio-oil yield (%)
Temperature
Ret
entio
n tim
e
24.4726.50
28.54
30.58
32.62
Figure 4.1 Contour plot for the effects of temperature and retention time on bio-oil yield
(15% biomass content and 1.5% catalyst loading)
Figure 4.2 explains the interaction between temperature and biomass content at zero level
of retention time (30 min) and catalyst loading (1.5 wt%). As presented in Figure 4.2, higher bio-
oil yield was obtained at low temperature with more biomass. Bio-oil yield increased with
increasing corn cobs content at any temperature. Researches have found that 10% biomass
content was the best loading for corn cobs HTC at neutral condition or with 0.2% NaOH (Yu et
al., 2007; Gan et al., 2010). However, this study used more NaOH (0.76% to 2.25%). Yin and
coworkers (Yin et al., 2011; Yin and Tan, 2012) have reported that reaction pathways of biomass
HTC were significantly affected by the initial pH value of the reaction medium. Under initial
strong alkaline conditions with final pH greater than 7, only alkaline pathway occurred. Under
weak initial alkaline or neutral conditions with final pH less than 7, biomass was converted by
both alkaline and acidic pathways. Previous studies showed that bio-oil yield of biomass HTC
increased as alkaline catalyst loading increased to 0.5%, but decreased as catalyst loading further
increased with constant biomass content (Ogi et al., 1985; Karagöz et al., 2006; Bhaskar et al.,
2008; Yokoyama et al., 1987; Suzuki et al., 1988; Dote et al., 1991). Alkali catalyst inhibited the
formation of char from bio-oil (Karagöz et al., 2006; Minowa et al., 1998), but with excessive
alkali catalyst, bio-oil might be cracked and dehydrated to gases and water soluble products.
More corn cobs could be decomposed to bio-oil with high alkaline catalyst loading in this study.
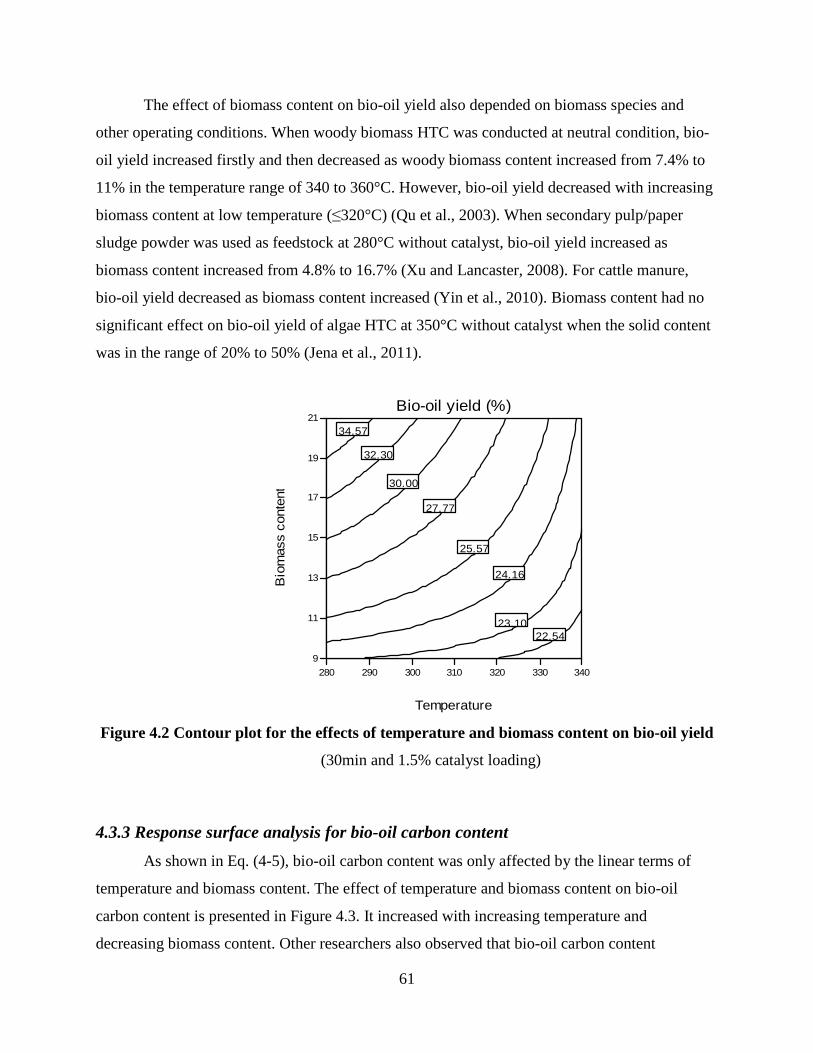
61
The effect of biomass content on bio-oil yield also depended on biomass species and
other operating conditions. When woody biomass HTC was conducted at neutral condition, bio-
oil yield increased firstly and then decreased as woody biomass content increased from 7.4% to
11% in the temperature range of 340 to 360°C. However, bio-oil yield decreased with increasing
biomass content at low temperature (≤320°C) (Qu et al., 2003). When secondary pulp/paper
sludge powder was used as feedstock at 280°C without catalyst, bio-oil yield increased as
biomass content increased from 4.8% to 16.7% (Xu and Lancaster, 2008). For cattle manure,
bio-oil yield decreased as biomass content increased (Yin et al., 2010). Biomass content had no
significant effect on bio-oil yield of algae HTC at 350°C without catalyst when the solid content
was in the range of 20% to 50% (Jena et al., 2011).
280 290 300 310 320 330 340
9
11
13
15
17
19
21Bio-oil yield (%)
Temperature
Bio
mas
s co
nten
t
25.57
27.77
30.00
32.30
34.57
24.16
22.5423.10
Figure 4.2 Contour plot for the effects of temperature and biomass content on bio-oil yield
(30min and 1.5% catalyst loading)
4.3.3 Response surface analysis for bio-oil carbon content
As shown in Eq. (4-5), bio-oil carbon content was only affected by the linear terms of
temperature and biomass content. The effect of temperature and biomass content on bio-oil
carbon content is presented in Figure 4.3. It increased with increasing temperature and
decreasing biomass content. Other researchers also observed that bio-oil carbon content
62
increased as HTC temperature increased (Ocfemia et al., 2006; Yu et al., 2011; Garcia Alba et
al., 2012). The major elements of bio-oil are carbon and oxygen, whose contents are in inverse
proportion. High temperature promoted dehydration and decarboxylation reactions to remove
oxygen from biomass in the form of H2O and CO2 in HTC. Gaseous products from biomass HTC
primarily comprised of CO2, CO, H2, and CH4, in which CO2 was the major component (Gan et
al., 2010; Zhang et al., 2008; Yu et al., 2007). With CO2 and CO formation, both carbon and
oxygen are removed from biomass. However, the loss of oxygen is higher than carbon because
the two gases contain more oxygen than carbon. Yu and co-workers (2007) reported that more
CO2, CO and aqueous products were formed from corn cobs liquefaction at higher temperature,
which indicated that more oxygen was removed in the form of H2O and CO2. Therefore, bio-oil
carbon content increased as temperature increased. As biomass content increased, bio-oil carbon
content decreased. It might because CO2 yield decreased as increasing corn cobs content (Yu et
al., 2007).
280 290 300 310 320 330 340
9
11
13
15
17
19
21Bio-oil carbon content (%)
Temperature
Bio
mas
s co
nten
t
63.11
64.64
65.92
67.13
72.65
68.75
69.97
71.12
Figure 4.3 Contour plot for the effects of temperature and biomass content on bio-oil
carbon content
(30min retention time and 1.5% catalyst loading)
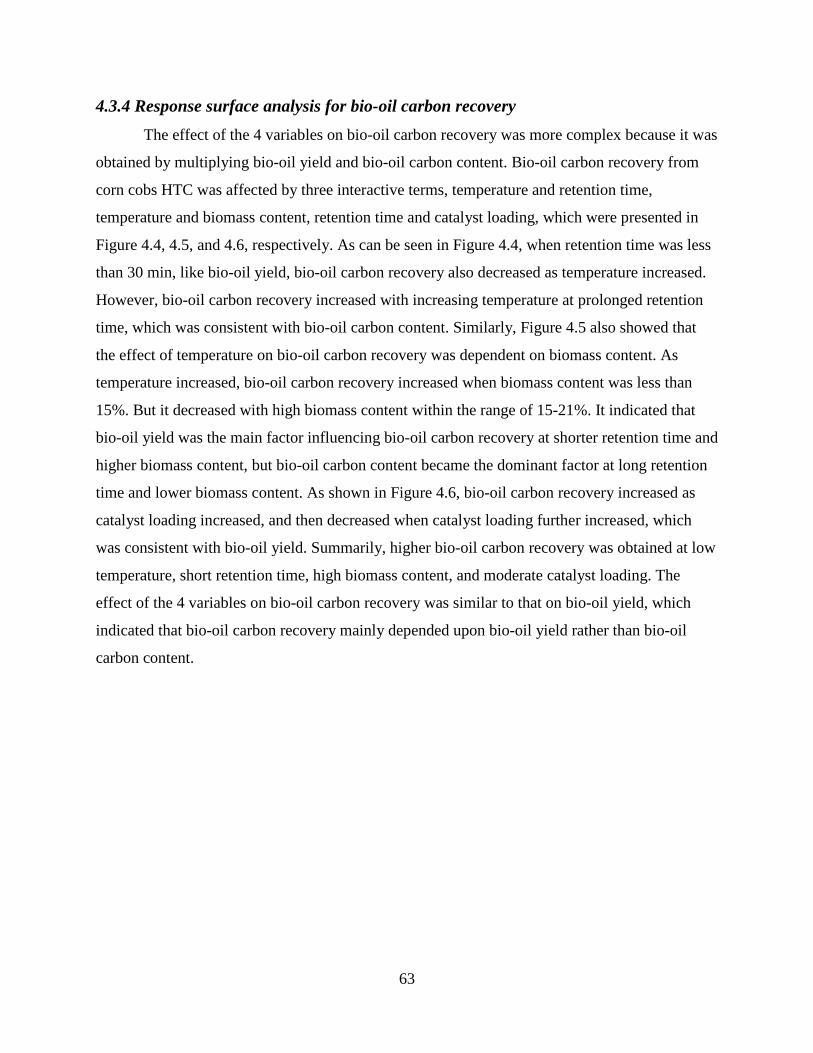
63
4.3.4 Response surface analysis for bio-oil carbon recovery
The effect of the 4 variables on bio-oil carbon recovery was more complex because it was
obtained by multiplying bio-oil yield and bio-oil carbon content. Bio-oil carbon recovery from
corn cobs HTC was affected by three interactive terms, temperature and retention time,
temperature and biomass content, retention time and catalyst loading, which were presented in
Figure 4.4, 4.5, and 4.6, respectively. As can be seen in Figure 4.4, when retention time was less
than 30 min, like bio-oil yield, bio-oil carbon recovery also decreased as temperature increased.
However, bio-oil carbon recovery increased with increasing temperature at prolonged retention
time, which was consistent with bio-oil carbon content. Similarly, Figure 4.5 also showed that
the effect of temperature on bio-oil carbon recovery was dependent on biomass content. As
temperature increased, bio-oil carbon recovery increased when biomass content was less than
15%. But it decreased with high biomass content within the range of 15-21%. It indicated that
bio-oil yield was the main factor influencing bio-oil carbon recovery at shorter retention time and
higher biomass content, but bio-oil carbon content became the dominant factor at long retention
time and lower biomass content. As shown in Figure 4.6, bio-oil carbon recovery increased as
catalyst loading increased, and then decreased when catalyst loading further increased, which
was consistent with bio-oil yield. Summarily, higher bio-oil carbon recovery was obtained at low
temperature, short retention time, high biomass content, and moderate catalyst loading. The
effect of the 4 variables on bio-oil carbon recovery was similar to that on bio-oil yield, which
indicated that bio-oil carbon recovery mainly depended upon bio-oil yield rather than bio-oil
carbon content.
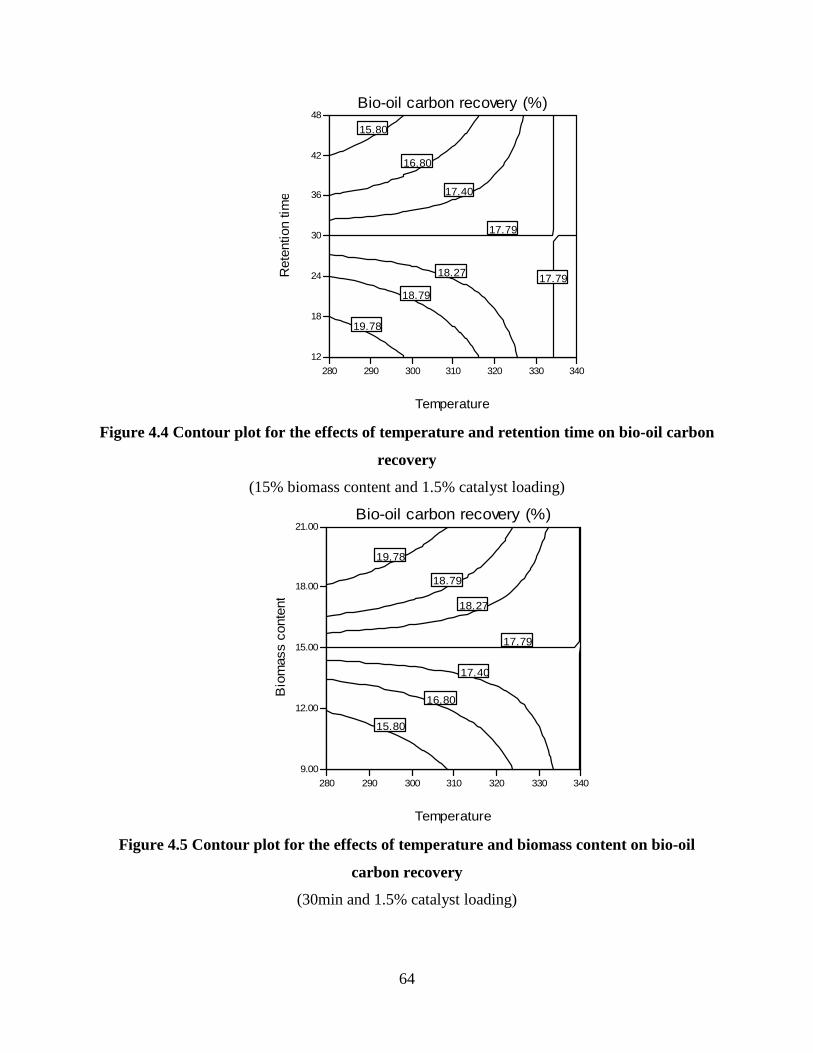
64
280 290 300 310 320 330 340
12
18
24
30
36
42
48Bio-oil carbon recovery (%)
Temperature
Ret
entio
n tim
e
15.80
16.80
17.79
17.79
18.79
19.78
18.27
17.40
Figure 4.4 Contour plot for the effects of temperature and retention time on bio-oil carbon
recovery
(15% biomass content and 1.5% catalyst loading)
280 290 300 310 320 330 340
9.00
12.00
15.00
18.00
21.00Bio-oil carbon recovery (%)
Temperature
Bio
mas
s co
nten
t
15.80
16.80
17.79
18.79
19.78
18.27
17.40
Figure 4.5 Contour plot for the effects of temperature and biomass content on bio-oil
carbon recovery
(30min and 1.5% catalyst loading)
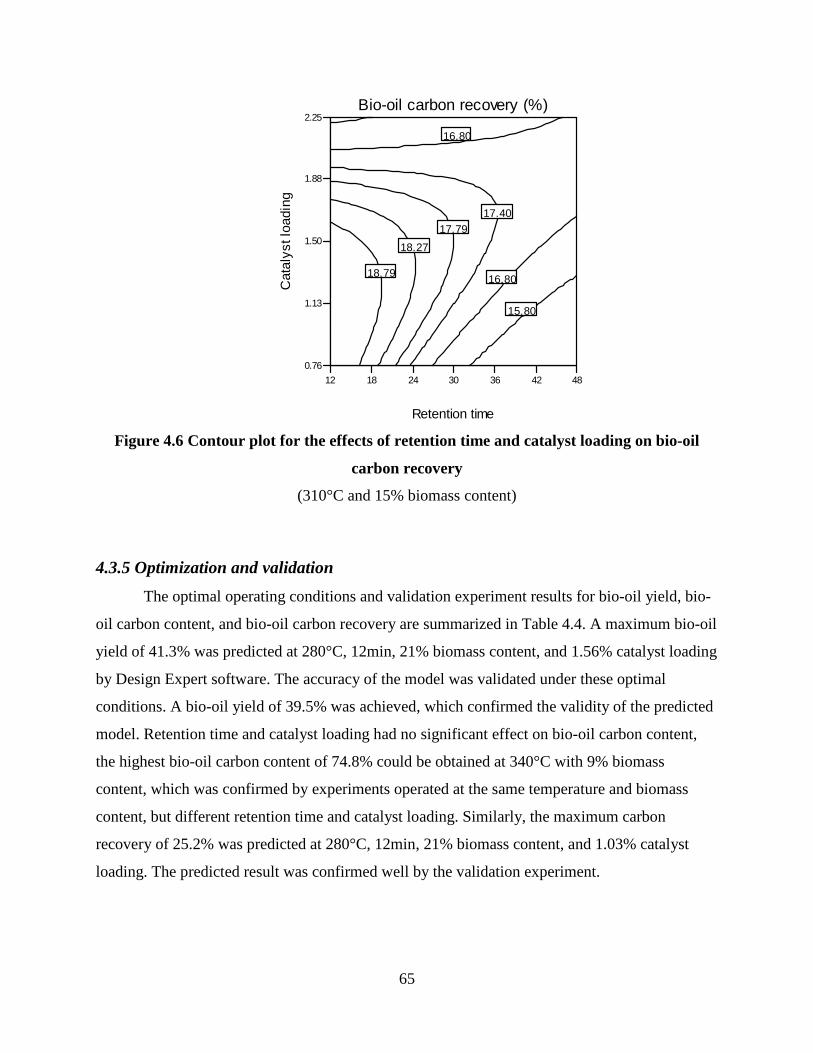
65
12 18 24 30 36 42 48
0.76
1.13
1.50
1.88
2.25Bio-oil carbon recovery (%)
Retention time
Cat
alys
t loa
ding
15.80
16.80
16.80
17.79
18.79
18.27
17.40
Figure 4.6 Contour plot for the effects of retention time and catalyst loading on bio-oil
carbon recovery
(310°C and 15% biomass content)
4.3.5 Optimization and validation
The optimal operating conditions and validation experiment results for bio-oil yield, bio-
oil carbon content, and bio-oil carbon recovery are summarized in Table 4.4. A maximum bio-oil
yield of 41.3% was predicted at 280°C, 12min, 21% biomass content, and 1.56% catalyst loading
by Design Expert software. The accuracy of the model was validated under these optimal
conditions. A bio-oil yield of 39.5% was achieved, which confirmed the validity of the predicted
model. Retention time and catalyst loading had no significant effect on bio-oil carbon content,
the highest bio-oil carbon content of 74.8% could be obtained at 340°C with 9% biomass
content, which was confirmed by experiments operated at the same temperature and biomass
content, but different retention time and catalyst loading. Similarly, the maximum carbon
recovery of 25.2% was predicted at 280°C, 12min, 21% biomass content, and 1.03% catalyst
loading. The predicted result was confirmed well by the validation experiment.
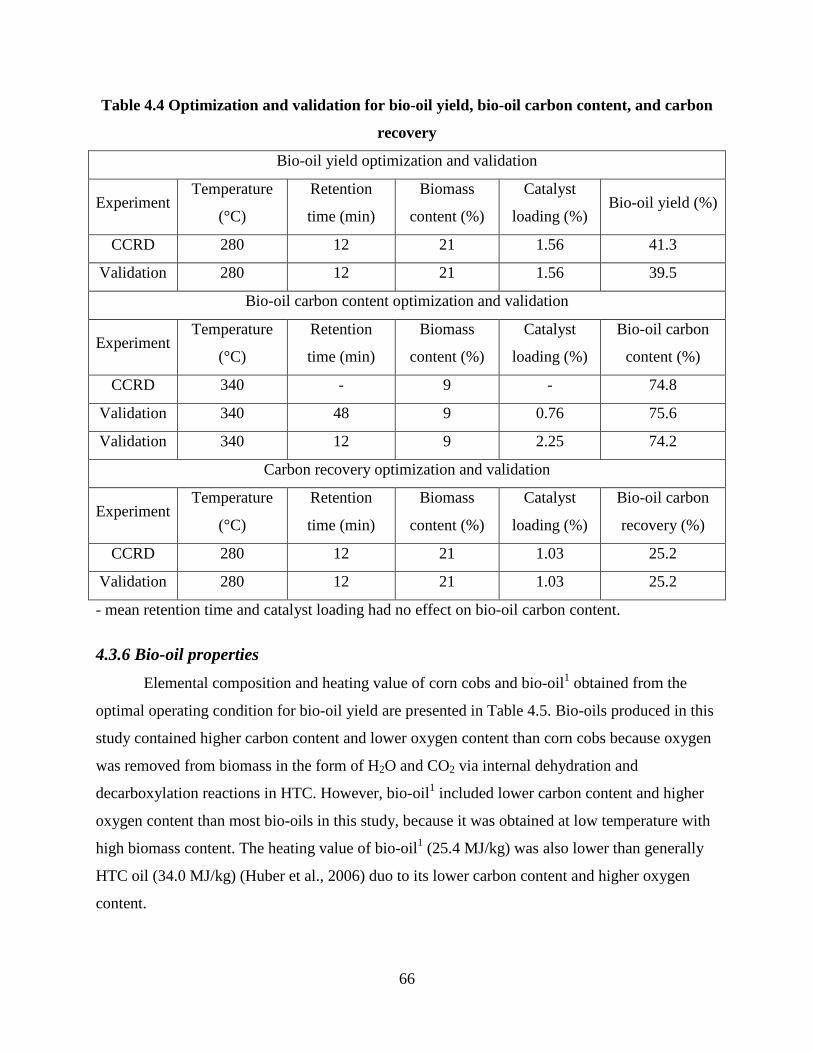
66
Table 4.4 Optimization and validation for bio-oil yield, bio-oil carbon content, and carbon
recovery
Bio-oil yield optimization and validation
Experiment Temperature
(°C)
Retention
time (min)
Biomass
content (%)
Catalyst
loading (%) Bio-oil yield (%)
CCRD 280 12 21 1.56 41.3
Validation 280 12 21 1.56 39.5
Bio-oil carbon content optimization and validation
Experiment Temperature
(°C)
Retention
time (min)
Biomass
content (%)
Catalyst
loading (%)
Bio-oil carbon
content (%)
CCRD 340 - 9 - 74.8
Validation 340 48 9 0.76 75.6
Validation 340 12 9 2.25 74.2
Carbon recovery optimization and validation
Experiment Temperature
(°C)
Retention
time (min)
Biomass
content (%)
Catalyst
loading (%)
Bio-oil carbon
recovery (%)
CCRD 280 12 21 1.03 25.2
Validation 280 12 21 1.03 25.2
- mean retention time and catalyst loading had no effect on bio-oil carbon content.
4.3.6 Bio-oil properties
Elemental composition and heating value of corn cobs and bio-oil1 obtained from the
optimal operating condition for bio-oil yield are presented in Table 4.5. Bio-oils produced in this
study contained higher carbon content and lower oxygen content than corn cobs because oxygen
was removed from biomass in the form of H2O and CO2 via internal dehydration and
decarboxylation reactions in HTC. However, bio-oil1 included lower carbon content and higher
oxygen content than most bio-oils in this study, because it was obtained at low temperature with
high biomass content. The heating value of bio-oil1 (25.4 MJ/kg) was also lower than generally
HTC oil (34.0 MJ/kg) (Huber et al., 2006) duo to its lower carbon content and higher oxygen
content.

67
The chemical compounds of bio-oil1 included ketones, alcohols, esters, and long chain
alkane hydrocarbons, in which 2-Ethylhexyl mercaptoacetate and 1-Hexanol, 2-ethyl- were the
dominant compounds, followed by 2-Pentanone, 4-hydroxy-4-methyl-, Nonadecane, and Diethyl
Phthalate. 2-Pentanone, 4-hydroxy-4-methyl- was considered as the decomposed product of
benzene derivatives from lignin (Bhaskar et al., 2008). Other compounds might be derived from
cellulose and hemicellulose in corn cobs because it is believed that cellulose and hemicellulose
are decomposed to straight chain hydrocarbons. No phenol or its derivatives were found in
bio-oil1, which might because phenolic derivatives was concentrated in aqueous products with
strong alkali solution (Bhaskar et al., 2008).
Table 4.5 Elemental composition and heating value of corn cobs and bio-oils
Sample C H N S O* Heating value
(MJ/kg)
Corncobs 53.48±0.45 5.09±0.52 0.52±0.11 0.89±0.17 40.03±0.35 18.32±0.25
Bio-oil1 63.0±1.57 6.87±0.57 0.42±0.01 1.31±0.10 28.82±2.23 25.41±0.73
* Calculated by difference. Bio-oil1 was obtained from the validation experiment at 280°C for 12min with 21% biomass content and 1.56% catalyst loading on a total reactant weight basis.
4.4 Conclusion
Second order polynomial models were developed to predict bio-oil yield and carbon
recovery, and first order linear model was developed to evaluate bio-oil carbon content. The
models were adequate enough owe to the low P value (<0.001), and insignificant lack of fit
(P>0.05). The results showed that higher bio-oil yield and carbon recovery could be obtained at
low temperature for short retention time with high biomass content and moderate alkaline
catalyst loading. However, bio-oil carbon content increased as temperature increased, but
decreased as biomass content increased. A maximum bio-oil yield of 41.3% was obtained at
280°C, 12min, 21% biomass content, and 1.56% catalyst loading. The experimental bio-oil yield
of 39.5% was well consistent with the predicted one. A highest bio-oil carbon content of 74.8%
was produced at 340°C with 9% biomass content. A maximum carbon recovery of 25.2% was
observed at 280°C, 12min, 21% biomass content, and 1.03% catalyst loading. The predicted bio-
oil carbon content and carbon recovery also were confirmed well by the validation experiments.

68
The properties of the bio-oil obtained at the optimal conditions for bio-oil yield were
measured. The heating value of the bio-oil was low as 25.41MJ/kg due to its low carbon content
(63%) and high oxygen content (28.8%). The chemical compounds of the bio-oil included
ketones, alcohols, esters, and long chain alkane hydrocarbons, in which 2-Ethylhexyl
mercaptoacetate and 1-Hexanol, 2-ethyl- were the dominant compounds.
69
Reference
Aktaş, S., Karakaya, M., and Avci, A. K. (2009). Thermodynamic analysis of steam assisted conversions of bio-oil components to synthesis gas. Int. J. Hydrogen Energy 34, 1752-1759.
Bhaskar, T., Sera, A., Muto, A., and Sakata, Y. (2008). Hydrothermal upgrading of wood biomass: Influence of the addition of K2CO3 and cellulose/lignin ratio. Fuel 87, 2236–2242.
Chiellini, E., Cinelli, P., Ilieva, V. I., Imam, S. H., and Lawton, J. W. (2009). Environmentally compatible foamed articles based on potato starch, corn fiber, and poly (vinyl alcohol). J. Cellular Plastics 45(1), 17-32.
Czernik, S., and Bridgwater, A.V. (2004). Overview of applications of biomass fast pyrolysis oil. Energy Fuels 18(2), 590–8.
Demirbas, A. (2011). Competitive biofuels from biomass. Appl Energy 88, 17-28.
Dote, Y., Yokoyama, S., Ogi, T., Minowa, T., and Murakami, M. (1991). Liquefaction of barley stillage and upgrading of primary oil. Biomass Bioenergy 1, 55-60.
FAO. (2008). FAOSTAT statistics database. Roma, Italy: United Nations FAO. Available at: faostat.fao.org/site/567/DesktopDefault.aspx?PageID=567.
Gan, J., Yuan, W., Nelson, N. O., and Agudelo, S. C. (2010). Hydrothermal conversion of corn cobs and crude glycerol. Biol. Eng. 2(4), 197–210.
Garcia Alba, L., Torri, G., Samori, C., van der Spek, J., Fabbri, D., Kersten, S. R. A, and Brilman, D. W. F. (2012). Hydrothermal treatment (HTT) of microalgae: evaluation of the process as conversion method in an algae biorefinery concept. Energy Fuels 26, 642-657.
Huber, G. W, and Dumesic, J. A. (2006). An overview of aqueous-phase catalytic processes for production of hydrogen and alkanes in a biorefinery. Catal. Today 111(1–2), 119–32.
Huber, G. W., Iborra, S., and Corma, A. (2006). Synthesis of transportation fuels from biomass: chemistry, catalysts, and engineering. Chem. Rev. 106, 4044-4098.
IEA. (2010). Sustainable production of second-generation biofuels: Potential and perspectives in major economies and developing countries.
Jena, U., Das, K. C., and Kastner, J. R. (2011). Effect of operating conditions of thermochemical liquefaction on biocrude production from Spriulina platensis. Bioresour. Technol. 102, 6221-6229.

70
Karagöz, S., Bhaskar, T., Muto, A., and Sakata, Y. (2006). Hydrothermal upgrading of biomass: Effect of K2CO3 concentration and biomass/water ratio on products distribution. Bioresour. Technol. 97, 90-98.
Luo, J., Xu, Y., Zhao, L., Dong, L., Tong, D., Zhu, L., and Hu, C. (2010). Two-step hydrothermal conversion of Pubesens to obtain furans and phenol compounds separately. Bioresour Technol 101, 8873-80.
Minowa, T., Zhen, F., and Ogi, T. (1997). Liquefaction of cellulose in hot compressed water using sodium carbonate: products distribution at different reaction temperatures. J. Chem. Eng. Jpn. 30, 186–190.
Minowa, T., Zhen, F., and Ogi, T. (1998). Cellulose decomposition in hot-compressed water with alkali or nickel catalyst. J. Supercrit. Fluids 13, 253-259.
Ocfmia, K. S., Zhang, Y., and Funk, T. (2006). Hydrothermal processing of swine manure into oil using a continuous reaction system: Development and testing. Transaction of the ASABE 49(2), 533-541.
Ogi, T., Yokoyama, S., and Koguchi, K. (1985). Direct liquefaction of wood by alkali and alkaline earth salt in an aqueous phase. Chemistry Letters 1199-1202.
Perlack, R. D., Wright, L. L., Turhollow, A. F., Graham, R. L., Stokes, B. J., and Erbach, D. C. (2005). Biomass as feedstock for a bioenergy and bioproducts Industry: the technical feasibility of a billion-ton annual supply. Oar Ridge National Laboratory Report ORNL/TM-2005/66, US Dept. of Energy, Oak Ridge, TN.
Peterson, A. A., Vogel, F., Lachance, R. P., Froling, M., Antal Jr, M. J., and Tester, J. W. (2008). Thermochemical biofuel production in hydrothermal media: a review of sub- and supercritical water technologies. Energy Environ. Sci. 1, 32–65.
Pińkowska, H., Wolak, P., and Zlocińska, A. (2011). Hydrothermal decomposition of xylan as a model substance for plant biomass waste-Hydrothermolysis in subcritical water. Biomass Bioenergy 35, 3902–3912.
Qu, Y., Wei, X., Zhong, C. (2003). Experimental study on the direct liquefaction of Cunninghamia lanceolata in Water. Energy 28, 597-606.
Shen, Z., Zhou, J., Zhou, X., and Zhang, Y. (2011). The production of acetic acid from microalgae under hydrothermal conditions. Appl Energy 88, 3444-7.
Sluiter, A., Ruiz, R., Scarlata, C., Sluiter, J., and Templeton, D. (2005). Determination of extractives in biomass. NREL/TP-510-42619. Golden, Colo.: National Renewable Energy Laboratory.
Sluiter, A., Hames, B., Ruiz, R., Scarlata, C., Sluiter, J., Templeton, D., and Crocker, D. (2008). Determination of structural carbohydrates and lignin in biomass. NREL/TP-510-42618. Golden, Colo.: National Renewable Energy Laboratory.
71
Suzuki, A., and Nakamura, T. (1988). Conversion of sewage sludge to heavy oil by direct thermochemical liquefaction. J. Chem. Eng. Jpn. 21, 288-293.
Wang, Z., Lin, W., and Song, W. (2012). Liquid product from hydrothermal treatment of cellulose by direct GC/MS analysis. Appl Energy :doi:10.1016/j.apenergy.2011.11.077
Xu, C., and Lancaster, J. (2008). Conversion of secondary pulp/paper sludge powder to liquid oil products for energy recovery by direct liquefaction in hot-compressed water. Water Research 42, 1571-1582.
Xu, C., and Etcheverry, T. (2008). Hydro-liquefaction of woody biomass in sub- and super-critical ethanol with iron-based catalysts. Fuel 87(3), 335-345.
Yokoyama, S., Suzuki, A., Murakamit, M., Ogi, T., Koguchi, K., and Nakamura, E. (1987). Liquid fuel production from sewage sludge by catalytic conversion using sodium carbonate. Fuel 66, 1150-1155.
Yin, S., Dolan, R., Harris, M., and Tan, Z. (2010). Subcritical hydrothermal liquefaction of cattle manure to bio-oil: Effect of conversion parameters on bio-oil yield and characterization of bio-oil. Bioresour. Technol. 101, 3657-3664.
Yu, F, Ruan, R., Chen, P., Deng, S., Liu, Y., and Lin, X. (2007). Liquefaction of corn cobs with supercritical water treatment. Trans. ASABE 50(1), 175-180.
Yu, G., Zhang, Y., Schideman, L., Funk, T., and Wang, C. (2011). Distributions of carbon and nitrogen in the products from hydrothermal liquefaction of low-lipid microalgae. Energy Environmental Science 4, 4587-4595.
Yuan, X. Z, Tong, J.Y., Zeng, G. M., Li, H., and Xie, W. (2009). Comparative studies of products obtained at different temperatures during straw liquefaction by hot compressed water. Energy & Fuels 23, 3262-3267.
Zhang, B., Keitz, M. V., and Valentas, K. (2008). Maximizing the liquid fuel yield in a biorefining process. Biotechnology and Bioengineering 101(5), 903-912.
Zhong, C., and Wei, X. (2004). A comparative experimental study on the liquefaction of wood. Energy 29, 1731–41.
Zhou, D., Zhang, L., Zhang, S., Fu, H., and Chen, J. (2010). Hydrothermal liquefaction of macroalgae Enteromorpha prolifera to bio-oil. Energy Fuels 24, 4050-4061.
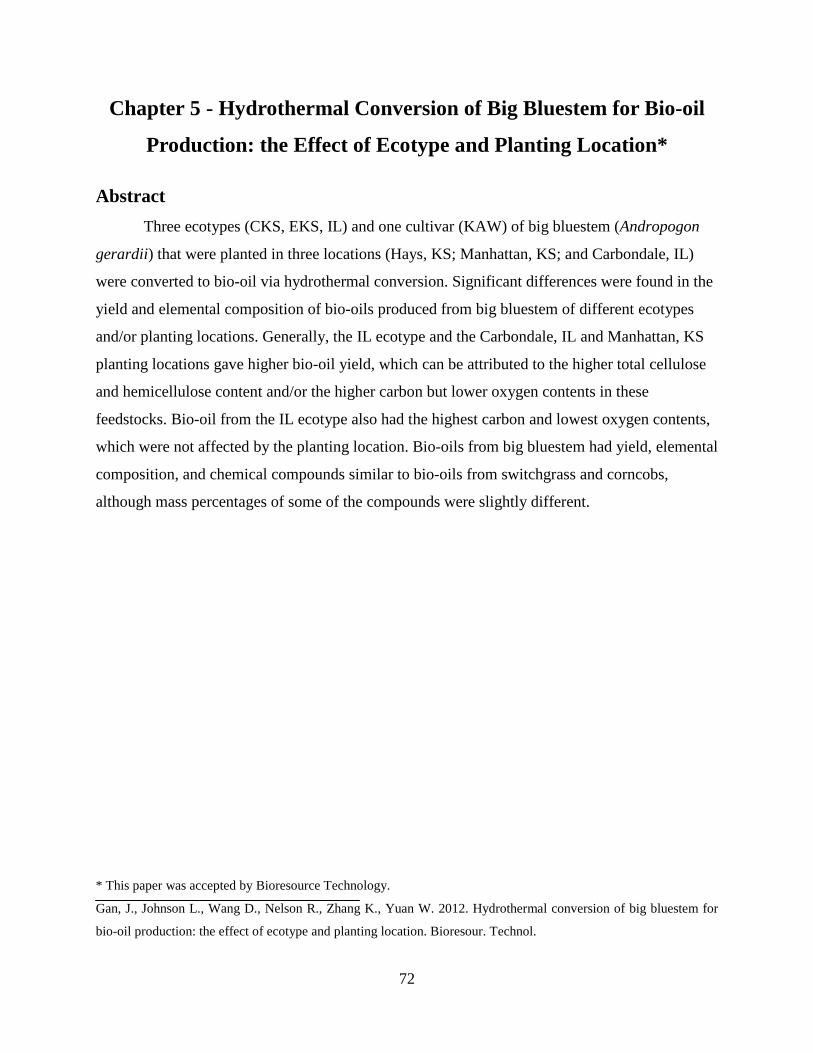
72
Chapter 5 - Hydrothermal Conversion of Big Bluestem for Bio-oil
Production: the Effect of Ecotype and Planting Location*
Abstract
Three ecotypes (CKS, EKS, IL) and one cultivar (KAW) of big bluestem (Andropogon
gerardii) that were planted in three locations (Hays, KS; Manhattan, KS; and Carbondale, IL)
were converted to bio-oil via hydrothermal conversion. Significant differences were found in the
yield and elemental composition of bio-oils produced from big bluestem of different ecotypes
and/or planting locations. Generally, the IL ecotype and the Carbondale, IL and Manhattan, KS
planting locations gave higher bio-oil yield, which can be attributed to the higher total cellulose
and hemicellulose content and/or the higher carbon but lower oxygen contents in these
feedstocks. Bio-oil from the IL ecotype also had the highest carbon and lowest oxygen contents,
which were not affected by the planting location. Bio-oils from big bluestem had yield, elemental
composition, and chemical compounds similar to bio-oils from switchgrass and corncobs,
although mass percentages of some of the compounds were slightly different.
* This paper was accepted by Bioresource Technology.
Gan, J., Johnson L., Wang D., Nelson R., Zhang K., Yuan W. 2012. Hydrothermal conversion of big bluestem for
bio-oil production: the effect of ecotype and planting location. Bioresour. Technol.

73
5.1 Introduction
Andropogon gerardii Vitman, commonly known as big bluestem, is a dominant grass in
the tallgrass prairies of North America (Weaver and Fitzpatric, 1932; Knapp et al., 1998). Big
bluestem is widely distributed on loamy soils in Midwest United States grasslands and comprises
up to 80% of prairie biomass (Knapp et al 1998). Although photosynthesis in C4 grasses is highly
sensitive to water stress (Ghannoum, 2009), big bluestem is capable of maintaining high
photosynthetic rates during periods of water shortage (Knapp, 1985) owning to its efficient water
usage and resource allocation (Johnson and Matchett, 2001). Conversion of native perennial
grasses such as big bluestem to biofuels offers major economic, environmental, and strategic
benefits. Compared with switchgrass, the first-generation dedicated bioenergy species, big
bluestem was found to produce three times more biomass (Epstein et al., 1998) with less (or no)
irrigation or nitrogen fertilizers needed. Moreover, big bluestem was found to have higher
cellulose and lignin contents and greater fermentability than switchgrass (Jung and Vogel, 1992),
which are important qualities for biofuel conversion.
McMillan conducted early studies investigating the ecotype effects of several grasses,
including big bluestem. Six ecotypes of big bluestem were collected across the United States
from north to south and were planted in Texas (McMillan, 1965a) or in growth chambers with
temperature and light-period controls (McMillan, 1965b). Results indicated that vegetation of big
bluestem was affected by its ecotype and growth climate. Jefferson and co-workers (2002, 2004)
also found that planting location had significant effects on big bluestem biomass production and
its cellulose and hemicellulose contents in the Canadian prairie provinces. They found that big
bluestem could not be well cultivated at sites above 51ºN latitude in western Canada, and its
cellulose and hemicellulose contents were lower than in lower latitude areas.
Cellulose, hemicellulose, and lignin are the three major compounds of lignocellulosic
biomass. Higher cellulose content in biomass generally favors higher ethanol yield in
biochemical conversion. Thermochemical conversion is another promising technology to convert
lignocellulosic biomass such as big bluestem into bio-fuels. As one of the thermochemical
conversion processes, hydrothermal conversion (HTC) has been extensively investigated for the
production of bio-oil, which can be used as a fuel for stationary diesel engines, burners, boilers
or turbines (Czernik and Bridgwater, 2004), or can be upgraded or further converted to
transportation fuels (e.g., gasoline and diesel) and products such as polymers, aromatics,

74
lubricants, and asphalt (Peterson et al., 2008). HTC is a chemical reforming process in which hot
compressed water (or other solvents) is used as reaction medium with which biomass is
depolymerized and reformed to gases, water-soluble matters, bio-oil, and char in an oxygen-
absent enclosure.
However, to the best of our knowledge, little information is available regarding the effect
of ecotype and planting location of big bluestem on its chemical composition and consequent
biofuel yield, and no information is available on converting big bluestem to bio-oil via HTC. The
objective of this study was to understand the effects of big bluestem ecotype and planting
location on its bio-oil yield and elemental composition. Four ecotypes of big bluestem
reciprocally planted in three locations (Hays and Manhattan, KS, and Carbondale, IL) were used
as the feedstock. For comparison purpose, switchgrass and corncobs were also tested.
5.2 Materials and Methods
5.2.1. Feedstock preparation
The feedstocks used in this study included big bluestem, switchgrass, and corncobs.
Three ecotypes of big bluestem, Central Kansas (CKS, Kansas State University Agricultural
Research Center–Hays, Hays, KS), Eastern Kansas (EKS, USDA Plant Material Center,
Manhattan, KS), and Illinois (IL, Southern Illinois University Agronomy Center, Carbondale, IL)
ecotypes were used. In Fall 2008, seeds of the ecotypes from these regions were collected by
hand from pristine ungrazed prairie within 50 miles of their home sites (Table 1). Seeds of each
ecotype were collected from two sites in the same region and separately planted in different
blocks. The Kaw cultivar (KAW) was also used for comparison purpose. KAW is a cultivar bred
by the USDA Plant Material Center (Manhattan, KS) that is widely used for restoration planting
in Conservation Reserve Program lands throughout the Great Plains. All three ecotypes plus
KAW were planted in the three locations, Hays and Manhattan, KS, and Carbondale, IL, in
August 2009 (Table 1) and were harvested in October 2010. For CKS, EKS, and IL ecotype of
big bluestem, two samples were obtained for each ecotype. Switchgrass (Panicum virgatum-
Kanlow) was grown and harvested at the Kansas State University Agronomy Farm in Manhattan,
KS. For big bluestem and switchgrass, the entire plant except for the root was used in this study.
Commercially available corncobs were obtained from Kaytee Products, Inc. (Chilton, WI). Each
feedstock sample was ground in a Retsch SM2000 rotary cutting mill (Retsch Inc., Newtown,
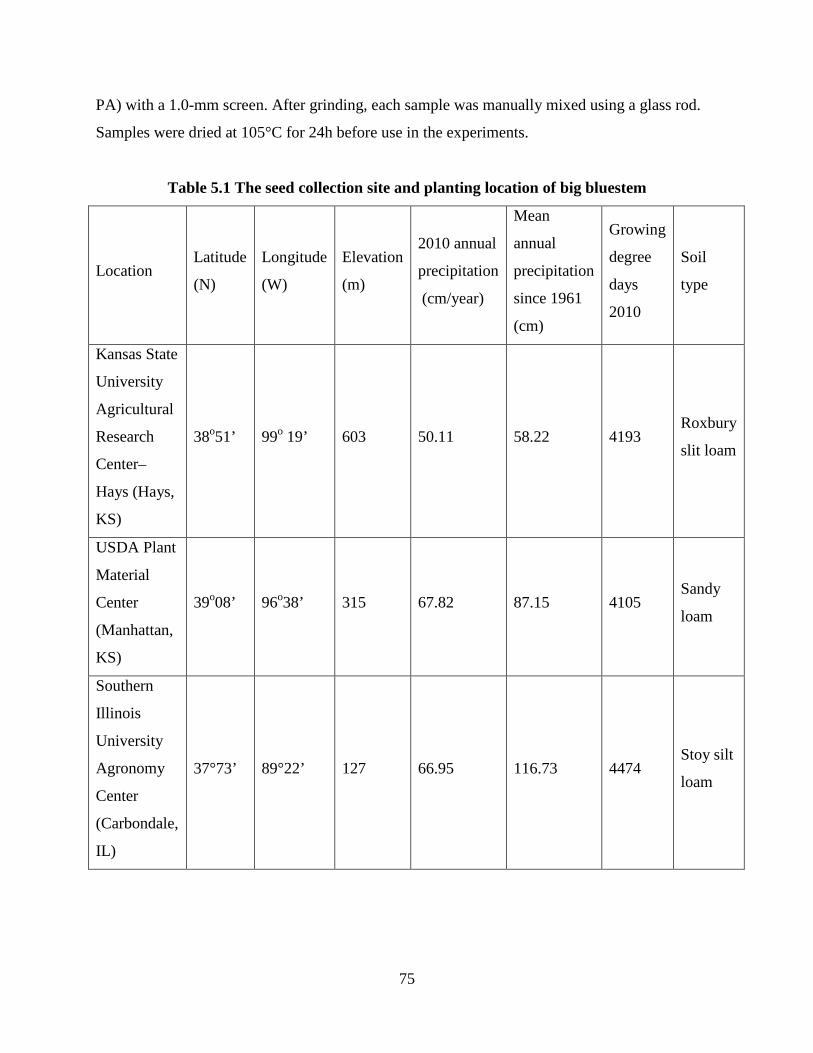
75
PA) with a 1.0-mm screen. After grinding, each sample was manually mixed using a glass rod.
Samples were dried at 105°C for 24h before use in the experiments.
Table 5.1 The seed collection site and planting location of big bluestem
Location Latitude
(N)
Longitude
(W)
Elevation
(m)
2010 annual
precipitation
(cm/year)
Mean
annual
precipitation
since 1961
(cm)
Growing
degree
days
2010
Soil
type
Kansas State
University
Agricultural
Research
Center–
Hays (Hays,
KS)
38o51’ 99o 19’ 603 50.11 58.22 4193 Roxbury
slit loam
USDA Plant
Material
Center
(Manhattan,
KS)
39o08’ 96o38’ 315 67.82 87.15 4105 Sandy
loam
Southern
Illinois
University
Agronomy
Center
(Carbondale,
IL)
37°73’ 89°22’ 127 66.95 116.73 4474 Stoy silt
loam

76
5.2.2 HTC apparatus and experimental procedure
A 1.8-L Parr model 4578 high-temperature, high-pressure reactor (Parr Instrument
Company, Moline, IL) equipped with a magnetic stirrer, serpentine cooling coil, reflux/take-off
condenser assembly, and bottom drain valve was used for all experiments. The reactor is made of
T316 stainless steel with an extreme operation capability of 5,000 psi and 500 °C. In a typical
batch test, a 50-g dry sample with 2.5 g sodium hydroxide as the catalyst and 447.5 g deionized
water were placed in the reactor. Air in the reactor was purged by flushing with nitrogen gas for
five minutes. The reactor was then pressurized to approximately 100 psi by using a high-pressure
nitrogen gas cylinder and heated to 280 °C with a heating rate of approximately 5 °C/min. The
desired temperature was kept for 20 min and the final gauge pressure at the end of the heating
cycle was around 1,100 psi. After the reaction, the reactor was cooled to room temperature with
tap water and the gaseous products were vented through the gas outlet valve. The solid and
aqueous products were collected from the reactor and separated by vacuum filtration with
Whatman Grad No.1 filter paper. Then, the water-insoluble fraction and the reactor were washed
with acetone. The solvent-insoluble portion was separated through vacuum filtration, then dried
to obtain the residual solid called bio-char. The solvent-soluble portion was then evaporated
using a rotary evaporator (Buchi RE-111, Flawil, Switzerland) to remove acetone, and the
remaining product was water-insoluble bio-oil. More details about the experimental apparatus
and procedure can be found in one of our previous papers (Gan et al., 2010). All experiments
were performed in duplicate, and data were expressed as average values. Bio-oil yield was
defined as follows: Oil yield (%) = (weight of bio-oil) / (dry weight of feedstock) × 100%.
5.2.3 Analytical tests
Chemical composition of biomass was determined according to the laboratory analytical
procedures developed by the National Renewable Energy Laboratory (Sluiter et al., 2005; Sluiter
et al., 2008). Briefly, after water and ethanol extraction, the sample was soaked in 72% sulfuric
acid at 30 °C for 1 h with constant stirring, followed by dilution to a 4% acid solution and
heating for another hour at 120 °C. The aqueous products and solid residue of the pretreatment
process were separated by vacuum filtration. The filtrate was adjusted to neutral by calcium
carbonate, then the sugar contents of the filtrate were measured by high-performance liquid
chromatography (Shimadzu, Kyoto, Japan), and acid-soluble lignin content in the filtrate was

77
detected by a UV-visible spectrophotometer (BioMate 3, Thermo Electron Corporation,
Madison, WI). The solid residue was dried and combusted. The weight difference between the
dry residue and combustion residue was reported as acid-insoluble lignin.
The elemental compositions of feedstock and bio-oil products were analyzed by a
CHNS/O elemental analyzer (PerkinElmer 2400, Shelton, CT). Each sample was placed in a
tarred tin capsule (PerkinElmer N2411255) and precisely weighed using a PerkinElmer AD6
Autobalance. The weight of each sample tested was approximately 2 mg. Samples encapsulated
in the tin were then loaded automatically by an integral 60-position autosampler (Perkin Elmer).
Bio-oil chemical compounds were analyzed by a gas chromatograph equipped with a
mass selective detector (Agilent 5975C GC-MS with HP-5MS column, Agilent Technologies
Inc., Santa Clara, CA). The temperature was kept at 40°C for 1 min, then increased to 300 °C
with 10 °C/min heating rate and held for 5 min. The inlet temperature of the GC-MS was 280 °C.
Compounds in the bio-oil were identified using the NIST08 library (Agilent Technologies Inc.,
Santa Clara, CA).
All statistical analyses were performed using SPSS software (SPSS 17.0, SPSS Inc.,
Chicago, IL). Correlations among big bluestem characteristics (chemical and elemental
compositions) and bio-oil properties (yield, carbon, and oxygen content) were determined using
Pearson’s correlation. Effects and interactions of ecotype/cultivar and planting location on bio-
oil yield, carbon, and oxygen content were analyzed using the ANOVA test. Tukey’s HSD test
was used to check significant differences. For convenience, “cultivar” is not specifically
differentiated from “ecotype” and are both described as “ecotype” thereafter in this article when
the effect of ecotype/cultivar is discussed.
5.3 Results and Discussion
5.3.1 The effect of ecotype and planting location on bio-oil yield
Bio-oil yields were in the range of 19.5–27.2%, depending on big bluestem ecotype and
planting location. The data were analyzed separately for each ecotype and planting location and
are shown in Figure 5.1. In Figure 5.1, letters (a and b) above the standard deviation bars indicate
that means of bio-oil yields are significantly different based on Tukey’s HSD test (p < 0.05); e.g.,
bio-oil yield of group b is significantly higher than bio-oil yield of group a. We denote
significant differences in the same manner for all remaining figures. As can be seen from Figure

78
5.1, the effect of big bluestem ecotype on bio-oil yield is dependent on the planting location.
When planted in Manhattan, KS, or Carbondale, IL, all ecotypes gave statistically similar bio-oil
yield, indicating that the planting location rather than ecotype may influence bio-oil yield. When
planted in Hays KS, slight differences in bio-oil yield were found, with KAW the highest and
EKS ecotype the lowest. The average bio-oil yield at all three locations for each ecotype showed
the same trend as in Hays, KS. In general, KAW and IL ecotype gave higher bio-oil yield,
suggesting that they might be the advantageous ecotypes for bio-oil production.
aa ab
ab
a
a a
a
a
aabab
aa
bb
0
5
10
15
20
25
30
Hays, KS Manhattan, KS Carbondale, IL Average of alllocations
Big bluestem planting location
Bio
-oil
yie
ld (
%)
CKS ecotype EKS ecotype IL ecotype KAW cultivar
Figure 5.1 Comparison of bio-oil yields of different ecotypes in each planting location,
grouped by planting location
Different letters (a and b) above the standard deviation bars indicate that the means of bio-oil
yield are significantly different (b>a), while the same letters indicate that the values are
statistically the same, based on Tukey’s HSD test (p < 0.05)
The effect of planting location on bio-oil yield can be found in Figure 5.2. KAW and IL
had no significant differences in bio-oil yield regardless of where they were planted. From
previous analysis, KAW and the IL ecotype were higher in bio-oil yield, which suggests that
ecotype is the main factor influencing bio-oil yield for these two advantageous ecotypes in terms
of bio-oil yield. However, for CKS and EKS ecotypes, Manhattan, KS, and Carbondale, IL, were
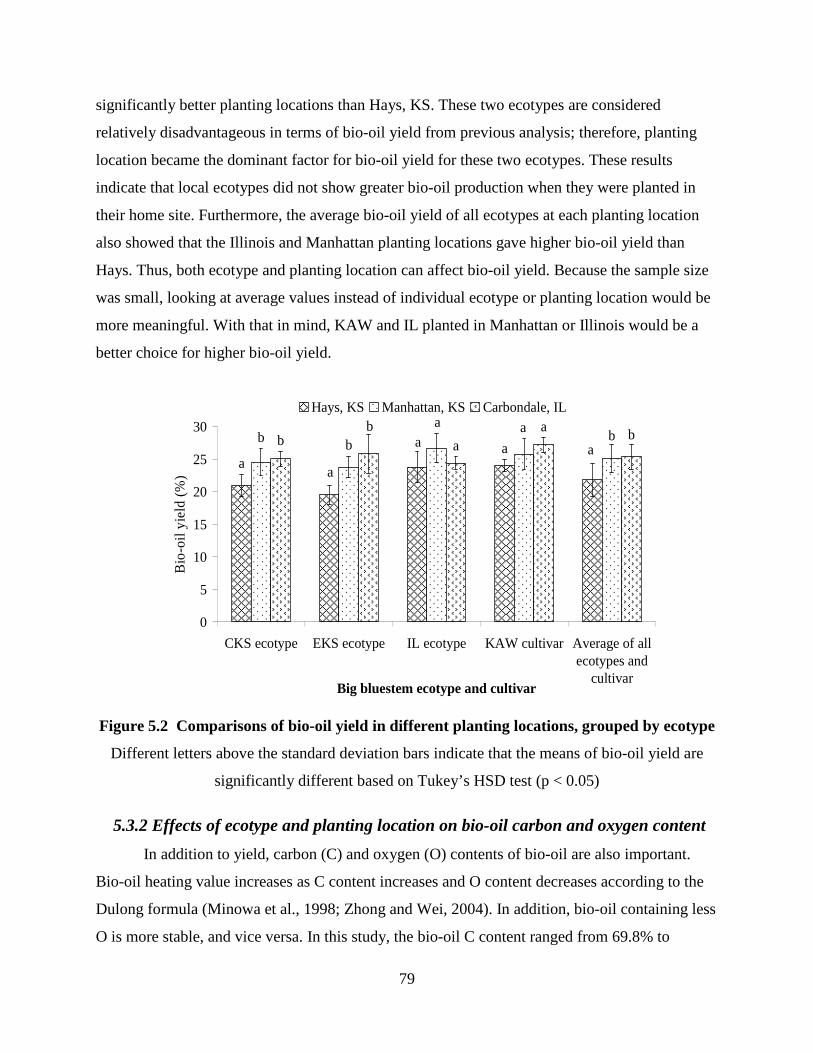
79
significantly better planting locations than Hays, KS. These two ecotypes are considered
relatively disadvantageous in terms of bio-oil yield from previous analysis; therefore, planting
location became the dominant factor for bio-oil yield for these two ecotypes. These results
indicate that local ecotypes did not show greater bio-oil production when they were planted in
their home site. Furthermore, the average bio-oil yield of all ecotypes at each planting location
also showed that the Illinois and Manhattan planting locations gave higher bio-oil yield than
Hays. Thus, both ecotype and planting location can affect bio-oil yield. Because the sample size
was small, looking at average values instead of individual ecotype or planting location would be
more meaningful. With that in mind, KAW and IL planted in Manhattan or Illinois would be a
better choice for higher bio-oil yield.
a
a
aa
a
ab
ba
ba
bb a
b
0
5
10
15
20
25
30
CKS ecotype EKS ecotype IL ecotype KAW cultivar Average of allecotypes and
cultivarBig bluestem ecotype and cultivar
Bio
-oil
yiel
d (%
)
Hays, KS Manhattan, KS Carbondale, IL
Figure 5.2 Comparisons of bio-oil yield in different planting locations, grouped by ecotype
Different letters above the standard deviation bars indicate that the means of bio-oil yield are
significantly different based on Tukey’s HSD test (p < 0.05)
5.3.2 Effects of ecotype and planting location on bio-oil carbon and oxygen content
In addition to yield, carbon (C) and oxygen (O) contents of bio-oil are also important.
Bio-oil heating value increases as C content increases and O content decreases according to the
Dulong formula (Minowa et al., 1998; Zhong and Wei, 2004). In addition, bio-oil containing less
O is more stable, and vice versa. In this study, the bio-oil C content ranged from 69.8% to

80
77.9%, and O content was between 14.0% and 22.0%. This was consistent with reports from
other researchers in which the typical C and O contents of HTC oil were 65%~83% and
5%~25%, respectively (Huber et al., 2006; Demirbaş et al., 2005; Demirbaş, 2005; Wang et al.,
2008; Gan et al., 2010; Zhang et al., 2011).
Bio-oil C and O contents are shown in Figure 5.3. From Figure 5.3A, ecotype seems to
have affected C content of the bio-oil produced for certain locations; however, the trend was not
consistent for individual ecotypes. For example, the CKS ecotype had the lowest C content in
Hays, but not in the Illinois location. By averaging all three locations, IL ecotype gave the
highest C content whereas CKS and KAW gave the lowest. O content showed a similar trend
(Figure 5.3B), but in an opposite way; that is, IL ecotype gave the lowest O content, and CKS
ecotype and KAW gave the highest. This suggests a negative correlation between C and O
contents of the bio-oil. The optimal ecotype of big bluestem to produce bio-oil with high C and
low O content seems to be the IL ecotype.

81
aba aa aa abb ba baba
aab a
0
10
20
30
40
50
60
70
80
Hays, KS Manhattan, KS Carbondale, IL Average of alllocations
Bio
-oil
C c
ont
ent (
%)
CKS ecotype EKS ecotype IL ecotype KAW cultivarA
a
a
bb aa ab
a aa
aa
aa
b b
0
5
10
15
20
25
30
Hays, KS Manhattan, KS Carbondale, IL Average of alllocations
Planting location of big bluestem
Bio
-oil
O c
on
ten
t (%
)
B
Figure 5.3 Comparisons of bio-oil carbon (A) and oxygen (B) contents of different ecotypes
grouped by planting location
Different letters above the standard deviation bars indicate that the means of C or O contents are
significantly different based on Tukey’s HSD test (p < 0.05)

82
The effect of big bluestem planting location on bio-oil C and O contents can be seen from
Figure 5.4. For all ecotypes except the EKS, no significant difference was observed in bio-oil C
or O contents among different planting locations. Bio-oil produced from EKS ecotype planted in
Hays, KS, contained more C and less O than that planted in Manhattan, KS, or Carbondale, IL.
The Hays planting site had significantly lower precipitation than Manhattan and Carbondale
planting sites in 2010, which might have caused the differences in feedstock chemical
composition (described in section 5.3.3) and consequently different bio-oils. However, the other
ecotypes planted in Hays did not yield significantly different bio-oils from other planting
locations like the EKS ecotype, which suggests that interaction effects may exist between
ecotype and planting location. In other words, different ecotypes might respond to climate
changes in different ways. This conclusion might be biased due to small samples sizes in this
study; therefore, looking at the average elemental compositions of all three ecotypes and KAW,
which are statistically the same in the three planting locations (Figure 5.4), would be more
meaningful.

83
abaa
aa aa aaa a
a a
a
0
10
20
30
40
50
60
70
80
CKS ecotype EKS ecotype IL ecotype KAW cultivar Average of allecotypes and
cultivar
Bio
-oil
C c
onte
nt (
%)
Hays, KS Manhattan, KS Carbondale, ILA
aa
aa
a aa
a
b
a
aa
a
ba
0
5
10
15
20
25
30
CKS ecotype EKS ecotype IL ecotype KAW cultivar Average of allecotypes and
cultivarBig bluestem ecotype and cultivar
Bio
-oil
O c
onte
nt (
%)
B
Figure 5.4 Comparisons of bio-oil C (A) and O (B) contents in different planting locations,
grouped by ecotype
Different letters above the standard deviation bars indicate that the means of C or O contents are
significantly different based on Tukey’s HSD test (p < 0.05)
Effects of ecotype and planting location on bio-oil yield and bio-oil C and O contents
were also analyzed by two-way ANOVA. Based on statistical results summarized in Table 5.2,
bio-oil yield of big bluestem HTC was significantly affected by ecotype (p < 0.05) and planting

84
location (p < 0.01), with the latter being more influential (greater F-value with smaller P-value).
The interaction effect of ecotype and planting location on bio-oil yield was statistically
insignificant (p > 0.05). Bio-oil C and O contents were significantly affected by both ecotype
(p < 0.01) and the interaction between ecotype and planting location (p < 0.05); however,
planting location alone had no significant effect on bio-oil C or O contents.
Table 5.2 Two-way ANOVA test of the effect of ecotype and planting location on bio-oil
yield and elemental composition
Bio-oil yield Bio-oil carbon content Bio-oil oxygen content
Source of variation df F P df F P df F P
Ecotype 3 3.83 .020 3 7.42 .001 3 7.17 .001
Location 2 13.12 .000 2 2.11 .140 2 2.59 .092
Ecotype × location 6 1.83 .127 6 2.71 .032 6 2.68 .033
5.3.3 The effect of ecotype and planting location on big bluestem chemical and
elemental compositions
It was hypothesized in this study that the yield and elemental compositions of bio-oil
were determined by the chemical and elemental compositions of big bluestem feedstock (Table
3), which were influenced by ecotype and/or planting location. By averaging all ecotypes and
cultivar in each planting location, big bluestem planted in Carbondale, IL and Manhattan, KS,
contained higher cellulose and hemicellulose contents than in Hays, KS, whereas lignin contents
of the three planting locations were statistically the same. A positive correlation between the
total amount of cellulose and hemicellulose and bio-oil yield was found (described in section 3.4,
Fig. 5). Furthermore, big bluestem planted in Carbondale, IL and Manhattan, KS contained more
C but less O than in Hays, KS, which may also explain the higher bio-oil yield in the two
locations. A positive correlation between C content and bio-oil yield and a negative correlation
between O content and bio-oil yield were found (described in section 3.4, Fig. 6). The effect of
big bluestem ecotype on its chemical and elemental compositions is dependent on the planting
location. Generally, KAW and the IL ecotype had either higher cellulose content or lower O
content; however, compared with planting location effect, ecotype effect on feedstock
85
composition was not significant. Detailed analysis of the effect of ecotype and planting location
on big bluestem chemical and elemental compositions will be reported in another article in our
series (unpublished data).
5.3.4 Correlations between feedstock compositions and bio-oil yield
A positive linear relationship between bio-oil yield and the total amount of cellulose and
hemicellulose in the feedstock is shown in Figure 5.5. Bio-oil yield generally increased as the
total amount of cellulose and hemicellulose increased. Cellulose and hemicellulose were found
to be able to convert to bio-oil in hot-compressed water at relatively low temperatures (260 to
300 °C) by some other researchers (Minowa et al., 1997; Pińkowska et al., 2011). The relatively
low coefficient of determination (R2 = 0.63) of the linear regression in Figure 5.5 suggests that
bio-oil yield was probably affected by other factors besides the total amount of cellulose and
hemicellulose of the feedstock, such as lignin content. Compared with cellulose and
hemicelluose, lignin is more readily depolymerized (Tymchyshyn and Xu, 2010), but the
decomposition of pure lignin favors the formation of water-soluble organic compounds and solid
residue rather than heavy bio-oil. Furthermore, solid residue is formed by condensation reactions
of the water-soluble organic compounds (Bobleter and Concin, 1979). Demirbaş (2000) also
reported that free phenoxyl radicals derived from lignin decomposition had a random tendency to
form bio-char via condensation or repolymerization; however, bio-oil produced from real
biomass HTC contained significant quantities of phenolic compounds and their derivatives
(Bhaskar et al., 2008; Tymchyshyn and Xu, 2010; Sun et al., 2011), which indicated that lignin
in real biomass contributed greatly to bio-oil production. Roberts and co-workers (2011) reported
that boric acid inhibited the condensation reaction in pure lignin base-catalyzed HTC. Significant
interactions between the biomass chemical compounds in the HTC process may occur because
acetic acid and other organic acids were produced from cellulose and hemicellulose in HTC.
Weak correlation between lignin content and bio-oil yield was found in this study, perhaps
because of the complex reactions in biomass HTC. Minowa and coworkers (1998) also found
that the bio-char yield increased as the biomass lignin content increased, but the correlation
between lignin content and bio-oil yield was weak. The other reason for the weak correlation
might be the narrow lignin content range of big bluestems in this study (16.3% to 19.6%). The
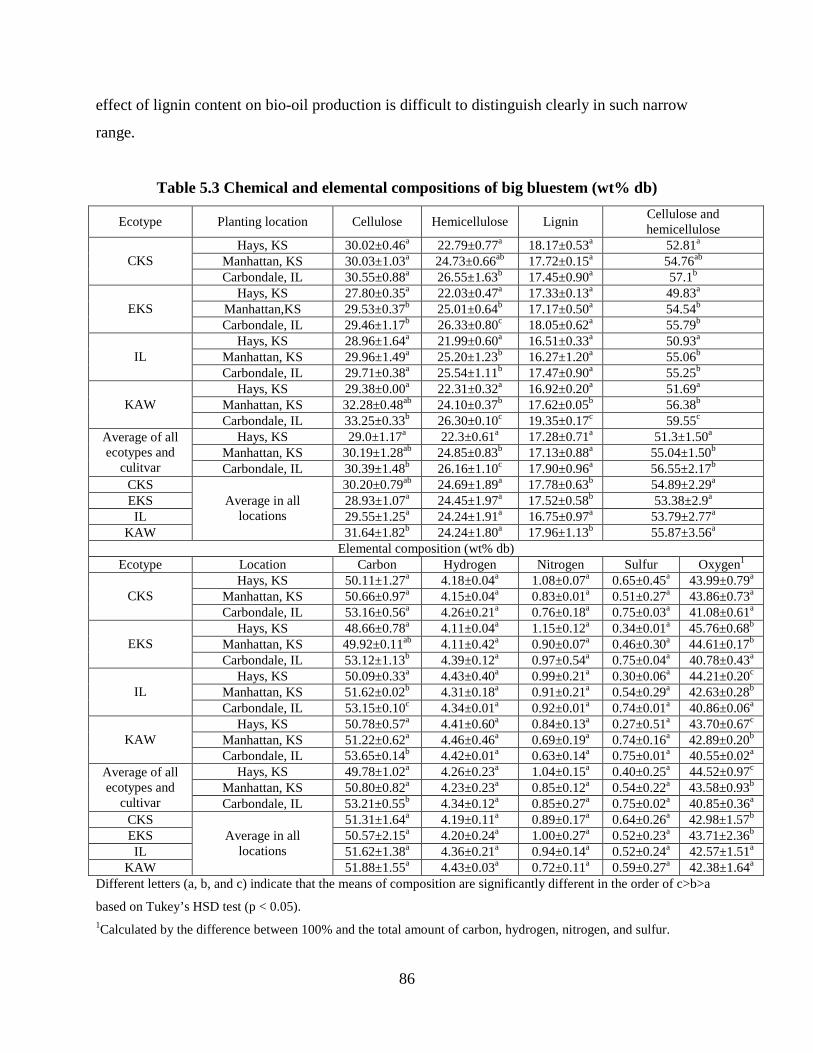
86
effect of lignin content on bio-oil production is difficult to distinguish clearly in such narrow
range.
Table 5.3 Chemical and elemental compositions of big bluestem (wt% db)
Ecotype Planting location Cellulose Hemicellulose Lignin Cellulose and hemicellulose
Hays, KS 30.02±0.46a 22.79±0.77a 18.17±0.53a 52.81a
Manhattan, KS 30.03±1.03a 24.73±0.66ab 17.72±0.15a 54.76ab CKS Carbondale, IL 30.55±0.88a 26.55±1.63b 17.45±0.90a 57.1b
Hays, KS 27.80±0.35a 22.03±0.47a 17.33±0.13a 49.83a
Manhattan,KS 29.53±0.37b 25.01±0.64b 17.17±0.50a 54.54b EKS Carbondale, IL 29.46±1.17b 26.33±0.80c 18.05±0.62a 55.79b
Hays, KS 28.96±1.64a 21.99±0.60a 16.51±0.33a 50.93a
Manhattan, KS 29.96±1.49a 25.20±1.23b 16.27±1.20a 55.06b IL Carbondale, IL 29.71±0.38a 25.54±1.11b 17.47±0.90a 55.25b
Hays, KS 29.38±0.00a 22.31±0.32a 16.92±0.20a 51.69a
Manhattan, KS 32.28±0.48ab 24.10±0.37b 17.62±0.05b 56.38b KAW Carbondale, IL 33.25±0.33b 26.30±0.10c 19.35±0.17c 59.55c
Hays, KS 29.0±1.17a 22.3±0.61a 17.28±0.71a 51.3±1.50a
Manhattan, KS 30.19±1.28ab 24.85±0.83b 17.13±0.88a 55.04±1.50b Average of all ecotypes and
culitvar Carbondale, IL 30.39±1.48b 26.16±1.10c 17.90±0.96a 56.55±2.17b
CKS 30.20±0.79ab 24.69±1.89a 17.78±0.63b 54.89±2.29a
EKS 28.93±1.07a 24.45±1.97a 17.52±0.58b 53.38±2.9a
IL 29.55±1.25a 24.24±1.91a 16.75±0.97a 53.79±2.77a
KAW
Average in all locations
31.64±1.82b 24.24±1.80a 17.96±1.13b 55.87±3.56a
Elemental composition (wt% db) Ecotype Location Carbon Hydrogen Nitrogen Sulfur Oxygen1
Hays, KS 50.11±1.27a 4.18±0.04a 1.08±0.07a 0.65±0.45a 43.99±0.79a
Manhattan, KS 50.66±0.97a 4.15±0.04a 0.83±0.01a 0.51±0.27a 43.86±0.73a CKS Carbondale, IL 53.16±0.56a 4.26±0.21a 0.76±0.18a 0.75±0.03a 41.08±0.61a
Hays, KS 48.66±0.78a 4.11±0.04a 1.15±0.12a 0.34±0.01a 45.76±0.68b
Manhattan, KS 49.92±0.11ab 4.11±0.42a 0.90±0.07a 0.46±0.30a 44.61±0.17b EKS Carbondale, IL 53.12±1.13b 4.39±0.12a 0.97±0.54a 0.75±0.04a 40.78±0.43a
Hays, KS 50.09±0.33a 4.43±0.40a 0.99±0.21a 0.30±0.06a 44.21±0.20c
Manhattan, KS 51.62±0.02b 4.31±0.18a 0.91±0.21a 0.54±0.29a 42.63±0.28b IL Carbondale, IL 53.15±0.10c 4.34±0.01a 0.92±0.01a 0.74±0.01a 40.86±0.06a
Hays, KS 50.78±0.57a 4.41±0.60a 0.84±0.13a 0.27±0.51a 43.70±0.67c
Manhattan, KS 51.22±0.62a 4.46±0.46a 0.69±0.19a 0.74±0.16a 42.89±0.20b KAW Carbondale, IL 53.65±0.14b 4.42±0.01a 0.63±0.14a 0.75±0.01a 40.55±0.02a
Hays, KS 49.78±1.02a 4.26±0.23a 1.04±0.15a 0.40±0.25a 44.52±0.97c
Manhattan, KS 50.80±0.82a 4.23±0.23a 0.85±0.12a 0.54±0.22a 43.58±0.93b Average of all ecotypes and
cultivar Carbondale, IL 53.21±0.55b 4.34±0.12a 0.85±0.27a 0.75±0.02a 40.85±0.36a
CKS 51.31±1.64a 4.19±0.11a 0.89±0.17a 0.64±0.26a 42.98±1.57b
EKS 50.57±2.15a 4.20±0.24a 1.00±0.27a 0.52±0.23a 43.71±2.36b
IL 51.62±1.38a 4.36±0.21a 0.94±0.14a 0.52±0.24a 42.57±1.51a
KAW
Average in all locations
51.88±1.55a 4.43±0.03a 0.72±0.11a 0.59±0.27a 42.38±1.64a
Different letters (a, b, and c) indicate that the means of composition are significantly different in the order of c>b>a
based on Tukey’s HSD test (p < 0.05). 1Calculated by the difference between 100% and the total amount of carbon, hydrogen, nitrogen, and sulfur.

87
Y = 0.6354X - 10.324
R2 = 0.63
18
20
22
24
26
28
48 50 52 54 56 58 60
Total amount of cellulose and hemicellulose of big bluestem
Bio
-oil
yiel
d (%
)Hays, KS Manhattan, KS Carbondale, IL Linear (All)
Figure 5.5 Effect of the total amount of cellulose and hemicellulose in big bluestem on bio-
oil yield
The effect of big bluestem C and O contents on bio-oil yield is evident in Figure 5.6.
Higher C content or lower O content, which usually correlate with each other, gave higher bio-
oil yield and explained 58 and 54% of the variation in bio-oil yield, respectively. Heavy bio-oil
produced from biomass HTC mainly consists of high molecular weight organic compounds such
as phenolic compounds and their derivatives, long-chain carboxylic acids/esters, and long-chain
hydrocarbons (Bhaskar et al., 2008; Sun et al., 2011). Biomass C is the main source of produced
heavy bio-oil.

88
Y= 1.0479C - 29.512
R2 = 0.58
18
20
22
24
26
28
48 49 50 51 52 53 54Big bluestem carbon content (%)
Bio
-oil
yiel
d (
%)
Hays, KS Manhattan, KS Carbondale, IL Linear (All)A
Y= -0.935O+ 64.412
R2 = 0.54
18
20
22
24
26
28
40 41 42 43 44 45 46Big bluestem oxygen content (%)
Bio
-oil
yiel
d (%
)
B
Figure 5.6 Effect of big bluestem C content (A) and O content (B) on bio-oil yield

89
Correlations between bio-oil yield and the contents of cellulose, hemicellulose, and
lignin, as well as C and O contents of the feedstock were also analyzed by SPSS Pearson’s
correlation. Correlations between bio-oil yield and the contents of cellulose and hemicellulose
were significant at the 0.05 level, and the correlation coefficients (r) were 0.67 and 0.70,
respectively. Furthermore, a strong positive correlation between bio-oil yield and the total
amount of cellulose and hemicellulose was found (r = 0.79, significant at the 0.01 level), which
is consistent with Figure 5.5. The correlation between bio-oil yield and lignin content is weak
and insignificant with a correlation coefficient of 0.14; however, considering the narrow range of
lignin content in the selected big bluestem samples (16.3% to 19.4% in Table 5.3), the
correlation is not reliable enough to exclude the effect of lignin content on bio-oil yield. The
positive correlation between big bluestem C content and bio-oil yield (r = 0.75, significant at the
0.01 level) and the negative correlation between big bluestem O content and bio-oil yield
(r = -0.72, significant at the 0.01 level) are also consistent with the findings from Figure 5.6.
5.3.5 Comparison of bio-oil production from big bluestem, switchgrass, and
corncobs
Table 5.4 summarizes the yield and elemental composition of bio-oils generated from big
bluestem, switchgrass, and corncobs. When the highest-yielding big bluestem (KAW planted in
Carbondale, IL) was used in statistical analysis, big bluestem had bio-oil yield similar to
corncobs, and yield was significantly higher than that from switchgrass. However, bio-oil from
KAW big bluestem planted in Carbondale, IL, had the lowest C and the highest O contents
compared with those from switchgrass and corncobs. When the average bio-oil yield and
elemental composition of all big bluestems were used, bio-oil yield of big bluestem and
switchgrass had no significant difference, but both were lower than that of corncobs. Bio-oils
produced from the three types of biomass were statistically the same in both C and O contents.
This is the first data set, to the best of our knowledge, that provides fundamental information
about the potential of big bluestem to be developed as a biofuel feedstock and how it compares
with more widely used crops such as switchgrass.
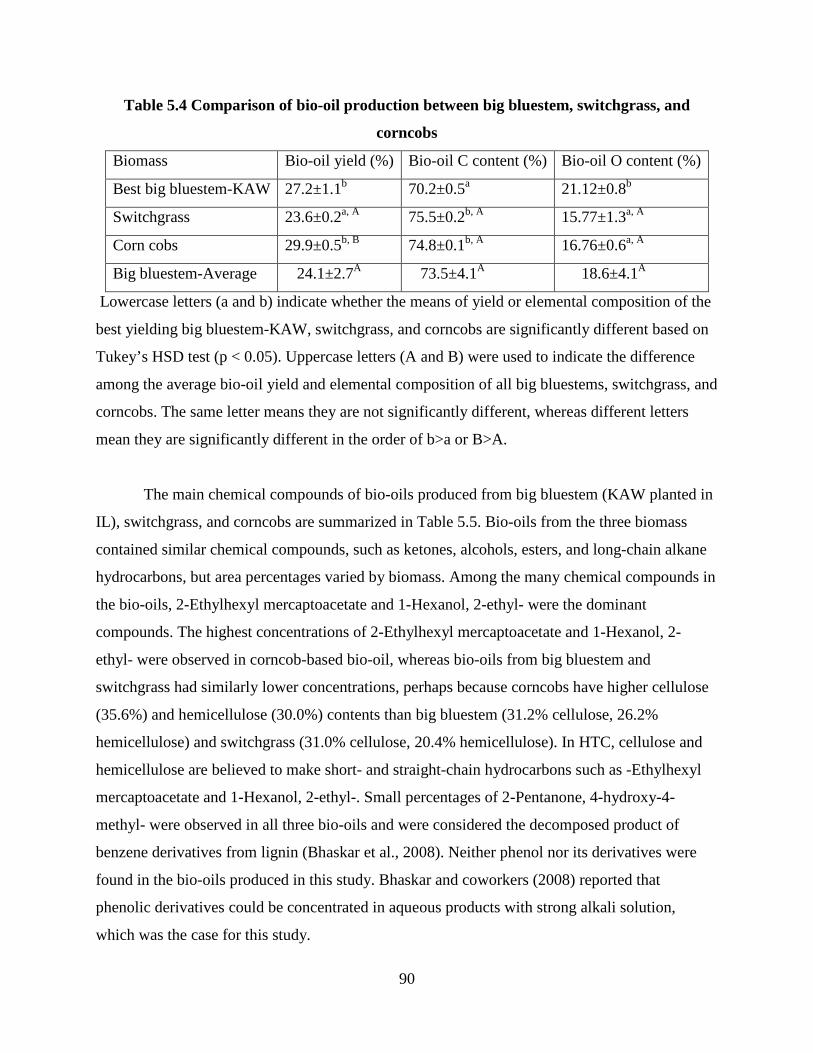
90
Table 5.4 Comparison of bio-oil production between big bluestem, switchgrass, and
corncobs
Biomass Bio-oil yield (%) Bio-oil C content (%) Bio-oil O content (%)
Best big bluestem-KAW 27.2±1.1b 70.2±0.5a 21.12±0.8b
Switchgrass 23.6±0.2a, A 75.5±0.2b, A 15.77±1.3a, A
Corn cobs 29.9±0.5b, B 74.8±0.1b, A 16.76±0.6a, A
Big bluestem-Average 24.1±2.7A 73.5±4.1A 18.6±4.1A
Lowercase letters (a and b) indicate whether the means of yield or elemental composition of the
best yielding big bluestem-KAW, switchgrass, and corncobs are significantly different based on
Tukey’s HSD test (p < 0.05). Uppercase letters (A and B) were used to indicate the difference
among the average bio-oil yield and elemental composition of all big bluestems, switchgrass, and
corncobs. The same letter means they are not significantly different, whereas different letters
mean they are significantly different in the order of b>a or B>A.
The main chemical compounds of bio-oils produced from big bluestem (KAW planted in
IL), switchgrass, and corncobs are summarized in Table 5.5. Bio-oils from the three biomass
contained similar chemical compounds, such as ketones, alcohols, esters, and long-chain alkane
hydrocarbons, but area percentages varied by biomass. Among the many chemical compounds in
the bio-oils, 2-Ethylhexyl mercaptoacetate and 1-Hexanol, 2-ethyl- were the dominant
compounds. The highest concentrations of 2-Ethylhexyl mercaptoacetate and 1-Hexanol, 2-
ethyl- were observed in corncob-based bio-oil, whereas bio-oils from big bluestem and
switchgrass had similarly lower concentrations, perhaps because corncobs have higher cellulose
(35.6%) and hemicellulose (30.0%) contents than big bluestem (31.2% cellulose, 26.2%
hemicellulose) and switchgrass (31.0% cellulose, 20.4% hemicellulose). In HTC, cellulose and
hemicellulose are believed to make short- and straight-chain hydrocarbons such as -Ethylhexyl
mercaptoacetate and 1-Hexanol, 2-ethyl-. Small percentages of 2-Pentanone, 4-hydroxy-4-
methyl- were observed in all three bio-oils and were considered the decomposed product of
benzene derivatives from lignin (Bhaskar et al., 2008). Neither phenol nor its derivatives were
found in the bio-oils produced in this study. Bhaskar and coworkers (2008) reported that
phenolic derivatives could be concentrated in aqueous products with strong alkali solution,
which was the case for this study.

91
Table 5.5 Identification of compounds by GC-MS in bio-oil from big bluestem, switchgrass,
and corncobs
Area (%)
No. RT
(min) Name of compound
Molecular
formula Big
bluestem Switchgrass Corncobs
1 5.8 3-Penten-2-one, 4-
methyl- C6H10O 1.5 4.6 -
2 6.4 2-Pentanone, 4-hydroxy-
4-methyl-
C6H12O2
3.7 5.8 3.6
3 9.3 1-Hexanol, 2-ethyl- C8H18O 21.1 20.9 30.1
4 15.0 2-Ethylhexyl
mercaptoacetate C10H20O2S 33.0 25.6 48.3
5 17.1 Diethyl Phthalate C12H14O4 2.05 0.55 0.51
6 22.8 Hexadecane C16H34 - 3.36 -
7 22.9 Nonadecane C19H40 8.93 - 3.19
5.4 Conclusions
Bio-oil yield of big bluestem HTC was significantly affected by both ecotype and
planting location, but the latter was more influential. The interaction effect between ecotype and
planting location on bio-oil yield was statistically insignificant (p > 0.05). Bio-oil C and O
contents were significantly affected mainly by ecotype (p < 0.01) and sometimes by the
interaction between ecotype and planting location (p < 0.05); however, planting location alone
had no significant effect on bio-oil C or O contents. Big bluestem and switchgrass have similar
potential for bio-oil production via HTC in terms of bio-oil yield, bio-oil C and O content.
92
References
Bhaskar, T., Sera, A., Muto, A., and Sakata, Y. (2008). Hydrothermal upgrading of wood biomass: Influence of the addition of K2CO3 and cellulose/lignin ratio. Fuel 87, 2236–2242.
Bobleter, O., and Concin, R. (1979). Degradation of poplar lignin by hydrothermal treatment. Cellul. Chem. Technol. 13, 583–593.
Czernik, S., and Bridgwater, A.V. (2004). Overview of applications of biomass fast pyrolysis oil. Energy Fuels 18(2), 590–598.
Demirbaş, A. (2000). Mechanisms of liquefaction and pyrolysis reactions of biomass. Energy Convers. Manage. 41, 633–646.
Demirbaş, A., Balat, M., and Bozbaş, K. (2005). Direct and catalytic liquefaction of wood species in aqueous solution. Energy Sources 27, 271–277.
Demibaş, A. (2005).Thermochemical conversion of biomass to liquid products in the aqueous medium. Energy Sources 27, 1235–1243.
Epstein, H. E., Lauenroth, W. K., Burke, I. C., and Coffin, D. P. (1998). Regional productivities of plant species in the great plains of the United States. Plant Ecology 137(2), 173–195.
Gan, J., Yuan , W., Nelson, N. O., and Agudelo, S. C. (2010). Hydrothermal conversion of corn cobs and crude glycerol. Biol. Eng. 2(4), 197–210.
Garcia Alba, L., Torri, C., Samorì C., Van Der Spek, J., Fabbri, D., Kersten, S. R. A., and Brilman, D. W. F. (2012). Hydrothermal treatment (HTT) of microalgae: evaluation of the process as conversion method in an algae biorefinery concept. Energy Fuels 26, 642-657.
Ghannoum, O. (2009). C(4) photosynthesis and water stress. Annals of Botany 103(4), 635–644.
Huber, G. W., Dumesic, J. A. (2006). An overview of aqueous-phase catalytic processes for production of hydrogen and alkanes in a biorefinery. Catal. Today 111(1–2), 119–132.
Jefferson, P. G., McCaughey, W. P., May, K., Woosaree, J., MacFarlane, L., and Wright, S. M. B. (2002). Performance of American native grass cultivars in the Canadian prairie provinces. Native Plants Journal 3, 24–33.
Jefferson, P. G., McCaughey, W. P., May, K., Woosaree, J., and McFarlane, L. (2004). Potential utilization of native prairie grasses from western Canada as ethanol feedstock. Can. J. Plant Sci. 84, 1067–1075.
Johnson, L. C., and Matchett, J. R. (2001). Fire and grazing regulate belowground processes in tallgrass prairie. Ecology 82, 3377–3389.

93
Jung, H. J. G., and Vogel, K. P. (1992). Lignification of switchgrass (Panicum virgatum) and big bluestem (Andropogon gerardii) plant parts during maturation and its effect on fiber degradability. J. Sci. Food Agric. 59(2), 169–176.
Knapp, A. K. (1985). Effect of fire and drought on the ecophysiology of andropogon gerardii and panicum virgatum in a tallgrass prairie. Ecology 66, 1309–1320.
Knapp, A. K., Briggs, J. M., Hartnett, D. C., and Collins, S. L. (1998). Grassland Dynamics: Long-Term Ecological Research in Tallgrass Prairie. Oxford University Press, New York.
Luo, J., Xu, Y., Zhao, L., Dong, L., Tong, D., Zhu, L., and Hu, C. (2010). Two-step hydrothermal conversion of Pubescens to obtain furans and phenol compounds separately. Bioresour. Technol. 101, 8873-8880.
McMillan, C. (1965a). Ecotypic differentiation within four North American prairie grasses. II. Behavioral variation within transplanted community fractions. Am. J. Bot. 52(1), 55-65.
McMillan, C. (1965b). Grassland community fractions from central North America simulated climates. Am. J. Bot. 52(2), 109-116.
Minowa, T., Zhen, F., and Ogi, T. (1997). Liquefaction of cellulose in hot compressed water using sodium carbonate: products distribution at different reaction temperatures. J. Chem. Eng. Jpn. 30, 186-190.
Minowa, T., Kondo, T., Sudirjo, S.T. (1998). Thermochemical liqufaction of Indonesian biomass residues. Biomass Bioenergy 14, 517-524.
Peterson, A. A., Vogel, F., Lachance, R. P., Froling, M., Antal Jr, M. J., and Tester, J. W. (2008). Thermochemical biofuel production in hydrothermal media: a review of sub- and supercritical water technologies. Energy Environ. Sci. 1, 32-65.
Pińkowska, H., Wolak, P., and Zlocińska, A. (2011). Hydrothermal decomposition of xylan as a model substance for plant biomass waste-Hydrothermolysis in subcritical water. Biomass Bioenergy 35, 3902-3912.
Roberts, V. M., Stein, V., Reiner, T., Lemonidou, A., Li, X., and Lercher, J. A. (2011). Towards quantitative catalytic lignin depolymerization. Chem.--Eur. J. 17, 5939-5948.
Sluiter, A., Ruiz, R., Scarlata, C., Sluiter, J., and Templeton, D. (2005). Determination of extractives in biomass. NREL/TP-510-42619. Golden, Colo.: National Renewable Energy Laboratory.
Sluiter, A., Hames, B., Ruiz, R., Scarlata, C., Sluiter, J., Templeton, D., and Crocker, D. (2008). Determination of structural carbohydrates and lignin in biomass. NREL/TP-510-42618. Golden, Colo.: National Renewable Energy Laboratory.

94
Sun, P., Heng, M., Sun, S. H., and Chen, J. (2011). Analysis of liquid and solid products from liquefaction of paulownia in hot-compressed water. Energy Conver. Manage. 52, 924-933.
Tymchyshyn, M., and Xu, C. (2010). Liquefaction of bio-mass in hot-compressed water for the production of phenolic compounds. Bioresour. Technol. 101, 2483-2490.
Vardon, D. R., Sharma, B. K., Blazina, G. V., Rajagopalan, K., Strathmann, T. J. (2012). Thermochemical conversion of raw and defatted algal biomass via hydrothermal liquefaction and slow pyrolysis. Bioresour. Technol. 109, 178-187.
Wang, C., Pan. J., Li, J., and Yang, Z. (2008). Comparative studies of products produced from four different biomass samples via deoxy-liquefaction. Bioresour. Technol. 99, 2778-2786.
Weaver, J. E., and Fitzpatrick, T. J. (1932). Ecology and relative importance of the dominants of tallgrass prairie. Botanical Gazette 93, 113-150.
Zhang, L., Champagne, P., and Xu, C. (2011). Bio-crude production from secondary pulp/paper-mill sludge and waste newspaper via co-liquefaction in hot-compressed water. Energy 36, 2142-2150.
Zhong, C., and Wei, X. (2004). A comparative experimental study on the liquefaction of wood. Energy 29, 1731-41.

95
Chapter 6 - Hydrothermal Conversion of Cellulose, Hemicellulose,
and Lignin: Influence of Operating Conditions and Their
Interactions
Abstract
The effects of reaction temperature, retention time, feedstock content, and catalyst
loading on pure cellulose, D-xylose (model of hemicellulose) and lignin HTC were investigated.
The maximum bio-oil yields of 21.4% and 19% were obtained from cellulose and D-xylose,
respectively, at 300°C for 20min with 10% feedstock loading and 0.5% sodium hydroxide.
However, little bio-oil was produced from lignin in this study. The interaction effect between the
three components in HTC process also was studied using their mixture as feedstock. The results
showed that there was positive interaction between cellulose and lignin, but negative interaction
between cellulose and D-xylose. No significant interaction was found between D-xylose and
lignin. Hydrothermal conversion of seven real biomass (corn cobs, big bluestem, switchgrass,
pine, cherry, pecan, and hazelnut shell) and their model biomass also was carried out to study the
effect of biomass chemical composition on bio-oil yield. As the total amount of cellulose and
hemicellulose increased, bio-oil yield generally increased when real biomass was used, but
decreased when low lignin content of model biomass was used.

96
6.1 Introduction
Biofuels produced from lignocellulosic biomass have received great interest because
lignocellulosic biomass is abundant, renewable, and environmental friendly. In the US, about 1.3
billion dry tons of lignocellulosic biomass can be sustainably produced annually (Perlack et al.,
2005). Hydrothermal conversion (HTC) is a promising technique to produce biofuels from
lignocellulosic biomass, which can be operating at relatively low temperature without feedstock
drying step owing to the use of hot compressed water or other solvents as reaction medium. HTC
is a chemical reforming process, in which gases, water-soluble matters, bio-oil, and char are
produced from biomass in a heated, pressurized, and oxygen-absent enclosure in the present of
water or other solvents. via hydrolysis, depolymerization, repolymerization, and condensation
(Ocfmia et al., 2006). Bio-oil produced from biomass HTC is an alternative for fossil fuel, which
can be used as a fuel for stationary diesel engines, burners, boilers or turbines (Czernik and
Bridgwater, 2004), or be upgraded to transportation fuels (e.g., gasoline and diesel) or products
such as polymers, aromatics, lubricants and asphalt (Peterson et al., 2008).
The three major chemical compositions of lignocellulosic biomass are cellulose,
hemicellose, and lignin. Forest biomass is typically composed of 40-45% cellulose, 15-35%
hemicellulose and 20-35% lignin. Agricultural wastes generally contain 40% cellulose, 20-25%
hemicelllulose and 10-20% lignin (Tymchyshyn and Xu, 2010). It is believed that the
composition of lignocellulosic biomass had significant effect on its hydrothermal decomposition
in the aspect of optimal operating conditions, bio-oil yield and bio-oil components. The optimal
temperature for bio-oil production from woody biomass HTC at the absence of catalyst shifted to
a higher value as biomass lignin content increased (Zhong and Wei, 2004). As cellulose and
hemicellulose content increased, bio-oil yield increased when woody biomass was used as
feedstock at neutral conditions (Zhong and Wei, 2004; Demirbaş, 2005; Demirbaş et al., 2005;
Bhaskar et al., 2008). However, bio-oil yield increased with increasing lignin content at alkaline
condition (Minowa et al., 1998a). Furthermore, more acetic acid was obtained from cellulose
rich biomass, but lignin rich biomass produced more phenolic hydrocarbons and derivatives
(Bhaskar et al., 2008). Therefore, in order to better understand lignocellulosic biomass HTC, it is
necessary to investigate the hydrothermal decomposition behaviors of the three components and
their interactions.

97
Cellulose is composed of D-glucose units, which are linked by ß-(1→4) glycosidic
bonds. Much work has been done on the kinetics and mechanisms of cellulose decomposition
under hot-compressed water (Kamio et al., 2008a; 2008b; Kabyemela et al., 1998; Sasaki et al.,
1998; 2000; 2002; 2004). The composition of the aqueous products was analyzed for proposing
the reaction pathway. However, they did not pay attention to bio-oil production from cellulose
HTC. Minowa and co-workers (1997; 1998b; 1998c) investigated the effect of reaction
temperature on cellulose HTC products distribution under alkali condition or catalyst-free
condition. They reported that the highest heavy oil yield from cellulose HTC was obtained
around 300°C, and alkali catalyst suppressed the formation of char from oil. However,
Tymchyshyn and Xu (2010) found that bio-oil yield from cellulose HTC decreased as
temperature increased from 250 to 350°C. The effects of alkalinity on reaction pathway of
cellulose HTC were studied by Yin et al., (2011). They found that alkaline pathway was involved
under initial strong alkaline conditions, acidic and alkaline pathways simultaneously occurred
under initial weak alkaline conditions. The major compounds of bio-oil produced from cellulose
HTC were esters of complex organic acids and long chain hydrocarbons (Tymchyshyn and Xu,
2010; Karagöz et al., 2005).
Hemicellulose is a polysaccharide that contains pentoses (xylose, arabinose), hexoses
(mannose, glucose, and galactose) and uronic acids, in which, xylose always presents in the
largest amount. Hydrothermal decomposition of xylan as a model substance for hemicellulose
was carried out in sub-critical water by Pińkowska et al., (2011). No bio-oil was produced from
xylan when reaction temperature was lower than 260°C. As temperature further increased to
300°C, bio-oil yield slightly increased to 4.3%.
The chemical structure of lignin is more complex than cellulose and hemicelluloses. It is
composed of paracoumaryl alcohol, confieryl alcohol and shinapyl alcohol, which are crossing
linked by ether. The decomposition of lignin or its model compounds has been carried out in
supercritical water (Wahyudiono et al., 2008; Funazukuri et al., 1990). They found that water
density had significant effect on the products distribution of lignin HTC. As water density
increased, bio-oil yield increased but char yield decreased. During lignin HTC, the hydrolysis is
an important reaction, but char is easily formed duo to the condensation of intermediates. The
use of supercritical water-phenol mixtures in lignin HTC is an effective method to suppress char
formation (Lin et al., 1997a; 1997b; Saisu et al., 2003). They reported that phenol could prevent

98
the char formation by condensation reaction. Furthermore, bio-oil production from lignin HTC
also was investigated at low temperature (Karagöz et al., 2005; Tymchyshyn and Xu, 2010).
They found that the yield of bio-oil was relative low, and its main components were phenolic and
benzene derivatives.
Although the HTC of the three main components of lignocellulosic biomass was
investigated by some many researchers, the information about the effect of operating conditions
and component proportion of lignocellulosic biomass on bio-oil production via HTC is not
sufficient, and a satisfactory relationship between the HTC of the three components and biomass
has not yet been established. The objectives of this study were are to 1) examine the effect of
operating conditions including reaction temperature, retention time, biomass content, and
catalyst loading on bio-oil production from cellulose, hemicellulose, and lignin HTC; 2)
investigate the interactions between the three components; 3) investigate the relationship
between lignocellulosic biomass HTC and the three components HTC.
6.2 Materials and Methods
6.2.1 Materials
α-cellulose power (C8002) was obtained from Sigma-Aldrich Co., Ltd. D-xylose with a
purity of 99% (H193) was used as a hemicellulose model, which was obtained from Cascade
Analytical Reagents & Biochemicals. Alkali lignin with low sulphonate content (471003) was
purchased from Sigma-Aldrich Co., Ltd. Seven lignocellulosic biomass (corn cobs, switchgrass,
big bluestem, cherry wood, pecan wood, pine, and hazelnut shell) were also used. Commercially
available corncobs were obtained from Kaytee Products, Inc. (Chilton, WI). Switchgrass
(Panicum virgatum-Kanlow) was grown and harvested at the Kansas State University Agronomy
Farm in Manhattan, KS. Big bluestem originated from Carbondale, Illinois was planted at USDA
Plant Material Center, Manhattan, KS. Wood chips of cherry, pecan, and pine were purchased
from Ace Hardware. Hazelnut shell was peeled from hazelnuts obtained from Nuts Company.
Each biomass was ground in a Retsch SM2000 rotary cutting mill (Retsch Inc., Newtown, PA)
with a 1.0-mm screen. After grinding, each sample was manually mixed thoroughly. Samples
were dried at 105°C for 24h before use in the experiments.

99
6.2.2 HTC apparatus and experimental procedure
In a typical test, feedstock, sodium hydroxide as the catalyst, and deionized water were
placed in a 1.8 L Parr model 4578 high-temperature high-pressure reactor (Parr Instrument
Company, Moline, IL). The reactor was heated to the desired temperature and then kept for
desired time. Then the reactor was cooled to room temperature by tap water through the
serpentine cooling coil. After the reaction, gaseous products were vented from the gas outlet
valve. The solid and aqueous products were collected from the reactor and separated by vacuum
filtration with Whatman Grad No.1 filter paper. When pure lignin was alone used as feedstock,
the solid and aqueous products collected were acidified to pH ~ 1-2 with 10 wt% HCL before
vacuum filtration to precipitate the unconverted lignin and high molecular lignin cleavage
products (Roberts et al., 2011). Then, the water-insoluble fraction and the reactor were washed
by acetone. The solvent insoluble portion was separated through vacuum filtration and then dried
to obtain residual solid, called bio-char. The solvent soluble portion is then evaporated in a rotary
evaporator (Buchi RE-111, Flawil, Switzerland) at 60°C to remove acetone, and the remaining
product is water insoluble bio-oil. The bio-oil yield was defined as follows: Bio-oil yield (%) =
(weight of bio-oil)/(weight of feedstock) × 100%. More details of the experimental apparatus and
procedure can be found in one of our previous papers (Gan et al., 2010).
6.2.3 Analytical tests
Chemical composition of biomass was determined according to the laboratory analytical
procedures developed by the National Renewable Energy Laboratory (Sluiter et al., 2005; Sluiter
et al., 2008). Briefly, after water and ethanol extraction, the sample was soaked in 72% sulfuric
acid at 30 °C for 1 h with constant stirring, followed by dilution to a 4% acid solution and
heating for another hour at 120 °C. The aqueous products and solid residue of the pretreatment
process were separated by vacuum filtration. The filtrate was adjusted to neutral by calcium
carbonate, then the sugar contents of the filtrate were measured by high-performance liquid
chromatography (Shimadzu, Kyoto, Japan), and acid-soluble lignin content in the filtrate was
detected by a UV-visible spectrophotometer (BioMate 3, Thermo Electron Corporation,
Madison, WI). The solid residue was dried and combusted. The weight difference between the
dry residue and combustion residue was reported as acid-insoluble lignin.
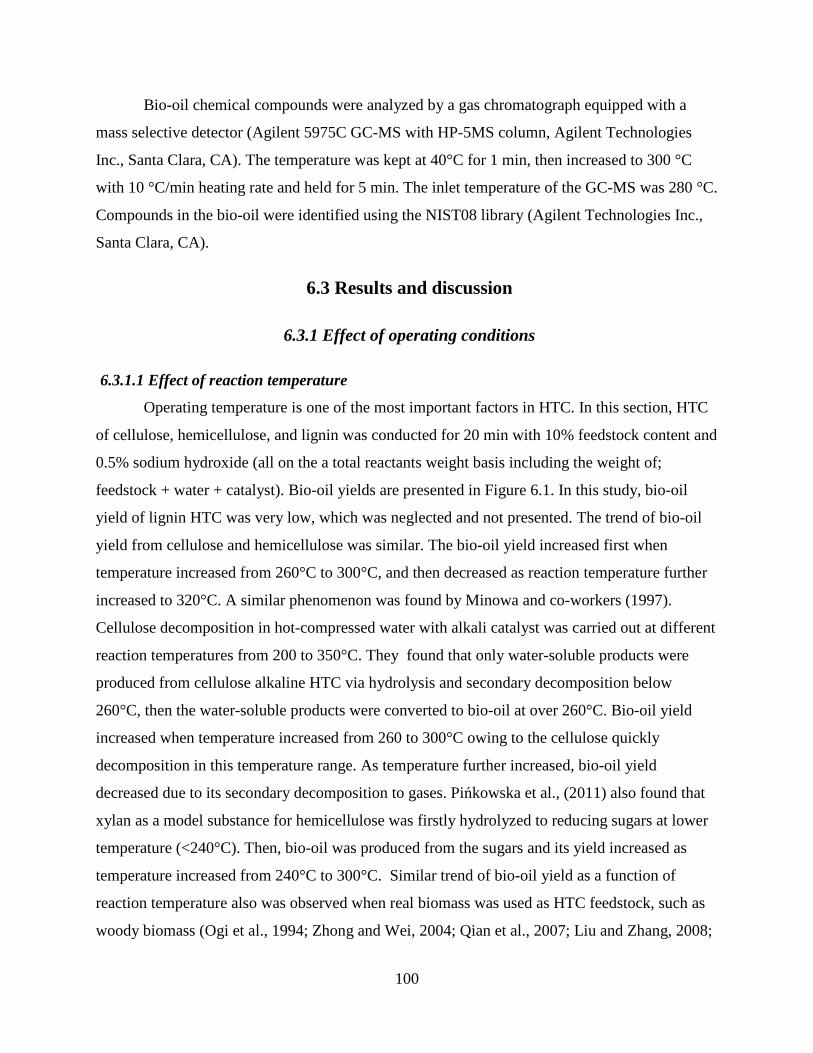
100
Bio-oil chemical compounds were analyzed by a gas chromatograph equipped with a
mass selective detector (Agilent 5975C GC-MS with HP-5MS column, Agilent Technologies
Inc., Santa Clara, CA). The temperature was kept at 40°C for 1 min, then increased to 300 °C
with 10 °C/min heating rate and held for 5 min. The inlet temperature of the GC-MS was 280 °C.
Compounds in the bio-oil were identified using the NIST08 library (Agilent Technologies Inc.,
Santa Clara, CA).
6.3 Results and discussion
6.3.1 Effect of operating conditions
6.3.1.1 Effect of reaction temperature
Operating temperature is one of the most important factors in HTC. In this section, HTC
of cellulose, hemicellulose, and lignin was conducted for 20 min with 10% feedstock content and
0.5% sodium hydroxide (all on the a total reactants weight basis including the weight of;
feedstock + water + catalyst). Bio-oil yields are presented in Figure 6.1. In this study, bio-oil
yield of lignin HTC was very low, which was neglected and not presented. The trend of bio-oil
yield from cellulose and hemicellulose was similar. The bio-oil yield increased first when
temperature increased from 260°C to 300°C, and then decreased as reaction temperature further
increased to 320°C. A similar phenomenon was found by Minowa and co-workers (1997).
Cellulose decomposition in hot-compressed water with alkali catalyst was carried out at different
reaction temperatures from 200 to 350°C. They found that only water-soluble products were
produced from cellulose alkaline HTC via hydrolysis and secondary decomposition below
260°C, then the water-soluble products were converted to bio-oil at over 260°C. Bio-oil yield
increased when temperature increased from 260 to 300°C owing to the cellulose quickly
decomposition in this temperature range. As temperature further increased, bio-oil yield
decreased due to its secondary decomposition to gases. Pińkowska et al., (2011) also found that
xylan as a model substance for hemicellulose was firstly hydrolyzed to reducing sugars at lower
temperature (<240°C). Then, bio-oil was produced from the sugars and its yield increased as
temperature increased from 240°C to 300°C. Similar trend of bio-oil yield as a function of
reaction temperature also was observed when real biomass was used as HTC feedstock, such as
woody biomass (Ogi et al., 1994; Zhong and Wei, 2004; Qian et al., 2007; Liu and Zhang, 2008;

101
Xu and Lad, 2008), rice staw (Yuan et al., 2007), and secondary pulp/paper sludge powder (Xu
and Lancaster 2008). As temperature increases, depolymerization of the biomass into a liquid
oil-rich phase becomes possible. But a further increase of the temperature might promote
decomposition of these fragments into gaseous products and repolymerization or condensation of
the intermediates into chars (Yuan et al., 2009; Minowa et al., 1998a). As shown in Figure 6.1,
the maximum bio-oil yields of cellulose and hemicellulose were 21.4% and 19%, respectively,
which were both obtained at 300°C.
12
14
16
18
20
22
260 280 300 320Temperature (°C)
Bio
-oil
yiel
d(%
)
Figure 6.1 Effect of operating temperature on bio-oil production from cellulose (▲) and
xylose (■) hydrothermal conversion
(20min retention time, 10% biomass content, 0.5% catalyst loading)
6.3.1.2 Effect of retention time
In this experiment, HTC was conducted at 300°C with 10% feedstock content and 0.5%
sodium hydroxide. Effects of retention time on bio-oil yields are shown in Figure 6.2. For both
cellulose and hemicellulose, retention time had no significant effect on bio-oil yield at shorter
retention time. As retention time increased from 10 min to 20 min, bio-oil yield increased
rapidlyfast, but then decreased at a prolonged retention time, which could be explained by the
cracking of bio-oil or intermediate products to gases and formation of chars by condensation,
cyclization, and repolymerization (Xu and Etcheverry, 2008; Li et al., 2009). In this step, the
maximum bio-oil yields of cellulose and hemicellulose were 21.4% and 19%, respectively,
which were both obtained at 20min.

102
12
14
16
18
20
22
0 10 20 30Retention time (min)
Bio
-oil
yiel
d (%
)
Figure 6.2 Effect of retention time on bio-oil production from cellulose (▲) and xylose (■)
hydrothermal conversion
(300°C, 10% biomass content, 0.5% catalyst loading)
6.3.1.3 Effect of feedstock content
In this experiment, the reactor was loaded with 500 g of reactants, which included
5%-20% feedstock, 0.5% sodium hydroxide (all on a total reactant weight basis), and relevant
amount of deionized water. The HTC experiments were carried out at 300°C for 20min. The
effect of feedstock content on bio-oil yield is shown in Figure 6.3. When feedstock content
increased from 5% to 10%, bio-oil yield of cellulose HTC increased from 16.0% to 21.4%, and
increased from 13.3% to 19.0% for xylose HTC. As feedstock content further increased, bio-oil
yield of cellulose HTC slowly decreased, but bio-oil yield of xylose HTC sharply decreased. It is
speculated that higher water content improves gas and aqueous products formation and biomass
depolymerization, and vice versa. Previous researchers reported that liquefaction yield decreased
as biomass ratio increased because of the decreasing water content (Yu et al., 2007). In this
study, the highest bio-oil yield of cellulose and hemicellulose HTC were 21.4% and 19%,
respectively, which were both obtained at 10% feedstock content.
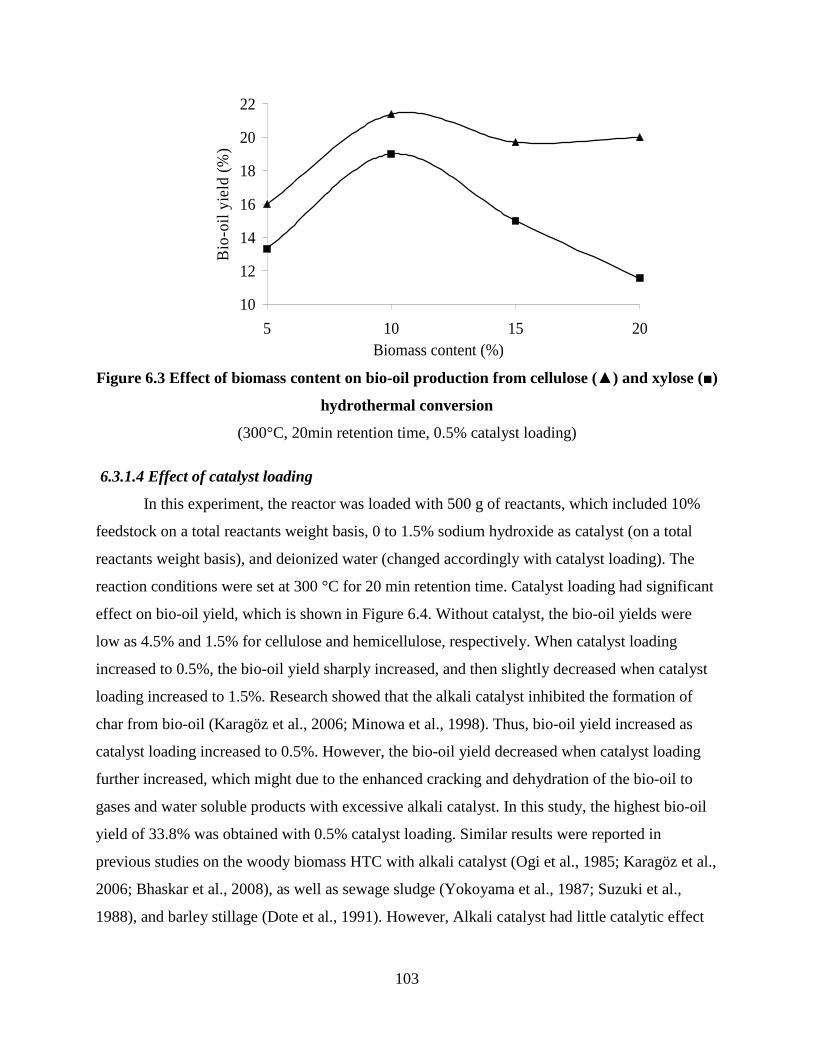
103
10
12
14
16
18
20
22
5 10 15 20Biomass content (%)
Bio
-oil
yiel
d (%
)
Figure 6.3 Effect of biomass content on bio-oil production from cellulose (▲) and xylose (■)
hydrothermal conversion
(300°C, 20min retention time, 0.5% catalyst loading)
6.3.1.4 Effect of catalyst loading
In this experiment, the reactor was loaded with 500 g of reactants, which included 10%
feedstock on a total reactants weight basis, 0 to 1.5% sodium hydroxide as catalyst (on a total
reactants weight basis), and deionized water (changed accordingly with catalyst loading). The
reaction conditions were set at 300 °C for 20 min retention time. Catalyst loading had significant
effect on bio-oil yield, which is shown in Figure 6.4. Without catalyst, the bio-oil yields were
low as 4.5% and 1.5% for cellulose and hemicellulose, respectively. When catalyst loading
increased to 0.5%, the bio-oil yield sharply increased, and then slightly decreased when catalyst
loading increased to 1.5%. Research showed that the alkali catalyst inhibited the formation of
char from bio-oil (Karagöz et al., 2006; Minowa et al., 1998). Thus, bio-oil yield increased as
catalyst loading increased to 0.5%. However, the bio-oil yield decreased when catalyst loading
further increased, which might due to the enhanced cracking and dehydration of the bio-oil to
gases and water soluble products with excessive alkali catalyst. In this study, the highest bio-oil
yield of 33.8% was obtained with 0.5% catalyst loading. Similar results were reported in
previous studies on the woody biomass HTC with alkali catalyst (Ogi et al., 1985; Karagöz et al.,
2006; Bhaskar et al., 2008), as well as sewage sludge (Yokoyama et al., 1987; Suzuki et al.,
1988), and barley stillage (Dote et al., 1991). However, Alkali catalyst had little catalytic effect

104
on bio-oil production from alage HTC, because alage contained a considerable amount of sodium
(Dote et al., 1994; Minowa et al., 1995; Zhou et al., 2010).
0
4
8
12
16
20
24
0 0.5 1 1.5Catalyst loading (%)
Bio
-oil
yiel
d (%
)
Figure 6.4 Effect of catalyst loading on bio-oil production from cellulose (▲) and xylose (■)
hydrothermal conversion
(300°C, 20min retention time, 10% biomass content)
6.3.2 Interaction effects between pure cellulose, hemicelluose, and lignin
The maximum bio-oil yields of cellulose and hemicellulose HTC were both obtained at
300°C for 20min with 10% feedstock loading and 0.5% catalyst loading (on a total reactants
weight basis). Thus, in this section, all experiments were conducted at 300°C for 20 min with
50g feedstock, 2.5g sodium hydroxide, and 447.5g deionized water. In order to investigate the
interaction effect among HTC of cellulose, hemicellulose and lignin, it is assumed that the three
components HTC is unaffected by each other, and their individual content in the feedstock has
no significant effect on bio-oil production. The hypothesis bio-oil yield is calculated by the
following equation:
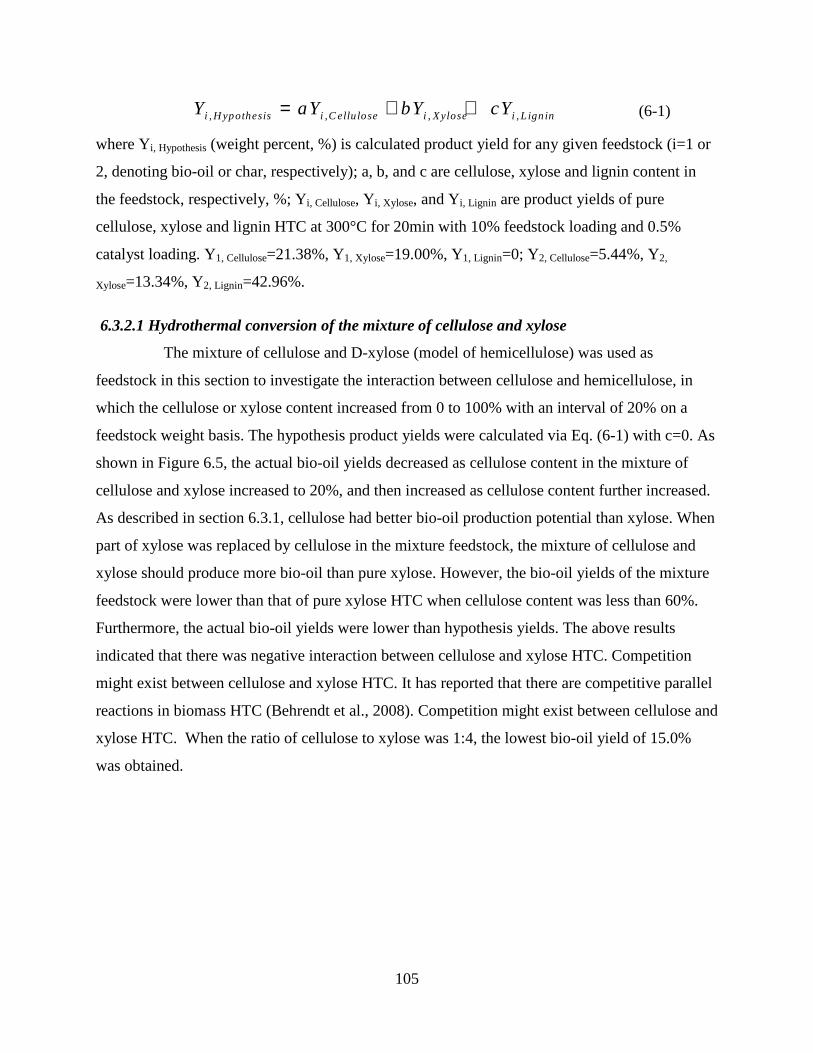
105
, , , ,i H ypothesis i C ellulose i Xylose i L ign inY aY bY cY= + + (6-1)
where Yi, Hypothesis (weight percent, %) is calculated product yield for any given feedstock (i=1 or
2, denoting bio-oil or char, respectively); a, b, and c are cellulose, xylose and lignin content in
the feedstock, respectively, %; Yi, Cellulose, Yi, Xylose, and Yi, Lignin are product yields of pure
cellulose, xylose and lignin HTC at 300°C for 20min with 10% feedstock loading and 0.5%
catalyst loading. Y1, Cellulose=21.38%, Y1, Xylose=19.00%, Y1, Lignin=0; Y2, Cellulose=5.44%, Y2,
Xylose=13.34%, Y2, Lignin=42.96%.
6.3.2.1 Hydrothermal conversion of the mixture of cellulose and xylose
The mixture of cellulose and D-xylose (model of hemicellulose) was used as
feedstock in this section to investigate the interaction between cellulose and hemicellulose, in
which the cellulose or xylose content increased from 0 to 100% with an interval of 20% on a
feedstock weight basis. The hypothesis product yields were calculated via Eq. (6-1) with c=0. As
shown in Figure 6.5, the actual bio-oil yields decreased as cellulose content in the mixture of
cellulose and xylose increased to 20%, and then increased as cellulose content further increased.
As described in section 6.3.1, cellulose had better bio-oil production potential than xylose. When
part of xylose was replaced by cellulose in the mixture feedstock, the mixture of cellulose and
xylose should produce more bio-oil than pure xylose. However, the bio-oil yields of the mixture
feedstock were lower than that of pure xylose HTC when cellulose content was less than 60%.
Furthermore, the actual bio-oil yields were lower than hypothesis yields. The above results
indicated that there was negative interaction between cellulose and xylose HTC. Competition
might exist between cellulose and xylose HTC. It has reported that there are competitive parallel
reactions in biomass HTC (Behrendt et al., 2008). Competition might exist between cellulose and
xylose HTC. When the ratio of cellulose to xylose was 1:4, the lowest bio-oil yield of 15.0%
was obtained.
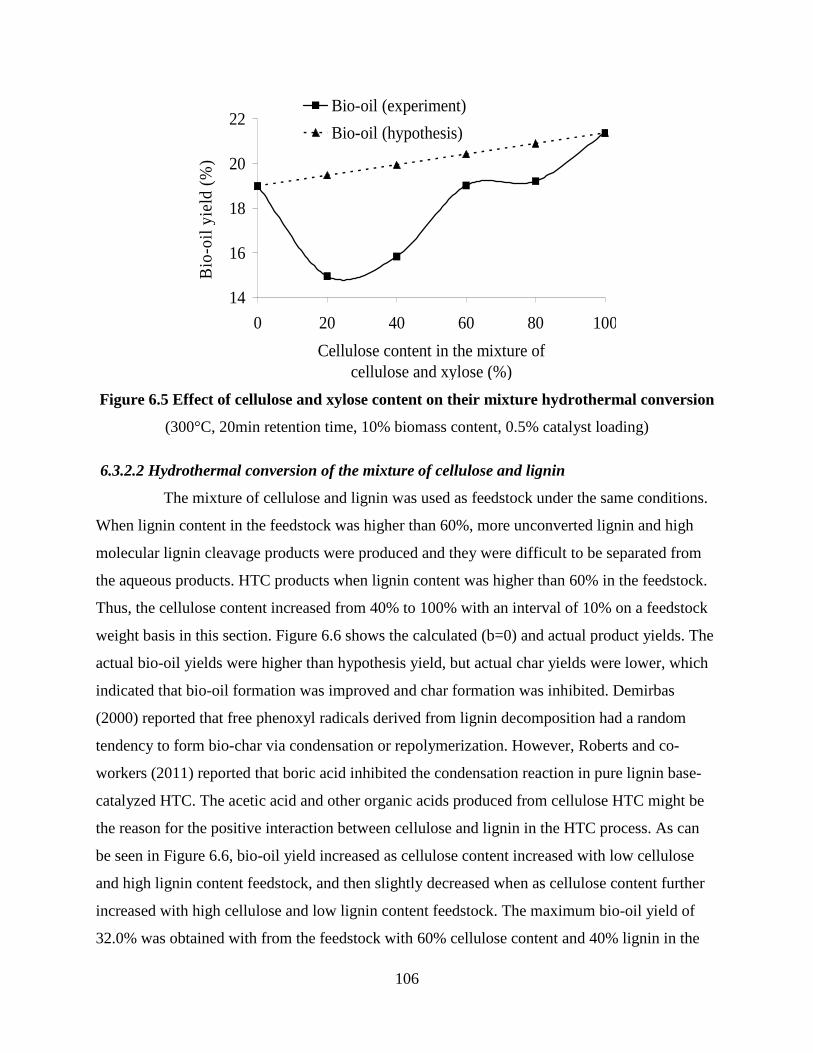
106
14
16
18
20
22
0 20 40 60 80 100
Cellulose content in the mixture of cellulose and xylose (%)
Bio
-oil
yiel
d (%
)
Bio-oil (experiment)
Bio-oil (hypothesis)
Figure 6.5 Effect of cellulose and xylose content on their mixture hydrothermal conversion
(300°C, 20min retention time, 10% biomass content, 0.5% catalyst loading)
6.3.2.2 Hydrothermal conversion of the mixture of cellulose and lignin
The mixture of cellulose and lignin was used as feedstock under the same conditions.
When lignin content in the feedstock was higher than 60%, more unconverted lignin and high
molecular lignin cleavage products were produced and they were difficult to be separated from
the aqueous products. HTC products when lignin content was higher than 60% in the feedstock.
Thus, the cellulose content increased from 40% to 100% with an interval of 10% on a feedstock
weight basis in this section. Figure 6.6 shows the calculated (b=0) and actual product yields. The
actual bio-oil yields were higher than hypothesis yield, but actual char yields were lower, which
indicated that bio-oil formation was improved and char formation was inhibited. Demirbas
(2000) reported that free phenoxyl radicals derived from lignin decomposition had a random
tendency to form bio-char via condensation or repolymerization. However, Roberts and co-
workers (2011) reported that boric acid inhibited the condensation reaction in pure lignin base-
catalyzed HTC. The acetic acid and other organic acids produced from cellulose HTC might be
the reason for the positive interaction between cellulose and lignin in the HTC process. As can
be seen in Figure 6.6, bio-oil yield increased as cellulose content increased with low cellulose
and high lignin content feedstock, and then slightly decreased when as cellulose content further
increased with high cellulose and low lignin content feedstock. The maximum bio-oil yield of
32.0% was obtained with from the feedstock with 60% cellulose content and 40% lignin in the

107
feedstock. Char yield decreased with increasing cellulose content, and then appeared to level off
when cellulose content was higher than 70%.
0
5
10
15
20
25
30
35
40 50 60 70 80 90 100Cellulose content in the mixture of
cellulose and lignin(%)
Pro
duct
yie
ld (
%)
Bio-oil (experiment) Bio-oil (hypothesis)
Char (experiment) Char (hypothesis)
Figure 6.6 Effect of cellulose and lignin content on their mixture hydrothermal conversion
(300°C, 20min retention time, 10% biomass content, 0.5% catalyst loading)
6.3.2.3 Hydrothermal conversion of the mixture of xylose and lignin
HTC of the mixture of xylose and lignin was conducted under the same conditions, and the
xylose content increased from 40% to 100% with an interval of 20% on a feedstock weight basis
in this section with a=0 in Eq. (6-1). In Figure 6.7, the actual bio-oil yields were slightly higher
than the hypothesis yields, which indicated that no significant interaction effect occurred
between xylose and lignin HTC. Similarly, the actual char yields were lower than the calculated
values, might duo to the acids produced from xylose HTC. However, the difference between the
actual and calculated bio-oil/char yields was small compared to the HTC of mixture of cellulose
and lignin. The final pH values of aqueous products from cellulose and xylose HTC at 300°C for
20min retention time with 10% biomass content and 0.5% catalyst loading were roughly
measured by pH paper. The former one (~3) was lower than the latter (~4) one, which meant that
xylose produced less acids than cellulose.

108
4
8
12
16
20
24
28
32
40 60 80 100Xylose content in the mixture of
xylose and lignin(%)
Pro
duc
t yi
eld
(%)
Bio-oil (experiment)Bio-oil (hypothesis)Char (experiment)Char (hypothesis)
Figure 6.7 Effect of xylose and lignin content on their mixture of hydrothermal conversion
(300°C, 20min retention time, 10% biomass content, 0.5% catalyst loading)
6.3.3 HTC of real and model biomass
To investigate the HTC of the mixture of cellulose, hemicellulose, and lignin, seven real
biomass and their model substances were used in this study. The model biomass was made of
cellulose, D-xylose, and lignin, whose contents were calculated as follows:
,, m o d
1 , 2 , 3 ,
1 0 0 %j r e a lj e l
r e a l r e a l r e a l
CC
C C C= ×
+ + (6-2)
where Cj, model, Cj, real were chemical composition content of model biomass and real biomass (j =
1, 2, 3 for cellulose, hemicellulose, and lignin, respectively); C1, real, C2, real, C3, real were cellulose,
hemicellulose, and lignin contents in real biomass, respectively. The chemical compositions of
real biomass and their model substances were presented in Table 6.1.
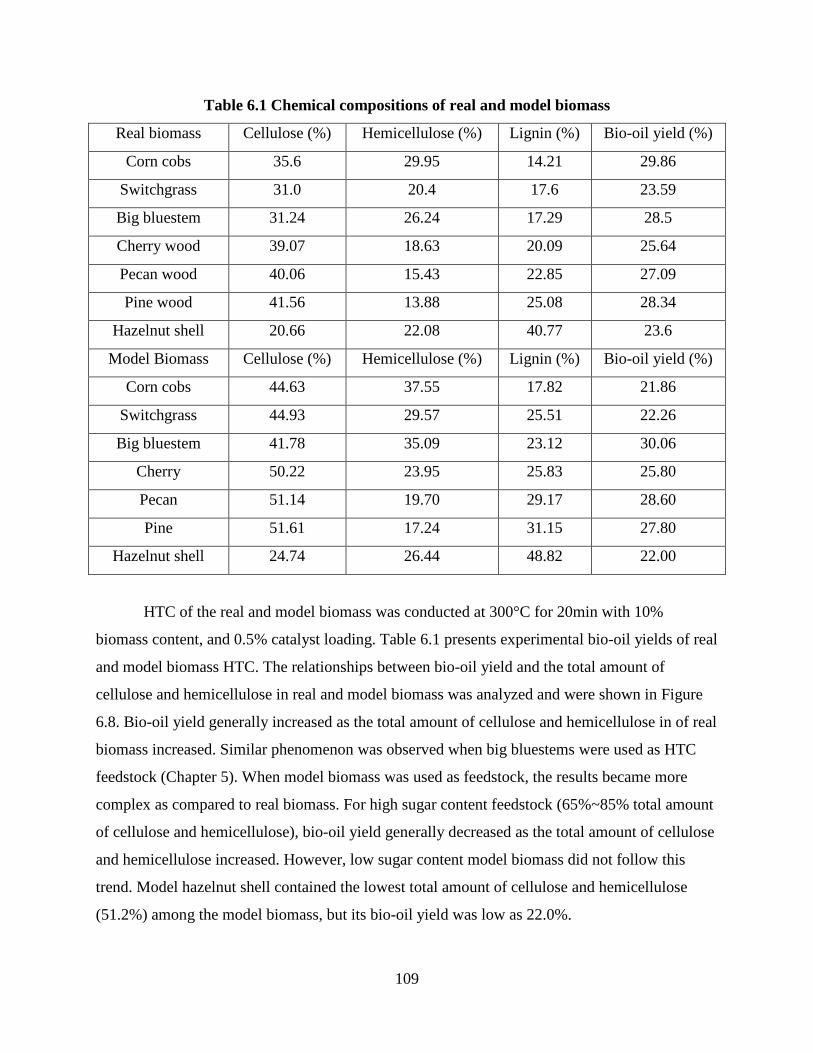
109
Table 6.1 Chemical compositions of real and model biomass
Real biomass Cellulose (%) Hemicellulose (%) Lignin (%) Bio-oil yield (%)
Corn cobs 35.6 29.95 14.21 29.86
Switchgrass 31.0 20.4 17.6 23.59
Big bluestem 31.24 26.24 17.29 28.5
Cherry wood 39.07 18.63 20.09 25.64
Pecan wood 40.06 15.43 22.85 27.09
Pine wood 41.56 13.88 25.08 28.34
Hazelnut shell 20.66 22.08 40.77 23.6
Model Biomass Cellulose (%) Hemicellulose (%) Lignin (%) Bio-oil yield (%)
Corn cobs 44.63 37.55 17.82 21.86
Switchgrass 44.93 29.57 25.51 22.26
Big bluestem 41.78 35.09 23.12 30.06
Cherry 50.22 23.95 25.83 25.80
Pecan 51.14 19.70 29.17 28.60
Pine 51.61 17.24 31.15 27.80
Hazelnut shell 24.74 26.44 48.82 22.00
HTC of the real and model biomass was conducted at 300°C for 20min with 10%
biomass content, and 0.5% catalyst loading. Table 6.1 presents experimental bio-oil yields of real
and model biomass HTC. The relationships between bio-oil yield and the total amount of
cellulose and hemicellulose in real and model biomass was analyzed and were shown in Figure
6.8. Bio-oil yield generally increased as the total amount of cellulose and hemicellulose in of real
biomass increased. Similar phenomenon was observed when big bluestems were used as HTC
feedstock (Chapter 5). When model biomass was used as feedstock, the results became more
complex as compared to real biomass. For high sugar content feedstock (65%~85% total amount
of cellulose and hemicellulose), bio-oil yield generally decreased as the total amount of cellulose
and hemicellulose increased. However, low sugar content model biomass did not follow this
trend. Model hazelnut shell contained the lowest total amount of cellulose and hemicellulose
(51.2%) among the model biomass, but its bio-oil yield was low as 22.0%.

110
YReal = 0.3866CC+H + 6.1028
R2 = 0.78
Ymodel = -0.4215CC+H + 57.163
R2 = 0.44
20
22
24
26
28
30
32
34
40 45 50 55 60 65 70 75 80 85Total amount of cellulose and hemicellulose of biomass (%)
Bio
-oil
yiel
d(%
)
Real biomassModel biomassLinear (Real biomass)Linear (Low lignin content model biomass)
Figure 6.8 Effect of cellulose and hemicellulose content on bio-oil yield
(300°C, 20min retention time, 10% biomass content, 0.5% catalyst loading)
Figure 6.9 shows the relationships between bio-oil yield and biomass lignin content. A
declining trend in bio-oil yield was observed for real biomass. For model biomass with low
lignin content but high sugar content, bio-oil yield generally increased as increasing lignin
content. However, as lignin content of model biomass further increased, bio-oil yield decreased.
It was consistent with the results of section 6.3.2.2. Bio-oil yield increased when feedstock lignin
content increased from 15% to 40%, and then decreased as feedstock lignin content further
increased to 60%. Therefore, total amount of cellulose and hemicellulose might be the main
factor influencing bio-oil yield for real biomass HTC, but lignin could become the dominant
factor for bio-oil production from model biomass with low lignin content, which ranged from
15% to 35%.
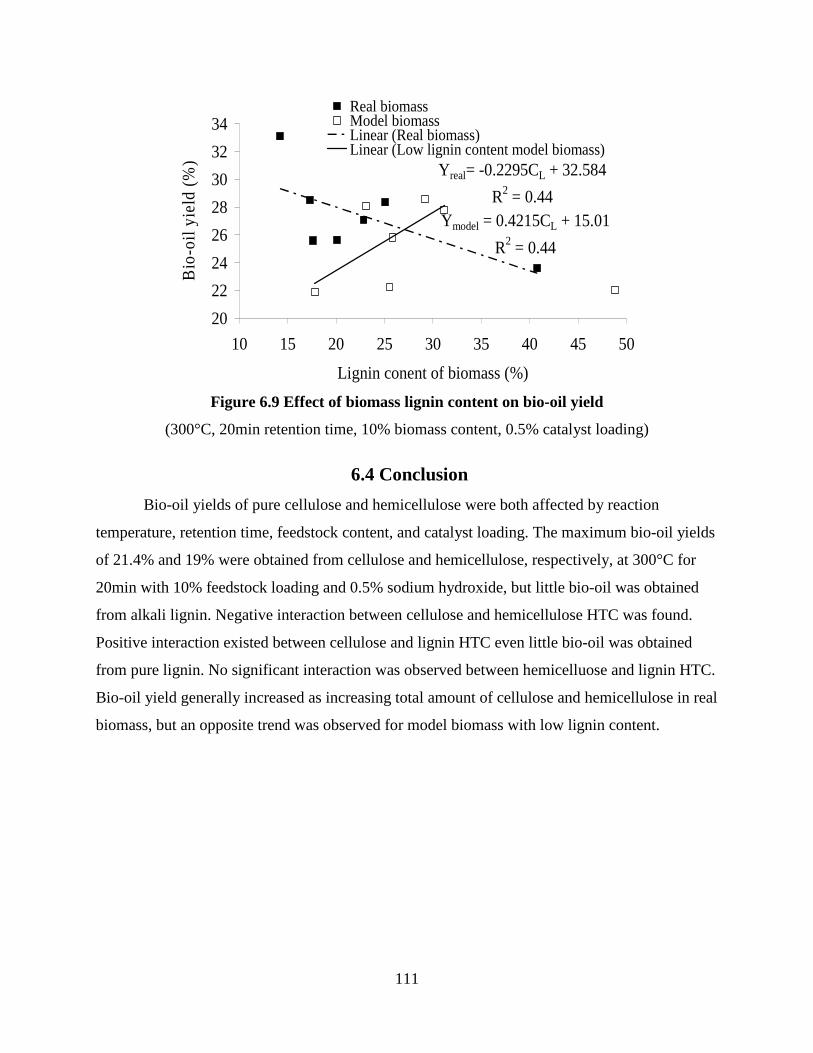
111
Yreal= -0.2295CL + 32.584
R2 = 0.44Ymodel = 0.4215CL + 15.01
R2 = 0.44
20
22
24
26
28
30
32
34
10 15 20 25 30 35 40 45 50
Lignin conent of biomass (%)
Bio
-oil
yiel
d (%
)
Real biomassModel biomassLinear (Real biomass)Linear (Low lignin content model biomass)
Figure 6.9 Effect of biomass lignin content on bio-oil yield
(300°C, 20min retention time, 10% biomass content, 0.5% catalyst loading)
6.4 Conclusion
Bio-oil yields of pure cellulose and hemicellulose were both affected by reaction
temperature, retention time, feedstock content, and catalyst loading. The maximum bio-oil yields
of 21.4% and 19% were obtained from cellulose and hemicellulose, respectively, at 300°C for
20min with 10% feedstock loading and 0.5% sodium hydroxide, but little bio-oil was obtained
from alkali lignin. Negative interaction between cellulose and hemicellulose HTC was found.
Positive interaction existed between cellulose and lignin HTC even little bio-oil was obtained
from pure lignin. No significant interaction was observed between hemicelluose and lignin HTC.
Bio-oil yield generally increased as increasing total amount of cellulose and hemicellulose in real
biomass, but an opposite trend was observed for model biomass with low lignin content.
112
References
Behrendt, F., Neubauer, Y., Oevermann, M., Wilmes, B., and Zobel, N. (2008). Direct liquefaction of biomass. Chem. Eng. Technol. 31(5), 667-677.
Bhaskar, T., Sera, A., Muto, A., and Sakata, Y. (2008). Hydrothermal upgrading of wood biomass: Influence of the addition of K2CO3 and cellulose/lignin ratio. Fuel 87, 2236-2242.
Czernik, S., and Bridgwater, A.V. (2004). Overview of applications of biomass fast pyrolysis oil. Energy Fuels 18(2), 590-598.
Demirbaş, A. (2000). Mechanisms of liquefaction and pyrolysis reactions of biomass. Energy Convers. Manage. 41, 633-646.
Demirbaş, A., Balat, M., and Bozbaş, K. (2005). Direct and catalytic liquefaction of wood species in aqueous solution. Energy Sources 27, 271-277.
Demibaş, A. (2005).Thermochemical conversion of biomass to liquid products in the aqueous medium. Energy Sources 27, 1235-1243.
Dote, Y., Yokoyama, S., Ogi, T., Minowa, T., and Murakami, M. (1991). Liquefaction of barley stillage and upgrading of primary oil. Biomass Bioenergy 1: 55-60.
Dote, Y., Sawayama, S., Inoue, S., Minowa, T., and Yokoyama, S. (1994). Recovery of liquid fuel from hydrocarbon-rich microalgae by thermochemical liquefaction. Fuel 1855-1857.
Funzaukuri, T., Wakao, N., and Smith, J. M. (1990). Liquefaction of lignin sulphonate with subcritical and supercritical water. Fuel 69, 349-353.
Gan, J., Yuan, W., Nelson, N. O., and Agudelo, S. C. (2010). Hydrothermal conversion of corn cobs and crude glycerol. Biol. Eng. 2(4), 197-210.
Kabyemela, B. M., Takigawa, M., Adschiri, T., Malaluan, R. M., and Arai, K. (1998). Mechanism and kinetics of cellobiose decomposition in sub- and supercritical water. Ind. Eng. Chem. Res. 37, 357-361.
Kamio, E., Sato, H., Takahashi, S., Noda, H., Fukuhara, C., and Okamura, T. (2008a). Liquefaction kinetics of cellulose treated by hot compressed water under variable temperature conditions. J. Mater. Sci. 43, 2179-2188.
Kamio, E., Takahashi, S., Noda, H., Fukuhara, C., and Okamura, T. (2008b). Effect of heating rate on liquefaction of cellulose by hot compressed water. Chemica Engineering Journal 137, 328-338.
Karagöz, S., Bhaskar, T., Muto, A., and Sakata, Y. (2005). Comparative studies of oil compositions produced from sawdust, rice husk, lignin and cellulose by hydrothermal treatment. Fuel 84, 875-884.

113
Li, H., Yuan, X., Zeng, G., Tong, J., Yan, Y., Cao, H., Wang, L., Cheng, M., Zhang, J., and Yang, D. (2009). Liquefaction of rice straw in sub- and supercritical 1, 4-dioxane-water mixture. Fuel Processing Technology 90(5), 657-663.
Lin, L., Yoshioka, M., Yao, Y., and Shiraishi, N. (1997a). Liquefaction mechanism of lignin in the presence of phenol at elevated temperature without catalysts. Studies on ß-0-4 lignin model compounds II. Reaction pathway. Holzforschung 51, 325-332.
Lin, L., Yoshioka, M., Yao, Y., and Shiraishi, N. (1997b). Liquefaction mechanism of lignin in the presence of phenol at elevated temperature without catalysts. Studies on ß-0-4 lignin model compounds III. Multi-condensation. Holzforschung 51, 333-337.
Liu, Z., and Zhang, F. S. (2008). Effect of various solvents on the liquefaction of biomass to produce fuels and chemical feedstocks. Energy Conversion and Management 49(12), 3498-3504.
Minowa, T., Yokoyama, S., Kishimoto, M., and Okakurat, T. (1995). Oil production from algal cells of Dunaliella tertiolecta by direct thermochemical liquefaction. Fuel 12, 1735-1738.
Minowa, T., Zhen, F., and Ogi, T. (1997). Liquefaction of cellulose in hot compressed water using sodium carbonate: products distribution at different reaction temperatures. J. Chem. Eng. Jpn. 30, 186-190.
Minowa, T., Kondo, T., and Sudirjo, S. T. (1998a). Thermochemical liquefaction of Indonesian biomass residues. Biomass Bioenergy 14, 517-524.
Minowa, T., Fang, Z., Ogi, T., and Varhegyi, G. (1998b). Decompostion of cellulose and glucose in hot-compressed water under catalyst-free conditions. J. Chem. Eng. Jpn. 31, 131-134.
Minowa, T., Zhen, F., and Ogi, T. (1998c). Cellulose decomposition in hot-compressed water with alkali or nickel catalyst. J. Supercrit. Fluids 13, 253-259.
Ogi, T., Yokoyama, S., and Koguchi, K. (1985). Direct liquefaction of wood by alkali and alkaline earth salt in an aqueous phase. Chemistry letters 1199-1202.
Ogi, T., Minowa, T., Dote, Y., and Yokoyama, S. Y. (1994). Characterization of oil produced by the direct liquefaction of Japanese oak in an aqueous 2-propanol solvent system. Biomass Bioenergy 7(1-6), 193-199.
Perlack, R. D., Wright, L. L., Turhollow, A. F., Graham, R. L., Stokes, B. J., and Erbach, D. C. (2005). Biomass as feedstock for a bioenergy and bioproducts Industry: the technical feasibility of a billion-ton annual supply. Oar Ridge National Laboratory Report ORNL/TM-2005/66, US Dept. of Energy, Oak Ridge, TN
Peterson, A. A., Vogel, F., Lachance, R. P., Froling, M., Antal Jr., M. J., and Tester, J. W. (2008). Thermochemical biofuel production in hydrothermal media: a review of sub- and supercritical water technologies. Energy Environ. Sci. 1, 32-65.

114
Pińkowska, H., Wolak, P., and Zlocińska, A. (2011). Hydrothermal decomposition of xylan as a model substance for plant biomass waste-Hydrothermolysis in subcritical water. Biomass Bioenergy 35, 3902–3912.
Qian, Y., Zuo, C., Tan, J., and He, J. (2007). Structural analysis of bio-oils from sub-and supercritical water liquefaction of woody biomass. Energy 32, 196-202.
Roberts, V. M., Stein, V., Reiner, T., Lemonidou, A., Li, X., and Lercher, J. A. (2011). Towards quantitative catalytic lignin depolymerization. Chem.--Eur. J. 17, 5939-5948.
Sasaki, M., Kabyemela, B., Malaluan, R., Hirose, S., Takeda, N., Adschiri, T., and Arai, K. (1998). Cellulose hydrolysis in subcritical and supercritical water. J. Supercrit. Fluids 13, 261-268.
Sasaki, M., Fang, Z., Fukushima, Y., Adschiri, T., and Arai, K. (2000). Dissolution and hydrolysis of cellulose in subcritical and supercritical water. Ind. Eng. Chem. Res. 39, 2883-2890.
Sasaki, M., Furukawa, M., Minami, K., Adschiri, T., and Arai, K. (2002). Kinetics and mechanism of cellobiose hydrolysis and retro-aldol condensation in subcritical and supercritical water. Ind. Eng. Res. 41, 6642-6649.
Saisu, M., Sato, T., Watanabe, M., Adschiri, T., and Arai, K.. (2003). Conversion of lignin with supercritical water-phenol mixtures. Energy Fuels 17, 922-928.
Sasaki, M., Adschiri, T., and Arai, K. (2004). Kinetics of cellulose conversion at 25 MPa in sub- and supercritical water. AIChE J. 50, 192-202.
Sluiter, A., Ruiz, R., Scarlata, C., Sluiter, J., and Templeton, D. (2005). Determination of extractives in biomass. NREL/TP-510-42619. Golden, Colo.: National Renewable Energy Laboratory.
Sluiter, A., Hames, B., Ruiz, R., Scarlata, C., Sluiter, J., Templeton, D., and Crocker, D. (2008). Determination of structural carbohydrates and lignin in biomass. NREL/TP-510-42618. Golden, Colo.: National Renewable Energy Laboratory.
Suzuki, A., and Nakamura, T. (1988). Conversion of sewage sludge to heavy oil by direct thermochemical liquefaction. J. Chem. Eng. Jpn. 21, 288-293.
Tymchyshyn, M., and Xu, C. (2010). Liquefaction of bio-mass in hot-compressed water for the production of phenolic compounds. Bioresour. Technol. 101, 2483-2490.
Wahyudiono, Sasaki, M., and Goto, M. (2008). Recovery of phenolic compounds through the decomposition of lignin in near and supercritical water. Chem. Eng. Process. 47: 1609-1619.

115
Xu, C., and Lancaster, J. (2008). Conversion of secondary pulp/paper sludge powder to liquid oil products for energy recovery by direct liquefaction in hot-compressed water. Water Research 42(6-7), 1571-1582.
Xu, C., and Lad, N. (2008). Production of heavy oils with high caloric values by direct liquefaction of woody biomass in sub/near-critical water. Energy and Fuels 22, 635-642.
Xu, C., and Etcheverry, T. (2008). Hydro-liquefaction of woody biomass in sub- and super-critical ethanol with iron-based catalysts. Fuel 87(3), 335-345.
Yin, S., Mehrotra, A. K, and Tan, Z. (2011). Alkaline hydrothermal conversion of cellulose to bio-oil: Influence of alkalinity on reaction pathway change. Birosour. Technol. 102, 6605-6610.
Yokoyama, S., Suzuki, A., Murakamit, M., Ogi, T., Koguchi, K., Nakamura, E. (1987). Liquid fuel production from sewage sludge by catalytic conversion using sodium carbonate. Fuel 66, 1150-1155.
Yu, F., Ruan, R., Chen, P., Deng, S., Liu, Y., and Lin, X. (2007). Liquefaction of corn cobs with supercritical water treatment. Transactions of the ASABE 50(1), 175-180.
Yuan, X. Z., Li, H., Zeng, G. M., Tong, J. Y., and Xie, W. (2007). Sub- and supercritical liquefaction of rice straw in the presence of ethanol-water and 2-propanol-water mixture. Energy 32(11), 2081-2088.
Yuan, X. Z., Tong, J. Y., Zeng, G. M., Li, H., and Xie, W. (2009). Comparative studies of products obtained at different temperatures during straw liquefaction by hot compressed water. Energy Fuels 23, 3262-3267.
Zhong, C., and Wei, X. (2004). A comparative experimental study on the liquefaction of wood. Energy 29, 1731-41.
Zhou, D., Zhang, L., Zhang, S., Fu, H., and Chen, J. (2010). Hydrothermal liquefaction of macroalgae Enteromorpha prolifera to bio-oil. Energy Fuels 24, 4050-4061.

116
Chapter 7 - Conclusions and Recommendations
7.1 Conclusions
Bio-oil production from lignocellulosic biomass via hydrothermal conversion has
received great attention. Hydrothermal conversion (HTC) is a chemical reforming process in
which hot compressed water (or other solvents) is used as reaction medium with which biomass
is depolymerized and reformed to gases, water-soluble matters, char, and bio-oil in an oxygen-
absent enclosure at relative low temperature. This research was conducted to (1) investigate the
effect of operating conditions (temperature, retention time, biomass content, and catalyst
loading) and crude glycerol on bio-oil production, (2) to optimize the operating conditions and
investigate the interaction effects between these operating conditions, (3) to study the effect of
biomass ecotype and planting location on bio-oil production; (4) to investigate the effect of
biomass chemical compositions on bio-oil production. The following conclusions were drawn:
Corncobs were used as the feedstock to investigate the effect of operating conditions and
crude glycerol (solvent) on bio-oil production. The highest bio-oil yield of 33.8% on the basis of
biomass dry weight was obtained at 305°C, 20 min retention time, 10% biomass content, and
0.5% catalyst loading on a total reactant weight basis. The effect of crude glycerol on corn cob
HTC was investigated at 305°C for 20min with 10% corncobs and 0.2% catalyst loading. Bio-oil
yield based on the total weight of corn cobs and crude glycerol almost remained constant when
the ratio of crude glycerol/corn cobs was below 3 but dramatically increased to 36.3% when the
crude glycerol ratio increased to 4. H2 in the gas product also increased from 11.1% to 27.5% as
the crude glycerol to biomass ratio increased from 0 to 5. In addition, the bio-oil with better
flowability floated on the aqueous products once crude glycerol was added, indicating reduced
oil density and viscosity, and thus better quality. As the crude glycerol to biomass ratio increased
from 0 to 5, oxygen content in bio-oil increased from 13.8% to 19.9%, carbon decreased from
77.5% to 65.8%, and hydrogen had no significant change. Thus, crude glycerol had at least two
effects on biomass HTC: It increased bio-oil yield and quality in terms of low viscosity and
density, but the oxygen content of bio-oil slightly increased as more crude glycerol was used.
Furthermore, the optimization of operating conditions for corncobs HTC was conducted
via response surface methodology. Second order polynomial models were developed to predict
bio-oil yield and carbon recovery, and first order model was developed to evaluate bio-oil carbon

117
content. The models were adequate enough owning to the low P value (<0.001), and insignificant
lack of fit (P>0.05). Higher bio-oil yield and carbon recovery rate were achieved at low
temperature for short retention time with high biomass content and moderate catalyst loading,
but higher bio-oil carbon content was obtained at high temperature with low biomass content
regardless of retention time and catalyst loading. A maximum bio-oil yield of 41.3% was
obtained at 280°C, 12min, 21% biomass content, and 1.56% catalyst loading. The experimental
bio-oil yield of 39.5% was well consistent with the predicted one. A highest bio-oil carbon
content of 74.8% was produced at 340°C with 9% biomass content regardless of the retention
time and catalyst loading. A maximum carbon recovery of 25.2% was observed at 280°C, 12min,
21% biomass content, and 1.03% catalyst loading. The predicted bio-oil carbon content and
carbon recovery also were confirmed well by the validation experiments. The properties of the
bio-oil obtained at the optimal conditions for bio-oil yield were measured. The heating value of
the bio-oil was low as 25.41MJ/kg due to its low carbon content (63%) and high oxygen content
(28.8%). The chemical compounds of the bio-oil included ketones, alcohols, esters, and long
chain alkane hydrocarbons, in which 2-Ethylhexyl mercaptoacetate and 1-Hexanol, 2-ethyl- were
the dominant compounds.
The effect of biomass ecotype and planting location on bio-oil production were studied
on big bluestems. Three ecotypes (CKS, EKS, IL) and one cultivar (KAW) of big bluestem
(Andropogon gerardii) that were planted in three locations (Hays, KS; Manhattan, KS; and
Carbondale, IL) were converted to bio-oil via HTC. Bio-oil yield of big bluestem HTC was
significantly affected by both ecotype and planting location, but the latter was more influential.
The interaction effect between ecotype and planting location on bio-oil yield was statistically
insignificant (p > 0.05). Bio-oil C and O contents were significantly affected mainly by ecotype
(p < 0.01) and sometimes by the interaction between ecotype and planting location (p < 0.05);
however, planting location alone had no significant effect on bio-oil C or O contents. Generally,
the IL ecotype and the Carbondale, IL and Manhattan, KS planting locations gave higher bio-oil
yield, which can be attributed to the higher total cellulose and hemicellulose content and/or the
higher carbon but lower oxygen contents in these feedstocks. Bio-oil from the IL ecotype also
had the highest carbon and lowest oxygen contents, which were not affected by the planting
location. Bio-oils from big bluestem had yield, elemental composition, and chemical compounds
118
similar to bio-oils from switchgrass and corncobs, although mass percentages of some of the
compounds were slightly different.
In order to better understand lignocellulosic biomass HTC, cellulose, hemiecellulsoe, and
lignin were used as feedstock to investigate the effect of operating conditions on their HTC and
interactions between them in HTC process. Bio-oil yields of cellulose and hemicellulose were
both affected by reaction temperature, retention time, feedstock content, and catalyst loading.
The maximum bio-oil yields of 21.4% and 19% were obtained from cellulose and hemicellulose,
respectively, at 300°C for 20min with 10% feedstock loading and 0.5% sodium hydroxide, but
little bio-oil was obtained from alkali lignin. Negative interaction between cellulose and
hemicellulose HTC was found. Positive interaction existed between cellulose and lignin HTC.
No significant interaction was observed between hemicelluose and lignin HTC. Furthermore,
hydrothermal conversion of seven real biomass and their models (corncobs, big bluestems,
switchgrass, cherry, pecan, pine, and hazelnut shell) also were conducted. Bio-oil yield increased
as real biomass cellulose and hemicellulose content increased, but an opposite trend was
observed when model biomass with lignin content less than 40% was used as feedstock.
7.2 Recommendations
Compared with other biofuels production technologies, like fast pyrolysis, gasification,
combustion, fermentation, digestion, HTC is still at an early stage of development, which faces
many challenges. The following are recommended fro future studies:
• The products chemical compositions will be investigated for HTC reaction mechanisms
and kinetics study.
• The effect of operating conditions, solvents used, and biomass chemical composition on
bio-oil compounds needs to be investigated for downstream bio-oil separation and
upgrading.
• Bio-oils produced from HTC can not be used as transportation fuels directly duo to its
poor quality. Efficient and low-cost bio-oil upgrading technologies are necessary.
Catalytic cracking and hydrotreatment are widely used to upgrade pyrolysis bio-oils. The
possibility and effectiveness of various catalysts and hydrogen providing solvents for
HTC bio-oil upgrading will be investigated.

119
• Aqueous products contain many valuable compounds, such as acetic acid, phenol,
benzene, and their derivatives, which can be extracted from aqueous products. The effect
of operating conditions, solvents used, and biomass chemical composition on the
valuable chemicals production will be studied.

120
Chapter 8 - Contributions
This research has made several unique contributions to the field of biomass hydrothermal
conversion as follows:
• Models for the estimation of bio-oil yield, bio-oil carbon content, and bio-oil carbon
recovery of corncobs HTC have been developed. These models reveal the effect of
operating conditions (temperature, retention time, biomass content, and catalyst loading)
on bio-oil production and their interactions. The results will help in selecting appropriate
operating conditions for bio-oil production from lignocellulosic biomass HTC, and
promote biofuels production from agricultural residues.
• The possibility and effectiveness of using crude glycerol as an inexpensive solvent in
lignocellulosic biomass HTC has been investigated. The results will be valuable in
treating and utilizing crude glycerol, and provide an option to improve bio-oil production
from lignocellulosic biomass HTC with low cost.
• The effect of biomass geographic/ecotype information on bio-oil yield and chemical
compositions has been studied. It provided fundamental information and methodology to
evaluate the potential of biomass (using big bluestem as an example) as a biofuels
feedstock.
• The relationships between bio-oil yield and biomass chemical and elemental
compositions have been investigated. The models can be used to evaluate bio-oil yield in
light of biomass chemical and elemental compositions, and are useful for biofuels
feedstock selection and design.
• The conversion mechanisms of and interactions between cellulose, hemicellulose, and
lignin in HTC process have been studied. Such results will help in further understanding
the mechanisms of lignocellulosic biomass HTC, and provide fundamental knowledge for
process optimization and downstream bio-oil separation and upgrading.