Embed Size (px)
Citation preview
Bioresource Technology 152 (2014) 130–139
Contents lists available at ScienceDirect
Bioresource Technology
journal homepage: www.elsevier .com/locate /bior tech
Hydrothermal liquefaction of mixed-culture algal biomassfrom wastewater treatment system into bio-crude oil
0960-8524/$ - see front matter � 2013 Elsevier Ltd. All rights reserved.http://dx.doi.org/10.1016/j.biortech.2013.10.111
Abbreviations: Ash, ash fraction in the dry mass of AW (no units); AWVM, mass of volatile matter of mixed-culture algal biomass from wastewater treatment systemass of feedstock (g); G, mass of gas products (g); MWI, mass of moisture in the water-insoluble products (g); R, raw oil (g); SR, mass of toluene-insoluble fractiwater-insoluble products (g); VM, volatile matter (g); WI, mass of water-insoluble products (g).⇑ Corresponding author. Address: 1304 W. Pennsylvania Avenue, Urbana, IL 61801, USA. Tel.: +1 217 333 2693; fax: +1 217 244 0323.
E-mail address: [email protected] (Y. Zhang).
Wan-Ting Chen a, Yuanhui Zhang a,⇑, Jixiang Zhang a,b, Guo Yu a, Lance C. Schideman a, Peng Zhang a,Mitchell Minarick a
a Department of Agricultural and Biological Engineering, University of Illinois at Urbana-Champaign, Urbana, IL 61801, USAb State Key Laboratory of Heavy Oil Processing, China University of Petroleum, Beijing 102249, China
h i g h l i g h t s
� The first work using mixed-culturealgae directly from wastewater asHTL feedstock.� Improved bio-crude oil yield using
mixed-culture algal biomass.� Lower nitrogen recovery in the bio-
crude oils compared to studies usingpure algae.
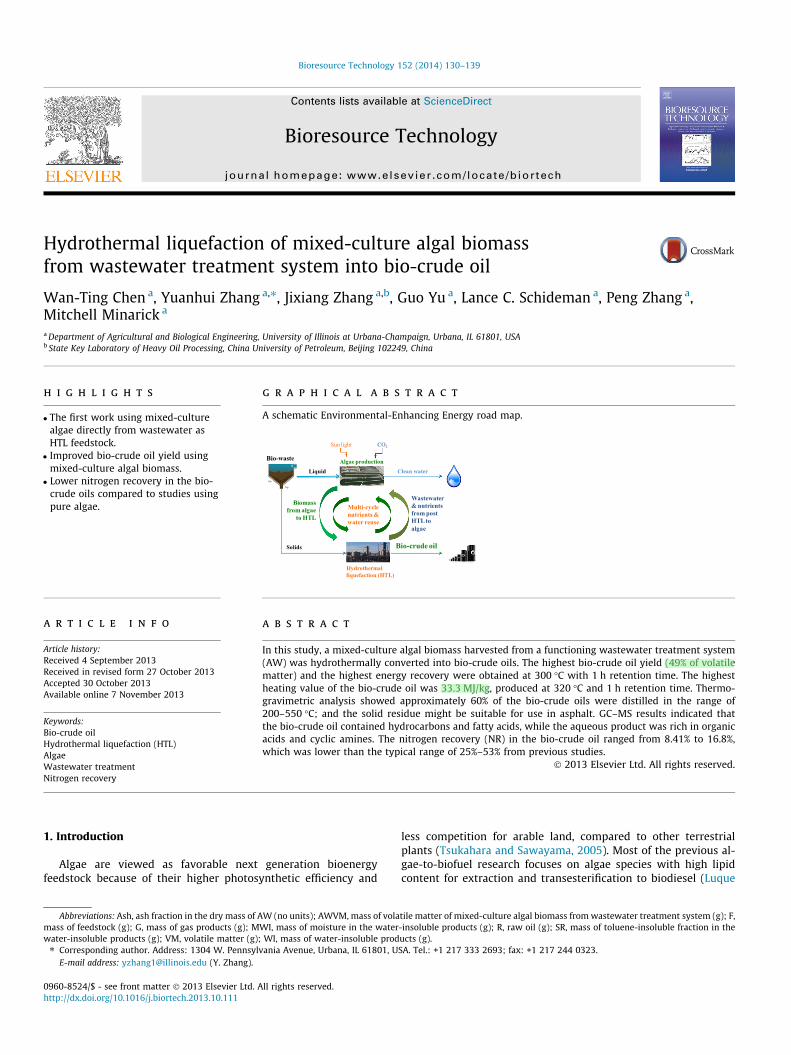
g r a p h i c a l a b s t r a c t
A schematic Environmental-Enhancing Energy road map.
Bio-waste
CO2Sun light
Liquid
Solids Bio-crude oil
Clean water
Multi-cycle nutrients & water reuse
Wastewater & nutrients from post HTL to algae
Algae production
Hydrothermal liquefaction (HTL)
Biomass from algae
to HTL
a r t i c l e i n f o
Article history:Received 4 September 2013Received in revised form 27 October 2013Accepted 30 October 2013Available online 7 November 2013
Keywords:Bio-crude oilHydrothermal liquefaction (HTL)AlgaeWastewater treatmentNitrogen recovery
a b s t r a c t
In this study, a mixed-culture algal biomass harvested from a functioning wastewater treatment system(AW) was hydrothermally converted into bio-crude oils. The highest bio-crude oil yield (49% of volatilematter) and the highest energy recovery were obtained at 300 �C with 1 h retention time. The highestheating value of the bio-crude oil was 33.3 MJ/kg, produced at 320 �C and 1 h retention time. Thermo-gravimetric analysis showed approximately 60% of the bio-crude oils were distilled in the range of200–550 �C; and the solid residue might be suitable for use in asphalt. GC–MS results indicated thatthe bio-crude oil contained hydrocarbons and fatty acids, while the aqueous product was rich in organicacids and cyclic amines. The nitrogen recovery (NR) in the bio-crude oil ranged from 8.41% to 16.8%,which was lower than the typical range of 25%–53% from previous studies.
� 2013 Elsevier Ltd. All rights reserved.
1. Introduction less competition for arable land, compared to other terrestrial
Algae are viewed as favorable next generation bioenergyfeedstock because of their higher photosynthetic efficiency and
plants (Tsukahara and Sawayama, 2005). Most of the previous al-gae-to-biofuel research focuses on algae species with high lipidcontent for extraction and transesterification to biodiesel (Luque
m (g); F,on in the
W.-T. Chen et al. / Bioresource Technology 152 (2014) 130–139 131
et al., 2010). However, low-lipid algae typically have higher totalbiomass productivity than high-lipid species. Furthermore, low-li-pid algae are more common in wastewater cultivations, which canreduce algal biomass production costs and environmentalpollution such as eutrophication (Chen et al., 2002). This paperinvestigates the potential for integration of algal wastewater treat-ment with bioenergy production via hydrothermal liquefaction(HTL), which is referred to here as the Environment-Enhancing En-ergy (E2-Energy) system. This system can uptake nutrients fromwastewater and re-releases most of them after HTL to supportmultiple cycles of algae growth, which amplifies the biofuel poten-tial of wastewater treatment (Yu et al., 2011a,b; Zhou et al., inpress).
In an HTL process, macromolecules in biomass are depolymer-ized first into light molecules and then the unstable fraction ofchemicals are repolymerized into oil compounds (Peterson et al.,2008). HTL is more suitable for treating wet feedstocks than otherthermochemical conversion processes such as pyrolysis and gasifi-cation, which need dry feedstocks for a positive energy balance.Wet feedstocks can be treated directly by HTL without dryingand energy-dense oil products self-separate from the water afterHTL treatment. For example, one previous study showed that whenHTL reaction temperatures reached 240 �C, bio-crude oil productsbegan to form as self-separated bitumen-like products; below240 �C, the feedstocks were not completely converted into bio-oilproducts (Yu, 2012). Retention time was another important factorin the formation of bio-crude oil. Typically, it takes at least tenminutes to form self-separating bioenergy products from algal bio-mass. As holding time increased, the bio-crude oil yield did not in-crease significantly, indicating that a long retention times was notan essential factor for the bio-crude oil formation. Past researchalso showed that initial pressure had little effect on the HTL prod-ucts distribution and oil product composition under HTL condi-tions when the additional initial pressure was above thesaturation pressure of water (Yu et al., 2011a,b). Consequently, thisstudy specifically focuses on HTL of the mixed-culture algal bio-mass from a wastewater treatment system (AW) with tempera-tures ranging from 260 �C to 320 �C, retention times rangingfrom 0 to 1.5 h and an initial pressure of 0.69 MPa, which wasthe lowest pressure previously shown to produce an substantialoil product (Yu et al., 2011a,b).
Past work demonstrated that low-lipid algae species can be effi-ciently converted into bio-crude oil via HTL (Yu, 2012). In order toachieve the goal of positive energy output, it has been suggested tocouple waste treatment with bio-energy production (Clarens et al.,2010). Producing bio-crude oil via HTL can not only provide bio-waste treatment but also saves great amounts of energy on dewa-tering algae. This study intends to examine the feasibility of usingmixed-culture algal biomass (a by-product of wastewater treat-ment combining various species of algae, bacteria and other organ-isms) as the HTL feedstock. The effects of the reaction temperatureand retention time on the bio-crude oil yields were analyzed. Inaddition, the liquefaction products were characterized viaelemental analysis, GC–MS and TGA to examine nutrient recovery,physiochemical properties and possible reaction pathways for thebio-crude oil formation.
Although other studies have used waste-fed algae as HTL feed-stocks (Roberts et al., 2013; Zhou et al., in press), which may stillencounter the risk of contamination by competing microorganismsduring the algae cultivation (National Research Council, 2012), thisstudy appears to be the first of its kind to use mixed-culture algalbiomass that was directly harvested from a full-scale operatingwastewater treatment systems. The conversion of low-lipid,mixed-culture algal biomass into bioenergy products resolves thecontamination issues associated with algal biofuels and allowsfor the full potential of E2-Energy technology to be realized.
2. Methods
2.1. Feedstock
The mixed-culture algal biomass (AW) was directly harvestedfrom a wastewater treatment system (One Water Inc., Indianapolis,IN) and was comprised of microalgae, macroalgae, bacteria, andother organisms. AW was dried and pulverized with a commercialblender (MX 1000XT, Waring Commercial Inc., Torrington, CT) andthen stored in a refrigerator below 4 �C. The dry solids content andthe ash content of AW were measured as the weight fraction afterdrying at 105 �C and the residual fraction after combustion at550 �C, respectively. Elemental analysis of feedstock was operatedby a CHN analyzer (CE-440, Exeter Analytical Inc., North Chelms-ford, MA). Other macromolecules and chemical compositions wereanalyzed according to the standard methods of the Association ofOfficial Analytical Chemists (AOAC). The higher heating value ofdry AW material was measured using an oxygen bomb calorimeter(Model 6200, Parr Instrument Co., Moline, IL). Detailed chemicalcomposition of AW is summarized in Table 1.
2.2. HTL experiments
The HTL experiments were performed by using a stainless steelcylinder reactor of 100 ml capacity with a magnetic drive stirrerand removable vessel (Model 4593, Parr Instrument Co., Moline,IL) operated in a batch mode. Reaction temperatures ranged from260 �C to 320 �C and retention times ranged from 0 h to 1.5 h.The 100 ml batch reactors used in the present work typically tookabout 0.5 h, 0.75 h, 1 h and 1.25 h to reach 260 �C, 280 �C, 300 �Cand 320 �C, respectively. The retention times as used in this studydo not include the heat-up times. After each test, the reactors wererapidly cooled down to room temperature within 0.5 h by circulat-ing tap water through cooling coils located outside the reactors. Atypical temperature profile is also presented in the Supplementarydata. 30 g of slurry feedstock with 25 wt% total solid content of AWwas used in each test. The reactor was subsequently sealed and theheadspace was purged with nitrogen three times. Nitrogen gas wasagain added to the reactor to build up to 0.69 MPa gauge pressureto prevent the water from boiling during the experiments (Yu et al.,2011a,b). Initial/final pressures and temperatures were recorded.
2.3. Analysis of products
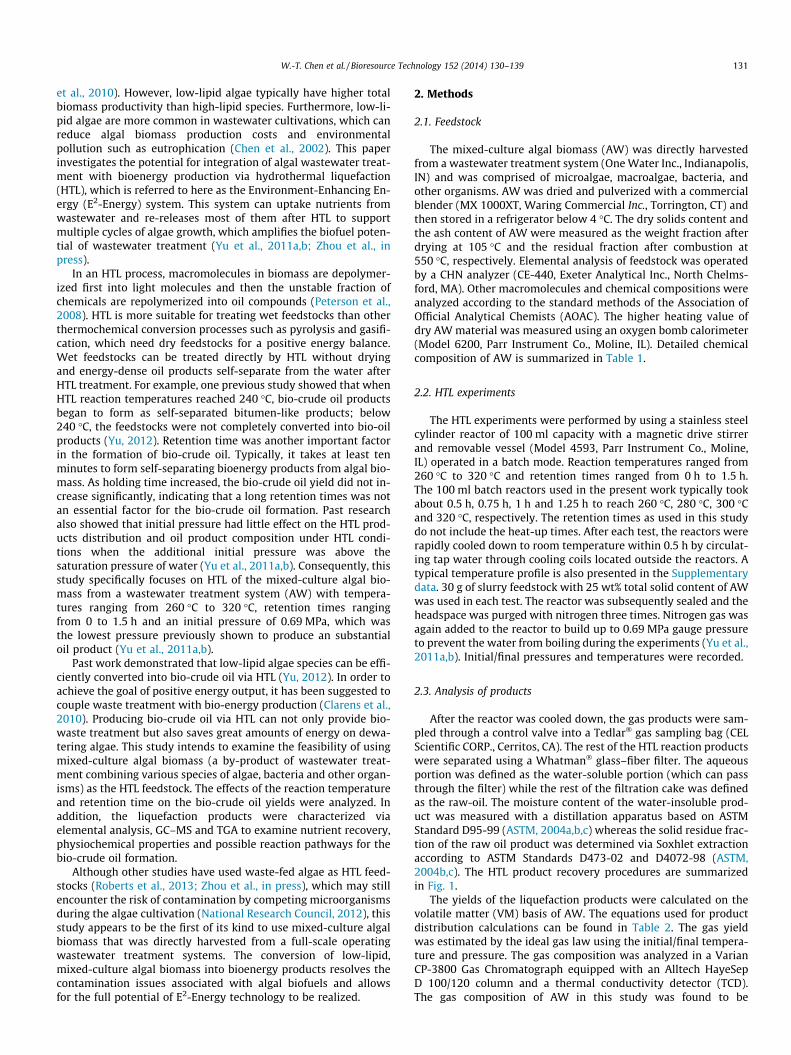
After the reactor was cooled down, the gas products were sam-pled through a control valve into a Tedlar� gas sampling bag (CELScientific CORP., Cerritos, CA). The rest of the HTL reaction productswere separated using a Whatman� glass–fiber filter. The aqueousportion was defined as the water-soluble portion (which can passthrough the filter) while the rest of the filtration cake was definedas the raw-oil. The moisture content of the water-insoluble prod-uct was measured with a distillation apparatus based on ASTMStandard D95-99 (ASTM, 2004a,b,c) whereas the solid residue frac-tion of the raw oil product was determined via Soxhlet extractionaccording to ASTM Standards D473-02 and D4072-98 (ASTM,2004b,c). The HTL product recovery procedures are summarizedin Fig. 1.
The yields of the liquefaction products were calculated on thevolatile matter (VM) basis of AW. The equations used for productdistribution calculations can be found in Table 2. The gas yieldwas estimated by the ideal gas law using the initial/final tempera-ture and pressure. The gas composition was analyzed in a VarianCP-3800 Gas Chromatograph equipped with an Alltech HayeSepD 100/120 column and a thermal conductivity detector (TCD).The gas composition of AW in this study was found to be
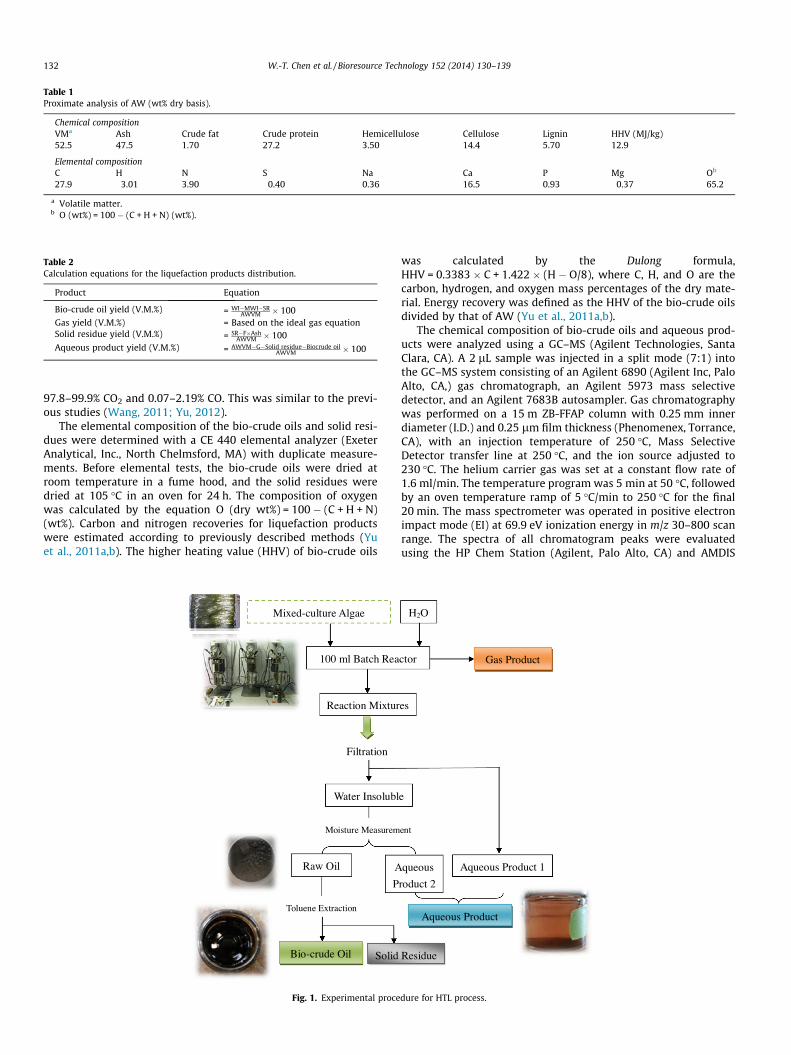
Table 1Proximate analysis of AW (wt% dry basis).
Chemical compositionVMa Ash Crude fat Crude protein Hemicellulose Cellulose Lignin HHV (MJ/kg)52.5 47.5 1.70 27.2 3.50 14.4 5.70 12.9
Elemental compositionC H N S Na Ca P Mg Ob
27.9 3.01 3.90 0.40 0.36 16.5 0.93 0.37 65.2
a Volatile matter.b O (wt%) = 100 � (C + H + N) (wt%).
Table 2Calculation equations for the liquefaction products distribution.
Product Equation
Bio-crude oil yield (V.M.%) = WI�MWI�SRAWVM � 100
Gas yield (V.M.%) = Based on the ideal gas equationSolid residue yield (V.M.%) = SR�F�Ash
AWVM � 100Aqueous product yield (V.M.%) = AWVM�G�Solid residue�Biocrude oil
AWVM � 100
132 W.-T. Chen et al. / Bioresource Technology 152 (2014) 130–139
97.8–99.9% CO2 and 0.07–2.19% CO. This was similar to the previ-ous studies (Wang, 2011; Yu, 2012).
The elemental composition of the bio-crude oils and solid resi-dues were determined with a CE 440 elemental analyzer (ExeterAnalytical, Inc., North Chelmsford, MA) with duplicate measure-ments. Before elemental tests, the bio-crude oils were dried atroom temperature in a fume hood, and the solid residues weredried at 105 �C in an oven for 24 h. The composition of oxygenwas calculated by the equation O (dry wt%) = 100 � (C + H + N)(wt%). Carbon and nitrogen recoveries for liquefaction productswere estimated according to previously described methods (Yuet al., 2011a,b). The higher heating value (HHV) of bio-crude oils
Mixed-culture Algae
100 ml Batch Rea
Reaction Mixtur
Filtration
Water Insolubl
Moisture Measurem
Raw Oil A
P
Toluene Extraction
Bio-crude Oil Solid
Fig. 1. Experimental proce
was calculated by the Dulong formula,HHV = 0.3383 � C + 1.422 � (H � O/8), where C, H, and O are thecarbon, hydrogen, and oxygen mass percentages of the dry mate-rial. Energy recovery was defined as the HHV of the bio-crude oilsdivided by that of AW (Yu et al., 2011a,b).
The chemical composition of bio-crude oils and aqueous prod-ucts were analyzed using a GC–MS (Agilent Technologies, SantaClara, CA). A 2 lL sample was injected in a split mode (7:1) intothe GC–MS system consisting of an Agilent 6890 (Agilent Inc, PaloAlto, CA,) gas chromatograph, an Agilent 5973 mass selectivedetector, and an Agilent 7683B autosampler. Gas chromatographywas performed on a 15 m ZB-FFAP column with 0.25 mm innerdiameter (I.D.) and 0.25 lm film thickness (Phenomenex, Torrance,CA), with an injection temperature of 250 �C, Mass SelectiveDetector transfer line at 250 �C, and the ion source adjusted to230 �C. The helium carrier gas was set at a constant flow rate of1.6 ml/min. The temperature program was 5 min at 50 �C, followedby an oven temperature ramp of 5 �C/min to 250 �C for the final20 min. The mass spectrometer was operated in positive electronimpact mode (EI) at 69.9 eV ionization energy in m/z 30–800 scanrange. The spectra of all chromatogram peaks were evaluatedusing the HP Chem Station (Agilent, Palo Alto, CA) and AMDIS
H2O
ctor Gas Product
es
e
ent
queous
roduct 2
Aqueous Product 1
Aqueous Product
Residue
dure for HTL process.
(a) (b)
(c) (d)
Fig. 2. Effect of reaction temperature and retention time on yields of liquefaction products: (a) bio-crude oil, (b) solid residue, (c) aqueous phase products, and (d) gasproducts.
W.-T. Chen et al. / Bioresource Technology 152 (2014) 130–139 133
(NIST, Gaithersburg, MD) programs. The spectra of all chromato-gram peaks were compared with an electron impact mass spec-trum from NIST Mass Spectral Database (NIST08) and W8N08library (John Wiley & Sons, Inc., Hoboken, NJ). To allow comparisonbetween samples, all data were normalized to internal standards:isopentanoic acid (0.1 lM) for aqueous extracts and pentadecanoicacid methyl ester (0.5 lM) for toluene extracts.
Thermogravimetric analysis (TGA) of bio-crude oils and solidresidues were performed on a Q50 TGA (TA Instruments, Schaum-burg, IL) from 110 �C to 800 �C in 60.0 ml/min N2 at 10 �C/min toestimate the boiling point distribution. Bio-crude oils and solid res-idues were dried naturally in the fume hood for 24 h and then sub-ject to TGA analysis.
3. Results and discussion
3.1. HTL products yields
In order to investigate the effect of temperature and retentiontime on products yields from HTL conversion of AW, temperaturesranging from 260 to 320 �C and retention times ranging from 0 to1.5 h were applied to the HTL tests. As shown in Fig. 2, the bio-crude oil yields ranged from 17.2% to 49.9% (VM). The highestbio-crude oil yield was realized at 300 �C with 1 h retention time.Compared to other studies (Anastasakis and Ross, 2011; Robertset al., 2013; Valdez et al., 2012; Vardon et al., 2011; Yu et al.,2011a,b), the highest bio-crude oil yield presented in this workwas comparable but slightly higher. The bio-crude oil yields gener-ally increased with reaction temperature. However, when the reac-tion temperature reached 320 �C, the bio-crude oil yields weresimilar to or lower than yields at 300 �C. This suggests that thebio-crude oil may be further decomposed into char/gas at highertemperatures. Similarly, increased retention times did not consis-tently increase bio-crude oil yields.
Fig. 2 indicates that at relatively low temperatures (260 and280 �C), AW was likely transformed into solid residues or aqueous
products, instead of bio-crude oils. When the temperatures in-creased beyond 300 �C with retention times of 0 and 0.5 h, therewere more bio-crude oils or solid residues rather than aqueousproducts. This inferred that the aqueous products may tend to beconverted into bio-crude oils when temperature increases. Thisobservation was also consistent with a previous study suggestingthe formation of bio-crude oil from water-soluble products (Valdezet al., 2012). Since dry AW contains about 25% lignocellulose, bio-crude oils converted from this type of algal feedstock may requirehigher temperatures than those produced from high-protein orhigh-lipid algae. Similar results were found in a study transformingvarious model compounds into bio-crude oil via HTL (Wang, 2011).Liquefaction product distributions also illustrated that the reactiontemperature significantly affected the liquefaction product yields.
The gas product yields were least affected by the retention timeor reaction temperature in the present work. However, as the tem-perature exceeded a specific point (300 �C), the gas productsgreatly increased. One previous work showed that the gas productyields were significantly increased when the reaction temperatureincreased from 320 to 380 �C (Li et al., 2012). Notably, the gasyields in the current work were lower than several previous stud-ies using pure species algae as HTL feedstock (Anastasakis andRoss, 2011; Yu, 2012). The existence of calcium carbonate in thefeedstock may affect the solubility of carbon dioxide. Under HTL,carbon dioxide may partly dissolve in water and react with calciumcarbonate to form a calcium bicarbonate solution. GC–MS analysisshowed that the aqueous products contain carbon dioxide.
3.2. Analysis of bio-crude oils
3.2.1. Elemental analysis and higher heating values (HHVs)Fig. 2 reveals that the bio-crude oil yields were maximized with
a retention time of 1 h and a reaction temperature of 300 �C. There-fore, bio-crude oils produced at 300 �C or with a 1 h retention timewere selected for further characterization to elucidate HTL reactionefficacy. Table 3 summarizes the results of ultimate analysis, high-
134 W.-T. Chen et al. / Bioresource Technology 152 (2014) 130–139
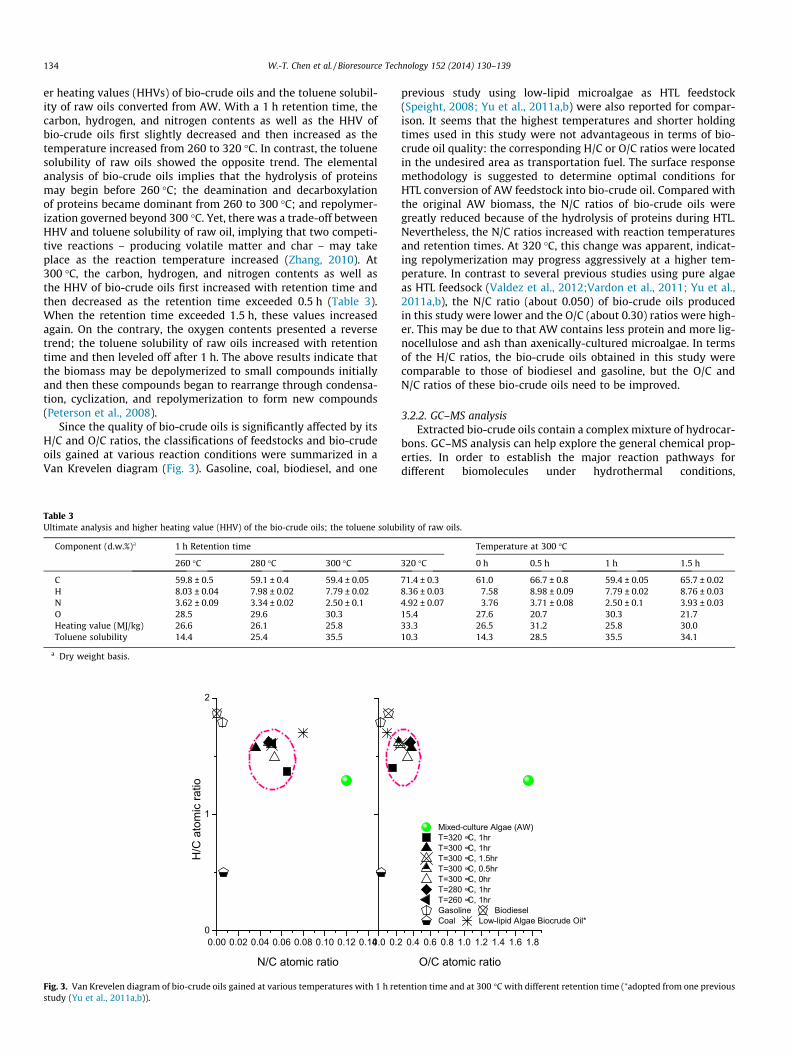
er heating values (HHVs) of bio-crude oils and the toluene solubil-ity of raw oils converted from AW. With a 1 h retention time, thecarbon, hydrogen, and nitrogen contents as well as the HHV ofbio-crude oils first slightly decreased and then increased as thetemperature increased from 260 to 320 �C. In contrast, the toluenesolubility of raw oils showed the opposite trend. The elementalanalysis of bio-crude oils implies that the hydrolysis of proteinsmay begin before 260 �C; the deamination and decarboxylationof proteins became dominant from 260 to 300 �C; and repolymer-ization governed beyond 300 �C. Yet, there was a trade-off betweenHHV and toluene solubility of raw oil, implying that two competi-tive reactions – producing volatile matter and char – may takeplace as the reaction temperature increased (Zhang, 2010). At300 �C, the carbon, hydrogen, and nitrogen contents as well asthe HHV of bio-crude oils first increased with retention time andthen decreased as the retention time exceeded 0.5 h (Table 3).When the retention time exceeded 1.5 h, these values increasedagain. On the contrary, the oxygen contents presented a reversetrend; the toluene solubility of raw oils increased with retentiontime and then leveled off after 1 h. The above results indicate thatthe biomass may be depolymerized to small compounds initiallyand then these compounds began to rearrange through condensa-tion, cyclization, and repolymerization to form new compounds(Peterson et al., 2008).
Since the quality of bio-crude oils is significantly affected by itsH/C and O/C ratios, the classifications of feedstocks and bio-crudeoils gained at various reaction conditions were summarized in aVan Krevelen diagram (Fig. 3). Gasoline, coal, biodiesel, and one
Table 3Ultimate analysis and higher heating value (HHV) of the bio-crude oils; the toluene solub
Component (d.w.%)a 1 h Retention time
260 �C 280 �C 300 �C
C 59.8 ± 0.5 59.1 ± 0.4 59.4 ± 0.05H 8.03 ± 0.04 7.98 ± 0.02 7.79 ± 0.02N 3.62 ± 0.09 3.34 ± 0.02 2.50 ± 0.1O 28.5 29.6 30.3Heating value (MJ/kg) 26.6 26.1 25.8Toluene solubility 14.4 25.4 35.5
a Dry weight basis.
0.00 0.02 0.04 0.06 0.08 0.10 0.12 0.140
1
2
0.0 0.2
H/C
ato
mic
ratio
N/C atomic ratio
Fig. 3. Van Krevelen diagram of bio-crude oils gained at various temperatures with 1 h restudy (Yu et al., 2011a,b)).
previous study using low-lipid microalgae as HTL feedstock(Speight, 2008; Yu et al., 2011a,b) were also reported for compar-ison. It seems that the highest temperatures and shorter holdingtimes used in this study were not advantageous in terms of bio-crude oil quality: the corresponding H/C or O/C ratios were locatedin the undesired area as transportation fuel. The surface responsemethodology is suggested to determine optimal conditions forHTL conversion of AW feedstock into bio-crude oil. Compared withthe original AW biomass, the N/C ratios of bio-crude oils weregreatly reduced because of the hydrolysis of proteins during HTL.Nevertheless, the N/C ratios increased with reaction temperaturesand retention times. At 320 �C, this change was apparent, indicat-ing repolymerization may progress aggressively at a higher tem-perature. In contrast to several previous studies using pure algaeas HTL feedsock (Valdez et al., 2012;Vardon et al., 2011; Yu et al.,2011a,b), the N/C ratio (about 0.050) of bio-crude oils producedin this study were lower and the O/C (about 0.30) ratios were high-er. This may be due to that AW contains less protein and more lig-nocellulose and ash than axenically-cultured microalgae. In termsof the H/C ratios, the bio-crude oils obtained in this study werecomparable to those of biodiesel and gasoline, but the O/C andN/C ratios of these bio-crude oils need to be improved.
3.2.2. GC–MS analysisExtracted bio-crude oils contain a complex mixture of hydrocar-
bons. GC–MS analysis can help explore the general chemical prop-erties. In order to establish the major reaction pathways fordifferent biomolecules under hydrothermal conditions,
ility of raw oils.
Temperature at 300 �C
320 �C 0 h 0.5 h 1 h 1.5 h
71.4 ± 0.3 61.0 66.7 ± 0.8 59.4 ± 0.05 65.7 ± 0.028.36 ± 0.03 7.58 8.98 ± 0.09 7.79 ± 0.02 8.76 ± 0.034.92 ± 0.07 3.76 3.71 ± 0.08 2.50 ± 0.1 3.93 ± 0.0315.4 27.6 20.7 30.3 21.733.3 26.5 31.2 25.8 30.010.3 14.3 28.5 35.5 34.1
0.4 0.6 0.8 1.0 1.2 1.4 1.6 1.8
Mixed-culture Algae (AW)T=320 ∞C, 1hrT=300 ∞C, 1hrT=300 ∞C, 1.5hrT=300 ∞C, 0.5hrT=300 ∞C, 0hrT=280 ∞C, 1hrT=260 ∞C, 1hrGasoline BiodieselCoal Low-lipid Algae Biocrude Oil*
O/C atomic ratio
tention time and at 300 �C with different retention time (⁄adopted from one previous
Hydrocarbons
Cyclic Hydrocarbons Fatty Acid Derivatives
Straight Amide DerivativesN-Heterocyclic cmpds.
Cyclic Oxygenates Phenols & Phytosterols Esters & Ketones
0.0%
10.0%
20.0%
30.0%
40.0%
50.0%
60.0%
70.0%
80.0%
90.0%
100.0%
% o
f T
ota
l R
elat
ive
Pea
k A
rea
(%)
Reaction Conditions (-)
Straight Amines…
Oxygenates
Ketones
Diazole
Fatty acids…
AlkaloidsPhenol & Phytosterol
Organic AcidCyclic Amines…
0.0%
5.0%
10.0%
15.0%
20.0%
25.0%
30.0%
35.0%
40.0%
45.0%
50.0%
1hr/260 °C1hr/280 °C
0 hr/300 °C0.5 hr/300 °C
1hr/300 °C1.5 hr/300 °C
1hr/320 °C
% o
f Tot
al R
elat
ive
Pea
k A
rea
(%)
Reaction Conditions (-)
(a)
(b)
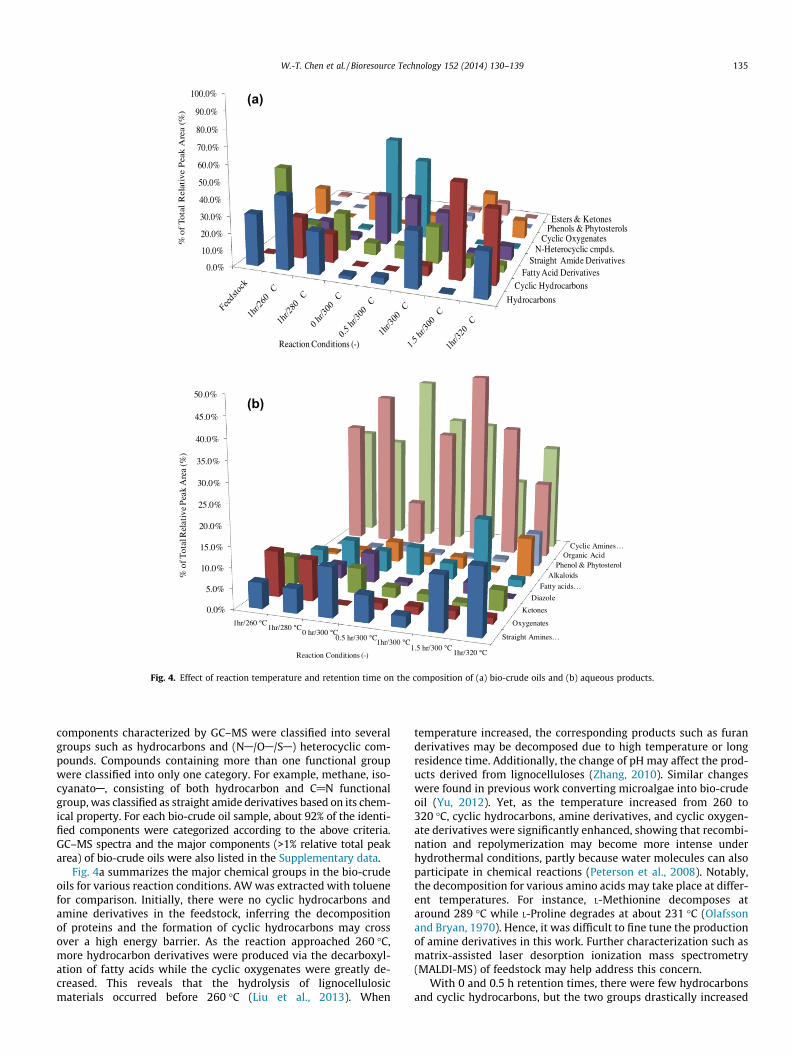
Fig. 4. Effect of reaction temperature and retention time on the composition of (a) bio-crude oils and (b) aqueous products.
W.-T. Chen et al. / Bioresource Technology 152 (2014) 130–139 135
components characterized by GC–MS were classified into severalgroups such as hydrocarbons and (NA/OA/SA) heterocyclic com-pounds. Compounds containing more than one functional groupwere classified into only one category. For example, methane, iso-cyanatoA, consisting of both hydrocarbon and C@N functionalgroup, was classified as straight amide derivatives based on its chem-ical property. For each bio-crude oil sample, about 92% of the identi-fied components were categorized according to the above criteria.GC–MS spectra and the major components (>1% relative total peakarea) of bio-crude oils were also listed in the Supplementary data.
Fig. 4a summarizes the major chemical groups in the bio-crudeoils for various reaction conditions. AW was extracted with toluenefor comparison. Initially, there were no cyclic hydrocarbons andamine derivatives in the feedstock, inferring the decompositionof proteins and the formation of cyclic hydrocarbons may crossover a high energy barrier. As the reaction approached 260 �C,more hydrocarbon derivatives were produced via the decarboxyl-ation of fatty acids while the cyclic oxygenates were greatly de-creased. This reveals that the hydrolysis of lignocellulosicmaterials occurred before 260 �C (Liu et al., 2013). When
temperature increased, the corresponding products such as furanderivatives may be decomposed due to high temperature or longresidence time. Additionally, the change of pH may affect the prod-ucts derived from lignocelluloses (Zhang, 2010). Similar changeswere found in previous work converting microalgae into bio-crudeoil (Yu, 2012). Yet, as the temperature increased from 260 to320 �C, cyclic hydrocarbons, amine derivatives, and cyclic oxygen-ate derivatives were significantly enhanced, showing that recombi-nation and repolymerization may become more intense underhydrothermal conditions, partly because water molecules can alsoparticipate in chemical reactions (Peterson et al., 2008). Notably,the decomposition for various amino acids may take place at differ-ent temperatures. For instance, L-Methionine decomposes ataround 289 �C while L-Proline degrades at about 231 �C (Olafssonand Bryan, 1970). Hence, it was difficult to fine tune the productionof amine derivatives in this work. Further characterization such asmatrix-assisted laser desorption ionization mass spectrometry(MALDI-MS) of feedstock may help address this concern.
With 0 and 0.5 h retention times, there were few hydrocarbonsand cyclic hydrocarbons, but the two groups drastically increased
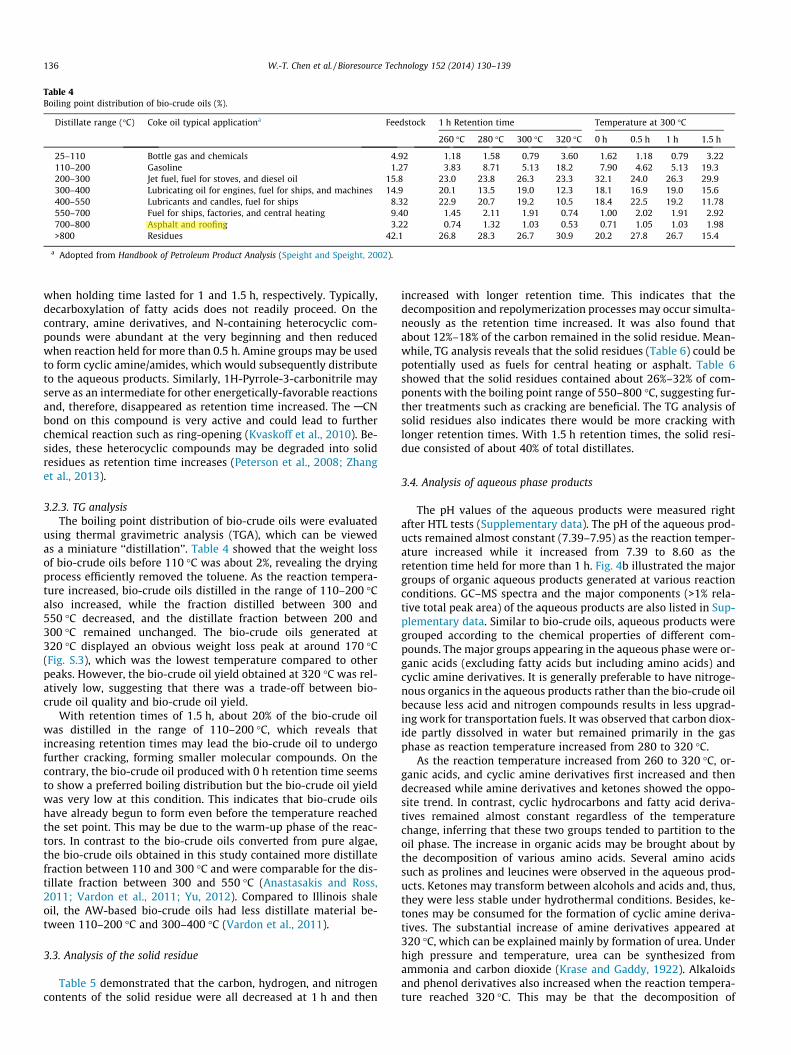
Table 4Boiling point distribution of bio-crude oils (%).
Distillate range (�C) Coke oil typical applicationa Feedstock 1 h Retention time Temperature at 300 �C
260 �C 280 �C 300 �C 320 �C 0 h 0.5 h 1 h 1.5 h
25–110 Bottle gas and chemicals 4.92 1.18 1.58 0.79 3.60 1.62 1.18 0.79 3.22110–200 Gasoline 1.27 3.83 8.71 5.13 18.2 7.90 4.62 5.13 19.3200–300 Jet fuel, fuel for stoves, and diesel oil 15.8 23.0 23.8 26.3 23.3 32.1 24.0 26.3 29.9300–400 Lubricating oil for engines, fuel for ships, and machines 14.9 20.1 13.5 19.0 12.3 18.1 16.9 19.0 15.6400–550 Lubricants and candles, fuel for ships 8.32 22.9 20.7 19.2 10.5 18.4 22.5 19.2 11.78550–700 Fuel for ships, factories, and central heating 9.40 1.45 2.11 1.91 0.74 1.00 2.02 1.91 2.92700–800 Asphalt and roofing 3.22 0.74 1.32 1.03 0.53 0.71 1.05 1.03 1.98>800 Residues 42.1 26.8 28.3 26.7 30.9 20.2 27.8 26.7 15.4
a Adopted from Handbook of Petroleum Product Analysis (Speight and Speight, 2002).
136 W.-T. Chen et al. / Bioresource Technology 152 (2014) 130–139
when holding time lasted for 1 and 1.5 h, respectively. Typically,decarboxylation of fatty acids does not readily proceed. On thecontrary, amine derivatives, and N-containing heterocyclic com-pounds were abundant at the very beginning and then reducedwhen reaction held for more than 0.5 h. Amine groups may be usedto form cyclic amine/amides, which would subsequently distributeto the aqueous products. Similarly, 1H-Pyrrole-3-carbonitrile mayserve as an intermediate for other energetically-favorable reactionsand, therefore, disappeared as retention time increased. The ACNbond on this compound is very active and could lead to furtherchemical reaction such as ring-opening (Kvaskoff et al., 2010). Be-sides, these heterocyclic compounds may be degraded into solidresidues as retention time increases (Peterson et al., 2008; Zhanget al., 2013).
3.2.3. TG analysisThe boiling point distribution of bio-crude oils were evaluated
using thermal gravimetric analysis (TGA), which can be viewedas a miniature ‘‘distillation’’. Table 4 showed that the weight lossof bio-crude oils before 110 �C was about 2%, revealing the dryingprocess efficiently removed the toluene. As the reaction tempera-ture increased, bio-crude oils distilled in the range of 110–200 �Calso increased, while the fraction distilled between 300 and550 �C decreased, and the distillate fraction between 200 and300 �C remained unchanged. The bio-crude oils generated at320 �C displayed an obvious weight loss peak at around 170 �C(Fig. S.3), which was the lowest temperature compared to otherpeaks. However, the bio-crude oil yield obtained at 320 �C was rel-atively low, suggesting that there was a trade-off between bio-crude oil quality and bio-crude oil yield.
With retention times of 1.5 h, about 20% of the bio-crude oilwas distilled in the range of 110–200 �C, which reveals thatincreasing retention times may lead the bio-crude oil to undergofurther cracking, forming smaller molecular compounds. On thecontrary, the bio-crude oil produced with 0 h retention time seemsto show a preferred boiling distribution but the bio-crude oil yieldwas very low at this condition. This indicates that bio-crude oilshave already begun to form even before the temperature reachedthe set point. This may be due to the warm-up phase of the reac-tors. In contrast to the bio-crude oils converted from pure algae,the bio-crude oils obtained in this study contained more distillatefraction between 110 and 300 �C and were comparable for the dis-tillate fraction between 300 and 550 �C (Anastasakis and Ross,2011; Vardon et al., 2011; Yu, 2012). Compared to Illinois shaleoil, the AW-based bio-crude oils had less distillate material be-tween 110–200 �C and 300–400 �C (Vardon et al., 2011).
3.3. Analysis of the solid residue
Table 5 demonstrated that the carbon, hydrogen, and nitrogencontents of the solid residue were all decreased at 1 h and then
increased with longer retention time. This indicates that thedecomposition and repolymerization processes may occur simulta-neously as the retention time increased. It was also found thatabout 12%–18% of the carbon remained in the solid residue. Mean-while, TG analysis reveals that the solid residues (Table 6) could bepotentially used as fuels for central heating or asphalt. Table 6showed that the solid residues contained about 26%–32% of com-ponents with the boiling point range of 550–800 �C, suggesting fur-ther treatments such as cracking are beneficial. The TG analysis ofsolid residues also indicates there would be more cracking withlonger retention times. With 1.5 h retention times, the solid resi-due consisted of about 40% of total distillates.
3.4. Analysis of aqueous phase products
The pH values of the aqueous products were measured rightafter HTL tests (Supplementary data). The pH of the aqueous prod-ucts remained almost constant (7.39–7.95) as the reaction temper-ature increased while it increased from 7.39 to 8.60 as theretention time held for more than 1 h. Fig. 4b illustrated the majorgroups of organic aqueous products generated at various reactionconditions. GC–MS spectra and the major components (>1% rela-tive total peak area) of the aqueous products are also listed in Sup-plementary data. Similar to bio-crude oils, aqueous products weregrouped according to the chemical properties of different com-pounds. The major groups appearing in the aqueous phase were or-ganic acids (excluding fatty acids but including amino acids) andcyclic amine derivatives. It is generally preferable to have nitroge-nous organics in the aqueous products rather than the bio-crude oilbecause less acid and nitrogen compounds results in less upgrad-ing work for transportation fuels. It was observed that carbon diox-ide partly dissolved in water but remained primarily in the gasphase as reaction temperature increased from 280 to 320 �C.
As the reaction temperature increased from 260 to 320 �C, or-ganic acids, and cyclic amine derivatives first increased and thendecreased while amine derivatives and ketones showed the oppo-site trend. In contrast, cyclic hydrocarbons and fatty acid deriva-tives remained almost constant regardless of the temperaturechange, inferring that these two groups tended to partition to theoil phase. The increase in organic acids may be brought about bythe decomposition of various amino acids. Several amino acidssuch as prolines and leucines were observed in the aqueous prod-ucts. Ketones may transform between alcohols and acids and, thus,they were less stable under hydrothermal conditions. Besides, ke-tones may be consumed for the formation of cyclic amine deriva-tives. The substantial increase of amine derivatives appeared at320 �C, which can be explained mainly by formation of urea. Underhigh pressure and temperature, urea can be synthesized fromammonia and carbon dioxide (Krase and Gaddy, 1922). Alkaloidsand phenol derivatives also increased when the reaction tempera-ture reached 320 �C. This may be that the decomposition of
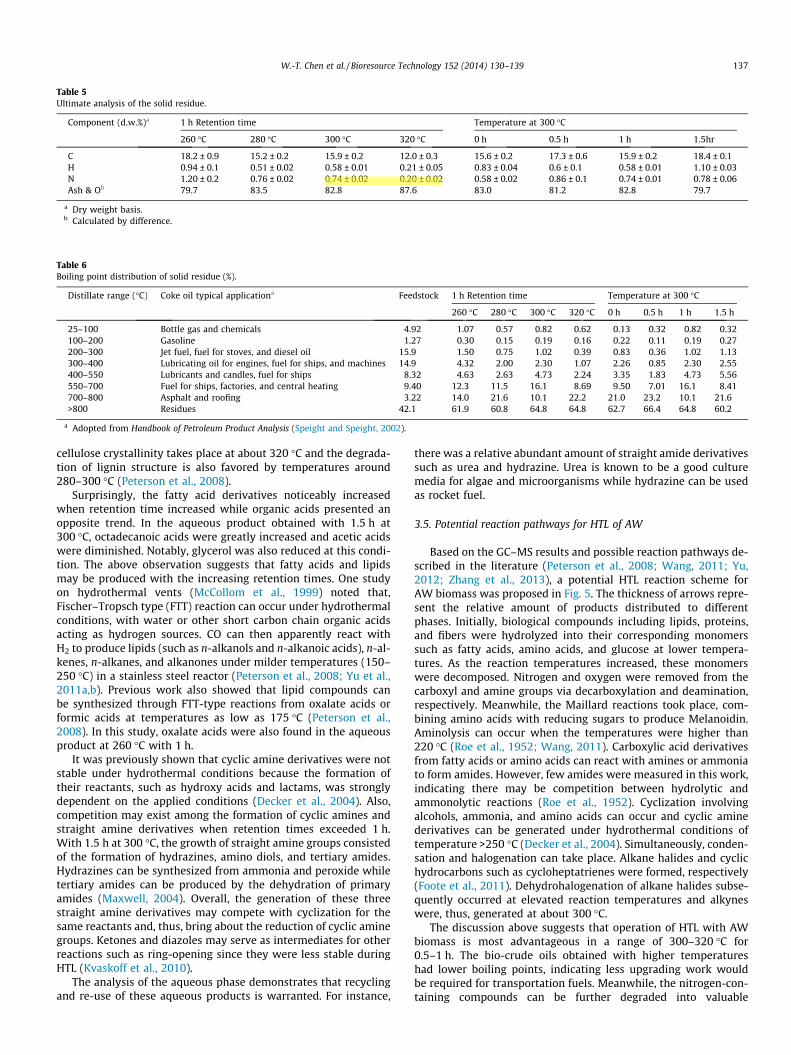
Table 5Ultimate analysis of the solid residue.
Component (d.w.%)a 1 h Retention time Temperature at 300 �C
260 �C 280 �C 300 �C 320 �C 0 h 0.5 h 1 h 1.5hr
C 18.2 ± 0.9 15.2 ± 0.2 15.9 ± 0.2 12.0 ± 0.3 15.6 ± 0.2 17.3 ± 0.6 15.9 ± 0.2 18.4 ± 0.1H 0.94 ± 0.1 0.51 ± 0.02 0.58 ± 0.01 0.21 ± 0.05 0.83 ± 0.04 0.6 ± 0.1 0.58 ± 0.01 1.10 ± 0.03N 1.20 ± 0.2 0.76 ± 0.02 0.74 ± 0.02 0.20 ± 0.02 0.58 ± 0.02 0.86 ± 0.1 0.74 ± 0.01 0.78 ± 0.06Ash & Ob 79.7 83.5 82.8 87.6 83.0 81.2 82.8 79.7
a Dry weight basis.b Calculated by difference.
Table 6Boiling point distribution of solid residue (%).
Distillate range (�C) Coke oil typical applicationa Feedstock 1 h Retention time Temperature at 300 �C
260 �C 280 �C 300 �C 320 �C 0 h 0.5 h 1 h 1.5 h
25–100 Bottle gas and chemicals 4.92 1.07 0.57 0.82 0.62 0.13 0.32 0.82 0.32100–200 Gasoline 1.27 0.30 0.15 0.19 0.16 0.22 0.11 0.19 0.27200–300 Jet fuel, fuel for stoves, and diesel oil 15.9 1.50 0.75 1.02 0.39 0.83 0.36 1.02 1.13300–400 Lubricating oil for engines, fuel for ships, and machines 14.9 4.32 2.00 2.30 1.07 2.26 0.85 2.30 2.55400–550 Lubricants and candles, fuel for ships 8.32 4.63 2.63 4.73 2.24 3.35 1.83 4.73 5.56550–700 Fuel for ships, factories, and central heating 9.40 12.3 11.5 16.1 8.69 9.50 7.01 16.1 8.41700–800 Asphalt and roofing 3.22 14.0 21.6 10.1 22.2 21.0 23.2 10.1 21.6>800 Residues 42.1 61.9 60.8 64.8 64.8 62.7 66.4 64.8 60.2
a Adopted from Handbook of Petroleum Product Analysis (Speight and Speight, 2002).
W.-T. Chen et al. / Bioresource Technology 152 (2014) 130–139 137
cellulose crystallinity takes place at about 320 �C and the degrada-tion of lignin structure is also favored by temperatures around280–300 �C (Peterson et al., 2008).
Surprisingly, the fatty acid derivatives noticeably increasedwhen retention time increased while organic acids presented anopposite trend. In the aqueous product obtained with 1.5 h at300 �C, octadecanoic acids were greatly increased and acetic acidswere diminished. Notably, glycerol was also reduced at this condi-tion. The above observation suggests that fatty acids and lipidsmay be produced with the increasing retention times. One studyon hydrothermal vents (McCollom et al., 1999) noted that,Fischer–Tropsch type (FTT) reaction can occur under hydrothermalconditions, with water or other short carbon chain organic acidsacting as hydrogen sources. CO can then apparently react withH2 to produce lipids (such as n-alkanols and n-alkanoic acids), n-al-kenes, n-alkanes, and alkanones under milder temperatures (150–250 �C) in a stainless steel reactor (Peterson et al., 2008; Yu et al.,2011a,b). Previous work also showed that lipid compounds canbe synthesized through FTT-type reactions from oxalate acids orformic acids at temperatures as low as 175 �C (Peterson et al.,2008). In this study, oxalate acids were also found in the aqueousproduct at 260 �C with 1 h.
It was previously shown that cyclic amine derivatives were notstable under hydrothermal conditions because the formation oftheir reactants, such as hydroxy acids and lactams, was stronglydependent on the applied conditions (Decker et al., 2004). Also,competition may exist among the formation of cyclic amines andstraight amine derivatives when retention times exceeded 1 h.With 1.5 h at 300 �C, the growth of straight amine groups consistedof the formation of hydrazines, amino diols, and tertiary amides.Hydrazines can be synthesized from ammonia and peroxide whiletertiary amides can be produced by the dehydration of primaryamides (Maxwell, 2004). Overall, the generation of these threestraight amine derivatives may compete with cyclization for thesame reactants and, thus, bring about the reduction of cyclic aminegroups. Ketones and diazoles may serve as intermediates for otherreactions such as ring-opening since they were less stable duringHTL (Kvaskoff et al., 2010).
The analysis of the aqueous phase demonstrates that recyclingand re-use of these aqueous products is warranted. For instance,
there was a relative abundant amount of straight amide derivativessuch as urea and hydrazine. Urea is known to be a good culturemedia for algae and microorganisms while hydrazine can be usedas rocket fuel.
3.5. Potential reaction pathways for HTL of AW
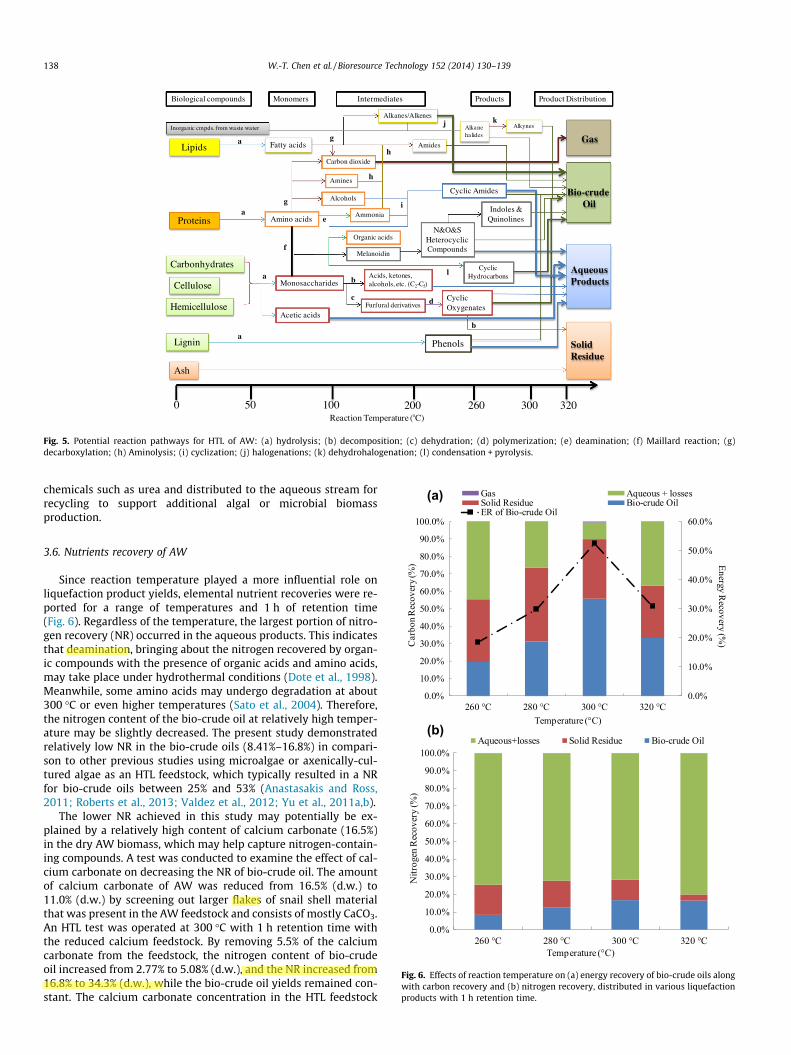
Based on the GC–MS results and possible reaction pathways de-scribed in the literature (Peterson et al., 2008; Wang, 2011; Yu,2012; Zhang et al., 2013), a potential HTL reaction scheme forAW biomass was proposed in Fig. 5. The thickness of arrows repre-sent the relative amount of products distributed to differentphases. Initially, biological compounds including lipids, proteins,and fibers were hydrolyzed into their corresponding monomerssuch as fatty acids, amino acids, and glucose at lower tempera-tures. As the reaction temperatures increased, these monomerswere decomposed. Nitrogen and oxygen were removed from thecarboxyl and amine groups via decarboxylation and deamination,respectively. Meanwhile, the Maillard reactions took place, com-bining amino acids with reducing sugars to produce Melanoidin.Aminolysis can occur when the temperatures were higher than220 �C (Roe et al., 1952; Wang, 2011). Carboxylic acid derivativesfrom fatty acids or amino acids can react with amines or ammoniato form amides. However, few amides were measured in this work,indicating there may be competition between hydrolytic andammonolytic reactions (Roe et al., 1952). Cyclization involvingalcohols, ammonia, and amino acids can occur and cyclic aminederivatives can be generated under hydrothermal conditions oftemperature >250 �C (Decker et al., 2004). Simultaneously, conden-sation and halogenation can take place. Alkane halides and cyclichydrocarbons such as cycloheptatrienes were formed, respectively(Foote et al., 2011). Dehydrohalogenation of alkane halides subse-quently occurred at elevated reaction temperatures and alkyneswere, thus, generated at about 300 �C.
The discussion above suggests that operation of HTL with AWbiomass is most advantageous in a range of 300–320 �C for0.5–1 h. The bio-crude oils obtained with higher temperatureshad lower boiling points, indicating less upgrading work wouldbe required for transportation fuels. Meanwhile, the nitrogen-con-taining compounds can be further degraded into valuable
0 50 300200100 320Reaction Temperature ( C)
Ash
Solid Residue
Lignina
Phenols
Carbonhydrates
Hemicellulose
Cellulose
AqueousProducts
Bio-crudeOil
Product Distribution
Gas
a
Biological compounds
Monosaccharides
Monomers Intermediates Products
260
b
Acetic acidsFurfural derivatives
Inorganic cmpds. from waste water
Acids, ketones,alcohols, etc. (C2-C5)
c d Cyclic Oxygenates
b
Proteinsa
Amino acids e
Organic acids
fMelanoidin
N&O&S Heterocyclic Compounds
gIndoles &
Quinolines
Lipids
Amines
Alcohols
Carbon dioxide
Fatty acidsa g
Alkanes/Alkenes
Amides
Ammonia
h
h
i
Cyclic Amides
jAlkane halides
Alkynesk
Cyclic Hydrocarbonsl
Fig. 5. Potential reaction pathways for HTL of AW: (a) hydrolysis; (b) decomposition; (c) dehydration; (d) polymerization; (e) deamination; (f) Maillard reaction; (g)decarboxylation; (h) Aminolysis; (i) cyclization; (j) halogenations; (k) dehydrohalogenation; (l) condensation + pyrolysis.
(a)
138 W.-T. Chen et al. / Bioresource Technology 152 (2014) 130–139
chemicals such as urea and distributed to the aqueous stream forrecycling to support additional algal or microbial biomassproduction.
(b)
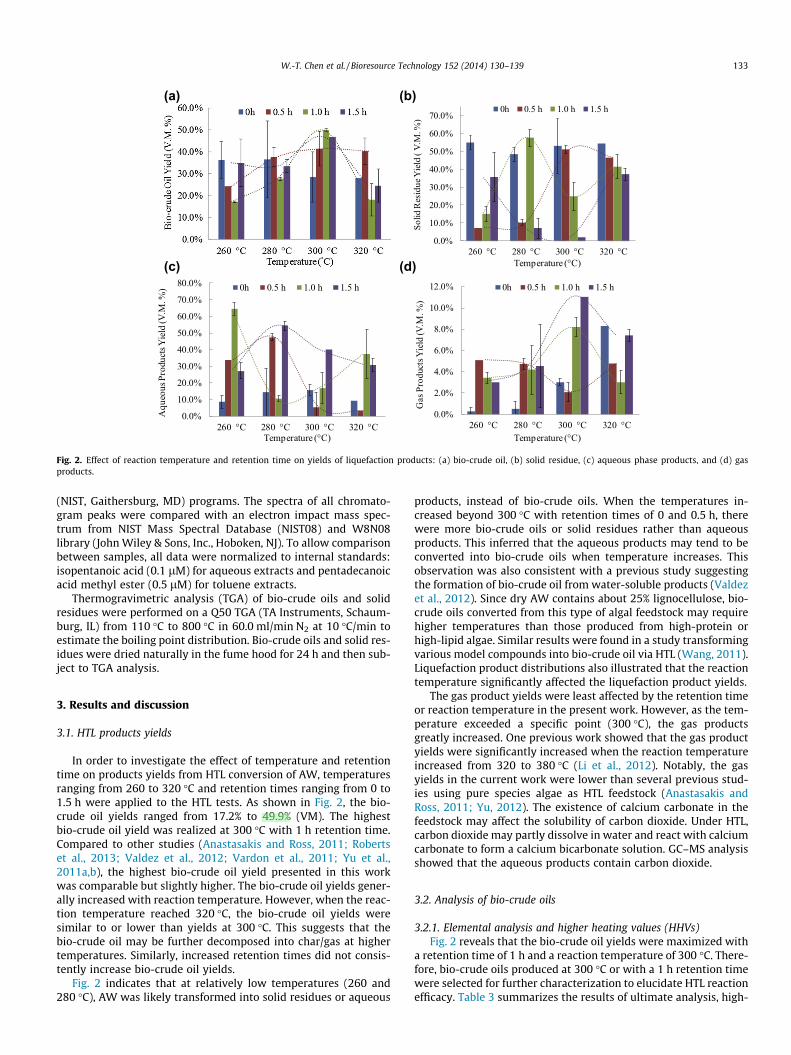
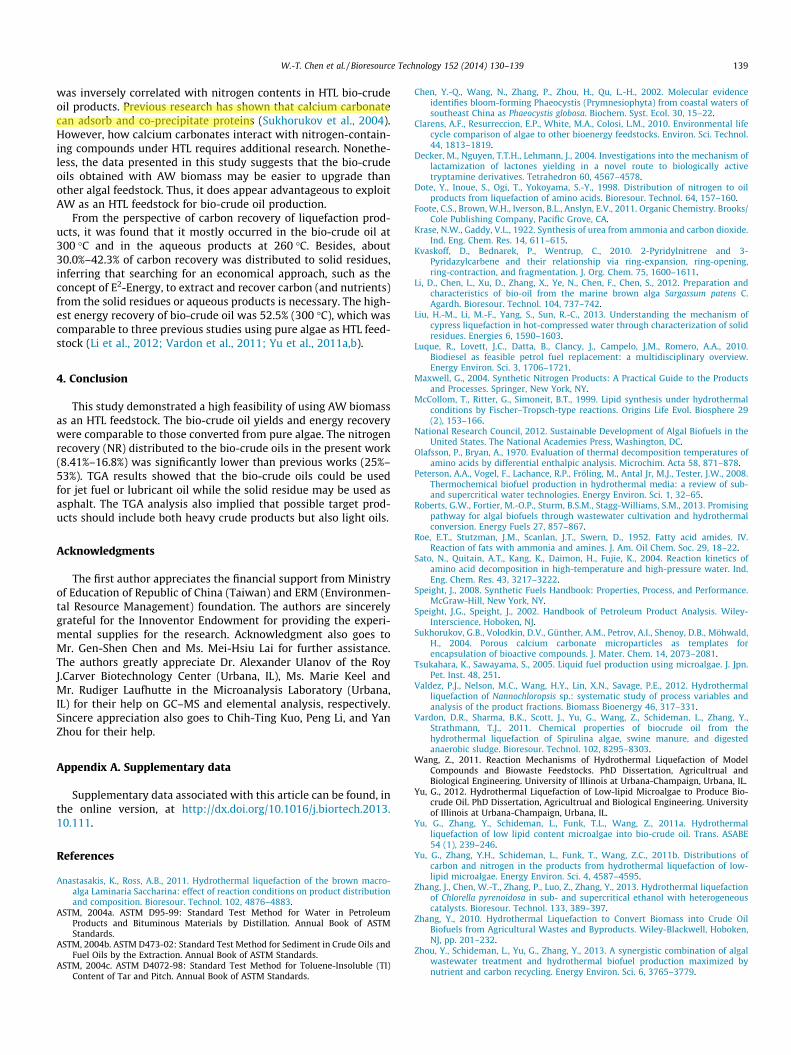
Fig. 6. Effects of reaction temperature on (a) energy recovery of bio-crude oils alongwith carbon recovery and (b) nitrogen recovery, distributed in various liquefactionproducts with 1 h retention time.
3.6. Nutrients recovery of AW
Since reaction temperature played a more influential role onliquefaction product yields, elemental nutrient recoveries were re-ported for a range of temperatures and 1 h of retention time(Fig. 6). Regardless of the temperature, the largest portion of nitro-gen recovery (NR) occurred in the aqueous products. This indicatesthat deamination, bringing about the nitrogen recovered by organ-ic compounds with the presence of organic acids and amino acids,may take place under hydrothermal conditions (Dote et al., 1998).Meanwhile, some amino acids may undergo degradation at about300 �C or even higher temperatures (Sato et al., 2004). Therefore,the nitrogen content of the bio-crude oil at relatively high temper-ature may be slightly decreased. The present study demonstratedrelatively low NR in the bio-crude oils (8.41%–16.8%) in compari-son to other previous studies using microalgae or axenically-cul-tured algae as an HTL feedstock, which typically resulted in a NRfor bio-crude oils between 25% and 53% (Anastasakis and Ross,2011; Roberts et al., 2013; Valdez et al., 2012; Yu et al., 2011a,b).
The lower NR achieved in this study may potentially be ex-plained by a relatively high content of calcium carbonate (16.5%)in the dry AW biomass, which may help capture nitrogen-contain-ing compounds. A test was conducted to examine the effect of cal-cium carbonate on decreasing the NR of bio-crude oil. The amountof calcium carbonate of AW was reduced from 16.5% (d.w.) to11.0% (d.w.) by screening out larger flakes of snail shell materialthat was present in the AW feedstock and consists of mostly CaCO3.An HTL test was operated at 300 �C with 1 h retention time withthe reduced calcium feedstock. By removing 5.5% of the calciumcarbonate from the feedstock, the nitrogen content of bio-crudeoil increased from 2.77% to 5.08% (d.w.), and the NR increased from16.8% to 34.3% (d.w.), while the bio-crude oil yields remained con-stant. The calcium carbonate concentration in the HTL feedstock
W.-T. Chen et al. / Bioresource Technology 152 (2014) 130–139 139
was inversely correlated with nitrogen contents in HTL bio-crudeoil products. Previous research has shown that calcium carbonatecan adsorb and co-precipitate proteins (Sukhorukov et al., 2004).However, how calcium carbonates interact with nitrogen-contain-ing compounds under HTL requires additional research. Nonethe-less, the data presented in this study suggests that the bio-crudeoils obtained with AW biomass may be easier to upgrade thanother algal feedstock. Thus, it does appear advantageous to exploitAW as an HTL feedstock for bio-crude oil production.
From the perspective of carbon recovery of liquefaction prod-ucts, it was found that it mostly occurred in the bio-crude oil at300 �C and in the aqueous products at 260 �C. Besides, about30.0%–42.3% of carbon recovery was distributed to solid residues,inferring that searching for an economical approach, such as theconcept of E2-Energy, to extract and recover carbon (and nutrients)from the solid residues or aqueous products is necessary. The high-est energy recovery of bio-crude oil was 52.5% (300 �C), which wascomparable to three previous studies using pure algae as HTL feed-stock (Li et al., 2012; Vardon et al., 2011; Yu et al., 2011a,b).
4. Conclusion
This study demonstrated a high feasibility of using AW biomassas an HTL feedstock. The bio-crude oil yields and energy recoverywere comparable to those converted from pure algae. The nitrogenrecovery (NR) distributed to the bio-crude oils in the present work(8.41%–16.8%) was significantly lower than previous works (25%–53%). TGA results showed that the bio-crude oils could be usedfor jet fuel or lubricant oil while the solid residue may be used asasphalt. The TGA analysis also implied that possible target prod-ucts should include both heavy crude products but also light oils.
Acknowledgments
The first author appreciates the financial support from Ministryof Education of Republic of China (Taiwan) and ERM (Environmen-tal Resource Management) foundation. The authors are sincerelygrateful for the Innoventor Endowment for providing the experi-mental supplies for the research. Acknowledgment also goes toMr. Gen-Shen Chen and Ms. Mei-Hsiu Lai for further assistance.The authors greatly appreciate Dr. Alexander Ulanov of the RoyJ.Carver Biotechnology Center (Urbana, IL), Ms. Marie Keel andMr. Rudiger Laufhutte in the Microanalysis Laboratory (Urbana,IL) for their help on GC–MS and elemental analysis, respectively.Sincere appreciation also goes to Chih-Ting Kuo, Peng Li, and YanZhou for their help.
Appendix A. Supplementary data
Supplementary data associated with this article can be found, inthe online version, at http://dx.doi.org/10.1016/j.biortech.2013.10.111.
References
Anastasakis, K., Ross, A.B., 2011. Hydrothermal liquefaction of the brown macro-alga Laminaria Saccharina: effect of reaction conditions on product distributionand composition. Bioresour. Technol. 102, 4876–4883.
ASTM, 2004a. ASTM D95-99: Standard Test Method for Water in PetroleumProducts and Bituminous Materials by Distillation. Annual Book of ASTMStandards.
ASTM, 2004b. ASTM D473-02: Standard Test Method for Sediment in Crude Oils andFuel Oils by the Extraction. Annual Book of ASTM Standards.
ASTM, 2004c. ASTM D4072-98: Standard Test Method for Toluene-Insoluble (TI)Content of Tar and Pitch. Annual Book of ASTM Standards.
Chen, Y.-Q., Wang, N., Zhang, P., Zhou, H., Qu, L.-H., 2002. Molecular evidenceidentifies bloom-forming Phaeocystis (Prymnesiophyta) from coastal waters ofsoutheast China as Phaeocystis globosa. Biochem. Syst. Ecol. 30, 15–22.
Clarens, A.F., Resurreccion, E.P., White, M.A., Colosi, L.M., 2010. Environmental lifecycle comparison of algae to other bioenergy feedstocks. Environ. Sci. Technol.44, 1813–1819.
Decker, M., Nguyen, T.T.H., Lehmann, J., 2004. Investigations into the mechanism oflactamization of lactones yielding in a novel route to biologically activetryptamine derivatives. Tetrahedron 60, 4567–4578.
Dote, Y., Inoue, S., Ogi, T., Yokoyama, S.-Y., 1998. Distribution of nitrogen to oilproducts from liquefaction of amino acids. Bioresour. Technol. 64, 157–160.
Foote, C.S., Brown, W.H., Iverson, B.L., Anslyn, E.V., 2011. Organic Chemistry. Brooks/Cole Publishing Company, Pacific Grove, CA.
Krase, N.W., Gaddy, V.L., 1922. Synthesis of urea from ammonia and carbon dioxide.Ind. Eng. Chem. Res. 14, 611–615.
Kvaskoff, D., Bednarek, P., Wentrup, C., 2010. 2-Pyridylnitrene and 3-Pyridazylcarbene and their relationship via ring-expansion, ring-opening,ring-contraction, and fragmentation. J. Org. Chem. 75, 1600–1611.
Li, D., Chen, L., Xu, D., Zhang, X., Ye, N., Chen, F., Chen, S., 2012. Preparation andcharacteristics of bio-oil from the marine brown alga Sargassum patens C.Agardh. Bioresour. Technol. 104, 737–742.
Liu, H.-M., Li, M.-F., Yang, S., Sun, R.-C., 2013. Understanding the mechanism ofcypress liquefaction in hot-compressed water through characterization of solidresidues. Energies 6, 1590–1603.
Luque, R., Lovett, J.C., Datta, B., Clancy, J., Campelo, J.M., Romero, A.A., 2010.Biodiesel as feasible petrol fuel replacement: a multidisciplinary overview.Energy Environ. Sci. 3, 1706–1721.
Maxwell, G., 2004. Synthetic Nitrogen Products: A Practical Guide to the Productsand Processes. Springer, New York, NY.
McCollom, T., Ritter, G., Simoneit, B.T., 1999. Lipid synthesis under hydrothermalconditions by Fischer–Tropsch-type reactions. Origins Life Evol. Biosphere 29(2), 153–166.
National Research Council, 2012. Sustainable Development of Algal Biofuels in theUnited States. The National Academies Press, Washington, DC.
Olafsson, P., Bryan, A., 1970. Evaluation of thermal decomposition temperatures ofamino acids by differential enthalpic analysis. Microchim. Acta 58, 871–878.
Peterson, A.A., Vogel, F., Lachance, R.P., Fröling, M., Antal Jr, M.J., Tester, J.W., 2008.Thermochemical biofuel production in hydrothermal media: a review of sub-and supercritical water technologies. Energy Environ. Sci. 1, 32–65.
Roberts, G.W., Fortier, M.-O.P., Sturm, B.S.M., Stagg-Williams, S.M., 2013. Promisingpathway for algal biofuels through wastewater cultivation and hydrothermalconversion. Energy Fuels 27, 857–867.
Roe, E.T., Stutzman, J.M., Scanlan, J.T., Swern, D., 1952. Fatty acid amides. IV.Reaction of fats with ammonia and amines. J. Am. Oil Chem. Soc. 29, 18–22.
Sato, N., Quitain, A.T., Kang, K., Daimon, H., Fujie, K., 2004. Reaction kinetics ofamino acid decomposition in high-temperature and high-pressure water. Ind.Eng. Chem. Res. 43, 3217–3222.
Speight, J., 2008. Synthetic Fuels Handbook: Properties, Process, and Performance.McGraw-Hill, New York, NY.
Speight, J.G., Speight, J., 2002. Handbook of Petroleum Product Analysis. Wiley-Interscience, Hoboken, NJ.
Sukhorukov, G.B., Volodkin, D.V., Günther, A.M., Petrov, A.I., Shenoy, D.B., Möhwald,H., 2004. Porous calcium carbonate microparticles as templates forencapsulation of bioactive compounds. J. Mater. Chem. 14, 2073–2081.
Tsukahara, K., Sawayama, S., 2005. Liquid fuel production using microalgae. J. Jpn.Pet. Inst. 48, 251.
Valdez, P.J., Nelson, M.C., Wang, H.Y., Lin, X.N., Savage, P.E., 2012. Hydrothermalliquefaction of Nannochloropsis sp.: systematic study of process variables andanalysis of the product fractions. Biomass Bioenergy 46, 317–331.
Vardon, D.R., Sharma, B.K., Scott, J., Yu, G., Wang, Z., Schideman, L., Zhang, Y.,Strathmann, T.J., 2011. Chemical properties of biocrude oil from thehydrothermal liquefaction of Spirulina algae, swine manure, and digestedanaerobic sludge. Bioresour. Technol. 102, 8295–8303.
Wang, Z., 2011. Reaction Mechanisms of Hydrothermal Liquefaction of ModelCompounds and Biowaste Feedstocks. PhD Dissertation, Agricultrual andBiological Engineering. University of Illinois at Urbana-Champaign, Urbana, IL.
Yu, G., 2012. Hydrothermal Liquefaction of Low-lipid Microalgae to Produce Bio-crude Oil. PhD Dissertation, Agricultrual and Biological Engineering. Universityof Illinois at Urbana-Champaign, Urbana, IL.
Yu, G., Zhang, Y., Schideman, L., Funk, T.L., Wang, Z., 2011a. Hydrothermalliquefaction of low lipid content microalgae into bio-crude oil. Trans. ASABE54 (1), 239–246.
Yu, G., Zhang, Y.H., Schideman, L., Funk, T., Wang, Z.C., 2011b. Distributions ofcarbon and nitrogen in the products from hydrothermal liquefaction of low-lipid microalgae. Energy Environ. Sci. 4, 4587–4595.
Zhang, J., Chen, W.-T., Zhang, P., Luo, Z., Zhang, Y., 2013. Hydrothermal liquefactionof Chlorella pyrenoidosa in sub- and supercritical ethanol with heterogeneouscatalysts. Bioresour. Technol. 133, 389–397.
Zhang, Y., 2010. Hydrothermal Liquefaction to Convert Biomass into Crude OilBiofuels from Agricultural Wastes and Byproducts. Wiley-Blackwell, Hoboken,NJ, pp. 201–232.
Zhou, Y., Schideman, L., Yu, G., Zhang, Y., 2013. A synergistic combination of algalwastewater treatment and hydrothermal biofuel production maximized bynutrient and carbon recycling. Energy Environ. Sci. 6, 3765–3779.