Embed Size (px)
Citation preview

1
Revised on April 15, 2005
Hydrodynamics and Associated Morphological Variations on an Estuarine Intertidal Sand-flat
By Yusuke Uchiyama*† * The former affiliation Littoral Drift Division Port and Airport Research Institute 3-1-1 Nagase, Yokosuka 239-0826 Japan Phone: +81-468-44-5045 Fax: +81-468-41-9812 E-mail: [email protected] (currently unreachable)
† The present affiliation: Institute of Geophysics and Planetary Physics University of California, Los Angeles 3845 Slichter Hall Los Angeles, CA 90095-1567 USA Phone: 1-310-206-9381 Fax: 1-310-206-3051 Email: [email protected]
LRH: Uchiyama
RRH: Morphodynamics on an intertidal sand-flat

2
ABSTRACT
Hydrodynamics, sediment suspension and morphological response on an estuarine intertidal sand-
flat in Tokyo Bay, Japan, are examined through a field experiment performed for 16 days in winter
2000 and using a bathymetry data set based upon a 6-year series of surveys. Topography of the sandy
flat was found to fluctuate by approximately 8 cm during the deployment while long-term
accumulation rate is estimated with the surveyed bathymetries to be only 3.8 cm/y. Cross-spectral
analysis of the measured data indicates that on the sandy tidal flat, semidiurnal or shorter-period
fluctuations in current velocity are mostly attributed to semidiurnal tides and waves, whereas wind
above the sea generally drives diurnal or longer-period fluctuations. The field data also confirms that
suspended sediment concentrations were highly correlated with bed shear stress, which is generated by
combination of tidal current, wind-induced current and wind waves. Episodic erosion is observed on
the sandy flat with high turbidities on ebbing phases. Erosion evidently occurs at phases between the
high slack and the mean tidal levels during ebb flows when combined tidal, wind-driven and wave-
driven currents are maximized.
Additional Index Words: wetting and drying, topography change, bed shear stress, tidal oscillation,
wind waves, wind-induced current

3
INTRODUCTION
For preservation and rehabilitation of ecosystems on tidal flats, wetlands and salt marshes, predicting
morphological behavior is a significant issue (PATERSON, 1989). The intertidal sediments play a key
role in providing habitat for resident infauna, which acts as a food resource for large communities of
shorebirds (FERNS, 1983; BAKKER et al., 1993). Even when slight erosion occurs on tidal flats, it
may have significant impact on the resident benthos (KAKINO, 2000). Understanding of the
hydrodynamics and associated morphological process on intertidal flats and wetlands is a prerequisite
for the development of conceptual and quantitative models that are essential to allow effective
management of the intertidal area.
Recently, efforts have been made to understand hydrodynamics, sediment transport and resultant
morphological process on mudflats located in the Dollard Estuary, the Netherlands (DYER et al., 2000;
VAN DER LEE, 2000), Humber Estuary, UK (CHRISTIE et al., 1999), Severn Estuary, UK
(O’BRIEN et al., 2000), Baie de Marennes-Oleron, France (BASSOULLET et al., 2000), the Wadden
Sea, the Netherlands and Denmark (HOUWING, 2000; ANDERSON, 2001; ANDERSON and
PEJRUP, 2001), and San Francisco Bay, USA (TALKE and STACEY, 2003). Usually
sedimentological processes reported in these studies have been described in comparison with laboratory
data (TEISSON et al., 1993), and there is a growing literature on the influence of mixtures of various
sizes of sediments (e.g. MITCHENER et al., 1996; TORFS et al., 1996) and biological factors (e.g.
RHOADS and BOYER, 1982; PATERSON, 1989; WIDDOWS et al., 1998; AUSTEN et al., 1999;

4
ANDERSON, 2001). Furthermore, AMOS et al. (1988) have documented that the subaerial exposure
often has considerable influence on bed strengthening. Some studies have examined hydrodynamics
that potentially control sediment transport and morphological process on mudflats, by measuring tidal
currents, wind-induced currents, wind waves, oceanic swells and infragravity waves, density-driven
circulation, and drainage processes (e.g., LE HIR et al., 2000; TALKE and STACEY, 2003).
Sediment transport on tidal flats occurs over a variety of timescales, ranging from seconds to seasons.
DALRYMPLE et al. (1991) in a paper on cohesive sediment deposition on a mudflat in the Bay of
Fundy indicate that historical deposition may be divided into two phases, namely, a short-term rapid
erosion and subsequent aggradation, and a longer-term gradual but quasi-equilibrium topographic
fluctuations. They also reported that deposited sediments are intensely disturbed by benthic organisms.
The combination of morphological processes in different timescales may control overall development
of intertidal areas. Intertidal topographic variations have been reported generally minor as
hydrodynamic forcing has basically been observed to be small in previous studies (e.g., CHRISTIE et
al., 1999). For example, KIRBY et al. (1993) demonstrated that bed elevation varies only 3-5 cm a
year in Strangford Lough, Northern Ireland. However, intermittent episodic processes are considered
to dominate the morphodynamics on intertidal areas. Storms can produce significant sediment
transport and cause topographic changes that are likely to occur for several years without storms.
Episodic fluvial outflows can also induce significant accretion. Recent studies have reported that
considerable short-term morphological variations of 10–30 cm on a mudflat in the Severn Estuary
(WEST and WEST, 1991; WHITEHOSE and MITCHENER, 1998; O’BRIEN et al., 2000). Therefore

5
morphological processes on intertidal flats, not only in the long term but also in the short term, provide
an “open” question.
Intertidal flats are characterized by tidal submergence-emergence cycles with the additional effect of
benthic disturbance and exposure to the air. The fluctuations in water surface elevation induce
hydrodynamic conditions which generate sediment processes such as formation of ripples, dunes,
channel networks, and so on. These external forces are responsible for sediment transport through
producing bed shear stresses affected by non-linear wave-current interaction, and are attributed to
erosion and accretion of the bed.
The purpose of the present study is to demonstrate short- and long-term morphological behavior of a
sandy tidal flat rather than mudflats reported in the previous studies. The prime objective is to
investigate episodic (short-term) and gradual (long-term) morphological processes on the sandy flat, to
investigate mechanisms of erosion related to estimating bed shear stresses due to combined effects of
waves and currents, and to examine detailed hydrodynamics, sediment suspension, and associated
morphodynamic processes in contrast to long-term topography variations. Biological effects on
sediment suspension and subaerial exposure are neglected in the present study, but should be
considered in future works.

6
FIELD MEASUREMENT
Study Site
A field measurements was carried out for 16 days, during February 7 – 22, 2000, on an intertidal
sandy flat at Banzu situated on the eastern shore of Tokyo Bay, Japan (Figure 1). This embayment is
characterized by well-mixed semi-diurnal mesotidal condition. During rainy seasons (June and
September), massive freshwater influx is supplied by three major rivers. Whereas Tokyo Bay was
previously fringed by a huge area of intertidal flats until the late 1950’s, some 20,800 ha of the flats
have been reclaimed over past decades (MINISTRY OF TRANSPORT, 2000). The study site has been
left from coastal developments to become the largest intertidal flat in Tokyo Bay.
Banzu sandy flat comprises an intertidal area of 7.6 km2 (760 ha) above the MLLW level. The
maximum spring tidal range is about 2.0 m. Bed sediments at the study site are characterized by well-
sorted fine sand with a median grain size of 170−190 µm (Figure 2). A preliminary study showed that
tidal exchange is the major source of suspended and dissolved material although the Obitsu River
mouth is located adjacent to the study site (KUWAE et al., 1998). As detailed in the Fluvial Effect
subsection in the Result section, freshwater discharge from the adjacent river (Figure 1) directly onto
the sandy flat was generally minor during winter (December to February), when the field
measurements was performed. Thus the effects of the river outflow on hydrodynamics and associated
sedimentological processes may be assumed negligible in the present analyses. In addition, because of
the historical reclamations of the hinterland, there exist almost no marshes or vegetation on Banzu tidal

7
flat except on the delta formed around the mouth of Obitsu River (Photo 1).
The wave climate around the study area is dominated by small wind waves. Tokyo Bay is
characterized as a semi-enclosed estuary and the bay entrance faces southwest to shelter the study area
from the prevailing wind and associated wind waves entering the bay from the Pacific Ocean. Wave
heights and periods are limited owing to small fetches from the shoreline that comprises two peninsulas
and the sand spit at the bay mouth. A number of wave measurements have been performed within the
bay. NAGAI et al. (2001) estimated a significant wave height H1/3 of 0.5 m or less in 88.6 % of the
waves during 1991-2000. Wave height H1/3 of 1.0 m was recorded for 0.5 % of the time at the Daini-
Kaiho Wave Observatory situated in the channel close to the spit at the bay entrance during this decade.
They also indicated a significant wave period T1/3 to be 5.0 s or more in 1.4 % of the waves, suggesting
that swells and infragravity waves in the study site are minor.
Methods
A line referred to as transect A-A’ was established near the river mouth, as shown in Figure 1, for
the purpose of conducting bathymetric surveys on February 7 and 22, 2000, using a surveyor’s level
and staff. Instrumentation layout at two monitoring stations, both of which were positioned along
transect A-A’, is illustrated in Figure 3. At station 1, water surface elevation was measured using an
ultrasonic wave gauge (KENEK Co., Ltd.) mounted at a height of 4.5 m from the bed at a sampling
frequency of 5 Hz, and a photoelectric sand-surface meter (SPM-7, Sanyo Sokki Co., Ltd.) was buried
in the bed to monitor bottom elevation at 10-minute intervals. The accuracy of the bed elevation

8
measurement is ±5 mm according to the instrument specification. At station.2, an optical
backscattering sensor (MTB-16K, Alec Electronics Co., Ltd.) and a three-dimensional electro-magnetic
current meter (ACM-16M, Alec Electronics Co., Ltd.) were installed to measure suspended sediment
concentrations and current velocity at 10 cm above the bed at a frequency of 2 Hz. Fluvial discharge
and water level of Obitsu River were measured at 1-hour intervals by the Obitsu Gate Operation Office
located at the point 5.6 km upstream from the river mouth. Wind velocity was hourly monitored by
Japan Meteorological Agency at north Kisarazu, about 3.0 km north of the study site. The OBS was
calibrated in a laboratory immediately after the deployment with the suspended sediments sampled at
the study site. A bucket of about 10 liters painted in black and an electrically-driven propeller were
used to mix the seawater and the sediments. The obtained calibration curves are linear with very small
variances, and there is almost no difference in the regression relations calculated with the bed and
suspended sediments. These results are considered quite different from those for mudflats, presumably
because the sediments are mostly composed of fine sand at the study site.

9
RESULTS
Short- and Long-term Morphological Variations
Figure 4 shows bottom profiles surveyed on February 7 and 22, 2000, along transect A-A’ and their
difference, ∆ h. The profile of the sandy tidal flat is found to have a mean slope of about 1:1850 and ∆h
is considerably small, ranging from +1cm to –4 cm. FURUKAWA et al., (2000) exhibited a series of
bottom topography data of Banzu flat measured along transect A-A’ from October 1994 at intervals of
1 − 6 months. Using their data, long-term variation of the sediment volume along transect A-A’ per
unit alongshore length was calculated (Figure 5). The figure indicates that Banzu sandy flat is
gradually accreting in the long term at about 45 m3/m/y. By dividing by the length of transect A-A’,
1,200 m long, this value can be converted into a profile-averaged long-term accretion rate of 3.8 cm/y.
In many tidal wetlands and flats of the world, the accretion rate is only a few millimeters per year (e.g.,
FREY and BASAN, 1985). Therefore, the accretion rate near the river mouth of Banzu sandy flat is 10
to 30 times greater than those in other studied sites in Europe and America (STEVENSON et al., 1985;
FRENCH and SPENCER, 1993; LEONARD et al., 1995; ANDERSON and PEJRUP, 2001).
Figure 6 displays the time series of bed level, h, measured at station 1 by SPM-7: (a) original time
series (hourly averaged), (b) 24-hour moving averaged bed level representing medium-term
fluctuations, (c) difference between (a) and (b) representing short-term fluctuations, and (d) root-mean-
square (R.M.S.) of (c) calculated for every 4 hours. As shown in Figures 6 (a) and (b), the seabed
appears to be eroded by about 8 cm during the first 4 days with small erosions and accumulations, and

10
then gradually recovered to the initial elevation . The magnitude of the short-term erosion occurring on
February 8 - 10 is nearly equivalent to the accretion occurring on February 15 – 16, as shown in
Figures 6 (c) and 6 (d).
Figure 7 shows time series of tidal elevation averaged for every 30 minutes, the bottom elevation at
station 1, and the turbidity (suspended sediment concentrations) averaged for every 10 minutes at
station 2. The elevations displayed here are relative to T.P. in m, where T.P. is the mean lower low
water (MLLW) level of Tokyo Bay. The spring-neap-spring tidal cycle and diurnal inequalities are
visible in the tidal data. Figures 4 and 7 show that station 1 was mostly submerged over the duration of
the deployment though station 2 was exposed during almost every low water phase. The turbidity
(Figure 7) fluctuated in response to the R.M.S. of the bed elevation (Figure 6 (d)), indicating that on
February 8 and 9, for instance, high turbidity is observed whenever the seabed is eroded. In addition
small amount of erosion and accretion occur with the semi-diurnal tidal fluctuations probably because
the wave height, which generally induces the sediment suspensions and resultant bed level variations,
varies in response to the tides and has its maximum at high water.
Hydrodynamics
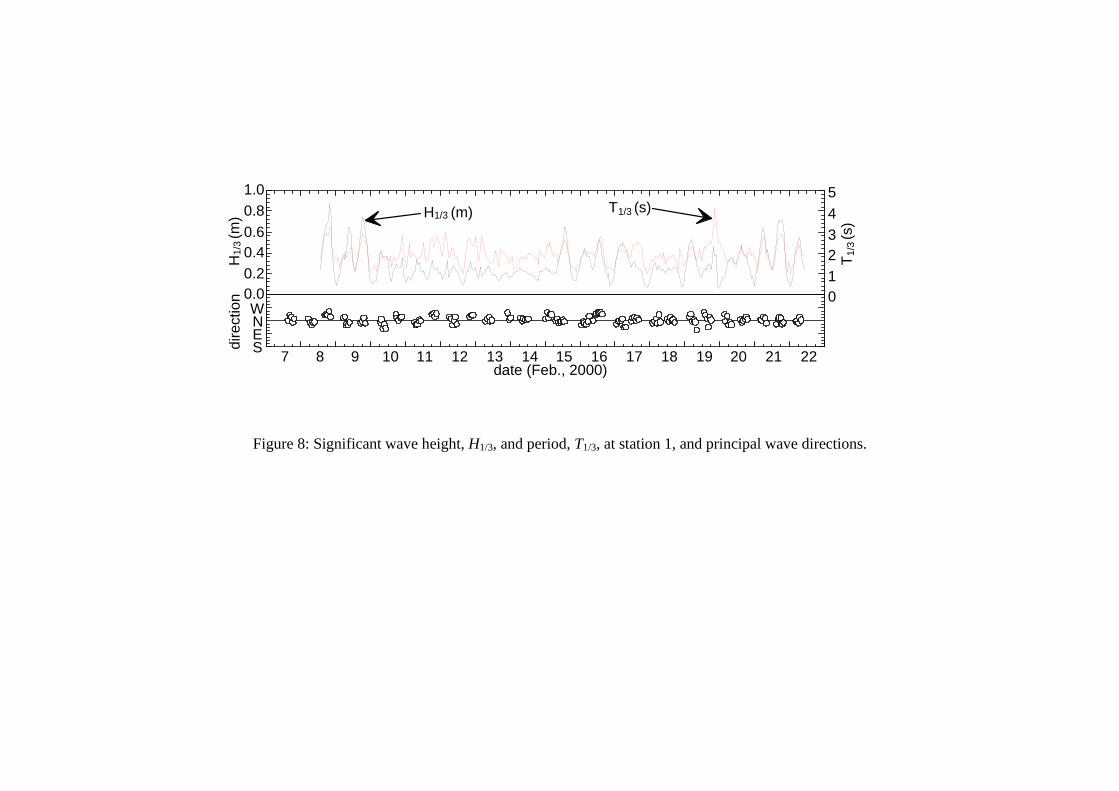
Figure 8 shows significant wave height (H1/3) and period (T1/3) at station 1, and principal wave
directions estimated from covariance of the current velocity. Figure 9 represents wind velocity vectors
at Kisarazu, and temporally-averaged velocity vectors of horizontal currents and water depth at station
2. Wave conditions are relatively severe at the early stage of the deployment as the wave height

11
reached 0.8 – 0.9 m with a period of about up to 4 s. Mild conditions prevailed for the next five days,
followed by medium conditions in the later stage. The principal wave direction is basically from N or
NNW, which means that the waves propagated mostly in the alongshore direction and thus refraction
can be ignored on the sandy flat although it is significant on sandy beaches.
The wave height fluctuates according to the water depth variation, i.e., tides, as shown in Figures 7
and 8, since H1/3 seems to be high during high water while low during low water. The principal wave
directions roughly coincide with the wind directions. Therefore, in order to determine contributions of
the wind action and the tidal forcing to the enhancement of wave height, H1/3, cross-spectral analyses
has been conducted. Figure 10 shows the cross spectra (represented by spectrum, coherence squared,
and phase) between (a) significant wave height (H1/3) and N-S component of wind velocity (Wn-s) and
(b) H1/3 and η (tide: water depth at station 2). The significant wave height is shown to correlate
appreciably with η over broad frequency bands with almost no phase lag. By contrast, coherence
between H1/3 and the wind velocity is generally small, whilst it is slightly larger at the lower
frequencies. These results demonstrate that H1/3 is fluctuating basically in response to the tide, not to
the local wind, yet its long-term (at frequency of about 0.01 cycle/h or less) variation is caused mainly
by the wind. This result is important because waves (short-period wind waves) are usually believed to
be induced by local wind forcing. However, the local water depth is a limiting factor for the
development of waves on the extremely shallow intertidal flat.
Next, causes of the variation in the horizontal current velocity are investigated. As shown in Figure
9, the horizontal current velocity appears to vary in the long term in response to the fluctuations of the

12
wind velocity and the wave height. The current field on the sandy flat is also considerably influenced
by the tide since the semi-diurnal inversions in the current directions occur with the tidal oscillations.
As a consequent, the currents on Banzu intertidal flat are simultaneously affected by the wind, the tide
and the waves. Figure 11 shows the cross spectra between (a) Wn-s and N-S component of horizontal
current velocity (Un-s), (b) H1/3 and Un-s, and (c) η (tide: depth at station 2) and Un-s. The power
spectral density of Un-s has an intense peak in the vicinity of the semi-diurnal period (T = 12 h),
although it is relatively low over periods longer than 24 h. The distinct peaks at the semi-diurnal
period can also be found in the spectra of η and H1/3 although there is no visible peak in the wind
velocity spectrum. The estimated coherences exhibit that the current variation is obviously correlated
with η and H1/3 at a period of 12 h. Since the coherence between Un-s and η is slightly larger than that
between Un-s and H1/3, the current velocity fluctuation is considered mainly due to the tide which
influences on the development of the waves. On the other hand, the coherence between Wn-s and Un-s
is high over periods longer than about 24 h, while the longer-period component of Un-s does not have
such a high correlation with the wave height and the tide. Consequently, the wind velocity mainly
affects the current field on Banzu sandy flat in the diurnal or longer-period fluctuations, whereas the
tide and the waves induce the semi-diurnal or shorter-period fluctuations.
Fluvial Effects
Because the study site is situated near the river mouth, influence of the fluvial input from the
adjacent Obitsu River must be considered in the analyses. Figure 12 gives a time series of fluvial

13
discharge and water elevations of Obitsu River monitored at 5.6 km upstream from the river mouth.
Whereas the river discharge during the duration of the measurement fluctuates slightly, it is minor as
compared with annual variation of the discharge displayed in Figure 13. The tidal elevation is
observed to affect the riverine water levels during high tides, although being generally lower than the
riverine water elevations during low tides. Therefore it is concluded that the freshwater discharge from
the adjacent river was presumably small and can be ignored in the present analysis.

14
DISCUSSION
Bed Shear Stress
The bed shear stresses are calculated to investigate the various mechanism of sediment suspension
on Banzu sandy flat. Different methodologies have been proposed to evaluate the bed shear stress
when considering wave-current interaction (e.g., GRANT and MADSEN, 1979; SOULSBY and
HUMPHERY, 1990; HUYNH-TANH and TEMPERVILLE, 1991; SOULSBY, 1997), and an
approach, in which the bed shear stress is estimated using Reynolds stresses calculated from the
fluctuating components of the current velocity (DYER and SOULSBY, 1988; FRENCH and
CLIFFORD, 1992), is chosen. Assuming that the region in the vicinity of the seabed, where the
velocity measurements were performed, is situated in a “constant shear layer”, the bed shear stresses
can be calculated using the following equations:
wuuw ′′−= ρτ , (1)
wvvw ′′−= ρτ , (2)
22vwuwb τττ += , (3)
where (u’, v’, w’) = (u − U, v − V, w − W) is a fluctuating velocity vector, (u, v, w) is a measured
current-velocity vector, (U, V, W) is a burst-averaged velocity vector over 15 s of burst intervals, τuw
and τvw are the vertical components of Reynolds stress in the directions of u and v, and ρ is the density

15
of sea water (1025 kg/m3), and overbars represent an ensemble averaging operator. It might be better
to decompose the current velocity into mean flow, wave component, and turbulence. However, that is
unfortunately not possible because the sampling frequency of the current meter is too low (2Hz). One
thus must be careful that the bed shear stress τb estimated may include wave components.
Figure 14 shows temporal variations of the current bed shear stress τb and the turbidity Cs measured
at station 2. The turbidity Cs clearly fluctuates in response to τb. It is verified that the high turbidities,
occurring intermittently on 8, 9, 15 and 21 Feb., for instance, are generated when higher bed shear
stress are observed. Figure 15 supports this since the bed shear stress and the turbidity are highly
correlated with the correlation coefficient of R = 0.856.
Previous studies have shown that modes of sediment transport are related to the Shields parameter,
Ψm, which is the non-dimensional bed shear stress under oscillatory flow with consideration of
underlying sediment properties. The relationship between Ψm and τb is given by
( ) ( ) gdgdu sbsm ρρτρρ −=−=Ψ 1*2 , (4)
where u* is bed friction velocity (m/s), ρ s and d are the density and median grain size of the bed
sediment (2690 kg/m3 and 0.19mm), ρ is the seawater density, and g is the gravitational acceleration
(9.80 m/s2). By converting the previously proposed threshold Shields parameters (SHIBAYAMA and
HORIKAWA, 1982) into τb using equation (4), one obtains τb ≈ 0.2 N/m2 for the minimum value for
initial generation of bed load, and τb ≈ 0.6 N/m2 for the minimum value for transition to suspended load.

16
As shown in Figure 14, whenever the bed sediments are highly suspended, τb is much greater than 0.6.
Therefore suspended load dominates on the intertidal sandy flat when high turbidity is measured.
Wave action is well known to have the largest effect on sediment suspension on sandy beaches
particularly in surf zones, and therefore the correlation between the turbidity and wave energy
evaluated from the linear wave theory using the significant wave height is investigated as shown in
Figure 16. Note that the waves and current data were separately measured at stations 1 and 2. In spite
of this discrepancy, the correlation coefficient R is evaluated to be 0.689. This is considered
sufficiently large, although somewhat less than that between τb and turbidity.
On the other hand, since hydrodynamics in shallow estuaries are strongly affected by local wind
(e.g., WU and TSANIS, 1995), the shear stress induced by the wind action at the water surface, τs, is
evaluated using the following equation:
( )22wesnafs WWC −− += ρτ , (5)
where Cf is the friction coefficient at the sea surface (= 2.5×10⁻³), ρa is the atmospheric density (= 1.2
kg/m3), and (Wn-s, We-w) is a horizontal wind-velocity vector. One can expect that the surface wind
stress may be related to the bed stress due to wind particularly when water-depth variation is negligible.
However, as shown in Figure 17, there is almost no correlation between τb and τs. This fact again
supports the results of the cross-spectral analyses (Figure 11). Consequently, increment of τb and the
resultant sediment suspension are not directly influenced by wind action, being primarily attributed to
the tides and the waves.

17
Phases of High Concentration of Suspended Sediment
Next the phases, when the high concentrations of suspended sediment are measured, are
investigated. Conditional samplings are carried out to estimate the ensemble averages (in other words,
the phase averaged pictures) of the wind and current velocities, the tidal elevations, the significant
wave height and the turbidity. The condition is defined here as the turbidity to exceed 40 ppm (i.e., bed
shear stress to exceed about 3.5 N/m2). The conditional samplings (e.g., YUAN and
MOKHTARZADEH-DEHGHAN, 1994) are executed to obtain the ensemble averages for five cases of
high concentrations measured at 21:00 on February 8th, 8:20 and 19:40 on the 9th, 12:40 on the 15th,
and 18:10 on the 21st. The estimated ensemble averages are shown in Figure 18 in which the phase of
high turbidity is adjusted to the elapsed time t = 0 h for each case. The current velocity, the wind
velocity and the bed shear stress apparently have highest values near the phase of the high turbidity. In
contrast the peak phases of the wave height and the tidal elevation do not correspond to the phase of
high turbidity. The turbidity is found high during ebb tide, which begins at around t = −1.5 h, and
becomes the highest at the phase between the high slack and the mean water, 1.5 hours after the high
slack water.
Intertidal flats are reported quite sensitive to action of wind-induced waves, because they are
extremely shallow, which favors the generation of high bed shear stresses that promote sediment
resuspension (FREEMAN et al., 1994). In other words, a net transport of suspended sediments may be
significantly dependent on wind speed and direction as suggested in PEJRUP (1986), CHRISTIE et al.

18
(1999) and BASSOULLET et al. (2000). The wave height has its peak at the high slack phase because
it fluctuates in response to the tide as shown in Figure 10 (b). If only the waves are predominant in
generating the bed shear stress as in surf zones, the highest turbidity may not appreciably lag behind the
high water phase. In general, tidal current velocities become largest between high slack and low slack
phases during flooding and ebbing. If the semidiurnal tidal component is dominant as in Tokyo Bay,
the maximum tidal velocities, as well as resultant bed shear stresses, appear at 3 h and 9 h after the low
slack. However, the estimated phase of high turbidity in Figure 18 is found at 1.5 h after the phase of
the high water and the maximum wave height, and at 1.5 h before the tidal current velocity and the bed
shear stress to be maximum. This discrepancy suggests that combined wave and current interaction is
essential to generation of the bed shear stress as conceptually illustrated in Figure 19. If the
contributions of waves and currents to produce the bed shear stress are equivalent (i.e., the amplitude of
tidal currents and wave orbital velocities are assumed to be the same) and the direction of wind
coincides with that of ebb tidal currents, the total velocity has the maximum value during ebbing at the
phase of 1.5 h after the high water as shown in Figure 19 (c). When the amplitudes of tidal currents
and wave orbital velocities are not the same, the phase of high turbidity is evidently different from that
shown in Figure 18. When wind blows in the direction of flood tidal currents, the maximum
concentration appears at a phase of 1.5 h before the high water. This result supports the importance of
a combination of waves, tidal currents, and wind-induced currents to hydrodynamics, associated
sediment transport and topography variations on the sandy tidal flat.

19
CONCLUSIONS
The results of a 16-day field measurement on hydrodynamics, sediment suspension and topography
variations, and a 6-year series of bed-profile survey demonstrate that an estuarine intertidal sandy flat
in the semi-enclosed Tokyo Bay, Japan, has a morphological process consisting of a long-term gradual
accretion, episodic erosions, and the subsequent accumulations. The long-term accretion rate is
estimated to be only about 3.8 cm/y on the basis of the surveyed data whereas bed elevation varies by
approximately 8 cm during the short-term measurement conducted in 2000, when fluvial discharge can
be ignored and relatively severe wave condition appears as significant wave height exceeds 0.8 m
during the deployment. Episodic erosion and subsequent gradual accretion are significant for the short-
term morphological processes. Modes of bottom sediment movement during the measurement are
examined using the Shields parameter. Erosion occurs in response to generation of high concentrations
of suspended sediments at phases between the high slack water and the mean water during ebb when
the combined wave and current interaction are predominant. On Banzu sandy flat, a key mechanism to
produce high turbidity is considered to be the combination of high waves, strong ebb-tidal current, and
acceleration due to wind blowing in the direction of ebb tidal currents. By contrast, the bed elevation
tends to accrete immediately after the erosion episodes as the wave height decreases. The waves are
observed to develop and attenuate in response to the tidal elevations, suggesting that the short-term
cyclic morphological processes also are attributed to the tides.

20
ACKNOWLEDGMENTS
The author is grateful to Dr. Keita Furukawa of National Institute for Land and Infrastructure
Management, Japan, for his cooperation to utilize the long-term topography data surveyed on Banzu
tidal flat. Acknowledgement is made to Dr. Tomohiro Kuwae of Port and Airport Research Institute
(PARI), Japan, Dr. Munemasa Nomura of Tohoku University, Japan, Mr. Tsuyoshi Nakashima of
Ministry of Land, Infrastructure and Transport, Japan, and Mr. Tomoaki Fujino of Toyo Construction
Co., Ltd., Japan, for their earnest help with the field measurements. The author would like to express
sincere appreciation to Dr. Yoshiaki Kuriyama and Dr. Kazumasa Katoh of PARI, Professor Terry
Healy of the University of Waikato, New Zealand, and an anonymous reviewer for their thorough and
constructive comments on the manuscript.

21
LITERATURE CITED
AMOS, C.L.; VAN WAGONER, N.A., and DABORN, G.R., 1998. The influence of subaerial
exposure on the bulk properties of fine-grained intertidal sediment from Minas Basin, Bay of
Fundy, Estuarine, Coastal and Shelf Science, 27, pp. 1 – 13.
ANDERSEN, T.J., 2001. Seasonal variation in erodibility of two temperate, microtidal mudflats,
Estuarine, Coastal and Shelf Science, 53, pp. 1 – 12.
ANDERSEN, T.J., and PEJRUP, M., 2001. Suspended sediment transport on a temperate, microtidal
mudflat, the Danish Wadden Sea, Marine Geology, 173, pp. 69-85.
AUSTEN, I.; ANDERSEN, T.J., and EDELVANG, K., 1999. The influence of benthic diatoms and
invertebrates on the erodibility of an intertidal mudflat, the Danish Wadden Sea, Estuarine,
Coastal and Shelf Science, 49, pp. 99 – 111.
BAKKER, J.P.; De LEEUW, J.; DIJKEMA, K.S.; LEENDERTSE, P.C.; PRINS, H.H.T., and
ROZEMA, J., 1993. Salt marshes along the coast of the Netherlands, Hydrobiologia, 265, pp.
73-95.
BASSOULLET, Ph.; LE HIR, P.; GOULEAU, D., and ROBERT, S., 2000. Sediment transport over an
intertidal mudflat: field investigations and estimation of fluxes within the “Baie de Marennes-
Oleron” (France), Continental Shelf Research, 20, pp. 1635 – 1653.
CHRISTIE, M.C.; DYER, K.R., and TURNER, P., 1999. Sediment flux and bed level measurements
from a macro tidal mudflat, Estuarine, Coastal and Shelf Science, 49, pp. 667 – 688.

22
DALRYMPLE, R.W.; MAKINO, Y., and ZAITLIN, B.A., 1991. Temporal and spatial pattern of
rhythmic deposition on mudflats in the macrotidal Cobequid Bay-Salmon River estuary, Bay of
Fundy, Canada. In: D.G. Smith; G.E. Reinson; B.A. Zaitlin, and R.A.Rahmani (Eds), Clastic
Tidal Sedimentology, Can. Soc. Petrol. Geol. Mem., 16, pp. 137-160.
DYER, K.R., and SOULSBY, R.L., 1988. Sand transport on the continental shelf, Annual Review of
Fluid Mechanics, 20, pp. 295 – 324.
DYER, K.R.; CHRISTIE, M.C.; FEATES, N.; FENNESSY, M.J.; PEJRUP, M., and VAN DER LEE,
M., 2000. An investigation into processes influencing the morphodynamics of an intertidal
mudflat, the Dollard Estuary, the Netherlands: I. Hydrodynamics and suspended sediment.
Estuarine, Coastal and Shelf Science, 50, pp. 607 – 625.
FERNS, P.N., 1983. Sediment mobility in the Severn Estuary and its influence upon the distribution of
shorebirds, Canadian Journal of Fisheries and Aquatic Science, 40 (Supp.1), pp. 331 – 340.
FREEMAN, D.P.; COATES, L.E.; OCKENDEN, M.C.; ROBERTS, W., and WEST, J.R., 1994.
Cohesive sediment transport on an inter-tidal zone under combined wave-tidal flow, Netherlands
Journal of Aquatic Ecology, 28 (3-4), pp. 283 – 288.
FRENCH, J.R., and CLIFFORD, N.J., 1992. Characteristics and event-structure of near-bed
turbulence in a macrotidal salt-marsh channel, Estuarine, Coastal and Shelf Science, 34, pp. 49 –
69.
FRENCH, J.R., and SPENCER, T., 1993. Dynamics of sedimentation in a tide-dominated backbarrier
salt marsh, Norfork, UK, Marine Geology, 110, pp. 315 – 331.

23
FREY, R.W., and BASAN, P.B., 1985. Coastal salt marshes, In: Davis, R.A. (Ed.), Coastal
Sedimentary Environments, New York; Springer-Verlag, pp. 225 – 289.
FURUKAWA, K.; FUJINO, T.; MIYOSHI, T.; KUWAE, T.; NOMURA, M.; HAGIMOTO, Y., and
HOSOKAWA, Y., 2000. Topographical change on tidal flats – case study on Banzu natural tidal
flat and Nishiura constructed tidal flat –, Technical Note of the Port and Harbour Research
Institute, 965, Yokosuka, Japan: PHRI, pp. 1 – 30. (in Japanese)
GRANT, W.D., and MADSEN, O.S., 1979. Combined wave and current interaction with a rough
bottom, Journal of Geophysical Research, 84, pp. 1797 – 1808.
HOUWING, E.-J., 2000. Morphodynamic development of intertidal mudflats: consequences for the
extension of the pioneer zone, Continental Shelf Research, 20, pp. 1735 – 1748.
HUYNH-TANH, S., and TEMPERVILLE, A., 1991. A numerical model of the rough turbulent
boundary layer in combined wave and current interaction, In: Soulsby, R.L., and Bettees, R.
(Eds), Euromech 262 – Sand Transport in Rivers, Estuaries and the Sea, Rotterdam, the
Netherlands: Balkema.
KAKINO, J., 2000. Dispersal of Japanese littleneck clam Ruditapes philippinarum (Adams and
Reeve) in relation to changes of bottom level due to wave action on Banzu tidal flat, Tokyo Bay,
Fisheries Engineering, 37 (2), pp. 115 – 128.
KIRBY, R.; BLEAKLEY, R.J.; WEATHERUP, S.T.C.; RAVEN, P.J., and DONALDSON, N.D., 1993.
Effect of episodic events on tidal mudflat stability, Ardmillan Bay, Strangford Lough, Northern

24
Ireland. In: Mehta, A.J. (Ed.), Nearshore and Estuarine Marine Cohesive Sediment Transport,
Coastal and Estuarine Studies, 42, Washington, DC: AGU, pp. 378 – 392.
KUWAE, T.; HOSOKAWA, Y., and EGUCHI, N., 1998. Dissolved inorganic nitrogen cycling in
Banzu intertidal sand-flat, Japan, Mangroves and Salt Marshes, 2, pp. 167-175.
LE HIR, P.; ROBERTS, W.; CAZAILLET, O.; CHRISTIE, M.; BASSOULLET, P., and BACHER, C.,
2000. Characterization of intertidal flat hydrodynamics, Continental Shelf Research, 20, pp.
1433 – 1459.
MINISTRY OF TRANSPORT, Second Port Construction Bureau, 2000. The environmental data book
in Tokyo Bay, Yokohama, Japan: Ministry of Transport, 47 pp. (in Japanese)
MITCHENER, H.; TORFS, H., and WHITEHOUSE, R., 1996. Erosion of mud/sand mixtures, Coastal
Engineering, 29, pp. 1-25.
NAGAI, N.; SATO, K.; SUGAHARA, A., and KAWAGUCHI, K., 2001. Annual report on
nationwide ocean wave information network for ports and harbours (NOWPHAS 2000),
Technical Note of the Port and Harbour Research Institute, 988, Yokosuka, Japan: PHRI, 402 pp.
(in Japanese)
O’BRIEN, D.J.; WHITEHOSE, R.J.S., and CRAMP, A., 2000. The cyclic development of a
macrotidal mudflat on varying timescales, Continental Shelf Research, 20, pp. 1593 – 1619.
PATERSON, D.M., 1989. Short-term changes in the erodibility of intertidal sediments related to the
migratory behavior of epipelic diatoms, Limnology and Oceanography, 34, pp. 223 – 234.
PEJRUP, M., 1986. Parameters affecting fine-grained suspended sediment concentrations in a shallow

25
micro-tidal estuary, Ho Bugt, Estuarine, Coastal and Shelf Science, 22, pp. 241 – 254.
RHOADS, D.C., and BOYER, L.F., 1982. The effects of marine benthos on physical properties of
sediments: a successional perspective, In: McCall, P.L., and Tevesz, M.J.S. (Eds.), Animal-
sediment relations: the Biogenic Alteration of Sediments, New York: Plenum Press, pp. 3 – 52.
SHIBAYAMA, T., and HORIKAWA, K., 1982. Sediment transport and beach transformation, Proc.
of 18th Coastal Engineering Conference, ASCE, pp. 1439 – 1458.
SOULSBY, R.L., 1997. Dynamics of Marine Sands: A Manual for Practical Applications, London:
Thomas Telford, 250 pp.
SOULSBY, R.L., and HUMPHERY, J.D., 1990. Field observations of wave-current interaction at the
sea bed, In: Torman, A., and Gudmestad, O.T. (Eds), Water Wave Mechanics, the Netherlands:
Kluwar Academic Publishers, pp. 413 – 428.
STEVENSON, J.C.; KEARNEY, M.S., and PENDLETON, E.C., 1985. Sedimentation and erosion in
a Chesapeake Bay brackish salt marsh system, Marine Geology, 80, pp. 37 – 59.
TALKE, S.A., and STACEY, M.T., 2003. The influence of oceanic swell on flows over an estuarine
intertidal mudflat in San Francisco Bay, Estuarine, Coastal and Shelf Science, 58, pp. 541-554.
TEISSON, C.; OCKENDEN, M.C.; LE HIR, P.; KRANENBURG, C., and HAMM, L., 1993.
Cohesive sediment transport processes, Coastal Engineering, 21, pp. 129-162.
TORFS, H.; MITCHENER, H.; HUYSENTRUYT, H., and TOORMAN, E., 1996. Settling and
consolidation of mud/sand mixtures, Coastal Engineering, 29, pp. 27-45.
VAN DER LEE, W.T.B., 2000. Temporal variation of floc size and settling velocity in the Dollard

26
estuary, Continental Shelf Research, 20, pp. 1495 – 1511.
WEST, M.S., and WEST, J.R., 1991. Spatial and temporal variations in intertidal zone properties in
the Severn Estuary, UK, In: Elliot, M., and Ducrotoy, J.P. (Eds.), Estuaries and Coasts,
Fredensborg: Alson and Alson, pp. 25 – 30.
WHITEHOSE, R.J.S., and MITCHENER, H.J., 1998. Observations of morphodynamic behaviour of
an intertidal mudflat at different timescales, In: Black, K.S.; Paterson, D.M., and Cramp, A.
(Eds.), Sedimentary Processes in the Intertidal Zone, 139, London: Geological Society, pp. 255 –
271.
WIDDOWS, J.; BRINSLEY, M., and ELLIOTT, M., 1998. Use of in situ flume to quantify particle
flux (biodeposition rates and sediment erosion) for an intertidal mudflat in relation to changes in
current velocity and benthic macrofauna, In: Black, K.S.; Paterson, D.M., and Cramp, A. (Eds.),
Sedimentary Processes in the Intertidal Zone, 139, London: Geological Society, pp. 85 – 97.
WILLIAM, H.F.L., and HAMILTON, T.S., 1995. Sedimentary dynamics of an eroding tidal marsh
derived from stratigraphic records of 137Cs fallout, Fraser Delta, British Columbia, Canada,
Journal of Coastal Research, 14 (4), pp. 1145 – 1156.
WU, J., and TSANIS, I.K., 1995. Numerical study of wind-induced water currents, Journal of
Hydraulic Engineering, 121, pp. 388-395.
YUAN, Y.M., and MOKHTARZADEH-DEHGHAN, M.R., 1994. A comparison study of
conditional sampling methods used to detect coherent structures in turbulent boundary layers,
Physics of Fluids, 6, pp. 2038-2057.

List of Figures and a Photo
Figure 1: The location of Banzu intertidal sand-flat, Tokyo Bay, Japan. Bed profiles were surveyed along transect A-A’ in the vicinity of the Obitsu River mouth.
Figure 2: Grain size distributions of bottom sediments sampled at stations 1 and 2. Median grain sizes are estimated to be 170-190 µm.
Figure 3: Instrumentation layout (left: station 1, right: station 2).
Figure 4: Bottom profiles along transect A-A’ surveyed on Feb.7 and 22, 2000, and their difference, ∆ h, along with the positions of stations 1 and 2.
Figure 5: Long-term accumulation evaluated from the bottom survey data along transect A-A’.
Figure.6: Time series of bed level, h, measured at station 1: (a) 1-hour averaged original time series, (b) 24-hour moving averaged bed level, (c) difference between (a) and (b), and (d) root-mean-square of (c).
Figure 7: Bottom elevation and tidal elevation at station 1, and turbidity at station 2.
Figure 8: Significant wave height, H1/3, and period, T1/3, at station 1, and principal wave directions.
Figure 9: Wind velocities at Kisarazu, and current velocities and water depth at station 2.
Figure 10: Cross spectra between (a) significant wave height, H1/3, and N-S component of wind velocity, Wn-s, and (b) H1/3 and η (tide: water depth at station 2).
Figure 11: Cross spectra between (a) Wn-s and N-S component of horizontal current velocity, Un-s, (b) H1/3 and Un-s, and (c) η and Un-s.
Figure 12: Discharge and water level of the Obitsu River measured at 5.6 km upstream from the river mouth. Upper panel: river discharge. Lower panel: tidal elevation at station 2 and river water level.
Figure 13: Annual variation of the Obitsu River discharge measured at 5.6 km upstream from the river mouth in 1999.
Figure 14: Bed shear stress (solid line) and turbidity (dotted line) at station 2.
Figure 15: Correlation between bed shear stress, τb, and turbidity.
Figure 16: Correlation between wave energy and turbidity.
Figure 17: Correlation between bed shear stress and wind shear stress at surface.

Figure 18: Ensemble averaged wind velocities, current velocities, tidal elevation, significant wave height, bed shear stresses, and suspended sediment concentrations calculated with the conditional sampling when the turbidity is in excess of 40 ppm.
Figure 19 Conceptual illustration of the current generation on Banzu intertidal flat. (a) tidal elevation, (b) velocities of wind-induced current, tidal current and wave-driven oscillatory flow, and (c) resultant total current velocity. Tide is assumed to consist of only the semi-diurnal component. High water and low water are set here to be at 3 h and 9 h.
Photo 1 Aerial photo of the study site (Banzu intertidal sand-flat, located off Kisaradu, Chiba Prefecture, Japan)

0 50km
Tokyo HasakiYokohama
Yokosuka
Tokyo BayN
Japan
Pacific Ocean
Sea of Japan
140 00' Eo
35 30' No
N
Kisarazu
Obitsu RIver
Tokyo BayAqua-Line(bridge)
BANZUTIDALFLAT
10m 5m
0m
5m
Stn.1
0 1 2(km)
0m5m10m
15m Stn.2
A
A'
Daini-KaihoWave Observatory
Figure 1: The location of the Banzu intertidal sand-flat, Tokyo Bay, Japan. Bed profiles were surveyed along transect A-A’ in the vicinity of the Obitsu River mouth.

10 10 10 10 10-3 -2 -1 0 1 0
20
40
60
80
100
diameter (mm)
cum
ulat
ive
wei
ght p
erce
ntag
e (%
) Stn.2Stn.1
Figure 2: Grain size distributions of bottom sediments sampled at stations 1 and 2. Median grain sizes are estimated to be 170-190 µm.
station 1station 2

sand surface meter
ultra sonicwave gauge
4.5m
Stn.1 Stn.2
1.5m10cm
electro-magnet current meterturbidity meter
Figure 3: Instrumentation layout (left: station 1, right: station 2).
station 1 station 2

0 200 400 600 800 1000 12000.1
0.3
0.5
0.7
0.9
1.1
1.3
1.5
+0.04
0.00
-0.04
-0.08
Feb. 7, 2000Feb. 22, 2000
distance offshore (m)
seab
ed le
vel (
T.P
., m
)
h (m
)∆
h∆
Stn.2 Stn.1
Figure 4: Bottom profiles along transect A-A’ surveyed on Feb.7 and 22, 2000, and their difference, ∆ h, along with the positions of stations 1 and 2.

1994 1995 1996 1997 1998 1999 2000-100
-50
0
50
100
150
200
250
300R=0.833
year
V (m
/m
)∆
3
Figure 5: Long-term accumulation evaluated from the bottom survey data along transect A-A’.

7 8 9 10 11 12 13 14 15 16 17 18 19 20 21 220.670.690.710.730.750.77
elevation (T.P., m)
date (Feb., 2000)
7 8 9 10 11 12 13 14 15 16 17 18 19 20 21 220.670.690.710.730.750.77
elevation (T.P., m)
date (Feb., 2000)
7 8 9 10 11 12 13 14 15 16 17 18 19 20 21 22-0.04
-0.02
0.00
0.02
0.04deviation (m)
date (Feb., 2000)
7 8 9 10 11 12 13 14 15 16 17 18 19 20 21 220.000.080.160.240.320.40 deviation RMS (m)
date (Feb., 2000)
(a)
(b)
(c)
(d)
Figure.6: Time series of bed level, h, measured at station 1: (a) 1-hour averaged original time series, (b) 24-hour moving averaged bed level, (c) difference between (a) and (b), and (d) root-mean-square of (c).

7 8 9 10 11 12 13 14 15 16 17 18 19 20 21 220.1
0.6
1.1
1.6
2.1
2.6
tide
(T.P
., m
)
0.85
0.81
0.77
60
30
0 turb
idity
(ppm
)
date (Feb., 2000)
seab
ed le
vel
(T.P
., m
)
turbidity
bed level
tide
Figure 7: Bottom elevation and tidal elevation at station 1, and turbidity at station 2.
01234
0.00.20.40.60.81.0 5
7 8 9 10 11 12 13 14 15 16 17 18 19 20 21 22SENW
dire
ctio
n
date (Feb., 2000)
T
(s)
1/3
H
(m)
1/3
H (m)1/3 T (s)1/3
Figure 8: Significant wave height, H1/3, and period, T1/3, at station 1, and principal wave directions.

N10 m/s
win
d
N30 cm/s
curr
ent
7 8 9 10 11 12 13 14 15 16 17 18 19 20 21 220.00.51.0
dept
h (m
)
date (Feb., 2000)
Figure 9: Wind velocities at Kisarazu, and current velocities and water depth at station 2.

10 10 10 10-3 -2 -1 0
frequency (1/h)
0
phas
e(ra
d) /4/2π
π
- /2- /4ππ
0.0
0.5
1.0
coh
2
10
10
10
10
10
10
2
3
4
5
6
7
10
10
10
10
10
10
-1
0
1
2
3
4
Wn-sH
24h12h
spec
trum
of W
n-s
(m /
s)2
1/3
spec
trum
of H
(
m s
)1/
32
-1
0
1
2
3
10
10
10
10
10
10 4
10
10
10
10
10
10
0
1
2
3
4
5
Hη
24h12h
10 10 10 10-3 -2 -1 0
frequency (1/h)
0
phas
e(ra
d) /4/2π
π
- /2- /4ππ
0.0
0.5
1.0
coh
2sp
ectru
m o
f H
(m s
)1/
32
1/3 spec
trum
of
(m
s)
2η
(a) H1/3 & Wn-s (b) H1/3 & η
Figure 10: Cross spectra between (a) significant wave height, H1/3, and N-S component of wind velocity, Wn-s, and (b) H1/3 and η (tide: water depth at station 2).

spec
trum
of W
n-s
(m /
s)
10
10
10
10
10
10
2
3
4
5
6
7
10
10
10
10
10
10
3
4
5
6
7
8
Wn-sUn-s
24h12h
10 10 10 10-3 -2 -1 0
frequency (1/h)
0
phas
e (ra
d) /4/2π
π
- /2- /4ππ
0.0
0.5
1.0
coh2
2
spec
trum
of U
n-s
(cm
/s)
2
10
10
10
10
10
10
-1
0
1
2
3
4
10
10
10
10
10
10
3
4
5
6
7
8
HUn-s
24h12h
10 10 10 10-3 -2 -1 0
frequency (1/h)
0
phas
e (r
ad)
/4/2π
π
- /2- /4ππ
0.0
0.5
1.0
coh2
spec
trum
of U
n-s
(cm
/s)
2
spec
trum
of H
(m
s)
1/3
2
1/3
10
10
10
10
10
10
0
1
2
3
4
5
10
10
10
10
10
10
3
4
5
6
7
8
ηUn-s
24h12h
10 10 10 10-3 -2 -1 0
frequency (1/h)
0
phas
e (r
ad)
/4/2π
π
- /2- /4ππ
0.0
0.5
1.0
coh
2
spec
trum
of U
n-s
(cm
/s)
2
spec
trum
of
(m
s)
2η
(a) Wn-s & Un-s (b) H1/3 & Un-s (c) η & Un-s
Figure 11: Cross spectra between (a) Wn-s and N-S component of horizontal current velocity, Un-s, (b) H1/3 and Un-s, and (c) η and Un-s.

7 8 9 10 11 12 13 14 15 16 17 18 19 20 21 221.52.53.54.5
date (Feb., 2000)
Qr (
m /
s)3
7 8 9 10 11 12 13 14 15 16 17 18 19 20 21 220.81.42.02.6
leve
l (T.
P.,
m)
date (Feb., 2000)
tide
Obitsu River
Figure 12: Discharge and water level of the Obitsu River measured at 5.6 km upstream from the river mouth. Upper panel: river discharge. Lower panel: tidal elevation at station 2 and river water level.

0
20
40
60
80
100
120
140
160
180
200
Jan. Feb. Mar. Apr. May Jun. Jul. Aug. Sep. Oct. Nov. Dec.months in 1999
disc
harg
e (m
/s)
3
Figure 13: Annual variation of the Obitsu River discharge measured at 5.6 km upstream from the river mouth in 1999.

7 8 9 10 11 12 13 14 15 16 17 18 19 20 21 22 80 40
0 2 4 6 8
10
0
date (Feb., 2000)
turb
idity
(ppm
)
shea
r stre
ss (N
/m )2
Figure 14: Bed shear stress (solid line) and turbidity (dotted line) at station 2.

0 1 2 3 4 5 0
10
20
30
40
50
60
70
turb
idity
(ppm
)
R=0 .856
shear stress (N/m )2
Figure 15: Correlation between bed shear stress, τb, and turbidity.

0 200 400 600 800 1000 0
10
20
30
40
50
60
wave eneargy (N/m)
turb
idity
(ppm
)
R=0 .689
Figure 16: Correlation between wave energy and turbidity.

0 1 2 3 4 50.0
0.1
0.2
0.3
0.4
0.5R=0 .572
win
d sh
ear (
N/m
)2
current shear (N/m )2
Figure 17: Correlation between bed shear stress and wind shear stress at surface.

-2 -1 0 1 2 3elapsed time, t (h)
1.0
1.4
1.8
2.2
2.60.9
0.6
H1/3 (m)
Nwind 10 m/s
current 20 cm/s
1 2 3 4 5 6 7
0 50
100
tide
(T.P
., m
)
turb
idity
(ppm
)sh
ear s
tress
(N/m
)2
-3
tide
shear stress
H1/3
Figure 18: Ensemble averaged wind velocities, current velocities, tidal elevation, significant wave height, bed shear stresses, and suspended sediment concentrations calculated with the conditional sampling when the turbidity is in excess of 40 ppm.

elapsed time (h)
(c) total current velocity2.0
0.0
-2.0
-4.0
(b) current components2.0
0.0
-2.0
-4.0
1.0
0.0
-1.0
(a) tidal elevation
high water ebblow water
flood
tidal current
wind-induced currentwave-driven oscillatory flow
peak (4.5 h)
0 1 2 3 4 5 6 7 8 9 10 11 12
0 1 2 3 4 5 6 7 8 9 10 11 12
0 1 2 3 4 5 6 7 8 9 10 11 12
Figure 19: Conceptual illustration of the current generation on Banzu intertidal flat. (a) tidal elevation, (b) velocities of wind-induced current, tidal current and wave-driven oscillatory flow, and (c) resultant total current velocity. Tide is assumed to consist of only the semi-diurnal component. High water and low water are set here to be at 3 h and 9 h.

Photo 1 Aerial photo of the study site (Banzu intertidal sand-flat, located off Kisaradu, Chiba Prefecture, Japan)
Delta
station 2
station 1

![Morphological variations and Inhibition of growth of ......[ISSN 0975 - 6272] Bhandari et al. 101 Volume III Number 2 2012 [97 – 105] Morphological variations and Inhibition of growth](https://img.dokumen.tips/doc/110x75/5e839fc559609e73bb4b97c5/morphological-variations-and-inhibition-of-growth-of-issn-0975-6272.jpg)