Embed Size (px)
Citation preview

_____________Mun. Ent. Zool. Vol. 11, No. 2, June 2016__________
695
GENETIC AND MORPHOLOGICAL VARIATIONS AMONG GEOGRAPHICAL POPULATIONS OF RHOPALOSIPHUM PADI
(L.) (HEMIPTERA: APHIDIDAE) IN EGYPT, USING RAPD AND ISSR MARKERS.
Reda M. Tabikha* and I. A. Adss**
* Plant Protection Department - Faculty of Agriculture, Damanhour University, EGYPT. E-mail: [email protected] ** Plant Pathology Department - Genetic Division - Faculty of Agriculture, Damanhour University, EGYPT. E-mail: [email protected] [Tabikha, R. M. & Adss, I. A. 2016. Genetic and morphological variations among geographical populations of Rhopalosiphum padi (L.) (Hemiptera: Aphididae) in Egypt, using rapd and issr markers. Munis Entomology & Zoology, 11 (2): 695-708]
ABSTRACT: Morphological and genetic variation of sixteen geagraphical populations of Rhopalosiphum padi (L.) collected from different locality of Egypt, were studed by investgating eighteen morphometric or numeric morphological characters, applying two molecular techniques; Random Amplified Polymorphic DNA (RAPD) and Inter Simple Sequence Repeats (ISSRs) with whole genomic DNA of aphid. Moreover, phylogenetic relationships among those populations were also concerned on base of morphological or genetic variation. Most tested morphological characters were nearly constant among investigated populations except five characters. Population of El-Fayoum Governorate was nearly different morphologically than others. The tested primers gave 47.27% polymorphism among R. padi geographical populations. Arbitrary primer C11 generated two unique bands with molecular weights 1400 and 1570 bp characterized Aswan and Menia populations, respectively. In addition, arbitrary primer (OPA-09) showed highest level of polymorphism at all (73.77%). Proximity matrix analysis, based on combined effect of RAPD- PCR and ISSRs, showed highest similarity value (85%) between geographical populations of Aswan and Sohag Governorates, while the lowest was with Qena and El-Sharqya populations. Moreover, the tested populations could be divided successfully into two main clusters, the first cluster include populations of Upper and Middle Egypt Governorates, while the second cluster includes populations of Lower Egypt Governorates. KEY WORDS: Rhopalosiphum padi, genetic, ISSR, RAPD-PCR, geotypes, wheat, phylogeny, Egypt
Aphid is a serious pest with wide range of agricultural crops in the temperate world; it can cause severe damage directly by depriving the plant of its essential nutrients or indirectly by transmitting viruses (Blackman, 1974; Minks & Harrewijn, 1987; Blackman & Eastop, 1994 & 2000). Bird cherry-oat aphid Rhopalosiphum padi (Linnaeus, 1758), is considered as one of dominant aphid species attack wheat and other plants of the families Gramineae. It was recorded for first time in Egypt by (Habib & El- Kady, 1961) on wheat. Confiding this species on cereal plants will be obvious and effective with higher generations' numbers under future climatic conditions in most regions of Egypt (Tabikha, 2016).
Molecular markers are rapid identification for large numbers of individuals collected at immature stages (Carew et al., 2003 & 2005). These techniques have been successfully applied to identify organisms in cryptic groups of invertebrates and also to identify species from eggs and immature stages (Clark et al., 2001; Carew et al., 2003 & 2005; Hebert et al., 2004; Choe et al., 2006). Early genetic studies depend on using PCR-random amplified polymorphic DNA technique to differentiate and study phylogenetic among aphid species in Egypt (Shahadi-

_____________Mun. Ent. Zool. Vol. 11, No. 2, June 2016__________
696
Fatima et al., 2007; Tabikha, 2008 and Amin et al., 2013), moreover detecting large amounts of genetic variation among and within biotypes of species (Black et al., 1992; Cenis et al., 1993). PCR-RFLP technique has been used not only to differentiate between aphid biotypes (Sunnucks et al., 1997; Shufran, 2003) but also to characterize genetic relationship of geographic population of aphid species in different countries. Mitochondrial DNA have been extensively used for studying population structure, phylogeography and phylogenetic relationship at various taxonomic levels (Xu et al., 2009).
Mitochondrial DNA methodology found to be a very promising tool for analyzing aphid population structure such as Rhopalosiphum padi from different localities in Spain (Martinez et al., 1992). Spatial and seasonal patterns of mitochondrial DNA diversity for R. padi populations were also examined in France (Martinez-Torres et al., 1997). Same technique has been also used to demonstrate the presence of two predominant lineages of R. padi in New Zealand (Bulman et al., 2005).
In addition, PCR techniques were used with other aphid species, that RAPD-PCR was used to estimate nucleotide diversity and genetic structure of Rhopalosiphum padi, Aphis gossypii and Myzus persicae, collected from two geographic distributions (Martinez et al., 1997), to detect the differentiation of Myzus persicae on tobacco from different regions (Yang-Xiao et al., 1999) and Aphis gossypii in China (Zou-Chen et al., 2000 & 2001). 588 bp region of (mtDNA-COI) were sequenced and analysed among different geographic population of Sitobion avenae in China (Zhao-huan et al., 2011).
Although Simple Sequence Repeats ISSRs (microsatellites) considered as punctual and sensitive genetic techniques which has been used by plant biologists (Wolfe & Liston, 1998) it was rarely used in zoological studies (Kostia et al., 2000; Reddy et al., 1999). This technique was used for population-level studies in two species of cyclically parthenogenetic aphids, Acyrthosiphon pisum and Pemphigus obesinymphae (Abbot, 2001), and to differentiate among eleven cereal aphid species found in Egypt (Helmi et al., 2011). Moreover it was also used to characterize microsatellite loci in Aphis gossypii, which collected from different host plants and different locations (Vanlerberghe et al., 1999) and to identify different biotypes of greenbug, Schizaphis graminum (Weng et al., 2007).
So, current study aimed to use RAPD-PCR and ISSRs for studying genetic variation and phylogeographic relationship among Rhopalosiphum padi geographical populations collected from 16 locations along latitudes of Egypt.
MATERIALS AND METHODS 1. Samples Collection and Preservation:
Specimen (apterous viviparous) of Rhopalosiphum padi (L.) collected from leaves, leaves' sheaths and spinks of wheat, Triticum aestivum from sixteen different administrative regions in Egypt (between latitudes of 22° and 32°N and longitudes 25°E and 35°E) during March, 2015. Data about latitudes and longitudes of region and date of collection and amount of each specimen were recorded and presented in Table (1) then preserved in Eppendorf tubes with ethyl alcohol 70% till further specimen mounting and morphological studies. Ten adult females were caged separately on wheat leaves by using leaf cages under field conditions of each region. After three days, offspring of next generation for each stem mother were collected by hair brush and preserved in Eppendorf tubes with ethyl alcohol 70% and transferred to laboratory under cooling and then preserved under -20o C till further use in molecular genetics studies. 2. Mounting Samples and Morphological Studies:
Slides of preserved adults apterae specimens were prepared and mounted, after maceration procedure according to Blackman and Eastop (2000) and a permanent euparal

_____________Mun. Ent. Zool. Vol. 11, No. 2, June 2016__________
697
mounting technique was chosen following Martin’s (1983) method of dehydrating the macerated specimens. The species was identified and confirmed by using taxonomic keys of Blackman and Eastop, (1984) & (2000) and Fathi and El-Fatih (2009). Eighteen morphometric or numeric morphological characters were investigated in specimens of each region as follow:-
1. Ratio between each antennal segment (I, II, III, IV, V, Basal part of VI and Unguis of VI) to total length of antenna.
2. Ratio between width of first Antennal seg. to width of second antennal seg. 3. Ratio between width to length of Apical rostal segment. 4. Ratio between width to length of Sphiniculi. 5. Ratio between width to length of Cauda. 6. Ratio between length of first to second tarsal segment. 7. Number of sensorial seta on antennal segment ( I, II, III, IV, V and Basal part of
VI). Obtained data subjected to ANOVA test Analysis by using COSTAT (2008) statistical
software computer program, then hierarchical clusters analysis based average linkage method for tested morphological characters of each aphid geographical population and their Euclidean distance, was performed by SYSTAT 13 Computer program. 3. Molecular Genetic Characterizations:
Sixteen specimens of geographical populations for Bird cherry-oat aphid, collected from wheat plants in different localities of Egypt, were subjected to Polymerase Chain Reaction with six arbitrary ten-mer primers (RAPD- PCR) and with four Inter Simple Sequence Repeat (ISSRs) primers.
a) DNA extraction
DNA from aphid was extracted using a Cetyl Trimethyl Ammonium Bromide (CTAB) protocol Weeks et al. (2000) with some modifications. Five individuals of apterus aphid adults were grinded in Eppendorf tubes under liquid nitrogen to a fine powder, powdered were transferred to 1.5 ml tubes and 750 μl of extracted buffer (2% PVP-40, pH 8.0 EDTA 20 mM, CTAB 5% (W/V) Tris-HCl pH 8.0 100 mM, NaCl 1.4 M, 2.0% mercapto ethanol) stored in 60˚C was added to each sample, mixed then kept in 60˚C hot water bath for 35 minutes. During incubation period, the contents of the tubes were shaken gently several times. Equivalent to the volume of the tube, the mixture of chloroform – isoamyl alcohol (1:24) was added to each tube containing the sample and was mixed gently for one minute. The mixture was centrifuged for 15 min at 13,000 rpm, and then supernatant was taken and poured into a new sterile tube, 1 ml of cold isopropanol solution was added to each tube and the solution in the tubes was gently mixed several times. Let the DNA precipitate in -20°C (freezer) for 30 min at least. The tubes containing DNA strands were centrifuged for 10 min at 13000 rpm on 4˚C and the supernatant was emptied gently so that the DNA remained intact inside the tube. Then 500 ml of ethanol 70% was added to the tubes containing DNA, and centrifuged at 13,000 rpm on 4˚C for 5 min. The upper phase was discarded and tubes were upside down in air and placed on absorbent paper so that the deposition dried and finally 50 μl of sterile double- distilled water was added to each tube. The samples were stored overnight in the refrigerator until the mass of DNA distilled in water. To detect the extracted DNA, 1.2% Agarose gel in TBE buffer was used then 5 μl of DNA with double amount of loading buffer was mixed and electrophorized under a constant voltage of 80 volts for 1.5 hours. Quantity and quality of extracted DNA was determined by spectrophotometry and agarose gel electrophoresis.
b) RAPD-PCR preparations and conditions:
Six random primers that consist of 10 bases were used to differentiate and fingerprint the tested Bird cherry-oat aphid geographical populations. The arbitrary primers sequences are presented in Table (2). For RAPD analysis, PCR amplification was carried out in total volume of 25µl containing 2.5µl 10 x buffer, 2.5µl 50 mM MgCl2, 2.5µl 4 mM dNTPs, 7µl 50pmol primer,1µl 10 ng of isolate genomic DNA and 0.2µl (5 units/ µl) Taq DNA polymerase (Promega Germany).
Amplification was performed in a thermal cycler and The following PCR programme was applied: Initial Denaturation (Initial strands separation) on 95ºC for 5 min; then 40 cycles were performed, each cycle contained Denaturation on 95ºC for 1 min, Annealing on

_____________Mun. Ent. Zool. Vol. 11, No. 2, June 2016__________
698
30ºC for 1 min and Extension on 72ºC for 1 min; finally, an extra final extension step on 72ºC for 10 min Istock et al. (2001). Two µl of loading dye were added prior to loading of 10 µl per gel slot. Electrophoresis was performed at 100 volt with 0.5 x TBE as running buffer in 1.5% agarose/0.5x TBE gels and then gel was stained in 0.5 µg/cm3 (w/v) ethidium bromide solution and distained in deionized water. Finally the gel was visualized and photographed using gel documentation system (Bio-Rad Gel Doc.2000).
c) ISSR preparations and conditions:
PCR amplification was performed using four Inter Simple Sequence Repeats (ISSRs) primers to differentiate and finger prints the geographical population of Bird cherry-oat aphid. The ISSR primers sequences of DNA are presented in Table (3). PCR amplification was conducted in total volume of 25 μL containing: 2μL DNA, 2μL of primer, 2.5µl 10 x buffer, 2.5µl 50mM MgCl2, 2.5µl 4mM dNTPs and 0.2 µl (5 units/ µl) Taq DNA polymerase (Promega Germany).
The DNA amplifications were performed in an automated thermal cycler with PCR conditions as follow: for one cycle on 94°C for 5 min, followed by 40 cycles [1 min on 94°C, 75 second on 44°C (for HB-09 and HB-14 primers) or 40°C (for HB-12 and HB-13 primers) and 2 min on 72°C] then Final extension for 10 min on 72°C. PCR products were separated by gel electrophoresis in 1% (w/v) agarose gel in TBE buffer at 120 V for 30 min then the bands were visualized by staining with Ethidium bromide, and photographed by using gel documentation system (Bio-Rad Gel Doc.2000).
4. Genetic Relatedness among Aphid Geographical Population:
To calculate pairwise difference matrix among the sixteen geographical populations of R. padi, Gene_Profiler_Eval computer program was used to record bands variations with each primer of RAPD and ISSRs markers, then resulting polymorphic bands from each geographical population were scored as 1 for presence of band and 0 for its absence. It was assumed that the bands with the same size were identical. Genetic comparisons based on RAPD or/and ISSRs fingerprints among geographical population were calculated using Jaccard's similarity coefficient embedded in Multi Variate Statisical Pakage (MVSP ) Version 3.1. computer program. Cluster analysis of the data matrix was performed by the Unweighted Pair Group Method with Arithmetic Means (UPGMA) with Jaccard's similarity coefficient Sneath and Sokal (1973).
RESULTS
Morphological and genetic variation of sixteen geagraphical populations of Rhopalosiphum padi (L.) collected from different locality of Egypt, were studied by investgating eighteen morphometric or numeric morphological characters and using ten PAPD and ISSR primers in polymerase chain reaction (PCR) for extracted DNA of each population. Moreover, phylogenetic relationships among those populations were also concerned on base of morphological or genetic variation among the populations.
1. Morphological Variation and Relatedness Analysis.
Most of the tested morphometeric and numeric morphological characters were nearly constant among investigated geographical population of R.padi in Egypt except five characters, which were varied signficantly from geographical population to another. Those varied characters were ratio between second antennal segment length to total antenna length, first to second antennal segment width, length of first to second tarsal segment, and width to length of sphiniculi, in addition numbers of sensorial hairs on fourth antennal segments. Results of ANOVA test analysis confirmed presence significant geographical variation for those characters among populations as followed: (F= 2.146*, LSD 0.05= 2.9e-5), (F= 3.104**, LSD 0.05= 0.015), (F= 2.481*, LSD 0.05= 0.302), (F= 3.478**, LSD 0.05= 0.176) and (F= 2.461*, LSD 0.05= 0.998), respectively. So it will be recommended avoiding of use those characters in discriminate R. padi species. In contrary the rest constant tested characters can be used as taxonomic characters for R. padi species as possible or at least characterized R. padi population of Egypt, but it is unsuitable for discriminate geographical populations of R. padi inside Egypt.

_____________Mun. Ent. Zool. Vol. 11, No. 2, June 2016__________
699
Relatedness among sixteen geographical populations of R. padi, based on morphometric and numeric morphological characters as graphically illustrated in Figure (1) that reflected the sixteen geographical populations can be classifying into two main clusters. The first cluster separate El-Fayoum population from others which indicate that population is nearly different morphologically than others. The second cluster divided to two sub-clusters, the first sub-cluster includes Assiut and Menia population, while the second sub-cluster divided to two groups. First group separate the south populations (Swan, Qena and Sohag Governorates) from Lower Egypt population, which the last one include two sub-groups, the first sub-group include population in closed localities (El-Behera, Kafer El-Shikh, Dakahli, Domiata) in addition Beni-Suif Governorates. While the second sub-group include population in semi closed governorates (El-Monfia, El-Giza, El- Sharqya and El- Gharbia Governorates).
2. Molecular Genetic Variation and Characterization.
Genetic variation among the sixteen geographical population of R. padi were assessed by using six Random Amplified Polymorphic DNA (RAPD) primers and four Inter Simple Sequence Repeats (ISSRs) primers with whole genomic DNA of aphid. Analysis of obtained data revealed that the used primers showed different levels of polymorphism. These primers generated 880 fragments, 416 bands of them were considered as polymorphic markers (47.27%) for different geographical populations of R. padi, while 496 bands were considered as monomorphic bands (52.73%).
a. RAPD-PCR analysis.
The obtained bands pattern of applying RAPD-PCR technique are shown in Figure (2), which reflect that four arbitrary primers (C11, C14, OPA-03 and OPA-09) from the six tested primers gave successfully different levels of polymorphism among tested geotypes, while the other primers (OPA-11 and OPA-12) didn’t show any polymorphism among geotypes. The four primers generated 481 different DNA fragment bands with wide molecular sizes (140-1570 bp). 273 polymorphic distinct fragment bands were recorded to achieve 56.76% polymorphism among tested geotypes. The highest number of DNA fragment bands (129) was observed with primer OPA-03, while the lowest number was 103 bands, generated by primer C11.
Primer C11 generated 103 bands with widest molecular weights at all ranged from 225 to 1570bp. 71 bands of them were considered as polymorphic markers for different geotypes (68.93%), while 2 bands of them were considered as unique bands that characterized population of Aswan and Menia with molecular weights 1400 and 1570 bp, respectively. In contrary, two common bands were detected among the sixteen geographical population of R. padi in molecular weights 325 and 986bp. This primer generated lowest numbers of bands (3 bands) with population of Beni-Suif Governorate, while highest numbers (9 bands) observed with population of El-Dakahlia Governorate.
The generated RAPD profile of DNA fragment bands with primer C14 gave highest number of bands (10 bands) with El-Qaloubia geographical population. In contrast, this primer gave lowest numbers of DNA fragments (6 bands) with the population collected from Menia Governorate. In addition, it generated 127 bands with molecular weights ranged from 150 to 1100bp. Sixty three bands of them were considered as polymorphic markers for different geotypes to achieve moderated polymorphism level at all (49.60%). Four common bands were detected among the sixteen geographical populations in molecular weights 263, 316, 350 and 618bp.
It was obvious from bands analysis for PCR products generated by OPA-03 primer that were 129 bands with closest molecular sizes at all, ranged from 160 to 781 bp and lowest level of polymorphism among the sixteen tested geotypes (37.98%), where 49 bands of them were polymorphic bands. This primer generated lowest numbers of bands (4 bands) with population of Qena, while highest numbers (9 bands) observed with populations of Aswan, Assiut, El-Fayoum, El-Monofia, Kafer El-Shikh and Domiata Governorates. Highest number of common bands (Five) was detected among the sixteen geographical populations in molecular weights 362, 387, 436, 470 and 504bp.
The last arbitrary primer (OPA-09) generated 122 bands with molecular weights ranged from 140 to 1000 bp. Number of generated bands in different geotypes ranged
_____________Mun. Ent. Zool. Vol. 11, No. 2, June 2016__________
700
from 4 bands in El-Behera population to 10 bands in populations of Qena and Sohag. This primer showed highest level of polymorphism at all (73.77%) whereas two common bands were only detected among the sixteen geographical populations of R. padi with molecular weights 140 and 300bp. So it may be considered as best DNA marker primers to differentiate among R. padi geographical population in Egypt.
b. ISSR analysis.
Four ISSRs primers (HB-09, HB-12, HB-13 and HB-14) were tested with the sixteen geographical populations of R. padi to detect molecular markers for each geotypes as shown in Figure (3). All tested ISSRs primers gave successfully different levels of polymorphism among tested geotypes that generated 399 different DNA fragment bands with molecular sizes (182-1000 bp). Obvious 143 polymorphic fragment bands were noticed to achieve polymorphism percent 35.84% among tested geotypes. The highest number of DNA fragment bands (115) was observed with primer HB-13, while the lowest number was 87 bands, generated by primer HB-09. Highest level of polymorphism (46.67%) was observed with primer HB-12, among the tested geotypes.
The generated ISSRs profile of DNA fragment bands with the primer HB-09 gave 87 bands with molecular weights ranged from 182 to 700bp. highest number of bands (6 bands) observed with most geographical population (Aswan, Qena, Sohag, Assuit, El-Qaluobia, El-Monfia, El-Gharbia and Domiata Governorates), while lowest numbers of bands (4 bands) occurred with population of Menia Governorate. It generated 39 polymorphic bands to achieve polymorphism level (44.83%). In contrast, three common bands were detected among the sixteen geographical populations with molecular weights 182, 183 and 625bp.
Primer HB-12 generated 90 bands with molecular weights ranged from 280 to 1000bp. Moreover, 42 bands pattern of them were considered as polymorphic markers for different geotypes with percent of polymorphism (46.67%) (Highest level comparing with tested ISSRs primers). In contrary, three common bands were detected among the sixteen geographical populations in molecular weights 532, 665 and 740bp. This primer generated lowest numbers of bands (4 bands) with populations of El-Monfia Governorate, while highest numbers (7 bands) observed with populations of Aswan and El-Fayoum Governorates.
Primer HB-13 generated 115 bands with molecular weights ranged from 165 to 990bp. Numbers of generated bands in different geotypes ranged from 6 bands in populations of El- Monofia and El-Dakahlia to 8 bands in populations of Qena, Assiut, El-Qaloubia, Kafer El-Shikh and Domiata Governorates. This primer showed lowest level of polymorphism at all 16.52% whereas highest numbers of common bands (6 bands) were detected among the sixteen geographical populations with molecular weights 165, 256, 300, 333, 424 and 586bp. So it may be considered as less suitable ISSRs primer to differentiate geographical populations of R. padi in Egypt, while it may be DNA marker primers to characterized R. padi species of Egypt at all or species specific primers.
Primer HB-14 generated 107 bands with molecular weights ranged from 285 to 912 bp where 43 bands of them were polymorphic bands to give 40.19% polymorphism among the sixteen tested geotypes. This primer generated lowest numbers of bands (5 bands) with populations of El-Qaloubia and El-Behera Governorates, and generated 6 bands with population of Aswan, El-Fayoum and El- Gharbia Governorates. While highest numbers (8 bands) observed with R. padi populations of El-Fayoum, El-Dakahlia and Kafer El-Shikh Governorates. Common bands were detected among the sixteen geographical population species in molecular weights 285, 402, 420 and 738bp.
3. Genetic Relatedness among Geographical Populations of R. padi in Egypt.
Genetic similarities and phylogenetic relationships among the tested sixteen geographical population of R. padi were based on RAPD- PCR and ISSRs analysis, in addition the combined effect of those techniques. To calculate proximity matrix and design dendrograms, the obtained data were subjected to cluster analysis by using Unweighted Pair Group Method with Arithmetic Means (UPGMA) and Jaccard's similarity coefficient

_____________Mun. Ent. Zool. Vol. 11, No. 2, June 2016__________
701
embedded in NTSYS-pc computer program.
The results of proximity matrix analysis for the tested sixteen geographical population of R. padi, based on RAPD- PCR, reflected that the highest similarity value 77.8% was recorded between geographical populations of El-Dakahlia and Kafer El-Shikh Governorates, while the lowest similarity value (48.6%) was recorded between geographical populations of Aswan and El-Giza Governorates. Moreover, dendrogram analysis based on RAPD-PCR polymorphism was graphically illustrated in Figure (4), which reflects that the sixteen geographical populations of R. padi could be classify into two main clusters with similarity percentage 61%, the first cluster divided to two sub-clusters, the first one includes only geographical population of El-Behera governorate; while the second include two groups with similarity percentages 68%, the first group divided to two sub-groups with similarity percentages 73%; the first includes El-sharqya, Kafer El-Shikh and El-Dakahlia populations, while the second includes Domiata and El-Qaloubia. The second sub-cluster includes El-Monfia and El-Giza population. The second cluster had populations of Upper Egypt governorates that divided to two sub-clusters with similarity percentage 68%, the first sub- cluster includes populations of Qena, Menia, Beni-Suif, El-Fayoum and El-Gharbia Governorates with similarity 69%; while the second sub-cluster includes populations of Assuit, Sohag and Aswan Governorates with similarity 73.3%.
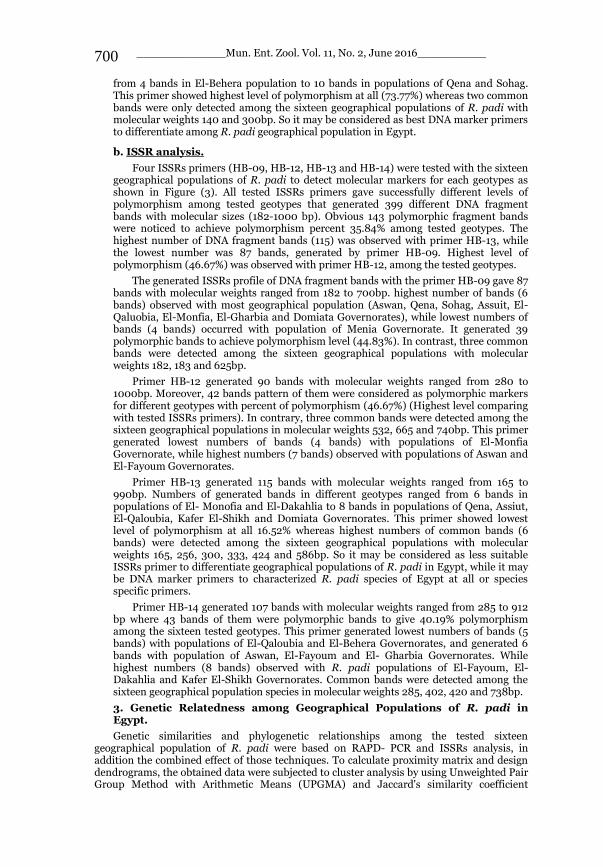
Proximity matrix analysis for the tested sixteen geographical population of R. padi, based on ISSR-PCR, reflected that the highest similarity value 96.3% was recorded between geographical populations of Aswan and Sohag Governorates, while the lowest similarity value (61.3%) was recorded between geographical populations of Assiut and El-Sharqya Governorates. In addition, dendrogram analysis based on ISSRs polymorphism was graphically illustrated in Figure (5), which reflects that the sixteen geographical populations of R. padi separated to two main clusters with similarity percentage 77.5%, the first cluster divided to two sub-clusters, the first one includes only geographical population of El-Monofia Governorate; while the second sub-clusters includes two groups with similarity percentage 81%; the first group includes populations of El-Gharbia and El-Sharqya Governorates, while the second group divided to two sub-groups with similarity 81.3%; the first include Domiata and El-Behera, Kafer El-Shikh and El-Dakalia Governorates; while the second include the populations of El-Qaloubia, El-Giza, Beni-Suif and Menia Governorates. The second cluster had populations for south of Upper Egypt governorates (Aswan, Qena and Sohag, Assiut) in addition to El-Fayoum Governorate with similarity percentage 85%.
The results of proximity matrix analysis for the tested sixteen geographical population of R. padi, based on combined effect of RAPD- PCR and ISSRs, showed that the highest similarity value 85% was recorded between geographical populations of Aswan and Sohag Governorates, while the lowest similarity value (58.8%) was recorded between geographical populations of Qena and El-Sharqya Governorates. Moreover, dendrogram analysis based on combined effect of RAPD- PCR and ISSRs polymorphism is graphically illustrated in Figure (6), which reflects that the sixteen geographical populations of R. padi could be divided successfully into two main clusters with similarity percentage 68%, the first cluster include populations of Upper and Middle Egypt Governorates in addition population of El-Gharbia Governorate, while the second cluster includes populations of Lower Egypt Governorates. So the first cluster includes two sub-cluster with similarity 75%; the first sub-cluster includes populations of Aswan, Sohag, Assiut and Qena Governorates with similarity percentage 77%, while the second sub-cluster includes populations of Menia, Beni-Suif, El-Fayoum and El-Gharbia with similarity 76.5%. The second cluster of Lower Egypt could be also divided to two sub-cluster, the first sub-cluster includes populations of El-Monofia and El-Giza Governorates with similarity 79%, while the second sub-cluster could be divided to two groups; the first group includes populations of El-Qaloubia, El-sharqya, Kafer El-Shikh and El-Dakahlia Governorates with similarity percentage 75.5%, while the second group include populations in costal Governorates (El-Behera and Domiata) with similarity percentage 78%.

_____________Mun. Ent. Zool. Vol. 11, No. 2, June 2016__________
702
DISCUSSION
Classical morphological criteria for aphid species identification may be affected by environmental factors such as climatic conditions and physiological status of the host plant (Helmi et al., 2011). The RAPD-PCR analysis was suitable method to determine genetic distances among different taxa (families, subfamilies, genera, species and populations within species) of aphids, moreover to differentiate aphids especially for closely and related species (Black et al., 1992; Cenis et al., 1993; Lushai et al., 1997; Zhang et al., 2000 and Jain et al.; 2010). Using of different primers in the RAPD method permits the detection of different levels of DNA polymorphism for Myzus persicae population (Yang et al., 1999), to detect a close relationship between the green spruce aphid, Elatobium abietinum in two localities (Sigurdsson et al., 1999), distinguish different geographical and/or host associated populations of some cryptic complex species (Zitoudi et al., 2001; Bulman et al., 2005; Helmi et al., 2011) and to distinguish among six biotypes of Schizaphis graminium (Black et al., 1992). Whereas Diuraphis noxia populations, collected from various host plants and regions, gave 69 polymorphic DNA bands amplified by 7 primers (Puterka et al., 1993). Random primer A11 gave a diagnostics constant loci to differentiate populations of Aphis gossypii collected on cucurbits, which was absent in those collected from other host plants (Vanlerberghe and Chavigny, 1998). In contract collected populations of A. gossypii from different localities can be differentiated (Zou-Chen et al., 2000). Each of geographical and seasonal distribution of Sitobion avenae populations had low effect on genetic variability (Figueroa et al., 2005).
In Egypt RAPD-PCR technique is successively used to fingerprint of some sap-sucking insect species belonging to the same taxonomic category such as fingerprinting of ten aphids species belonging to Genus Aphis (Shahadi-Fatima et al., 2007), eighteen aphid species belonging to Tribe Aphidini (Sub-tribe Rhapalosiphina) and Tribe Macrosiphini (Tabikha, 2008) and to differentiate eleven different cereal aphid species (Helmi et al., 2011).
Some taxonomic studies were based on ISSRs techniques and applied with aphids such as (Abbot et al., 2001) that studied population-level in two species of cyclically parthenogenetic aphids; Acyrthosiphon pisum and Pemphigus obesinymphae, and reported that ISSRs are suitable for invertebrate populations with small size bodies and low levels of within-population variation; (Weng et al., 2007) studied host-associated genetic differences and regional differences among the green bug, Schizaphis graminum biotypes and cited that the use of ISSRs would be useful for aphid genetic, ecological, and evolutionary studies.
In Egypt, (ISSRs) were used to find diagnostic markers for fingerprinting eleven cereal aphids collected from different cereal plants and from different localities in Egypt. Whereas HP-09 primer generated 23 bands with molecular weight ranged from 117 to 1109bp. and generated 5 bands with R. padi and showed 82.6% polymorphism; HP-11 primer generated 30 bands with molecular weights ranged from 124 to 1301bp. and showed 73.3 % polymorphism; HP-12 primer generated 22 bands with molecular weight ranged from 95 to 842bp. with 90.9% polymorphism, and detected one marker band for R. padi ; HP-13 primer: generated 25 bands with molecular weight ranged from 123 to 1016bp. with 88% polymorphism and detected also one marker band for R. padi; finally HP-14 primer generated 22 bands with molecular weights ranged from 32 to 963bp. with 81.8% and detect one marker band for R. padi (Helmi et al., 2011).

_____________Mun. Ent. Zool. Vol. 11, No. 2, June 2016__________
703
ACKNOWLEDGEMENTS
Grateful thanks are extended to Dr. Ahmed Abd El khaleik, Nucleic Acid Department, Research City for Scientific Research and Biotechnology, for supporting and helping us in molecular studies; and to each of Dr. Mohammed Z. Dakroury, Crop Department and Dr. Mostafa E. Ahmed, Plant Protection Department, Faculty of Agriculture, Damanhour University for their appreciated helps and efforts in specimens' collection with authors.
LITERATURE CITED
Abbot, P. 2001. Individual and population variation in invertebrates revealed by Inter-simple Sequence Repeats (ISSRs). 3 pp. Journal of Insect Science, 1.8. Available online: insectscience.org/1.8.
Amin, A. H., Draz, K. A., Soliman, Kh. A. & Tabikha, R. M. 2013. Genetic fingerprints and phylogenetic relationships of eighteen aphid species from Egypt (Hemiptera: Sternorrhyncha: Aphididae). Munis Entomology & Zoology, 8 (1): 387-406.
Black, W. C., DuTeau, N. M., Puterka, G. J., Nechols, J. R. & Pettorini, J. M. 1992. Use of the random amplified polymorphic DNA polymerase chain reaction (RAPD-PCR) to detect DNA polymorphisms in aphids (Homoptera: Aphididae). Bulletin of Entomological Research, 82: 151-159.
Blackman, R. L. 1974. Aphids. Ginn & Company Limited, London and Aylesbury, UK.
Blackman, R. L. & Eastop, V. S. 1984. Aphids on the world’s crops: An Identification and Information Guide (text book). John Wiley & Sons; 465 pp.
Blackman, R. L. & Eastop, V. F. 1994. Aphids on the World’s Trees: An Identification and Information Guide. CAB International in association with the Natural History Museum, Wallingford, USA.
Blackman, R. L. & Eastop, V. F. 2000. Aphids on the World’s Crops: An Identification and Information Guide, 2nd edn. John Wiley & Sons Ltd, Chichester, UK.
Bulman, S. R., Stufkens, M. A. W., Nichol, D., Harcourt, S. J., Harrex, A. L. & Teulon, D. A. J. 2005. Rhopalosiphum aphids in New Zealand. I. RAPD markers reveal limited variability in lineages of Rhopalosiphum padi. New Zealand Journal of Zoology, 32: 29-36.
Carew, M. E., Pettigrove, V. & Hoffmann, A. A. 2003. Identifying chironomids (Diptera: Chironomidae) for biological monitoring with PCR-RFLP. Bulletin of Entomological Research, 93: 483-490.
Carew, M. E., Pettigrove, V. & Hoffmann, A. A. 2005. The utility of DNA markers in classical taxonomy: Cytochrome Oxidase I markers to differentiate Australian Cladopelma (Diptera: Chironomidae) midges. Annals of the Entomological Society of America, 98: 587-594.
Cenis, J. L., Perez, P. & Fereres, A. 1993. Identification of aphid (Homoptera: Aphididae) species and clones by random amplified polymorphic DNA. Annals of the Entomological Society of America, 86: 545-550.
Choe, H. J., Lee, S. H. & Lee, S. 2006. Morphological and genetic indiscrimination of the grain aphids Sitobion avenae complex (Hemiptera: Aphididae). Applied Entomology and Zoology, 41: 63-71.
Clark, T. L., Meinke, L. J. & Foster, J. E. 2001. PCR-RFLP of the mitochondrial cytochrome oxidase (subunit I) gene provides diagnostic markers for selected Diabrotica species (Coleoptera: Chrysomelidae). Bulletin of Entomological Research, 91: 419-427.
Costat Software 2008. Version 6.3, CoHort, 798 Lighthouse Ave, PMB 320, Monetery, CA93940, USA.
Fathi, A. H. & El Fatih, M. M. 2009. Identification of apterous viviparous of cereal aphids in Egypt (Hemiptera: Sternorrhyncha: Aphidoidea). Bull. Ent. Soc. Egypt, 86: 307-325.
Figueroa, C. C. , Simon, J. C., Le Gallic, J. F., Leterme, N. P., Briones, L. M., Dedryver, C. A. & Niemeyer, H. M. 2005. Genetic structure and clonal diversity of an introduced pest in Chile, the cereal aphid Sitobion avenae. Heredity, 95: 24-33.
Habib, A. & El-kady, E. 1961. The Aphididae of Egypt. Bull. Soc. Entomol. Egypte, 45: 1-137.
Hebert, P. D. N., Penton, E. H., Burns, J. M., Janzen, D. H. & Hallwachs, W. 2004. Ten species in one: DNA barcoding reveals cryptic species in the Neotropical skipper butterfly Astraptes fulgerator. Proceedings of the National Academy of Sciences of the United States of America, 101: 14812-14817.
Helmi, A., Khafaga, A. F. & El-Fatih, M. M. 2011. Molecular Fingerprinting of certain cereal aphids in Egypt (Hemiptera: Sternorrhyncha: Aphididae) using RAPD and ISSR markers. Munis Entomology & Zoology, 6 (1): 363-376.
Istock, C. A., Ferguson, N., Istock, N. L. & Duncan, K. E. 2001. Geographical diversity of genomic lineages in Bacillus subtilis (Ehrenberg) Cohn sensu lato.Org. Divers. Evol., 1: 179-191.
Jain, S. K., Neekhra, B., Pandey, D. & Jain, K. 2010. RAPD marker system in insect study: A review, Indian Journal of Biotechnology, 9: 7-12.
Kostia, S., Ruohonen-Lehto, M., Vainola, R. & Varvio, S. L. 2000. Phylogenetic information in inter-SINE and inter-SSR fingerprints of the Artiodactyla and evolution of the BovtA SINE. Heredity, 84: 37-45.
Lushai, G., Loxdale, H. D., Brookes, C. P., Ven Mende, N., Harrington, R. & Herdie, J. 1997. Genotypic variation among different phenotypes within aphid clones. Proc. Biol. Sci., 264(1382): 725-730.

_____________Mun. Ent. Zool. Vol. 11, No. 2, June 2016__________
704
Martin, J. H. 1983. The identification of common aphid pests of tropical agriculture. Tropical Pest Management, 29: 395-411.
Martinez, T. D., Moya, A., Hebert, P. D. N. & Simon, J. C. 1997. Geographic distribution and seasonal variation of mitochondrial DNA haplotypes in the aphid Rhopalosiphum padi (Hemiptera: Aphididae). Bull. Ent. Res., 87(2): 161-167.
Martiniz, D., Moya, A., Latorre, A. & Fereres, A. 1992. Mitochondrial DNA variation in Rhopalosiphum padi (Homoptera: Aphididae) populations from four Spanish localities. Ann. Entomol. Sot. Am., 85: 241-246.
Minks, A. K. & Harrewijn, P. eds. 1987. Aphids: Their Biology, Natural Enemies and Control. Elsevier, New York, USA.
Puterka, G. J., Black, W. C., Steiner, W. M. & Burton, R. L. 1993. Genetic variation and phylogenetic relationships among worldwide collections of the Russian wheat aphid, Diuraphis noxia (Mordvilko), inferred from allozyme and RAPD-PCR markers. Heredity, 70(6): 604-618.
Reddy, K. D., Nagaraju, J. & Abraham, E. G. 1999. Genetic characterization of the silkworm Bombyx mori by simple sequence repeat (SSR)-anchored PCR. Heredity, 83: 681-687.
Shahadi-Fatima, H., Amin, A. H. & Soliman, Kh. A. 2007. Genetic fingerprints and phylogenetic relationships of ten Aphis species found in Egypt (Hemiptera: Aphididae). J. Biol. Chem. Environ. Sci., 2 (4): 173-188.
Shufran, K. A. 2003. Polymerase chain reaction-restriction fragment length polymorphisms identity mtDNA haplotypes of greenbug (Hemiptera: Aphididae). Journal of the Kansas Entomological Society, 76: 551-556.
Sigurdsson, V., Halldorsson, G., Sigurgeirsson, A., Thorsson, A. E. T. & Anamthawat-Jonsson, K. 1999. Genetic differentiation of the green spruce aphid (Elatobium abietinum Walker), a recent invader to Iceland. Agricultural and Forest Entomology, 1 (3): 157-163.
Sneath, P. H. A. & Sokal, R. R. 1973. Numerical taxonomy - the principles and practice of numerical classification. (W. H. Freeman: San Francisco).
Sunnucks, P., Driver, F., Brown, W. V., Carver, M., Hales, D. F. & Milne, W. M. 1997. Biological and genetic characterization of morphologically similar Therioaphis trifolii (Hemiptera: Aphididae) with different host utilization. Bulletin of Entomological Research, 87: 425-436.
Tabikha, R. M. 2008. Taxonomical studies on some aphid species by using modern techniques. Ph.D. Thesis, Fac. Agri. Alexandria University, Damanhour branch, Egypt. 193 pp.
Tabikha, R. M. 2016. Impacts of temporal and spatial climatic changes on annual generations of Rhopalosiphum maidis and R. padi (Hemiptera: Aphididae) in Egypt, using geographical information system (GIS). Journal of Entomology and Zoology Studies, 4 (1): 394-401.
Vanlerberghe, M. F. & Chavigny, P. 1998. Host based genetic differentiation in the aphid Aphis gossypii Glover, evidenced from RAPD fingerprints. Mol. Eco., 7 (7): 905-914.
Vanlerberghe, M. F., Chavigny, P. & Fuller, S. J. 1999. Characterization of microsatellite loci in the aphid species Aphis gossypii Glover. Mol. Eco., 8 (4): 693-695.
Weeks, A. R., Van Opijnen, T. & Breeuwer, J. A. 2000. AFLP fingerprinting for assessing intraspecific variation and genome mapping in mites. Exp. Appl. Acarol., 24: 775-793.
Weng, Y., Azhaguvel, P., Michels, G. J. & Rudd, J. C. 2007. Cross-species transferability of microsatellite markers from six aphid (Hemiptera: Aphididae) species and their use for evaluating biotypic diversity in two cereal aphids. Insect Mol. Biol., 16 (5): 613-622.
Wolfe, A. D. & Liston, A. 1998. Contributions of PCR-based methods to plant systematics and evolutionary biology. In: Soltis, D.E., Soltis P.S., Doyle J.J., editors. Wolfe, A.D., Xiang, Q-Y, Kephart, S.R. 1998. Assessing hybridization in natural populations of Penstemon (Scrophulariaceae) using hypervariable inter simple sequence repeat markers. Mol. Ecol., 7: 1107-1125.
Xu, Q., Liu, R. & Liu, Y. 2009. Genetic population structure of the swimming crab, Portunus trituberculatus in east China sea based on mtDNA 16S rRNA sequence. Journal of Experimental Marine Biology and Ecology, 371: 121-129.
Yang-Xiao Wen, Zhang-Xia Oxi, Cheng-Xiao Feng & Wang Ying 1999. On the RAPD-PCR analysis of DNA polymorphism of green peach aphid from different hosts. Acta Phytophylacica Sinica, 26 (2): 147-152.
Zhang, S., Yang, X. & Ma, J. 2000. A study on genetic distance among different taxa of aphids (Homoptera: Aphidoidea). Acta Ent. Sin., 7 (3): 235-242.
Zhao-huan, x., Ju-lian, C., Deng-fa, C., Young, L. & Francis, F. 2011. Genetic variation among the geographic population of grain aphid Sitobion avenae (Hemiptera: Aphididae) in China inferred from mitochondrial COI gene sequence. Agriculture Science in China, 10 (7): 1041-1048.
Zitoudi, K., Margaritopoulos, J. T., Mamuris, Z. & Tsitsipis, J. A. 2001. Genetic variation in Myzus persicae populations associated with host-plant and life cycle category., Ent. Exp. et. Appl., 99 (3): 303-311.
Zou-Chen, H., Yang-Xiao, W., Chen-Xiao, F. & Li-Ying. X. 2000. Repeat sequence Primer-PCR study on DNA polymorphism of geographic populations of cotton aphid Aphis gossypii in China. Acta Ent. Sin., 7 (4): 315-321.
Zou-Chen, H., Yang-Xiao, W., Chen-Xiao, F. & Li-Ying. X. 2001. Study on geographic population differentiation of cotton aphid, Aphis gossypii, using repeat sequence primers PCR. Entomological Knowledge, 38 (5): 348-351.

_____________Mun. Ent. Zool. Vol. 11, No. 2, June 2016__________
705
Table 1. List of localities (Governorates) names and associated geographical information for collected specimens of Rhopalosiphum padi in Egypt.
Sample No.
Locality (Governorate)
GPS Date of collection
Sample Size
Latitudes Longitudes
1 Aswan 24° 25' 14.48" N 32° 56' 07.97" E 2/3/2015 20
2 Qena 25° 43' 20.31" N 32° 37' 43.31" E 1/3/2015 8
3 Sohag 26° 33' 50.43" N 31° 43' 42.67" E 3/3/2015 15
4 Assiut 27° 08' 50.26" N 31° 17' 34.61" E 3/3/2015 22
5 Menia 28° 06' 44.21" N 30° 44' 39.94" E 4/3/2015 17
6 Beni-Suif 29° 05' 15.55" N 31° 06' 37.54" E 4/3/2015 13
7 El-Fayoum 29° 26' 19.88" N 30° 46' 19.06" E 5/3/2015 11
8 El-Giza 30° 01' 03.64" N 31° 12' 17.60" E 18/3/2015 7
9 El-Qaloubia 30° 17' 11.36" N 31° 11' 59.49" E 21/3/2015 20
10 El-Sharqya 30° 35' 43.89" N 31° 27' 46.04" E 16/3/2015 8
11 El-Monofia 30° 36' 23.18" N 31° 00' 00.55" E 21/3/2015 18
12 El-Gharbia 30° 49' 15.06" N 30° 59' 33.52" E 16/3/2015 5
13 El-Dakahlia 31° 03' 55.40" N 31° 22' 15.66" E 24/3/2015 8
14 KaferEl-Shikh 31° 07' 27.38" N 30° 57' 12.12" E 10/3/2015 7
15 El-Behera 31 °19' 42.13" N 30° 24' 16.66" E 12/3/2015 17
16 Domiata 31° 24' 01.19" N 31° 41' 59.04" E 24/3/2015 5
Table 2. Arbitrary ten-mer primers employed in the RAPD-PCR analysis.
Primer Code Nucleotide Sequence
5\ --------------------- 3\
C11
C14
OPA-03
OPA-09
OPA-11
OPA-12
AAAGCTGCGG
TGCGTGCTTG
AGTCAGCCAC
CTCACCGTCC
CAATCGCCGT
CAATCGCCGT
Table 3. ISSR primers employed in the ISSR-PCR analysis.
Primer Code Nucleotide Sequence
5\ --------------------- 3\
HB-09
HB-12
HB-13
HB-14
GTGTGTGTGTGTGG
CACCACCACGC
GAGGAGGAGGC
GTGTGTGTGTGTGC

_____________Mun. Ent. Zool. Vol. 11, No. 2, June 2016__________
706
Figure 1. Hierarchical clusters show morphological relatedness among sixteen geographical populations of R. padi, based on morphometric and numeric Morphological characters.
Figure 2. DNA fragment banding generated by four arbitrary primers [Primer C11(A), C14(B) , OPA-03(C), and OPA-09(D)] for geographical population of R. Padi collected from sixteen localities [Aswan(L1), Qena(L2), Sohag(L3), Assiut(L4), Menia(L5), Beni-Suif (L6), El-Fayoum(L7), El-Giza(L8), El-Qaloubia(L9), El-Sharqya(L10), El-Monofia(L11), El-Gharbia(L12), El-Dakahlia(L13), Kafer El-Shikh(L14), El-Behera(L15) and Domiata(L16)], in addition DNA marker(M).

_____________Mun. Ent. Zool. Vol. 11, No. 2, June 2016__________
707
Figure 3. DNA fragment banding generated by four ISSRs primers [Primer HB-09 (A), HB-12(B), HB-13 (C), and HB-14 (D)] for geographical population of R. Padi collected from sixteen localities [Aswan(L1), Qena(L2), Sohag(L3), Assiut(L4), Menia(L5), Beni-Suif (L6), El-Fayoum(L7), El-Giza(L8), El-Qaloubia(L9), El-Sharqya(L10), El-Monofia(L11), El-Gharbia(L12), El-Dakahlia(L13), Kafer El-Shikh(L14), El-Behera(L15) and Domiata(L16)], in addition DNA marker(M).
Figure 4. Dendrogram show phylogenetic relationship among the sixteen geographical population of R. padi based on RAPD-PCR analysis.
UPGMA
Jaccard's Coefficient
Aswan
Sohag
Assiut
Qena
Menia
Beni-Suif
El-Fayoum
El-Gharbia
El-Giza
El-Monofia
El-Qaloubia
Domiata
El-Sharqya
El-Dakahlia
KaferEl-Shikh
El-Behera
0.52 0.6 0.68 0.76 0.84 0.92 1

_____________Mun. Ent. Zool. Vol. 11, No. 2, June 2016__________
708
Figure 5. Dendrogram show phylogenetic relationship among the sixteen geographical population of R. padi based on ISSRs analysis.
Figure 6. Dendrogram show phylogenetic relationship among the sixteen geographical population of R. padi based on combined effect of RAPD-PCR and ISSRs analysis.
UPGMA
Jaccard's Coefficient
Aswan
Sohag
Qena
Assiut
El-Fayoum
Menia
Beni-Suif
El-Giza
El-Qaloubia
El-Dakahlia
KaferEl-Shikh
El-Behera
Domiata
El-Sharqya
El-Gharbia
El-Monofia
0.76 0.8 0.84 0.88 0.92 0.96 1
UPGMA
Jaccard's Coefficient
Aswan
Sohag
Assiut
Qena
Menia
Beni-Suif
El-Fayoum
El-Gharbia
El-Giza
El-Monofia
El-Qaloubia
El-Sharqya
El-Dakahlia
KaferEl-Shikh
El-Behera
Domiata
0.64 0.7 0.76 0.82 0.88 0.94 1