Embed Size (px)
Citation preview

Hydraulic Laboratory Report HL-2004-05
Hydraulic Performance of a Horizontal Flat-Plate Screen
U.S. Department of the Interior Bureau of Reclamation Technical Service Center Water Resources Research Laboratory Denver, Colorado February 2005

Standard Form 298 (Rev. 8/98)
REPORT DOCUMENTATION PAGE
Prescribed by ANSI Std. Z39.18
Form Approved
OMB No. 0704-0188
The public reporting burden for this collection of information is estimated to average 1 hour per response, including the time for reviewing instructions, searching existing data sources,gathering and maintaining the data needed, and completing and reviewing the collection of information. Send comments regarding this burden estimate or any other aspect of this collection ofinformation, including suggestions for reducing the burden, to Department of Defense, Washington Headquarters Services, Directorate for Information Operations and Reports (0704-0188), 1215 Jefferson Davis Highway, Suite 1204, Arlington, VA 22202-4302. Respondents should be aware that notwithstanding any other provision of law, no person shall be subject to any penalty for failing to comply with a collection of information if it does not display a currently valid OMB control number.PLEASE DO NOT RETURN YOUR FORM TO THE ABOVE ADDRESS.
1. REPORT DATE (DD-MM-YYYY) 2. REPORT TYPE 3. DATES COVERED (From - To)
4. TITLE AND SUBTITLE 5a. CONTRACT NUMBER
5b. GRANT NUMBER
5c. PROGRAM ELEMENT NUMBER
5d. PROJECT NUMBER
5e. TASK NUMBER
5f. WORK UNIT NUMBER
6. AUTHOR(S)
7. PERFORMING ORGANIZATION NAME(S) AND ADDRESS(ES) 8. PERFORMING ORGANIZATION
REPORT NUMBER
9. SPONSORING/MONITORING AGENCY NAME(S) AND ADDRESS(ES) 10. SPONSOR/MONITOR'S ACRONYM(S)
11. SPONSOR/MONITOR'S REPORT
NUMBER(S)
12. DISTRIBUTION/AVAILABILITY STATEMENT
13. SUPPLEMENTARY NOTES
14. ABSTRACT
15. SUBJECT TERMS
16. SECURITY CLASSIFICATION OF:
a. REPORT b. ABSTRACT c. THIS PAGE
17. LIMITATION OF
ABSTRACT
18. NUMBER
OF
PAGES
19a. NAME OF RESPONSIBLE PERSON
19b. TELEPHONE NUMBER (Include area code)
02-22-2005 Technical June 2000 - July 2001
Hydraulic Performance of a Horizontal Flat-Plate Screen
Frizell, Kathleen H.Mefford, Brent W.
U.S. Department of the Interior, Bureau of ReclamationWater Resources Research LaboratoryPO Box 25007Denver, CO 80225
HL-2004-05
U.S. Department of the Interior U.S. Department of the InteriorBureau of Reclamation Bureau of ReclamationPacific Northwest Division Science and Technology Research Program203 Collins Road PO Box 25007, D-9000Boise, ID 83702-4520 Denver, CO 80225
Available from:National Technical Information Service, Operations Division, 5285 Port Royal Road, Springfield, Virginia 22161http://www.ntis.gov
Prepared in cooperation with Colorado State University. The biological documentation is reported in "Bull Trout Performance During Passage Over A Horizontal Flat-plate Screen" by Beyers and Bestgen.
The Bureau of Reclamation with the assistance of the Colorado State University Larval Fish Laboratory has conducted hydraulic and biological tests of a horizontal flat-plate fish screen in the Water Resources Research Laboratory. Investigating the hydraulic characteristics of the screen will provide valuable information on how the screen operates and provide limitations on the zones of operation to ensure meeting biological needs. A laboratory-based biological assessment of the screening concept using bull trout will provide a pilot study that evaluates fish behavior and potential damage when exposed to the screen.
horizontal flat-plate fish screen, hydraulic evaluation, sweeping velocity, approach velocity, diversion structure, bull trout fish passage, debris testing
UL UL UL SAR 71
Clifford A. Pugh
303-445-2151

U.S. Department of the Interior Bureau of Reclamation Technical Service Center Water Resources Research Laboratory Denver, Colorado February 2005
Hydraulic Laboratory Report HL-2004-05
Hydraulic Performance of a Horizontal Flat-Plate Screen Kathleen H. Frizell Brent W. Mefford

Mission Statements
The mission of the Department of the Interior is to protect and provide access to our Nation's natural and cultural heritage and honor our trust responsibilities to Indian Tribes and our commitments to island communities.
___________________________ The mission of the Bureau of Reclamation is to manage, develop, and protect water and related resources in an environmentally and economically sound manner in the interest of the American public.
Acknowledgments Mr. Brian Hamilton of Reclamation’s Pacific Northwest Region requested this work. Reclamation’s Pacific Northwest Region and the Science and Technology Research Program supplied funding. The team formed by members of the National Marine Fisheries Service, Fish and Wildlife Service, and the Oregon Department of Fish and Wildlife provided invaluable guidance to the study. Dr. Kevin Bestgen and Dr. Daniel Beyers from the Colorado State University Larval Fish Laboratory cultured the bull trout from eggs to the appropriate life stage. Their expertise in handling and performing the biological studies in the Water Resources Research Laboratory (WRRL) provided validity to the biological testing. Thanks to WRRL technicians Jerry Fitzwater and Billy Baca for data collection assistance. The WRRL shop personnel expertly constructed the model and made changes to the model quickly, often with short notice. Peer review was provided by Leslie Hanna, Hydraulic Engineer, in the Water Resources Research Laboratory.
Hydraulic Laboratory Reports The Hydraulic Laboratory Report series is produced by the Bureau of Reclamation’s Water Resources Research Laboratory (Mail Code D-8560), PO Box 25007, Denver, Colorado 80225-0007. At the time of publication, this report was also made available online at http://www.usbr.gov/pmts/hydraulics_lab/pubs/HL/HL-2004-05.pdf
Disclaimer No warranty is expressed or implied regarding the usefulness or completeness of the information contained in this report. References to commercial products do not imply endorsement by the Bureau of Reclamation and may not be used for advertising or promotional purposes.

iii
Table of Contents Page
Introduction............................................................................................................1
Objective .................................................................................................................1
Conclusions.............................................................................................................2
Similitude................................................................................................................4
Physical Models of the Screen geometries tested ................................................5
Hydraulic Investigations .......................................................................................7 Operations ....................................................................................................7
Screen Sweeping Velocity Prediction Spreadsheet ........................ 8 Instrumentation ............................................................................................9 Sweeping Velocity .....................................................................................10 Diversion Weir Wall ..................................................................................11 Converging Wall Angle .............................................................................12 Debris Testing............................................................................................12 Rectangular Horizontal Flat-plate Screen Performance ............................13 Screen Performance with a Converging Side wall ....................................27 Screen Performance with a Converging Side Wall and a Drop at the Downstream End of the Screen..................................................................38
Biological Testing – Flow Description................................................................46
Future Investigations ...........................................................................................49
Implementation Plan for Horizontal Fish Screen Technology ........................49
References.............................................................................................................50
Appendix A...........................................................................................................51
Appendix B ...........................................................................................................52 Rectangular Screen Data............................................................................52 Converging Side wall with 2.54-ft-wide Bypass Opening ........................57 Converging Wall with 1-ft-wide Bypass Entrance ....................................65
Figures Figure Page
1 Schematic of the physical fish screen model with the original design and the basic layout of the 15-degree wall convergence..................6
2 Overall view of the horizontal screen model showing the flow channel designations and velocity ...............................................................7
3 ADV probe close-up and instrument setup over screen.............................10
4 Locations where velocity data were gathered for the rectangular horizontal fish screen .................................................................................14

iv
Table of Contents—continued
Figures Figure Page
5 Test 1 with the rectangular screen geometry..............................................15
6 Test 2 looking down onto the downstream end of the rectangular screen ......................................................................................16
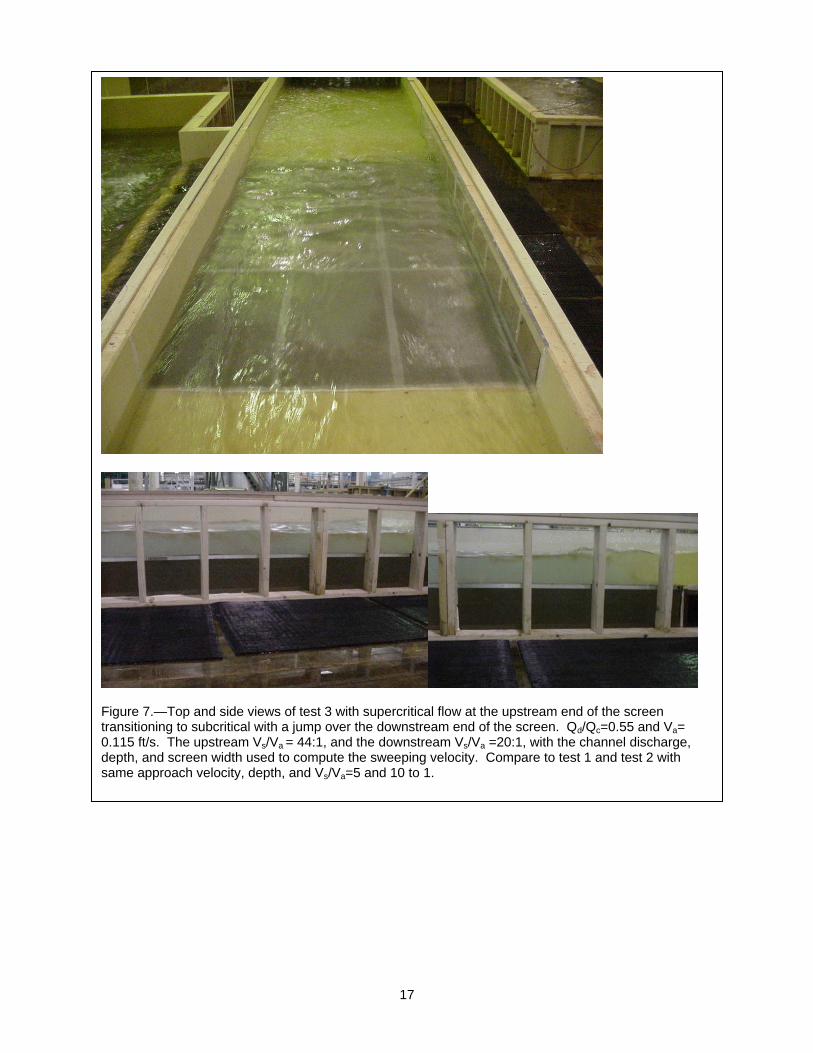
7 Top and side view of test 3 with supercritical flow at the upstream end of the screen.........................................................................17
8 Test 1. Rectangular 6-by-12 ft screen ........................................................18
9 Test 2. Rectangular 6-by-12 ft. screen .......................................................19
10 Test 3. Rectangular 6-by-12 ft screen ........................................................20
11 Test 4. Rectangular 6-by-12 ft screen ........................................................21
12 Test 5. Rectangular 6-by-12 ft screen ........................................................22
13 Test 6. Rectangular 6-by-12 ft screen ........................................................23
14 Test 6. Subcritical flow occurs across the rectangular screen with a jump downstream.................................................................24
15 Test 7. Rectangular 6-by-12 ft screen ........................................................25
16 Test 8. Rectangular 6-by-12 ft screen ........................................................26
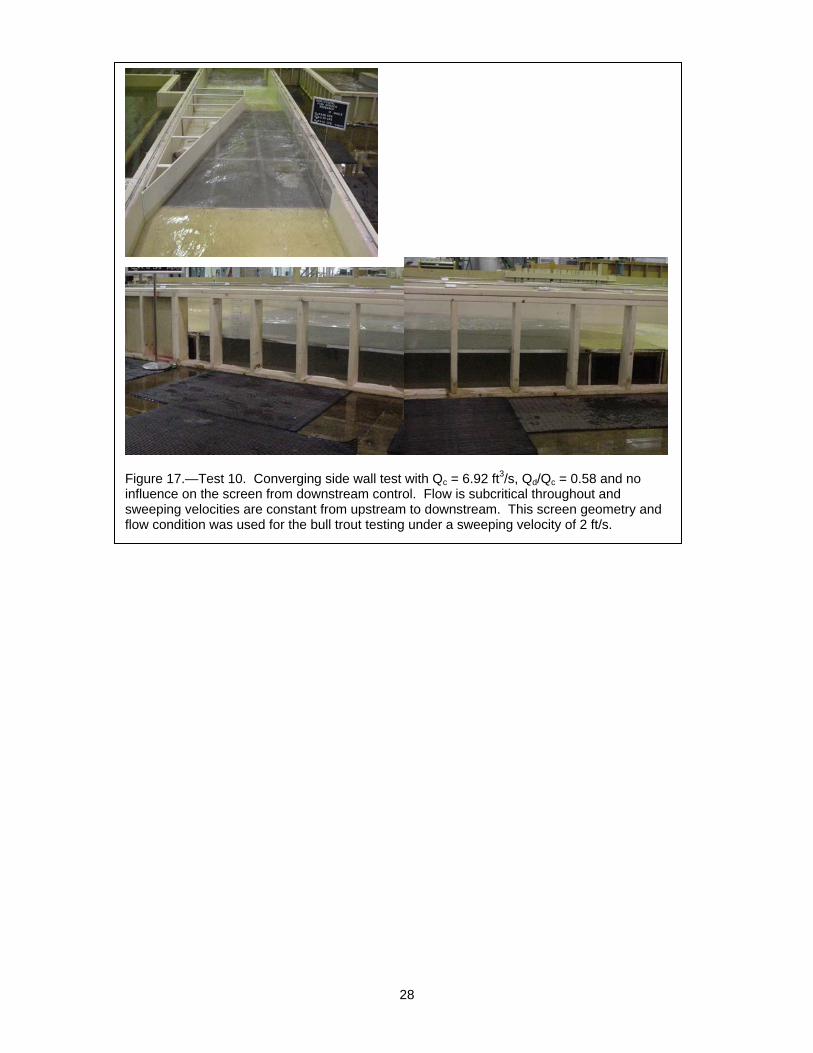
17 Test 10. Converging side wall test with Qc = 6.92 ft3/s, Qd/Qc = 0.58...............................................................................................28
18 Test 13. Test of converging side wall Qc=15 ft3/s, Qd/Qc = 66 percent .....................................................................................29
19 Locations where velocity data were gathered for the 15° converging wall..........................................................................................30
20 Test 9. Converging wall with 15° angle.....................................................31
21 Test 10. Converging channel with 15° angle .............................................32
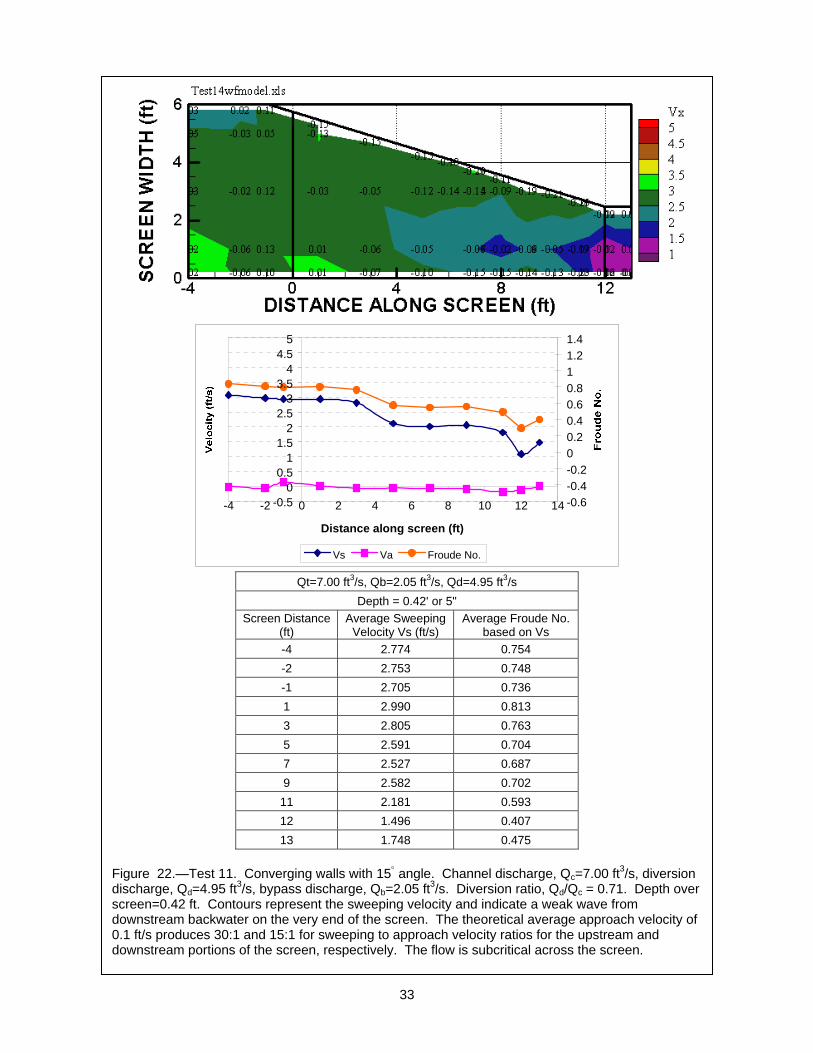
22 Test 11. Converging walls with 15° angle .................................................33
23 Test 12. Converging wall with 15° angle...................................................34
24 Test 13. Converging wall with 15° angle..................................................35
25 Test 14. Converging wall with 15° angle..................................................36
26 Test 15. Converging wall with 15-degree angle and 2.54-ft-wide bypass opening......................................................................37
27 Test 20. Critical flow at the downstream end of the screen with Qc=4.07 3/s and Qd/Qc= 67% ..................................................39
28 Test 18. Critical flow at the downstream end of the screen .....................39

v
Table of Contents—continued
Figures Figure Page
29 Test 16 with 15-degree converging side wall to 1-ft wide bypass channel ...........................................................................................41
30 Test 17 with 15-degree converging side wall to 1-ft-wide bypass.............42
31 Test 18 with 15-degree converging side wall to 1-ft-wide bypass.............43
32 Test 19 with 15-degree side wall to 1-ft-wide bypass................................44
33 Test 20 with 15-degree converging side wall to 1-ft-wide bypass.............45
34 Test 21 with 15-degree side wall with 1-ft-wide bypass............................46
35 Bull trout testing with the 15-degree converging wall over the screen......48
36 Control test setup for bull trout testing with clear plastic over the screen and 2 ft/s sweeping velocity.......................................................................48
37 Control test setup for bull trout testing with clear plastic over the screen and 4 ft/s sweeping velocity.......................................................................48
Tables Table Page
1 Flow rates tested with the rectangular screen geometry.............................13
3 Tests conducted with the 15-degree converging side wall to 2.54-ft-wide bypass with a flat, non-perforated bypass extension.............27
4 Flow rates tested over the screen with a 1-ft-wide bypass and a drop at the downstream end ....................................................................38
5 Hydraulic parameters used for the biological testing.................................48

INTRODUCTION Reclamation’s Pacific Northwest Region has a site where they have proposed using a horizontal flat-plate screen to divert water for irrigation. The site, located on the Powder River near Baker, Oregon, is in a potential bull trout habitat area. The proposed screen is considered experimental under current regulatory agency criteria for fish screen design because no method to automatically clean the screen is provided. In addition, there have been no statistically based biological studies performed on this type of screen. Initial field tests of several small screens have shown that horizontal flat-plate screens exhibit low fouling rates when operated at sweeping-to-approach-flow velocity ratios of greater than about 10:1. The low fouling attribute of the screening concept could reduce screen construction, operation and maintenance costs. Therefore, if the level of fish protection is comparable with accepted fish screening technology, the horizontal fish screen could potentially be used extensively. The Bureau of Reclamation with the assistance of the Colorado State University Larval Fish Laboratory has conducted hydraulic and biological tests of a horizontal flat-plate fish screen in the Water Resources Research Laboratory. Investigating the hydraulic characteristics of the screen will provide valuable information on how the screen operates and provide limitations on the zones of operation to ensure meeting biological needs. A laboratory-based biological assessment of the screening concept using bull trout will provide a pilot study that evaluates fish behavior and potential damage when exposed to the screen. This report presents the hydraulic assessment of the performance of the horizontal screen. The report of the biological assessment, “Bull Trout Performance in a Horizontal Flat-Plate Screen”, prepared by Drs. Dan Beyers and Kevin Bestgen from the Colorado State University Larval Fish Laboratory, is available separately [1]. OBJECTIVE The objective is to conduct laboratory hydraulic and biological testing of an experimental horizontal flat-plate fish screen. The screen will be evaluated to determine the effect of the following hydraulic parameters on screen performance:
• Approach and sweeping velocities,
• Depth over screen,
• Bypass flow control issues,
• Flow conditions including eddy zones,
• Diversion to bypass flow ranges,
• Approach channel conditions and,
• Debris.

2
The hydraulic aspects of the screen performance are discussed in this report. The biological aspects of bull trout passage over the screen are reported separately in a July 2002 report [1]. The draft hydraulic report was completed in June 2001. This final report is being published under this new report series for better distribution of the material and is dated accordingly. CONCLUSIONS The hydraulic modeling effort has resulted in a better understanding of how a horizontal flat-plate screen operates. The initial screen design had several very positive aspects that were discovered and other aspects that have been dealt with now that the screen operation is understood. A brief discussion of the final results of the screen testing is presented. The conclusions are general in nature and are given as guidance for future horizontal flat-plate screen designs.
• Uniform approach channel geometry of at least five depths in length upstream from the screen is recommended. A longer screen approach channel produces better flow conditions over the screen. A flat non-porous section upstream from the screen is ideal, as this will prevent a change in flow direction at the upstream edge of the screen.
• Depth is maintained over the screen by the use of a weir that must extend the entire length of the screen in the diversion channel. The diversion weir provides two important features. First, the weir wall ensures the screen will not dewater and maintains a minimum bypass flow. Second, the weir forces a nearly constant flow depth over the entire screen and therefore, a fairly uniform approach velocity field to the screen. Screen baffling is not required to maintain uniform approach velocity across the width and along the length of the screen.
• A flat non-perforated section with a length of at least two flow depths is recommended downstream from the screen section to alleviate possible non-uniformity in the approach flow near the end of the screen.
• Sweeping velocity will gradually decrease downstream along the length of the screen for all flows except those near the design flow.
• Depth will be constant over the screen when operating under the design condition, with the exception of surface waves across the width and length of the screen.
• Any approach velocity may be designed for and will be reasonably well maintained across and down the length of the screen with appropriate approach and bypass channel geometry.
• Head loss through the screen is minimal as expected with small screen approach velocities.

3
• Sweeping and approach velocities are generally consistent across the width of the screen section whether rectangular or with a converging side wall.
• As the depth increases over the screen the sweeping velocity decreases.
• Recirculation, ponded water, or the presence of a hydraulic jump over the screen increases the screen approach velocity and should be avoided during operation.
• Rectangular screen geometry is only appropriate for smaller diversion to channel flow ratios of about 25 percent or less.
• Debris handling issues were only briefly investigated with the following observations:
o Higher sweeping velocities produce better debris handling performance.
o Debris or gravel the size of the screen perforations is likely to become lodged in the screen.
o Gravel smaller than the screen perforations will pass through the screen or remain suspended in the bypass flow and travel downstream. Gravel larger than the screen perforations will travel over the screen and out through the bypass.
o Vegetation and algae were not fully tested in the laboratory, but initial tests revealed a tendency for waterlogged vegetation to stick to the screen and other types to pass downstream.
o A sediment trap located upstream from the screen would be a wise design feature.
o Dislodging gravel wedged in the screen perforations will be difficult.
o Cleaning the area beneath the screen will be a difficult maintenance issue.
• Better overall screen performance exists with operation in the supercritical flow range.
• A change in flow condition over the screen, i.e. from supercritical to subcritical flow, is unacceptable.
• Downstream control of the bypass flow is not recommended, as it will likely produce an undesirable flow condition on the downstream end of the screen.
• A drop below the elevation of the screen structure is recommended, if possible, at a field installation. A solid or non-perforated section should be placed at the downstream end of the

4
screen before entering the drop to prevent excessive approach velocities or reverse flow at the bypass opening when operating with a drop at the end of the screen. The screen bypass discharge and bypass width will control the critical flow depth and control the sweeping velocity at the end of the screen. A drop below the elevation of the screen will generally produce increasing sweeping velocity into the bypass.
• NMFS screen exposure time criteria of 60 seconds would allow a very long screen with a reasonable sweeping velocity of 1 to 3 ft/s. Screen exposure time may be less critical depending upon the findings of the bull trout testing.
• For a given channel discharge and bypass flow, sweeping velocity and depth may be attained several ways. If larger flow depths are desired then a narrower channel is needed. However, larger flow depths decrease sweeping velocities and increase approach velocities. The best compromise that will attain both the highest sweeping velocity and most depth would be to optimize the screen geometry to produce a high length to width ratio.
A simple spreadsheet was developed in Microsoft Excel to help narrow down the range of operation in the model. This spreadsheet will allow a designer to hone in on a screen geometry option prior to making the final design computations using a backwater computation or software program. These observations of the hydraulic performance of the screen should be interpreted with the results of the bull trout testing program. Studying both aspects of the screen performance will, hopefully, determine if a horizontal flat-plate screen is a viable alternative for water diversions where ESA listed species are located. SIMILITUDE The model testing was performed using Froude similitude where the geometric and kinematic parameters for a 1:3 scale are as follows: Lr = Lp/Lm = 3 Ar = (Lr)2 = 9 Vr = (Lr)1/2 = 1.732 Qr = (Lr)5/2 = 15.59 Where: Lp = prototype characteristic length Lm = model characteristic length Lr = length ratio Ar = area ratio Vr = velocity ratio Qr = discharge ratio

5
The screen hole-size in the model is the same as the screen hole-size in the prototype with 3/32 in diameter holes and a 37 percent open area on the perforated plate. The Reynolds number was high enough in the model to eliminate scale effects; therefore, the model and prototype screen openings can be the same [2]. Various Froude model scales were used for the hydraulic testing. By using different model scales a larger range of flow conditions could be tested. Model results may be scaled to the prototype by using the above ratios or other ratios as needed to produce the desired prototype range of flows, velocities, or depths. The biological investigations were performed as if the model were full field scale. The model was assumed to be of an actual prototype or field size for the biological testing. As a result, no scaling of discharge, velocities or depths is needed to interpret the biological results. PHYSICAL MODELS OF THE SCREEN GEOMETRIES TESTED A model of a water diversion containing a horizontal flat-plate screen was constructed in the Water Resources Research Laboratory (WRRL) in Denver, Colorado, figure 1. The model has a 6 ft wide rectangular channel approximately 40 ft long. A 10:1 (H:V) ramp slopes up to a 4-ft-long non-porous flat section, then to the screen about midway down the channel. The 6-ft-wide by 12-ft-long screen is supported 1 ft above the channel floor. The screen is composed of nine, 2-ft-wide by 4-ft-long punch plate screen panels supported on a metal frame. The screen has 3/32 in diameter holes on 3/16 in stagger. Flow passes from beneath the screen through a 12 ft long by 1 ft high rectangular opening in one side wall to the diversion channel. A 1-ft-high weir was placed across the diversion channel to ensure the screen cannot totally dewater channel flow. Slats were used in the downstream diversion channel to control diversion flow and depth over the weir. The downstream bypass channel consisted of a 2-ft-flat section immediately downstream of the screen leading to a 10:1 ramp down to the floor of the box. A flap gate was located downstream in the bypass channel to provide backwater or a control point, as needed.

6
Flow was supplied to the model either using the permanent laboratory Venturi measurement system or a portable pump with an acoustic strap-on pipe flow meter for measurement. The bypass flow was measured using a contracted rectangular sharp-crested weir mounted in a box at the end of the bypass channel. The head on the weir was measured using a pressure cell in a stilling well and converted to flow using a continuous flow meter that updated and constantly displayed the flow rate. This allowed accurate setting of the flow volumes between the diversion and bypass flows. A large compressor and heat exchanger was installed in the WRRL water storage channel to cool the water temperature to an acceptable range for the bull trout testing. Initial model testing was conducted with a rectangular screen. The next tests were conducted with a converging wall on the left side. A portion of the screen was omitted and covered with a 15-degree sloping wall that began about 1 ft upstream from the screen, converged through the screen area, and continued straight through the flat section downstream from the screen producing a 2.54-ft-wide bypass opening. After completing testing on this geometry, the flat section in the
Figure 1.—Schematic of the physical fish screen model with the original design and the basic layout of the 15-degree wall convergence.

7
bypass channel was extended an additional 2 ft to make the bypass section 4 ft long before entering the downstream ramp. Final testing was conducted with the model modified to produce a 1 ft wide bypass with a 15-degree wall producing a 4.22-ft-wide upstream channel width. The upstream channel width of 4.22 ft extended upstream to the beginning of the ramp to provide good approach conditions. The downstream flat section was removed to produce a drop at the downstream end of the screen. The gate in the downstream bypass channel was still available to provide control as necessary. HYDRAULIC INVESTIGATIONS
Hydraulic investigations of the flow field near the screen were conducted for three screen and channel geometries. First, a rectangular screen with a constant width channel and a full width downstream bypass channel was tested. Second, a triangular screen with a converging wall from the same upstream width leading to a narrowed downstream bypass channel was tested. The third configuration consisted of a converging side wall from a narrower upstream channel leading to a 1 ft wide bypass channel. This configuration was tested using a Froude scale of 2:1 to provide a comparison to existing vertical screen and bypass technology. The model was operated over a range of diversion flow to channel flow ratios and flow depths. Tests were also conducted with and without downstream control in the bypass channel. For each flow tested three-dimensional point velocity measurements were measured three inches above the screen. These data were used to evaluate flow field uniformity, screen approach velocity, and screen sweeping velocity. Debris testing was also conducted to determine the self-cleaning characteristics of the screen. Testing covered sweeping to approach flow velocity ratios from 5:1 to about 30:1. The flow range tested included sweeping velocities in both the subcritical and supercritical range. Operations The channel discharge, Qc, approaches the screen with a 10:1 ramp and a 4-ft-long flat section leading up to the screen. The screen is mounted on a rack 1 ft off the floor of the model with the downstream end underneath closed off and the left side of the underneath area open for the diversion flow, Qd. The bypass flow, Qb, continues on over the screen and out to a laboratory return channel. These flow areas are shown on figure 2. Control of the diversion and bypass flows, for a given incoming channel flow, determines the flow ratios. A weir is set in the diversion channel along the entire length of the screen preventing the screen from dewatering either during operation or during shutdown of diversion operations. There are innumerable ways to operate the screen based upon the importance of various parameters to the operator, owner, or agency. However, the range of acceptable operation of the screen is quite limited for a given diversion flow. The weir wall on the diversion must be set to keep the desired minimum water surface over the screen for the design diversion flow. The velocity of approach and the
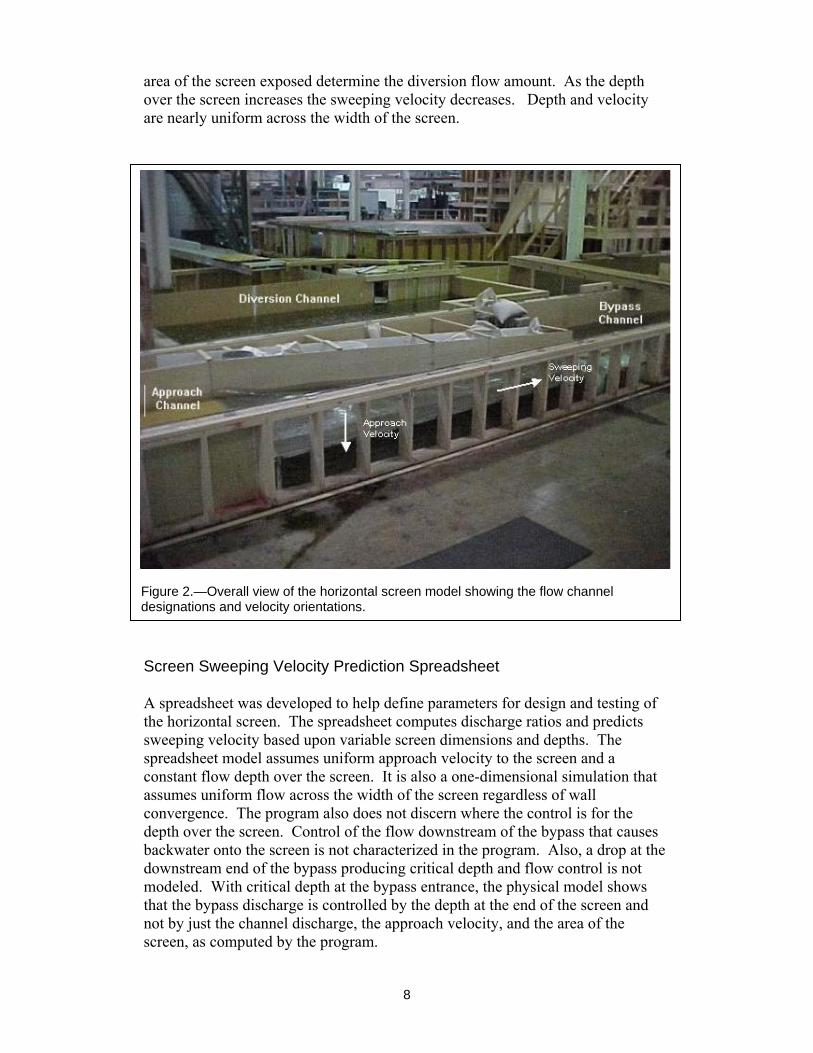
8
area of the screen exposed determine the diversion flow amount. As the depth over the screen increases the sweeping velocity decreases. Depth and velocity are nearly uniform across the width of the screen.
Screen Sweeping Velocity Prediction Spreadsheet A spreadsheet was developed to help define parameters for design and testing of the horizontal screen. The spreadsheet computes discharge ratios and predicts sweeping velocity based upon variable screen dimensions and depths. The spreadsheet model assumes uniform approach velocity to the screen and a constant flow depth over the screen. It is also a one-dimensional simulation that assumes uniform flow across the width of the screen regardless of wall convergence. The program also does not discern where the control is for the depth over the screen. Control of the flow downstream of the bypass that causes backwater onto the screen is not characterized in the program. Also, a drop at the downstream end of the bypass producing critical depth and flow control is not modeled. With critical depth at the bypass entrance, the physical model shows that the bypass discharge is controlled by the depth at the end of the screen and not by just the channel discharge, the approach velocity, and the area of the screen, as computed by the program.
Figure 2.—Overall view of the horizontal screen model showing the flow channel designations and velocity orientations.

9
Originally, the program was developed for subcritical flow conditions. As testing continued, it became apparent that higher sweeping velocities were desirable. Therefore, the supercritical flow range was included in the acceptable range of flow. Several conditions were determined to limit the range of operation for the screen. A minimum sweeping velocity, and a maximum change in sweeping velocity per ft of screen may be entered. A change in flow regime, i.e. from supercritical to subcritical, and violation of parameters entered is checked by the spreadsheet. When any of these conditions are violated, the screen would be operating in an unacceptable range. The U.S. Geological Service Conte Anadromous Fish Laboratory has performed tests with accelerating flow over weirs that states that a velocity change of 1 ft/s per ft of distance will cause avoidance [3]. Agencies have expressed an interest in keeping the sweeping velocity as high as possible from a debris and fish passage point of view. The minimum acceptable sweeping velocity and percent acceleration or deceleration per foot of screen may be changed as necessary. Irrigators will know the channel discharge or river discharge and how much water they would like diverted. Therefore, the spreadsheet evolved into entering the channel and diversion discharges, the flow depth and screen geometry and letting the spreadsheet compute the sweeping velocity, velocity of approach, and acceptable range of operation. The pivot table in the spreadsheet shows the acceptable ranges of operation for the geometry and hydraulic parameters entered. The desired design flow ratio or velocities may not be obtainable with the specified geometry. The geometry should then be modified until acceptable flow conditions occur. The desired and generally fairly small range of diversion to channel flow ratio is shaded for a range of approach velocities. In addition to using the spreadsheet, with caution, to narrow down the acceptable screen geometry, a backwater computation must be performed using a program such as HEC-RAS. This will ensure that the downstream influence is appropriately accounted for in the design. The spreadsheet is given in Appendix A with the equations shown in the cells should a designer wish to replicate the computations. Instrumentation A SonTek 19 MHz Micro Acoustic Doppler Velocimeter (ADV) was used to gather three-dimensional velocity data over the horizontal screen. The probe has 3 “arms” that receive the signal from the control volume located about 5 cm from the transmitter. The control volume is only 0.09 cm. The ADV measures all three velocity components simultaneously, providing a complete description of the flow field. Figure 3 shows the ADV mounted on a carriage with a motorized screw mechanism allowing travel up and down. The mount could also be moved

10
along the carriage to traverse both the length and width of the approach channel and the entire screen area. Data were gathered at a rate of 10 Hz with 600 samples gathered at each data location and stored onto a PC. The data were input into the WinAdv software program that allowed filtering and reduction of the data and exporting into a format acceptable for spreadsheet use. Initially, seeding was necessary to overcome the acoustic reflection off the screen surface. Eventually, the screen surface was sprayed with a very thin rubbery substance (Sure Grip) that minimized the reflection from the screen and increased the data quality without seeding.
Data were collected 3 inches above the screen to correspond to the standard measurement distance in the prototype. Velocity measurements were obtained at grid points that were established for the screen geometry tested. Flow depths were also gathered from a point gage mounted on the traversing system. Sweeping Velocity Investigation of the sweeping velocity provided very interesting results. Once the screen operation was determined, it was realized that sweeping velocity would typically decrease as a function of screen length. This occurs because with a constant inflow and depth, the volume of flow, thus velocity, passing over the screen decreases as the diversion flow leaves through the screen. The sweeping
Probe close-up
Figure 3.—ADV probe close-up and instrument setup over screen.

11
velocity can be maintained by constructing a converging side wall, but for fairly limited operating range. Because setting the hydraulic model was quite tedious, the previously mentioned spreadsheet program that defines sweeping velocity conditions for any geometry was utilized and aided in defining the model test range. Continuity of flow dictates that the sweeping velocity will decrease if the flow decreases and the depth remain constant for a given area [4]. This is seen by the equation: Q=VA where the area, A, is the width times the depth. Therefore, a converging wall will help to maintain sweeping velocity by decreasing the area at a rate that will offset the flow loss. Balancing the area with the flow withdrawn is the key to maintaining sweeping velocity. It seems reasonable to define the bypass channel as the channel at the downstream end of the screen where the flow passing over the screen exits back to the river. Using this definition, unless there is a recirculation zone or eddy over the downstream end of the screen, it would usually be possible to maintain or have velocities increase into the bypass channel at the end of the screen to provide attraction flow for downstream migrants. Diversion Weir Wall Operation of the screen model soon showed the importance of the diversion weir wall. The diversion weir wall was set at the elevation of the screen with capability to adjust the level. Baffles were initially included in the model, but the effectiveness of the weir wall in controlling the depth and providing uniform approach velocities soon made it clear that the baffles were not needed. The elevation of the diversion wall will set the minimum depth on the screen for any given diversion flow. A downstream diversion gate may then be used to further increase depth over the diversion weir wall and the screen, if deemed necessary. The flow depth affects the sweeping velocity and higher flow depths for the same diversion rate produce lower sweeping velocities. The elevation of the diversion wall will prevent the screen from dewatering until the channel flow is stopped. Depths were measured over the screen and in the basin formed by the weir wall leading to the diversion channel. There is very little head loss through the screen and through the opening to the weir wall. The head loss is a function of the approach velocity and since this is very small there is only a very slight difference in depth between that over the weir wall and over the screen. The diversion weir wall is a valuable asset to the horizontal screen design, providing uniform depth and approach velocities over the screen and aiding in the prevention of surface irregularities. This may be seen in the screen approach velocity data shown later for each screen geometry tested.

12
Converging Wall Angle The side wall angle improves the design of the horizontal screen by reducing the screen area as the channel flow is diverted, thus maintaining the sweeping velocity. The angle of the side wall; however, can produce some undesirable effects to water surface over the screen. Any angle will produce some buildup of flow depth along the wall that could lead to increased approach velocities. Given a severe enough angle this could be a problem. Also, cross-waves will form caused by the contraction. The height of the waves and the pattern is dependant upon the wall angle, Froude number, and depth [4]. The contraction or side wall angle may be designed to minimize flow disturbances. With this in mind, the maximum convergence angle should probably be 15 degrees. With high sweeping velocities, this angle should probably be minimized. The possible perturbations from the converging side wall will be minimized with a longer screen and smaller convergence angle. Debris Testing Debris is a big concern with the horizontal screen because in this experimental stage there is no plan to use a mechanical cleaning device. Eliminating the cleaning device makes the screen economical and more likely to be used, but riskier from a biological standpoint. Published vertical screen criteria require a minimum sweeping velocity of two times the approach velocity. Higher sweeping velocities are expected to produce optimal cleaning characteristics. Debris can be leaves, sand, fine sediment, evergreen needles, gravel, algae or trash. Rigorous debris testing was not performed in this study. Various types of plants, and sand or gravel, were introduced upstream from both the rectangular and converging screen geometries and observed while traveling over the screen. Amounts passing through or bypassing the screen were not measured, but these tests did provide general information about the self-cleaning capability of the screen. Good self-cleaning characteristics were observed for various flow rates when the sand or gravel size exceeded or was smaller than the screen opening size. Particles larger than the screen hole-size would continue over the screen and into the bypass. Particles smaller than the screen hole-size would pass through the holes or remain suspended and be carried downstream. If smaller particles pass through the screen, a maintenance issue could develop if large amounts accumulate under the screen. To investigate a predicted worse case, a test was performed with the majority of the test material graded to be about the size of the 3/32 or 0.0.0938 in screen openings. The material used was graded between a #8 and #4 sieve, or larger than very fine gravel (0.0925 in) and smaller than fine gravel (0.1811 in). The material was trickled into the channel on the flat section upstream from the screen geometry with a 15 degree wall convergence and a channel flow rate of 9.0 ft3/s, Qd/Qc = 0.82 and subcritical flow conditions over the screen. A sweeping velocity, Vs = 2.7 ft/s, at the upstream end and about 1 ft/s at the downstream end

13
of the screen produced ratios of sweeping to approach velocity ratios of 18:1 and 6:1 at the upstream and downstream portions of the screen, respectively. The approach velocity averaged about 0.15 ft/s over the screen with a depth of 7 in. In addition, the bypass flow was being controlled by the weir gate downstream from the screen that caused a recirculation back up onto the end of the screen and a potentially poor flow condition for self-cleaning, figure 23. The fine gravel material wedged in the openings of the screen at the upstream end of the screen area and at the downstream end due to the backwater present on the screen. Particles lodged into the screen openings were difficult to remove. Sand and debris will clearly be less of an issue with the highest possible sweeping velocities over the screen. Rectangular Horizontal Flat-plate Screen Performance The initial hydraulic investigations were conducted with the full 6- by 12-ft rectangular screen. Data were gathered at the centerline of each of the three 2-ft by 4-ft screen sections throughout the length of the 12-ft-long screen section, figure 4. In the final tests, data were also gathered near the walls and further upstream and downstream from the screen to investigate flow conditions approaching and leaving the screen. Depth data were also gathered with a point gage along the length of the screen. Depth measurements were taken in the basin created by the weir wall to look at head loss through the screen to the diversion channel. The flow rates and diversion to channel flow ratios tested over the rectangular screen are shown in table 1.
Data are plotted on contour maps with the sweeping velocity forming the contours. The edges of the contours are the most outside locations where data were taken. The labels at the nodes show the approach velocity at that point, with negative values indicating flow into the screen. The accompanying tables show the actual distance along the screen that measurements were taken. At each
Table 1.—Flow rates tested with the rectangular screen geometry
Test Channel
Discharge, Qc (ft3/s)
Diversion Discharge,
Qd (ft3/s)
Bypass Discharge,
Qb (ft3/s)
Qd/Qc (percent)
Theoretical Approach Velocity
(ft/s)
Depth (ft)
1 10.04 8.30 1.74 83 0.115 0.5 2 11.76 8.25 3.51 70 0.115 0.5 3 15.25 8.35 6.90 55 0.116 0.5 4 10.01 5.78 4.23 58 0.115 0.67 5 10.00 3.92 6.08 40 0.054 0.5 6 10.01 2.08 7.93 21 0.03 0.583 7 17.36 14.29 3.07 82 0.2 0.5 8 20.4 14.35 6.05 70 0.2 0.67

14
DATA LOCATIONSTests 1, 2, 4, 5, & 6
0
2
4
6
-8 -4 0 4 8 12 16DISTANCE ALONG SCREEN (ft)
SCR
EEN
WID
TH (f
t)
DATA LOCATIONSTests 3, 7, & 8
0
2
4
6
-8 -4 0 4 8 12 16DISTANCE ALONG SCREEN (ft)
SCR
EEN
WID
TH (f
t)
Figure 4.—Locations where velocity data were gathered for the rectangular horizontal fish screen. The 6 by 12 ft screen area is highlighted with the screen beginning at 0 ft. Data were gathered primarily along screen panel centerlines. For tests 3, 7, and 8, data were also gathered upstream from the screen and along the walls.
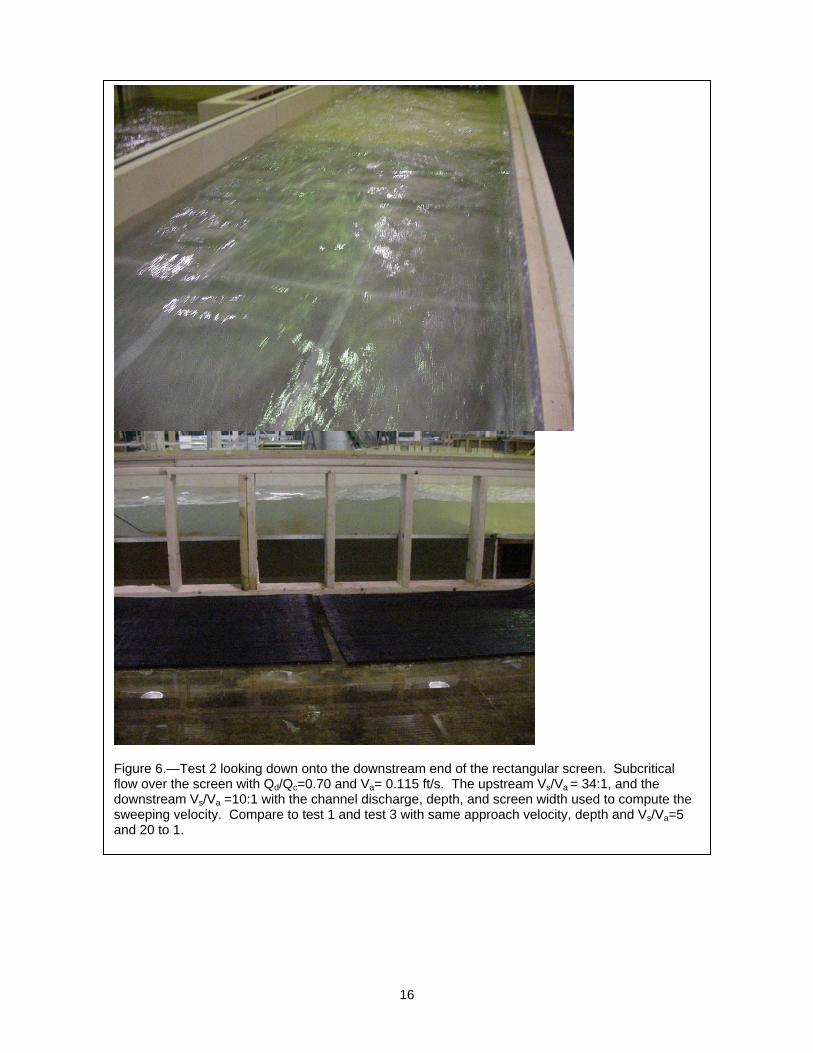
section, the sweeping velocities in the tables are averaged across the width and a Froude number computed to show the flow conditions that the screen is experiencing. Raw velocity data are shown in the appendix for test series 1-8. Traditional screen flow conditions were initially investigated by operating the screen under specific sweeping to approach velocity ratios of 5, 10 and 20:1. The sweeping velocity ratios were computed at the downstream end of the screen using the bypass discharge, the screen width of 6 ft, and the depth over the screen. These flow conditions were tests 1, 2 and 3 with channel flows of 10, 11.76, and 15.25 ft3/s with Qd/Qc=0.83, 0.70, and 0.55, respectively. The diversion flow, approach velocity, and depth were kept the same at 8.25 ft3/s and 0.115 ft/s, and 0.5 ft, respectively. In all three cases, backwater was present on the downstream end of the screen under these flow divisions, figures 5, 6, and 7.

15
The first series shows a plan and side view of Test 1 with Qd/Qc = 0.83 and downstream control of the bypass flow, figure 5. Under this operating condition, recirculating eddies form over the downstream end of the screen caused pooled flow and an increase in the approach velocity above 0.2 ft/s. Figure 8 gives the velocity and Froude number data for this flow condition. The flow is subcritical throughout but would not be an acceptable operating condition with the eddy over the downstream end of the screen. Tests 2 and 3 are similar with the flow condition changing from subcritical to supercritical in test 3. These tests showed higher sweeping velocities for increasing channel discharge and decreasing diversion ratios for the same diversion discharge and depth, figures 8, 9, and 10. The screen area is too large for high diversion ratios, and the sweeping velocities decreased down the length of the screen.
Wave front
Figure 5.—Test 1 with the rectangular screen geometry, Qc = 10 ft3/s, and Qd/Qc = 0.83 and downstream control of the bypass. The flow over the screen is subcritical and downstream control is causing a recirculation pattern over the downstream portion of the screen. The wavy, higher water surface indicates the location of the recirculation. The velocity of approach increases above 0.2 ft/s in this area because of the ponded flow. This would be an unacceptable flow condition.
16
Figure 6.—Test 2 looking down onto the downstream end of the rectangular screen. Subcritical flow over the screen with Qd/Qc=0.70 and Va= 0.115 ft/s. The upstream Vs/Va = 34:1, and the downstream Vs/Va =10:1 with the channel discharge, depth, and screen width used to compute the sweeping velocity. Compare to test 1 and test 3 with same approach velocity, depth and Vs/Va=5 and 20 to 1.
17
Figure 7.—Top and side views of test 3 with supercritical flow at the upstream end of the screen transitioning to subcritical with a jump over the downstream end of the screen. Qd/Qc=0.55 and Va= 0.115 ft/s. The upstream Vs/Va = 44:1, and the downstream Vs/Va =20:1, with the channel discharge, depth, and screen width used to compute the sweeping velocity. Compare to test 1 and test 2 with same approach velocity, depth, and Vs/Va=5 and 10 to 1.

18
Qc=10.04 ft3/s, Qb=1.74 ft3/s, Qd=8.30 ft3/s Depth = 0.5' or 6"
Screen Distance(ft)
Average SweepingVelocity Vs (ft/s)
Average Froude No. based on Vs
-0.4271 3.30 0.830 0.0729 3.113 0.776 0.5729 3.102 0.773 3.5729 2.569 0.640 6.5729 2.001 0.499 9.5729 1.241 0.393 11.0729 0.846 0.428
Figure 8.—Test 1. Rectangular 6-by-12 ft screen. Channel discharge, Qc=10.04 ft3/s, diversion discharge, Qd=8.30 ft3/s, bypass discharge, Qb=1.74 ft3/s. Diversion ratio, Qd/Qc = 0.83. Depth over screen=0.5 ft. Contours represent the sweeping velocity and indicate a wave front with some recirculating flow over the downstream right corner of the screen. Labels are the screen approach velocity values which increase under the influence of the pooled water over the screen. The theoretical average approach velocity of 0.115 ft/s produces 27:1 and 7:1 for sweeping to approach velocity ratios for the upstream and downstream portions of the screen, respectively. This screen flow condition is operating under the subcritical flow regime.

19
Qc=11.76 ft3/s, Qb=3.51 ft3/s, Qd=8.25 ft3/s Depth = 0.5' or 6"
Screen Distance (ft)
Average Sweeping Velocity Vs (ft/s)
Average Froude No. based on Vs
-0.4271 3.774 0.940 0.0729 3.629 0.904 0.5729 3.536 0.881 3.5729 2.895 0.721 6.5729 2.421 0.603 9.5729 2.272 0.566 11.0729 1.149 0.357
Figure 9.—Test 2. Rectangular 6-by-12 ft screen. Channel discharge, Qc=11.76 ft3/s, diversion discharge, Qd=8.25 ft3/s, bypass discharge, Qb=3.51 ft3/s. Diversion ratio, Qd/Qc = 0.7. Depth over screen=0.5 ft. Contours represent the sweeping velocity and indicate a wave front with some re-circulating flow over the downstream right corner of the screen. The screen approach velocity values increase under the influence of the pooled water over the screen. The theoretical average approach velocity of 0.115 ft/s produces 33:1 and 10:1 for sweeping to approach velocity ratios for the upstream and downstream portions of the screen, respectively. This screen flow condition is operating under the subcritical flow regime.

20
The next series tested the same channel discharge with varying diversion flows, thus attempting to define the practical range of flow conditions possible with rectangular screen geometry while keeping one variable constant. The next tests, 4, 5, and 6, were conducted with Qd/Qc =0.58 and 0.4 and 0.21, respectively, with the channel discharge constant and the diversion flow decreasing. The sweeping velocity contours are shown on figures 11, 12, and 13. Figure 14 shows a plan and side view of the rectangular screen for test 6 operating under Qd/Qc = 0.21. The diversion flow is only a small portion of the channel flow. The flow is subcritical across the screen and a jump occurs downstream
Qc=15.25 ft3/s, Qb=6.90 ft3/s, Qd=8.35 ft3/s Depth = 0.5' or 6"
Screen Distance(ft)
Average SweepingVelocity Vs (ft/s)
Average Froude No. based on Vs
-0.4271 4.667 1.163 0.0729 4.767 1.188 0.5729 4.847 1.208 3.5729 4.211 1.050 6.5729 3.795 0.946 9.5729 3.293 0.821 11.0729 1.283 0.473
Figure 10.—Test 3. Rectangular 6-by-12 ft screen. Channel discharge, Qc=15.25 ft3/s, diversion discharge, Qd=8.35 ft3/s, bypass discharge, Qb=6.90 ft3/s. Diversion ratio, Qd/Qc = 0.55. Depth over screen=0.5 ft. Contours represent the sweeping velocity and indicate a hydraulic jump over the downstream end of the screen. The screen approach velocity values increase under the influence of the higher water surface and slower velocities associated with the jump. The theoretical average approach velocity of 0.116 ft/s produces 40:1 and 11:1 for sweeping to approach velocity ratios for the upstream and downstream portions of the screen, respectively. The flow was supercritical on the upstream portion of the screen and subcritical downstream of the jump.

21
Qc=10.01 ft3/s, Qb=4.23 ft3/s, Qd=5.78 ft3/s Depth = 0.667' or 8"
Screen Distance(ft)
Average SweepingVelocity Vs (ft/s)
Average Froude No. based on Vs
-0.4271 2.092 0.451 0.0729 1.914 0.413 0.5729 1.497 0.323 3.5729 1.308 0.282 6.5729 1.265 0.273 9.5729 1.185 0.256 11.0729 0.977 0.211
Figure 11.—Test 4. Rectangular 6-by-12 ft screen. Channel discharge, Qc=10.01 ft3/s, diversion discharge, Qd=5.78 ft3/s, bypass discharge, Qb=4.23 ft3/s. Diversion ratio, Qd/Qc = 0.58. Depth over screen=0.67 ft. Contours represent the sweeping velocity and indicate a wave front with some re-circulating flow over the downstream right corner of the screen. The screen approach velocity values increase under the influence of the pooled water over the screen. The theoretical average approach velocity of 0.115 ft/s produces 33:1 and 10:1 for sweeping to approach velocity ratios for the upstream and downstream portions of the screen, respectively. This screen flow condition is operating under the subcritical flow regime.
from the screen. The diversion flow is returning back up through the downstream portion of the screen as shown on figure 13 with a positive approach flow at the downstream end of the screen. Flow comes back up through the screen to provide a mass balance of the flow. This flow condition may not necessarily be a poor flow condition as there is no recirculation on the screen. This test series indicated that smaller diversion ratios are better suited for rectangular screens.

22
Qc=10.0 ft3/s, Qb=6.08 ft3/s, Qd=3.92 ft3/s Depth = 0.5' or 6"
Screen Distance (ft)
Average SweepingVelocity Vs (ft/s)
Average Froude No. based on Vs
-0.4271 3.094 0.771 0.0729 2.995 0.746 0.5729 2.940 0.733 3.5729 2.318 0.578 6.5729 1.895 0.472 9.5729 1.830 0.456 11.0729 1.422 0.354
Figure 12.—Test 5. Rectangular 6-by-12 ft screen. Channel discharge, Qc=10.0 ft3/s, diversion discharge, Qd=3.92 ft3/s, bypass discharge, Qb=6.08 ft3/s. Diversion ratio, Qd/Qc = 0.4. Depth over screen=0.5 ft. Contours represent the sweeping velocity and indicate a weak wave front over the downstream end of the screen. The theoretical average approach velocity of 0.054 ft/s produces 57:1 and 26:1 for sweeping to approach velocity ratios for the upstream and downstream portions of the screen, respectively. This flow condition operated entirely under the subcritical flow regime.

23
Qc=10.01 ft3/s, Qb=7.93 ft3/s, Qd=2.08 ft3/s Depth = 0.583' or 7"
Screen Distance(ft)
Average SweepingVelocity Vs (ft/s)
Average Froude No. based on Vs
-0.4271 2.882 0.665 0.0729 2.822 0.651 0.5729 2.760 0.637 3.5729 2.240 0.517 6.5729 1.904 0.439 9.5729 1.616 0.373 11.0729 1.824 0.421
Figure 13.—Test 6. Rectangular 6-by-12 ft screen. Channel discharge, Qc=10.01 ft3/s, diversion discharge, Qd=2.08 ft3/s, bypass discharge, Qb=7.93 ft3/s. Diversion ratio, Qd/Qc = 0.21. Depth over screen=0.583 ft. Contours represent the sweeping velocity and indicate no downstream interference over the screen. The approach velocity still increases right at the end of the screen. The theoretical average approach velocity of 0.03 ft/s produces 96:1 and 60:1 for sweeping to approach velocity ratios for the upstream and downstream portions of the screen, respectively. This flow condition operated under the subcritical flow regime.

24
Additional data were recorded as tests 7 and 8 and are shown on figures 15 and 16. Both of these tests had high Qd/Qc ratios with the flow unacceptably transitioning from supercritical to subcritical over the screen. Sweeping velocity is difficult to maintain on a rectangular screen because the continual loss of diversion flow over a constant area reduces the flow, thus velocity as the flow travels over the length of the screen. The depth is essentially constant over the screen except near the end depending upon whether there is control downstream or a transition on the screen or critical flow at the end of the screen. This arrangement might be used when the diversion flow rate is small compared to the channel flow rate.
Figure 14.—Test 6. Subcritical flow occurs across the rectangular screen with a jump downstream of the screen forced by tailwater control. Qc = 10 ft3/s, and Qd/Qc = 0.21. The bypass flow is much greater than the diversion flow and flow is coming back up through the screen at the downstream end as indicated by positive Va values and producing unacceptable flow conditions.

25
-0.08
-0.11
-0.12
-0.08
-0.19
-0.14
-0.16
-0.25
-0.20
-0.12
-0.12
-0.14
-0.22
-0.24
-0.15
-0.20
-0.17
-0.14
-0.26
-0.28
-0.33
-0.20
-0.11
-0.18
-0.20
-0.45
-0.40
-0.46
-0.37
-0.46
-0.15
-0.16
-0.28
-0.65
-0.88
-0.08
-0.11
-0.12
-0.08
-0.19
-0.14
-0.16
-0.25
-0.20
-0.12
-0.12
-0.14
-0.22
-0.24
-0.15
-0.20
-0.17
-0.14
-0.26
-0.28
-0.33
-0.20
-0.11
-0.18
-0.20
-0.45
-0.40
-0.46
-0.37
-0.46
-0.15
-0.16
-0.28
-0.65
-0.88
DISTANCE ALONG SCREEN (ft)
SC
RE
EN
WID
TH(ft
)
0 4 8 120
2
4
6Vx54.543.532.521.51
T7filtermodel.xls
Qc=17.36 ft3/s, Qb=3.07 ft3/s, Qd=14.29 ft3/s
Depth = 0.5' or 6"
Screen Distance(ft)
Average SweepingVelocity Vs (ft/s)
Average Froude No. based on Vs
-0.4271 4.843 1.207 0.0729 4.841 1.207 0.5729 4.864 1.212 3.5729 4.264 1.063 6.5729 3.861 0.962 9.5729 1.684 0.585 11.0729 0.578 0.514
Figure 15.—Test 7. Rectangular 6-by-12 ft screen. Channel discharge, Qc=17.36 ft3/s, diversion discharge, Qd=14.29 ft3/s, bypass discharge, Qb=3.07 ft3/s. Diversion ratio, Qd/Qc = 0.82. Depth over screen=0.5 ft. Contours represent the sweeping velocity and indicate a wave front with re-circulating flow over the downstream right corner of the screen. The screen approach velocity values increase under the influence of the pooled water over the screen. The theoretical average approach velocity of 0.2 ft/s produces 24:1 and 3:1 for sweeping to approach velocity ratios for the upstream and downstream portions of the screen, respectively. The flow is supercritical over the upstream portion of the screen and transitions to subcritical about halfway down the screen.

26
Qc=20.4 ft3/s, Qb=6.05 ft3/s, Qd=14.35 ft3/s Depth = 0.667' or 8"
Screen Distance(ft)
Average SweepingVelocity Vs (ft/s)
Average Froude No. based on Vs
-4.4271 3.602 0.777 -2.4271 4.650 1.003 -0.4271 5.007 1.080 0.0729 5.069 1.094 0.5729 5.087 1.098 3.5729 4.488 0.968 6.5729 4.135 0.892 9.5729 2.818 0.668 11.0729 0.832 0.369 12.5729 1.030 0.444
Figure 16.—Test 8. Rectangular 6-by-12 ft screen. Channel discharge, Qc=20.4 ft3/s, diversion discharge, Qd=14.35 ft3/s, bypass discharge, Qb=6.05 ft3/s. Diversion ratio, Qd/Qc = 0.7. Depth over screen=0.67 ft. Contours represent the sweeping velocity and indicate a wave front with recirculating flow over the downstream corners of the screen. Recirculation is strong over the downstream right corner of the screen. The screen approach velocities increase under the influence of the pooled water over the screen. The theoretical average approach velocity of 0.2 ft/s produces 25:1 and 5:1 for sweeping to approach velocity ratios for the upstream and downstream portions of the screen, respectively. The flow is supercritical over the upstream portion of the screen and transitions to subcritical about halfway down the screen.

27
Screen Performance with a Converging Side wall The concept of the converging side wall over a flat-plate screen is to decrease the exposed flow area to match the rate at which the channel flow is being diverted. This geometry will diminish or prevent a decrease in sweeping velocity along the screen. Two wall convergences were tested in the model with the first discussed in this section. This geometry had the original 6 ft upstream width with the convergence beginning 1 ft upstream from the screen and ending at a bypass width of 2.54 ft. In addition, a non-perforated floor at the same elevation as the screen extended 2 to 4 ft downstream into the bypass. Table 2 shows the discharge conditions for the first series of converging side wall tests. The biological testing was also performed using this screen geometry.
Table 2.—Tests conducted with the 15-degree converging side wall to 2.54-ft-wide bypass with a flat, non-perforated bypass extension.
Test Channel
Discharge, Qc (ft3/s)
Diversion Discharge,
Qd (ft3/s)
Bypass Discharge,
Qb (ft3/s)
Qd/Qc (percent)
Theoretical Approach
Velocity (ft/s) Depth
(ft)
9 7.38 5.70 1.68 77 0.115 0.42 10 6.92 4.00 2.92 58 0.10 0.42 11 7.00 4.95 2.05 71 0.10 0.42 12 9.08 7.45 1.63 82 0.15 0.58 13 15.00 9.89 5.11 66 0.2 0.58 14 12.00 9.89 2.11 82 0.2 0.58 15 11.5 7.42 4.08 64 0.15 0.42
Figures 17 and 18 show the flow conditions representing the opposite ends of the operating range with the converging side wall at 15-degrees, the 2.54-ft wide bypass, and a supported jet with downstream control. Figure 17, test 10, shows subcritical flow over the entire screen area. Figure 18, test 13, shows supercritical flow transitioning to subcritical flow over the screen. At the beginning of the study it was probably felt that the screen should operate in the subcritical range, however, observations of the flow conditions revealed that supercritical flow over the entire screen would be acceptable, if not preferable. The flow regime transition in figure 18 is, however, not acceptable as the wave front over the screen would cause fish to hold on the screen and a change in velocities over the screen.
28
Figure 17.—Test 10. Converging side wall test with Qc = 6.92 ft3/s, Qd/Qc = 0.58 and no influence on the screen from downstream control. Flow is subcritical throughout and sweeping velocities are constant from upstream to downstream. This screen geometry and flow condition was used for the bull trout testing under a sweeping velocity of 2 ft/s.

29
Velocity data were recorded in the positions shown on figure 19 for tests 9-15 with the 15 degree converging side wall geometry. The sweeping velocity contour plots and longitudinal velocity and Froude number profiles are shown on figures 20-26. Velocity profiles were created by extracting data longitudinally along the screen from the data tables in the appendix at the centerline of the right screen 1 ft from the right wall, looking downstream. These data show the overall trends of the sweeping and approach velocities. The contour plots show that the sweeping velocities are very consistent across the width of the screen as with the rectangular screen. The approach velocities are slightly higher along the converging wall with the slight wave formed along the wall producing a slightly greater depth. The converging wall helps to keep the sweeping velocity deceleration rate less than with the rectangular screen. As the flow enters the bypass, the velocity does increase if there is no backwater present on the screen. Overall, the 15-degree converging side wall provided improved flow conditions and larger diversion to channel ratios than with the rectangular screen geometry. In addition, the Froude number was plotted along the second y-axis to show sub or super-critical flow conditions. In test 13, shown on figure 18, the flow transitioned over the screen from supercritical to subcritical flow and would not be an acceptable condition for operation.
Figure 18.—Test 13. Test of converging side wall with Qc=15 ft3/s, Qd/Qc=66 percent. Supercritical flow at the upstream end of the screen transitioning to subcritical about 7 ft onto the screen.

30
DATA LOCATIONS
Test 9
0
2
4
6
-8 -4 0 4 8 12 16DISTANCE ALONG SCREEN
SCR
EEN
WID
TH (f
t)
DATA LOCATIONSTest 10
0
2
4
6
-8 -4 0 4 8 12 16DISTANCE ALONG SCREEN (ft)
DATA LOCATIONSTests 11, 12, 13 & 14
0
2
4
6
-8 -4 0 4 8 12 16DISTANCE ALONG SCREEN (ft)
Figure 19.—Locations where velocity data were gathered for the 15° converging wall on the full-width horizontal fish screen. The exposed screen area is highlighted with the screen beginning at 0 ft. Data were gathered at various distances down the screen length primarily along screen panel centerlines and along the walls, including upstream and downstream from the screen. Test 15 data were only gathered along the screen length 1 ft from the right wall, looking downstream.

31
-1-0.5
00.5
11.5
22.5
33.5
44.5
5
-4 -2 0 2 4 6 8 10 12 14
Distance along screen (ft)-0.6-0.4-0.200.20.40.60.811.21.4
Vs Va Froude No.
Qc=7.38 ft3/s, Qb=1.68 ft3/s, Qd=5.70 ft3/s
Depth = 0.42' or 5" Screen Distance
(ft) Average Sweeping
Velocity Vs (ft/s) Average Froude No.
based on Vs -4.4271 2.299 0.627 -2.4271 2.527 0.690 -0.4271 2.758 0.753 0.0729 2.908 0.794 0.5729 2.928 0.799 3.5729 2.791 0.762 6.5729 2.666 0.728 9.5729 2.629 0.718 11.0729 1.208 0.330 12.5729 1.981 0.541
Figure 20.—Test 9. Converging wall with 15° angle. Channel discharge, Qc=7.38 ft3/s, diversion discharge, Qd=5.70 ft3/s, bypass discharge, Qb=1.68 ft3/s. Diversion ratio, Qd/Qc = 0.77. Depth over screen=0.42 ft. Contours represent the sweeping velocity and indicate backwater from downstream control over the downstream corners of the screen. The screen approach velocities increase under the influence of the pooled water over the screen. The theoretical average approach velocity of 0.115 ft/s produces 25:1 and 16:1 for sweeping to approach velocity ratios for the upstream and downstream portions of the screen, respectively. The flow is subcritical across the screen.

32
-0.50
0.51
1.52
2.53
3.54
4.55
-4 -2 0 2 4 6 8 10 12 14
Distance along screen (ft)
-0.6-0.4-0.200.20.40.60.811.21.4
Vs Va Froude No.
Qt=6.92 ft3/s, Qb=2.92 ft3/s, Qd=4.00 ft3/s Depth = 0.42' or 5"
Screen Distance (ft)
Average Sweeping Velocity Vs (ft/s)
Average Froude No. based on Vs
-4 2.6503 0.7207 -2 2.6744 0.7272 -1 2.6691 0.7258 0 2.8318 0.7700 1 2.8487 0.7746 2 2.7738 0.7543 3 2.5915 0.7047 4 2.5868 0.7034 5 2.6021 0.7076 6 2.4936 0.6781 7 2.4330 0.6616 8 2.3269 0.6327 9 2.4654 0.6704
10 2.3951 0.6513 11 2.3249 0.6322 12 2.6083 0.7093 13 3.1960 0.8691
Figure 21.—TEST 10. Converging channel with 15° angle. Channel discharge, Qc=6.92 ft3/s, diversion discharge, Qd= 4.00 ft3/s, bypass discharge, Qb=2.92 ft3/s. Diversion ratio, Qd/Qc = 0.58. Depth over screen=0.42 ft. Contours represent the sweeping velocity and indicate no influence from downstream control on the screen. The theoretical average approach velocity of 0.1 ft/s produces 28:1 and 26:1 for sweeping to approach velocity ratios for the upstream and downstream portions of the screen, respectively. The flow is subcritical across the entire screen with no decrease in sweeping velocity and a jump downstream from the screen. Bull trout tests were conducted with this screen geometry, flow rate, and sweeping velocity of about 2 ft/s.
33
-0.50
0.51
1.52
2.53
3.54
4.55
-4 -2 0 2 4 6 8 10 12 14
Distance along screen (ft)
-0.6-0.4-0.200.20.40.60.811.21.4
Vs Va Froude No.
Qt=7.00 ft3/s, Qb=2.05 ft3/s, Qd=4.95 ft3/s Depth = 0.42' or 5"
Screen Distance (ft)
Average Sweeping Velocity Vs (ft/s)
Average Froude No. based on Vs
-4 2.774 0.754 -2 2.753 0.748 -1 2.705 0.736 1 2.990 0.813 3 2.805 0.763 5 2.591 0.704 7 2.527 0.687 9 2.582 0.702
11 2.181 0.593 12 1.496 0.407 13 1.748 0.475
Figure 22.—Test 11. Converging walls with 15° angle. Channel discharge, Qc=7.00 ft3/s, diversion discharge, Qd=4.95 ft3/s, bypass discharge, Qb=2.05 ft3/s. Diversion ratio, Qd/Qc = 0.71. Depth over screen=0.42 ft. Contours represent the sweeping velocity and indicate a weak wave from downstream backwater on the very end of the screen. The theoretical average approach velocity of 0.1 ft/s produces 30:1 and 15:1 for sweeping to approach velocity ratios for the upstream and downstream portions of the screen, respectively. The flow is subcritical across the screen.

34
-1-0.5
00.5
11.5
22.5
33.5
44.5
5
-4 -2 0 2 4 6 8 10 12 14
Distance along screen (ft)
-0.6-0.4-0.200.20.40.60.811.21.4
Vs Va Froude No. Qt=9.08 ft3/s , Qb=1.63 ft3/s , Qd=7.45 ft3/s
Depth = 0.58' or 7" Screen Distance
(ft) Average Sweeping
Velocity Vs (ft/s) Average Froude No.
based on Vs -4 2.707 0.625
-2 2.646 0.611
-1 2.654 0.613
1 2.698 0.623
3 2.587 0.597
5 2.631 0.607
7 2.465 0.569
9 2.216 0.511
11 1.296 0.299
12 0.882 0.203
13 1.018 0.235 Figure 23.—TEST 12. Converging wall with 15° angle. Channel discharge, Qc=9.08 ft3/s, diversion discharge, Qd=7.45 ft3/s, bypass discharge, Qb=1.63 ft3/s. Diversion ratio, Qd/Qc = 0.82. Depth over screen=0.58 ft. Contours represent the sweeping velocity and indicate backwater over the end of the screen from downstream control. The screen approach velocities increase under the influence of the pooled water over the screen. The theoretical average approach velocity of 0.15 ft/s produces 18:1 and 6:1 for sweeping to approach velocity ratios for the upstream and downstream portions of the screen, respectively. The flow is subcritical over the entire screen. Debris testing was performed with this screen geometry and flow condition.

35
-1-0.5
00.5
11.5
22.5
33.5
44.5
5
-4 -2 0 2 4 6 8 10 12 14
Distance along screen (ft)
Velo
city
(ft/s
)
-0.6-0.4-0.200.20.40.60.811.21.4
Frou
de N
o.
Vs Va Froude No. Qt=15.00 ft3/s, Qb=5.11 ft3/s , Qd=9.89 ft3/s
Depth = 0.58' or 7" Screen Distance
(ft) Average Sweeping
Velocity Vs (ft/s) Average Froude No.
based on Vs -4 3.646 0.841
-2 3.674 0.848
-1 3.634 0.839
1 4.519 1.043
3 4.378 1.011
5 4.447 1.026
7 4.277 0.987
9 4.250 0.981
11 3.733 0.862
12 2.587 0.597
13 3.054 0.705 Figure 24.—TEST 13. Converging wall with 15° angle. Channel discharge, Qc=15.00 ft3/s, diversion discharge, Qd=9.89 ft3/s, bypass discharge, Qb=5.11 ft3/s. Diversion ratio, Qd/Qc = 0.66. Depth over screen=0.58 ft. Contours represent the sweeping velocity and indicate backwater over the end of the screen from downstream control. The screen approach velocities increase under the influence of the pooled water over the screen. The theoretical average approach velocity of 0.2 ft/s produces 23:1 and 13:1 for sweeping to approach velocity ratios for the upstream and downstream portions of the screen, respectively. The flow is near critical over most of the screen and transitions to subcritical as the flow is backwatered onto the screen.

36
-1-0.5
00.5
11.5
22.5
33.5
44.5
5
-4 -2 0 2 4 6 8 10 12 14
Distance along screen (ft)
-0.6-0.4-0.200.20.40.60.811.21.4
Vs Va Froude No.
Qt=12.00 ft3/s, Qb=2.11 ft3/s, Qd=9.89 ft3/s Depth = 0.58' or 7"
Screen Distance(ft)
Average SweepingVelocity Vs (ft/s)
Average Froude No. based on Vs
-4 3.128 0.722 -2 3.124 0.721 -1 3.182 0.734 1 3.274 0.756 3 3.175 0.733 5 3.180 0.734 7 2.909 0.671 9 2.426 0.560
11 1.440 0.332 12 1.262 0.291 13 1.161 0.268
Figure 25.—TEST 14. Converging wall with 15° angle. Channel discharge, Qc=12.00 ft3/s, diversion discharge, Qd=9.89 ft3/s, bypass discharge, Qb=2.11 ft3/s. Diversion ratio, Qd/Qc = 0.82. Depth over screen=0.58 ft. Contours represent the sweeping velocity and indicate a wave front with minor re-circulating flow over the downstream right corner of the screen. The screen approach velocities increase under the influence of the pooled water over the screen. The theoretical average approach velocity of 0.2 ft/s produces 16:1 and 6:1 for sweeping to approach velocity ratios for the upstream and downstream portions of the screen, respectively. The flow is subcritical across the entire screen.

37
-0.50.00.51.01.52.02.53.03.54.04.55.0
-4 -2 0 2 4 6 8 10 12 14
Distance along screen (ft)
Velo
city
(ft/s
)-0.6-0.4-0.20.00.20.40.60.81.01.21.4
Frou
de N
o.
Vs Va Froude No.
Screen Distance (ft) Vs (ft/s) Froude No.
-2.000 3.560 0.954 1.000 4.561 1.221 3.000 4.396 1.177 5.000 4.335 1.161 7.000 4.001 1.071 9.000 3.671 0.983 11.000 3.884 1.040 12.000 3.692 0.989 13.000 3.558 0.953
Figure 26. - Test 15. Converging wall with 15-degree angle and 2.54-ft-wide bypass opening. Channel discharge, Qc=11.5 ft3/s, diversion discharge, Qd=7.42 ft3/s, bypass discharge, Qb=4.08 ft3/s. Diversion ratio Qd/Qc=0.64. Depth over screen=0.42 ft. The profiles represent the sweeping and approach velocities measured over the screen 1 ft from the straight wall. Data were not gathered across the width; therefore, there is no contour plot. The flow is supercritical throughout the screen. Bull trout tests were conducted with this screen geometry, flow rate, and sweeping velocity of about 4 ft/s.
38
Screen Performance with a Converging Side Wall and a Drop at the Downstream End of the Screen The second series of tests with a converging side wall were conducted with the model modified to form a 1-ft-wide bypass and a drop at the downstream end of the screen into the bypass. Constructing a 1-ft-bypass, while keeping the wall convergence at 15 degrees, meant reducing the upstream channel to a width of 4.22 ft. The Froude model scale that was used for these tests was 2:1. This allowed for deeper flow depths and investigation of a typical 2 ft bypass width normally used in vertical screen installations. In addition, adding a drop at the end of the screen into the bypass allowed investigation of the effects of flow depth control at the downstream end of the screen. Critical depth occurred at the end of the screen and controlled the depth over the screen in addition to that provided by the diversion weir wall and control gate. With critical depth at the end of the screen (Froude number =1), the bypass flow is controlled for any given depth over the screen [4]. The flow conditions tested over the screen with the 15 degree wall convergence leading to the 1-ft-wide bypass with a drop at the downstream end are shown in table 3. After a few initial tests the channel flow was kept constant and the depth over the screen increased for comparison of flow conditions.
The flow characteristics at the end of the screen entering the bypass are complex. Two different flow conditions, represented by tests 20 and 18, are shown on figures 27 and 28. Test 20, shown on figure 27, has a fairly small channel flow and as a result the screen area is too large and flow returns back up through the screen at the downstream end. A necessary balance of flow causes flow to come up out of the screen for the given approach velocity, screen area, and depth. Test 18, shown on figure 28, has a large channel flow and cross-waves form due to the relatively short approach area causing build up of the flow at the downstream end of the screen and an increase in approach velocity at the downstream end of the screen.
Table 3.—Flow rates tested over the screen with a 1-ft-wide bypass and a drop at the downstream end
Test Channel
Discharge, Qc (ft3/s)
Diversion Discharge,
Qd (ft3/s)
Bypass Discharge,
Qb (ft3/s)
Qd/Qc (percent)
Theoretical Approach
Velocity (ft/s) Depth
(ft)
16 8 6.20 1.80 77 0.198 0.5
17 7 5.11 1.89 73 0.163 0.5
18 9 6.69 2.31 74 0.213 0.5
19 9 6.15 2.85 68 0.196 0.67
20 4.07 2.64 1.36 67 0.086 0.5
21 4.07 1.85 2.25 45 0.062 0.67

39
Figure 27.—Test 20. Critical flow at the downstream end of the screen with Qc= 4.07 ft3/s and Qd/Qc= 67 percent. Flow depth of 0.5 ft. The sweeping velocity is increasing across the screen and particularly as the flow enters the bypass opening. The approach velocity in the last foot of the screen is positive indicating that flow is coming up through the screen.
Figure 28.—Test 18. Critical flow at the downstream end of the screen with Qc= 9 ft3/s and Qd/Qc= 74 percent. Flow depth of 0.5 ft. The sweeping velocity is maintained across the screen and as the flow enters the bypass opening. The approach velocity over the last 2 feet of the screen exceeds the target of 0.2 ft/s indicating that the flow is deeper upstream from critical depth at the end of the screen. Notice the cross-waves extending the full width of the channel.

40
Velocity data were gathered along a profile located 0.5 ft from the straight right wall. Profiles of the depth at the end of the screen were measured to determine if the depth at the end of the screen was at, or above critical. In all cases depth measurements were equal to or greater than the computed critical depth for the bypass flow indicating subcritical flow conditions over the screen. For all channel flow rates and Qd/Qc ratios tested the sweeping velocity increased or remained steady as the flow entered the bypass opening at the downstream end of the screen, figures 29-34. This is an improvement in sweeping velocity that should encourage fish passage and would be similar to bypass velocities with vertical screens. The surface turbulence caused by the cross-waves from the wall convergence and the curvilinear flow at the drop produced some approach channel velocity anomalies at the end of the screen. In addition, the relatively short approach section to the screen section can also cause non-uniformity of the approach velocity. Approach conditions into the screen with higher sweeping velocities produced somewhat non-uniform approach velocities for every condition tested with small approach velocities at the upstream end of the screen that increased towards the downstream end of the screen. For test 18, figure 31, and test 19, figure 32, with the same channel flow rate of 9 ft3/s, the flow condition for test 18 produced increasing downward approach velocities along the screen, with the larger depth in test 19 following the same trend, but produced upwelling at the end of the screen. Figure 33, test 20, and figure 34, test 21, show the sweeping velocity increasing into the bypass and flow coming up out of the screen with positive approach velocities for Qc=4.07 ft3/s with Qd/Qc=0.67, D=0.5 ft and Qd/Qc=0.45, D=0.67 ft, respectively. The larger flow depth over the screen in test 21, compared to test 20, produced quite a large upwelling of velocity from the screen. This condition is not necessarily a problem hydraulically, but could cause fish avoidance at the bypass. A solid or non-perforated section should perhaps be placed at the end of the screen to prevent excessive approach velocities or reverse flow at the bypass opening when operating with a drop at the end of the screen. In addition, a longer screen will reduce cross-waves by decreasing the side wall convergence for a given diversion design flow.

41
-1.0-0.50.00.51.01.52.02.53.03.54.04.55.0
-4 -2 0 2 4 6 8 10 12
Distance along screen (ft)
Velo
city
(ft/s
)
Vs Va
X Vs (ft/s) Vy (ft/s) Va (ft/s) -4 2.655 -0.024 0.113 -2 4.201 -0.082 0.012 -1 3.454 -0.065 -0.078 0 3.398 -0.022 -0.073 1 3.352 0.096 -0.010 3 3.269 -0.086 -0.135 5 3.374 0.040 -0.184 7 3.295 -0.504 -0.271 9 3.382 -0.342 -0.296
10 3.136 -0.523 -0.314 11 2.998 -0.504 -0.294
Figure 29.—Test 16 with 15-degree converging side wall to 1 ft wide bypass channel. Qc=8 ft3/s, Qd=6.20 ft3/s, and Qd/Qc=77.5 percent with a 0.5 ft depth. Approach velocities increase down the screen and sweeping velocities remain relatively constant, perhaps slightly decreasing.

42
-1-0.5
00.5
11.5
22.5
33.5
44.5
5
-4 -2 0 2 4 6 8 10 12
Distance along screen (ft)
Velo
city
(ft/s
)
Vs Va
X distance (ft) Vs (ft/s) Vy (ft/s) Va (ft/s)
-2 3.2365 -0.0231 0.0103 0 3.6254 -0.0447 0.0335 2 3.0673 -0.0458 -0.0847 4 2.7194 -0.1154 -0.0465 6 2.7903 -0.1694 -0.1365 8 2.7733 -0.2012 -0.0978 10 2.901 -0.3217 -0.2906 11 2.9947 -0.4747 -0.2701
Figure 30.—Test 17 with 15-degree converging side wall to 1-ft-wide bypass. Qc=7 ft3/s, Qd=5.11 ft3/s, and Qd/Qc=73 percent with a 0.5 ft depth. Approach velocities increase down the screen and sweeping velocities remain relatively constant once over the screen.

43
-1-0.5
00.5
11.5
22.5
33.5
44.5
5
-4 -2 0 2 4 6 8 10 12
Distance along screen (ft)
Velo
city
(ft/s
)
Vs Va
X Distance (ft) Vs (ft/s) Vy (ft/s) Va (ft/s)
-2 4.4118 -0.0619 -0.0165 0 4.3276 -0.0555 -0.0006 2 3.9688 -0.0022 -0.1117 4 3.3786 -0.0721 -0.0633 6 3.5456 -0.1454 -0.1506 8 3.4904 -0.2494 -0.1771 10 3.6902 -0.2639 -0.3269 11 3.5782 -0.3731 -0.3825
Figure 31.—Test 18 with 15-degree converging side wall to 1-ft-wide bypass. Qc=9 ft3/s, Qd=6.69 ft3/s, and Qd/Qc=74 percent with a 0.5 ft depth. Approach velocities increase down the screen and sweeping velocities remain relatively constant once at a location 4 ft onto the screen.

44
-0.50.00.51.01.52.02.53.03.54.0
-4 -2 0 2 4 6 8 10 12
Distance along screen (ft)
Velo
city
(ft/s
)
Vs Va
X Vs (ft/s) Vy (ft/s) Va (ft/s) -2 3.354 -0.129 -0.020 0 3.144 -0.167 0.000 1 2.976 -0.196 -0.138 3 2.687 -0.166 -0.098 5 2.994 -0.216 -0.247 7 2.718 -0.221 -0.147 9 2.912 -0.244 -0.353 11 3.056 -0.347 -0.256
11.25 3.223 -0.389 -0.212 11.5 3.404 -0.394 0.041
Figure 32.—Test 19 with 15-degree side wall to 1-ft-wide bypass. Qc=9 ft3/s, Qd=6.15 ft3/s, and Qd/Qc=68 percent with a 0.67 ft depth. Approach velocities increase down the screen and sweeping velocities increasing into the bypass.
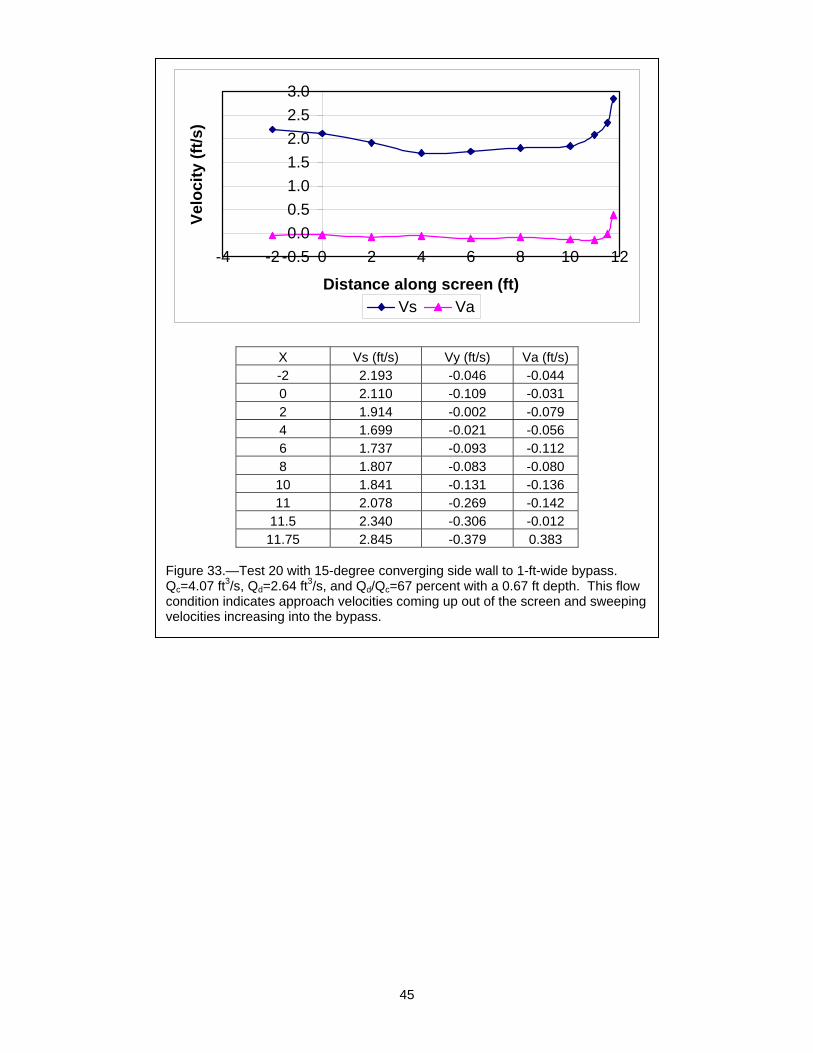
45
-0.50.00.51.01.52.02.53.0
-4 -2 0 2 4 6 8 10 12
Distance along screen (ft)
Velo
city
(ft/s
)
Vs Va
X Vs (ft/s) Vy (ft/s) Va (ft/s) -2 2.193 -0.046 -0.044 0 2.110 -0.109 -0.031 2 1.914 -0.002 -0.079 4 1.699 -0.021 -0.056 6 1.737 -0.093 -0.112 8 1.807 -0.083 -0.080 10 1.841 -0.131 -0.136 11 2.078 -0.269 -0.142
11.5 2.340 -0.306 -0.012 11.75 2.845 -0.379 0.383
Figure 33.—Test 20 with 15-degree converging side wall to 1-ft-wide bypass. Qc=4.07 ft3/s, Qd=2.64 ft3/s, and Qd/Qc=67 percent with a 0.67 ft depth. This flow condition indicates approach velocities coming up out of the screen and sweeping velocities increasing into the bypass.

46
BIOLOGICAL TESTING – FLOW DESCRIPTION The results of the biological testing of bull trout are attached under a separate report entitled “Bull Trout Performance in a Horizontal Flat-plate Screen” by Beyers and Bestgen [1]. The following is the Executive Summary from that comprehensive report. “This investigation was conducted to the describe effects of passage of bull trout Salvelinus confluentus over a horizontal flat-plate screen. Experimental releases were conducted with three sizes of bull trout that averaged 28, 37, and 58 mm total length (TL). Fish were released individually and in batches to: (1) describe general behavior near and on the screen; (2) estimate physical condition and survival of fish after passage; and (3) estimate entrainment and impingement rates.
-0.5
0.0
0.5
1.0
1.5
2.0
2.5
-4 -2 0 2 4 6 8 10 12
Distance along screen (ft)
Velo
city
(ft/s
)
Vs Va
X Vs (ft/s) Vy (ft/s) Va (ft/s) -2 1.3995 -0.0291 -0.0145 0 1.3977 -0.0431 -0.0127 1 1.3796 -0.0439 -0.0618 3 1.3984 -0.073 -0.0341 5 1.3839 -0.1152 -0.1061 7 1.3715 -0.1353 -0.0468 9 1.5095 -0.175 -0.0941 11 1.5832 -0.2265 0.1052
11.5 1.9876 -0.2937 0.3614 11.75 1.8415 -0.5295 0.5617
Figure 34. - Test 21 with 15-degree side wall with 1-ft-wide bypass. Qc=4.07 ft3/s, Qd=1.85 ft3/s, and Qd/Qc=45 percent with 0.67 ft depth. This flow condition indicates approach velocities coming up out of the screen and sweeping velocities increasing into the bypass.

47
Consistent negative effects from passage of bull trout over a horizontal flat-plate screen were not observed. Potential entrainment was ≤ 3.5% for 28 mm fish, and was never observed for larger fish. Impingement never occurred. Passage times increased with fish size and ranged from 4 sec to more than 10 min. Physical damage to eyes, fins, and integument was either rare (eyes) or less frequent in fish that passed over the screen than in control fish. Fish that passed over the screen did contact the bottom more frequently than control fish, but no immediate mortality occurred from screen passage. Survival at 24 h was ≤ 1.5% lower for fish that passed over the screen compared to controls. At 96 h after passage, survival was reduced, but was not consistently lower for fish that passed over the screen compared to controls. Thus, physical effects of screen passage were at, or near the level of background effects induced by fish culture, handling, transport, and testing. Water depth and orientation of bull trout changed with fish size and age despite the use of a standardized release methodology. Larger fish were more frequently observed near the bottom and more frequently oriented upstream than smaller fish. The tendency to occupy deeper water increased the likelihood that fish contacted the horizontal flat-plate screen. It also increased the likelihood that fish discovered attractive hydraulic properties of the screen. We observed several 58 mm fish that appeared to be maintaining position by using downward pressure generated by water approaching the screen. This behavior was the main factor responsible for increased passage time for larger fish. Thus, we did observe that certain hydraulic conditions of the horizontal flat-plate screen used in this investigation attracted fish and delayed their movement over the screen.” This section describes the flow conditions under which the biological testing was conducted. The testing was conducted with a 15-degree converging wall from the 6 ft wide channel to a 2.54 ft wide bypass. The wall convergence began 1 ft upstream from the 12 ft long screen section. The side wall in the downstream bypass area was extended to allow an acceptable area to net the fish below the screen. Two sweeping velocities were selected for testing that represented large sweeping to approach velocity ratios and different flow conditions over the screen. Test 10 with subcritcal flow over the screen, Vs = 2 ft/s and Qd/Qc = 0.58, figures 17 and 21, were replicated for the bull trout tests. Supercritical flow, test 15, was used with Vs = 4 ft/s and Qs/Qc = 0.62, figure 26. Flow depths for both tests were about 0.42 feet over the length of the screen. The sweeping velocities were essentially constant over the screen and increased at the entrance to the bypass. Both control and screen exposure tests were performed. For the control tests, the screen was covered with a thin sheet of plastic and the wall geometry modified to produce the same sweeping velocity without diversion flow. The hydraulic information for the biological tests is given in table 4. Figures 35- 37 show the geometry and flow conditions under which the bull trout testing was performed.

48
Table 4.—Hydraulic parameters used for the biological testing Qc (ft3/s) Qd (ft3/s) Qb (ft3/s) Qd/Qc Vs (ft/s) Va (ft/s) Vs/Va Depth (ft)
Test 11 6.92 4.00 2.92 0.58 2 0.15 13:1 0.42 Control 2.05 0 2.05 0 2 N/A N/A 0.42 Test 15 11.5 7.12 4.38 0.62 4 0.15 27:1 0.42 Control 4.08 0 4.08 0 4 N/A N/A 0.42
Figure 35.—Bull trout testing with the 15-degree converging wall over the screen.
Figure 36.—Control test setup for bull trout testing with clear plastic over the screen and 2 ft/s sweeping velocity.
Figure 37.—Control test setup for bull trout testing with clear plastic over the screen and 4 ft/s sweeping velocity.

49
FUTURE INVESTIGATIONS The hydraulic and biological investigations presented in this work will lead to discussions with Federal and State resource agencies regarding the feasibility of this technology. These agencies have been taking an active role in the investigations in order to resolve issues relating to requests from various irrigation districts to allow the use of the horizontal screen technology for flow diversion where ESA listed species are located. Implementation of an experimental horizontal screen at a field site is, hopefully, the next step in these investigations. This site would require meeting the standards determined by the resource agencies and also require monitoring of hydraulic and possibly biological performance. A few additional laboratory studies could be performed, should further research funding be available. These would include:
• Testing a wedge wire-type screen
• Testing various screen porosities
• More thorough debris tests
• Effectiveness of cleaning devices, if needed
• Further investigation of bypass exit conditions IMPLEMENTATION PLAN FOR HORIZONTAL FISH SCREEN TECHNOLOGY A meeting attended by Reclamation, the resource agencies, and members of the Baker Valley Irrigation District in July 2001 in Boise, ID to discuss what would be needed to utilize the horizontal flat-plate screen technology at a field site. The following items were determined to be necessary prior to use of the screen technology:
1. Obtain necessary permits and perform necessary biological assessments.
a. Determine migration pattern for listed species during irrigation season.
2. Obtain the area hydrology.
a. Hydrographs for all years.
b. QDesign and QRatio.

50
3. Site parameters.
a. Headwater control.
b. Tailwater control or information.
c. Modify site to meet optimal parameters.
d. Downstream drop off screen if possible.
e. Assess sediment issue with gradation information.
4. Evaluate debris type, i.e. leaves, needles, sand, etc. and quantity and design sediment traps, as needed.
5. Stay within recommended screen “criteria” (guidelines) for approach velocity and flow depth over 90 percent of the operational season.
a. Use spreadsheet to develop initial design.
b. Use a backwater program, such as HEC-RAS, for final design.
6. The diversion wall MUST be fixed.
7. Off-channel construction in diversion channels recommended.
8. Approach to design when outside of design with low flow.
a. Construct 2 channels side-by-side and shut off 1 side.
b. Use bypass control for low flows.
9. Evaluate hydraulic and biological performance throughout irrigation season.
REFERENCES [1] Beyers, Daniel W., Bestgen, Kevin R., “Bull Trout Performance During
Passage Over A Horizontal Flat-plate Screen”, Contribution 128, Larval Fish Laboratory, Department of Fishery and Wildlife Biology, Colorado State University, Fort Collins, CO 80523, July 2001.
[2] Mefford, B., Kubitschek, J., “Physical Model Studies of the GCID
Pumping Plant Fish Screen Structure Alternatives, Progress Report No. 1, 1:30 Scale Model Investigations, Alternative D”, R-97-02, U.S. Bureau of Reclamation, Technical Services Center, March 1997.
[3] Odeh, Mufeed, “Advances in Fish Passage Technology: Engineering
Design and Biological Evaluation”, American Fisheries Society, Bethesda, Maryland, 2000.
[4] Chow, Ven Te, “Open-Channel Hydraulics”, McGraw-Hill Book
Company, 1959.

51
APPENDIX A Flat-plate screen sweeping velocity prediction model. The computations are shown with the developed pivot table using cell K26.
123456789
101112
13141516171819202122232425262728293031
3233343536373839404142434445464748495051
A B C D E F G H I J K L M N
Screen length Channel width Area lost Screen area Qdiv Qb Flow area Vs Vs acc test Critical depth Critical vel Froude #
1 ft incrementsTotal u/s width-convergence angle*screen increment Tan(A)*screen length*screen length/2
Width*length-area lost
Incremental Q thru screen Total Q-Qdiv
Depth*channel width Qb/flow area
Specific Case 0 =($B$30)-(TAN(RADIANS($B$31))*C14) 0 0 0 =+$B$15-G14 =D14*$B$33 =H14/I14 =+((H14/D14)^2/32.2)^0.333 =+(32.2*L14)^0.5 =+(J14)^2/(32.2*$B$33)Qus = 10 =+B29/12 =($B$30)-(TAN(RADIANS($B$31))*C15) =TAN(RADIANS($B$31))*C15*C15/2 =$B$30*C15-E15 =+$B$16*F15 =+$B$15-G15 =D15*$B$33 =H15/I15 =IF((M15>J15),IF((ABS(J14-J15)<$B$34),IF((J15>$B$35),1,100),-100),-1) =+((H15/D15)^2/32.2)^0.333 =+(32.2*L15)^0.5 =+(J15)^2/(32.2*$B$33)Va = 0.2 =+$C$15*2 =($B$30)-(TAN(RADIANS($B$31))*C16) =TAN(RADIANS($B$31))*C16*C16/2 =$B$30*C16-E16 =+$B$16*F16 =+$B$15-G16 =D16*$B$33 =H16/I16 =IF((M16>J16),IF((ABS(J15-J16)<$B$34),IF((J16>$B$35),1,100),-100),-1) =+((H16/D16)^2/32.2)^0.333 =+(32.2*L16)^0.5 =+(J16)^2/(32.2*$B$33)Qdiv = =+$G$26 =+$C$15*3 =($B$30)-(TAN(RADIANS($B$31))*C17) =TAN(RADIANS($B$31))*C17*C17/2 =$B$30*C17-E17 =+$B$16*F17 =+$B$15-G17 =D17*$B$33 =H17/I17 =IF((M17>J17),IF((ABS(J16-J17)<$B$34),IF((J17>$B$35),1,100),-100),-1) =+((H17/D17)^2/32.2)^0.333 =+(32.2*L17)^0.5 =+(J17)^2/(32.2*$B$33)Qby= =+$B$15-$B$17 =+$C$15*4 =($B$30)-(TAN(RADIANS($B$31))*C18) =TAN(RADIANS($B$31))*C18*C18/2 =$B$30*C18-E18 =+$B$16*F18 =+$B$15-G18 =D18*$B$33 =H18/I18 =IF((M18>J18),IF((ABS(J17-J18)<$B$34),IF((J18>$B$35),1,100),-100),-1) =+((H18/D18)^2/32.2)^0.333 =+(32.2*L18)^0.5 =+(J18)^2/(32.2*$B$33)
=+$C$15*5 =($B$30)-(TAN(RADIANS($B$31))*C19) =TAN(RADIANS($B$31))*C19*C19/2 =$B$30*C19-E19 =+$B$16*F19 =+$B$15-G19 =D19*$B$33 =H19/I19 =IF((M19>J19),IF((ABS(J18-J19)<$B$34),IF((J19>$B$35),1,100),-100),-1) =+((H19/D19)^2/32.2)^0.333 =+(32.2*L19)^0.5 =+(J19)^2/(32.2*$B$33)=+$C$15*6 =($B$30)-(TAN(RADIANS($B$31))*C20) =TAN(RADIANS($B$31))*C20*C20/2 =$B$30*C20-E20 =+$B$16*F20 =+$B$15-G20 =D20*$B$33 =H20/I20 =IF((M20>J20),IF((ABS(J19-J20)<$B$34),IF((J20>$B$35),1,100),-100),-1) =+((H20/D20)^2/32.2)^0.333 =+(32.2*L20)^0.5 =+(J20)^2/(32.2*$B$33)=+$C$15*7 =($B$30)-(TAN(RADIANS($B$31))*C21) =TAN(RADIANS($B$31))*C21*C21/2 =$B$30*C21-E21 =+$B$16*F21 =+$B$15-G21 =D21*$B$33 =H21/I21 =IF((M21>J21),IF((ABS(J20-J21)<$B$34),IF((J21>$B$35),1,100),-100),-1) =+((H21/D21)^2/32.2)^0.333 =+(32.2*L21)^0.5 =+(J21)^2/(32.2*$B$33)=+$C$15*8 =($B$30)-(TAN(RADIANS($B$31))*C22) =TAN(RADIANS($B$31))*C22*C22/2 =$B$30*C22-E22 =+$B$16*F22 =+$B$15-G22 =D22*$B$33 =H22/I22 =IF((M22>J22),IF((ABS(J21-J22)<$B$34),IF((J22>$B$35),1,100),-100),-1) =+((H22/D22)^2/32.2)^0.333 =+(32.2*L22)^0.5 =+(J22)^2/(32.2*$B$33)=+$C$15*9 =($B$30)-(TAN(RADIANS($B$31))*C23) =TAN(RADIANS($B$31))*C23*C23/2 =$B$30*C23-E23 =+$B$16*F23 =+$B$15-G23 =D23*$B$33 =H23/I23 =IF((M23>J23),IF((ABS(J22-J23)<$B$34),IF((J23>$B$35),1,100),-100),-1) =+((H23/D23)^2/32.2)^0.333 =+(32.2*L23)^0.5 =+(J23)^2/(32.2*$B$33)=+$C$15*10 =($B$30)-(TAN(RADIANS($B$31))*C24) =TAN(RADIANS($B$31))*C24*C24/2 =$B$30*C24-E24 =+$B$16*F24 =+$B$15-G24 =D24*$B$33 =H24/I24 =IF((M24>J24),IF((ABS(J23-J24)<$B$34),IF((J24>$B$35),1,100),-100),-1) =+((H24/D24)^2/32.2)^0.333 =+(32.2*L24)^0.5 =+(J24)^2/(32.2*$B$33)=+$C$15*11 =($B$30)-(TAN(RADIANS($B$31))*C25) =TAN(RADIANS($B$31))*C25*C25/2 =$B$30*C25-E25 =+$B$16*F25 =+$B$15-G25 =D25*$B$33 =H25/I25 =IF((M25>J25),IF((ABS(J24-J25)<$B$34),IF((J25>$B$35),1,100),-100),-1) =+((H25/D25)^2/32.2)^0.333 =+(32.2*L25)^0.5 =+(J25)^2/(32.2*$B$33)=+$C$15*12 =($B$30)-(TAN(RADIANS($B$31))*C26) =TAN(RADIANS($B$31))*C26*C26/2 =$B$30*C26-E26 =+$B$16*F26 =+$B$15-G26 =D26*$B$33 =H26/I26 =IF((M26>J26),IF((ABS(J25-J26)<$B$34),IF((J26>$B$35),1,100),-100),-1) =+((H26/D26)^2/32.2)^0.333 =+(32.2*L26)^0.5 =+(J26)^2/(32.2*$B$33)
Screen length (L) 12channel width (Cw) =5Wall angle (A) 15 =K27 0.15 =D31+0.025 =E31+0.025 =F31+0.025 =G31+0.025 =H31+0.025 =I31+0.025Bypass width (Bw) = =+B30-(B29*TAN(B31*PI()/180)) 12 Vs<Vmin Vs<Vmin Vs<Vmin Vs<Vmin >deltaVs >deltaVs >deltaVsDepth (D) = 1 13 Vs<Vmin Vs<Vmin Vs<Vmin Vs<Vmin >deltaVs >deltaVs >deltaVs%Acl/Dcl per ft 1 14 Vs<Vmin Vs<Vmin Vs<Vmin Vs<Vmin >deltaVs >deltaVs >deltaVsVs (min), ft/s 2 15 Vs<Vmin Vs<Vmin Vs<Vmin Vs<Vmin Vs<Vmin >deltaVs >deltaVs
16 0.494676581449592 Vs<Vmin Vs<Vmin Vs<Vmin Vs<Vmin >deltaVs >deltaVsChannel 17 0.412230484541326 0.61834572681199 Vs<Vmin Vs<Vmin Vs<Vmin >deltaVs >deltaVs
Flow, 18 >deltaVs 0.530010622981706 0.70668083064227 Vs<Vmin Vs<Vmin >deltaVs >deltaVscfs 19 >deltaVs 0.463759295108992 0.618345726811990.772932158514 Vs<Vmin >deltaVs >deltaVs
20 >deltaVs >deltaVs 0.549640646055100.6870508075680.82446096908 >deltaVs >deltaVs21 >deltaVs >deltaVs 0.494676581449590.6183457268110.74201487217 Vs<Vmin >deltaVs22 >deltaVs >deltaVs >deltaVs 0.5621324789190.67455897470 0.786985470487 >deltaVs23 TRANS TRANS >deltaVs 0.5152881056760.61834572681 0.7214033479470.82446096908224 TRANS TRANS TRANS TRANS 0.57078067090 0.6659107827200.76104089453725 TRANS TRANS TRANS TRANS 0.53001062298 0.6183457268110.70668083064226 Vs>Vc Vs>Vc Vs>Vc TRANS TRANS 0.5771226783570.65956877526627 Vs>Vc Vs>Vc Vs>Vc Vs>Vc Vs>Vc TRANS TRANS
Vr>0.6 28 Vs>Vc Vs>Vc Vs>Vc Vs>Vc Vs>Vc Vs>Vc Vs>Vc0.3<Vr<0.6 29 Vs>Vc Vs>Vc Vs>Vc Vs>Vc Vs>Vc Vs>Vc Vs>Vc
Vr<0.3 30 Vs>Vc Vs>Vc Vs>Vc Vs>Vc Vs>Vc Vs>Vc Vs>Vc
Diversion ratio, Vr*
* Vr = Ratio of Diversion Flow to Channel Flow
Model assumes uniform approach velocity to the screen and a constant flow depth over the screenInput parameters are shown in yellow
And includes supercritical flow range as acceptable.Shaded areas in the table are for acceptable flow ratios given the specified input and approach velocity range.
Table shows where velocity is outside specified limits or shows "Trans" where flow changes from subcritical to supercritical.
Spreadsheet computes discharges based upon variable screen dimensions and depths.
=IF(AVERAGE(K15:K26)=1,G26/$B$15,IF(MAX(K15:K26)=100,"Vs<Vmin",IF(MIN(K15:K26)=-100,">deltaVs",IF(AVERAGE(K15:K26)=-1,"Vs>Vc","TRANS"))))
Flat plate screen sweeping velocity prediction modelfilename: flat plate screen worksheet sample.xls
Screen Approach Velocity, ft/s

52
APPENDIX B This appendix provides the actual three-dimensional velocity data as recorded by the SonTek ADV and analyzed with WinAdv. The “X” parameter is the distance down the screen in feet with 0 ft the beginning and 12 ft the end of the screen. The “Y” parameter is the distance across the screen in feet. Data were recorded for tests 16-21 only at one point 6 inches from the right or straight wall for each “X” distance when the “Y” distance is not shown. Rectangular Screen Data
Test 1 X Y Vs Vy Va
-0.4271 1 3.196 -0.175 -0.017 -0.4271 3 3.498 -0.211 -0.014 -0.4271 5 3.295 -0.015 -0.057 0.0729 1 3.020 -0.196 -0.109 0.0729 3 3.169 -0.140 -0.152 0.0729 5 3.150 -0.010 -0.127 0.5729 1 2.903 -0.146 -0.082 0.5729 3 3.200 -0.064 -0.157 0.5729 5 3.204 0.018 -0.124 3.5729 1 2.435 -0.096 -0.091 3.5729 3 2.700 0.075 -0.059 3.5729 5 2.571 0.006 -0.085 6.5729 1 1.928 0.085 -0.170 6.5729 3 2.060 0.032 -0.084 6.5729 5 2.014 -0.075 -0.086 9.5729 1 -0.507 0.048 -0.224 9.5729 3 2.197 0.597 -0.327 9.5729 5 2.032 0.000 -0.159 11.0729 1 -1.309 -0.155 -0.055 11.0729 3 2.205 0.574 -0.214 11.0729 5 1.640 0.282 -0.428
Test 2 X Y Vs Vy Va
-0.4271 1 3.785 -0.392 -0.024 -0.4271 3 3.818 -0.568 -0.019 -0.4271 5 3.719 -0.331 -0.023 0.0729 1 3.555 -0.264 -0.101 0.0729 3 3.737 -0.369 -0.126 0.0729 5 3.595 -0.144 -0.070 0.5729 1 3.536 -0.259 -0.110 0.5729 3 3.588 -0.227 -0.061
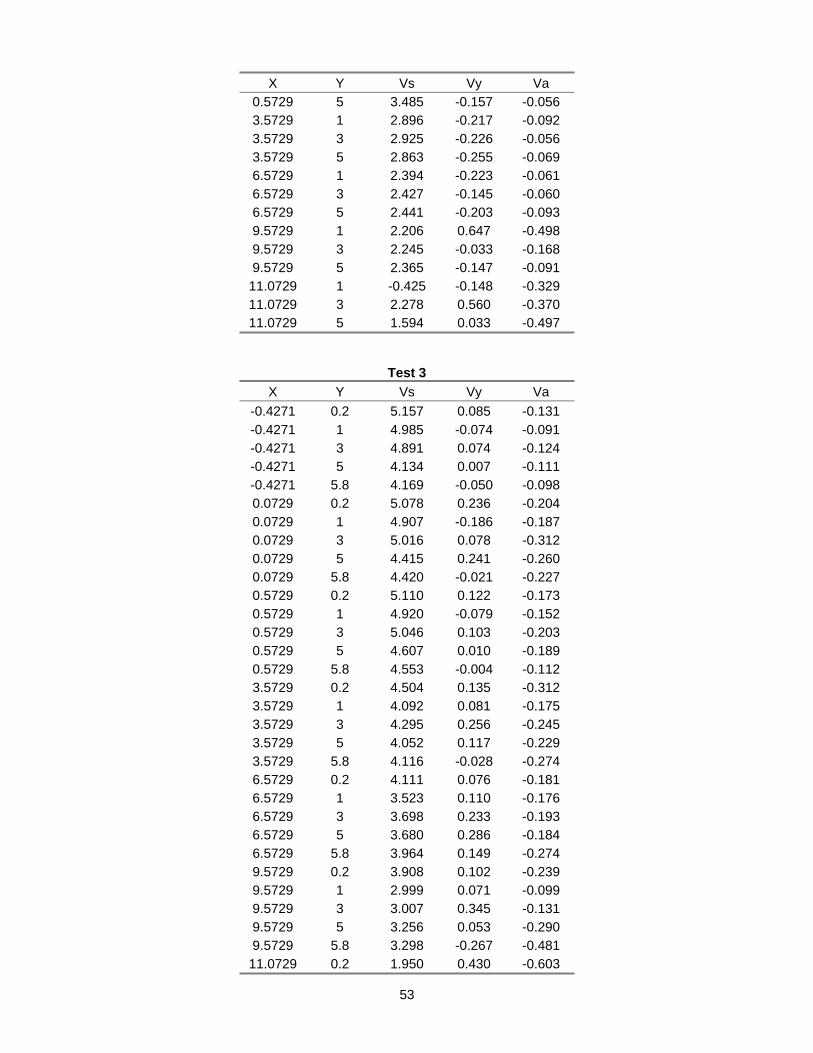
53
X Y Vs Vy Va 0.5729 5 3.485 -0.157 -0.056 3.5729 1 2.896 -0.217 -0.092 3.5729 3 2.925 -0.226 -0.056 3.5729 5 2.863 -0.255 -0.069 6.5729 1 2.394 -0.223 -0.061 6.5729 3 2.427 -0.145 -0.060 6.5729 5 2.441 -0.203 -0.093 9.5729 1 2.206 0.647 -0.498 9.5729 3 2.245 -0.033 -0.168 9.5729 5 2.365 -0.147 -0.091 11.0729 1 -0.425 -0.148 -0.329 11.0729 3 2.278 0.560 -0.370 11.0729 5 1.594 0.033 -0.497
Test 3 X Y Vs Vy Va
-0.4271 0.2 5.157 0.085 -0.131 -0.4271 1 4.985 -0.074 -0.091 -0.4271 3 4.891 0.074 -0.124 -0.4271 5 4.134 0.007 -0.111 -0.4271 5.8 4.169 -0.050 -0.098 0.0729 0.2 5.078 0.236 -0.204 0.0729 1 4.907 -0.186 -0.187 0.0729 3 5.016 0.078 -0.312 0.0729 5 4.415 0.241 -0.260 0.0729 5.8 4.420 -0.021 -0.227 0.5729 0.2 5.110 0.122 -0.173 0.5729 1 4.920 -0.079 -0.152 0.5729 3 5.046 0.103 -0.203 0.5729 5 4.607 0.010 -0.189 0.5729 5.8 4.553 -0.004 -0.112 3.5729 0.2 4.504 0.135 -0.312 3.5729 1 4.092 0.081 -0.175 3.5729 3 4.295 0.256 -0.245 3.5729 5 4.052 0.117 -0.229 3.5729 5.8 4.116 -0.028 -0.274 6.5729 0.2 4.111 0.076 -0.181 6.5729 1 3.523 0.110 -0.176 6.5729 3 3.698 0.233 -0.193 6.5729 5 3.680 0.286 -0.184 6.5729 5.8 3.964 0.149 -0.274 9.5729 0.2 3.908 0.102 -0.239 9.5729 1 2.999 0.071 -0.099 9.5729 3 3.007 0.345 -0.131 9.5729 5 3.256 0.053 -0.290 9.5729 5.8 3.298 -0.267 -0.481 11.0729 0.2 1.950 0.430 -0.603

54
X Y Vs Vy Va 11.0729 1 1.789 0.340 -0.468 11.0729 3 1.978 0.045 -0.466 11.0729 5 2.238 -0.288 -0.477 11.0729 5.8 -1.541 -0.104 -0.425
Test 4 X Y Vs Vy Va
-0.4271 1 1.948 -0.082 0.091 -0.4271 3 2.173 -0.054 0.120 -0.4271 5 2.156 0.048 0.063 0.0729 1 1.802 -0.262 -0.058 0.0729 3 1.944 -0.302 -0.046 0.0729 5 1.995 -0.348 -0.033 0.5729 1 1.440 -0.186 -0.046 0.5729 3 1.543 -0.147 -0.027 0.5729 5 1.508 0.024 -0.035 3.5729 1 1.310 -0.036 -0.039 3.5729 3 1.352 0.061 -0.045 3.5729 5 1.262 0.017 -0.021 6.5729 1 1.238 -0.067 -0.041 6.5729 3 1.317 -0.020 -0.058 6.5729 5 1.239 -0.004 -0.031 9.5729 1 1.208 -0.008 -0.088 9.5729 3 1.146 0.023 -0.041 9.5729 5 1.201 0.051 -0.047 11.0729 1 1.055 0.010 -0.256 11.0729 3 0.933 0.032 -0.254 11.0729 5 0.945 -0.024 -0.264
Test 5 X Y Vs Vy Va
-0.4271 1 3.059 -0.241 -0.030 -0.4271 3 3.212 -0.278 -0.015 -0.4271 5 3.013 -0.208 -0.036 0.0729 1 2.944 -0.251 -0.113 0.0729 3 3.048 -0.232 -0.158 0.0729 5 2.992 -0.142 -0.069 0.5729 1 2.874 -0.173 -0.068 0.5729 3 3.095 -0.200 -0.076 0.5729 5 2.852 -0.112 -0.062 3.5729 1 2.265 -0.098 -0.048 3.5729 3 2.430 -0.140 -0.039 3.5729 5 2.259 -0.090 -0.068 6.5729 1 1.849 -0.094 -0.050 6.5729 3 2.055 -0.020 -0.033 6.5729 5 1.780 -0.086 -0.058

55
X Y Vs Vy Va 9.5729 1 1.719 -0.119 -0.031 9.5729 3 1.913 -0.028 -0.071 9.5729 5 1.858 -0.021 -0.060 11.0729 1 1.364 0.012 -0.210 11.0729 3 1.494 -0.022 -0.221 11.0729 5 1.408 -0.015 -0.308
Test 6 X Y Vs Vy Va
-0.4271 1 2.898 -0.180 -0.062 -0.4271 3 2.928 -0.199 -0.057 -0.4271 5 2.820 -0.227 -0.035 0.0729 1 2.816 -0.174 -0.060 0.0729 3 2.918 -0.213 -0.059 0.0729 5 2.733 -0.089 -0.057 0.5729 1 2.758 -0.125 -0.079 0.5729 3 2.798 -0.169 -0.040 0.5729 5 2.725 -0.064 -0.060 3.5729 1 2.193 -0.137 -0.070 3.5729 3 2.291 -0.185 -0.077 3.5729 5 2.235 -0.061 -0.057 6.5729 1 1.901 -0.071 -0.054 6.5729 3 1.925 -0.175 -0.064 6.5729 5 1.887 -0.057 -0.080 9.5729 1 1.643 -0.141 -0.032 9.5729 3 1.788 -0.155 -0.066 9.5729 5 1.417 -0.140 0.067 11.0729 1 1.805 -0.132 0.268 11.0729 3 1.793 -0.109 0.242 11.0729 5 1.874 -0.224 0.290
Test 7 X Y Vs Vy Va
-0.4271 0.2 5.157 0.085 -0.131 -0.4271 1 4.985 -0.074 -0.091 -0.4271 3 4.891 0.074 -0.124 -0.4271 5 4.134 0.007 -0.111 -0.4271 5.8 4.169 -0.050 -0.098 0.0729 0.2 5.078 0.236 -0.204 0.0729 1 4.907 -0.186 -0.187 0.0729 3 5.016 0.078 -0.312 0.0729 5 4.415 0.241 -0.260 0.0729 5.8 4.420 -0.021 -0.227 0.5729 0.2 5.110 0.122 -0.173 0.5729 1 4.920 -0.079 -0.152 0.5729 3 5.046 0.103 -0.203

56
X Y Vs Vy Va 0.5729 5 4.607 0.010 -0.189 0.5729 5.8 4.553 -0.004 -0.112 3.5729 0.2 4.504 0.135 -0.312 3.5729 1 4.092 0.081 -0.175 3.5729 3 4.295 0.256 -0.245 3.5729 5 4.052 0.117 -0.229 3.5729 5.8 4.116 -0.028 -0.274 6.5729 0.2 4.111 0.076 -0.181 6.5729 1 3.523 0.110 -0.176 6.5729 3 3.698 0.233 -0.193 6.5729 5 3.680 0.286 -0.184 6.5729 5.8 3.964 0.149 -0.274 9.5729 0.2 3.908 0.102 -0.239 9.5729 1 2.999 0.071 -0.099 9.5729 3 3.007 0.345 -0.131 9.5729 5 3.256 0.053 -0.290 9.5729 5.8 3.298 -0.267 -0.481 11.0729 0.2 1.950 0.430 -0.603 11.0729 1 1.789 0.340 -0.468 11.0729 3 1.978 0.045 -0.466 11.0729 5 2.238 -0.288 -0.477 11.0729 5.8 -1.541 -0.104 -0.425
Test 8 X Y Vs Vy Va
-4.4271 0.2 3.265 0.198 0.131 -4.4271 1.0 3.453 0.091 0.204 -4.4271 3.0 3.860 0.099 0.243 -4.4271 5.0 3.720 0.329 0.199 -4.4271 5.8 3.712 0.136 0.211 -2.4271 0.2 4.422 0.239 -0.186 -2.4271 1.0 4.591 0.126 -0.126 -2.4271 3.0 4.849 0.148 -0.100 -2.4271 5.0 4.759 0.264 -0.146 -2.4271 5.8 4.628 0.169 -0.113 -0.4271 0.2 4.871 0.176 -0.142 -0.4271 1.0 4.946 0.163 -0.110 -0.4271 3.0 5.126 0.031 -0.048 -0.4271 5.0 5.064 0.260 -0.132 -0.4271 5.8 5.029 -0.051 -0.092 0.0729 0.2 4.908 0.245 -0.271 0.0729 1.0 4.960 0.169 -0.234 0.0729 3.0 5.162 0.130 -0.226 0.0729 5.0 5.211 0.321 -0.280 0.0729 5.8 5.102 0.071 -0.224 0.5729 0.2 4.986 0.185 -0.183 0.5729 1.0 4.936 0.122 -0.156

57
X Y Vs Vy Va 0.5729 3.0 5.117 0.129 -0.163 0.5729 5.0 5.208 0.284 -0.226 0.5729 5.8 5.188 0.018 -0.182 3.5729 0.2 4.539 0.132 -0.302 3.5729 1.0 4.006 0.180 -0.185 3.5729 3.0 4.439 0.134 -0.074 3.5729 5.0 4.512 0.312 -0.156 3.5729 5.8 4.944 0.145 -0.240 6.5729 0.2 4.016 0.243 -0.181 6.5729 1.0 3.753 0.174 -0.151 6.5729 3.0 3.754 0.183 -0.072 6.5729 5.0 4.365 0.152 -0.129 6.5729 5.8 4.785 0.213 -0.187 9.5729 0.2 -0.696 0.136 -0.596 9.5729 1.0 2.907 0.973 -0.746 9.5729 3.0 3.325 0.605 -0.329 9.5729 5.0 4.044 0.215 -0.317 9.5729 5.8 4.510 0.068 -0.435 11.0729 0.2 -1.618 -0.119 -0.292 11.0729 1.0 -0.573 -0.368 -0.344 11.0729 3.0 2.989 1.170 -0.507 11.0729 5.0 2.748 0.328 -0.771 11.0729 5.8 0.614 -0.067 -0.936 12.5729 0.2 -1.902 -0.244 0.112 12.5729 1.0 -0.665 -0.586 0.087 12.5729 3.0 3.273 0.790 -0.071 12.5729 5.0 2.886 0.447 -0.062 12.5729 5.8 1.560 0.340 -0.070
Converging Side wall with 2.54-ft-wide Bypass Opening
Test 9 X Y Vs Vy Va
-4.427 0.2 2.272 -0.054 0.147 -4.427 1 2.276 -0.230 0.165 -4.427 3 2.275 -0.147 0.241 -4.427 5 2.409 -0.026 0.190 -4.427 5.8 2.264 -0.003 0.156 -2.427 0.2 2.308 -0.086 -0.098 -2.427 1 2.408 0.020 -0.040 -2.427 3 2.595 -0.211 0.020 -2.427 5 2.733 -0.062 0.016 -2.427 5.8 2.592 -0.093 0.061 -0.427 0.2 2.913 -0.050 -0.028 -0.427 1 3.037 -0.231 -0.027

58
X Y Vs Vy Va -0.427 3 3.026 -0.324 -0.023 -0.427 5 2.747 -0.537 0.004 -0.427 5.7 2.065 -0.568 -0.029 0.073 0.2 3.120 -0.068 0.506 0.073 1 2.722 -0.148 -0.050 0.073 2.9 3.121 -0.335 -0.056 0.073 4.8 2.922 -0.373 -0.125 0.073 5.5 2.655 -0.704 -0.132 0.573 0.2 2.600 0.144 0.107 0.573 1 2.253 -0.068 0.275 0.573 2.5 3.234 -0.277 0.652 0.573 3.8 3.364 -0.354 0.683 0.573 5.2 3.192 -0.647 0.421 3.573 0.2 2.725 0.000 -0.149 3.573 1 2.670 -0.192 -0.142 3.573 3 2.819 -0.279 -0.180 3.573 3.8 2.865 -0.428 -0.195 3.573 4.55 2.878 -0.677 -0.188 6.573 0.2 2.509 -0.005 -0.170 6.573 1 2.381 -0.126 -0.131 6.573 2.4 2.623 -0.304 -0.152 6.573 3 2.981 -0.530 -0.176 6.573 3.8 2.838 -0.761 -0.149 9.573 0.2 2.509 0.022 -0.224 9.573 1 2.137 -0.110 -0.166 9.573 2.3 2.896 -0.486 -0.165 9.573 2.9 2.975 -0.664 -0.221
11.073 0.2 0.681 -0.031 -0.330 11.073 1 1.735 0.022 -0.340 12.573 2.3 1.981 -0.175 -0.033
Test 10 X Y Vs Vy Va -4 0.2 2.847 0.013 0.107 -4 1 2.856 0.116 0.136 -4 3 2.626 0.009 0.129 -4 5 2.462 -0.034 0.066 -4 5.8 2.460 0.048 0.100 -2 0.2 2.920 0.029 -0.042 -2 1 2.923 0.031 -0.040 -2 3 2.718 -0.131 -0.001 -2 5 2.458 -0.062 -0.016 -2 5.8 2.352 0.029 0.012 -1 0.2 2.974 0.037 -0.038 -1 1 2.944 0.034 -0.031 -1 3 2.781 -0.174 -0.037 -1 5 2.512 -0.277 -0.041

59
X Y Vs Vy Va -1 5.8 2.134 -0.256 -0.029 0 0.2 3.038 0.021 -0.037 0 1 3.056 0.027 -0.011 0 3 2.876 -0.257 -0.025 0 5 2.493 -0.431 -0.105 0 5.6 2.696 -0.539 -0.182 1 0.2 2.942 0.015 -0.079 1 1 2.845 0.045 -0.058 1 3 2.816 -0.235 -0.041 1 5 2.837 -0.482 -0.143 1 5.3 2.802 -0.556 -0.161 2 0.2 2.963 0.032 -0.103 2 1 2.759 0.012 -0.069 2 3 2.597 -0.229 -0.096 2 5 2.777 -0.569 -0.159 3 0.2 2.832 0.006 -0.139 3 1 2.552 -0.006 -0.110 3 3 2.237 -0.196 -0.089 3 4.7 2.745 -0.566 -0.167 4 0.2 2.744 0.030 -0.111 4 1 2.364 0.021 -0.057 4 3 2.435 -0.227 -0.067 4 4.5 2.804 -0.606 -0.099 5 0.2 2.611 0.035 -0.107 5 1 2.406 -0.005 -0.089 5 3 2.548 -0.274 -0.121 5 4.2 2.844 -0.594 -0.157 6 0.2 2.462 -0.043 -0.130 6 1 2.125 -0.002 -0.064 6 3 2.689 -0.415 -0.137 6 4 2.698 -0.540 -0.100 7 0.2 2.306 0.074 -0.148 7 1 1.894 0.022 -0.066 7 3 2.745 -0.471 -0.136 7 3.7 2.787 -0.593 -0.200 8 0.2 2.398 -0.040 -0.152 8 1 1.801 -0.024 -0.018 8 3 2.537 -0.507 -0.090 8 3.4 2.572 -0.553 -0.110 9 0.2 2.541 -0.003 -0.144 9 1 1.981 -0.059 -0.055 9 3 2.875 -0.639 -0.186 10 0.2 2.386 0.080 -0.127 10 1 1.983 -0.137 -0.053 10 2.9 2.816 -0.644 -0.212 11 0.2 2.295 0.042 -0.134 11 1 1.894 -0.206 -0.069 11 2.6 2.785 -0.554 -0.161

60
X Y Vs Vy Va 12 0.2 2.460 -0.040 -0.062 12 1 2.239 -0.198 -0.020 12 2.2 3.126 -0.601 -0.118 13 0.2 3.223 -0.001 -0.057 13 1 3.169 -0.057 0.003
Test 11 X Y Vs Vy Va
-4.00 0.2 3.133 0.048 -0.018 -4.00 1 3.076 0.021 -0.015 -4.00 3 2.864 -0.228 -0.031 -4.00 5 2.608 -0.250 -0.048 -4.00 5.8 2.188 -0.305 -0.030 -2.00 0.2 2.969 0.043 -0.057 -2.00 1 2.978 0.048 -0.059 -2.00 3 2.808 -0.117 -0.022 -2.00 5 2.565 -0.126 -0.026 -2.00 5.8 2.443 0.037 0.024 -1.00 0.2 2.856 0.015 0.095 -1.00 1 2.935 0.135 0.134 -1.00 3 2.664 0.009 0.123 -1.00 5 2.533 -0.008 0.052 -1.00 5.8 2.540 0.090 0.114 1.00 0.2 3.136 0.042 0.015 1.00 1 2.936 0.055 0.007 1.00 3 2.938 -0.244 -0.034 1.00 5 3.010 -0.505 -0.128 1.00 5.3 2.929 -0.578 -0.154 3.00 0.2 2.908 -0.037 -0.072 3.00 1 2.809 0.023 -0.064 3.00 3 2.631 -0.208 -0.048 3.00 4.7 2.872 -0.408 -0.151 5.00 0.2 2.685 0.175 -0.102 5.00 1 2.115 0.015 -0.051 5.00 3 2.830 -0.324 -0.123 5.00 4.2 2.733 -0.758 -0.150 7.00 0.2 2.386 0.194 -0.150 7.00 1 2.014 0.007 -0.063 7.00 3 2.672 -0.288 -0.148 7.00 3.7 3.035 -0.597 -0.209 9.00 0.2 2.676 0.146 -0.138 9.00 1 2.055 -0.003 -0.087 9.00 3 3.016 -0.617 -0.189
11.00 0.2 1.963 0.413 -0.202 11.00 1 1.809 -0.077 -0.186 11.00 2.6 2.771 -0.603 -0.210 12.00 0.2 1.086 -0.064 -0.120

61
X Y Vs Vy Va 12.00 1 1.078 -0.046 -0.117 12.00 2.2 2.325 -0.267 -0.087 13.00 0.2 1.406 -0.132 0.041 13.00 1 1.473 -0.051 0.006 13.00 2.2 2.365 -0.046 0.003 6.00 3 2.689 -0.415 -0.137 6.00 4 2.698 -0.540 -0.100 7.00 0.2 2.306 0.074 -0.148 7.00 1 1.894 0.022 -0.066 7.00 3 2.745 -0.471 -0.136 7.00 3.7 2.787 -0.593 -0.200 8.00 0.2 2.398 -0.040 -0.152 8.00 1 1.801 -0.024 -0.018 8.00 3 2.537 -0.507 -0.090 8.00 3.4 2.572 -0.553 -0.110 9.00 0.2 2.541 -0.003 -0.144 9.00 1 1.981 -0.059 -0.055 9.00 3 2.875 -0.639 -0.186
10.00 0.2 2.386 0.080 -0.127 10.00 1 1.983 -0.137 -0.053 10.00 2.9 2.816 -0.644 -0.212 11.00 0.2 2.295 0.042 -0.134 11.00 1 1.894 -0.206 -0.069 11.00 2.6 2.785 -0.554 -0.161 12.00 0.2 2.460 -0.040 -0.062 12.00 1 2.239 -0.198 -0.020 12.00 2.2 3.126 -0.601 -0.118 13.00 0.2 3.223 -0.001 -0.057 13.00 1 3.169 -0.057 0.003
Test 12 X Y Vs Vy Va
-4.0 0.2 2.957 -0.332 0.174 -4.0 1.0 2.958 -0.224 0.246 -4.0 3.0 2.637 -0.444 0.192 -4.0 5.0 2.487 -0.377 0.127 -4.0 5.8 2.495 -0.240 0.157 -2.0 0.2 2.949 -0.339 -0.014 -2.0 1.0 2.885 -0.292 0.030 -2.0 3.0 2.636 -0.512 0.019 -2.0 5.0 2.425 -0.418 0.010 -2.0 5.8 2.336 -0.314 0.031 -1.0 0.2 3.011 -0.380 -0.034 -1.0 1.0 2.947 -0.147 -0.011 -1.0 3.0 2.737 -0.437 -0.033 -1.0 5.0 2.479 -0.444 -0.043 -1.0 5.8 2.097 -0.422 -0.021

62
X Y Vs Vy Va 1.0 0.2 2.736 -0.135 -0.111 1.0 1.0 2.748 -0.107 -0.064 1.0 3.0 2.547 -0.372 -0.117 1.0 5.0 2.759 -0.585 -0.226 1.0 5.3 2.699 -0.694 -0.253 3.0 0.2 2.530 0.064 -0.079 3.0 1.0 2.640 0.014 -0.090 3.0 3.0 2.547 -0.323 -0.097 3.0 4.7 2.630 -0.519 -0.234 5.0 0.2 2.764 -0.001 -0.117 5.0 1.0 2.420 -0.048 -0.066 5.0 3.0 2.739 -0.432 -0.145 5.0 4.2 2.600 -0.424 -0.158 7.0 0.2 2.463 0.073 -0.157 7.0 1.0 1.994 -0.039 -0.044 7.0 3.0 2.728 -0.347 -0.155 7.0 3.7 2.676 -0.530 -0.254 9.0 0.2 1.972 0.253 -0.306 9.0 1.0 1.979 0.009 -0.220 9.0 3.0 2.696 -0.536 -0.280
11.0 0.2 0.216 0.139 -0.345 11.0 1.0 1.654 0.088 -0.392 11.0 2.6 2.017 -0.183 -0.435 12.0 0.2 -0.215 -0.337 -0.034 12.0 1.0 1.290 -0.076 -0.106 12.0 2.2 1.569 -0.136 -0.128 13.0 0.2 0.115 -0.104 0.020 13.0 1.0 1.391 -0.310 0.016 13.0 2.2 1.548 -0.063 0.007
Test 13 X Y Vs Vy Va
-4.00 0.2 3.598 -0.366 0.198 -4.00 1 3.683 -0.406 0.280 -4.00 3 3.798 -0.456 0.297 -4.00 5 3.588 -0.364 0.151 -4.00 5.8 3.562 -0.243 0.259 -2.00 0.2 3.825 -0.361 -0.021 -2.00 1 3.938 -0.393 0.039 -2.00 3 3.898 -0.630 0.091 -2.00 5 3.413 -0.545 -0.020 -2.00 5.8 3.298 -0.299 0.088 -1.00 0.2 3.912 -0.434 -0.069 -1.00 1 3.973 -0.498 -0.032 -1.00 3 3.869 -0.778 -0.006 -1.00 5 3.533 -0.782 -0.071 -1.00 5.8 2.884 -0.709 0.000

63
X Y Vs Vy Va 1.00 0.2 4.427 0.133 -0.113 1.00 1 4.558 -0.104 -0.157 1.00 3 4.541 -0.438 -0.120 1.00 5 4.661 -0.580 -0.369 1.00 5.3 4.410 -0.879 -0.363 3.00 0.2 4.398 0.173 -0.187 3.00 1 4.618 -0.069 -0.195 3.00 3 4.275 -0.334 -0.156 3.00 4.7 4.224 -0.592 -0.365 5.00 0.2 4.360 0.025 -0.113 5.00 1 4.685 -0.022 -0.113 5.00 3 4.659 -0.624 -0.226 5.00 4.2 4.083 -0.438 -0.227 7.00 0.2 4.138 -0.747 -0.268 7.00 1 4.144 -0.065 -0.212 7.00 3 4.451 -0.719 -0.297 7.00 3.7 4.375 -0.808 -0.384 9.00 0.2 4.399 -0.700 -0.212 9.00 1 4.101 -0.903 -0.262 9.00 3 4.249 -1.349 -0.396 11.00 0.2 3.347 0.340 -0.428 11.00 1 3.724 -0.159 -0.435 11.00 2.6 4.129 -0.721 -0.391 12.00 0.2 2.028 -0.188 -0.220 12.00 1 2.607 0.114 -0.198 12.00 2.2 3.127 -0.108 -0.165 13.00 0.2 2.640 -0.122 0.051 13.00 1 3.154 -0.036 0.030 13.00 2.2 3.367 0.001 0.022
Test 14 X Y Vs Vy Va
-4.00 0.2 3.104 -0.010 0.154 -4.00 1 3.070 -0.025 0.177 -4.00 3 3.246 -0.031 0.187 -4.00 5 3.174 0.126 0.159 -4.00 5.8 3.046 0.096 0.178 -2.00 0.2 3.196 -0.001 -0.020 -2.00 1 3.262 -0.006 -0.020 -2.00 3 3.301 -0.152 0.023 -2.00 5 3.027 0.008 0.011 -2.00 5.8 2.835 0.038 0.030 -1.00 0.2 3.397 0.032 -0.033 -1.00 1 3.472 0.007 -0.036 -1.00 3 3.537 -0.244 -0.007 -1.00 5 3.042 -0.187 -0.013 -1.00 5.8 2.462 -0.281 0.003
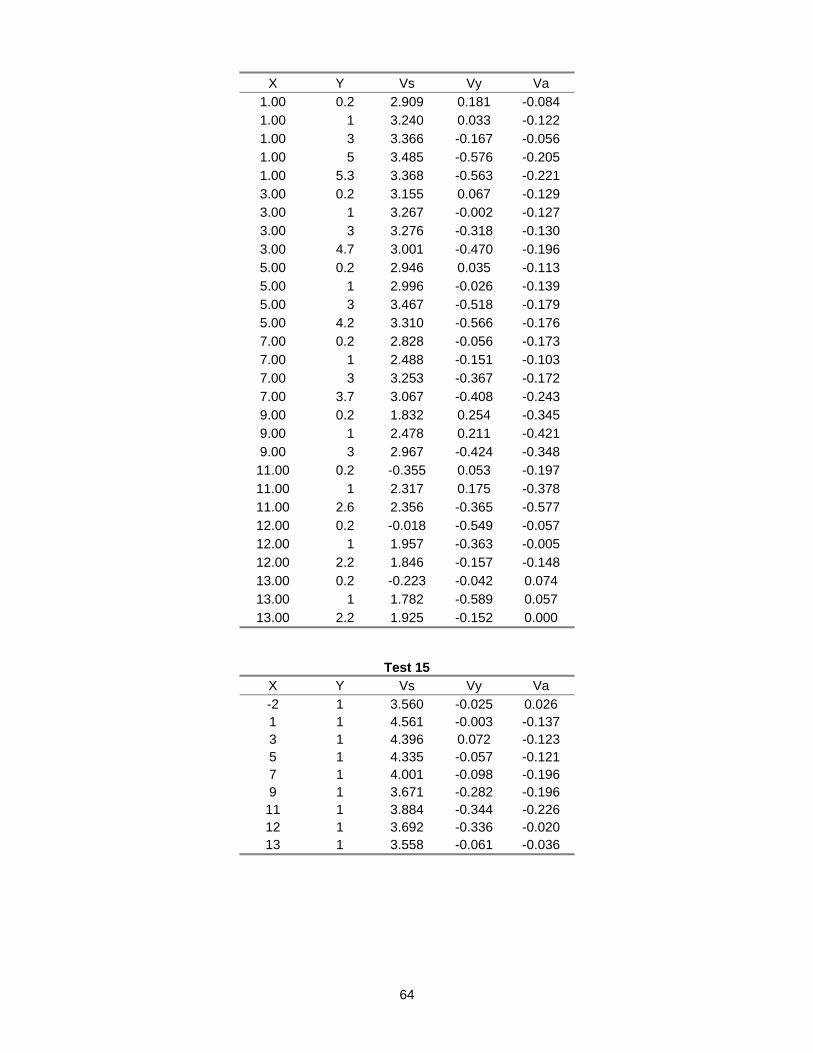
64
X Y Vs Vy Va 1.00 0.2 2.909 0.181 -0.084 1.00 1 3.240 0.033 -0.122 1.00 3 3.366 -0.167 -0.056 1.00 5 3.485 -0.576 -0.205 1.00 5.3 3.368 -0.563 -0.221 3.00 0.2 3.155 0.067 -0.129 3.00 1 3.267 -0.002 -0.127 3.00 3 3.276 -0.318 -0.130 3.00 4.7 3.001 -0.470 -0.196 5.00 0.2 2.946 0.035 -0.113 5.00 1 2.996 -0.026 -0.139 5.00 3 3.467 -0.518 -0.179 5.00 4.2 3.310 -0.566 -0.176 7.00 0.2 2.828 -0.056 -0.173 7.00 1 2.488 -0.151 -0.103 7.00 3 3.253 -0.367 -0.172 7.00 3.7 3.067 -0.408 -0.243 9.00 0.2 1.832 0.254 -0.345 9.00 1 2.478 0.211 -0.421 9.00 3 2.967 -0.424 -0.348 11.00 0.2 -0.355 0.053 -0.197 11.00 1 2.317 0.175 -0.378 11.00 2.6 2.356 -0.365 -0.577 12.00 0.2 -0.018 -0.549 -0.057 12.00 1 1.957 -0.363 -0.005 12.00 2.2 1.846 -0.157 -0.148 13.00 0.2 -0.223 -0.042 0.074 13.00 1 1.782 -0.589 0.057 13.00 2.2 1.925 -0.152 0.000
Test 15 X Y Vs Vy Va -2 1 3.560 -0.025 0.026 1 1 4.561 -0.003 -0.137 3 1 4.396 0.072 -0.123 5 1 4.335 -0.057 -0.121 7 1 4.001 -0.098 -0.196 9 1 3.671 -0.282 -0.196 11 1 3.884 -0.344 -0.226 12 1 3.692 -0.336 -0.020 13 1 3.558 -0.061 -0.036

65
Converging Wall with 1-ft-wide Bypass Entrance
Test 16 X Vs Vy Va -4 2.655 -0.024 0.113 -2 4.201 -0.082 0.012 -1 3.454 -0.065 -0.078 0 3.398 -0.022 -0.073 1 3.352 0.096 -0.010 3 3.269 -0.086 -0.135 5 3.374 0.040 -0.184 7 3.295 -0.504 -0.271 9 3.382 -0.342 -0.296
10 3.136 -0.523 -0.314 11 2.998 -0.504 -0.294
Test 17 X distance (ft) Vs Vy Va
-2 3.2365 -0.0231 0.0103 0 3.6254 -0.0447 0.0335 2 3.0673 -0.0458 -0.0847 4 2.7194 -0.1154 -0.0465 6 2.7903 -0.1694 -0.1365 8 2.7733 -0.2012 -0.0978 10 2.901 -0.3217 -0.2906 11 2.9947 -0.4747 -0.2701
Test 18 X Distance (ft) Vs Vy Va
-2 4.4118 -0.0619 -0.0165 0 4.3276 -0.0555 -0.0006 2 3.9688 -0.0022 -0.1117 4 3.3786 -0.0721 -0.0633 6 3.5456 -0.1454 -0.1506 8 3.4904 -0.2494 -0.1771
10 3.6902 -0.2639 -0.3269 11 3.5782 -0.3731 -0.3825
Test 19 X Vs Vy Va -2 3.354 -0.1286 -0.0204 0 3.144 -0.167 0.0001 1 2.9758 -0.1962 -0.1375 3 2.6868 -0.1663 -0.0984 5 2.9937 -0.2155 -0.2466 7 2.7179 -0.2205 -0.1472

66
X Vs Vy Va 9 2.9123 -0.2442 -0.3532 11 3.0562 -0.3474 -0.2561
11.25 3.2229 -0.3886 -0.2118 11.5 3.4039 -0.3942 0.041
Test 20 X Vs Vy Va -2 2.193 -0.046 -0.044 0 2.110 -0.109 -0.031 2 1.914 -0.002 -0.079 4 1.699 -0.021 -0.056 6 1.737 -0.093 -0.112 8 1.807 -0.083 -0.080 10 1.841 -0.131 -0.136 11 2.078 -0.269 -0.142
11.5 2.340 -0.306 -0.012 11.75 2.845 -0.379 0.383
Test 21 X Vs Vy Va -2 1.453 0.009 -0.014 0 1.400 -0.074 -0.003 2 1.378 -0.058 -0.064 4 1.337 -0.082 -0.056 6 1.351 -0.044 -0.103 8 1.318 -0.155 -0.071
10 1.530 -0.150 -0.090 11 1.731 -0.209 0.125
11.5 1.769 -0.458 0.457 11.75 2.048 -0.475 0.601


![Horizontal Motion: [1] - · PDF fileHorizontal Motion: The horizontal ... then tangential and normal components of acceleration are ... determine the ball’s velocity and the normal](https://img.dokumen.tips/doc/110x75/5a7ea5497f8b9ae9398ea3e8/horizontal-motion-1-motion-the-horizontal-then-tangential-and-normal-components.jpg)