Embed Size (px)
Citation preview
Human PapillomavirusandRelated Diseases Report
INDONESIAVersion posted at www.hpvcentre.net on 10 December 2018
- ii -
Copyright and Permissions
©ICO/IARC Information Centre on HPV and Cancer (HPV Information Centre) 2018
All rights reserved. HPV Information Centre publications can be obtained from the HPV Informa-tion Centre Secretariat, Institut Català d’Oncologia, Avda. Gran Via de l’Hospitalet, 199-203 08908L’Hospitalet del Llobregat (Barcelona) Spain. E-mail: [email protected]. Requests for per-mission to reproduce or translate HPV Information Centre publications - whether for sale or for non-commercial distribution- should be addressed to the HPV Information Centre Secretariat, at the aboveaddress.
The designations employed and the presentation of the material in this publication do not imply theexpression of any opinion whatsoever on the part the HPV Information Centre concerning the legalstatus of any country, territory, city or area or of its authorities, or concerning the delimitation of itsfrontiers or boundaries. Dotted lines on maps represent approximate border lines for which there maynot yet be full agreement. The mention of specific companies or of certain manufacturers products doesnot imply that they are endorsed or recommended the HPV Information Centre in preference to othersof a similar nature that are not mentioned. Errors and omissions excepted, the names of proprietaryproducts are distinguished by initial capital letters. All reasonable precautions have been taken by theHPV Information Centre to verify the information contained in this publication. However, the publishedmaterial is being distributed without warranty of any kind, either expressed or implied. The respon-sibility for the interpretation and use of the material lies with the reader. In no event shall the HPVInformation Centre be liable for damages arising from its use.
The development of this report has been supported by grants from the European Comission (7th Frame-work Programme grant HEALTH-F3-2010-242061, HEALTH-F2-2011-282562, HPV AHEAD).
Recommended citation:
Bruni L, Albero G, Serrano B, Mena M, Gómez D, Muñoz J, Bosch FX, de Sanjosé S. ICO/IARCInformation Centre on HPV and Cancer (HPV Information Centre). Human Papillomavirus and RelatedDiseases in Indonesia. Summary Report 10 December 2018. [Date Accessed]
ICO/IARC HPV Information Centre
- iii -
Executive summary
Human papillomavirus (HPV) infection is now a well-established cause of cervical cancer and there isgrowing evidence of HPV being a relevant factor in other anogenital cancers (anus, vulva, vagina andpenis) as well as head and neck cancers. HPV types 16 and 18 are responsible for about 70% of all cer-vical cancer cases worldwide. HPV vaccines that prevent HPV 16 and 18 infections are now availableand have the potential to reduce the incidence of cervical and other anogenital cancers.This report provides key information for Indonesia on: cervical cancer; other anogenital cancers andhead and neck cancers; HPV-related statistics; factors contributing to cervical cancer; cervical cancerscreening practices; HPV vaccine introduction; and other relevant immunisation indicators. The reportis intended to strengthen the guidance for health policy implementation of primary and secondary cer-vical cancer prevention strategies in the country.
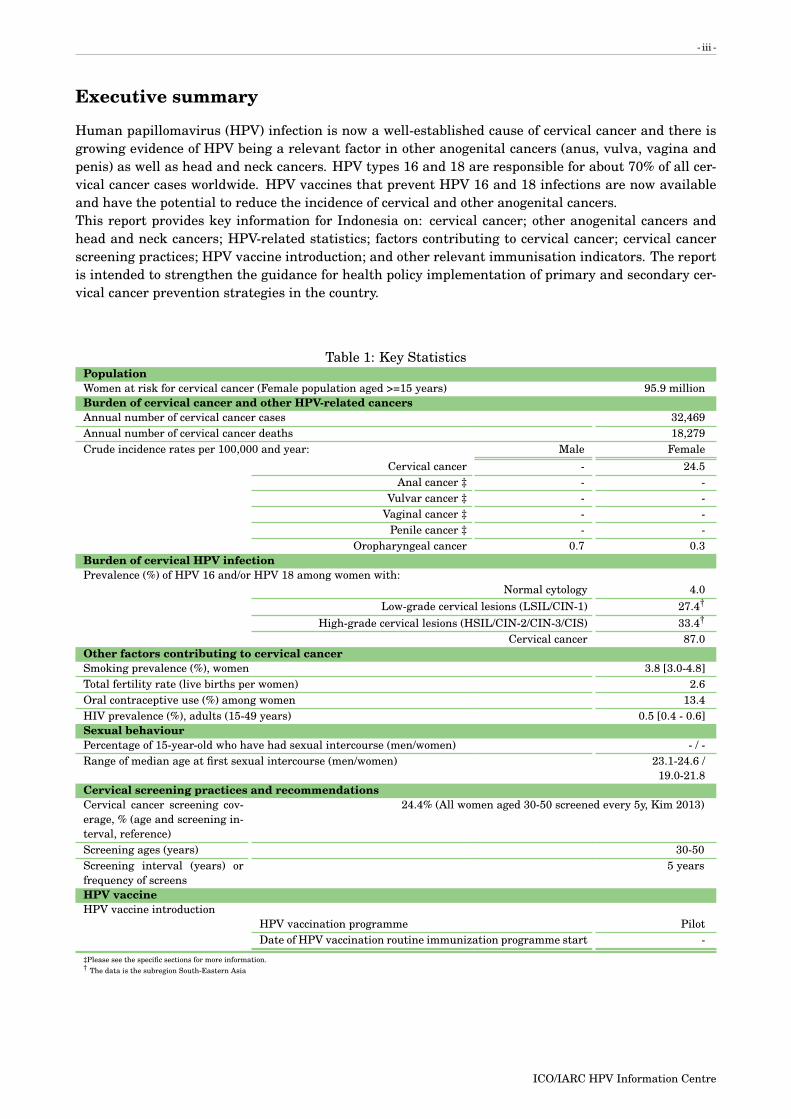
Table 1: Key StatisticsPopulationWomen at risk for cervical cancer (Female population aged >=15 years) 95.9 millionBurden of cervical cancer and other HPV-related cancersAnnual number of cervical cancer cases 32,469Annual number of cervical cancer deaths 18,279Crude incidence rates per 100,000 and year: Male Female
Cervical cancer - 24.5Anal cancer ‡ - -
Vulvar cancer ‡ - -Vaginal cancer ‡ - -
Penile cancer ‡ - -Oropharyngeal cancer 0.7 0.3
Burden of cervical HPV infectionPrevalence (%) of HPV 16 and/or HPV 18 among women with:
Normal cytology 4.0Low-grade cervical lesions (LSIL/CIN-1) 27.4†
High-grade cervical lesions (HSIL/CIN-2/CIN-3/CIS) 33.4†
Cervical cancer 87.0Other factors contributing to cervical cancerSmoking prevalence (%), women 3.8 [3.0-4.8]Total fertility rate (live births per women) 2.6Oral contraceptive use (%) among women 13.4HIV prevalence (%), adults (15-49 years) 0.5 [0.4 - 0.6]Sexual behaviourPercentage of 15-year-old who have had sexual intercourse (men/women) - / -Range of median age at first sexual intercourse (men/women) 23.1-24.6 /
19.0-21.8Cervical screening practices and recommendationsCervical cancer screening cov-erage, % (age and screening in-terval, reference)
24.4% (All women aged 30-50 screened every 5y, Kim 2013)
Screening ages (years) 30-50Screening interval (years) orfrequency of screens
5 years
HPV vaccineHPV vaccine introduction
HPV vaccination programme PilotDate of HPV vaccination routine immunization programme start -
‡Please see the specific sections for more information.† The data is the subregion South-Eastern Asia
ICO/IARC HPV Information Centre

CONTENTS - iv -
Contents
Executive summary iii
1 Introduction 2
2 Demographic and socioeconomic factors 4
3 Burden of HPV related cancers 63.1 Cervical cancer . . . . . . . . . . . . . . . . . . . . . . . . . . . . . . . . . . . . . . . . . . . . . . 6
3.1.1 Cervical cancer incidence in Indonesia . . . . . . . . . . . . . . . . . . . . . . . . . . . . 63.1.2 Cervical cancer incidence by histology in Indonesia . . . . . . . . . . . . . . . . . . . . 103.1.3 Cervical cancer incidence in Indonesia across South-Eastern Asia . . . . . . . . . . . 123.1.4 Cervical cancer mortality in Indonesia . . . . . . . . . . . . . . . . . . . . . . . . . . . . 143.1.5 Cervical cancer mortality in Indonesia across South-Eastern Asia . . . . . . . . . . . 183.1.6 Cervical cancer incidence and mortality comparison, Premature deaths and dis-
ability in Indonesia . . . . . . . . . . . . . . . . . . . . . . . . . . . . . . . . . . . . . . . 203.2 Anogenital cancers other than the cervix . . . . . . . . . . . . . . . . . . . . . . . . . . . . . . 22
3.2.1 Anal cancer . . . . . . . . . . . . . . . . . . . . . . . . . . . . . . . . . . . . . . . . . . . . 223.2.2 Vulvar cancer . . . . . . . . . . . . . . . . . . . . . . . . . . . . . . . . . . . . . . . . . . . 243.2.3 Vaginal cancer . . . . . . . . . . . . . . . . . . . . . . . . . . . . . . . . . . . . . . . . . . 253.2.4 Penile cancer . . . . . . . . . . . . . . . . . . . . . . . . . . . . . . . . . . . . . . . . . . . 26
3.3 Head and neck cancers . . . . . . . . . . . . . . . . . . . . . . . . . . . . . . . . . . . . . . . . . 273.3.1 Oropharyngeal cancer . . . . . . . . . . . . . . . . . . . . . . . . . . . . . . . . . . . . . . 27
4 HPV related statistics 304.1 HPV burden in women with normal cervical cytology, cervical precancerous lesions or
invasive cervical cancer . . . . . . . . . . . . . . . . . . . . . . . . . . . . . . . . . . . . . . . . . 304.1.1 HPV prevalence in women with normal cervical cytology . . . . . . . . . . . . . . . . 314.1.2 HPV type distribution among women with normal cervical cytology, precancerous
cervical lesions and cervical cancer . . . . . . . . . . . . . . . . . . . . . . . . . . . . . . 324.1.3 HPV type distribution among HIV+ women with normal cervical cytology . . . . . . 414.1.4 Terminology . . . . . . . . . . . . . . . . . . . . . . . . . . . . . . . . . . . . . . . . . . . . 42
4.2 HPV burden in anogenital cancers other than cervix . . . . . . . . . . . . . . . . . . . . . . . 434.2.1 Anal cancer and precancerous anal lesions . . . . . . . . . . . . . . . . . . . . . . . . . 434.2.2 Vulvar cancer and precancerous vulvar lesions . . . . . . . . . . . . . . . . . . . . . . . 454.2.3 Vaginal cancer and precancerous vaginal lesions . . . . . . . . . . . . . . . . . . . . . 474.2.4 Penile cancer and precancerous penile lesions . . . . . . . . . . . . . . . . . . . . . . . 49
4.3 HPV burden in men . . . . . . . . . . . . . . . . . . . . . . . . . . . . . . . . . . . . . . . . . . . 514.4 HPV burden in the head and neck . . . . . . . . . . . . . . . . . . . . . . . . . . . . . . . . . . 52
4.4.1 Burden of oral HPV infection in healthy population . . . . . . . . . . . . . . . . . . . . 524.4.2 HPV burden in head and neck cancers . . . . . . . . . . . . . . . . . . . . . . . . . . . . 52
5 Factors contributing to cervical cancer 54
6 Sexual and reproductive health behaviour indicators 56
7 HPV preventive strategies 587.1 Cervical cancer screening practices . . . . . . . . . . . . . . . . . . . . . . . . . . . . . . . . . . 587.2 HPV vaccination . . . . . . . . . . . . . . . . . . . . . . . . . . . . . . . . . . . . . . . . . . . . . 61
8 Protective factors for cervical cancer 61
ICO/IARC HPV Information Centre

LIST OF CONTENTS - v -
9 Indicators related to immunisation practices other than HPV vaccines 639.1 Immunisation schedule . . . . . . . . . . . . . . . . . . . . . . . . . . . . . . . . . . . . . . . . . 639.2 Immunisation coverage estimates . . . . . . . . . . . . . . . . . . . . . . . . . . . . . . . . . . . 63
10 Glossary 64
ICO/IARC HPV Information Centre

LIST OF FIGURES - vi -
List of Figures1 Indonesia and South-Eastern Asia . . . . . . . . . . . . . . . . . . . . . . . . . . . . . . . . . . . . . . . . . . . . . . . 22 Population pyramid of Indonesia for 2017 . . . . . . . . . . . . . . . . . . . . . . . . . . . . . . . . . . . . . . . . . . . 43 Population trends in four selected age groups in Indonesia . . . . . . . . . . . . . . . . . . . . . . . . . . . . . . . . . 44 HPV-related cancer incidence in Indonesia (estimates for 2012) . . . . . . . . . . . . . . . . . . . . . . . . . . . . . . 65 Comparison of cervical cancer incidence to other cancers in women of all ages in Indonesia (estimates for 2018) 76 Comparison of age-specific cervical cancer to age-specific incidence of other cancers among women 15-44 years
of age in Indonesia (estimates for 2018) . . . . . . . . . . . . . . . . . . . . . . . . . . . . . . . . . . . . . . . . . . . . 87 Annual number of cases and age-specific incidence rates of cervical cancer in Indonesia (estimates for 2018) . . 98 Time trends in cervical cancer incidence in Indonesia (cancer registry data) . . . . . . . . . . . . . . . . . . . . . . 119 Age-standardised incidence rates of cervical cancer of Indonesia (estimates for 2018) . . . . . . . . . . . . . . . . 1210 Annual number of new cases of cervical cancer by age group in Indonesia (estimates for 2018) . . . . . . . . . . . 1311 Comparison of cervical cancer mortality to other cancers in women of all ages in Indonesia (estimates for 2018) 1512 Comparison of age-specific mortality rates of cervical cancer to other cancers among women 15-44 years of age
in Indonesia (estimates for 2018) . . . . . . . . . . . . . . . . . . . . . . . . . . . . . . . . . . . . . . . . . . . . . . . . 1613 Annual number of deaths and age-specific mortality rates of cervical cancer in Indonesia (estimates for 2018) . 1714 Comparison of age-standardised cervical cancer mortality rates in Indonesia and countries within the region
(estimates for 2018) . . . . . . . . . . . . . . . . . . . . . . . . . . . . . . . . . . . . . . . . . . . . . . . . . . . . . . . . 1815 Annual deaths number of cervical cancer by age group in Indonesia (estimates for 2018) . . . . . . . . . . . . . . 1916 Comparison of age-specific cervical cancer incidence and mortality rates in Indonesia (estimates for 2018) . . . . 2017 Comparison of annual premature deaths and disability from cervical cancer in Indonesia to other cancers among
women (estimates for 2008) . . . . . . . . . . . . . . . . . . . . . . . . . . . . . . . . . . . . . . . . . . . . . . . . . . . 2118 Time trends in anal cancer incidence in Indonesia (cancer registry data) . . . . . . . . . . . . . . . . . . . . . . . . 2319 Time trends in vulvar cancer incidence in Indonesia (cancer registry data) . . . . . . . . . . . . . . . . . . . . . . . 2420 Time trends in vaginal cancer incidence in Indonesia (cancer registry data) . . . . . . . . . . . . . . . . . . . . . . 2521 Time trends in penile cancer incidence in Indonesia (cancer registry data) . . . . . . . . . . . . . . . . . . . . . . . 2622 Comparison of incidence and mortality rates of the oropharynx by age group and sex in Indonesia (estimates for
2018). Includes ICD-10 codes: C09-10 . . . . . . . . . . . . . . . . . . . . . . . . . . . . . . . . . . . . . . . . . . . . . 2823 Crude age-specific HPV prevalence (%) and 95% confidence interval in women with normal cervical cytology in
Indonesia . . . . . . . . . . . . . . . . . . . . . . . . . . . . . . . . . . . . . . . . . . . . . . . . . . . . . . . . . . . . . . 3124 HPV prevalence among women with normal cervical cytology in Indonesia, by study . . . . . . . . . . . . . . . . . 3125 HPV 16 prevalence among women with normal cervical cytology in Indonesia, by study . . . . . . . . . . . . . . . 3226 HPV 16 prevalence among women with low-grade cervical lesions in Indonesia, by study . . . . . . . . . . . . . . 3227 HPV 16 prevalence among women with high-grade cervical lesions in Indonesia, by study . . . . . . . . . . . . . . 3328 HPV 16 prevalence among women with invasive cervical cancer in Indonesia, by study . . . . . . . . . . . . . . . 3329 Comparison of the ten most frequent HPV oncogenic types in Indonesia among women with and without cervical
lesions . . . . . . . . . . . . . . . . . . . . . . . . . . . . . . . . . . . . . . . . . . . . . . . . . . . . . . . . . . . . . . . . 3430 Comparison of the ten most frequent HPV oncogenic types in Indonesia among women with invasive cervical
cancer by histology . . . . . . . . . . . . . . . . . . . . . . . . . . . . . . . . . . . . . . . . . . . . . . . . . . . . . . . . . 3531 Comparison of the ten most frequent HPV types in anal cancer cases in Asia and the World . . . . . . . . . . . . 4432 Comparison of the ten most frequent HPV types in AIN 2/3 cases in Asia and the World . . . . . . . . . . . . . . . 4433 Comparison of the ten most frequent HPV types in cases of vulvar cancer in Asia and the World . . . . . . . . . . 4634 Comparison of the ten most frequent HPV types in VIN 2/3 cases in Asia and the World . . . . . . . . . . . . . . . 4635 Comparison of the ten most frequent HPV types in cases of vaginal cancer in Asia and the World . . . . . . . . . 4836 Comparison of the ten most frequent HPV types in VaIN 2/3 cases in Asia and the World . . . . . . . . . . . . . . 4837 Comparison of the ten most frequent HPV types in cases of penile cancer in Asia and the World . . . . . . . . . . 5038 Comparison of the ten most frequent HPV types in PeIN 2/3 cases in Asia and the World . . . . . . . . . . . . . . 5039 Estimated coverage of cervical cancer screening in Indonesia, by age and study . . . . . . . . . . . . . . . . . . . . 5940 Reported HPV vaccination coverage in females by birth cohort in National HPV Immunization programme in
Indonesia . . . . . . . . . . . . . . . . . . . . . . . . . . . . . . . . . . . . . . . . . . . . . . . . . . . . . . . . . . . . . . 61
ICO/IARC HPV Information Centre

LIST OF TABLES - 1 -
List of Tables1 Key Statistics . . . . . . . . . . . . . . . . . . . . . . . . . . . . . . . . . . . . . . . . . . . . . . . . . . . . . . . . . . . . iii2 Sociodemographic indicators in Indonesia . . . . . . . . . . . . . . . . . . . . . . . . . . . . . . . . . . . . . . . . . . . 53 Cervical cancer incidence in Indonesia (estimates for 2018) . . . . . . . . . . . . . . . . . . . . . . . . . . . . . . . . 74 Cervical cancer incidence in Indonesia by cancer registry . . . . . . . . . . . . . . . . . . . . . . . . . . . . . . . . . 75 Age-standardised incidence rates of cervical cancer in Indonesia by histological type and cancer registry . . . . . 106 Cervical cancer mortality in Indonesia (estimates for 2018) . . . . . . . . . . . . . . . . . . . . . . . . . . . . . . . . 147 Premature deaths and disability from cervical cancer in Indonesia, South-Eastern Asia and the rest of the world
(estimates for 2008) . . . . . . . . . . . . . . . . . . . . . . . . . . . . . . . . . . . . . . . . . . . . . . . . . . . . . . . . 208 Anal cancer incidence in Indonesia by cancer registry and sex . . . . . . . . . . . . . . . . . . . . . . . . . . . . . . . 229 Vulvar cancer incidence in Indonesia by cancer registry . . . . . . . . . . . . . . . . . . . . . . . . . . . . . . . . . . 2410 Vaginal cancer incidence in Indonesia by cancer registry . . . . . . . . . . . . . . . . . . . . . . . . . . . . . . . . . . 2511 Penile cancer incidence in Indonesia by cancer registry . . . . . . . . . . . . . . . . . . . . . . . . . . . . . . . . . . . 2612 Incidence and mortality of cancer of the oropharynx in Indonesia, South-Eastern Asia and the rest of the world
by sex (estimates for 2018). Includes ICD-10 codes: C09-10 . . . . . . . . . . . . . . . . . . . . . . . . . . . . . . . . 2713 Incidence of oropharyngeal cancer in Indonesia by cancer registry and sex . . . . . . . . . . . . . . . . . . . . . . . 2914 Prevalence of HPV16 and HPV18 by cytology in Indonesia . . . . . . . . . . . . . . . . . . . . . . . . . . . . . . . . . 3215 Type-specific HPV prevalence in women with normal cervical cytology, precancerous cervical lesions and invasive
cervical cancer in Indonesia . . . . . . . . . . . . . . . . . . . . . . . . . . . . . . . . . . . . . . . . . . . . . . . . . . . 3716 Type-specific HPV prevalence among invasive cervical cancer cases in Indonesia by histology . . . . . . . . . . . 3917 Studies on HPV prevalence among HIV women with normal cytology in Indonesia . . . . . . . . . . . . . . . . . . 4118 Studies on HPV prevalence among anal cancer cases in Indonesia (male and female) . . . . . . . . . . . . . . . . . 4319 Studies on HPV prevalence among cases of AIN2/3 in Indonesia . . . . . . . . . . . . . . . . . . . . . . . . . . . . . 4320 Studies on HPV prevalence among vulvar cancer cases in Indonesia . . . . . . . . . . . . . . . . . . . . . . . . . . . 4521 Studies on HPV prevalence among VIN 2/3 cases in Indonesia . . . . . . . . . . . . . . . . . . . . . . . . . . . . . . 4522 Studies on HPV prevalence among vaginal cancer cases in Indonesia . . . . . . . . . . . . . . . . . . . . . . . . . . 4723 Studies on HPV prevalence among VaIN 2/3 cases in Indonesia . . . . . . . . . . . . . . . . . . . . . . . . . . . . . . 4724 Studies on HPV prevalence among penile cancer cases in Indonesia . . . . . . . . . . . . . . . . . . . . . . . . . . . 4925 Studies on HPV prevalence among PeIN 2/3 cases in Indonesia . . . . . . . . . . . . . . . . . . . . . . . . . . . . . . 4926 Studies on HPV prevalence among men in Indonesia . . . . . . . . . . . . . . . . . . . . . . . . . . . . . . . . . . . . 5127 Studies on HPV prevalence among men from special subgroups in Indonesia . . . . . . . . . . . . . . . . . . . . . . 5128 Studies on oral HPV prevalence among healthy in Indonesia . . . . . . . . . . . . . . . . . . . . . . . . . . . . . . . 5229 Studies on HPV prevalence among cases of oral cavity cancer in Indonesia . . . . . . . . . . . . . . . . . . . . . . . 5230 Studies on HPV prevalence among cases of oropharyngeal cancer in Indonesia . . . . . . . . . . . . . . . . . . . . 5331 Studies on HPV prevalence among cases of hypopharyngeal or laryngeal cancer in Indonesia . . . . . . . . . . . . 5332 Factors contributing to cervical carcinogenesis (cofactors) in Indonesia . . . . . . . . . . . . . . . . . . . . . . . . . 5433 Percentage of 15-year-olds who have had sexual intercourse in Indonesia . . . . . . . . . . . . . . . . . . . . . . . . 5634 Median age at first sex in Indonesia . . . . . . . . . . . . . . . . . . . . . . . . . . . . . . . . . . . . . . . . . . . . . . 5635 Marriage patterns in Indonesia . . . . . . . . . . . . . . . . . . . . . . . . . . . . . . . . . . . . . . . . . . . . . . . . . 5636 Main characteristics of cervical cancer screening in Indonesia . . . . . . . . . . . . . . . . . . . . . . . . . . . . . . . 5837 Estimated coverage of cervical cancer screening in Indonesia . . . . . . . . . . . . . . . . . . . . . . . . . . . . . . . 5938 Estimated coverage of cervical cancer screening in Indonesia , by region . . . . . . . . . . . . . . . . . . . . . . . . 5939 National HPV Immunization programme in Indonesia . . . . . . . . . . . . . . . . . . . . . . . . . . . . . . . . . . . 6140 Prevalence of male circumcision in Indonesia . . . . . . . . . . . . . . . . . . . . . . . . . . . . . . . . . . . . . . . . . 6241 Prevalence of condom use in Indonesia . . . . . . . . . . . . . . . . . . . . . . . . . . . . . . . . . . . . . . . . . . . . . 6242 General immunization schedule in Indonesia . . . . . . . . . . . . . . . . . . . . . . . . . . . . . . . . . . . . . . . . . 6343 Immunization coverage estimates in Indonesia . . . . . . . . . . . . . . . . . . . . . . . . . . . . . . . . . . . . . . . . 6344 Glossary . . . . . . . . . . . . . . . . . . . . . . . . . . . . . . . . . . . . . . . . . . . . . . . . . . . . . . . . . . . . . . . 64
ICO/IARC HPV Information Centre
1 INTRODUCTION - 2 -
1 Introduction
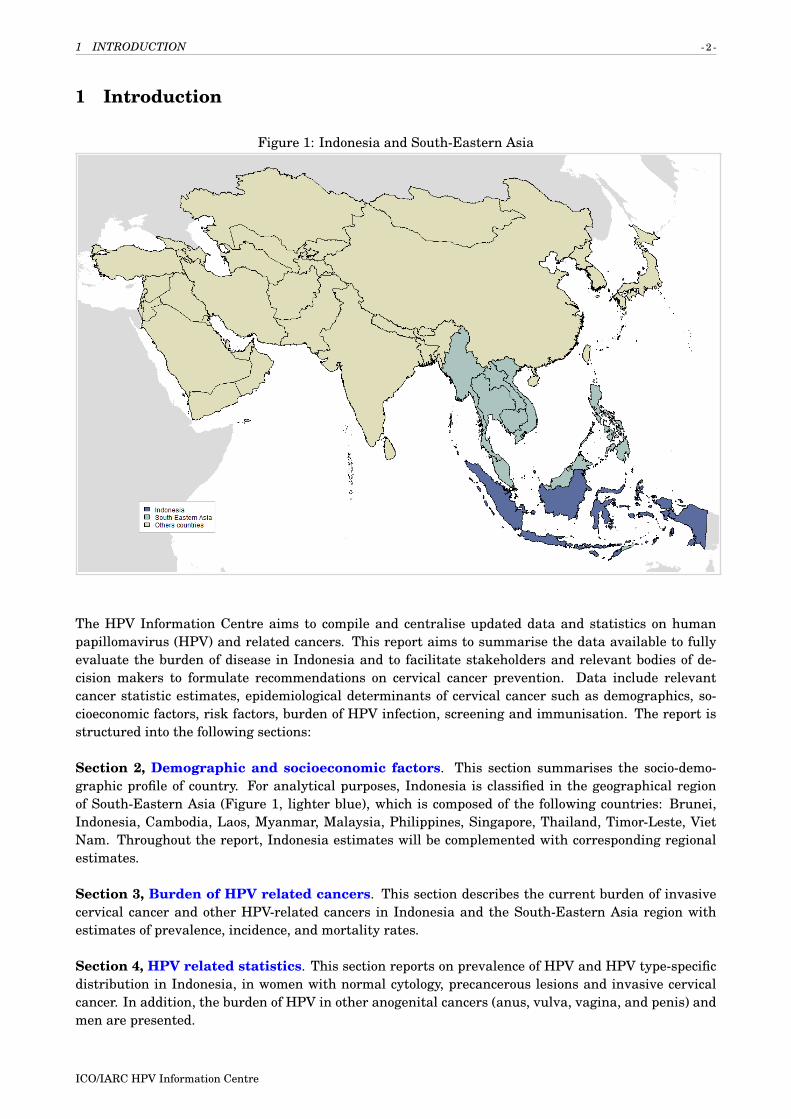
Figure 1: Indonesia and South-Eastern Asia
The HPV Information Centre aims to compile and centralise updated data and statistics on humanpapillomavirus (HPV) and related cancers. This report aims to summarise the data available to fullyevaluate the burden of disease in Indonesia and to facilitate stakeholders and relevant bodies of de-cision makers to formulate recommendations on cervical cancer prevention. Data include relevantcancer statistic estimates, epidemiological determinants of cervical cancer such as demographics, so-cioeconomic factors, risk factors, burden of HPV infection, screening and immunisation. The report isstructured into the following sections:
Section 2, Demographic and socioeconomic factors. This section summarises the socio-demo-graphic profile of country. For analytical purposes, Indonesia is classified in the geographical regionof South-Eastern Asia (Figure 1, lighter blue), which is composed of the following countries: Brunei,Indonesia, Cambodia, Laos, Myanmar, Malaysia, Philippines, Singapore, Thailand, Timor-Leste, VietNam. Throughout the report, Indonesia estimates will be complemented with corresponding regionalestimates.
Section 3, Burden of HPV related cancers. This section describes the current burden of invasivecervical cancer and other HPV-related cancers in Indonesia and the South-Eastern Asia region withestimates of prevalence, incidence, and mortality rates.
Section 4, HPV related statistics. This section reports on prevalence of HPV and HPV type-specificdistribution in Indonesia, in women with normal cytology, precancerous lesions and invasive cervicalcancer. In addition, the burden of HPV in other anogenital cancers (anus, vulva, vagina, and penis) andmen are presented.
ICO/IARC HPV Information Centre

1 INTRODUCTION - 3 -
Section 5, Factors contributing to cervical cancer. This section describes factors that can modifythe natural history of HPV and cervical carcinogenesis such as smoking, parity, oral contraceptive use,and co-infection with HIV.
Section 6, Sexual and reproductive health behaviour indicators. This section presents sexualand reproductive behaviour indicators that may be used as proxy measures of risk for HPV infectionand anogenital cancers.
Section 7, HPV preventive strategies. This section presents preventive strategies that include ba-sic characteristics and performance of cervical cancer screening status, status of HPV vaccine licensureintroduction, and recommendations in national immunisation programmes.
Section 8, Protective factors for cervical cancer. This section presents the prevalence of malecircumcision and condom use.
Section 9, Indicators related to immunisation practices other than HPV vaccines. This sectionpresents data on immunisation coverage and practices for selected vaccines. This information will berelevant for assessing the country’s capacity to introduce and implement the new vaccines. The data areperiodically updated and posted on the WHO immunisation surveillance, assessment and monitoringwebsite at http://www.who.int/immunization_monitoring/en/.
ICO/IARC HPV Information Centre
2 DEMOGRAPHIC AND SOCIOECONOMIC FACTORS - 4 -
2 Demographic and socioeconomic factors
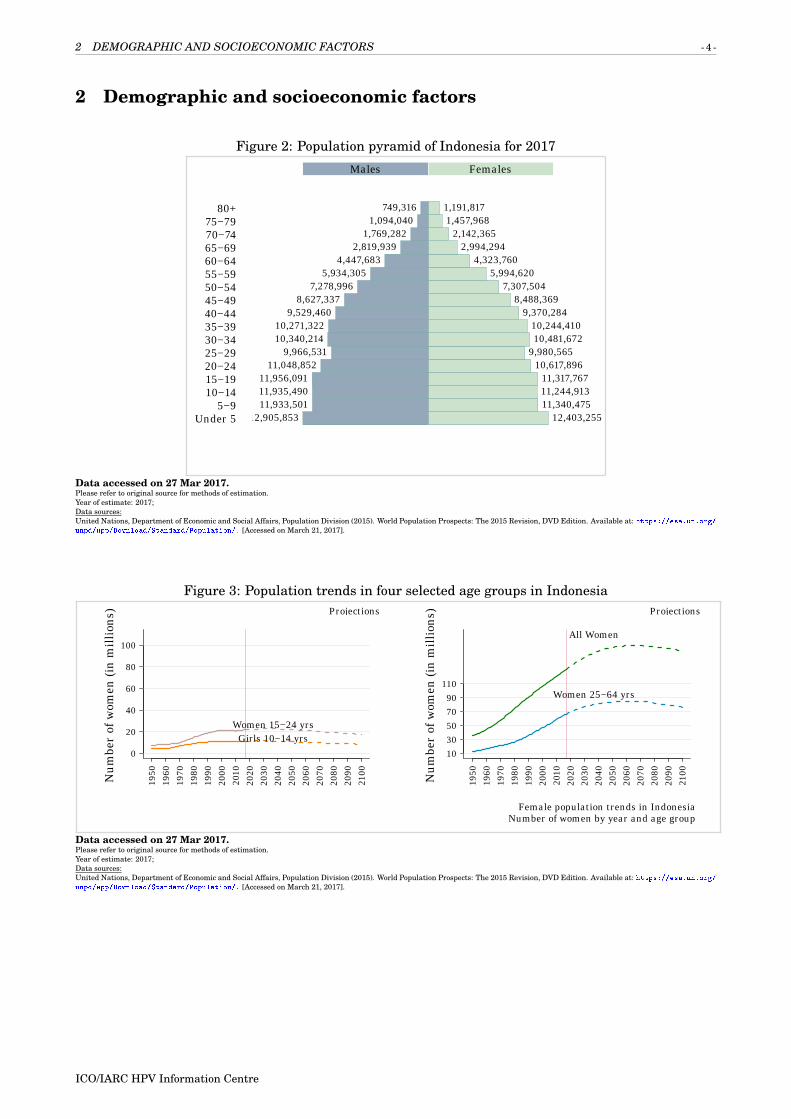
Figure 2: Population pyramid of Indonesia for 2017
Under 55−9
10−1415−1920−2425−2930−3435−3940−4445−4950−5455−5960−6465−6970−7475−79
80+
12,905,853 12,403,25511,933,501 11,340,47511,935,490 11,244,91311,956,091 11,317,767
11,048,852 10,617,8969,966,531 9,980,565
10,340,214 10,481,67210,271,322 10,244,410
9,529,460 9,370,2848,627,337 8,488,369
7,278,996 7,307,5045,934,305 5,994,620
4,447,683 4,323,7602,819,939 2,994,294
1,769,282 2,142,3651,094,040 1,457,968
749,316 1,191,817
Males Females
Data accessed on 27 Mar 2017.Please refer to original source for methods of estimation.Year of estimate: 2017;Data sources:United Nations, Department of Economic and Social Affairs, Population Division (2015). World Population Prospects: The 2015 Revision, DVD Edition. Available at: https://esa.un.org/unpd/wpp/Download/Standard/Population/. [Accessed on March 21, 2017].
Figure 3: Population trends in four selected age groups in IndonesiaProjections
1950
1960
1970
1980
1990
2000
2010
2020
2030
2040
2050
2060
2070
2080
2090
2100
0
20
40
60
80
100
Num
ber
of w
omen
(in
mill
ions
)
Girls 10−14 yrsWomen 15−24 yrs
Female population trends in IndonesiaNumber of women by year and age group
Projections
1950
1960
1970
1980
1990
2000
2010
2020
2030
2040
2050
2060
2070
2080
2090
2100
1030507090
110
Num
ber
of w
omen
(in
mill
ions
)
Women 25−64 yrs
All Women
Data accessed on 27 Mar 2017.Please refer to original source for methods of estimation.Year of estimate: 2017;Data sources:United Nations, Department of Economic and Social Affairs, Population Division (2015). World Population Prospects: The 2015 Revision, DVD Edition. Available at: https://esa.un.org/unpd/wpp/Download/Standard/Population/. [Accessed on March 21, 2017].
ICO/IARC HPV Information Centre

2 DEMOGRAPHIC AND SOCIOECONOMIC FACTORS - 5 -
Table 2: Sociodemographic indicators in IndonesiaIndicator Male Female TotalPopulation in thousands1,± 132,608.2 130,901.9 263,510.1
Population growth rate (%)1,∓ - - 1.3
Median age of the population (in years)1,∗ - - 28.4
Population living in urban areas (%)2,∗ - - 53.7
Crude birth rate (births per 1,000)1,∓ - - 20.5
Crude death rate (deaths per 1,000)1,∓ - - 7.2
Life expectancy at birth (in years)3,a,b,∗ 67.1 71.2 69.1
Adult mortality rate (probability of dying between 15 and 60 years oldper 1,000)4,∗
204 147 176
Maternal mortality ratio (per 100,000 live births)3,c,∗ - - 126
Under age five mortality rate (per 1,000 live births)3,d,∗ - - 27.2
Density of physicians (per 1,000 population)5,e,? - - 0.201
Gross national income per capita (PPP current international $)6, f ,∗ - - 10700
Adult literacy rate (%) (aged 15 and older)7,g,∗ 97.1 93.8 95.4
Youth literacy rate (%) (aged 15-24 years)7,g,∗ 99.7 99.7 99.7
Net primary school enrollment ratio7,g,◦ 90.2 89.2 89.7
Net secondary school enrollment ratio7,◦ 75.3 74.7 75Data accessed on 27 Mar 2017.Please refer to original source for methods of estimation.aWorld Population Prospects, the 2015 revision (WPP2015). New York (NY): United Nations DESA, Population Division.bWHO annual life tables for 1985–2015 based on the WPP2015, on the data held in the WHO Mortality Database and on HIV mortality estimates prepared by UNAIDS. WHO MemberStates with a population of less than 90 000 in 2015 were not included in the analysis.cWHO, UNICEF, UNFPA, World Bank Group and the United Nations Population Division. Trends in maternal mortality: 1990 to 2015. Estimates by WHO, UNICEF, UNFPA,World Bank Group and the United Nations Population Division. Geneva: World Health Organization; 2015 (http://www.who.int/reproductivehealth/publications/monitoring/maternal-mortality-2015/en/, accessed 25 March 2016). WHO Member States with a population of less than 100 000 in 2015 were not included in the analysis.dLevels & Trends in Child Mortality. Report 2015. Estimates Developed by the UN Inter-agency Group for Child Mortality Estimation. New York (NY), Geneva and Washington (DC):United Nations Children’s Fund, World Health Organization, World Bank and United Nations; 2015 (http://www.unicef.org/publications/files/Child_Mortality_Report_2015_Web_9_Sept_15.pdf, accessed 26 March 2016).eNumber of medical doctors (physicians), including generalist and specialist medical practitioners, per 1 000 population.f GNI per capita based on purchasing power parity (PPP). PPP GNI is gross national income (GNI) converted to international dollars using purchasing power parity rates. An internationaldollar has the same purchasing power over GNI as a U.S. dollar has in the United States. GNI is the sum of value added by all resident producers plus any product taxes (less subsidies)not included in the valuation of output plus net receipts of primary income (compensation of employees and property income) from abroad. Data are in current international dollars basedon the 2011 ICP round.gUIS EstimationYear of estimate: ±2017; ∓2010-2015; ∗2015; ?2012; ◦2014;Data sources:1United Nations, Department of Economic and Social Affairs, Population Division (2015). World Population Prospects: The 2015 Revision, DVD Edition. Available at: https://esa.un.org/unpd/wpp/Download/Standard/Population/. [Accessed on March 21, 2017].2United Nations, Department of Economic and Social Affairs, Population Division (2014). World Urbanization Prospects: The 2014 Revision, CD-ROM Edition. Available at: https://esa.un.org/unpd/wup/CD-ROM/. [Accessed on March 21, 2017].3World Health Statistics 2016. Geneva, World Health Organization, 2016. Available at: http://who.int/entity/gho/publications/world_health_statistics/2016/en/index.html. [Accessed on March 21, 2017].4World Health Organization. Global Health Observatory data repository. Available at: http://apps.who.int/gho/data/view.main.1360?lang=en. [Accessed on March 21, 2017].5The 2016 update, Global Health Workforce Statistics, World Health Organization, Geneva (http://www.who.int/hrh/statistics/hwfstats/). [Accessed on March 21, 2017].6World Bank, World Development Indicators Database. Washington, DC. International Comparison Program database. Available at: http://databank.worldbank.org/data/reports.aspx?source=world-development-indicators#. [Accessed on March 21, 2017].7UNESCO Institute for Statistics Data Centre [online database]. Montreal, UNESCO Institute for Statistics. Available at: http://stats.uis.unesco.org [Accessed on March 21, 2017].
ICO/IARC HPV Information Centre

3 BURDEN OF HPV RELATED CANCERS - 6 -
3 Burden of HPV related cancers
HPV is the cause of almost all cervical cancer cases and is responsible for an important fraction of otheranogenital and head and neck cancer. Here, we present the most recent estimations on the burden ofHPV-associated cancer.
Figure 4: HPV-related cancer incidence in Indonesia (estimates for 2012)
0 10 20
Head and neck (b)
Other anogenital (a)
Cervix uteri
0.1
0.5
17.3
Age−standardised incidence rate per 100,0000 womenWorld Standard
Data accessed on 08 May 2017.aOther anogenital cancer cases (vulvar, vaginal, anal, and penile).bHead and neck cancer cases (oropharynx, oral cavity and larynx).ASR: Age-standardized rate, rates per 100,000 per year.Please refer to original source for methods.GLOBOCAN quality index for availability of incidence data: Frequency data.GLOBOCAN quality index of methods for calculating incidence: Methods to estimate the sex- and age-specific incidence rates of cancer for a specific country: Estimated as the weightedaverage of the local ratesData sources:de Martel C, Plummer M, Vignat J, Franceschi S. Worldwide burden of cancer attributable to HPV by site, country and HPV type. Int J Cancer. 2017
3.1 Cervical cancer
Cancer of the cervix uteri is the 3rd most common cancer among women worldwide, with an estimated569,847 new cases and 311,365 deaths in 2018 (GLOBOCAN). The majority of cases are squamous cellcarcinoma followed by adenocarcinomas. (Vaccine 2006, Vol. 24, Suppl 3; Vaccine 2008, Vol. 26, Suppl10; Vaccine 2012, Vol. 30, Suppl 5; IARC Monographs 2007, Vol. 90)
This section describes the current burden of invasive cervical cancer in Indonesia and in comparisonto geographic region, including estimates of the annual number of new cases, deaths, incidence, andmortality rates.
3.1.1 Cervical cancer incidence in Indonesia
About 32,469 new cervical cancer cases are diagnosed annually in In-donesia (estimates for 2018).
Cervical cancer ranks* as the 2nd leading cause of female cancer inIndonesia.
Cervical cancer is the 2th most common female cancer in women aged15 to 44 years in Indonesia.
KEY STATS.
ICO/IARC HPV Information Centre

3 BURDEN OF HPV RELATED CANCERS - 7 -
* Ranking of cervical cancer incidence to other cancers among all women according to highest incidence rates (ranking 1st) excluding non-melanoma skin cancer. Ranking is based on crude
incidence rates (actual number of cervical cancer cases). Ranking using age-standardized rate (ASR) may differ.
Table 3: Cervical cancer incidence in Indonesia (estimates for 2018)
Indicator Indonesia South-Eastern Asia World
Annual number of new cancer cases 32,469 62,456 569,847
Crude incidence ratea 24.5 19.0 15.1
Age-standardized incidence ratea 23.4 17.2 13.1
Cumulative risk (%) at 75 years oldb 3 2 1Data accessed on 05 Oct 2018.For more detailed methods of estimation please refer to http://gco.iarc.fr/today/data-sources-methodsaRates per 100,000 women per year.bCumulative risk (incidence) is the probability or risk of individuals getting from the disease during ages 0-74 years. For cancer, it is expressed as the % of new born children who would beexpected to develop from a particular cancer before the age of 75 if they had the rates of cancer observed in the period in the absence of competing causes.Data sources:Ferlay J, Ervik M, Lam F, Colombet M, Mery L, Piñeros M, Znaor A, Soerjomataram I, Bray F (2018). Global Cancer Observatory: Cancer Today. Lyon, France: International Agency forResearch on Cancer. Available from: https://gco.iarc.fr/today, accessed [05 October 2018].
Table 4: Cervical cancer incidence in Indonesia by cancer registryCancer registry Period N casesa Crude rateb ASRb
No Data Available - - - -Data accessed on 05 Oct 2018.ASR: Age-standardized rate, Standardized rates have been estimated using the direct method and the World population as the reference;Please refer to original source (available at http://ci5.iarc.fr/CI5-XI/Default.aspx)aAccumulated number of cases during the period in the population covered by the corresponding registry.bRates per 100,000 women per year.
Figure 5: Comparison of cervical cancer incidence to other cancers in women of all ages in Indonesia(estimates for 2018)
0 10 20 30 40 50 60
Kaposi sarcomaMesotheliomaHypopharynx
LarynxAnus
OesophagusHodgkin lymphoma
OropharynxVaginaKidney
Melanoma of skinGallbladder
StomachSalivary glands
Multiple myelomaBladder
VulvaLip, oral cavity
PancreasBrain, nervous system
NasopharynxLiver
RectumNon−Hodgkin lymphoma
LeukaemiaColon
Corpus uteriLung
ThyroidOvary
Cervix uteriBreast
0.00.00.10.20.20.20.20.30.30.40.50.50.50.60.70.80.91.51.51.6
3.03.23.53.63.94.55.15.75.9
10.024.5
44.0
Annual crude incidence rate per 100,000Indonesia: Female (All ages)
ICO/IARC HPV Information Centre
3 BURDEN OF HPV RELATED CANCERS - 8 -
Data accessed on 07 Oct 2018.Non-melanoma skin cancer is not included.Rates per 100,000 women per year.Data sources:Ferlay J, Ervik M, Lam F, Colombet M, Mery L, Piñeros M, Znaor A, Soerjomataram I, Bray F (2018). Global Cancer Observatory: Cancer Today. Lyon, France: International Agency forResearch on Cancer. Available from: https://gco.iarc.fr/today, accessed [05 October 2018].
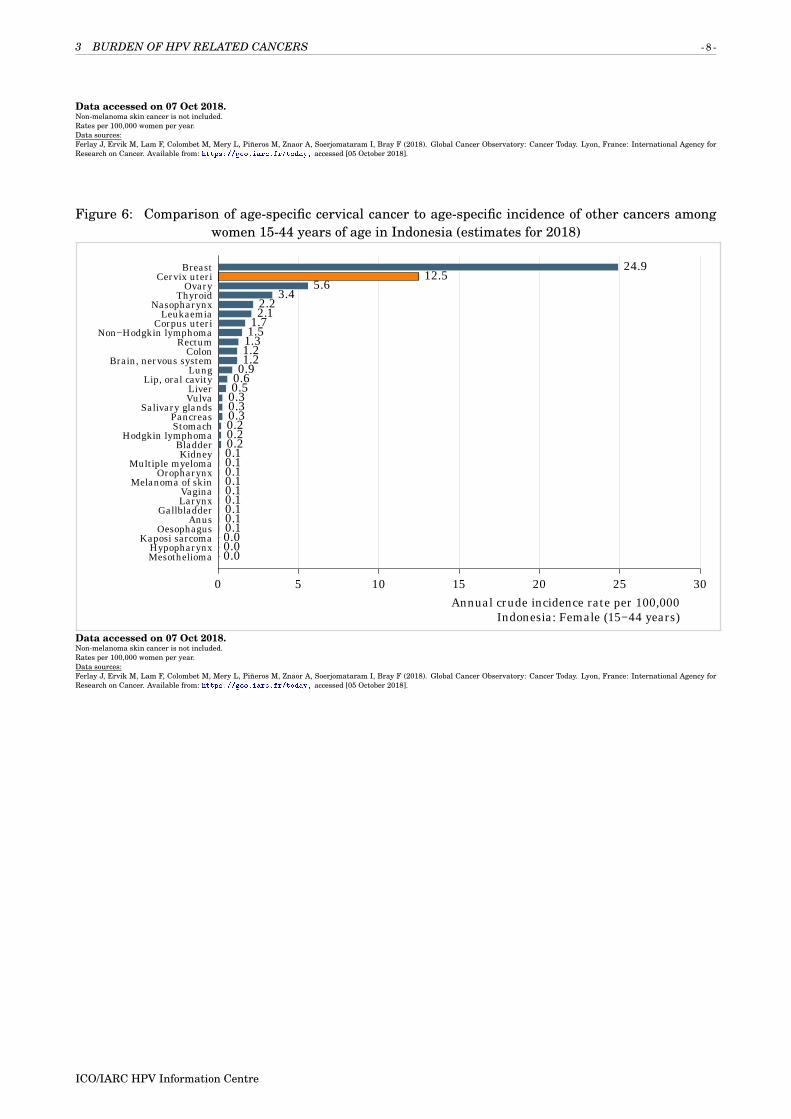
Figure 6: Comparison of age-specific cervical cancer to age-specific incidence of other cancers amongwomen 15-44 years of age in Indonesia (estimates for 2018)
0 5 10 15 20 25 30
MesotheliomaHypopharynx
Kaposi sarcomaOesophagus
AnusGallbladder
LarynxVagina
Melanoma of skinOropharynx
Multiple myelomaKidney
BladderHodgkin lymphoma
StomachPancreas
Salivary glandsVulvaLiver
Lip, oral cavityLung
Brain, nervous systemColon
RectumNon−Hodgkin lymphoma
Corpus uteriLeukaemia
NasopharynxThyroid
OvaryCervix uteri
Breast
0.00.00.00.10.10.10.10.10.10.10.10.10.20.20.20.30.30.30.50.60.91.21.21.31.51.72.12.2
3.45.6
12.524.9
Annual crude incidence rate per 100,000Indonesia: Female (15−44 years)
Data accessed on 07 Oct 2018.Non-melanoma skin cancer is not included.Rates per 100,000 women per year.Data sources:Ferlay J, Ervik M, Lam F, Colombet M, Mery L, Piñeros M, Znaor A, Soerjomataram I, Bray F (2018). Global Cancer Observatory: Cancer Today. Lyon, France: International Agency forResearch on Cancer. Available from: https://gco.iarc.fr/today, accessed [05 October 2018].
ICO/IARC HPV Information Centre

3 BURDEN OF HPV RELATED CANCERS - 9 -
Figure 7: Annual number of cases and age-specific incidence rates of cervical cancer in Indonesia (esti-mates for 2018)
Ann
ual n
umbe
r of
new
cas
es o
f cer
vica
l can
cer
● ●
●
●
●
●
●
●
●●
●
●
●
0
15
30
45
60
75
Age
−spe
cifi
c ra
tes
ofce
rvic
al c
ance
r
15−1
9
20−2
4
25−2
9
30−3
4
35−3
9
40−4
4
45−4
9
50−5
4
55−5
9
60−6
4
65−6
9
70−7
4
75+
15−39 40−64 65+
0
5000
10000
15000
20000
56724270*
22436
40−44 yrs: 3574 cases
45−49 yrs: 4758 cases
50−54 yrs: 5294 cases
55−59 yrs: 4942 cases
60−64 yrs: 3868 cases
Age group (years)
*15-19 yrs: 24 cases. 20-24 yrs: 35 cases. 25-29 yrs: 496 cases. 30-34 yrs: 1277 cases. 35-39 yrs: 2438 cases.Data accessed on 05 Oct 2018.Rates per 100,000 women per year.Data sources:Ferlay J, Ervik M, Lam F, Colombet M, Mery L, Piñeros M, Znaor A, Soerjomataram I, Bray F (2018). Global Cancer Observatory: Cancer Today. Lyon, France: International Agency forResearch on Cancer. Available from: https://gco.iarc.fr/today, accessed [05 October 2018].
ICO/IARC HPV Information Centre

3 BURDEN OF HPV RELATED CANCERS - 10 -
3.1.2 Cervical cancer incidence by histology in Indonesia
Table 5: Age-standardised incidence rates of cervical cancer in Indonesia by histological type and cancerregistry
CarcinomaCancer registry Period Squamous Adeno Other Unspec.
No data available - - - - -Data accessed on 05 Oct 2018.Adeno: adenocarcinoma; Other: Other carcinoma; Squamous: Squamous cell carcinoma; Unspec: Unspecified carcinoma;Rates per 100,000 women per year.Standarized rates have been estimated using the direct method and the World population as the references.
ICO/IARC HPV Information Centre

3 BURDEN OF HPV RELATED CANCERS - 11 -
Figure 8: Time trends in cervical cancer incidence in Indonesia (cancer registry data)
Cervix uteri
No data available
Ann
ual c
rude
inci
denc
e ra
te
(per
100
,000
)
1975
1980
1985
1990
1995
Cervix uteri: Squamous cell carcinoma
No data available
Ann
ual c
rude
inci
denc
e ra
te
(per
100
,000
)
1975
1980
1985
1990
1995
1975
1980
1985
1990
1995
Cervix uteri: Adenocarcinoma
No data available
Ann
ual c
rude
inci
denc
e ra
te
(per
100
,000
)
1975
1980
1985
1990
1995
1975
1980
1985
1990
1995
All ages (2)
15−44 yrs (2)
45−74 yrs (2)
All ages (2)
15−44 yrs (2)
45−74 yrs (2)
All ages (2)
15−44 yrs (2)
45−74 yrs (2)
Data accessed on 27 Apr 2015.aEstimated annual percentage change based on the trend variable from the net drift for the most recent two 5-year periods.Data sources:1Vaccarella S, Lortet-Tieulent J, Plummer M, Franceschi S, Bray F. Worldwide trends in cervical cancer incidence: Impact of screening against changes in disease risk factors. eur J Cancer2013;49:3262-73.2Ferlay J, Bray F, Steliarova-Foucher E and Forman D. Cancer Incidence in Five Continents, CI5plus: IARC CancerBase No. 9 [Internet]. Lyon, France: International Agency for Researchon Cancer; 2014. Available from: http://ci5.iarc.fr
ICO/IARC HPV Information Centre

3 BURDEN OF HPV RELATED CANCERS - 12 -
3.1.3 Cervical cancer incidence in Indonesia across South-Eastern Asia
Figure 9: Age-standardised incidence rates of cervical cancer of Indonesia (estimates for 2018)
0 5 10 15 20 25 30
Viet Nam
Singapore
Malaysia
Laos
Timor−Leste
Cambodia
Philippines
Thailand
Brunei
Myanmar
Indonesia
7.1
7.7
10.5
11.4
12.5
13.5
14.9
16.2
20.6
21.5
23.4
Cervical cancer: Age−standardised incidence rate per 100,000 womenWorld Standard. Female (All ages)
Data accessed on 05 Oct 2018.Rates per 100,000 women per year.Data sources:Ferlay J, Ervik M, Lam F, Colombet M, Mery L, Piñeros M, Znaor A, Soerjomataram I, Bray F (2018). Global Cancer Observatory: Cancer Today. Lyon, France: International Agency forResearch on Cancer. Available from: https://gco.iarc.fr/today, accessed [05 October 2018].
ICO/IARC HPV Information Centre

3 BURDEN OF HPV RELATED CANCERS - 13 -
Figure 10: Annual number of new cases of cervical cancer by age group in Indonesia (estimates for2018)
Indonesia
15−19 20−24 25−29 30−34 35−39 40−44 45−49 50−54 55−59 60−64 65−69 70−74 >=750
1500
3000
4500
6000
7500
9000
* *496
1243 1277
28292438
4922
3574
6989
4758
8899
5294
9635
4942
8809
3868
7015
2439
4755
1579
3127
1654
3903
Age group (years)
Ann
ual n
umbe
r of
new
cas
es o
f cer
vica
l can
cer
South−Eastern Asia
*24 cases for Indonesia and 45 cases for South-Eastern Asia in the 15-19 age group. 35 cases for Indonesia and 191 cases for South-Eastern Asia in the 20-24 age group.Data accessed on 05 Oct 2018.Data sources:Ferlay J, Ervik M, Lam F, Colombet M, Mery L, Piñeros M, Znaor A, Soerjomataram I, Bray F (2018). Global Cancer Observatory: Cancer Today. Lyon, France: International Agency forResearch on Cancer. Available from: https://gco.iarc.fr/today, accessed [05 October 2018].
ICO/IARC HPV Information Centre

3 BURDEN OF HPV RELATED CANCERS - 14 -
3.1.4 Cervical cancer mortality in Indonesia
About 18,279 cervical cancer deaths occur annually in Indonesia(estimates for 2018).
Cervical cancer ranks* as the 2nd leading cause of female cancer deathsin Indonesia.
Cervical cancer is the 2nd leading cause of cancer deaths in womenaged 15 to 44 years in Indonesia.
KEY STATS.
* Ranking of cervical cancer incidence to other cancers among all women according to highest incidence rates (ranking 1st) excluding non-melanoma skin cancer. Ranking is based on crude
incidence rates (actual number of cervical cancer cases). Ranking using age-standardized rate (ASR) may differ.
Table 6: Cervical cancer mortality in Indonesia (estimates for 2018)
Indicator Indonesia South-Eastern Asia World
Annual number of deaths 18,279 35,738 311,365
Crude mortality ratea 13.8 10.9 8.2
Age-standardized mortality ratea 13.9 10.0 6.9
Cumulative risk (%) at 75 years oldb 1.6 1.2 0.8Data accessed on 05 Oct 2018.For more detailed methods of estimation please refer to http://gco.iarc.fr/today/data-sources-methodsaRates per 100,000 women per year.bCumulative risk (mortality) is the probability or risk of individuals dying from the disease during ages 0-74 years. For cancer, it is expressed as the % of new born children who would beexpected to die from a particular cancer before the age of 75 if they had the rates of cancer observed in the period in the absence of competing causes.Data sources:Ferlay J, Ervik M, Lam F, Colombet M, Mery L, Piñeros M, Znaor A, Soerjomataram I, Bray F (2018). Global Cancer Observatory: Cancer Today. Lyon, France: International Agency forResearch on Cancer. Available from: https://gco.iarc.fr/today, accessed [05 October 2018].
ICO/IARC HPV Information Centre

3 BURDEN OF HPV RELATED CANCERS - 15 -
Figure 11: Comparison of cervical cancer mortality to other cancers in women of all ages in Indonesia(estimates for 2018)
0 5 10 15 20 25 30
Kaposi sarcomaMesotheliomaHypopharynx
AnusLarynx
OropharynxHodgkin lymphoma
VaginaOesophagus
Salivary glandsMelanoma of skin
KidneyVulva
StomachBladder
GallbladderMultiple myeloma
Lip, oral cavityThyroid
Brain, nervous systemPancreas
RectumNasopharynxCorpus uteri
Non−Hodgkin lymphomaColonLiver
LeukaemiaLung
OvaryCervix uteri
Breast
0.00.00.00.10.10.10.10.20.20.20.20.30.30.40.40.40.60.6
1.11.21.41.61.71.82.0
2.93.13.3
4.85.9
13.817.1
Annual crude mortality rate per 100,000Indonesia: Female (All ages)
Data accessed on 07 Oct 2018.Non-melanoma skin cancer not included.aRates per 100,000 women per year.Data sources:Ferlay J, Ervik M, Lam F, Colombet M, Mery L, Piñeros M, Znaor A, Soerjomataram I, Bray F (2018). Global Cancer Observatory: Cancer Today. Lyon, France: International Agency forResearch on Cancer. Available from: https://gco.iarc.fr/today, accessed [05 October 2018].
ICO/IARC HPV Information Centre

3 BURDEN OF HPV RELATED CANCERS - 16 -
Figure 12: Comparison of age-specific mortality rates of cervical cancer to other cancers among women15-44 years of age in Indonesia (estimates for 2018)
0 5 10
Kaposi sarcomaHypopharynx
AnusOropharynxOesophagus
VaginaLarynx
Melanoma of skinMesothelioma
Hodgkin lymphomaSalivary glands
BladderGallbladder
Multiple myelomaKidney
VulvaThyroid
Lip, oral cavityPancreasStomach
Corpus uteriRectum
LiverColon
Non−Hodgkin lymphomaLung
Brain, nervous systemNasopharynx
OvaryLeukaemia
Cervix uteriBreast
0.00.00.00.00.00.00.00.00.00.10.10.10.10.10.10.10.20.20.20.20.3
0.50.50.60.60.60.70.8
1.72.1
3.65.9
Annual crude mortality rate per 100,000Indonesia: Female (15−44 years)
Data accessed on 07 Oct 2018.Non-melanoma skin cancer not included.aRates per 100,000 women per year.Data sources:Ferlay J, Ervik M, Lam F, Colombet M, Mery L, Piñeros M, Znaor A, Soerjomataram I, Bray F (2018). Global Cancer Observatory: Cancer Today. Lyon, France: International Agency forResearch on Cancer. Available from: https://gco.iarc.fr/today, accessed [05 October 2018].
ICO/IARC HPV Information Centre

3 BURDEN OF HPV RELATED CANCERS - 17 -
Figure 13: Annual number of deaths and age-specific mortality rates of cervical cancer in Indonesia(estimates for 2018)
Ann
ual n
umbe
r of
dea
ths
of c
ervi
cal c
ance
r
● ● ●●
●
●
●
●
●
●
●
●●
0
15
30
45
60
75
Age
−spe
cifi
c ra
tes
ofce
rvic
al c
ance
r
15−1
9
20−2
4
25−2
9
30−3
4
35−3
9
40−4
4
45−4
9
50−5
4
55−5
9
60−6
4
65−6
9
70−7
4
75+
15−39 40−64 65+
0
2000
4000
6000
8000
10000
12000
14000
5969
985*
11279
40−44 yrs: 1270 cases
45−49 yrs: 1941 cases
50−54 yrs: 2555 cases
55−59 yrs: 2847 cases
60−64 yrs: 2666 cases
Age group (years)
* 15-19 yrs: 12 cases. 20-24 yrs: 24 cases. 25-29 yrs: 40 cases. 30-34 yrs: 240 cases. 35-39 yrs: 669 cases.Data accessed on 05 Oct 2018.Rates per 100,000 women per year.Data sources:Ferlay J, Ervik M, Lam F, Colombet M, Mery L, Piñeros M, Znaor A, Soerjomataram I, Bray F (2018). Global Cancer Observatory: Cancer Today. Lyon, France: International Agency forResearch on Cancer. Available from: https://gco.iarc.fr/today, accessed [05 October 2018].
ICO/IARC HPV Information Centre

3 BURDEN OF HPV RELATED CANCERS - 18 -
3.1.5 Cervical cancer mortality in Indonesia across South-Eastern Asia
Figure 14: Comparison of age-standardised cervical cancer mortality rates in Indonesia and coun-tries within the region (estimates for 2018)
0 5 10 15 20
Singapore
Viet Nam
Malaysia
Brunei
Timor−Leste
Laos
Philippines
Thailand
Cambodia
Myanmar
Indonesia
3.8
4
6
6.1
6.2
7
8.8
9
10.1
13.1
13.9
Cervical cancer: Age−standardised mortality rate per 100,000 womenWorld Standard. Female (All ages)
Data accessed on 05 Oct 2018.Rates per 100,000 women per year.Data sources:Ferlay J, Ervik M, Lam F, Colombet M, Mery L, Piñeros M, Znaor A, Soerjomataram I, Bray F (2018). Global Cancer Observatory: Cancer Today. Lyon, France: International Agency forResearch on Cancer. Available from: https://gco.iarc.fr/today, accessed [05 October 2018].
ICO/IARC HPV Information Centre

3 BURDEN OF HPV RELATED CANCERS - 19 -
Figure 15: Annual deaths number of cervical cancer by age group in Indonesia (estimates for 2018)
Indonesia
15−19 20−24 25−29 30−34 35−39 40−44 45−49 50−54 55−59 60−64 65−69 70−74 >=750
1000
2000
3000
4000
5000
6000
7000
* ** 240
691 669
15451270
2654
1941
3859
2555
4817
2847
5208
2666
4927
2120
4049
1694
3154
2155
4512
Age group (years)
Ann
ual n
umbe
r of
new
cas
es o
f cer
vica
l can
cer
South−Eastern Asia
*12 cases for Indonesia and 21 cases for South-Eastern Asia in the 15-19 age group. 24 cases for Indonesia and 51 cases for South-Eastern Asia in the 20-24 age group. 40 cases for Indonesiaand 203 cases for South-Eastern Asia in the 25-29 age group.Data accessed on 05 Oct 2018.Data sources:Ferlay J, Ervik M, Lam F, Colombet M, Mery L, Piñeros M, Znaor A, Soerjomataram I, Bray F (2018). Global Cancer Observatory: Cancer Today. Lyon, France: International Agency forResearch on Cancer. Available from: https://gco.iarc.fr/today, accessed [05 October 2018].
ICO/IARC HPV Information Centre
3 BURDEN OF HPV RELATED CANCERS - 20 -
3.1.6 Cervical cancer incidence and mortality comparison, Premature deaths and disabilityin Indonesia
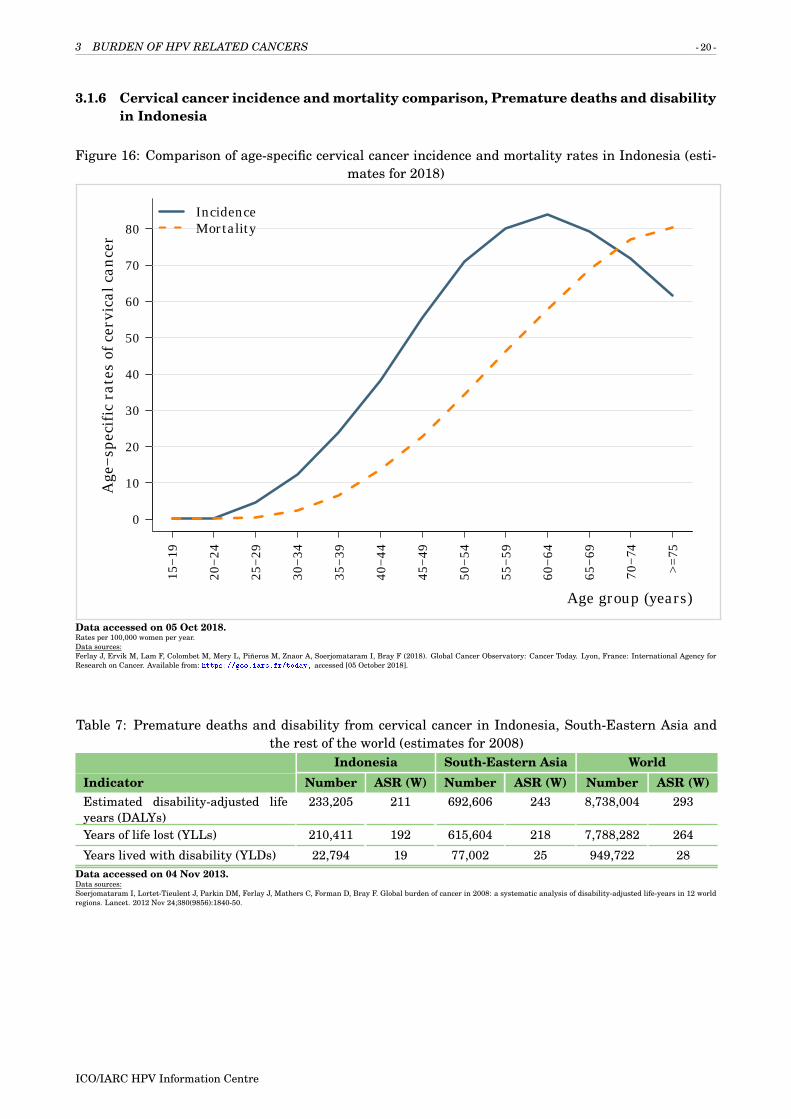
Figure 16: Comparison of age-specific cervical cancer incidence and mortality rates in Indonesia (esti-mates for 2018)
15−1
9
20−2
4
25−2
9
30−3
4
35−3
9
40−4
4
45−4
9
50−5
4
55−5
9
60−6
4
65−6
9
70−7
4
>=75
Age group (years)
0
10
20
30
40
50
60
70
80
Age
−spe
cifi
c ra
tes
of c
ervi
cal c
ance
r
IncidenceMortality
Data accessed on 05 Oct 2018.Rates per 100,000 women per year.Data sources:Ferlay J, Ervik M, Lam F, Colombet M, Mery L, Piñeros M, Znaor A, Soerjomataram I, Bray F (2018). Global Cancer Observatory: Cancer Today. Lyon, France: International Agency forResearch on Cancer. Available from: https://gco.iarc.fr/today, accessed [05 October 2018].
Table 7: Premature deaths and disability from cervical cancer in Indonesia, South-Eastern Asia andthe rest of the world (estimates for 2008)
Indonesia South-Eastern Asia WorldIndicator Number ASR (W) Number ASR (W) Number ASR (W)Estimated disability-adjusted lifeyears (DALYs)
233,205 211 692,606 243 8,738,004 293
Years of life lost (YLLs) 210,411 192 615,604 218 7,788,282 264
Years lived with disability (YLDs) 22,794 19 77,002 25 949,722 28Data accessed on 04 Nov 2013.Data sources:Soerjomataram I, Lortet-Tieulent J, Parkin DM, Ferlay J, Mathers C, Forman D, Bray F. Global burden of cancer in 2008: a systematic analysis of disability-adjusted life-years in 12 worldregions. Lancet. 2012 Nov 24;380(9856):1840-50.
ICO/IARC HPV Information Centre
3 BURDEN OF HPV RELATED CANCERS - 21 -
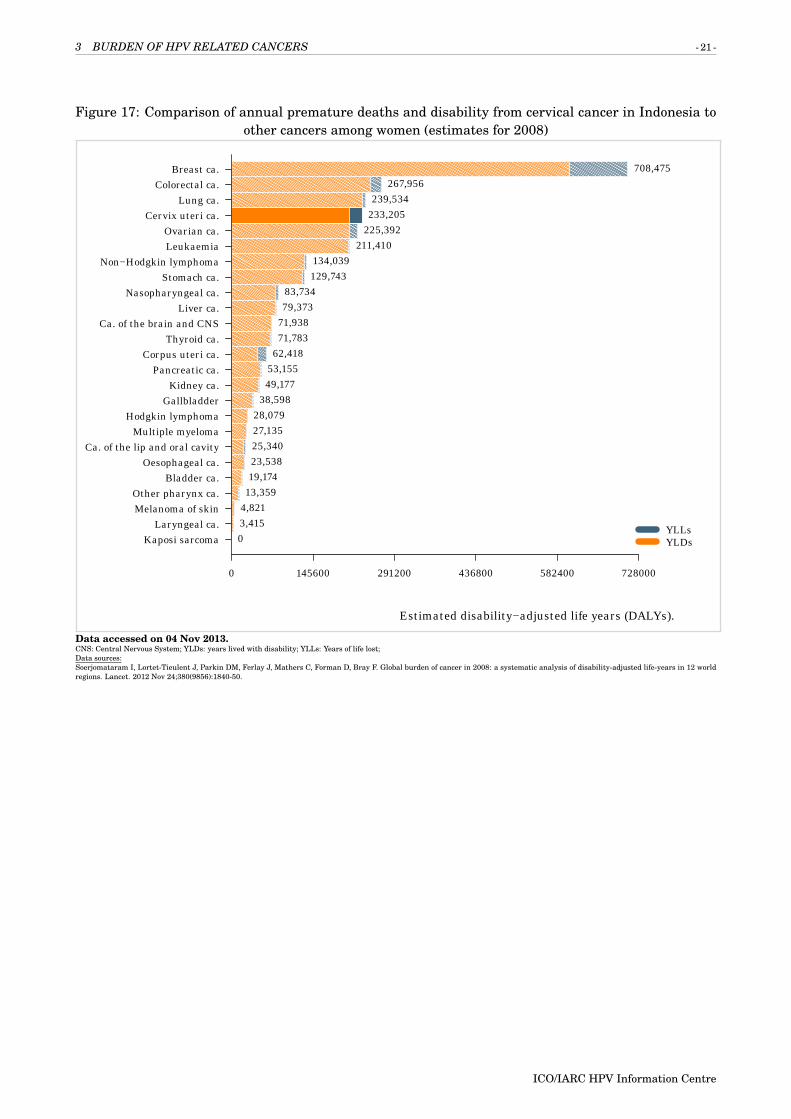
Figure 17: Comparison of annual premature deaths and disability from cervical cancer in Indonesia toother cancers among women (estimates for 2008)
Kaposi sarcomaLaryngeal ca.
Melanoma of skinOther pharynx ca.
Bladder ca.Oesophageal ca.
Ca. of the lip and oral cavityMultiple myeloma
Hodgkin lymphomaGallbladder
Kidney ca.Pancreatic ca.
Corpus uteri ca.Thyroid ca.
Ca. of the brain and CNSLiver ca.
Nasopharyngeal ca.Stomach ca.
Non−Hodgkin lymphomaLeukaemiaOvarian ca.
Cervix uteri ca.Lung ca.
Colorectal ca.Breast ca.
0 145600 291200 436800 582400 728000
03,4154,82113,35919,17423,53825,34027,13528,079
38,59849,17753,15562,41871,78371,93879,37383,734
129,743134,039
211,410225,392233,205239,534
267,956708,475
YLLsYLDs
Estimated disability−adjusted life years (DALYs).
Data accessed on 04 Nov 2013.CNS: Central Nervous System; YLDs: years lived with disability; YLLs: Years of life lost;Data sources:Soerjomataram I, Lortet-Tieulent J, Parkin DM, Ferlay J, Mathers C, Forman D, Bray F. Global burden of cancer in 2008: a systematic analysis of disability-adjusted life-years in 12 worldregions. Lancet. 2012 Nov 24;380(9856):1840-50.
ICO/IARC HPV Information Centre
3 BURDEN OF HPV RELATED CANCERS - 22 -
3.2 Anogenital cancers other than the cervix
Data on HPV role in anogenital cancers other than cervix are limited, but there is an increasing bodyof evidence strongly linking HPV DNA with cancers of anus, vulva, vagina, and penis. Although thesecancers are much less frequent compared to cervical cancer, their association with HPV make thempotentially preventable and subject to similar preventative strategies as those for cervical cancer. (Vac-cine 2006, Vol. 24, Suppl 3; Vaccine 2008, Vol. 26, Suppl 10; Vaccine 2012, Vol. 30, Suppl 5; IARCMonographs 2007, Vol. 90).
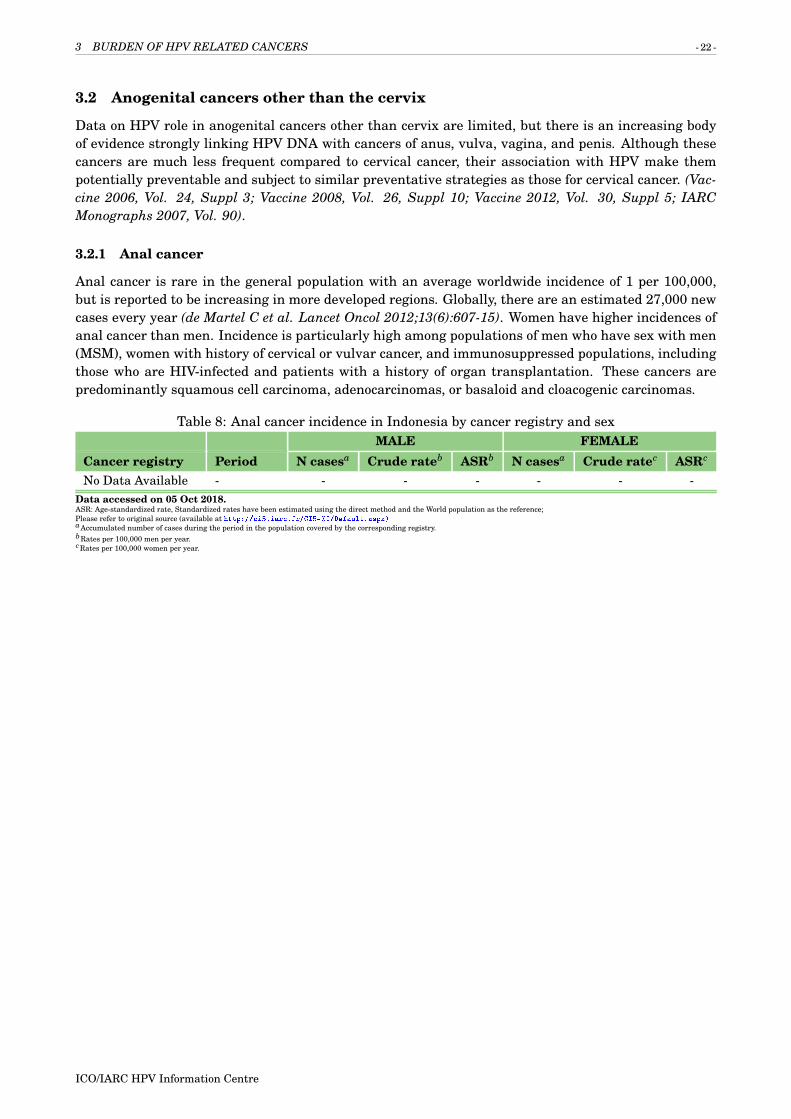
3.2.1 Anal cancer
Anal cancer is rare in the general population with an average worldwide incidence of 1 per 100,000,but is reported to be increasing in more developed regions. Globally, there are an estimated 27,000 newcases every year (de Martel C et al. Lancet Oncol 2012;13(6):607-15). Women have higher incidences ofanal cancer than men. Incidence is particularly high among populations of men who have sex with men(MSM), women with history of cervical or vulvar cancer, and immunosuppressed populations, includingthose who are HIV-infected and patients with a history of organ transplantation. These cancers arepredominantly squamous cell carcinoma, adenocarcinomas, or basaloid and cloacogenic carcinomas.
Table 8: Anal cancer incidence in Indonesia by cancer registry and sexMALE FEMALE
Cancer registry Period N casesa Crude rateb ASRb N casesa Crude ratec ASRc
No Data Available - - - - - - -Data accessed on 05 Oct 2018.ASR: Age-standardized rate, Standardized rates have been estimated using the direct method and the World population as the reference;Please refer to original source (available at http://ci5.iarc.fr/CI5-XI/Default.aspx)aAccumulated number of cases during the period in the population covered by the corresponding registry.bRates per 100,000 men per year.cRates per 100,000 women per year.
ICO/IARC HPV Information Centre

3 BURDEN OF HPV RELATED CANCERS - 23 -
Figure 18: Time trends in anal cancer incidence in Indonesia (cancer registry data)
Anal cancer in men
No data available
Ann
ual c
rude
inci
denc
e ra
te
(per
100
,000
)
1975
1980
1985
1990
1995
1975
1980
1985
1990
1995
Anal cancer in women
No data available
Ann
ual c
rude
inci
denc
e ra
te
(per
100
,000
)
Year1975
1980
1985
1990
1995
1975
1980
1985
1990
1995
All ages
15−44 yrs
45−74 yrs
All ages
15−44 yrs
45−74 yrs
Data accessed on 27 Apr 2015.Data sources:Ferlay J, Bray F, Steliarova-Foucher E and Forman D. Cancer Incidence in Five Continents, CI5plus: IARC CancerBase No. 9 [Internet]. Lyon, France: International Agency for Researchon Cancer; 2014. Available from: http://ci5.iarc.fr
ICO/IARC HPV Information Centre

3 BURDEN OF HPV RELATED CANCERS - 24 -
3.2.2 Vulvar cancer
Cancer of the vulva is rare among women worldwide, with an estimated 27,000 new cases in 2008, rep-resenting 4% of all gynaecologic cancers (de Martel C et al. Lancet Oncol 2012;13(6):607-15). Worldwide,about 60% of all vulvar cancer cases occur in more developed countries. Vulvar cancer has two distincthistological patterns with two different risk factor profiles: (1) basaloid/warty types (2) keratinisingtypes. Basaloid/warty lesions are more common in young women, are very often associated with HPVDNA detection (75-100%), and have a similar risk factor profile as cervical cancer. Keratinising vulvarcarcinomas represent the majority of the vulvar lesions (>60%), they occur more often in older womenand are more rarely associated with HPV (IARC Monograph Vol 100B).
Table 9: Vulvar cancer incidence in Indonesia by cancer registryCancer registry Period N casesa Crude rateb ASRb
No Data Available - - - -Data accessed on 05 Oct 2018.ASR: Age-standardized rate, Standardized rates have been estimated using the direct method and the World population as the reference;Please refer to original source (available at http://ci5.iarc.fr/CI5-XI/Default.aspx)aAccumulated number of cases during the period in the population covered by the corresponding registry.bRates per 100,000 women per year.
Figure 19: Time trends in vulvar cancer incidence in Indonesia (cancer registry data)
No data available
Ann
ual c
rude
inci
denc
e ra
te
(per
100
,000
)
Year1975
1980
1985
1990
1995
All ages
15−44 yrs
45−74 yrs
Data accessed on 27 Apr 2015.Data sources:Ferlay J, Bray F, Steliarova-Foucher E and Forman D. Cancer Incidence in Five Continents, CI5plus: IARC CancerBase No. 9 [Internet]. Lyon, France: International Agency for Researchon Cancer; 2014. Available from: http://ci5.iarc.fr
ICO/IARC HPV Information Centre

3 BURDEN OF HPV RELATED CANCERS - 25 -
3.2.3 Vaginal cancer
Cancer of the vagina is a rare cancer, with an estimated 13,000 new cases in 2008, representing 2% ofall gynaecologic cancers (de Martel C et al. Lancet Oncol 2012;13(6):607-15). Similar to cervical cancer,the majority of vaginal cancer cases (68%) occur in less developed countries. Most vaginal cancers aresquamous cell carcinoma (90%) generally attributable to HPV, followed by clear cell adenocarcinomasand melanoma. Vaginal cancers are primarily reported in developed countries. Metastatic cervicalcancer can be misclassified as cancer of the vagina. Invasive vaginal cancer is diagnosed primarily inold women (≥ 65 years) and the diagnosis is rare in women under 45 years whereas the peak incidenceof carcinoma in situ is observed between ages 55 and 70 (Vaccine 2008, Vol. 26, Suppl 10).
Table 10: Vaginal cancer incidence in Indonesia by cancer registryCancer registry Period N casesa Crude rateb ASRb
No Data Available - - - -Data accessed on 05 Oct 2018.ASR: Age-standardized rate, Standardized rates have been estimated using the direct method and the World population as the reference;Please refer to original source (available at http://ci5.iarc.fr/CI5-XI/Default.aspx)aAccumulated number of cases during the period in the population covered by the corresponding registry.bRates per 100,000 women per year.
Figure 20: Time trends in vaginal cancer incidence in Indonesia (cancer registry data)
No data available
Ann
ual c
rude
inci
denc
e ra
te
(per
100
,000
)
Year1975
1980
1985
1990
1995
All ages
15−44 yrs
45−74 yrs
Data accessed on 27 Apr 2015.Data sources:Ferlay J, Bray F, Steliarova-Foucher E and Forman D. Cancer Incidence in Five Continents, CI5plus: IARC CancerBase No. 9 [Internet]. Lyon, France: International Agency for Researchon Cancer; 2014. Available from: http://ci5.iarc.fr
ICO/IARC HPV Information Centre

3 BURDEN OF HPV RELATED CANCERS - 26 -
3.2.4 Penile cancer
The annual burden of penile cancer has been estimated to be 22,000 cases worldwide with incidencerates strongly correlating with those of cervical cancer (de Martel C et al. Lancet Oncol 2012;13(6):607-15). Penile cancer is rare and most commonly affects men aged 50-70 years. Incidence rates are higherin less developed countries than in more developed countries, accounting for up to 10% of male cancersin some parts of Africa, South America and Asia. Precursor cancerous penile lesions (PeIN) are rare.
Cancers of the penis are primarily of squamous cell carcinomas (SCC) (95%) and the most commonpenile SCC histologic sub-types are keratinising (49%), mixed warty-basaloid (17%), verrucous (8%)warty (6%), and basaloid (4%). HPV is most commonly detected in basaloid and warty tumours but isless common in keratinising and verrucous tumours. Approximately 60-100% of PeIN lesions are HPVDNA positive.
Table 11: Penile cancer incidence in Indonesia by cancer registryCancer registry Period N casesa Crude rateb ASRb
No Data Available - - - -Data accessed on 05 Oct 2018.ASR: Age-standardized rate, Standardized rates have been estimated using the direct method and the World population as the reference;Please refer to original source (available at http://ci5.iarc.fr/CI5-XI/Default.aspx)aAccumulated number of cases during the period in the population covered by the corresponding registry.bRates per 100,000 men per year.
Figure 21: Time trends in penile cancer incidence in Indonesia (cancer registry data)
No data available
Ann
ual c
rude
inci
denc
e ra
te
(per
100
,000
)
Year1975
1980
1985
1990
1995
Penis
15−44
45−74
Data accessed on 27 Apr 2015.Data sources:Ferlay J, Bray F, Steliarova-Foucher E and Forman D. Cancer Incidence in Five Continents, CI5plus: IARC CancerBase No. 9 [Internet]. Lyon, France: International Agency for Researchon Cancer; 2014. Available from: http://ci5.iarc.fr
ICO/IARC HPV Information Centre

3 BURDEN OF HPV RELATED CANCERS - 27 -
3.3 Head and neck cancers
The majority of head and neck cancers are associated with high tobacco and alcohol consumption. How-ever, increasing trends in the incidence at specific sites suggest that other aetiological factors are in-volved, and infection by certain high-risk types of HPV (i.e. HPV16) have been reported to be associatedwith head and neck cancers, in particular with oropharyngeal cancer. Current evidence suggests thatHPV16 is associated with tonsil cancer (including Waldeyer ring cancer), base of tongue cancer andother oropharyngeal cancer sites. Associations with other head and neck cancer sites such as oral can-cer are neither strong nor consistent when compared to molecular-epidemiological data on HPV andoropharyngeal cancer. Association with laryngeal cancer is still unclear (IARC Monograph Vol 100B).
3.3.1 Oropharyngeal cancer
Table 12: Incidence and mortality of cancer of the oropharynx in Indonesia, South-Eastern Asia and therest of the world by sex (estimates for 2018). Includes ICD-10 codes: C09-10
MALE FEMALEIndicator Indonesia South-
EasternAsia
World Indonesia South-Eastern
Asia
World
INCIDENCEAnnual number of new cancer cases 918 3,130 74,472 385 932 18,415
Crude incidence ratea 0.7 1.0 1.9 0.3 0.3 0.5
Age-standardized incidence ratea 0.7 1.0 1.8 0.3 0.3 0.4
Cumulative risk (%) at 75 years oldb 0.1 0.1 0.2 0 0 0
MORTALITYAnnual number of deaths 479 1,686 42,116 147 406 8,889
Crude mortality ratea 0.4 0.5 1.1 0.1 0.1 0.2
Age-standardized mortality ratea 0.4 0.5 1.0 0.1 0.1 0.2
Cumulative risk (%) at 75 years oldc 0 0.1 0.1 0 0 0
Data accessed on 05 Oct 2018.For more detailed methods of estimation please refer to http://gco.iarc.fr/today/data-sources-methodsaMale: Rates per 100,000 men per year. Female: Rates per 100,000 women per year.bCumulative risk (incidence) is the probability or risk of individuals getting from the disease during ages 0-74 years. For cancer, it is expressed as the % of new born children who would beexpected to develop from a particular cancer before the age of 75 if they had the rates of cancer observed in the period in the absence of competing causes.cCumulative risk (mortality) is the probability or risk of individuals dying from the disease during ages 0-74 years. For cancer, it is expressed as the % of new born children who would beexpected to die from a particular cancer before the age of 75 if they had the rates of cancer observed in the period in the absence of competing causes.Data sources:Ferlay J, Ervik M, Lam F, Colombet M, Mery L, Piñeros M, Znaor A, Soerjomataram I, Bray F (2018). Global Cancer Observatory: Cancer Today. Lyon, France: International Agency forResearch on Cancer. Available from: https://gco.iarc.fr/today, accessed [05 October 2018].
ICO/IARC HPV Information Centre

3 BURDEN OF HPV RELATED CANCERS - 28 -
Figure 22: Comparison of incidence and mortality rates of the oropharynx by age group and sex inIndonesia (estimates for 2018). Includes ICD-10 codes: C09-10
MALE
0−14
15−39
40−44
45−49
50−54
55−59
60−64
65−69
70−74
>=75
Age
−spe
cifi
c ra
tes
ofor
opha
ryng
eal c
ance
r
0
1
2
3
4
5
Incidence
FEMALE
0−14
15−39
40−44
45−49
50−54
55−59
60−64
65−69
70−74
>=75
Age groups (years)
0
Mortality
Data accessed on 05 Oct 2018.Male: Rates per 100,000 men per year. Female: Rates per 100,000 women per year.Data sources:Ferlay J, Ervik M, Lam F, Colombet M, Mery L, Piñeros M, Znaor A, Soerjomataram I, Bray F (2018). Global Cancer Observatory: Cancer Today. Lyon, France: International Agency forResearch on Cancer. Available from: https://gco.iarc.fr/today, accessed [05 October 2018].
ICO/IARC HPV Information Centre

3 BURDEN OF HPV RELATED CANCERS - 29 -
Table 13: Incidence of oropharyngeal cancer in Indonesia by cancer registry and sexMALE FEMALE
Cancer registryα Periodα N casesa Crude rateb ASRα N casesa Crude rateb ASRb
Tongue (ICD-10 code: C01-02)No data available - - - - - - -
Tonsillar cancer (ICD-10 code: C09)No data available - - - - - - -
Cancer of the oropharynx (excludes tonsil) (ICD-10 code: C10)No data available - - - - - - -
Data accessed on 15 Oct 2018.ASR: Age-standardised rate. Standardised rates have been estimated using the direct method and the World population as the reference.aAccumulated number of cases during the period in the population covered by the corresponding registry.bMale: Rates per 100,000 men per year. Female: Rates per 100,000 women per year.αPlease refer to original source (available at http://ci5.iarc.fr/CI5-XI/Default.aspx)
ICO/IARC HPV Information Centre

4 HPV RELATED STATISTICS - 30 -
4 HPV related statistics
HPV infection is commonly found in the anogenital tract of men and women with and without clinicallesions. The aetiological role of HPV infection among women with cervical cancer is well-established,and there is growing evidence of its central role in other anogenital sites. HPV is also responsible forother diseases such as recurrent juvenile respiratory papillomatosis and genital warts, both mainlycaused by HPV types 6 and 11 (Lacey CJ, Vaccine 2006; 24(S3):35). For this section, the methodologiesused to compile the information on HPV burden are derived from systematic reviews and meta-analysesof the literature. Due to the limitations of HPV DNA detection methods and study designs used, thesedata should be interpreted with caution and used only as a guide to assess the burden of HPV infectionwithin the population. (Vaccine 2006, Vol. 24, Suppl 3; Vaccine 2008, Vol. 26, Suppl 10; Vaccine2012,Vol. 30, Suppl 5; IARC Monographs 2007, Vol. 90).
4.1 HPV burden in women with normal cervical cytology, cervical precancerouslesions or invasive cervical cancer
The statistics shown in this section focus on HPV infection in the cervix uteri. HPV cervical infection re-sults in cervical morphological lesions ranging from normalcy (cytologically normal women) to differentstages of precancerous lesions (CIN-1, CIN-2, CIN-3/CIS) and invasive cervical cancer. HPV infectionis measured by HPV DNA detection in cervical cells (fresh tissue, paraffin embedded or exfoliated cells).
The prevalence of HPV increases with lesion severity. HPV causes virtually 100% of cervical cancercases, and an underestimation of HPV prevalence in cervical cancer is most likely due to the limitationsof study methodologies. Worldwide, HPV16 and 18 (the two vaccine-preventable types) contribute toover 70% of all cervical cancer cases, between 41% and 67% of high-grade cervical lesions and 16-32%of low-grade cervical lesions. After HPV16/18, the six most common HPV types are the same in allworld regions, namely 31, 33, 35, 45, 52 and 58; these account for an additional 20% of cervical cancersworldwide (Clifford G, Vaccine 2006;24(S3):26).
Methods: Prevalence and type distribution of human papillomavirus in cervical carcinoma,low-grade cervical lesions, high-grade cervical lesions and normal cytology: systematic re-view and meta-analysis
A systematic review of the literature was conducted regarding the worldwide HPV-prevalence and typedistribution for cervical carcinoma, low-grade cervical lesions, high-grade cervical lesions and normalcytology from 1990 to ’data as of ’ indicated in each section. The search terms for the review were ’HPV’AND cerv* using Pubmed. There were no limits in publication language. References cited in selectedarticles were also investigated. Inclusion criteria were: HPV DNA detection by means of PCR or HC2,a minimum of 20 cases for cervical carcinoma, 20 cases for low-grade cervical lesions, 20 cases for high-grade cervical lesions and 100 cases for normal cytology and a detailed description of HPV DNA detec-tion and genotyping techniques used. The number of cases tested and HPV positive extracted for eachstudy were pooled to estimate the prevalence of HPV DNA and the HPV type distribution globally andby geographical region. Binomial 95% confidence intervals were calculated for each HPV prevalence.For more details refer to the methods document.
ICO/IARC HPV Information Centre
4 HPV RELATED STATISTICS - 31 -
4.1.1 HPV prevalence in women with normal cervical cytology
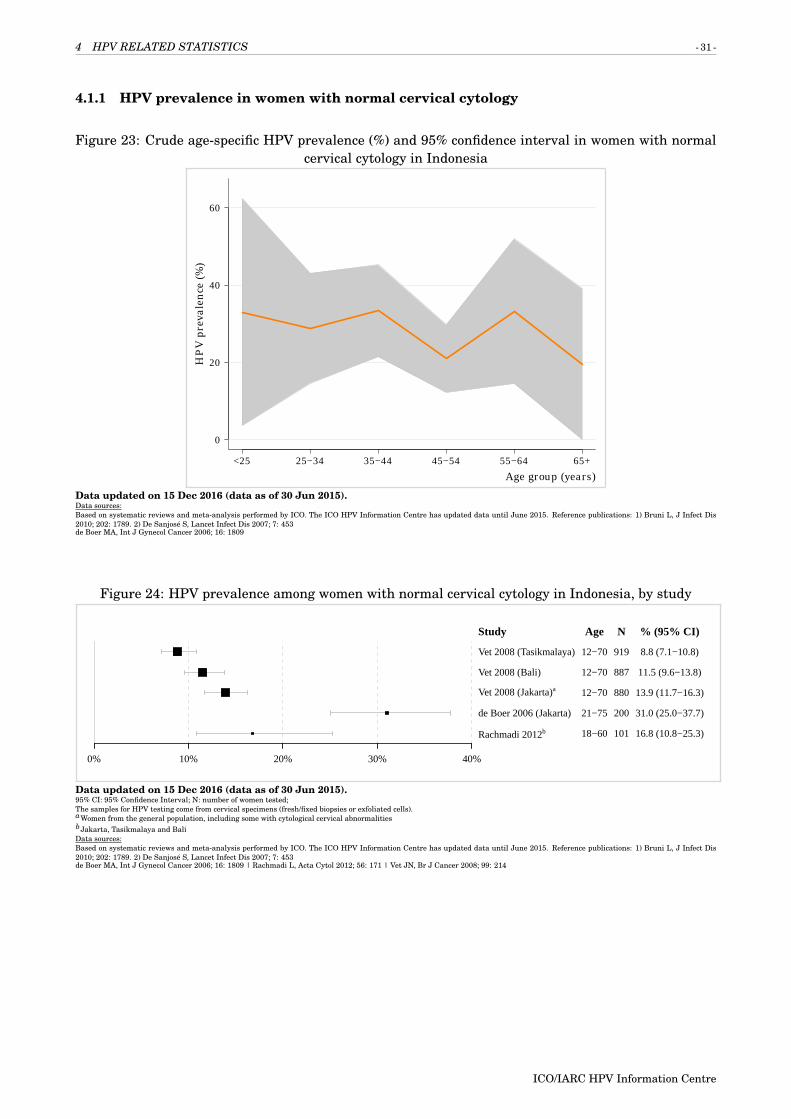
Figure 23: Crude age-specific HPV prevalence (%) and 95% confidence interval in women with normalcervical cytology in Indonesia
0
20
40
60
<25 25−34 35−44 45−54 55−64 65+Age group (years)
HP
V p
reva
lenc
e (%
)
Data updated on 15 Dec 2016 (data as of 30 Jun 2015).Data sources:Based on systematic reviews and meta-analysis performed by ICO. The ICO HPV Information Centre has updated data until June 2015. Reference publications: 1) Bruni L, J Infect Dis2010; 202: 1789. 2) De Sanjosé S, Lancet Infect Dis 2007; 7: 453de Boer MA, Int J Gynecol Cancer 2006; 16: 1809
Figure 24: HPV prevalence among women with normal cervical cytology in Indonesia, by study
Study
Vet 2008 (Tasikmalaya)
Vet 2008 (Bali)
Vet 2008 (Jakarta)a
de Boer 2006 (Jakarta)
Rachmadi 2012b
Age
12−70
12−70
12−70
21−75
18−60
N
919
887
880
200
101
% (95% CI)
8.8 (7.1−10.8)
11.5 (9.6−13.8)
13.9 (11.7−16.3)
31.0 (25.0−37.7)
16.8 (10.8−25.3)
0% 10% 20% 30% 40%
Data updated on 15 Dec 2016 (data as of 30 Jun 2015).95% CI: 95% Confidence Interval; N: number of women tested;The samples for HPV testing come from cervical specimens (fresh/fixed biopsies or exfoliated cells).aWomen from the general population, including some with cytological cervical abnormalitiesbJakarta, Tasikmalaya and BaliData sources:Based on systematic reviews and meta-analysis performed by ICO. The ICO HPV Information Centre has updated data until June 2015. Reference publications: 1) Bruni L, J Infect Dis2010; 202: 1789. 2) De Sanjosé S, Lancet Infect Dis 2007; 7: 453de Boer MA, Int J Gynecol Cancer 2006; 16: 1809 | Rachmadi L, Acta Cytol 2012; 56: 171 | Vet JN, Br J Cancer 2008; 99: 214
ICO/IARC HPV Information Centre

4 HPV RELATED STATISTICS - 32 -
4.1.2 HPV type distribution among women with normal cervical cytology, precancerous cer-vical lesions and cervical cancer
Table 14: Prevalence of HPV16 and HPV18 by cytology in Indonesia
HPV 16/18 Prevalence
No. tested % (95% CI)
Normal cytology1,2 200 4.0 (2.0-7.7)
Low-grade lesions3 - - -
High-grade lesions4 - - -
Cervical cancer5,6 230 87.0 (82.0-90.7)
Data updated on 19 May 2017 (data as of 30 Jun 2015 / 30 Jun 2015).95% CI: 95% Confidence Interval; High-grade lesions: CIN-2, CIN-3, CIS or HSIL; Low-grade lesions: LSIL or CIN-1;The samples for HPV testing come from cervical specimens (fresh / fixed biopsies or exfoliated cells)Data sources:1Based on systematic reviews and meta-analysis performed by ICO. The ICO HPV Information Centre has updated data until June 2014. Reference publications: 1) Bruni L, J Infect Dis2010; 202: 1789. 2) De Sanjosé S, Lancet Infect Dis 2007; 7: 4532de Boer MA, Int J Gynecol Cancer 2006; 16: 18093Based on meta-analysis performed by IARC’s Infections and Cancer Epidemiology Group up to November 2011, the ICO HPV Information Centre has updated data until June 2015.Reference publications: 1) Guan P, Int J Cancer 2012;131:2349 2) Clifford GM, Cancer Epidemiol Biomarkers Prev 2005;14:11574Based on meta-analysis performed by IARC’s Infections and Cancer Epidemiology Group up to November 2011, the ICO HPV Information Centre has updated data until June 2015.Reference publications: 1) Guan P, Int J Cancer 2012;131:2349 2) Smith JS, Int J Cancer 2007;121:621 3) Clifford GM, Br J Cancer 2003;89:101.5Based on meta-analysis performed by IARC’s Infections and Cancer Epidemiology Group up to November 2011, the ICO HPV Information Centre has updated data until June 2014.Reference publications: 1) Guan P, Int J Cancer 2012;131:2349 2) Li N, Int J Cancer 2011;128:927 3) Smith JS, Int J Cancer 2007;121:621 4) Clifford GM, Br J Cancer 2003;88:63 5) CliffordGM, Br J Cancer 2003;89:101.6Contributing studies: Bosch FX, J Natl Cancer Inst 1995; 87: 796 | De Boer MA, Int J Cancer 2005; 114: 422 | Schellekens MC, Gynecol Oncol 2004; 93: 49 | Tobing MD, Asian Pac JCancer Prev 2014; 15: 5781
Figure 25: HPV 16 prevalence among women with normal cervical cytology in Indonesia, by study
Study
de Boer 2006
N
200
% (95% CI)
2.0 (0.8−5.0)
0% 10%
Data updated on 15 Dec 2016 (data as of 30 Jun 2015).95% CI: 95% Confidence Interval; N: number of women tested;The samples for HPV testing come from cervical specimens (fresh/fixed biopsies or exfoliated cells).Data sources:Based on systematic reviews and meta-analysis performed by ICO. The ICO HPV Information Centre has updated data until June 2014. Reference publications: 1) Bruni L, J Infect Dis2010; 202: 1789. 2) De Sanjosé S, Lancet Infect Dis 2007; 7: 453de Boer MA, Int J Gynecol Cancer 2006; 16: 1809
Figure 26: HPV 16 prevalence among women with low-grade cervical lesions in Indonesia, by study
Study
No data available
Age N
0% 10% 20% 30% 40% 50% 60% 70% 80% 90% 100%
Data updated on 20 Nov 2018 (data as of 30 Jun 2015).95% CI: 95% Confidence Interval; Low-grade lesions: LSIL or CIN-1; N: number of women tested;The samples for HPV testing come from cervical specimens (fresh/fixed biopsies or exfoliated cells).Data sources:Based on meta-analysis performed by IARC’s Infections and Cancer Epidemiology Group up to November 2011, the ICO HPV Information Centre has updated data until June 2015.Reference publications: 1) Guan P, Int J Cancer 2012;131:2349 2) Clifford GM, Cancer Epidemiol Biomarkers Prev 2005;14:1157
ICO/IARC HPV Information Centre

4 HPV RELATED STATISTICS - 33 -
Figure 27: HPV 16 prevalence among women with high-grade cervical lesions in Indonesia, by study
Study
No data available
Age N
0% 10% 20% 30% 40% 50% 60% 70% 80% 90% 100%
Data updated on 20 Nov 2018 (data as of 30 Jun 2015).95% CI: 95% Confidence Interval; High-grade lesions: CIN-2, CIN-3, CIS or HSIL; N: number of women tested;The samples for HPV testing come from cervical specimens (fresh/fixed biopsies or exfoliated cells).Data sources:Based on meta-analysis performed by IARC’s Infections and Cancer Epidemiology Group up to November 2011, the ICO HPV Information Centre has updated data until June 2015.Reference publications: 1) Guan P, Int J Cancer 2012;131:2349 2) Smith JS, Int J Cancer 2007;121:621 3) Clifford GM, Br J Cancer 2003;89:101.
Figure 28: HPV 16 prevalence among women with invasive cervical cancer in Indonesia, by study
Study
De Boer 2005
Schellekens 2004
Bosch 1995
Tobing 2014
N
74
74
42
40
% (95% CI)
33.8 (24.0−45.1)
43.2 (32.6−54.6)
35.7 (23.0−50.8)
90.0 (76.9−96.0)
20% 30% 40% 50% 60% 70% 80% 90% 100%
Data updated on 20 Nov 2018 (data as of 30 Jun 2015).95% CI: 95% Confidence Interval; N: number of women tested;The samples for HPV testing come from cervical specimens (fresh/fixed biopsies or exfoliated cells).Data sources:Based on meta-analysis performed by IARC’s Infections and Cancer Epidemiology Group up to November 2011, the ICO HPV Information Centre has updated data until June 2014.Reference publications: 1) Guan P, Int J Cancer 2012;131:2349 2) Li N, Int J Cancer 2011;128:927 3) Smith JS, Int J Cancer 2007;121:621 4) Clifford GM, Br J Cancer 2003;88:63 5) CliffordGM, Br J Cancer 2003;89:101.Bosch FX, J Natl Cancer Inst 1995; 87: 796 | De Boer MA, Int J Cancer 2005; 114: 422 | Schellekens MC, Gynecol Oncol 2004; 93: 49 | Tobing MD, Asian Pac J Cancer Prev 2014; 15: 5781
ICO/IARC HPV Information Centre

4 HPV RELATED STATISTICS - 34 -
Figure 29: Comparison of the ten most frequent HPV oncogenic types in Indonesia among womenwith and without cervical lesions
Nor
mal
cyt
olog
y(a,
b)
Low
−gra
de le
sion
s(c)
Hig
h−gr
ade
lesi
ons(
d)C
ervi
cal C
ance
r(e,
f)
59663945525316561851
HP
V−t
ype
0.50.50.50.51.01.52.02.02.0
4.5
10th*9th*8th*7th*6th*5th*4th*3rd*2nd*1st*
HP
V−t
ype
No data available
10th*9th*8th*7th*6th*5th*4th*3rd*2nd*1st*
HP
V−t
ype
No data available
0 10 20 30 40 50
58313933513545521816
HP
V−t
ype
0.61.31.31.31.31.3
12.213.5
40.047.0
Prevalence (%)
*No data available. No more types than shown were tested or were positive.Data updated on 19 May 2017 (data as of 30 Jun 2015 / 30 Jun 2015).High-grade lesions: CIN-2, CIN-3, CIS or HSIL; Low-grade lesions: LSIL or CIN-1;The samples for HPV testing come from cervical specimens (fresh / fixed biopsies or exfoliated cells).Data sources:aBased on systematic reviews and meta-analysis performed by ICO. The ICO HPV Information Centre has updated data until June 2014. Reference publications: 1) Bruni L, J Infect Dis2010; 202: 1789. 2) De Sanjosé S, Lancet Infect Dis 2007; 7: 453bde Boer MA, Int J Gynecol Cancer 2006; 16: 1809cBased on meta-analysis performed by IARC’s Infections and Cancer Epidemiology Group up to November 2011, the ICO HPV Information Centre has updated data until June 2015.Reference publications: 1) Guan P, Int J Cancer 2012;131:2349 2) Clifford GM, Cancer Epidemiol Biomarkers Prev 2005;14:1157dBased on meta-analysis performed by IARC’s Infections and Cancer Epidemiology Group up to November 2011, the ICO HPV Information Centre has updated data until June 2015.Reference publications: 1) Guan P, Int J Cancer 2012;131:2349 2) Smith JS, Int J Cancer 2007;121:621 3) Clifford GM, Br J Cancer 2003;89:101.eBased on meta-analysis performed by IARC’s Infections and Cancer Epidemiology Group up to November 2011, the ICO HPV Information Centre has updated data until June 2014.Reference publications: 1) Guan P, Int J Cancer 2012;131:2349 2) Li N, Int J Cancer 2011;128:927 3) Smith JS, Int J Cancer 2007;121:621 4) Clifford GM, Br J Cancer 2003;88:63 5) CliffordGM, Br J Cancer 2003;89:101.
(Continued on next page)
ICO/IARC HPV Information Centre

4 HPV RELATED STATISTICS - 35 -
( Figure 29 – continued from previous page)f Contributing studies: Bosch FX, J Natl Cancer Inst 1995; 87: 796 | De Boer MA, Int J Cancer 2005; 114: 422 | Schellekens MC, Gynecol Oncol 2004; 93: 49 | Tobing MD, Asian Pac JCancer Prev 2014; 15: 5781
Figure 30: Comparison of the ten most frequent HPV oncogenic types in Indonesia among womenwith invasive cervical cancer by histology
Cer
vica
l Can
cer
Squa
mou
s ce
ll ca
rcin
oma
Ade
noca
rcin
oma
Une
spec
ifie
d
58313933513545521816
HP
V−t
ype
0.61.31.31.31.31.3
12.213.5
40.047.0
10th*353356393145521816
HP
V−t
ype
0.81.51.52.33.0
6.19.1
25.050.8
10th*9th*8th*7th*
585945521618
HP
V−t
ype
3.43.4
5.212.1
19.067.2
0 10 20 30 40 50 60 70
10th*9th*8th*
35335152451816
HP
V−t
ype
2.52.5
5.030.0
32.542.1
53.5
Prevalence (%)
*No data available. No more types than shown were tested or were positive.Data updated on 19 May 2017 (data as of 30 Jun 2015).The samples for HPV testing come from cervical specimens (fresh / fixed biopsies or exfoliated cells). The ranking of the ten most frequent HPV types may present less than ten types beauseonly a limited number of types were tested or were HPV-positive.Data sources:
(Continued on next page)
ICO/IARC HPV Information Centre

4 HPV RELATED STATISTICS - 36 -
( Figure 30 – continued from previous page)Based on meta-analysis performed by IARC’s Infections and Cancer Epidemiology Group up to November 2011, the ICO HPV Information Centre has updated data until June 2014.Reference publications: 1) Guan P, Int J Cancer 2012;131:2349 2) Li N, Int J Cancer 2011;128:927 3) Smith JS, Int J Cancer 2007;121:621 4) Clifford GM, Br J Cancer 2003;88:63 5) CliffordGM, Br J Cancer 2003;89:101.Contributing studies: Bosch FX, J Natl Cancer Inst 1995; 87: 796 | De Boer MA, Int J Cancer 2005; 114: 422 | Schellekens MC, Gynecol Oncol 2004; 93: 49 | Tobing MD, Asian Pac JCancer Prev 2014; 15: 5781
ICO/IARC HPV Information Centre
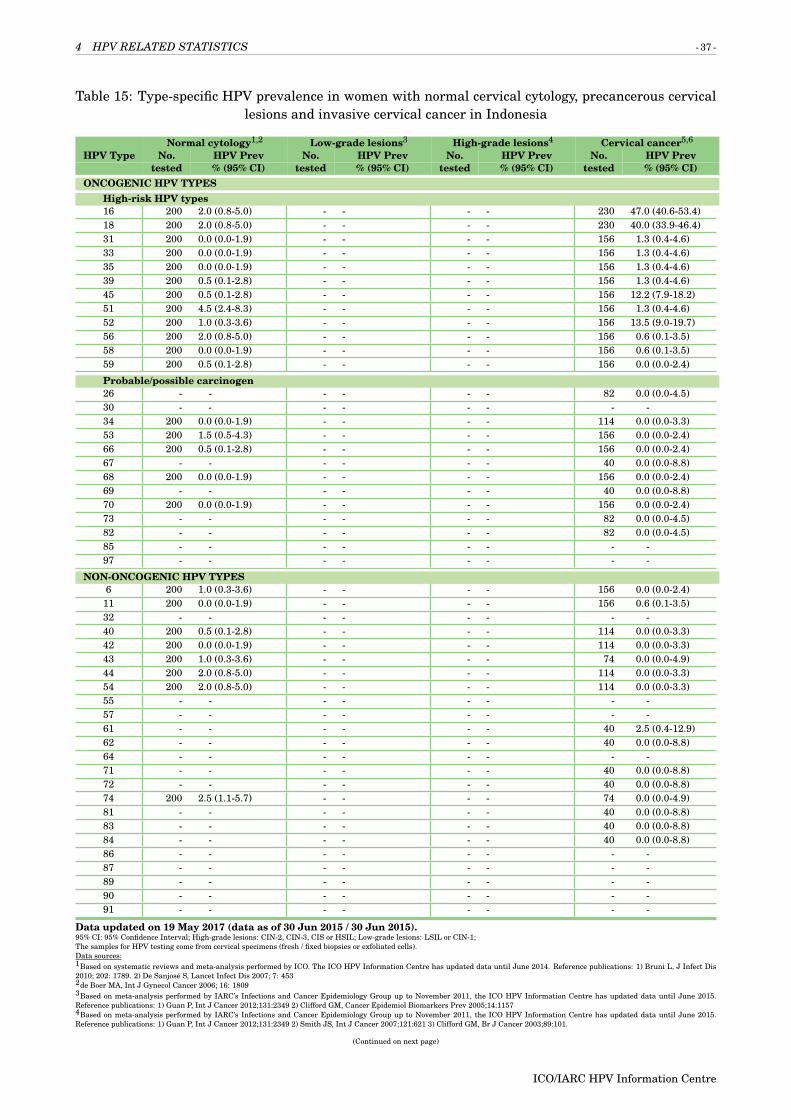
4 HPV RELATED STATISTICS - 37 -
Table 15: Type-specific HPV prevalence in women with normal cervical cytology, precancerous cervicallesions and invasive cervical cancer in Indonesia
Normal cytology1,2 Low-grade lesions3 High-grade lesions4 Cervical cancer5,6
HPV Type No. HPV Prev No. HPV Prev No. HPV Prev No. HPV Prevtested % (95% CI) tested % (95% CI) tested % (95% CI) tested % (95% CI)
ONCOGENIC HPV TYPESHigh-risk HPV types16 200 2.0 (0.8-5.0) - - - - 230 47.0 (40.6-53.4)18 200 2.0 (0.8-5.0) - - - - 230 40.0 (33.9-46.4)31 200 0.0 (0.0-1.9) - - - - 156 1.3 (0.4-4.6)33 200 0.0 (0.0-1.9) - - - - 156 1.3 (0.4-4.6)35 200 0.0 (0.0-1.9) - - - - 156 1.3 (0.4-4.6)39 200 0.5 (0.1-2.8) - - - - 156 1.3 (0.4-4.6)45 200 0.5 (0.1-2.8) - - - - 156 12.2 (7.9-18.2)51 200 4.5 (2.4-8.3) - - - - 156 1.3 (0.4-4.6)52 200 1.0 (0.3-3.6) - - - - 156 13.5 (9.0-19.7)56 200 2.0 (0.8-5.0) - - - - 156 0.6 (0.1-3.5)58 200 0.0 (0.0-1.9) - - - - 156 0.6 (0.1-3.5)59 200 0.5 (0.1-2.8) - - - - 156 0.0 (0.0-2.4)
Probable/possible carcinogen26 - - - - - - 82 0.0 (0.0-4.5)30 - - - - - - - -34 200 0.0 (0.0-1.9) - - - - 114 0.0 (0.0-3.3)53 200 1.5 (0.5-4.3) - - - - 156 0.0 (0.0-2.4)66 200 0.5 (0.1-2.8) - - - - 156 0.0 (0.0-2.4)67 - - - - - - 40 0.0 (0.0-8.8)68 200 0.0 (0.0-1.9) - - - - 156 0.0 (0.0-2.4)69 - - - - - - 40 0.0 (0.0-8.8)70 200 0.0 (0.0-1.9) - - - - 156 0.0 (0.0-2.4)73 - - - - - - 82 0.0 (0.0-4.5)82 - - - - - - 82 0.0 (0.0-4.5)85 - - - - - - - -97 - - - - - - - -
NON-ONCOGENIC HPV TYPES6 200 1.0 (0.3-3.6) - - - - 156 0.0 (0.0-2.4)
11 200 0.0 (0.0-1.9) - - - - 156 0.6 (0.1-3.5)32 - - - - - - - -40 200 0.5 (0.1-2.8) - - - - 114 0.0 (0.0-3.3)42 200 0.0 (0.0-1.9) - - - - 114 0.0 (0.0-3.3)43 200 1.0 (0.3-3.6) - - - - 74 0.0 (0.0-4.9)44 200 2.0 (0.8-5.0) - - - - 114 0.0 (0.0-3.3)54 200 2.0 (0.8-5.0) - - - - 114 0.0 (0.0-3.3)55 - - - - - - - -57 - - - - - - - -61 - - - - - - 40 2.5 (0.4-12.9)62 - - - - - - 40 0.0 (0.0-8.8)64 - - - - - - - -71 - - - - - - 40 0.0 (0.0-8.8)72 - - - - - - 40 0.0 (0.0-8.8)74 200 2.5 (1.1-5.7) - - - - 74 0.0 (0.0-4.9)81 - - - - - - 40 0.0 (0.0-8.8)83 - - - - - - 40 0.0 (0.0-8.8)84 - - - - - - 40 0.0 (0.0-8.8)86 - - - - - - - -87 - - - - - - - -89 - - - - - - - -90 - - - - - - - -91 - - - - - - - -
Data updated on 19 May 2017 (data as of 30 Jun 2015 / 30 Jun 2015).95% CI: 95% Confidence Interval; High-grade lesions: CIN-2, CIN-3, CIS or HSIL; Low-grade lesions: LSIL or CIN-1;The samples for HPV testing come from cervical specimens (fresh / fixed biopsies or exfoliated cells).Data sources:1Based on systematic reviews and meta-analysis performed by ICO. The ICO HPV Information Centre has updated data until June 2014. Reference publications: 1) Bruni L, J Infect Dis2010; 202: 1789. 2) De Sanjosé S, Lancet Infect Dis 2007; 7: 4532de Boer MA, Int J Gynecol Cancer 2006; 16: 18093Based on meta-analysis performed by IARC’s Infections and Cancer Epidemiology Group up to November 2011, the ICO HPV Information Centre has updated data until June 2015.Reference publications: 1) Guan P, Int J Cancer 2012;131:2349 2) Clifford GM, Cancer Epidemiol Biomarkers Prev 2005;14:11574Based on meta-analysis performed by IARC’s Infections and Cancer Epidemiology Group up to November 2011, the ICO HPV Information Centre has updated data until June 2015.Reference publications: 1) Guan P, Int J Cancer 2012;131:2349 2) Smith JS, Int J Cancer 2007;121:621 3) Clifford GM, Br J Cancer 2003;89:101.
(Continued on next page)
ICO/IARC HPV Information Centre

4 HPV RELATED STATISTICS - 38 -
( Table 15 – continued from previous page)5Based on meta-analysis performed by IARC’s Infections and Cancer Epidemiology Group up to November 2011, the ICO HPV Information Centre has updated data until June 2014.Reference publications: 1) Guan P, Int J Cancer 2012;131:2349 2) Li N, Int J Cancer 2011;128:927 3) Smith JS, Int J Cancer 2007;121:621 4) Clifford GM, Br J Cancer 2003;88:63 5) CliffordGM, Br J Cancer 2003;89:101.6Contributing studies: Bosch FX, J Natl Cancer Inst 1995; 87: 796 | De Boer MA, Int J Cancer 2005; 114: 422 | Schellekens MC, Gynecol Oncol 2004; 93: 49 | Tobing MD, Asian Pac JCancer Prev 2014; 15: 5781
ICO/IARC HPV Information Centre
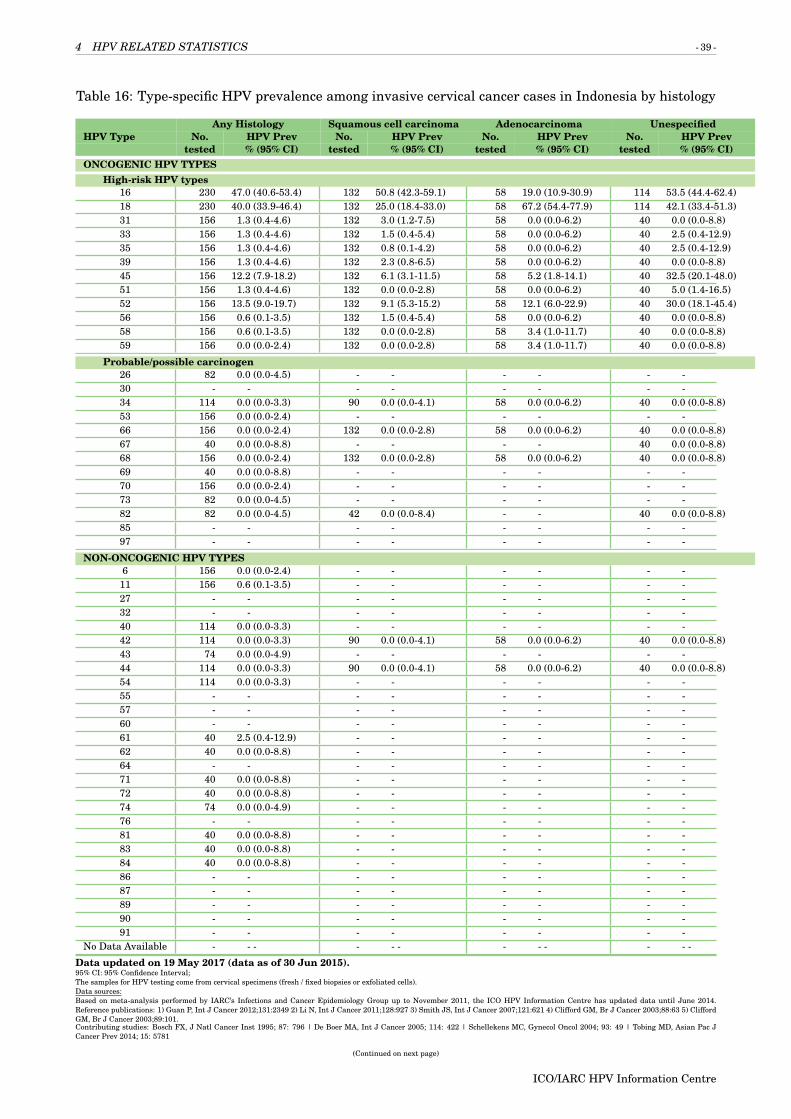
4 HPV RELATED STATISTICS - 39 -
Table 16: Type-specific HPV prevalence among invasive cervical cancer cases in Indonesia by histology
Any Histology Squamous cell carcinoma Adenocarcinoma UnespecifiedHPV Type No. HPV Prev No. HPV Prev No. HPV Prev No. HPV Prev
tested % (95% CI) tested % (95% CI) tested % (95% CI) tested % (95% CI)ONCOGENIC HPV TYPES
High-risk HPV types16 230 47.0 (40.6-53.4) 132 50.8 (42.3-59.1) 58 19.0 (10.9-30.9) 114 53.5 (44.4-62.4)18 230 40.0 (33.9-46.4) 132 25.0 (18.4-33.0) 58 67.2 (54.4-77.9) 114 42.1 (33.4-51.3)31 156 1.3 (0.4-4.6) 132 3.0 (1.2-7.5) 58 0.0 (0.0-6.2) 40 0.0 (0.0-8.8)33 156 1.3 (0.4-4.6) 132 1.5 (0.4-5.4) 58 0.0 (0.0-6.2) 40 2.5 (0.4-12.9)35 156 1.3 (0.4-4.6) 132 0.8 (0.1-4.2) 58 0.0 (0.0-6.2) 40 2.5 (0.4-12.9)39 156 1.3 (0.4-4.6) 132 2.3 (0.8-6.5) 58 0.0 (0.0-6.2) 40 0.0 (0.0-8.8)45 156 12.2 (7.9-18.2) 132 6.1 (3.1-11.5) 58 5.2 (1.8-14.1) 40 32.5 (20.1-48.0)51 156 1.3 (0.4-4.6) 132 0.0 (0.0-2.8) 58 0.0 (0.0-6.2) 40 5.0 (1.4-16.5)52 156 13.5 (9.0-19.7) 132 9.1 (5.3-15.2) 58 12.1 (6.0-22.9) 40 30.0 (18.1-45.4)56 156 0.6 (0.1-3.5) 132 1.5 (0.4-5.4) 58 0.0 (0.0-6.2) 40 0.0 (0.0-8.8)58 156 0.6 (0.1-3.5) 132 0.0 (0.0-2.8) 58 3.4 (1.0-11.7) 40 0.0 (0.0-8.8)59 156 0.0 (0.0-2.4) 132 0.0 (0.0-2.8) 58 3.4 (1.0-11.7) 40 0.0 (0.0-8.8)
Probable/possible carcinogen26 82 0.0 (0.0-4.5) - - - - - -30 - - - - - - - -34 114 0.0 (0.0-3.3) 90 0.0 (0.0-4.1) 58 0.0 (0.0-6.2) 40 0.0 (0.0-8.8)53 156 0.0 (0.0-2.4) - - - - - -66 156 0.0 (0.0-2.4) 132 0.0 (0.0-2.8) 58 0.0 (0.0-6.2) 40 0.0 (0.0-8.8)67 40 0.0 (0.0-8.8) - - - - 40 0.0 (0.0-8.8)68 156 0.0 (0.0-2.4) 132 0.0 (0.0-2.8) 58 0.0 (0.0-6.2) 40 0.0 (0.0-8.8)69 40 0.0 (0.0-8.8) - - - - - -70 156 0.0 (0.0-2.4) - - - - - -73 82 0.0 (0.0-4.5) - - - - - -82 82 0.0 (0.0-4.5) 42 0.0 (0.0-8.4) - - 40 0.0 (0.0-8.8)85 - - - - - - - -97 - - - - - - - -
NON-ONCOGENIC HPV TYPES6 156 0.0 (0.0-2.4) - - - - - -
11 156 0.6 (0.1-3.5) - - - - - -27 - - - - - - - -32 - - - - - - - -40 114 0.0 (0.0-3.3) - - - - - -42 114 0.0 (0.0-3.3) 90 0.0 (0.0-4.1) 58 0.0 (0.0-6.2) 40 0.0 (0.0-8.8)43 74 0.0 (0.0-4.9) - - - - - -44 114 0.0 (0.0-3.3) 90 0.0 (0.0-4.1) 58 0.0 (0.0-6.2) 40 0.0 (0.0-8.8)54 114 0.0 (0.0-3.3) - - - - - -55 - - - - - - - -57 - - - - - - - -60 - - - - - - - -61 40 2.5 (0.4-12.9) - - - - - -62 40 0.0 (0.0-8.8) - - - - - -64 - - - - - - - -71 40 0.0 (0.0-8.8) - - - - - -72 40 0.0 (0.0-8.8) - - - - - -74 74 0.0 (0.0-4.9) - - - - - -76 - - - - - - - -81 40 0.0 (0.0-8.8) - - - - - -83 40 0.0 (0.0-8.8) - - - - - -84 40 0.0 (0.0-8.8) - - - - - -86 - - - - - - - -87 - - - - - - - -89 - - - - - - - -90 - - - - - - - -91 - - - - - - - -
No Data Available - - - - - - - - - - - -
Data updated on 19 May 2017 (data as of 30 Jun 2015).95% CI: 95% Confidence Interval;The samples for HPV testing come from cervical specimens (fresh / fixed biopsies or exfoliated cells).Data sources:Based on meta-analysis performed by IARC’s Infections and Cancer Epidemiology Group up to November 2011, the ICO HPV Information Centre has updated data until June 2014.Reference publications: 1) Guan P, Int J Cancer 2012;131:2349 2) Li N, Int J Cancer 2011;128:927 3) Smith JS, Int J Cancer 2007;121:621 4) Clifford GM, Br J Cancer 2003;88:63 5) CliffordGM, Br J Cancer 2003;89:101.Contributing studies: Bosch FX, J Natl Cancer Inst 1995; 87: 796 | De Boer MA, Int J Cancer 2005; 114: 422 | Schellekens MC, Gynecol Oncol 2004; 93: 49 | Tobing MD, Asian Pac JCancer Prev 2014; 15: 5781
(Continued on next page)
ICO/IARC HPV Information Centre

4 HPV RELATED STATISTICS - 40 -
( Table 16 – continued from previous page)
ICO/IARC HPV Information Centre

4 HPV RELATED STATISTICS - 41 -
4.1.3 HPV type distribution among HIV+ women with normal cervical cytology
Table 17: Studies on HPV prevalence among HIV women with normal cytology in IndonesiaHPV detection Prevalence of 5 most
method and targeted HPV prevalence frequent HPVsStudy HPV types No. Tested % (95% CI) HPV type (%)
No Data Available - - - - -
Data updated on 31 Jul 2013 (data as of 31 Dec 2011). Only for European countries.95% CI: 95% Confidence Interval;Data sources:Systematic review and meta-analysis were performed by the ICO HPV Information Centre up to December 2011. Selected studies had to include at least 20 HIV positive women who hadboth normal cervical cytology and HPV test results (PCR or HC2).
ICO/IARC HPV Information Centre
4 HPV RELATED STATISTICS - 42 -
4.1.4 Terminology
Cytologically normal womenNo abnormal cells are observed on the surface of their cervix upon cytology.
Cervical Intraepithelial Neoplasia (CIN) / Squamous Intraepithelial Lesions (SIL)SIL and CIN are two commonly used terms to describe precancerous lesions or the abnormalgrowth of squamous cells observed in the cervix. SIL is an abnormal result derived from cervicalcytological screening or Pap smear testing. CIN is a histological diagnosis made upon analysis ofcervical tissue obtained by biopsy or surgical excision. The condition is graded as CIN 1, 2 or 3,according to the thickness of the abnormal epithelium (1/3, 2/3 or the entire thickness).
Low-grade cervical lesions (LSIL/CIN-1)Low-grade cervical lesions are defined by early changes in size, shape, and number of ab-normal cells formed on the surface of the cervix and may be referred to as mild dysplasia,LSIL, or CIN-1.
High-grade cervical lesions (HSIL/ CIN-2 / CIN-3 / CIS)High-grade cervical lesions are defined by a large number of precancerous cells on the sur-face of the cervix that are distinctly different from normal cells. They have the potentialto become cancerous cells and invade deeper tissues of the cervix. These lesions may bereferred to as moderate or severe dysplasia, HSIL, CIN-2, CIN-3 or cervical carcinoma insitu (CIS).
Carcinoma in situ (CIS)Preinvasive malignancy limited to the epithelium without invasion of the basement membrane.CIN 3 encompasses the squamous carcinoma in situ.
Invasive cervical cancer (ICC) / Cervical cancerIf the high-grade precancerous cells invade the basement membrane is called ICC. ICC stagesrange from stage I (cancer is in the cervix or uterus only) to stage IV (the cancer has spread todistant organs, such as the liver).
Invasive squamous cell carcinomaInvasive carcinoma composed of cells resembling those of squamous epithelium.
AdenocarcinomaInvasive tumour with glandular and squamous elements intermingled.
ICO/IARC HPV Information Centre

4 HPV RELATED STATISTICS - 43 -
4.2 HPV burden in anogenital cancers other than cervix
Methods: Prevalence and type distribution of human papillomavirus in carcinoma of thevulva, vagina, anus and penis: systematic review and meta-analysis
A systematic review of the literature was conducted on the worldwide HPV-prevalence and type dis-tribution for anogenital carcinomas other than cervix from January 1986 to ’data as of ’ indicated ineach section. The search terms for the review were ’HPV’ AND (anus OR anal) OR (penile) OR vagin*OR vulv* using Pubmed. There were no limits in publication language. References cited in selectedarticles were also investigated. Inclusion criteria were: HPV DNA detection by means of PCR, a mini-mum of 10 cases by lesion and a detailed description of HPV DNA detection and genotyping techniquesused. The number of cases tested and HPV positive cases were extracted for each study to estimatethe prevalence of HPV DNA and the HPV type distribution. Binomial 95% confidence intervals werecalculated for each HPV prevalence.
4.2.1 Anal cancer and precancerous anal lesions
Anal cancer is similar to cervical cancer with respect to overall HPV DNA positivity, with approximately88% of cases associated with HPV infection worldwide (de Martel C et al. Lancet Oncol 2012;13(6):607-15). HPV16 is the most common type detected, representing 73% of all HPV-positive tumours. HPV18is the second most common type detected and is found in approximately 5% of cases. HPV DNA is alsodetected in the majority of precancerous anal lesions (AIN) (91.5% in AIN1 and 93.9% in AIN2/3) (DeVuyst H et al. Int J Cancer 2009; 124: 1626-36). In this section, the burden of HPV among cases of analcancers and precancerous anal lesions in Indonesia are presented.
Table 18: Studies on HPV prevalence among anal cancer cases in Indonesia (male and female)HPV detection Prevalence of 5 most
method and targeted HPV prevalence frequent HPVsStudy HPV types No. Tested % (95% CI) HPV type (%)
No Data Available - - - - -
Data updated on 20 Nov 2018 (data as of 30 Jun 2015).95% CI: 95% Confidence Interval;Data sources:Based on systematic reviews (up to 2008) performed by ICO for the IARC Monograph on the Evaluation of Carcinogenic Risks to Humans volume 100B and IARC’s Infections and CancerEpidemiology Group. The ICO HPV Information Centre has updated data until June 2015. Reference publications: 1) Bouvard V, Lancet Oncol 2009;10:321 2) De Vuyst H, Int J Cancer2009;124:1626
Table 19: Studies on HPV prevalence among cases of AIN2/3 in IndonesiaHPV detection Prevalence of 5 most
method and targeted HPV prevalence frequent HPVsStudy HPV types No. Tested % (95% CI) HPV type (%)
No Data Available - - - - -
Data updated on 20 Nov 2018 (data as of 30 Jun 2015).95% CI: 95% Confidence Interval; AIN 2/3: Anal intraepithelial neoplasia of grade 2/3;Data sources:Based on systematic reviews (up to 2008) performed by ICO for the IARC Monograph on the Evaluation of Carcinogenic Risks to Humans volume 100B and IARC’s Infections and CancerEpidemiology Group. The ICO HPV Information Centre has updated data until June 2015. Reference publications: 1) Bouvard V, Lancet Oncol 2009;10:321 2) De Vuyst H, Int J Cancer2009;124:1626
ICO/IARC HPV Information Centre
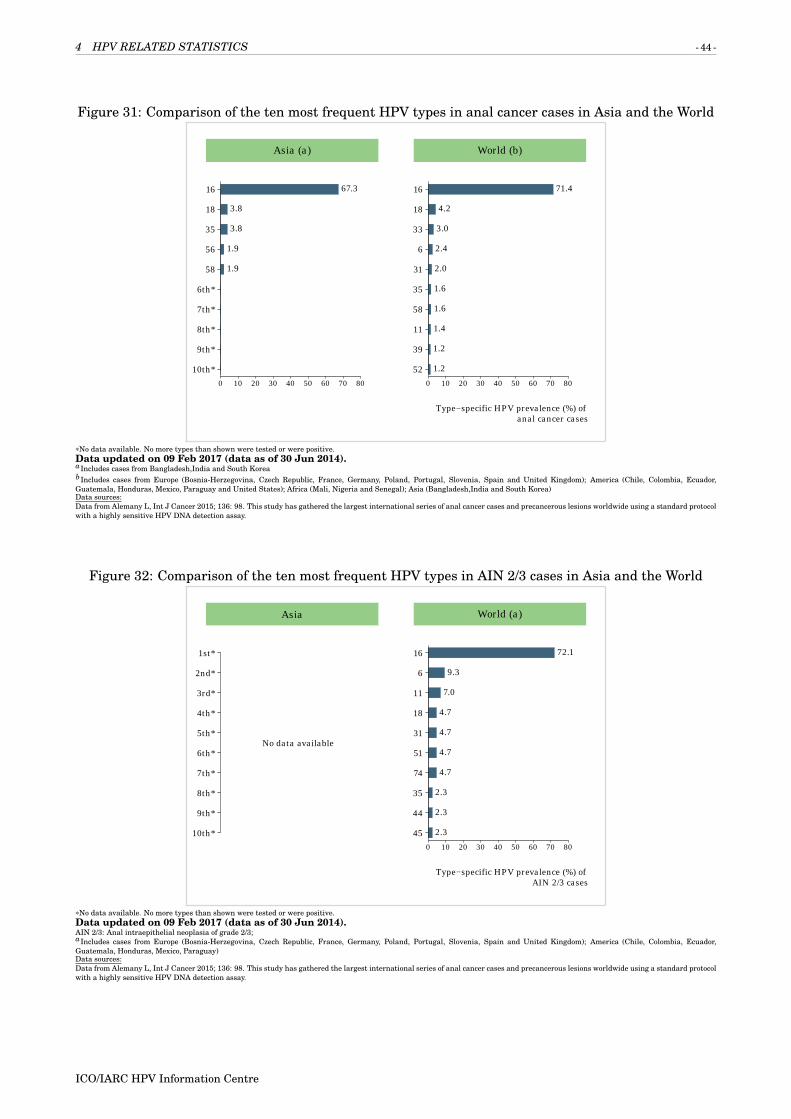
4 HPV RELATED STATISTICS - 44 -
Figure 31: Comparison of the ten most frequent HPV types in anal cancer cases in Asia and the World
Asia (a)
10th*
9th*
8th*
7th*
6th*
58
56
35
18
16
0 10 20 30 40 50 60 70 80
1.9
1.9
3.8
3.8
67.3
Type−specific HPV prevalence (%) of anal cancer cases
World (b)
52
39
11
58
35
31
6
33
18
16
0 10 20 30 40 50 60 70 80
1.2
1.2
1.4
1.6
1.6
2.0
2.4
3.0
4.2
71.4
*No data available. No more types than shown were tested or were positive.Data updated on 09 Feb 2017 (data as of 30 Jun 2014).aIncludes cases from Bangladesh,India and South KoreabIncludes cases from Europe (Bosnia-Herzegovina, Czech Republic, France, Germany, Poland, Portugal, Slovenia, Spain and United Kingdom); America (Chile, Colombia, Ecuador,Guatemala, Honduras, Mexico, Paraguay and United States); Africa (Mali, Nigeria and Senegal); Asia (Bangladesh,India and South Korea)Data sources:Data from Alemany L, Int J Cancer 2015; 136: 98. This study has gathered the largest international series of anal cancer cases and precancerous lesions worldwide using a standard protocolwith a highly sensitive HPV DNA detection assay.
Figure 32: Comparison of the ten most frequent HPV types in AIN 2/3 cases in Asia and the World
Asia
10th*
9th*
8th*
7th*
6th*
5th*
4th*
3rd*
2nd*
1st*
No data available
Type−specific HPV prevalence (%) of AIN 2/3 cases
World (a)
45
44
35
74
51
31
18
11
6
16
0 10 20 30 40 50 60 70 80
2.3
2.3
2.3
4.7
4.7
4.7
4.7
7.0
9.3
72.1
*No data available. No more types than shown were tested or were positive.Data updated on 09 Feb 2017 (data as of 30 Jun 2014).AIN 2/3: Anal intraepithelial neoplasia of grade 2/3;aIncludes cases from Europe (Bosnia-Herzegovina, Czech Republic, France, Germany, Poland, Portugal, Slovenia, Spain and United Kingdom); America (Chile, Colombia, Ecuador,Guatemala, Honduras, Mexico, Paraguay)Data sources:Data from Alemany L, Int J Cancer 2015; 136: 98. This study has gathered the largest international series of anal cancer cases and precancerous lesions worldwide using a standard protocolwith a highly sensitive HPV DNA detection assay.
ICO/IARC HPV Information Centre

4 HPV RELATED STATISTICS - 45 -
4.2.2 Vulvar cancer and precancerous vulvar lesions
HPV attribution for vulvar cancer is 43% worldwide (de Martel C et al. Lancet Oncol 2012;13(6):607-15). Vulvar cancer has two distinct histological patterns with two different risk factor profiles: (1) basa-loid/warty types (2) keratinising types. Basaloid/warty lesions are more common in young women, arefrequently found adjacent to VIN, are very often associated with HPV DNA detection (86%), and havea similar risk factor profile as cervical cancer. Keratinising vulvar carcinomas represent the majorityof the vulvar lesions (>60%). These lesions develop from non HPV-related chronic vulvar dermatoses,especially lichen sclerosus and/or squamous hyperplasia, their immediate cancer precursor lesion is dif-ferentiated VIN, they occur more often in older women, and are rarely associated with HPV (6%) or withany of the other risk factors typical of cervical cancer. HPV prevalence is frequently detected amongcases of high-grade VIN (VIN2/3) (85.3%). HPV 16 is the most common type detected followed by HPV33 (De Vuyst H et al. Int J Cancer 2009; 124: 1626-36).In this section, the HPV burden among cases ofvulvar cancer cases and precancerous vulvar lesions in Indonesia are presented.
Table 20: Studies on HPV prevalence among vulvar cancer cases in IndonesiaHPV detection Prevalence of 5 most
method and targeted HPV prevalence frequent HPVsStudy HPV types No. Tested % (95% CI) HPV type (%)
No Data Available - - - - -
Data updated on 20 Nov 2018 (data as of 30 Jun 2015).95% CI: 95% Confidence Interval;Data sources:Based on systematic reviews (up to 2008) performed by ICO for the IARC Monograph on the Evaluation of Carcinogenic Risks to Humans volume 100B and IARC’s Infections and CancerEpidemiology Group. The ICO HPV Information Centre has updated data until June 2015. Reference publications: 1) Bouvard V, Lancet Oncol 2009;10:321 2) De Vuyst H, Int J Cancer2009;124:1626
Table 21: Studies on HPV prevalence among VIN 2/3 cases in IndonesiaHPV detection Prevalence of 5 most
method and targeted HPV prevalence frequent HPVsStudy HPV types No. Tested % (95% CI) HPV type (%)
No Data Available - - - - -
Data updated on 20 Nov 2018 (data as of 30 Jun 2015).95% CI: 95% Confidence Interval; VIN 2/3: Vulvar intraepithelial neoplasia of grade 2/3;Data sources:Based on systematic reviews (up to 2008) performed by ICO for the IARC Monograph on the Evaluation of Carcinogenic Risks to Humans volume 100B and IARC’s Infections and CancerEpidemiology Group. The ICO HPV Information Centre has updated data until June 2015. Reference publications: 1) Bouvard V, Lancet Oncol 2009;10:321 2) De Vuyst H, Int J Cancer2009;124:1626
ICO/IARC HPV Information Centre

4 HPV RELATED STATISTICS - 46 -
Figure 33: Comparison of the ten most frequent HPV types in cases of vulvar cancer in Asia and theWorld
Asia (a)
31
30
26
11
58
52
45
44
18
16
0 10 20
0.5
0.5
0.5
0.5
1.1
1.1
1.1
1.6
1.6
18.1
Type−specific HPV prevalence (%) of vulvar cancer cases
World (b)
56
51
52
44
31
6
45
18
33
16
0 10 20
0.4
0.4
0.5
0.6
0.6
0.6
0.9
1.5
1.8
19.4
Data updated on 09 Feb 2017 (data as of 30 Jun 2014).aIncludes cases from Bangladesh, India, Israel, South Korea, Kuwait, Lebanon, Philippines, Taiwan and Turkey.bIncludes cases from America (Argentina, Brazil, Chile, Colombia, Ecuador, Guatemala, Honduras, Mexico, Paraguay, Uruguay, United States of America and Venezuela); Africa (Mali,Mozambique, Nigeria, and Senegal); Oceania (Australia and New Zealand); Europe (Austria, Belarus, Bosnia-Herzegovina, Czech Republic, France, Germany, Greece, Italy, Poland, Portugal,Spain and United Kingdom); and in Asia (Bangladesh, India, Israel, South Korea, Kuwait, Lebanon, Philippines, Taiwan and Turkey)Data sources:Data from de Sanjosé S, Eur J Cancer 2013; 49: 3450. This study has gathered the largest international series of vulva cancer cases and precancerous lesions worldwide using a standardprotocol with a highly sensitive HPV DNA detection assay.
Figure 34: Comparison of the ten most frequent HPV types in VIN 2/3 cases in Asia and the World
Asia (a)
10th*
9th*
8th*
7th*
54
35
33
18
6
16
0 10 20 30 40 50 60 70 80 90
5.0
5.0
5.0
5.0
5.0
80.0
Type−specific HPV prevalence (%) of VIN 2/3 cases
World (b)
66
74
56
51
52
31
18
6
33
16
0 10 20 30 40 50 60 70 80 90
0.7
0.9
0.9
1.2
1.4
1.9
2.4
2.4
10.2
67.1
*No data available. No more types than shown were tested or were positive.Data updated on 09 Feb 2017 (data as of 30 Jun 2014).aIncludes cases from Bangladesh, India, Israel, South Korea, Kuwait, Lebanon, Philippines, Taiwan and Turkey.bIncludes cases from America (Argentina, Brazil, Chile, Colombia, Ecuador, Guatemala, Honduras, Mexico, Paraguay, Uruguay and Venezuela); Oceania (Australia and New Zealand);Europe (Austria, Belarus, Bosnia-Herzegovina, Czech Republic, France, Germany, Greece, Italy, Poland, Portugal, Spain and United Kingdom); and in Asia (Bangladesh, India, Israel, SouthKorea, Kuwait, Lebanon, Philippines, Taiwan and Turkey)Data sources:Data from de Sanjosé S, Eur J Cancer 2013; 49: 3450. This study has gathered the largest international series of vulva cancer cases and precancerous lesions worldwide using a standardprotocol with a highly sensitive HPV DNA detection assay.
ICO/IARC HPV Information Centre

4 HPV RELATED STATISTICS - 47 -
4.2.3 Vaginal cancer and precancerous vaginal lesions
Vaginal and cervical cancers share similar risk factors and it is generally accepted that both carcinomasshare the same aetiology of HPV infection although there is limited evidence available. Women withvaginal cancer are more likely to have a history of other ano-genital cancers, particularly of the cervix,and these two carcinomas are frequently diagnosed simultaneously. HPV DNA is detected among 70%of invasive vaginal carcinomas and 91% of high-grade vaginal neoplasias (VaIN2/3). HPV16 is themost common type in high-grade vaginal neoplasias and it is detected in at least 70% of HPV-positivecarcinomas (de Martel C et al. Lancet Oncol 2012;13(6):607-15; De Vuyst H et al. Int J Cancer 2009;124:1626-36). In this section, the HPV burden among cases of vaginal cancer cases and precancerousvaginal lesions in Indonesia are presented.
Table 22: Studies on HPV prevalence among vaginal cancer cases in IndonesiaHPV detection Prevalence of 5 most
method and targeted HPV prevalence frequent HPVsStudy HPV types No. Tested % (95% CI) HPV type (%)
No Data Available - - - - -
Data updated on 20 Nov 2018 (data as of 30 Jun 2015).95% CI: 95% Confidence Interval;Data sources:Based on systematic reviews (up to 2008) performed by ICO for the IARC Monograph on the Evaluation of Carcinogenic Risks to Humans volume 100B and IARC’s Infections and CancerEpidemiology Group. The ICO HPV Information Centre has updated data until June 2015. Reference publications: 1) Bouvard V, Lancet Oncol 2009;10:321 2) De Vuyst H, Int J Cancer2009;124:1626
Table 23: Studies on HPV prevalence among VaIN 2/3 cases in IndonesiaHPV detection Prevalence of 5 most
method and targeted HPV prevalence frequent HPVsStudy HPV types No. Tested % (95% CI) HPV type (%)
No Data Available - - - - -
Data updated on 20 Nov 2018 (data as of 30 Jun 2015).95% CI: 95% Confidence Interval; VAIN 2/3: Vaginal intraepithelial neoplasia of grade 2/3;Based on systematic reviews (up to 2008) performed by ICO for the IARC Monograph on the Evaluation of Carcinogenic Risks to Humans volume 100B and IARC’s Infections and CancerEpidemiology Group. The ICO HPV Information Centre has updated data until June 2015. Reference publications: 1) Bouvard V, Lancet Oncol 2009;10:321 2) De Vuyst H, Int J Cancer2009;124:1626Data sources:Based on systematic reviews (up to 2008) performed by ICO for the IARC Monograph on the Evaluation of Carcinogenic Risks to Humans volume 100B and IARC’s Infections and CancerEpidemiology Group. The ICO HPV Information Centre has updated data until June 2015. Reference publications: 1) Bouvard V, Lancet Oncol 2009;10:321 2) De Vuyst H, Int J Cancer2009;124:1626
ICO/IARC HPV Information Centre

4 HPV RELATED STATISTICS - 48 -
Figure 35: Comparison of the ten most frequent HPV types in cases of vaginal cancer in Asia and theWorld
Asia (a)
59
56
52
51
45
26
18
68
33
16
0 10 20 30 40 50
3.0
3.0
3.0
3.0
3.0
3.0
3.0
3.0
3.0
39.4
Type−specific HPV prevalence (%) of vaginal cancer cases
World (b)
39
73
51
52
58
45
33
18
31
16
0 10 20 30 40 50
1.5
1.7
1.7
2.2
2.7
2.7
3.7
3.7
3.9
43.6
Data updated on 09 Feb 2017 (data as of 30 Jun 2014).aIncludes cases from Bangladesh, India, Israel, South Korea, Kuwait, Philippines, Taiwan and TurkeybIncludes cases from Europe (Austria, Belarus, Czech Republic, France, Germany, Greece, Poland, Spain and United Kingdom); America (Argentina, Brazil, Chile, Colombia, Ecuador,Guatemala, Mexico, Paraguay, Uruguay, United states of America and Venezuela); Africa (Mozambique, Nigeria); Asia (Bangladesh, India, Israel, South Korea, Kuwait, Philippines, Taiwanand Turkey); and Oceania (Australia)Data sources:Data from Alemany L, Eur J Cancer 2014; 50: 2846. This study has gathered the largest international series of vaginal cancer cases and precancerous lesions worldwide using a standardprotocol with a highly sensitive HPV DNA detection assay.
Figure 36: Comparison of the ten most frequent HPV types in VaIN 2/3 cases in Asia and the World
Asia (a)
10th*
9th*
8th*
7th*
6th*
73
45
59
52
16
0 10 20 30 40 50 60
7.7
7.7
15.4
15.4
53.8
Type−specific HPV prevalence (%) of VaIN 2/3 cases
World (b)
35
6
51
56
59
33
73
52
18
16
0 10 20 30 40 50 60
1.6
1.6
2.1
2.6
3.7
4.2
4.8
5.3
5.3
56.1
*No data available. No more types than shown were tested or were positive.Data updated on 09 Feb 2017 (data as of 30 Jun 2014).VAIN 2/3: Vaginal intraepithelial neoplasia of grade 2/3;aIncludes cases from Australia, Bangladesh, India, Israel, South Korea, Kuwait, Philippines, Taiwan and Turkey.bIncludes cases from Europe (Austria, Belarus, Czech Republic, France, Germany, Greece, Poland, Spain and United Kingdom); America (Argentina, Brazil, Chile, Colombia, Ecuador,Guatemala, Mexico, Paraguay, Uruguay, United states of America and Venezuela); Asia (Bangladesh, India, Israel, South Korea, Kuwait, Philippines, Taiwan and Turkey); and Oceania(Australia)Data sources:Data from Alemany L, Eur J Cancer 2014; 50: 2846. This study has gathered the largest international series of vaginal cancer cases and precancerous lesions worldwide using a standardprotocol with a highly sensitive HPV DNA detection assay.
ICO/IARC HPV Information Centre

4 HPV RELATED STATISTICS - 49 -
4.2.4 Penile cancer and precancerous penile lesions
HPV DNA is detectable in approximately 50% of all penile cancers (de Martel C et al. Lancet Oncol2012;13(6):607-15). Among HPV-related penile tumours, HPV16 is the most common type detected,followed by HPV18 and HPV types 6/11 (Miralles C et al. J Clin Pathol 2009;62:870-8). Over 95% ofinvasive penile cancers are SCC and the most common penile SCC histologic sub-types are keratinising(49%), mixed warty-basaloid (17%), verrucous (8%), warty (6%), and basaloid (4%). HPV is commonlydetected in basaloid and warty tumours but is less common in keratinising and verrucous tumours. Inthis section, the HPV burden among cases of penile cancer cases and precancerous penile lesions inIndonesia are presented.
Table 24: Studies on HPV prevalence among penile cancer cases in IndonesiaHPV detection Prevalence of 5 most
method and targeted HPV prevalence frequent HPVsStudy HPV types No. Tested % (95% CI) HPV type (%)
No Data Available - - - - -
Data updated on 20 Nov 2018 (data as of 30 Jun 2015).95% CI: 95% Confidence Interval;Data sources:The ICO HPV Information Centre has updated data until June 2015. Reference publications (up to 2008): 1) Bouvard V, Lancet Oncol 2009;10:321 2) Miralles-Guri C,J Clin Pathol2009;62:870
Table 25: Studies on HPV prevalence among PeIN 2/3 cases in IndonesiaHPV detection Prevalence of 5 most
method and targeted HPV prevalence frequent HPVsStudy Method No. Tested % (95% CI) HPV type (%)
No Data Available - - - - -
Data updated on 20 Nov 2018 (data as of 30 Jun 2015).95% CI: 95% Confidence Interval; PeIN 2/3: Penile intraepithelial neoplasia of grade 2/3;Data sources:The ICO HPV Information Centre has updated data until June 2014. Reference publication (up to 2008): Bouvard V, Lancet Oncol 2009;10:321
ICO/IARC HPV Information Centre
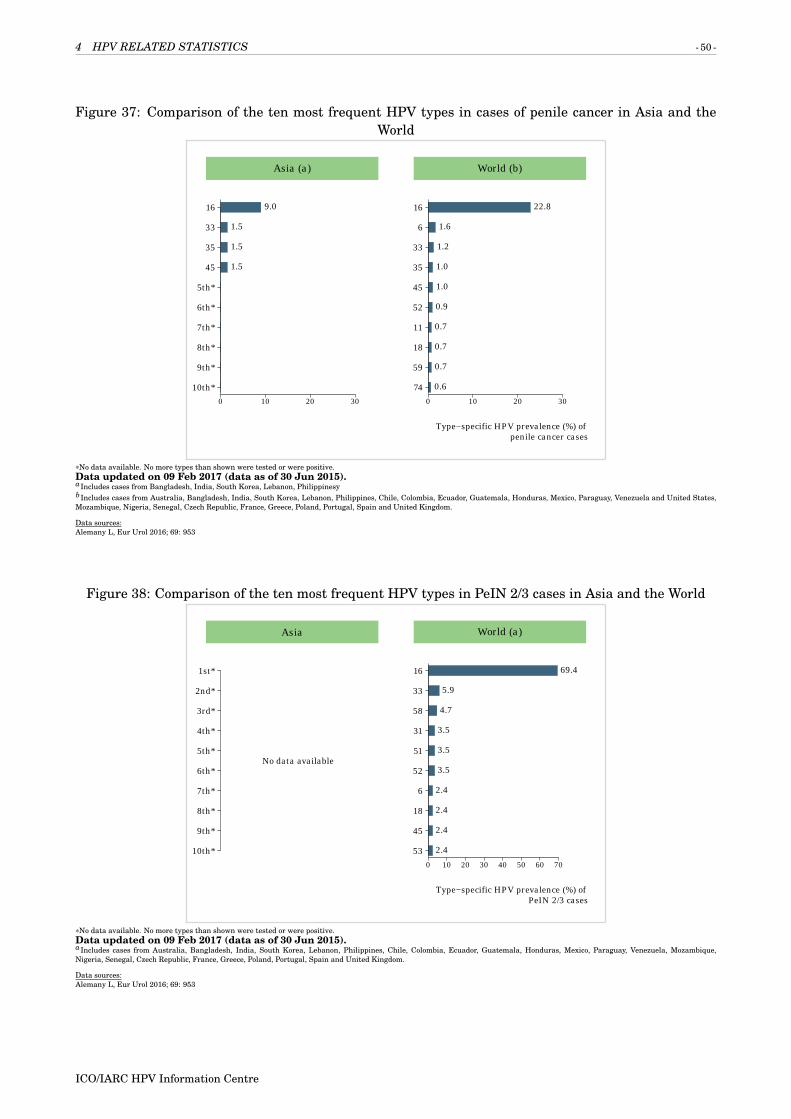
4 HPV RELATED STATISTICS - 50 -
Figure 37: Comparison of the ten most frequent HPV types in cases of penile cancer in Asia and theWorld
Asia (a)
10th*
9th*
8th*
7th*
6th*
5th*
45
35
33
16
0 10 20 30
1.5
1.5
1.5
9.0
Type−specific HPV prevalence (%) of penile cancer cases
World (b)
74
59
18
11
52
45
35
33
6
16
0 10 20 30
0.6
0.7
0.7
0.7
0.9
1.0
1.0
1.2
1.6
22.8
*No data available. No more types than shown were tested or were positive.Data updated on 09 Feb 2017 (data as of 30 Jun 2015).aIncludes cases from Bangladesh, India, South Korea, Lebanon, PhilippinesybIncludes cases from Australia, Bangladesh, India, South Korea, Lebanon, Philippines, Chile, Colombia, Ecuador, Guatemala, Honduras, Mexico, Paraguay, Venezuela and United States,Mozambique, Nigeria, Senegal, Czech Republic, France, Greece, Poland, Portugal, Spain and United Kingdom.
Data sources:Alemany L, Eur Urol 2016; 69: 953
Figure 38: Comparison of the ten most frequent HPV types in PeIN 2/3 cases in Asia and the World
Asia
10th*
9th*
8th*
7th*
6th*
5th*
4th*
3rd*
2nd*
1st*
No data available
Type−specific HPV prevalence (%) of PeIN 2/3 cases
World (a)
53
45
18
6
52
51
31
58
33
16
0 10 20 30 40 50 60 70
2.4
2.4
2.4
2.4
3.5
3.5
3.5
4.7
5.9
69.4
*No data available. No more types than shown were tested or were positive.Data updated on 09 Feb 2017 (data as of 30 Jun 2015).aIncludes cases from Australia, Bangladesh, India, South Korea, Lebanon, Philippines, Chile, Colombia, Ecuador, Guatemala, Honduras, Mexico, Paraguay, Venezuela, Mozambique,Nigeria, Senegal, Czech Republic, France, Greece, Poland, Portugal, Spain and United Kingdom.
Data sources:Alemany L, Eur Urol 2016; 69: 953
ICO/IARC HPV Information Centre

4 HPV RELATED STATISTICS - 51 -
4.3 HPV burden in men
The information to date regarding anogenital HPV infection is primarily derived from cross-sectionalstudies of selected populations such as general population, university students, military recruits, andstudies that examined husbands of control women, as well as from prospective studies. Special sub-groups include mainly studies that examined STD (sexually transmitted diseases) clinic attendees,MSM (men who have sex with men), HIV positive men, and partners of women with HPV lesions, CIN(cervical intraepithelial neoplasia), cervical cancer or cervical carcinoma in situ. Globally, prevalence ofexternal genital HPV infection in men is higher than cervical HPV infection in women, but persistenceis less likely. As with genital HPV prevalence, high numbers of sexual partners increase the acquisitionof oncogenic HPV infections (Vaccine 2012, Vol. 30, Suppl 5). In this section, the HPV burden amongmen in Indonesia is presented.
Methods
HPV burden in men was based on published systematic reviews and meta-analyses (Dunne EF, J InfectDis 2006; 194: 1044, Smith JS, J Adolesc Health 2011; 48: 540, Olesen TB, Sex Transm Infect 2014;90: 455, and Hebnes JB, J Sex Med 2014; 11: 2630) up to October 31, 2015. The search terms for thereview were human papillomavirus, men, polymerase chain reaction (PCR), hybrid capture (HC), andviral DNA. References cited in selected articles were also investigated. Inclusion criteria were: HPVDNA detection by means of PCR or HC (ISH if data are not available for the country), and a detaileddescription of HPV DNA detection and genotyping techniques used. The number of cases tested andHPV positive cases were extracted for each study to estimate the anogenital prevalence of HPV DNA.Binomial 95% confidence intervals were calculated for each anogenital HPV prevalence.
Table 26: Studies on HPV prevalence among men in IndonesiaAnatomic sites HPV detection Age HPV prevalence
Study samples method Population (years) No % (95% CI)No Data Avail-able
- - - - - - -
Data updated on 20 Nov 2018 (data as of 31 Oct 2015).95% CI: 95% Confidence Interval;Data sources:Based on published systematic reviews, the ICO HPV Information Centre has updated data until October 2015. Reference publications: 1) Dunne EF, J Infect Dis 2006; 194: 1044 2) SmithJS, J Adolesc Health 2011; 48: 540 3) Olesen TB, Sex Transm Infect 2014; 90: 455 4) Hebnes JB, J Sex Med 2014; 11: 2630.
Table 27: Studies on HPV prevalence among men from special subgroups in IndonesiaAnatomic sites HPV detection Age HPV prevalence
Study samples method Population (years) No % (95% CI)No Data Avail-able
- - - - - - -
Data updated on 20 Nov 2018 (data as of 31 Oct 2015).95% CI: 95% Confidence Interval;Data sources:Based on published systematic reviews, the ICO HPV Information Centre has updated data until October 2015. Reference publications: 1) Dunne EF, J Infect Dis 2006; 194: 1044 2) SmithJS, J Adolesc Health 2011; 48: 540 3) Olesen TB, Sex Transm Infect 2014; 90: 455 4) Hebnes JB, J Sex Med 2014; 11: 2630.
ICO/IARC HPV Information Centre

4 HPV RELATED STATISTICS - 52 -
4.4 HPV burden in the head and neck
The last evaluation of the International Agency for Research in Cancer (IARC) on the carcinogenicity ofHPV in humans concluded that (a) there is enough evidence for the carcinogenicity of HPV type 16 inthe oral cavity, oropharynx (including tonsil cancer, base of tongue cancer and other oropharyngeal can-cer sites), and (b) limited evidence for laryngeal cancer (IARC Monograph Vol 100B). There is increasingevidence that HPV-related oropharyngeal cancers constitute an epidemiological, molecular and clinicaldistinct form as compared to non HPV-related ones. Some studies indicate that the most likely expla-nation for the origin of this distinct form of head and neck cancers associated with HPV is a sexuallyacquired oral HPV infection that is not cleared, persists and evolves into a neoplastic lesion. The mostrecent figures estimate that 25.6% of all oropharyngeal cancers are attributable to HPV infection withHPV16 being the most frequent type (de Martel C. Lancet Oncol. 2012;13(6):607). In this section, theHPV burden in the head and neck in Indonesia is presented..
4.4.1 Burden of oral HPV infection in healthy population
Table 28: Studies on oral HPV prevalence among healthy in IndonesiaMethod HPV detection Prev. of 5 most
specimen method frequentcollection and and targeted Age No. HPV prevalence HPVs
Study anatomic site HPV types Population (years) Tested % (95% CI) HPV type (%)MENNo DataAvailable
- - - - - - - -
WOMENNo DataAvailable
- - - - - - - -
BOTH OR UNSPECIFIEDNo DataAvailable
- - - - - - - -
Data as of 29 Feb 2012. Only for European countries.95% CI: 95% Confidence Interval;Data sources:Systematic review and meta-analysis was performed by ICO HPV Information Centre until July 2012. Pubmed was searched using the keywords oral and papillomavirus. Inclusion criteria:studies reporting oral HPV prevalence in healthy population in Europe; n > 50. Exclusion criteria: focused only in children or immunosuppressed population; not written in English;case-control studies; commentaries and systematic reviews and studies that did not use HPV DNA detection methods.
4.4.2 HPV burden in head and neck cancers
Table 29: Studies on HPV prevalence among cases of oral cavity cancer in IndonesiaHPV detection Prevalence of 5 most
method and targeted HPV prevalence frequent HPVsStudy HPV types No. Tested % (95% CI) HPV type (%)
MENNo Data Available - - - - -
WOMENNo Data Available - - - - -
BOTH OR UNSPECIFIEDNo Data Available - - - - -
Data as of 31 Dec 2015. Only for European countries.95% CI: 95% Confidence Interval;Data sources:Based on systematic reviews and meta-analysis performed by ICO. Reference publications: 1) Ndiaye C, Lancet Oncol 2014; 15: 1319 2) Kreimer AR, Cancer Epidemiol Biomarkers Prev2005; 14: 467
ICO/IARC HPV Information Centre

4 HPV RELATED STATISTICS - 53 -
Table 30: Studies on HPV prevalence among cases of oropharyngeal cancer in IndonesiaHPV detection Prevalence of 5 most
method and targeted HPV prevalence frequent HPVsStudy HPV types No. Tested % (95% CI) HPV type (%)
MENNo Data Available - - - - -
WOMENNo Data Available - - - - -
BOTH OR UNSPECIFIEDNo Data Available - - - - -
Data as of 31 Dec 2015. Only for European countries.95% CI: 95% Confidence Interval;Data sources:Based on systematic reviews and meta-analysis performed by ICO. Reference publications: 1) Ndiaye C, Lancet Oncol 2014; 15: 1319 2) Kreimer AR, Cancer Epidemiol Biomarkers Prev2005; 14: 467
Table 31: Studies on HPV prevalence among cases of hypopharyngeal or laryngeal cancer in IndonesiaHPV detection Prevalence of 5 most
method and targeted HPV prevalence frequent HPVsStudy HPV types No. Tested % (95% CI) HPV type (%)
MENNo Data Available - - - - -
WOMENNo Data Available - - - - -
BOTH OR UNSPECIFIEDNo Data Available - - - - -
Data as of 31 Dec 2015. Only for European countries.95% CI: 95% Confidence Interval;Data sources:Based on systematic reviews and meta-analysis performed by ICO. Reference publications: 1) Ndiaye C, Lancet Oncol 2014; 15: 1319 2) Kreimer AR, Cancer Epidemiol Biomarkers Prev2005; 14: 467
ICO/IARC HPV Information Centre

5 FACTORS CONTRIBUTING TO CERVICAL CANCER - 54 -
5 Factors contributing to cervical cancer
HPV is a necessary cause of cervical cancer, but it is not a sufficient cause. Other cofactors are necessaryfor progression from cervical HPV infection to cancer. Tobacco smoking, high parity, long-term hormonalcontraceptive use, and co-infection with HIV have been identified as established cofactors. Co-infectionwith Chlamydia trachomatis and herpes simplex virus type-2, immunosuppression, and certain dietarydeficiencies are other probable cofactors. Genetic and immunological host factors and viral factors otherthan type, such as variants of type, viral load and viral integration, are likely to be important but havenot been clearly identified. (Muñoz N, Vaccine 2006; 24(S3): 1-10). In this section, the prevalence ofsmoking, parity (fertility), oral contraceptive use, and HIV in Indonesia are presented.
Table 32: Factors contributing to cervical carcinogenesis (cofactors) in IndonesiaINDICATORa MALE FEMALE TOTALSmoking
Smoking of any tobacco adjustedprevalence (%) [95% CI]
Current1,b,c,± 73.3 [56.6-89.9] 3.8 [3.0-4.8] 38.5 [29.8-47.2]Daily1,b,d,± 63.9 [49.0-80.4] 2.4 [1.8-3.1] 33.1 [25.3-41.6]
Cigarette smoking adjustedprevalence (%) [95% CI]
Current1,b,c,± 63.0 [48.9-78.8] 3.5 [2.7-4.3] 33.2 [25.7-41.5]Daily1,b,d,± 59.4 [45.1-74.6] 2.3 [1.7-2.9] 30.8 [23.4-38.6]
ParityTotal fertility rate per woman2,∓ - 2.6 -
Age-specific fertility rate(per 1000 women)
15-19 years2,∗ - 48.0 -20-24 years2,∗ - 138.0 -25-29 years2,∗ - 143.0 -30-34 years2,∗ - 103.0 -35-39 years2,∗ - 62.0 -40-44 years2,∗ - 21.0 -45-49 years2,∗ - 4.0 -
Hormonal contraceptionOral contraceptive use (%) among women15-49yrswho are married or in union3,?
- 13.4 -
Hormonal contraception use (%) (pill, injectable orimplant), among women15-49yrs who are marriedor in union3,e,?
- 49.4 -
HIVEstimated percent of adults aged 15-49 whoare living with HIV [low estimate - highestimate]4, f ,?
- - 0.5 [0.4 - 0.6]
Estimated percent of young adults aged 15-24who are living with HIV [low estimate - highestimate]4, f ,?
0.4 [0.2 - 0.6] 0.4 [0.3 - 0.5] -
HIV prevalence (%) among female sex workers inthe capital city4,g,?
- 7 -
HIV prevalence (%) among men who have sex withmen in the capital city4,5,?
25.8 - -
Estimated number of adults (15+ years) livingwith HIV [low estimate - high estimate]4,h,?
- 250 000 [220 000 - 280 000] 680 000 [590 000 - 780 000]
Estimated number of adults and children livingwith HIV [low estimate - high estimate]4,h,?
- - 680 000 [590 000 - 780 000]
Estimated number of AIDS deaths in adults andchildren [low estimate - high estimate]4,i,?
- - 35 000 [31 000 - 40 000]
Data accessed on 22 Mar 2017.aPlease refer to original source for methods of estimation of the following indicators.bAdjusted and age-standardized prevalence estimates of tobacco use by country, for the year 2013. These rates are constructed solely for the purpose of comparing tobacco use prevalenceestimates across countries, and should not be used to estimate the number of smokers in the population.c"Current" means smoking at the time of the survey, including daily and non-daily smoking. "Tobacco smoking" means smoking any form of tobacco, including cigarettes, cigars, pipes,hookah, shisha, water-pipe, etc. and excluding smokeless tobacco.d "Daily" means smoking every day at the time of the survey. "Tobacco smoking" means smoking any form of tobacco, including cigarettes, cigars, pipes, hookah, shisha, water-pipe, etc. andexcluding smokeless tobacco.eProportion (%) of women using hormonal contraception (pill, injectable or implant), among those of reproductive age who are married or in union.f Estimates include all people with HIV infection, regardless of whether they have developed symptoms of AIDS.gData on key populations at higher risk from country progress reports typically derive from surveys in capital cities and are not representative of the entire country. In particular, surveysin capital cities are likely to overestimate national HIV prevalence and service coverage.hThe number of people with HIV infection, whether or not they have developed symptoms of AIDS, estimated to be alive at the end of a specific year.iThe estimated number of adults and children that have died due to HIV/AIDS in a specific year.Year of estimate: ±2013; ∓2012; ∗2010; ?2015;Data sources:1WHO report on the global tobacco epidemic, 2015: The MPOWER package. Geneva, World Health Organization, 2015. Available at http://www.who.int/tobacco/global_report/2015/en/index.html
(Continued on next page)
ICO/IARC HPV Information Centre

5 FACTORS CONTRIBUTING TO CERVICAL CANCER - 55 -
( Table 32 – continued from previous page)2United Nations, Department of Economic and Social Affairs, Population Division (2015). World Fertility Data 2015 (POP/DB/Fert/Rev2015). Available at: http://www.un.org/en/development/desa/population/publications/dataset/fertility/wfd2015.shtml. [Accessed on March 22, 2017].3United Nations, Department of Economic and Social Affairs, Population Division (2016). World Contraceptive Use 2016 (POP/DB/CP/Rev2016). http://www.un.org/en/development/desa/population/publications/dataset/contraception/wcu2016.shtml. Available at: [Accessed on March 22, 2017].4UNAIDS database [internet]. Available at: http://aidsinfo.unaids.org/ [Accessed on March 22, 2017]5 Integrated Biological and Behavior Survey, 2015
ICO/IARC HPV Information Centre
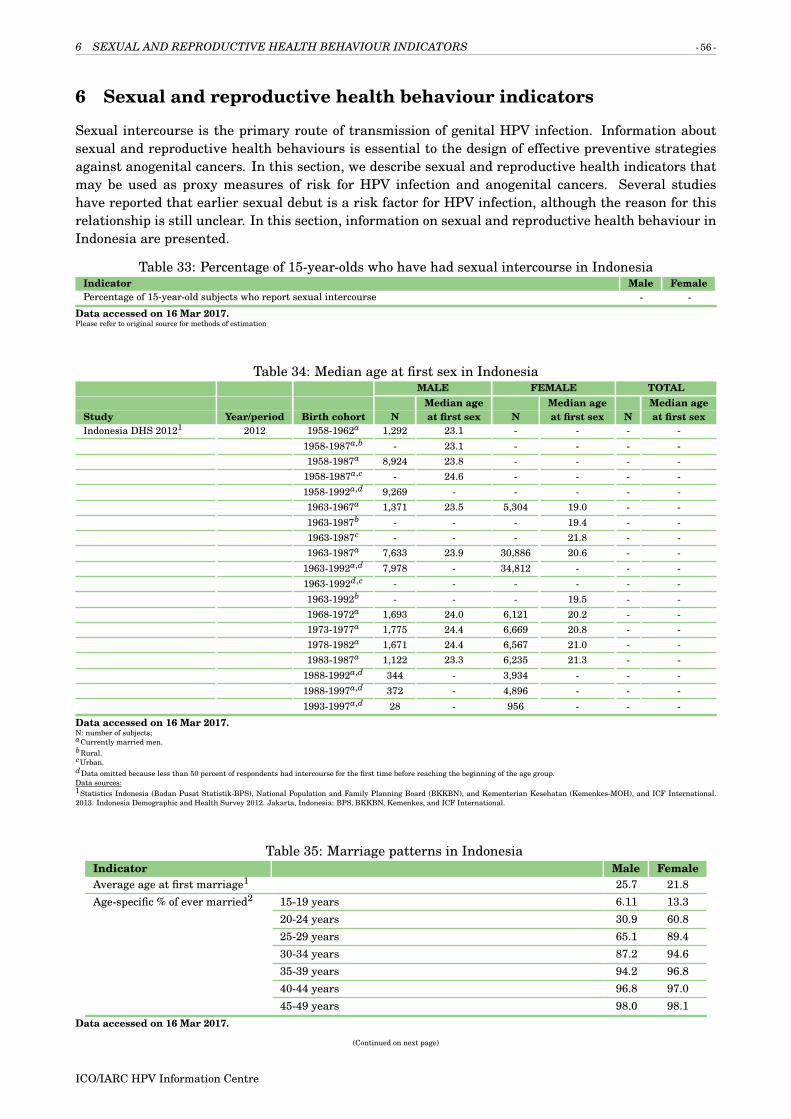
6 SEXUAL AND REPRODUCTIVE HEALTH BEHAVIOUR INDICATORS - 56 -
6 Sexual and reproductive health behaviour indicators
Sexual intercourse is the primary route of transmission of genital HPV infection. Information aboutsexual and reproductive health behaviours is essential to the design of effective preventive strategiesagainst anogenital cancers. In this section, we describe sexual and reproductive health indicators thatmay be used as proxy measures of risk for HPV infection and anogenital cancers. Several studieshave reported that earlier sexual debut is a risk factor for HPV infection, although the reason for thisrelationship is still unclear. In this section, information on sexual and reproductive health behaviour inIndonesia are presented.
Table 33: Percentage of 15-year-olds who have had sexual intercourse in IndonesiaIndicator Male FemalePercentage of 15-year-old subjects who report sexual intercourse - -
Data accessed on 16 Mar 2017.Please refer to original source for methods of estimation
Table 34: Median age at first sex in IndonesiaMALE FEMALE TOTAL
Median age Median age Median ageStudy Year/period Birth cohort N at first sex N at first sex N at first sexIndonesia DHS 20121 2012 1958-1962a 1,292 23.1 - - - -
1958-1987a,b - 23.1 - - - -1958-1987a 8,924 23.8 - - - -
1958-1987a,c - 24.6 - - - -1958-1992a,d 9,269 - - - - -1963-1967a 1,371 23.5 5,304 19.0 - -1963-1987b - - - 19.4 - -1963-1987c - - - 21.8 - -1963-1987a 7,633 23.9 30,886 20.6 - -
1963-1992a,d 7,978 - 34,812 - - -1963-1992d,c - - - - - -1963-1992b - - - 19.5 - -1968-1972a 1,693 24.0 6,121 20.2 - -1973-1977a 1,775 24.4 6,669 20.8 - -1978-1982a 1,671 24.4 6,567 21.0 - -1983-1987a 1,122 23.3 6,235 21.3 - -
1988-1992a,d 344 - 3,934 - - -1988-1997a,d 372 - 4,896 - - -1993-1997a,d 28 - 956 - - -
Data accessed on 16 Mar 2017.N: number of subjects;aCurrently married men.bRural.cUrban.dData omitted because less than 50 percent of respondents had intercourse for the first time before reaching the beginning of the age group.Data sources:1Statistics Indonesia (Badan Pusat Statistik-BPS), National Population and Family Planning Board (BKKBN), and Kementerian Kesehatan (Kemenkes-MOH), and ICF International.2013. Indonesia Demographic and Health Survey 2012. Jakarta, Indonesia: BPS, BKKBN, Kemenkes, and ICF International.
Table 35: Marriage patterns in IndonesiaIndicator Male FemaleAverage age at first marriage1 25.7 21.8Age-specific % of ever married2 15-19 years 6.11 13.3
20-24 years 30.9 60.825-29 years 65.1 89.430-34 years 87.2 94.635-39 years 94.2 96.840-44 years 96.8 97.045-49 years 98.0 98.1
Data accessed on 16 Mar 2017.
(Continued on next page)
ICO/IARC HPV Information Centre

6 SEXUAL AND REPRODUCTIVE HEALTH BEHAVIOUR INDICATORS - 57 -
( Table 35 – continued from previous page)Please refer to original source for methods of estimation.Year of estimate: ±2010; ∓2012;Data sources:1The world bank: health nutrition and population statistics. Updated 16-Dec-2016. Accessed on March 16 2017. Available at http://data.worldbank.org/data-catalog/health-nutrition-and-population-statistics2United Nations, Department of Economic and Social Affairs, Population Division (2015). World Marriage Data 2015 (POP/DB/Marr/Rev2015). Available at: http://www.un.org/en/development/desa/population/theme/marriage-unions/WMD2015.shtml Accessed on April 3, 2017.
ICO/IARC HPV Information Centre

7 HPV PREVENTIVE STRATEGIES - 58 -
7 HPV preventive strategies
It is established that well-organised cervical screening programmes or widespread good quality cytologycan reduce cervical cancer incidence and mortality. The introduction of HPV vaccination could alsoeffectively reduce the burden of cervical cancer in the coming decades. This section presents indicatorson basic characteristics and performance of cervical cancer screening, status of HPV vaccine licensureand introduction in Indonesia.
7.1 Cervical cancer screening practices
Screening strategies differ between countries. Some countries have population-based programmes,where in each round of screening women in the target population are individually identified and in-vited to attend screening. This type of programme can be implemented nationwide or only in specificregions of the country. In opportunistic screening, invitations depend on the individual’s decision oron encounters with health-care providers. The most frequent method for cervical cancer screening iscytology, and there are alternative methods such as HPV DNA tests and visual inspection with aceticacid (VIA). VIA is an alternative to cytology-based screening in low-resource settings (the ’see and treat’approach). HPV DNA testing is being introduced into some countries as an adjunct to cytology screen-ing (’co-testing’) or as the primary screening test to be followed by a secondary, more specific test, suchas cytology.
Table 36: Main characteristics of cervical cancer screening in Indonesia
Availability of a cervical cancer screening programmeα Yes
Quality assurance structure and mandate to supervise and to monitor the screeningprocessβ
Yes
Active invitation to screeningγ No
Main screening test used for primary screening VIA
Undergoing demonstration projects
Screening ages (years) 30-50
Screening interval or frequency of screenings 5 yearsData accessed on 31 Dec 2016.Single visit approach (VIA + cryotherapy). From January 2007 to December 2011 the project was piloted in the district of Karawang, and after the pilot it was up-scaled.αPublic national cervical cancer screening program in place (Cytology/VIA/HPV testing). Countries may have clinical guidelines or protocols, and cervical cancer screening services in aprivate sector but without a public national program. Publicly mandatβSelf-reported quality assurance: Organised programmes provide for a national or regional team responsible for implementation and require providers to follow guidelines, rules, or standardoperating procedures. They also define a quality assurance structurγSelf-reported active invitation or recruitment, as organised population-based programmes, identify and personally invite each eligible person in the target population to attend a givenround of screening.Data sources:Technical guidelines for control of breast and cervical cancer (Pedoman teknis pengendalian kanker payudara dan kanker leher rahim), 2010. Available at: http://www.dinkesjatengprov.go.id/v2010/dokumen/2014/SDK/Mibangkes/perundangan/Bina%20Upaya%20Kes/2010/KMK%20No.%20796%20ttg%20Kanker%20Payudara%20dan%20Kanker%20Leher%20Rahim.pdfWHO. Strategic framework for the comprehensive control of cancer cervix in South-East Asia Region. 2015. http://apps.who.int/iris/handle/10665/152098
ICO/IARC HPV Information Centre

7 HPV PREVENTIVE STRATEGIES - 59 -
Table 37: Estimated coverage of cervical cancer screening in IndonesiaReference1,a Year Population Urban vs
rural orboth (all)
N Women Age range Within thelast
year(s)
Coverage(%)b
Kim 2013 2007-2011 General femalepopulation
All 123,508 30-50 5y 24 .4
Data accessed on 31 Dec 2016.aData from Karawang District. Coverage of the VIA pilot programbProportion of women in the total sample of the mentioned age range in the country or region that reported having a Pap smear during a given time period (e.g., last year, last 2, 3, 5 yearsor ever).Data sources:1Kim YM, Lambe FM, Soetikno D, Wysong M, Tergas AI, Rajbhandari P, Ati A, Lu E. Evaluation of a 5-year cervical cancer prevention project in Indonesia: opportunities, issues, andchallenges. J Obstet Gynaecol Res. 2013;39(6):1190-9.
Figure 39: Estimated coverage of cervical cancer screening in Indonesia, by age and study
Est
imat
ed c
ervi
cal c
ance
r sc
reen
ing
cove
rage
(%)(
a)
0
20
40
60
80
100
No data available
Age group (years)
Data accessed on 31 Dec 2016.aProportion of women in the total sample of the mentioned age range in the country or region that reported having a Pap smear during a given time period (e.g., last year, last 2, 3, 5 yearsor ever).Data sources:ICO Information Centre on HPV and Cancer. Country-specific references identified in each country-specific report as general recommendation from relevant scientific organizations and/orpublications.
Table 38: Estimated coverage of cervical cancer screening in Indonesia , by regionRegion N Women Age range LYa Population Coverage
(%)bYear(s)studied
Reference1
Batu Jaya 8,676 30-50 5y General femalepopulation
14.5 2007-2011
Kim 2013
Ciampel 3,464 30-50 5y General femalepopulation
46.4 2007-2011
Kim 2013
Cibuaya 6,010 30-50 5y General femalepopulation
14.1 2007-2011
Kim 2013
Cikampek 9,931 30-50 5y General femalepopulation
20.9 2007-2011
Kim 2013
Cilamaya 9,547 30-50 5y General femalepopulation
34.3 2007-2011
Kim 2013
Jatisari 5,218 30-50 5y General femalepopulation
34.6 2007-2011
Kim 2013
Karawang 6,707 30-50 5y General femalepopulation
19.8 2007-2011
Kim 2013
Klari 7,826 30-50 5y General femalepopulation
24.9 2007-2011
Kim 2013
(Continued on next page)
ICO/IARC HPV Information Centre

7 HPV PREVENTIVE STRATEGIES - 60 -
( Table 38 – continued from previous page)
Region N Women Age range LYa Population Coverage(%)b
Year(s)studied
Reference1
Kota Baru 4,338 30-50 5y General femalepopulation
26.3 2007-2011
Kim 2013
Lemah Abang 8,153 30-50 5y General femalepopulation
15.7 2007-2011
Kim 2013
Pangkalan 4,417 30-50 5y General femalepopulation
41.5 2007-2011
Kim 2013
Pedes 8,280 30-50 5y General femalepopulation
20.9 2007-2011
Kim 2013
Rengas Dengklok 11,322 30-50 5y General femalepopulation
31.1 2007-2011
Kim 2013
Telagasari 7,677 30-50 5y General femalepopulation
30.4 2007-2011
Kim 2013
Tempuran 8,734 30-50 5y General femalepopulation
19.2 2007-2011
Kim 2013
Tirta Jaya 7,622 30-50 5y General femalepopulation
19.1 2007-2011
Kim 2013
Tirta Mulya 5,586 30-50 5y General femalepopulation
18.2 2007-2011
Kim 2013
Data accessed on 31 Dec 2016.aLY: Within the last year(s).bProportion of women in the total sample of the mentioned age range in the country or region that reported having a Pap smear during a given time period (e.g., last year, last 2, 3, 5 yearsor ever).Data sources:1Kim YM, Lambe FM, Soetikno D, Wysong M, Tergas AI, Rajbhandari P, Ati A, Lu E. Evaluation of a 5-year cervical cancer prevention project in Indonesia: opportunities, issues, andchallenges. J Obstet Gynaecol Res. 2013;39(6):1190-9.
ICO/IARC HPV Information Centre
8 PROTECTIVE FACTORS FOR CERVICAL CANCER - 61 -
7.2 HPV vaccination
Table 39: National HPV Immunization programme in IndonesiaFemale Male
Year of introduction - -
Primary target age (years) - -
Organized catch-up age (years) - -
Opportunistic catch-up age (years) - -
Strategy - -
Schedulea,b - -
Data updated on 11 Jul 2017 (data as of 31 Dec 2016)a 2 doses: 0-6m if not otherwise stated. Since 2014, based on clinical trials results several agencies responsible for the scientific evaluation of medicines, like the European Medicines Agency,aproved a two-dose schedule for girls aged less than 15 or 14 depending on the vaccine (Cervarix or Gardasil).b 3-doses standard: administration of three doses following the standard vaccination schedule as 0-2-6 months for the quadrivalent vaccine or 0-1-6 months for the bivalent vaccine.Data sources:1 Adapted from Bruni et al 2016 Lancet Global Health (data up to October 2014).
Figure 40: Reported HPV vaccination coverage in females by birth cohort in National HPVImmunization programme in Indonesia
No data available
0
10
20
30
40
50
60
70
80
90
100
HP
V v
acci
natio
n co
vera
ge (
%)
Data updated on 11 Jul 2017 (data as of 31 Oct 2014)Data sources:1 Adapted from Bruni et al 2016 Lancet Global Health (data up to October 2014).
8 Protective factors for cervical cancer
Male circumcision and the use of condoms have shown a significant protective effect against HPV trans-mission.
ICO/IARC HPV Information Centre
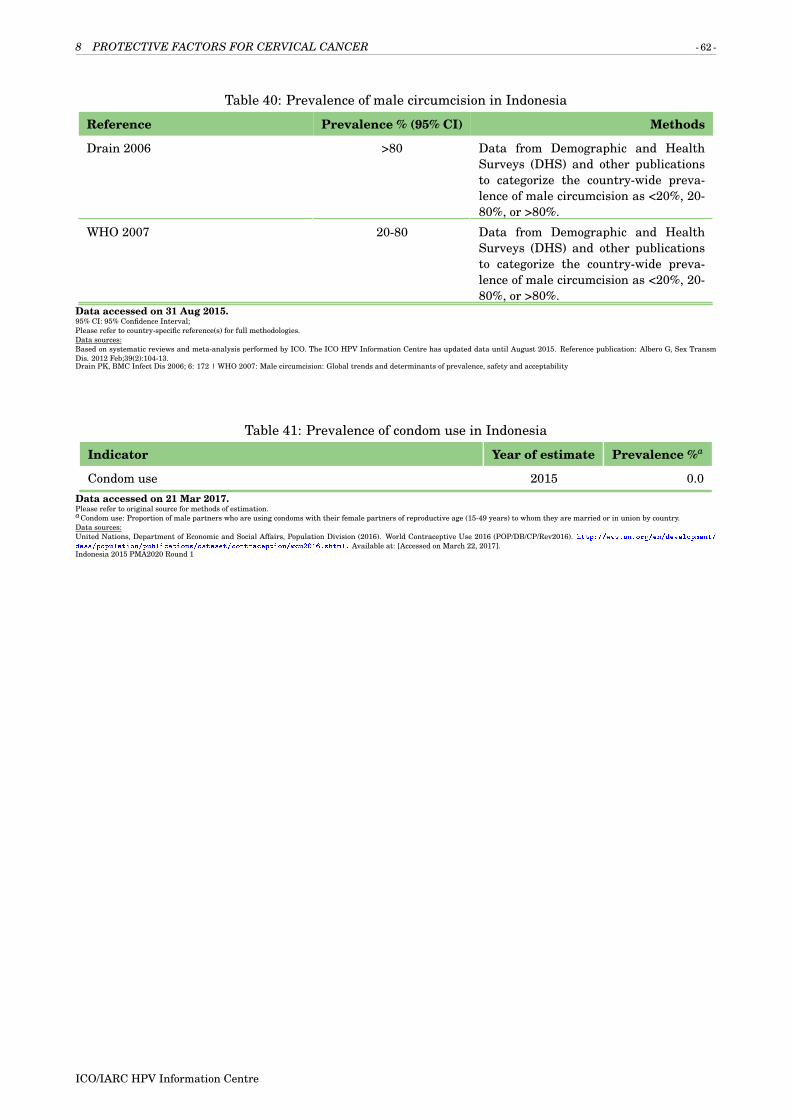
8 PROTECTIVE FACTORS FOR CERVICAL CANCER - 62 -
Table 40: Prevalence of male circumcision in Indonesia
Reference Prevalence % (95% CI) Methods
Drain 2006 >80 Data from Demographic and HealthSurveys (DHS) and other publicationsto categorize the country-wide preva-lence of male circumcision as <20%, 20-80%, or >80%.
WHO 2007 20-80 Data from Demographic and HealthSurveys (DHS) and other publicationsto categorize the country-wide preva-lence of male circumcision as <20%, 20-80%, or >80%.
Data accessed on 31 Aug 2015.95% CI: 95% Confidence Interval;Please refer to country-specific reference(s) for full methodologies.Data sources:Based on systematic reviews and meta-analysis performed by ICO. The ICO HPV Information Centre has updated data until August 2015. Reference publication: Albero G, Sex TransmDis. 2012 Feb;39(2):104-13.Drain PK, BMC Infect Dis 2006; 6: 172 | WHO 2007: Male circumcision: Global trends and determinants of prevalence, safety and acceptability
Table 41: Prevalence of condom use in Indonesia
Indicator Year of estimate Prevalence %a
Condom use 2015 0.0Data accessed on 21 Mar 2017.Please refer to original source for methods of estimation.aCondom use: Proportion of male partners who are using condoms with their female partners of reproductive age (15-49 years) to whom they are married or in union by country.Data sources:United Nations, Department of Economic and Social Affairs, Population Division (2016). World Contraceptive Use 2016 (POP/DB/CP/Rev2016). http://www.un.org/en/development/desa/population/publications/dataset/contraception/wcu2016.shtml. Available at: [Accessed on March 22, 2017].Indonesia 2015 PMA2020 Round 1
ICO/IARC HPV Information Centre

9 INDICATORS RELATED TO IMMUNISATION PRACTICES OTHER THAN HPV VACCINES - 63 -
9 Indicators related to immunisation practices other than HPV vac-cines
This section presents data on immunisation coverage and practices for selected vaccines. This infor-mation will be relevant for assessing the country’s capacity to introduce and implement the new HPVvaccines. The data are periodically updated and posted on the WHO Immunisation surveillance, assess-ment and monitoring website at http://who.int/immunization_monitoring/en/.
9.1 Immunisation schedule
Table 42: General immunization schedule in IndonesiaVaccine Schedule Coveragea CommentBacille Calmette-Guérin vaccine 1 month; entire -Tetanus and diphtheria toxoid childrens’dose
6-7 years; entire -
Diphtheria and Tetanus and Pertussis andHaemophilus influenzae and Hepatitis Bvaccine
2, 3, 4, 18 months; entire -
Hepatitis B vaccine 0-7 days; entire -Inactivated polio vaccine 2, 3, 4 months; part -Measles vaccine 9, 24 months; entire second dose at 24 months
in selected provinceOral polio vaccine 1, 2, 3, 4 months; entire -Tetanus and diphtheria toxoid for olderchildren / adults vaccube
7-8, 8-9 years; entire -
Tetanus toxoid vaccine 15-39 years; entire CBAWData accessed on 27 Jan 2017.The shedules are the country official reported figuresaEntire:introduced in the entire country. Part:partially introduced.Data sources:Annual WHO/UNICEF Joint Reporting Form (Update of 2015/July/15). Geneva, Immunization, Vaccines and Biologicals (IVB), World Health Organization. Available at: http://www.who.int/immunization/monitoring_surveillance/en/
9.2 Immunisation coverage estimates
Table 43: Immunization coverage estimates in IndonesiaIndicator Year of estimation Coverage (%)Third dose of diphtheria toxoid, tetanus toxoid and pertussis vaccine 2015 84Third dose of hepatitis B vaccine administered to infants 2015 84Third dose of Haemophilus influenzae type B vaccine 2015 93Measles-containing vaccine 2015 87Third dose of polio vaccine 2015 85
Data accessed on 27 Jan 2017.The coverage figures (%) are the country official reported figures. Immunization coverage levels are presented as a percentage of a target population that has been vaccinated.Data sources:Annual WHO/UNICEF Joint Reporting Form and WHO Regional offices reports (Update of 2015/July/16). Geneva, Immunization, Vaccines and Biologicals (IVB),World Health Organization.Available at: http://www.who.int/immunization/monitoring_surveillance/en/
ICO/IARC HPV Information Centre

10 GLOSSARY - 64 -
10 Glossary
Table 44: GlossaryTerm DefinitionIncidence Incidence is the number of new cases arising in a given period in a specified
population. This information is collected routinely by cancer registries. It can beexpressed as an absolute number of cases per year or as a rate per 100,000persons per year (see Crude rate and ASR below). The rate provides anapproximation of the average risk of developing a cancer.
Mortality Mortality is the number of deaths occurring in a given period in a specifiedpopulation. It can be expressed as an absolute number of deaths per year or as arate per 100,000 persons per year.
Prevalence The prevalence of a particular cancer can be defined as the number of persons ina defined population who have been diagnosed with that type of cancer, and whoare still alive at the end of a given year, the survivors. Complete prevalencerepresents the number of persons alive at certain point in time who previouslyhad a diagnosis of the disease, regardless of how long ago the diagnosis was, or ifthe patient is still under treatment or is considered cured. Partial prevalence ,which limits the number of patients to those diagnosed during a fixed time in thepast, is a particularly useful measure of cancer burden. Prevalence of cancersbased on cases diagnosed within one, three and five are presented as they arelikely to be of relevance to the different stages of cancer therapy, namely, initialtreatment (one year), clinical follow-up (three years) and cure (five years).Patients who are still alive five years after diagnosis are usually consideredcured since the death rates of such patients are similar to those in the generalpopulation. There are exceptions, particularly breast cancer. Prevalence ispresented for the adult population only (ages 15 and over), and is available bothas numbers and as proportions per 100,000 persons.
Crude rate Data on incidence or mortality are often presented as rates. For a specifictumour and population, a crude rate is calculated simply by dividing the numberof new cancers or cancer deaths observed during a given time period by thecorresponding number of person years in the population at risk. For cancer, theresult is usually expressed as an annual rate per 100,000 persons at risk.
ASR (age-standardisedrate)
An age-standardised rate (ASR) is a summary measure of the rate that apopulation would have if it had a standard age structure. Standardization isnecessary when comparing several populations that differ with respect to agebecause age has a powerful influence on the risk of cancer. The ASR is aweighted mean of the age-specific rates; the weights are taken from populationdistribution of the standard population. The most frequently used standardpopulation is the World Standard Population. The calculated incidence ormortality rate is then called age-standardised incidence or mortality rate(world). It is also expressed per 100,000. The world standard population used inGLOBOCAN is as proposed by Segi [1] and modified by Doll and al. [2]. Theage-standardised rate is calculated using 10 age-groups. The result may beslightly different from that computed using the same data categorised using thetraditional 5 year age bands.
Cumulative risk Cumulative incidence/mortality is the probability or risk of individualsgetting/dying from the disease during a specified period. For cancer, it isexpressed as the number of new born children (out of 100, or 1000) who would beexpected to develop/die from a particular cancer before the age of 75 if they hadthe rates of cancer observed in the period in the absence of competing causes.
Cytologically normalwomen
No abnormal cells are observed on the surface of their cervix upon cytology.
(Continued)
ICO/IARC HPV Information Centre

10 GLOSSARY - 65 -
Table 44 – ContinuedTerm DefinitionCervical IntraepithelialNeoplasia (CIN) /Squamous IntraepithelialLesions (SIL)
SIL and CIN are two commonly used terms to describe precancerous lesions orthe abnormal growth of squamous cells observed in the cervix. SIL is anabnormal result derived from cervical cytological screening or Pap smear testing.CIN is a histological diagnosis made upon analysis of cervical tissue obtained bybiopsy or surgical excision. The condition is graded as CIN 1, 2 or 3, according tothe thickness of the abnormal epithelium (1/3, 2/3 or the entire thickness).
Low-grade cervical lesions(LSIL/CIN-1)
Low-grade cervical lesions are defined by early changes in size, shape, andnumber of ab-normal cells formed on the surface of the cervix and may bereferred to as mild dysplasia, LSIL, or CIN-1.
High-grade cervicallesions (HSIL / CIN-2 /CIN-3 / CIS)
High-grade cervical lesions are defined by a large number of precancerous cellson the sur-face of the cervix that are distinctly different from normal cells. Theyhave the potential to become cancerous cells and invade deeper tissues of thecervix. These lesions may be referred to as moderate or severe dysplasia, HSIL,CIN-2, CIN-3 or cervical carcinoma in situ (CIS).
Carcinoma in situ (CIS) Preinvasive malignancy limited to the epithelium without invasion of thebasement membrane. CIN 3 encompasses the squamous carcinoma in situ.
Invasive cervical cancer(ICC) / Cervical cancer
If the high-grade precancerous cells invade the basement membrane is calledICC. ICC stages range from stage I (cancer is in the cervix or uterus only) tostage IV (the cancer has spread to distant organs, such as the liver).
Invasive squamous cellcarcinoma
Invasive carcinoma composed of cells resembling those of squamous epithelium
Adenocarcinoma Invasive tumour with glandular and squamous elements intermingled.Eastern Europe References included in Belarus, Bulgaria, Czech Republic, Hungary, Poland,
Republic of Moldova, Romania, Russian Federation, Slovakia, and Ukraine.Northern Europe References included in Denmark, Estonia, Finland, Iceland, Ireland, Latvia,
Lithuania, Norway, Sweden, and United Kingdom of Great Britain and NorthernIreland.
Southern Europe References included in Albania, Bosnia and Herzegovina, Croatia, Greece, Italy,Malta, Montenegro, Portugal, Serbia, Slovenia, Spain, The former YugoslavRepublic of Macedonia.
Western Europe References included in Austria, Belgium, France, Germany, Liechtenstein,Luxembourg, Netherlands, and Switzerland.
Europe PREHDICT References included in Albania, Austria, Belarus, Belgium, Bosnia andHerzegovina, Bulgaria, Croatia, Cyprus, Czech Republic, Denmark, Estonia,Finland, France, Germany, Greece, Hungary, Iceland, Ireland, Israel, Italy,Latvia, Liechtenstein, Lithuania, Luxembourg, Malta, Montenegro,Netherlands, Norway, Poland, Portugal, Republic of Moldova, Romania, RussianFederation, Serbia, Slovakia, Slovenia, Spain, Sweden, Switzerland, The formerYugoslav Republic of Macedonia, Turkey, Ukraine, and United Kingdom of GreatBritain and Northern Ireland.
ICO/IARC HPV Information Centre
10 GLOSSARY - 66 -
Acknowledgments
This report has been developed by the Unit of Infections and Cancer, Cancer Epidemiology ResearchProgram, at the Institut Català d’Oncologia (ICO, Catalan Institute of Oncology) within the PREHDICTproject (7th Framework Programme grant HEALTH-F3-2010-242061, PREHDICT). The HPV Informa-tion Centre is being developed by the Institut Català d’Oncologia (ICO). The Centre was originallylaunched by ICO with the collaboration of WHO’s Immunisation, Vaccines and Biologicals (IVB) depart-ment and support from the Bill and Melinda Gates Foundation.
Institut Català d’Oncologia (ICO), in alphabetic orderAlbero G, Barrionuevo-Rosas L, Bosch FX, Bruni L, de Sanjosé S, Gómez D, Mena M, Muñoz J, SerranoB.
7th Framework Programme grant PREHDICT project: health-economic modelling of PREventionstrategies for Hpv-related Diseases in European CounTries. Coordinated by Drs. Johannes Berkhofand Chris Meijer at VUMC, Vereniging Voor Christelijk Hoger Onderwijs Wetenschappelijk OnderzoekEn Patientenzorg, the Netherlands.(http://cordis.europa.eu/projects/rcn/94423_en.html)
7th Framework Programme grant HPV AHEAD project: Role of human papillomavirus infec-tion and other co-factors in the aetiology of head and neck cancer in India and Europe. Coordinated byDr. Massimo Tommasino at IARC, International Agency of Research on Cancer, Lyon, France.(http://cordis.europa.eu/project/rcn/100268_en.html)
International Agency for Research on Cancer (IARC)
ICO/IARC HPV Information Centre
- 67 -
Note to the reader
Anyone who is aware of relevant published data that may not have been included in the present reportis encouraged to contact the HPV Information Centre for potential contributions.
Although efforts have been made by the HPV Information Centre to prepare and include as accuratelyas possible the data presented, mistakes may occur. Readers are requested to communicate any errorsto the HPV Information Centre, so that corrections can be made in future volumes.
Disclaimer
The information in this database is provided as a service to our users. Any digital or printed publica-tion of the information provided in the web site should be accompanied by an acknowledgment of HPVInformation Centre as the source. Systematic retrieval of data to create, directly or indirectly, a scien-tific publication, collection, database, directory or website requires a permission from HPV InformationCentre.
The responsibility for the interpretation and use of the material contained in the HPV InformationCentre lies on the user. In no event shall the HPV Information Centre be liable for any damages arisingfrom the use of the information.
Licensed Logo Use
Use, reproduction, copying, or redistribution of PREHDICT or HPV Information Centre logos are strictlyprohibited without written explicit permission from the HPV Information Centre.
Contact information:
ICO/IARC HPV Information CentreInstitut Català d’OncologiaAvda. Gran Via de l’Hospitalet, 199-20308908 L’Hospitalet de Llobregat (Barcelona, Spain)e-mail: [email protected] adress: www.hpvcentre.net
ICO/IARC HPV Information Centre