Embed Size (px)
Citation preview

HSS4303B – Intro to EpidemiologyFeb 8, 2010 - Agreement
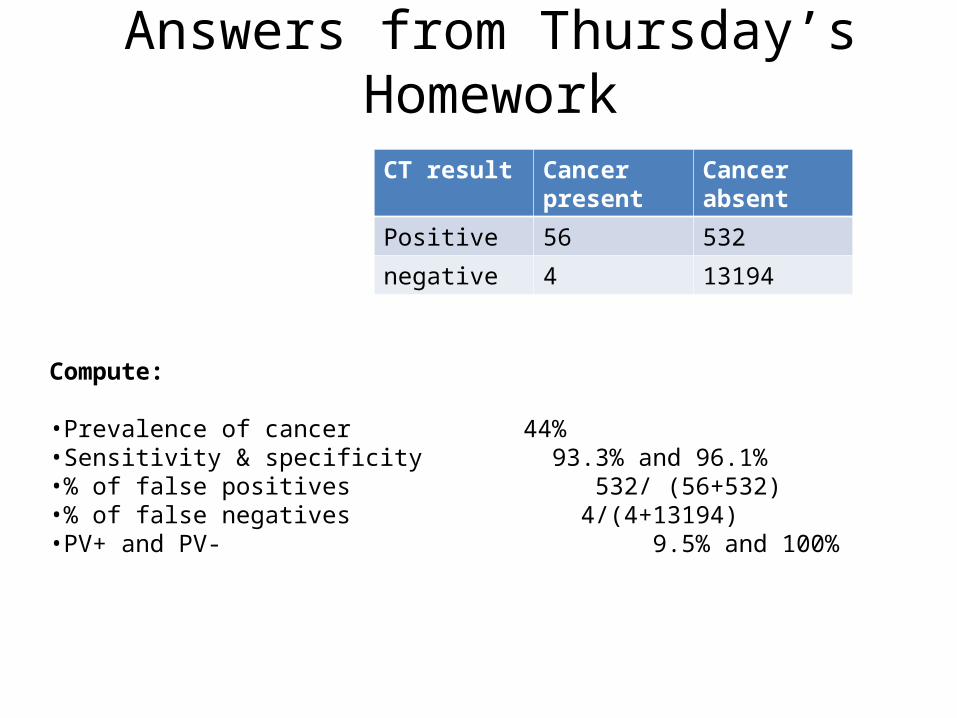
CT result Cancer present
Cancer absent
Positive 56 532
negative 4 13194
Compute:
•Prevalence of cancer 44%•Sensitivity & specificity 93.3% and 96.1%•% of false positives 532/ (56+532)•% of false negatives 4/(4+13194)•PV+ and PV- 9.5% and 100%
Answers from Thursday’s Homework
Last Time…
• Screening Tests– Validity and Reliability– Specificity and Sensitivity– Pos Predictive Value and Neg Predictive Value

Screening test results
Truly diseases (cases)
Truly non-diseases
Totals
Positive (thinks it’s a case)
a b a+b
Negative (thinks it’s not a case)
c d c+d
totals a+c b +d a+b+c+d
Sensitivity = a/(a+c)Specificity = d/(b+d)
PV+ = a/(a+b)
PV- = d/(c+d)

Ultimately, What Do All These Indicators Want To Tell Us?
“What is the likelihood is it that you have the disease?”
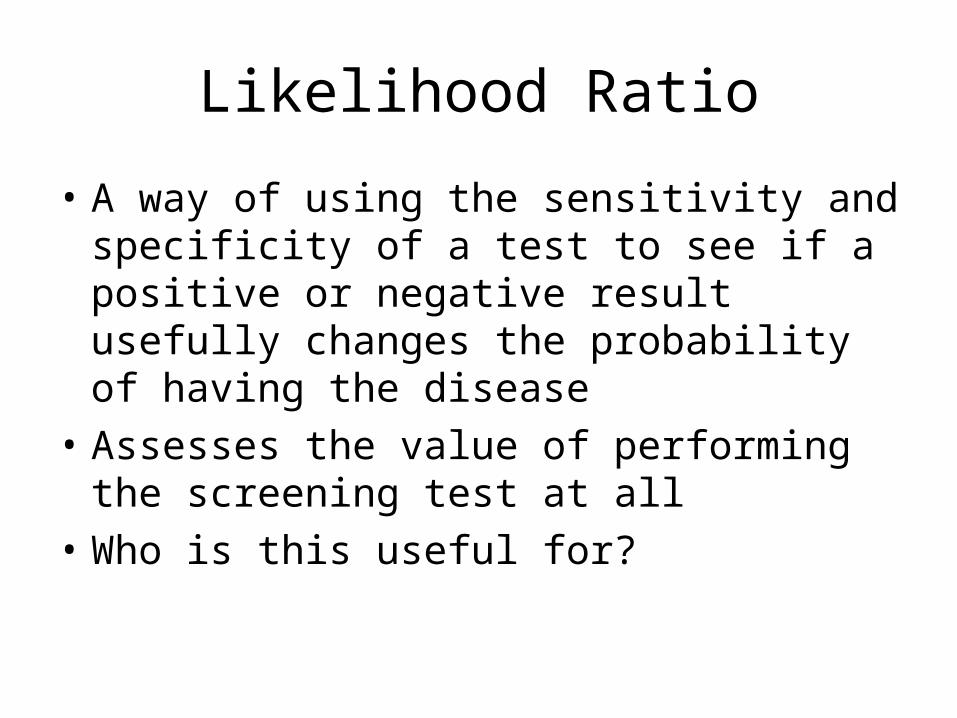
Likelihood Ratio
• A way of using the sensitivity and specificity of a test to see if a positive or negative result usefully changes the probability of having the disease
• Assesses the value of performing the screening test at all
• Who is this useful for?
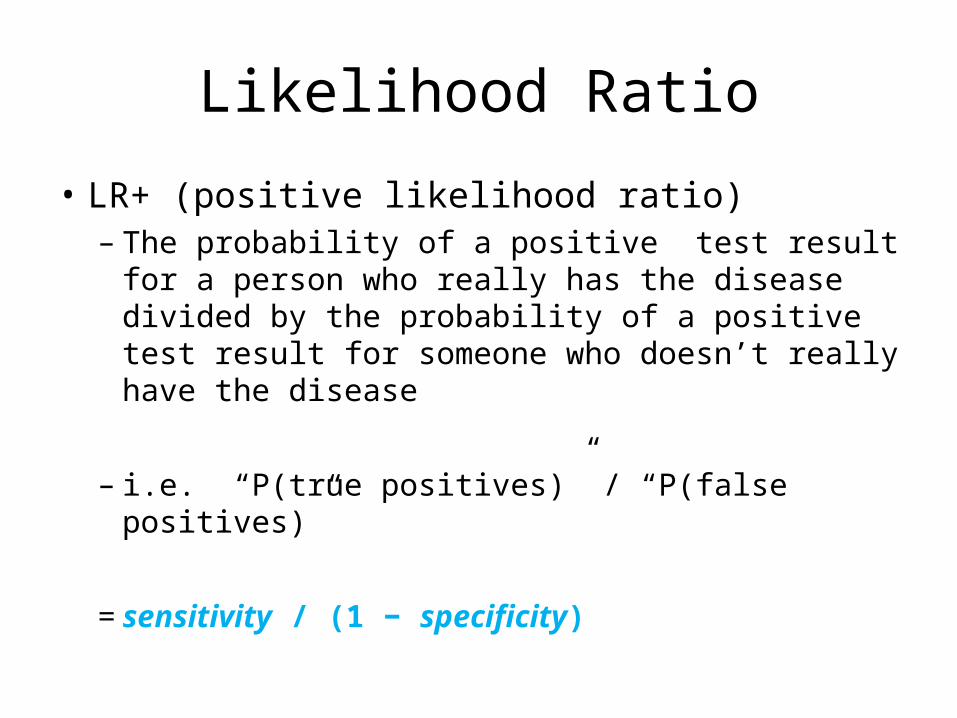
Likelihood Ratio
• LR+ (positive likelihood ratio)– The probability of a positive test result for a
person who really has the disease divided by the probability of a positive test result for someone who doesn’t really have the disease
– i.e. “P(true positives)” / “P(false positives)”
= sensitivity / (1 − specificity)
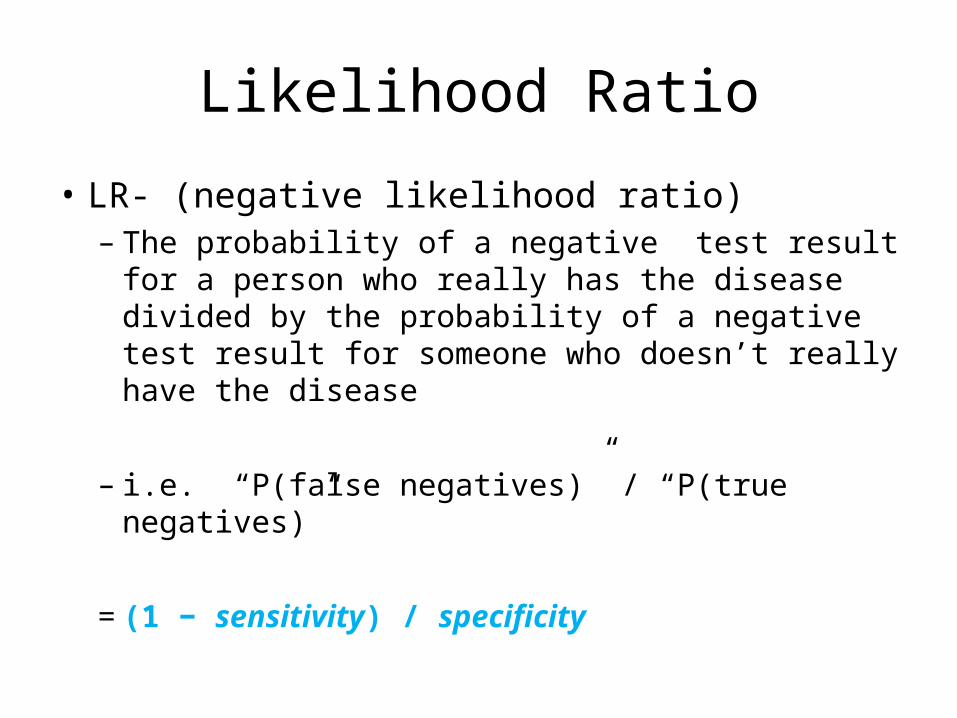
Likelihood Ratio
• LR- (negative likelihood ratio)– The probability of a negative test result for a
person who really has the disease divided by the probability of a negative test result for someone who doesn’t really have the disease
– i.e. “P(false negatives)” / “P(true negatives)”
= (1 − sensitivity) / specificity

Screening test results
Truly diseases (cases)
Truly non-diseases
Totals
Positive (thinks it’s a case)
a b a+b
Negative (thinks it’s not a case)
c d c+d
totals a+c b +d a+b+c+d
Sensitivity = a/(a+c)
Specificity = d/(b+d)
PV+ = a/(a+b)
PV- = d/(c+d)
True positivesTrue negativesFalse positivesFalse negatives
adbc
LR+ = P (true +ve)/ P(false +ve)
=(a/(a+c)) / (b/(b+d))=(a/(a+c))/(1-(d/(b+d))=sensitivity / (1-specificity)

Interpreting the LR
• A likelihood ratio of >1 indicates the test result is associated with the disease
• A likelihood ratio <1 indicates that the result is associated with absence of the disease
• In other words– High LR+ means strong suspicion that a +ve test result
means the person has the disease– Low LR- means strong suspicion that a –ve test result
means the person doesn’t have disease– What about “1”?

Interpreting the LR
• Arbitrary cutoffs:– LR+ >10 means strong diagnostic value– LR- <0.1 means strong diagnostic value
– (Some literature suggests 5 and 0.2 are more appropriate cutoffs)
The likelihood ratio, which combines information from sensitivity and specificity, gives an indication of how much the odds of disease change based on a positive or a negative result

LR+• The smallest possible value of the LR+ is zero,
when sensitivity is zero. • The maximum possible value of the LR+ is
infinity when the denominator is minimized (specificity = 1, so 1 - specificity = 0).
• LR+ = 1: indicates a test with no value in sorting out persons with and without the disease of interest, since the probability of a positive test result is equally likely for affected and unaffected persons.

LR-• The smallest value of the LR– occurs when the
numerator is minimized (sensitivity = 1, so 1 - sensitivity = 0), resulting in an LR– of zero.
• The largest value of the LR– occurs when the denominator is minimized (specificity = 0), resulting in an LR– of positive infinity.
• LR– = 1: indicates a test with no value in sorting out persons with and without the disease of interest, as the probability of a negative test result is equally likely among persons affected and unaffected with the disease of interest.

FNA test (fine needle aspiration)Cancer No cancer Totals
+ve FNA 113 15 128
-ve FNA 8 181 189
Totals 121 196 317
PrevalenceSensitivitySpecificityPV+PV-

FNA test (fine needle aspiration)Cancer No cancer Totals
+ve FNA 113 15 128
-ve FNA 8 181 189
Totals 121 196 317
PrevalenceSensitivitySpecificityPV+PV-
38%93%92%88%96%
LR+ = sensitivity / (1-specificity)= 0.93 / (1-0.92) = 11.63 <- FNA test has high diagnostic value

Probability of presence of disease• Pretest probability of disease - the likelihood that a person
has the disease of interest before the test is performed.• Pretest odds of disease are defined as the estimate before
diagnostic testing of the probability that a patient has the disease of interest divided by the probability that the patient does not have the disease of interest.
• Posttest odds of disease are defined as the estimate after diagnostic testing of the probability that a patient has the disease of interest divided by the probability that the patient does not have the disease of interest.
• Posttest probability of disease – the likelihood that a person has the disease of interest post the test is performed.

Pretest probability and pretest odds
Cancer No cancer
Mammography positive
14True positives
8False positives
22
Mammography negative
1False negatives
91True negatives
92
15 99 114
Pretest probability =
Pretest odds = pretest probability / (1-pretest probability)
=
= 0.15

Pretest probability and pretest odds
Cancer No cancer
Mammography positive
14True positives
8False positives
22
Mammography negative
1False negatives
91True negatives
92
15 99 114
Pretest probability = 15/114 = 0.13
Pretest odds = pretest probability / (1-pretest probability)
= 0.13/0.87
= 0.15

What does this have to do with LR?
• LR = post test odds / pre test odds
• So now we can compute the odds of having the disease after applying the test and computing LR

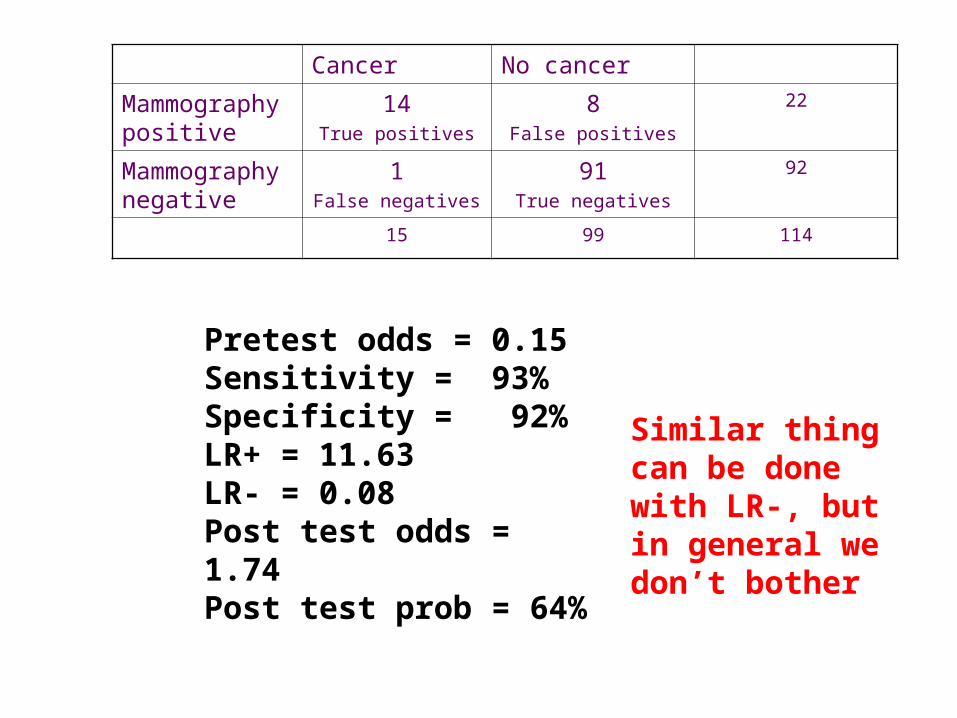
Pretest probability and pretest odds
Cancer No cancer
Mammography positive
14True positives
8False positives
22
Mammography negative
1False negatives
91True negatives
92
15 99 114
Pretest odds = 0.15Sensitivity = 93%Specificity = 92%
Compute LR+ and LR-:LR+ = 0.93/0.08 = 11.63 LR- = 0.07/0.92 = 0.08
So…
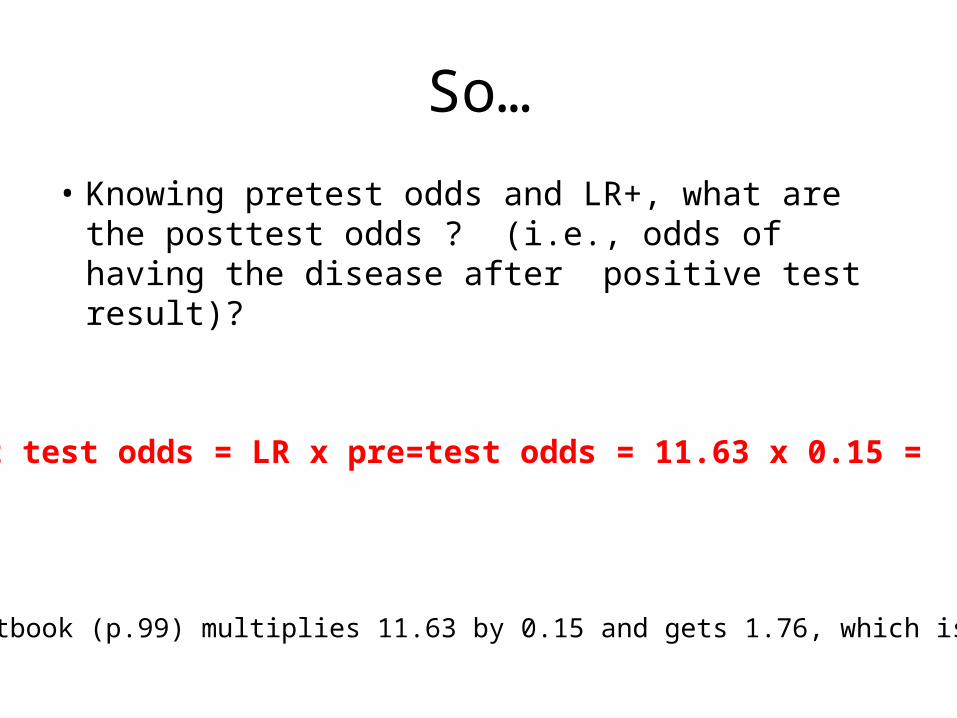
• Knowing pretest odds and LR+, what are the posttest odds ? (i.e., odds of having the disease after positive test result)?
Post test odds = LR x pre=test odds = 11.63 x 0.15 = 1.74
NB, textbook (p.99) multiplies 11.63 by 0.15 and gets 1.76, which is wrong
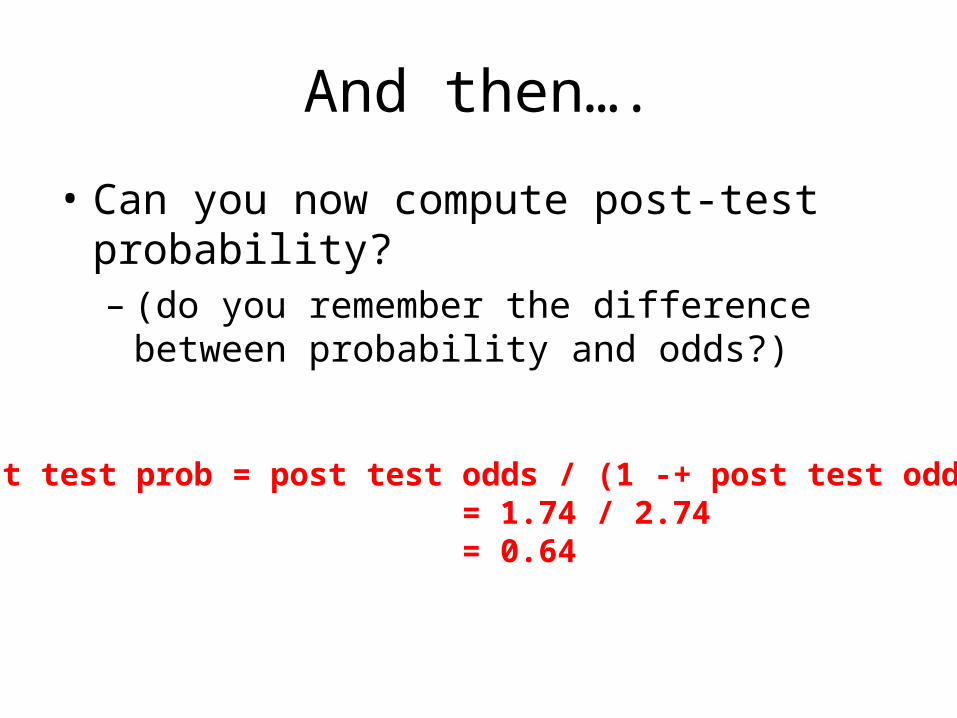
And then….
• Can you now compute post-test probability?– (do you remember the difference between
probability and odds?)
Post test prob = post test odds / (1 -+ post test odds) = 1.74 / 2.74 = 0.64

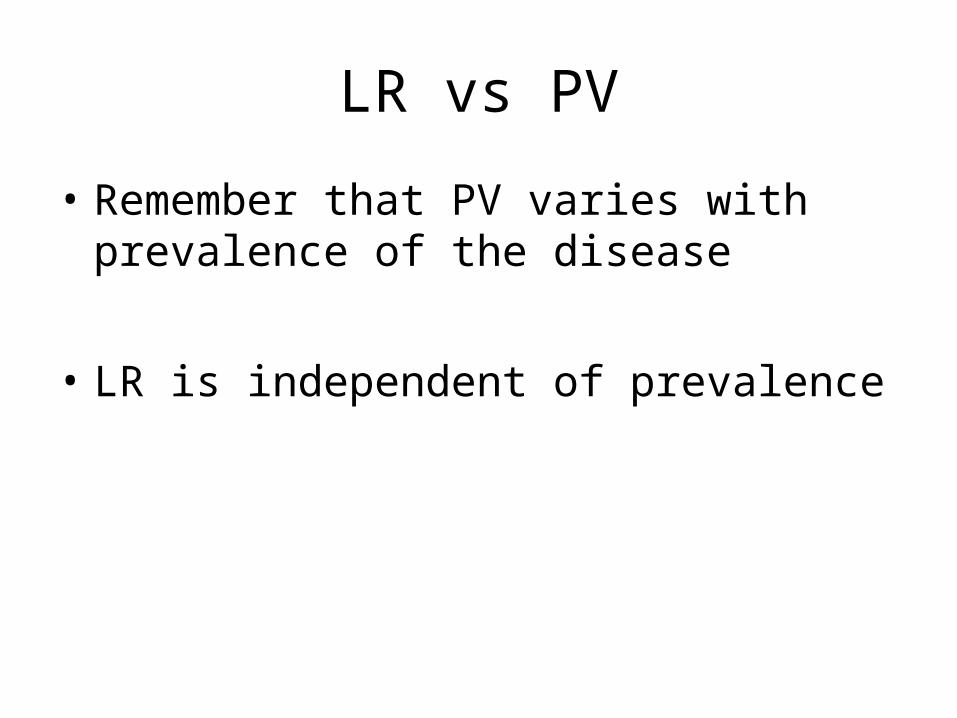
LR vs PV
• Positive predictive value is the proportion of patients with positive test results who are correctly diagnosed.
• The likelihood ratio indicates the value of the test for increasing certainty about a positive diagnosis– Relates to a comparison between pre-test odds of
having the disease vs post-test odds of having the disease
LR+ = post-test odds / pre-test odds
LR vs PV
• Remember that PV varies with prevalence of the disease
• LR is independent of prevalence
Cancer No cancer
Mammography positive
14True positives
8False positives
22
Mammography negative
1False negatives
91True negatives
92
15 99 114
Pretest odds = 0.15Sensitivity = 93%Specificity = 92%LR+ = 11.63LR- = 0.08Post test odds = 1.74Post test prob = 64%
Similar thing can be done with LR-, but in general we don’t bother

Performance YieldPerformance Yield
400
98905100
995
True Disease Status+ -
Results ofScreeningTest
+
-
Sensitivity: a / (a + c) = 400 / (400 + 100) = 80%Specificity: d / (b + d) = 98905 / (995 + 98905) = 99%PV+: a / (a + b) = 400 / (400 + 995) = 29%PV-: d / (c + d) = 98905 / (100 + 98905) = 99%Prevalence: (a+c)/(a+b+c+d) = 500/100400 = 0.5%
LR+ = sens / (1-spec) = 0.8/(1-0.99) = 80
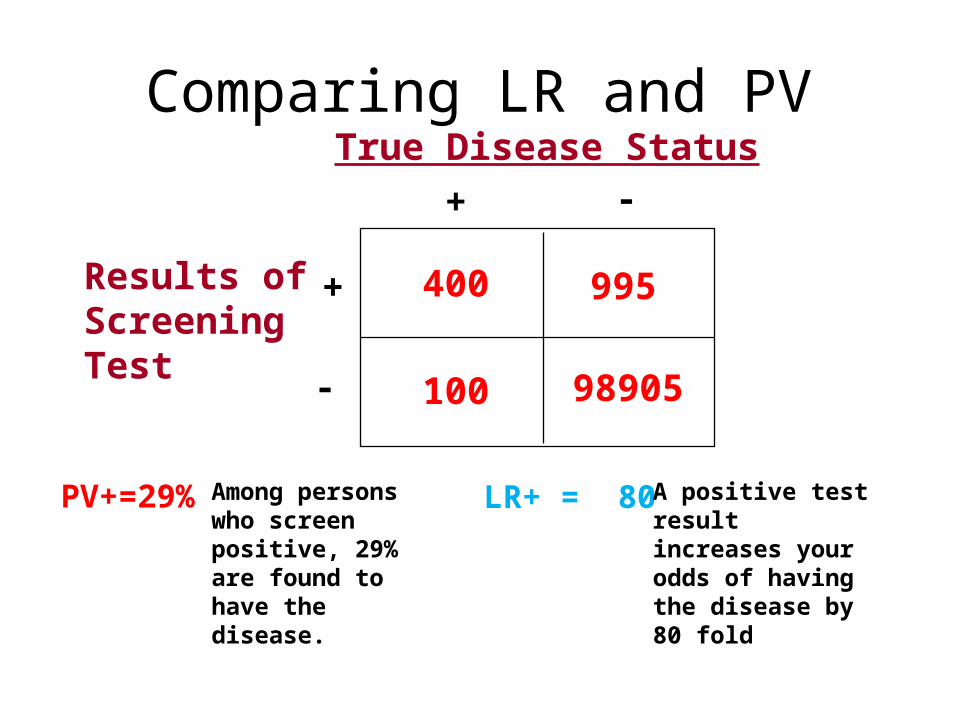
Comparing LR and PV
400
98905100
995
True Disease Status+ -
Results ofScreeningTest
+
-
PV+=29% LR+ = 80Among persons who screen positive, 29% are found to have the disease.
A positive test result increases your odds of having the disease by 80 fold

Homework #1• Geenberg p. 105, question 1-13:
– 13786 Japanese patients underwent CT scans to detect first signs of cancer, then had pathology tests 2 years later to confirm whether or not they actually had cancer
CT result Cancer present
Cancer absent
Positive 56 532
negative 4 13194
Compute:
1.LR+2.LR-3.Pre-test probability of cancer4.Pre-test odds of cancer5.Post-test odds of cancer6.Post-test probability of cancer
(Answers are in the notes section of this slide)
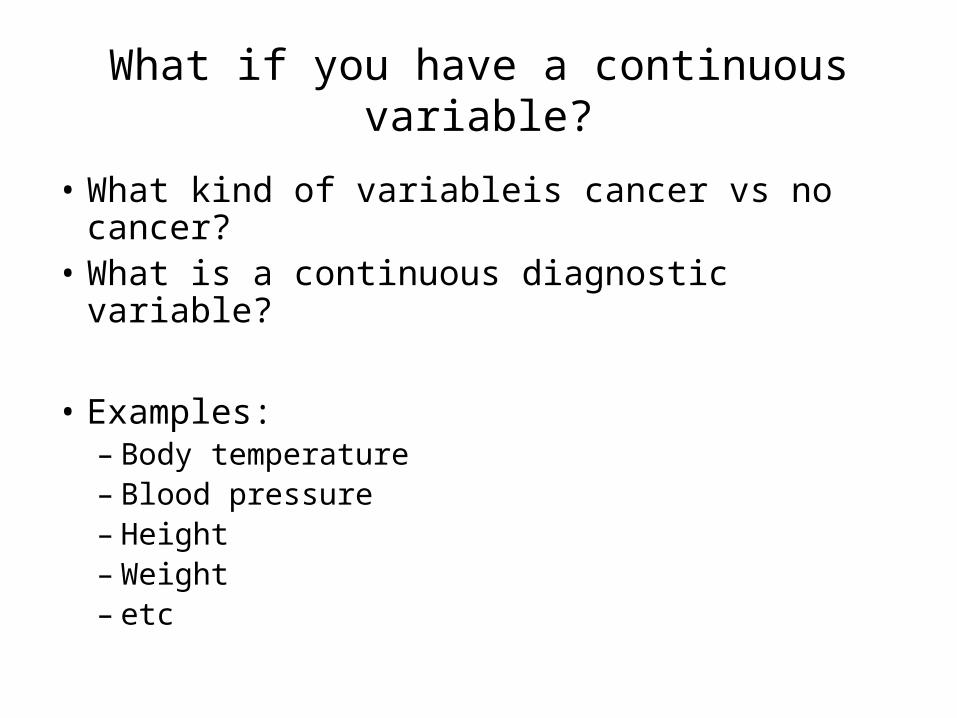
What if you have a continuous variable?
• What kind of variableis cancer vs no cancer?• What is a continuous diagnostic variable?
• Examples:– Body temperature– Blood pressure– Height– Weight– etc
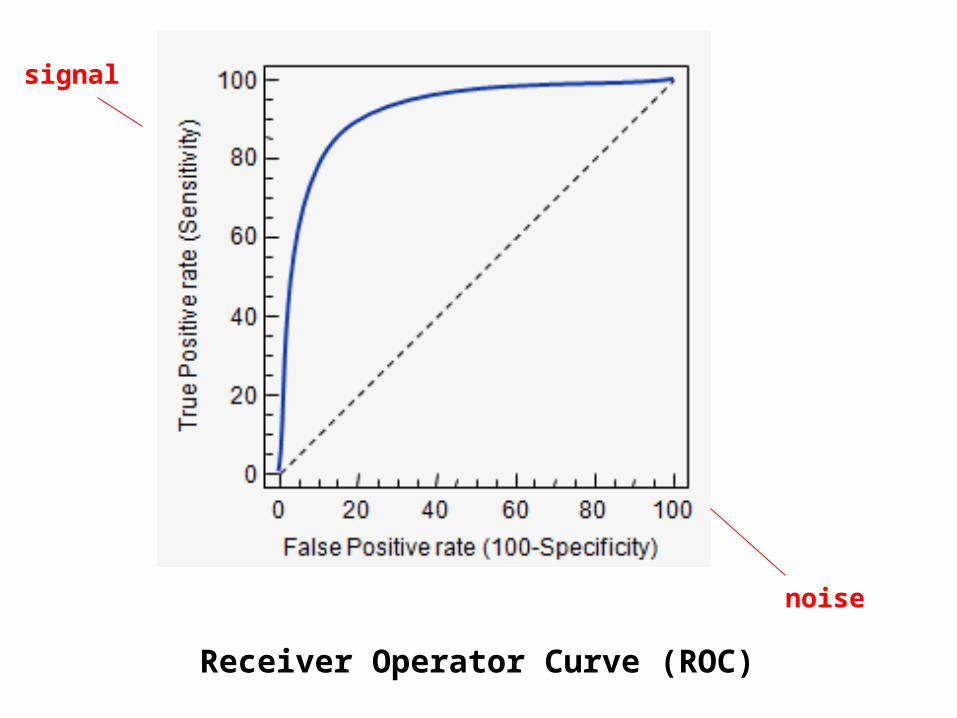
Receiver Operator Curve (ROC)
signal
noise

Useful for comparing 2 diagnostic tests. The greater the area under the curve, the better signal-to-noise ratio and the better the test

AgreementSee article on website called “Kappa.pdf”

Remember Reliability?
• The extent to which the screening test will produce the same or very similar results each time it is administered.
• Inter-rater reliability is “the variation in measurements when taken by a different persons but with the same method or instruments”
Also called CONCORDANCE
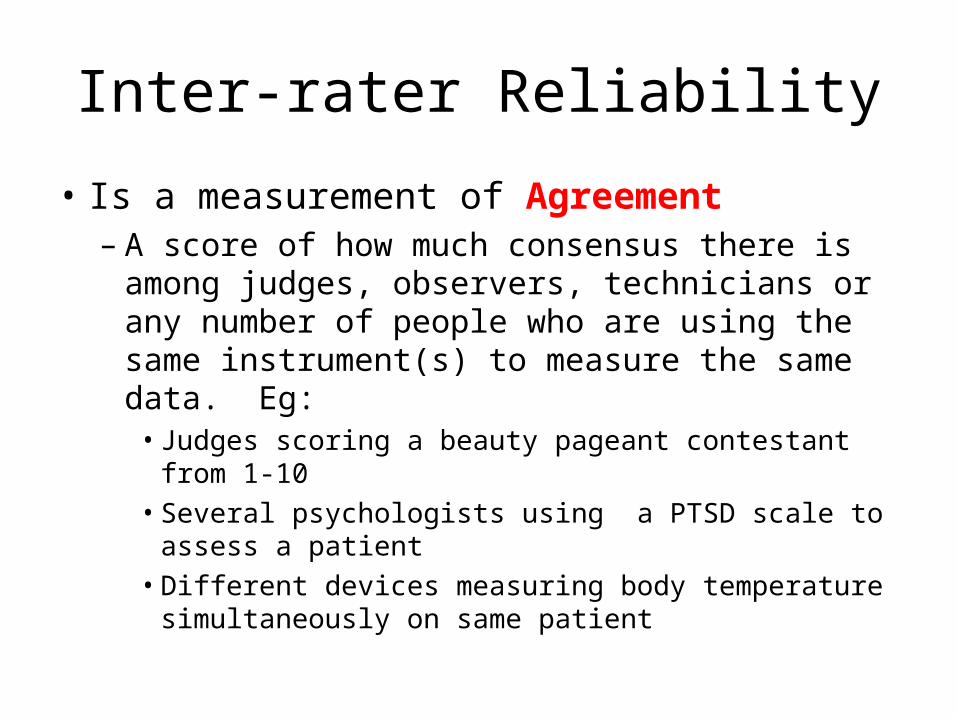
Inter-rater Reliability
• Is a measurement of Agreement– A score of how much consensus there is among
judges, observers, technicians or any number of people who are using the same instrument(s) to measure the same data. Eg:• Judges scoring a beauty pageant contestant from 1-10• Several psychologists using a PTSD scale to assess a
patient• Different devices measuring body temperature
simultaneously on same patient
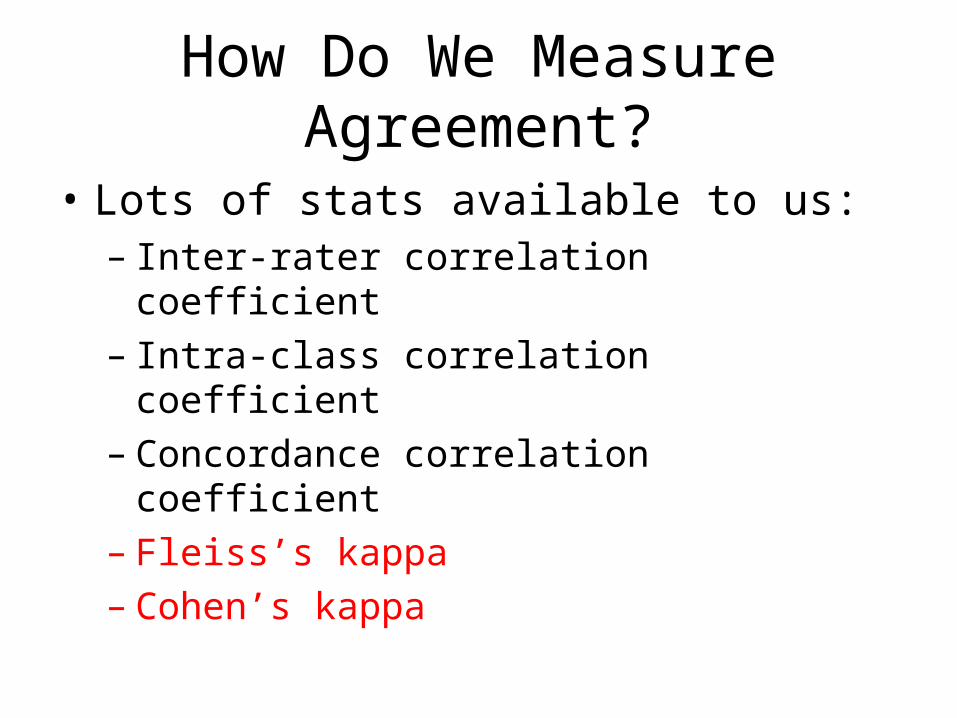
How Do We Measure Agreement?
• Lots of stats available to us:– Inter-rater correlation coefficient– Intra-class correlation coefficient– Concordance correlation coefficient– Fleiss’s kappa– Cohen’s kappa

Kappa (κ)
• Cohen– Two raters
• Fleiss– Adaptation of Cohen, applicable to multiple raters
• Kappa is generally thought to be a more robust measure than simple percent agreement calculation since κ takes into account the agreement occurring by chance

Cohen’s Kappa
Cohen the Barbarian

Cohen’s Kappa
• Κ = {Pr(a) – Pr(e)} / {1-Pr(e)}
Pr(a) = relative observed agreementPr(e) = prob that agreement is due to chance
Results in a ratio from 0 to 1

Two Judges Decide Whether Or Not 75 Beauty Pageant Contestants Are Hot
Judge #1 = Hasselhoff
Judge #2 = Shatner

The DataJudge Yes They Are Hot No They Are Not Totals
Hasselhoff 41 3 44
Shatner 4 27 31
Totals 45 30 75

The DataJudge Yes They Are Hot No They Are Not Totals
Hasselhoff 41 3 44
Shatner 4 27 31
Totals 45 30 75
Pr(a) = relative observed agreement = (41 + 27 )/ 75 = 90.7%

The DataJudge Yes They Are Hot No They Are Not Totals
Hasselhoff 41 3 44
Shatner 4 27 31
Totals 45 30 75
Pr(a) = relative observed agreement = (41 + 27 )/ 75 = 90.7%
Pr(e) = prob that agreement is due to chance =
(44x45/752 + (31x30)/752 = 0.352 + 0.165 = 51.7%
(multiply marginals and divide by total squared)
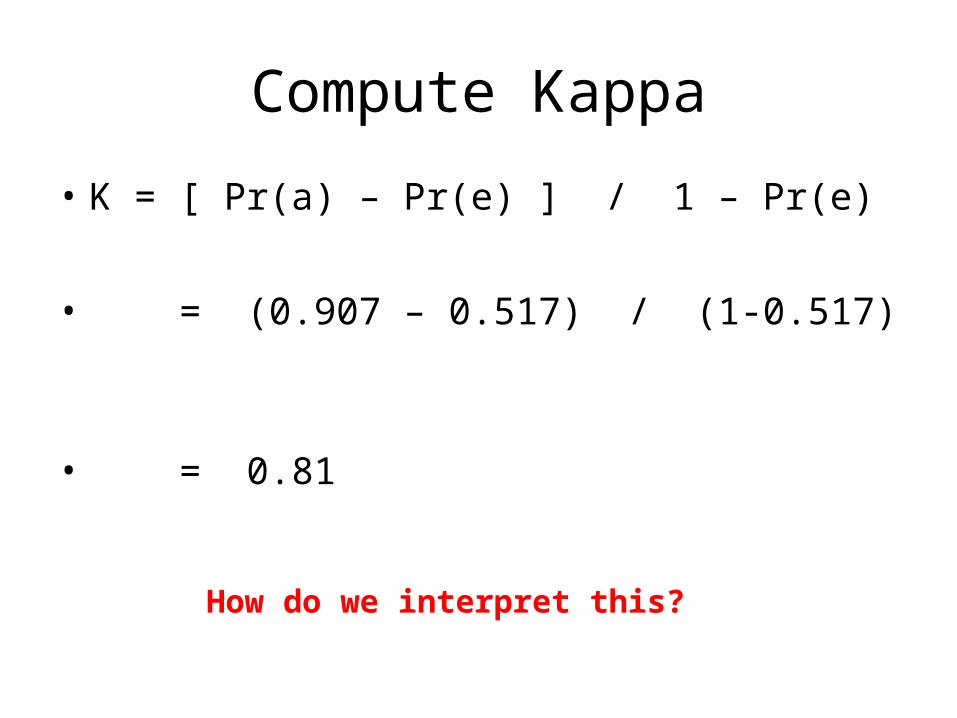
Compute Kappa
• K = [ Pr(a) – Pr(e) ] / 1 – Pr(e)
• = (0.907 – 0.517) / (1-0.517)
• = 0.81
How do we interpret this?

Interpreting Kappa
Hasselhoff and Shatner are in almost perfect agreement over who is hot and who is not.

What if….?
• There are >2 raters?• There are >2 categories?– Eg, “ugly, meh, hmm, pretty hot, very hot,
smokin’”– Eg, “don’t like, somewhat like, like”
• Then it is possible to apply kappa, but only to determine complete agreement. So?– Dichotomize variables– Weighted kappa

Homework #2
Compute Cohen’s Kappa in both cases and interpret. (The answers are in the notes section of this slide)

So When/Why Use Screening Tests?
Basis for Criteria Criteria
Effect of morbidity and mortality on population
Morbidity or mortality of the disease must be a sufficient concern to public health.
A high-risk population must exist.
Effective early intervention must be known to reduce morbidity or mortality.
Screening test The screening test should be sensitive and specific.
The screening test must be acceptable to the target population.
Minimal risk should be associated with the screening test.
Diagnostic work-up for a positive test result must have acceptable morbidity given the number of false-positive results.