Embed Size (px)
Citation preview
Harpur Hill, Buxton Derbyshire, SK17 9JN T: +44 (0)1298 218000 F: +44 (0)1298 218590 W: www.hsl.gov.uk
Development of an advanced fire detector for underground coalmines - Final Report.
HSL/2005/39
Project Leader: Peter Walsh
Author(s): Mike Hemingway & Peter Walsh
Science Group: Environmental Sciences
© Crown copyright (2005)

iii
ACKNOWLEDGEMENTS
We would like to acknowledge Stuart Hunneyball (TES Bretby) for his contribution to all
aspects of the project; the staff of UK Coal Welbeck Colliery, in particular Keenan Short, for
support and assistance with the field trials; Stuart Jobling (UK Coal HQ) for coordinating UK
Coal’s contribution; Brian Powell, Matthew Bonney and Philip Barton (Kidde plc) for loan of
the smoke detectors and assistance with interpretation; the following HSL staff - Dave Gregory
for design and construction of electronics, Mark Stephens for initial data analysis, Andrew
Nicol for fire temperature equipment, John Gummer for thermal video camera, Derrick Wake
for sizing coal dust samples; Barry Dickinson and Mark Rowland (Trolex Ltd) for providing
the Trolex logging equipment and data; the staff of Fenner Dunlop including Brian Rothery; the
staff of Winsford Salt Mine including Steve Reece, James Knoblett and Robin Burrell; and
Mike Bell (Detector Technologies Ltd) for video smoke detector analysis.

iv
FOREWORD
This project was commissioned by HSE/HID and UK Coal. It was initiated by the Mine Fire
Detection Working Group comprising: Mansel Williams (Chair, HID; replacing Gary Goodlad,
retired), Peter Goodier, (HID), Neville Williams (Secretary, HID), Brian Parry (HID, retired),
Stuart Jobling (UK Coal) and Stuart Hunneyball (TES Bretby). David Brenkley (Mines Rescue
Service) was an invited guest.

v
CONTENTS
1 INTRODUCTION .................................................................................................................. 1
2 SENSORS USED IN THE TESTS........................................................................................ 3
2.1 Introduction.............................................................................................. 32.2 TGS 711 POC semiconductor sensor...................................................... 32.3 Potential alternative POC sensors to TGS 711........................................ 32.4 Ionisation smoke sensor .......................................................................... 42.5 Electrochemical nitric oxide, nitrogen dioxide and carbon monoxide
sensors .................................................................................................... 42.6 Optical smoke sensors ............................................................................ 42.7 Thermal Imaging camera......................................................................... 52.8 Video Smoke Detection ........................................................................... 5
3 LABORATORY TESTS........................................................................................................ 6
3.1 POC Semiconductor sensors .................................................................. 63.2 Smoke detectors...................................................................................... 6
4 FIELD TESTS....................................................................................................................... 8
4.1 Introduction.............................................................................................. 84.2 Results................................................................................................... 10
5 CONCLUSIONS AND RECOMMENDATIONS.................................................................. 21
6 APPENDICES .................................................................................................................... 24
6.1 Locations of complete sets of results..................................................... 246.2 Details of laboratory tests on POC semiconductor Sensors .................. 256.3 Example results of laboratory tests on POC semiconductor sensors. ... 25
7 REFERENCES ................................................................................................................... 28

vi
EXECUTIVE SUMMARY
In the UK, automatic fire detectors detect fewer underground fires than mine personnel,
particularly during the early stages of smouldering and smoke emission. However, as collieries
become more automated, there are fewer personnel to detect fires. Current fire detectors in use
in UK coal mines, based on semiconductor sensors which detect gaseous products of
combustion, are under-utilised. Moreover, they are not user-friendly, have performance
limitations due to interferences, and are obsolete. A joint HSE/UK Coal research project was
therefore instigated to develop an improved fire detector. This paper describes tests performed
in an experimental mine roadway on various types of sensor. The sensors were exposed to
smouldering conveyor belt, coal, wood, oil and grease, and diesel exhaust fume.
Objectives
1. To improve the techniques and technology for fire detection systems in mines and
tunnels developed in earlier projects.
2. To evaluate a prototype, commercial-based (non-Intrinsically Safe) products of
combustion (POC) monitoring system for potential use in underground mines based on
a sensor array and pattern recognition system with the potential for improved
performance over the current FIDESCO fire detection system used underground, with
respect to cross-sensitivity to common interferents.
3. To recommend how the system may be further developed for actual use underground.
Main Findings
The following sensors were found to be unacceptable for use in an advanced underground fire
detection system:
1. Products of combustion semiconductor sensors. The TGS 2106 proved to be the most
sensitive semiconductor to all fire types but it was sensitive to water vapour and
hydrogen. In addition, variations in its specification, as later models are brought out by
the manufacturer, mitigate against using them as an integral component of a sensor
array.
2. Ionisation smoke detector. This was sensitive to all fires and diesel exhaust but also to
coal dust. Also, there is a general policy is to avoid the use of equipment containing an
ionising source in underground mines.
3. Single wavelength optical smoke sensor. This was sensitive to most fires although not
so sensitive to smouldering wood and grease. However, it was also sensitive to coal
dust.
4. Thermal imaging camera. This could readily highlight heat produced from all fires.
However, they do not work well in dusty environments, need line-of-sight to a fire and
it would be very expensive to install and maintain the intrinsically safe versions
required in coalmines.
5. Video Smoke Detection systems. This could readily detect smoke but it would be very
expensive to install and maintain intrinsically safe versions required in coalmines.

vii
The following sensors were found to be the most promising as part of an advanced mine fire
detection system:
1. A high sensitivity (laser particle counter) optical smoke detector responded well to all
fires and responded to smoke fumes up to a minute before they could be smelt.
However, it could not distinguish smoke from coal dust and diesel fume.
2. A dual wavelength (blue/infrared) optical smoke detector was found to be sensitive to
all fires and was able to distinguish smoke from coal dust. However, when the detector
was tested against both smoke and coal dust together, the presence of coal dust was
found to mask the response from smoke. The detector could not distinguish diesel fume
from smoke and was found to be less sensitive than personnel smelling fumes.
3. The carbon monoxide, nitric oxide and nitrogen dioxide electrochemical sensors
responded to diesel fume but not to the smouldering fires. This might prove useful in
combination with optical smoke detectors that cannot distinguish smoke particles from
diesel fume.
Recommendations
It is not recommended that POC semiconductor sensors, ionisation smoke detectors, single
wavelength optical smoke sensors, thermal imaging camera systems and Video Smoke
Detection systems should be used in an advanced fire detection system for coalmines.
It is recommended that an advanced mine fire detector system should be based on a combination
of a high sensitivity optical smoke detector fitted with a cyclone to remove coal dust; and nitric
oxide or nitrogen dioxide electrochemical sensors to distinguish smoke from diesel exhaust. If
such a system proves to be too expensive then an alternative could be based upon a combination
of blue/infrared optical smoke detector, which distinguish fires and diesel exhaust from coal
dust, and a nitric oxide or nitrogen dioxide electrochemical sensor.
Further work is required underground to assess a high sensitivity optical smoke detector at
typical coal dust levels in likely installation areas.

mine fire detector final report -V4.doc 1
1 INTRODUCTION
Fires underground can be very serious both in terms of the risk to human life and the possible need to
seal off sections of the mine with loss of production. The confined nature of mine workings means that
evacuation and fire fighting are considerably more difficult than above ground. Hence, reliable and
early detection of fires is essential. There are principally two types of real-time environmental monitor
currently in use underground in the UK for detection of open fires and spontaneous combustion:
general body carbon monoxide, CO, (based on an electrochemical sensor); and
general body gaseous products of combustion (based on semiconductor and CO
electrochemical sensors, termed the FIDESCO - Fire Detection Sensor & CO)
Fire detection technology tends not to be as effective as underground personnel for detecting fires,
although the fraction of fires discovered by monitors has increased over the years. Moreover,
personnel are mobile and can survey a larger area than fixed detectors, and possess a sensitive detector
- the nose. However, as mines become more automated there are fewer personnel working
underground than in previous years. This situation is perhaps illustrated by the failure of equipment to
detect a significant conveyor event, which produced large amounts of fume, leading to a withdrawal of
men from Kellingley Colliery, UK (Royals, 2001). The fire detectors at Kellingley were all based on
carbon monoxide sensors; FIDESCO was not in use.
FIDESCO instruments currently suffer from the disadvantages of susceptibility to interferents,
resulting in false alarms, and instrumental drift, which has restricted their use. A survey by UK Coal in
2002 (UK Coal, 2002) showed that from a sample of 14 collieries, 59% of FIDESCOs were fully
utilised (92 out of 156) but the remainder were not in use. The highest percentage of FIDESCOs in use
at a colliery was 80%. Industry guidance for underground environmental fire detection systems (eg
RJB Mining UK, 1998) recommends that use of products of combustion (POC) instruments (ie
FIDESCO) is limited to intake roadway installations where levels of contaminants are lower and less
changeable than in return roadways. In addition, FIDESCO is now obsolete - only the sensors can be
obtained as spare parts, and they too are about to be withdrawn.
POC sensors including FIDESCOs were shown to have the highest sensitivity for various types of
smouldering fire including belt, coal, wood and oil compared to CO sensors and ionisation smoke
detectors (Hambleton et al., 1997). Small, smouldering coal dust fires and conveyor belt heating are
unlikely to be detected by CO sensors alone (Hambleton et al. 1997).
A review of early warning fire detection techniques for use in underground mines has recently been
published by Walsh and Hunneyball (2002). This review outlined the types of sensor and tests which
could be carried out in order to build on previous work carried out by HSL and work undertaken
elsewhere on this topic, particularly that in the United States by NIOSH/PRL (Edwards et al, 2000;
Edwards et al., 2002, Litton, 2002).
This joint project (partners: HSE/HSL, UK Coal and TES Bretby) was initiated to investigate the
performance of proposed solutions to the sensor shortage and to explore the potential of an
‘intelligent’ monitoring system, i.e. an array of sensors. Such systems have been discussed by Walsh
and Hunneyball (2002) for mining applications, and by Meacham (1994) and Liu and Kim (2003) for
general applications. The system should have the sensitivity of existing FIDESCO but not be
susceptible to typical interferents such as diesel exhaust, firedamp, coal dust, humidity, hydrogen.

mine fire detector final report -V4.doc 2
The perceived benefits of investigating such a detection system are:
(1) Establishing for mines inspectors what can now be considered reasonably practicable
for early smoke and fire detection in mines, taking account of technical progress, to
assist them in regulatory decisions.
(2) Improved system for early detection of fire which reduces reliance on detection by
personnel, as requested by the Deep Mines Coal Industry Advisory Committee.
(3) Improvement in fire detection over current technology used underground over the
medium to long term period.
(4) Improving confidence of mining personnel in fire detectors.
(5) Improved ease of use of POC-based fire detection instrument.
This report details the work carried out under the joint project, draws conclusions and suggests
recommendations for action.

mine fire detector final report -V4.doc 3
2 SENSORS USED IN THE TESTS
2.1 INTRODUCTION
The review by Walsh & Hunneyball (2002) recommended a range of sensors to be considered in this
project. This was then narrowed down to the following to be included in the tests as practicable
potential mine fire sensors (as part of an array) and existing fire sensors to be used as benchmarks:
1. Semiconductor sensor: TGS 711 POC (as used in the FIDESCO instrument).
2. Potential alternative POC semiconductor sensors to TGS 711.
3. Ionisation smoke sensor: domestic, Trolex mine fire detector (obsolete).
4. Electrochemical carbon monoxide (CO), nitric oxide (NO), nitrogen dioxide (NO2) sensors.
5. Optical smoke sensors: domestic, Blue/Infrared, HART, VESDA
6. Thermal imaging camera
7. Video Smoke Detection.
These sensors are described in more detail below. In addition the temperature of the fires were
measured during the initial tests only with two thermocouples having a range 0-800 ºC (supplied by
HSL Fire Safety Section); and percentage obscuration of the atmosphere at the detectors was also
measured during initial tests with an in-house built obscuration meter, having 1 m separation (also
supplied by Fire Safety Section).
2.2 TGS 711 POC SEMICONDUCTOR SENSOR
The TGS 711 sensing element (Figaro Engineering Inc., Japan. www.figaro.com) is used in current
FIDESCO instruments. It has a sensitivity ratio of carbon monoxide/methane of approximately 40,
which is considerably greater than those for other TGS sensors (Hoddy and Gibson, 1977; Watson and
Yates, 1985).
Spare parts for the current FIDESCOs are now either becoming difficult or impossible to source (eg
the TGS 711 POC sensor). A batch of sensors has recently been procured from a UK supplier by TES
Bretby, which will provide cover for UK Coal in the short/medium term, assuming non-replaceable
parts keep functioning. However, these sensors will become obsolete, as the manufacturer has stated
that production will cease shortly.
This instrument was used as a benchmark in the field tests.
2.3 POTENTIAL ALTERNATIVE POC SENSORS TO TGS 711
The following POC sensors (Figaro Engineering Inc., Japan) were used in the tests:
TGS 2106 – a sensor designed for diesel exhaust applications, particularly sensitive to
nitrogen dioxide. Its predecessor, the TGS 2105, was used by NIOSH/PRL (Edwards et al.,
2002).
TGS 2442 – a CO sensor using a carbon filter to reduce cross-sensitivity to volatile organic
compounds (VOCs). It was used by NIOSH/PRL in their experiments on mine fire detection
(Edwards et al., 2002).
TGS 2600 – a general purpose air quality sensor sensitive to VOCs, again used by
NIOSH/PRL (Edwards et al., 2002).
Further details on the performance of these sensors can be found in the manufacturer’s product data
sheets (www.figaro.com).

mine fire detector final report -V4.doc 4
2.4 IONISATION SMOKE SENSOR
An alarm based on ionisation detection was built for use underground (Trolex P3270). However, it
was very old and is now not employed at all because of a lack of sensitivity. Nevertheless, ionisation
smoke detectors are widespread in the domestic environment and perform satisfactorily. It was
therefore decided to investigate the performance of a modern version of this type of sensor. Ionisation
sensors were kindly loaned by Kidde plc. These sensors were not designed for use in mines, they are
domestic sensors, and therefore their performance in these tests would not be indicative of that in their
design environment.
The sensors were calibrated at Kidde by reference to a standard ionisation detector (MIC, output in
pA) when challenged with smouldering cotton and flaming paraffin.
2.5 ELECTROCHEMICAL NITRIC OXIDE, NITROGEN DIOXIDE AND CARBON MONOXIDE SENSORS
An electrochemical carbon monoxide sensor as currently used in the FIDESCO instrument was used
as a benchmark, along with a nitrogen dioxide sensor (Trolex TX3240 with 3NDHG Citicell sensor,
range 0 - 20 ppm). A multigas detector (Rae Systems MultiRae Plus), fitted with electrochemical
sensors, was also used to measure carbon monoxide, nitric oxide and nitrogen dioxide.
2.6 OPTICAL SMOKE SENSORS
Currently there are no smoke detectors used in UK coalmines based on the optical (photometric)
principle. The technique detects smoke particles by light scattering. However, it was thought it would
be informative to investigate the potential of this type of sensor for mine application. Photometric
sensors were kindly loaned by Kidde plc. These sensors were not designed for use in mines therefore
their performance in these tests would not be indicative of their performance in their design
environment. Four types were used for the tests:
Standard smoke alarm – a single wavelength infrared sensor as supplied for the domestic
smoke alarm market.
Blue/IR LED smoke detector – a dual wavelength prototype sensor for commercial
applications with a sensitivity of 5%.m-1 and supplied by Kidde. Smaller smoke particles
produce a bigger response to the shorter wavelength of blue light, while larger general dust
particles, such as coal dust, produce a bigger response to the longer wavelength of the infrared
light. Therefore, the ratio of the response to blue light and infrared light should be large in the
presence of smoke and small in the presence of coal dust. In this way the dual wavelength
optical detector (or Blue/IR detector) can distinguish between smoke particles and coal dust in
a coal mine.
Blue/IR smoke detector (aviation) – a more rugged version of the blue/IR smoke detector
designed for use in the aviation market, supplied by Kidde, and used in latter tests at Welbeck.
Hart XL – a single wavelength infrared high sensitive smoke detector as supplied for the
commercial smoke alarm market by Kidde. It is an aspirated, laser based smoke particle
counter with a sensitivity range of 0.005%.m-1 to 1%.m-1 obscuration. It is designed to respond
to particles within the range 0.001 m to 10 m and so may not have a significant response to
coal dust. Air is drawn through a network of pipes with a number of sample orifices (for
details see www.kfp.co.uk/HartXLHSSD.shtml)
Vesda – another single wavelength infrared high sensitive smoke detector similar to the Hart
XL but it uses filters to remove larger dust particles allowing only smoke fume through to the

mine fire detector final report -V4.doc 5
sensing zone (www.vesda.com). The Vesda was not tested during this study but it was
observed in use in a safe document storage area in Winsford salt mine.
The standard smoke alarms and the two types of Blue/IR smoke detectors were calibrated at Kidde by
reference to visible obscuration (%.m-1) when challenged with smouldering cotton and flaming
paraffin. The Hart XL was calibrated during manufacture to an equivalent white smoke sensitivity
2.7 THERMAL IMAGING CAMERA
A FLIR SC 2000 thermal imaging camera (supplied by HSL Explosion Control Section) was used to
measure temperature. The camera uses a military specification un-cooled matrix micro-bolometer
detector that measures infrared radiation over the wavelength range 7.5 -13 m and has a built in
atmospheric filter with cut-on at 7.5 m. The measured radiation is converted into a black body
temperature by a calibration function stored in the electronics of the camera based on the Stefan-
Boltzmann law.
The system was set to download images to a personal computer for analysis. Each image consists of
76,800 pixels (320 x 240). The temperature range covered by the imager is -40 to 1500oC, which is
divided into three ranges (low, -40 to 120oC, medium, 0 to 500oC, and high, 350 to 1500oC).
According to the manufacturer, ignoring emissivity effects, the accuracy was ±2% of the absolute
temperature, e.g. ± 11oC at 300oC.
The maximum frame rate of this instrument is 50 frames per second.
2.8 VIDEO SMOKE DETECTION
Video Smoke Detection (VSD) was performed by computer image-analysis of video images of the
fires at Welbeck training galley by Intelligent Security Ltd (ISL, www.intelsec.com). A standard
CCTV camera was used to obtain video footage that was then kindly processed by ISL after the tests
were completed; although the VSD system can work in real-time. The system detects smoke by
processing only the areas in a video image that are changing against a library of known smoke
signatures. Alarm conditions, such as amount of smoke and duration, can be altered to match the local
ambient conditions and camera field of view.

mine fire detector final report -V4.doc 6
3 LABORATORY TESTS
3.1 POC SEMICONDUCTOR SENSORS
To determine the most sensitive POC semiconductor sensor with the least cross-sensitivity, brief
laboratory tests were carried out on their response to a mixture of hydrocarbon gases, carbon
monoxide, methane and nitrogen dioxide in the presence and absence of water vapour. The sensors’
response times were not measured accurately but were generally of the order of 2-3 min. The complete
results can be found using the index in Appendix 6.1, details of the hydrocarbon test mixture are given
in Appendix 6.2. and example results are shown in Appendix 6.3. These should be viewed as an
indication of the sensors’ amplitude of response only.
The TGS 2442 was only sensitive to carbon monoxide to which the TGS 2106 and the TGS 2600 were
not as sensitive. The TGS 2600 and the TGS 2106 were both sensitive to water vapour and to methane.
The TGS 2106 and 2600 were both sensitive to nitric oxide and nitrogen dioxide.
3.2 SMOKE DETECTORS
The smoke detectors from Kidde were only subjected to brief checks on their response to smoke
aerosol. These sensors had already been calibrated by Kidde. However, further tests were carried out
by Kidde on the Blue/IR optical smoke detector to show it could distinguish between smoke particles
and coal dust with reference to visible obscuration. Smouldering cotton was generated from cotton
wick, the oil mist was marine lubrication oil heated on hot plate, the smouldering paper was filter
paper on hot plate as BS EN54 calibration (BSI, 1996), the flaming polystyrene was a small piece of
polystyrene cup flaming and the coal dust was ground domestic solid fuel sieved to less than 53 µm.
Figure 1 shows the results summary and the location of the complete results are given in Appendix
6.1.
0
0.5
1
1.5
2
2.5
3
3.5
4
4.5
5
0 0.2 0.4 0.6 0.8 1 1.2 1.4 1.6
blue signal (V)
blu
e/IR
rati
o
smouldering cotton 1
smouldering cotton 2
oil mist 1
oil mist 2
smouldering paper 1
smouldering paper 2
flaming polystyrene 1
flaming polystyrene 2
coal dust 1
coal dust 2
coal dust 3
Figure 1. Response of the Kidde Blue/IR detector as a function of the blue sensor signal.

mine fire detector final report -V4.doc 7
The Blue/IR sensor characterises airborne dusts by the ratio of their response to blue and IR light.
Smouldering cotton, flaming polystyrene and oil mist have ratios of the blue to IR signals significantly
above 1. Smouldering paper has a ratio just above 1 and coal dust has a ratio of about 0.5. This
suggests that the Blue/IR detector can distinguish smoke particles from coal dust.

mine fire detector final report -V4.doc 8
4 FIELD TESTS
4.1 INTRODUCTION
Field tests were performed in the surface training gallery at UK Coal's Welbeck Colliery. The gallery
is equivalent to a standard UK coalmine gallery with the exception that equipment used in it need not
be intrinsically safe. The sensors were connected to two dataloggers (Trolex PSC) except for the
MultiRae and Hart XL, which had internal datalogging, and the Blue/IR sensors, which were
connected to laptop computers.
Fire detectors were exposed to a series of test fires and diesel exhaust fumes initiated in the training
gallery in a ventilated air stream moving at approximately 1.5 m.s-1 provided by an auxiliary fan. The
test fires were:
Smouldering conveyor belt.
Smouldering grease and oil.
Smouldering coal fire simulating spontaneous combustion.
Smouldering wood.
Rapidly evolving diesel pool fire.
The test fires were relatively small scale. The conveyor belt test fires comprised of 0.45 m square
sample of belt clamped to a 6 mm steel plate, which was heated on the non-belt side using electrical
strip heaters. The power supply to the heaters was slowly increased to a maximum of 3.3 kW. The
coal test fires comprised approximately 14 kg of coal sized up to 60 mm placed in a 0.6 m square and
0.1 m deep container and having the electrical strip heaters embedded in the coal. The power supply
to the heaters was slowly increased to a maximum of 2.4 kW. Wood test fires comprised a crib made
from roof support timber cut into 0.3 m strips. The crib was then placed onto the same hot plate used
in the conveyor belt experiments. Grease and oil fires comprised of a patch of oil about 0.3 m in
diameter surrounded by a grease dam and heated on the hot plate. The diesel pool fires comprised a
shallow pool of diesel held in the same container that was used for the coal fires. This was ignited,
allowed to burn for approximately 3 min and then extinguished.
The detectors were also exposed to diesel exhaust gases provided by a Free Steered Vehicle (FSV).
Tests were carried out with the diesel engine running at idle and on-load, close to (2 m) and far away
(30 m) from the detectors. In some cases the exhaust was directed straight at the sensors using a 0.5 m
diameter flexible duct and in one case the the FSV was run while approximately 100 m away from the
sensors.
After each fire or exhaust exposure, the tunnel was purged with clean air to reduce the sensor
responses near to their zero level. Repeats of fires and diesel exhaust experiments were carried out.
The gas monitoring instruments were placed as close as possible to each other in an array across the
centre of the gallery at just below roof height at a distance of 20 m from the fire site (see Figures 2 and
3).
Some of the sensors were also exposed to coal dust that was collected from a Welbeck coalmine
gallery. The dust dispersal system comprised of a feed hopper, turntable, and aspiration system. Coal
dust falling from the hopper is spread evenly across the turntable by a knife-edge and passes beneath a
collection nozzle. The dust is entrained into airflow and directed out of the exit nozzle towards the
sensors. The dispersal system produced an inconsistent airborne dust plume with peak concentrations
of between 40 mg.m3 to 60 mg.m3.

mine fire detector final report -V4.doc 9
Figure 2. Sensors used in the field tests. Ionisation smoke detector (1), domestic optical smoke
sensor (2), blue/IR optical smoke detector (3), Fidesco POC: TGS 711 and CO electrochemical
sensor (4), Trolex ionisation smoke detector (5), TGS 2106, 2442 and 2600 POC semiconductor
sensors (6), NO2 electrochemical (7).
Figure 3. Sensors used in the field tests. The Hart XL is connected to the red aspiration tube.
Beneath the tube is an aviation Blue/IR sensor (1) and a MultiRae (2). In the background is the
coal dust dispersion apparatus (3).
1 2 3
4
5
67
1 2
3

mine fire detector final report -V4.doc 10
4.2 RESULTS
All the fires produced visible smoke at the sensors that could easily be smelt except for the oil and
grease fires. Table 1 shows the temperature and atmospheric obscuration during the tests. The diesel
pool fire rapidly produced large quantities of smoke that were easily detected by all of the sensors (see
Table 1). The remaining fires tended to produce many small puffs of smoke that caused large
variations in the visible quantities of smoke at the detectors. This resulted in noisy signals from all of
the sensors except for the semiconductors, which had a slow response time.
Table 1: Temperature and obscuration during tests.
Obscuration (%.m-1
)Fire Maximum
temperature ( C) Background During fire
Smouldering conveyor belt. 405 0.025 0.051 - 0.065
Smouldering grease and oil. 230 0.065 0.065 – 0.080
Smouldering coal fire simulating
spontaneous combustion.
415 0.025 0.038 – 0.065
Smouldering wood. 225 0.051 0.065
Rapidly evolving diesel pool fire 695 0.065 0.638
FSV diesel exhaust - 0.012 0.025
4.2.1 TGS 711 POC semiconductor sensor
Example results for the TGS 711 as used in FIDESCO are shown in Figures 4 and 5. Further results
can be found from Appendix 6.1. Figures 4 and 5 show that the TGS 711 had a large response to
smouldering coal, belt and grease fires and to diesel fume. Results, not shown here, show that the TGS
711 had a similar response to smouldering wood and diesel pool fires.
4.2.2 TGS 2106, 2442 and 2600 POC sensors
Example results for the TGS 2106, 2442 and 2600 POC semiconductor sensor are shown in Figures 4
and 5 and further results can be found from Appendix 6.1.
The TGS 2106 sensor had a significant response to all the fires and a very low response to diesel fume
from the FSV. The TGS 2442 was not sensitive to either smoke or diesel fume and the TGS 2600
sensors had much lower responses than the TGS 711 or TGS 2106 sensors.

mine fire detector final report -V4.doc 11
0
0.5
1
1.5
2
2.5
3
3.5
4
4.5
5
10:38:08 10:58:08 11:18:08 11:38:08 11:58:08 12:18:08 12:38:08 12:58:08 13:18:08 13:38:08 13:58:08 14:18:08 14:38:08 14:58:08 15:18:08 15:38:08
Time /h:m:s
Sig
na
l
TGS2106 TGS2442 TGS2600 TGS711
coal firebelt fire
belt/grease/oil fire
Figure 4. POC semiconductor sensor response to smouldering coal, belt and grease fires.
0
0.5
1
1.5
2
2.5
3
3.5
4
4.5
5
9:05:04 9:25:04 9:45:04 10:10:24 10:30:24 10:50:24 11:10:24 11:30:24 11:50:24 12:10:24 12:30:24 12:50:24
Time /h:m;s
Sig
na
l
TGS2106 TGS2442 TGS2600 TGS 711
FSV idling FSV high revs FSV high revs Heater on
conveyor belt,
no FSV
Figure 5. POC semiconductor sensor response to diesel fume from a Free Standing Vehicle
(FSV), light fume (heater on) and smouldering conveyor belt fire.

mine fire detector final report -V4.doc 12
0
2
4
6
8
10
12
10:38:08 10:58:08 11:18:08 11:38:08 11:58:08 12:18:08 12:38:08 12:58:08 13:18:08 13:38:08 13:58:08 14:18:08 14:38:08 14:58:08 15:18:08 15:38:08
Time /h:m:s
Sen
so
r re
sp
on
se
0
5
10
15
20
25
op
tical sm
oke d
ete
cto
r re
sp
on
se
FIDESCO NO2
Ionisation smoke detector optical smoke detector
coal fire belt fire belt/grease/oil fire
Figure 6. Electrochemical CO (FIDESCO) and NO2 sensor and ionisation and optical smoke
detector response to smouldering coal, belt and grease fires.
4.2.3 Ionisation smoke detector
Example results for the ionisation smoke detector are shown in Figures 6 to 8 and further results can
be found using Appendix 6.1. The detector had a reasonable response to all fires, diesel fume and coal
dust.
4.2.4 Electrochemical nitric oxide, nitrogen dioxide and carbon monoxide sensors
Example results for the FIDESCO carbon monoxide and nitrogen dioxide electrochemical sensors are
shown in Figures 6 to 8 and further results can be found from Appendix 6.1.

mine fire detector final report -V4.doc 13
0
2
4
6
8
10
12
14
16
9:05:04 9:25:04 9:45:04 10:10:24 10:30:24 10:50:24 11:10:24 11:30:24 11:50:24 12:10:24 12:30:24 12:50:24
Time /h:m;s
se
ns
or
resp
on
se
0
0.2
0.4
0.6
0.8
1
1.2
1.4
1.6
1.8
2
FID
ES
CO
re
sp
on
se
NO2 optical smoke detectorionisation smoke detector FIDESCO
FSV idling FSV high revs FSV high revs Heater on
conveyor belt,
no FSV
Figure 7. Electrochemical CO (FIDESCO) and NO2 sensor and ionisation and optical smoke
detector response to diesel fume from a Free Standing Vehicle, light fume (heater on) and
smouldering conveyor belt fire.
0
0.5
1
1.5
2
2.5
3
3.5
4
4.5
5
12:17 12:57 13:37
Time /h:m
Sig
na
l re
sp
on
se
0
2
4
6
8
10
12
14
16
18
20
FIDESCO NO2 EC ionisation smoke detector optical smoke detector
Figure 8. Electrochemical CO (FIDESCO) and NO2 sensor and ionisation and optical smoke
detector response to generated coal dust.
Example results for the nitric oxide and nitrogen dioxide electrochemical sensors as used in the
MultiRae Plus, are shown in Figure 9 and further results can be found from Appendix 6.1.

mine fire detector final report -V4.doc 14
None of the electrochemical sensors responded to any of the smouldering fires. The FIDESCO did,
however, show signal deterioration on exposure to coal dust. The nitric oxide, nitrogen dioxide and
carbon monoxide sensors responded to diesel pool fire and diesel fume.
0
2
4
6
8
10
12
14
8:18 8:25 8:32 8:39 8:47 8:54 9:01 9:08 9:15
time /hr:min
co
nce
ntr
atio
n /p
pm
nitric oxide
nitrogen dioxide
FSV on
smouldering belt fire
Figure 9. MultiRae Plus electrochemical NO and NO2 sensor response to diesel fume from a Free
Standing Vehicle (FSV) and smouldering conveyor belt fire.
4.2.5 Single wavelength optical smoke detector
Example results for the single wavelength optical smoke detector are shown in Figures 6 to 8 and
further results can be found from Appendix 6.1. The detector had a large response to all fires and coal
dust and a much smaller response to diesel fume.
4.2.6 Blue/IR optical smoke detector (domestic and aviation versions)
Example results for the aviation version of the Blue/IR optical smoke detector are shown in Figures 10
to 13 and further results can be found from Appendix 6.1. The domestic version responded in a similar
manner. The detector was sensitive to all fires, diesel fume and coal dust.
The Blue/IR optical smoke detector distinguishes between smoke and coal dust using the ratio of blue
signal to IR signal. A ratio greater than one indicates smoke or fume, and less than one indicates dust.
Figure 10 shows that the blue and IR responses are very noisy so the ratio of the signals has been
smoothed with a 60 s moving average. It does show that the ratio remains above one, indicating that
the detector can distinguish smoke from coal dust. However, although the ratio remains above one, the
blue signal did not rise significantly above the background level until some 8 min after the subjective
test of being able to smell smoke at the sensors. The IR signal took even longer. Similar results were
also obtained for smoke from wood, diesel pool, and grease and oil fires.

mine fire detector final report -V4.doc 15
0
0.05
0.1
0.15
0.2
0.25
0.3
0.35
0.4
9:28 9:36 9:43 9:50 9:57 10:04
time /hr:min
ou
tpu
t /a
rbitra
ry u
nits
0
1
2
3
4
5
6
7
8
9
10
blu
e/IR
ratio
blue signal
IR signal
60 s moving average of ratio
Faint smell of smoke at
detectors.
Figure 10. Blue/IR optical smoke detector response to smouldering coal fire.
0
0.05
0.1
0.15
0.2
0.25
0.3
8:13:30 8:14:00 8:14:30 8:15:00 8:15:30 8:16:00 8:16:30 8:17:00
time /hr:min:sec
se
nso
r re
sp
on
se
0
1
2
3
4
5
6
7
8
9
10
11
12
ratio
blue
red IR
5 per. Mov. Avg. (blue/IR ratio)
Figure 11. Blue/IR optical smoke detector response to FSV diesel fume.
Figure 11 shows that the blue/IR ratio remains above one in the presence of diesel fume.

mine fire detector final report -V4.doc 16
Figure 12 shows the blue/IR optical smoke detector’s response, initially to smouldering wood smoke
and then combined with generated coal dust. In the presence of only wood smoke, the ratio remains
above one indicating smoke. The coal dust plume was very intermittent producing a noisy signal
response that is difficult to interpret. However, it can be seen that when coal dust does impinge upon
the detector, the IR signal peaks above 0.2 and the ratio tends to fall to about one. This suggests that
coal dust may mask the presence of smoke from the blue/IR optical smoke detector.
0
0.05
0.1
0.15
0.2
0.25
0.3
9:50 9:52 9:54 9:56time /hr:min
se
nso
r re
sp
on
se
0
2
4
6
8
10
12
ratio
blue signal IR signal 10 s moving average of blue/IR ratio
coal dust on
sm
ell
sm
oke a
t th
e d
ete
cto
rs
Figure 12. Blue/IR optical smoke detector response to smouldering wood smoke and generated
coal dust.
Figure 13 shows the blue/IR optical smoke detector’s response to a smouldering used conveyor belt
fire, and shows that initially the blue/IR ratio peaks significantly above one as is expected for smoke.
However, the ratio quickly falls below one as the smouldering belt fire progresses. In the latter stages
of the fire, relatively large particles are generated that produce a large IR response, causing the ratio to
fall to a value indicating dust particles rather than smoke fume. This type of response only occurred if
the cleanest face of the belt was face up when heated. The wear on the belts appeared to indicate that
one face remained in contact with the rollers and the opposite face was more damaged and dirty from
contact with coal. If the dirtiest face was face up then a more standard signal profile similar to Figure
10 resulted.
Friction testing of belt samples was carried out at Fenners Dunlop (Hull), the belt manufacturer’s test
laboratory, to observe if a similar response to that above occurred. Most belt fires are caused by the
edge of a conveyor belt rubbing against machinery (jammed rollers), therefore friction testing a belt
sample is more realistic test. Testing was carried out on a drum friction testing apparatus according to
BS 3289 (BSI, 1990). A sample of belt was held under tension and turned through 180o around a metal
drum that rotates at high speed (see Figure 14). Samples of used PVC belt were taken from Welbeck
and tested along with clean samples of PVC and nitrile coated belts supplied by Fenners Dunlop.

mine fire detector final report -V4.doc 17
Although the smouldering fires progressed much more swiftly than those observed at Welbeck, results
were always similar to those shown in Figure 13. Further results can be found from Appendix 6.1
0
0.5
1
1.5
2
2.5
3
9:49 9:56 10:03 10:10 10:18time /hr:min
ou
tpu
t /a
rbitra
ry u
nits
0
1
2
3
4
5
6
ratio
blue signal
IR signal
30s moving average of ratio
Figure 13: Blue/IR optical smoke detector response to smouldering used conveyor belt with its
clean face up.
Figure 14. Conveyer belt drum friction apparatus.

mine fire detector final report -V4.doc 18
4.2.7 Hart XL high sensitivity optical smoke detector
Example results for the single wavelength high sensitivity optical smoke detector are shown in Figures
15 and 16 and further results can be found from Appendix 6.1.
Gallery ventilation on, residual diesel fume.
Coal dust on
Sm
ell
sm
oke a
t d
ete
cto
r
Figure 15. High sensitivity optical smoke detector response to smouldering wood fire, FSV diesel
fume and generated coal dust.
The detector responded to smouldering wood fires, smouldering coal fires, diesel fume and generated
coal dust. Figure 15 shows that the detector responded to smouldering wood fire about a minute before
the fumes could be smelt. The intermittent coal dust plume produced a noisy response after
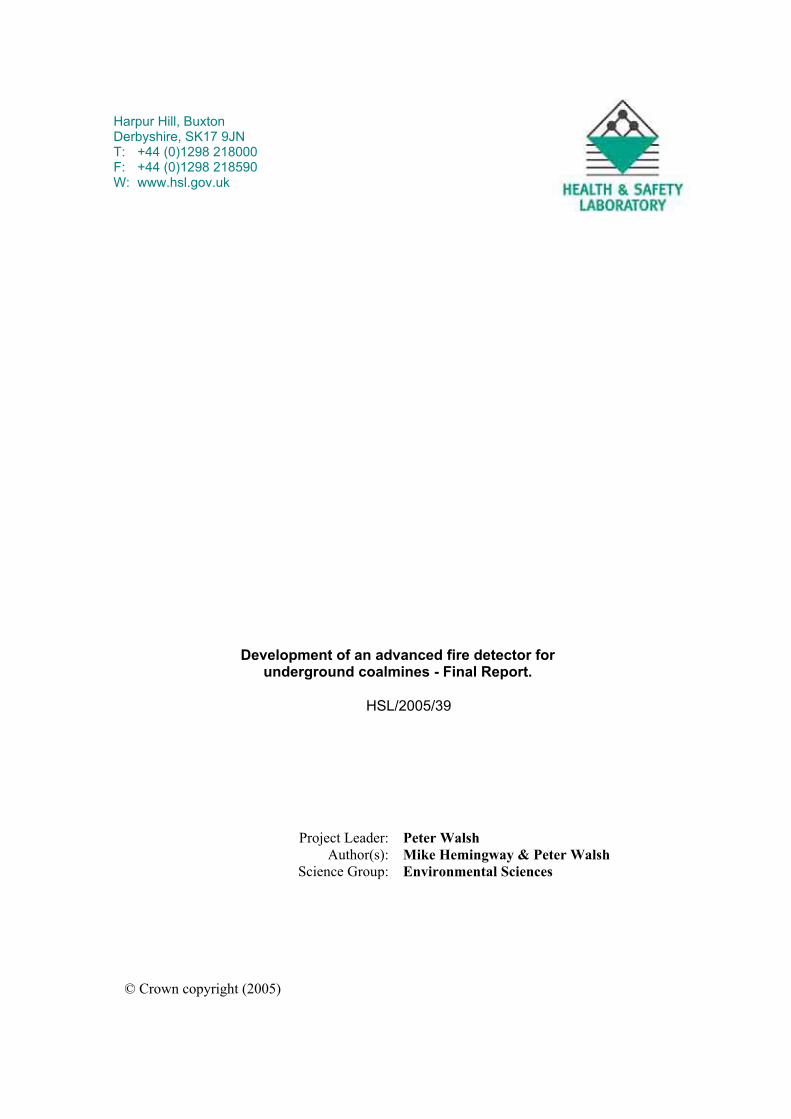
approximately 09:52:49. The response to coal dust can be seen more clearly in Figure 16.
The Hart XL is designed to ignore particles larger then 10 m but the level of response to coal dust
indicated in Figure 16 suggests that a significant proportion of the coal dust is smaller than this. To
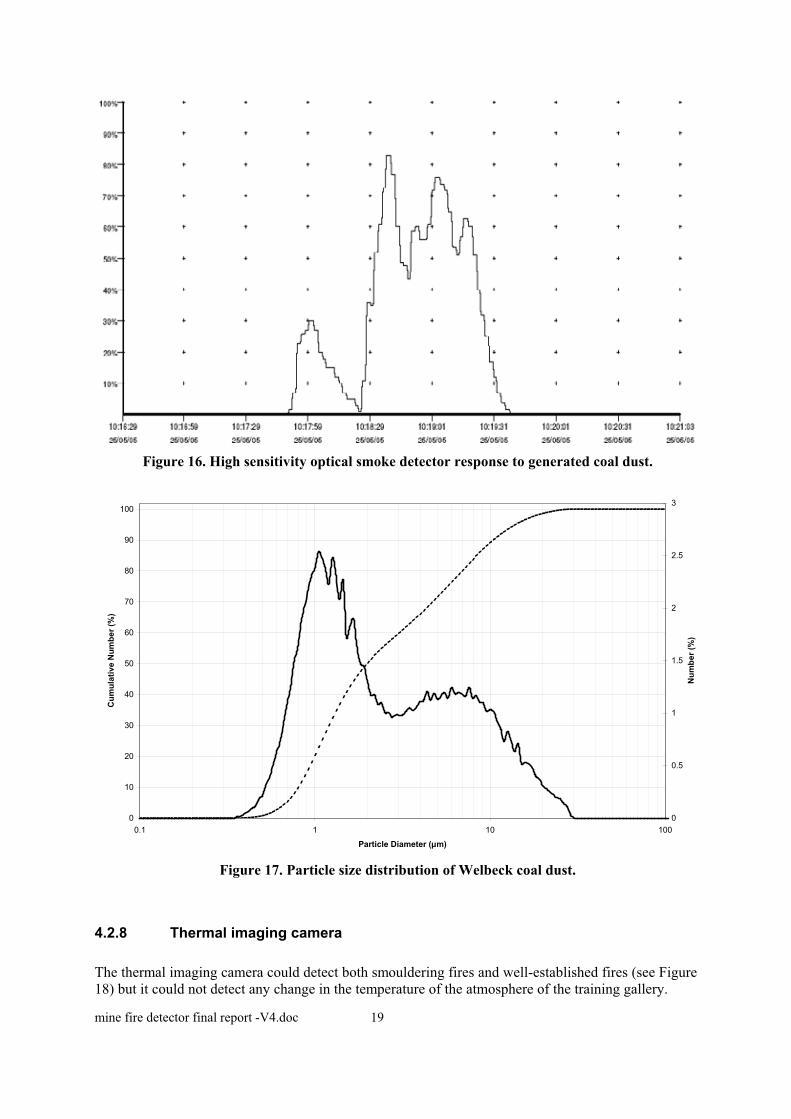
confirm this a sample of Welbeck coal dust was passed through a 30 m sieve and then sized using an
API Aerodynamic Particle Sizer. The particle size distribution (see Figure 17) had 90% of the particles
smaller than 10 m.
mine fire detector final report -V4.doc 19
Figure 16. High sensitivity optical smoke detector response to generated coal dust.
0
10
20
30
40
50
60
70
80
90
100
0.1 1 10 100
Particle Diameter (µm)
Cu
mu
lati
ve N
um
be
r (%
)
0
0.5
1
1.5
2
2.5
3
Nu
mb
er
(%)
Figure 17. Particle size distribution of Welbeck coal dust.
4.2.8 Thermal imaging camera
The thermal imaging camera could detect both smouldering fires and well-established fires (see Figure
18) but it could not detect any change in the temperature of the atmosphere of the training gallery.

mine fire detector final report -V4.doc 20
Figure 18. Thermal image of a smouldering coal fire before heat is applied (left) and once it is
well established (right).
4.2.9 Video Smoke Detection (VSD)
The VSD system detects smoke by real-time image analysis of the areas in a video image that are
changing against a library of known smoke signatures. Areas of video footage in which smoke is
detected are highlighted with a red box and an alarm is triggered. The system could identify smoke
using video footage of smouldering coal, wood and oil and grease fires (see Figure 19). Typically
VSD identification time was about the same as that of a viewer concentrating on the image.
Figure 19: VSD smoke identification of a smouldering coal fire before the fire starts (left) and
once smoke has began to be generated. Red squares indicate the detection of smoke.

mine fire detector final report -V4.doc 21
5 CONCLUSIONS AND RECOMMENDATIONS
The TGS 711 (as used in FIDESCO) was sensitive to all fires except oil and grease, and was very
sensitive to diesel exhaust. Of the alternative POC semiconductor sensors used in the trials, the TGS
2106 proved to be the most sensitive semiconductor to all fires. However, results from laboratory tests,
indicate that these sensors are sensitive to methane, water vapour and hydrogen. In addition, the TGS
2106 sensor specification has changed compared to earlier work by NIOSH/PRL (Edwards et al.,
2002) who used its predecessor - the TGS 2105. Therefore, variations in specification over time
mitigate against using it as an integral component of a sensor array. For these reasons it is
recommended that current semiconductor sensors should not be used as part of an underground fire
detector system.
The ionisation smoke detector was sensitive to all fires and diesel exhaust but also to coal dust. Its
potential when used with an optical light scattering sensor for discrimination of fires in the presence of
diesel exhaust and coal dust has been discussed (Litton, 2002). However, because of ionising radiation
regulations, the use of equipment containing an ionising source would cause complications in
underground mines; the general policy is to avoid their use. For this reason it is recommended that
ionisation smoke detectors should not be used as part of an underground fire detector system.
The carbon monoxide, nitric oxide and nitrogen dioxide electrochemical sensors responded to diesel
fume but not to the smouldering fires. This might prove useful in combination with optical smoke
detectors that cannot distinguish smoke particles from diesel fume. The presence of smoke particles
combined with a response from a nitric oxide or nitrogen dioxide sensor would indicate the presence
of diesel fume and not a smouldering fire.
The single wavelength optical smoke sensor was sensitive to most fires although not so sensitive to
smouldering wood and grease. It was not sensitive to diesel exhaust. It is sensitive to coal dust and
may even have a baseline shift after exposure to coal dust. However, it must be noted that the design
was not intended for use in coalmines. For these reasons it is recommended that simple, single
wavelength optical smoke sensors should not be used as part of an underground fire detector system.
The dual wavelength Blue/IR optical smoke detector was sensitive to all fires and the ratio of blue to
IR response was always above one and frequently above five for all these fires except for belt fires.
Laboratory tests showed a ratio of about 0.5 when exposed to coal dust, which indicates these sensors
should be able to distinguish smoke from coal dust. This was confirmed by tests in Welbeck on coal
dust on its own. However, when the detector was tested against both smoke and coal dust together, the
presence of coal dust was found to mask the response from smoke fume by reducing the blue/IR ratio
below that expected for smoke. The coal dust generated at Welbeck was probably not a good
representation of the concentrations and variability of airborne coal dust found underground so the
extent of this lack of discrimination is not known. Further work is required in an underground coal
mine to assess the levels and variability of airborne coal dust where the detectors would be positioned.
The Blue/IR optical smoke detector initially responded to belt fires with a blue/IR ratio above one but
this quickly fell below one. This response occurred for all belt samples except for dirty, used belts that
had their dirtier face up. This behaviour is not yet understood but it should not prevent the detectors
from alarming in the presence of smouldering belt fires because the peak in the ratio is of sufficient
duration to trigger an alarm.
The Blue/IR optical smoke detector also responded to diesel fume and could not distinguish it from
smoke. However, diesel fume could be distinguished from smoke by combining results from a nitric
oxide or nitrogen dioxide electrochemical sensor.

mine fire detector final report -V4.doc 22
A further limitation of the Blue/IR sensors is that they have a sensitivity of only 5%.m-1 obscuration;
at this level a person could see and smell a fire in advance of the detector (see Figure 10). Ideally,
these sensors would need to be made more sensitive. However, as collieries have become more
automated and there are fewer personnel to detect fires, this level of sensitivity may still be acceptable.
For these reasons it is recommended that Blue/IR smoke detectors could be used as part of an
underground fire detector system but more sensitive systems that are more able to discriminate coal
dust from smoke should be considered first.
The HART XL high sensitive optical smoke detector responded well to all fires but also to diesel
fume. The detectors use laser light sources and so are much more sensitive than the standard optical
smoke detectors. As a result, the detector responded to smoke fumes up to a minute before they could
be smelt. The Blue/IR usually responded one to three minutes after smoke fumes could be smelt and
sometimes much longer.
However, the Hart XL could not distinguish coal dust from smoke fume. Again, the extent of the lack
of discrimination would depend upon the concentrations and variability of airborne coal dust in mines
where the detectors would be positioned. If the coal dust concentration remained low or constant then
the Hart XL would be sensitive enough to detect small concentrations of smoke above the background
level. Further work is required underground to assess this.
If the dust levels are high or variable then a particle trap, such as a cyclone designed to remove
particles larger than about 0.5 m, should remove coal dust before it reached the detector. The cyclone
should also require minimum maintenance by not allowing larger particles to block the system. As the
Hart XL is an aspirated system, a cyclone should be easy to attach. Indeed, the Vesda smoke aspirating
system, a smoke detector similar to the Hart XL, uses a dual filter system to remover the larger dust
particles. This is known to work well in many industrial situations including safe document storage
areas in Winsford Salt Mine. However, these situations are far less dusty than coalmines and it would
be expected that the discrimination filters would need replacing much more frequently in coalmines. A
visit to Winsford Salt Mine suggests that these filters could need changing every 2 to 4 months and the
system cleaned every 3 to 9 days in typical underground coalmine conditions.
Both the Hart XL and Vesda systems are about 15 times more expensive than the other types of sensor
discussed here and could have significantly higher maintenance costs, especially for the Vesda system.
However, their high sensitivity could mean that many fewer units would be needed to protect a mine,
which may reduce costs to a more acceptable level. A better understanding of underground ventilation
networks, coal dust levels and likely areas that a fire could start is required, along with further
measurements underground. Despite these limitations, it is recommended that an advanced mine fire
detector system should be based upon a high sensitive optical smoke detector such as the Hart XL.
The thermal imaging camera could readily highlight heat produced from smouldering and well-
established fires but it could not detect any change in the atmosphere of the training gallery. This
means the thermal camera requires direct line-of-site to a fire to be able to detect it. Also, they do not
work well in dusty environments and it would be very expensive to install and maintain the
intrinsically safe versions required in coalmines. Similarly, Video Smoke Detection systems would
also be very expensive to install (eg requirement for intrinsically safe cameras) and maintain.
Although none of the sensors tested here have proved to be totally acceptable, the most promising for
a potential advanced mine fire detector system is based on a combination of a high sensitive optical
smoke detector based on laser particle counting (such as the Hart XL) fitted with a cyclone to remove
coal dust; and nitric oxide or nitrogen dioxide electrochemical sensors to distinguish smoke from
diesel exhaust. If such a system proves to be too expensive then an alternative could be based upon a
combination of Blue/IR optical smoke detector, which distinguish fires and diesel exhaust from coal
dust, and the nitric oxide or nitrogen dioxide electrochemical sensor. The latter system maybe more

mine fire detector final report -V4.doc 23
preferable if airborne coal dust concentrations are low and remain constant in the areas the detectors
would be positioned.

mine fire detector final report -V4.doc 24
6 APPENDICES
6.1 LOCATIONS OF COMPLETE SETS OF RESULTS
Table 2. Locations of data files
Results Section Files Location
Laboratory results
\Gas sensors 2004 POC semiconductor
sensors 3.1 All files in directories
\labtests
Kidde smoke detectors 3.2 All “.xls” calibration files and “coal dust
ratio.ppt” \Kidde_data
Field results
POC semiconductor
sensors
4.2.1 and
4.2.2
Ionisation smoke detector 4.2.3
FIDESCO
electrochemical NO, NO2
and CO sensors 4.2.4
“keysensors.xls” \Welbeck2003
MultiRae electrochemical
NO and NO2 sensors 4.2.4
“welbeck1.dat”, “welbeck-day2-CO.dat”,
“welbeck-day2-NO.dat” and “welbeck-
day2-K4.xls”
\Welbeck 23-08-04 and
\Welbeck 27-08-04
Optical smoke detector 4.2.5 “keysensors.xls” \Welbeck2003
“Welbeck-day1.K1.xls”, “Welbeck-day1-
K4.xls” \Welbeck 23-08-04
“Welbeck-day2.K4.xls” \Welbeck 27-08-04
“Welbeck-day3.K1.xls”, “Welbeck-day3-
K4.xls” \Welbeck 1-10-04
“Welbeck-day4-K1.xls” \Welbeck 25-05-05
Blue/IR optical smoke
detector 4.2.6
“Fenners-K1.xls” and “Fenners-K4.xls” \Fenners 25-11-04
High sensitive optical
smoke detector 4.2.7
All “.smk” files and “HART results
summary.doc” \Welbeck 25-05-05
Thermal imaging camera 4.2.8 All files in directory \Thermal imaging
Video Smoke Detection 4.2.9 VHS video tape Section archive
All directories are sub-directories of “:H\WORK\HSE\REACTIVE\SUPPORT\S2003135 Mine fire
detection”.
mine fire detector final report -V4.doc 25
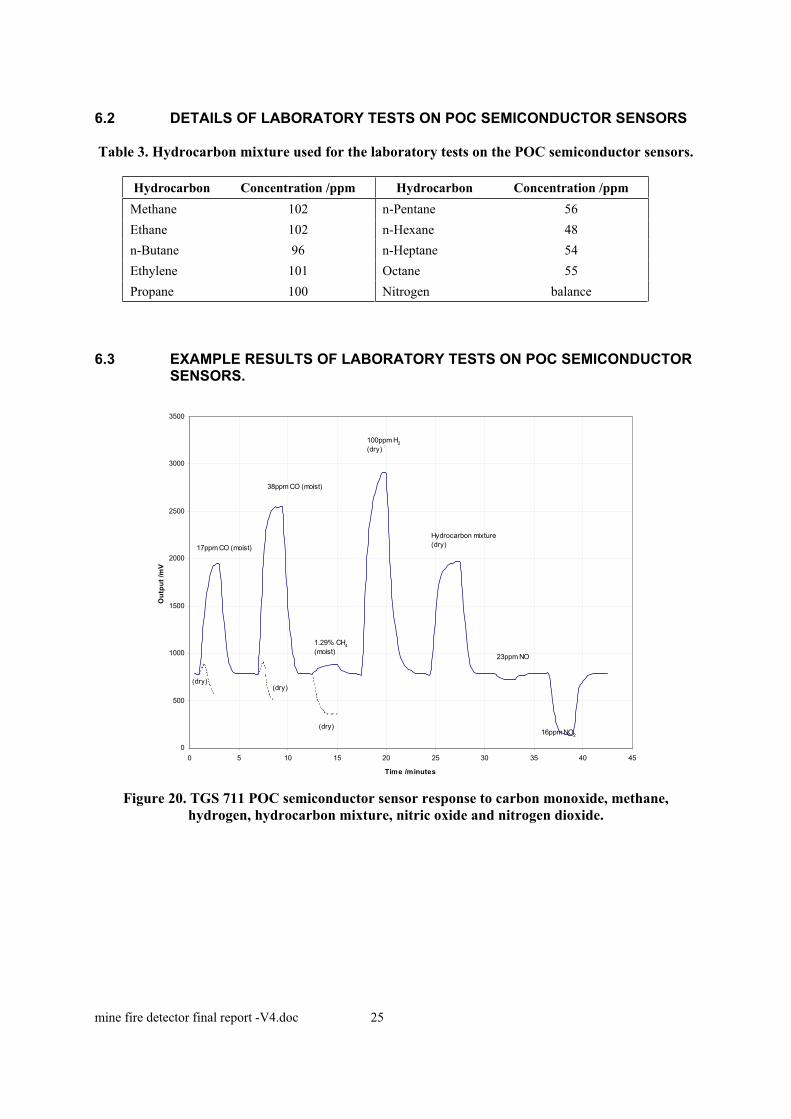
6.2 DETAILS OF LABORATORY TESTS ON POC SEMICONDUCTOR SENSORS
Table 3. Hydrocarbon mixture used for the laboratory tests on the POC semiconductor sensors.
Hydrocarbon Concentration /ppm Hydrocarbon Concentration /ppm
Methane 102 n-Pentane 56
Ethane 102 n-Hexane 48
n-Butane 96 n-Heptane 54
Ethylene 101 Octane 55
Propane 100 Nitrogen balance
6.3 EXAMPLE RESULTS OF LABORATORY TESTS ON POC SEMICONDUCTOR SENSORS.
0
500
1000
1500
2000
2500
3000
3500
0 5 10 15 20 25 30 35 40 45
Time /minutes
Ou
tpu
t /m
V
17ppm CO (moist)
(dry)
38ppm CO (moist)
(dry)
1.29% CH4
(moist)
(dry)
100ppm H2
(dry)
Hydrocarbon mixture
(dry)
23ppm NO
16ppm NO2
Figure 20. TGS 711 POC semiconductor sensor response to carbon monoxide, methane,
hydrogen, hydrocarbon mixture, nitric oxide and nitrogen dioxide.

mine fire detector final report -V4.doc 26
0
500
1000
1500
2000
2500
3000
3500
4000
4500
5000
0 5 10 15 20 25 30 35 40 45 50 55 60
Time /minutes
Ou
tpu
t /m
V
17ppm CO
38ppm CO
100ppm H2
1.29% CH4
Hydrocarbon mixture
23ppm NO 16ppm NO2
Figure 21. TGS 2106 POC semiconductor sensor response to carbon monoxide, methane,
hydrogen, hydrocarbon mixture, nitric oxide and nitrogen dioxide.
0
100
200
300
400
500
600
700
800
900
0 5 10 15 20 25 30 35 40 45 50 55 60
Time /minutes
Ou
tpu
t /m
V
17ppm CO
38ppm CO
1.29% CH4
100ppm H2
Hydrocarbon mixture23ppm NO 16ppm NO2
Figure 22. TGS 2442 POC semiconductor sensor response to carbon monoxide, methane,
hydrogen, hydrocarbon mixture, nitric oxide and nitrogen dioxide.

mine fire detector final report -V4.doc 27
0
500
1000
1500
2000
2500
3000
3500
4000
4500
5000
0 5 10 15 20 25 30 35 40 45 50 55
Time /minutes
Ou
tpu
t /m
V
17ppm CO
1.29% CH4
100ppm H2
Hydrocarbon mixture
23ppm NO
16ppmNO2
Figure 23.TGS 2442 POC semiconductor sensor response to carbon monoxide, methane,
hydrogen, hydrocarbon mixture, nitric oxide and nitrogen dioxide.
0
100
200
300
400
500
600
700
800
900
1000
09:12 09:22 09:32 09:42 09:52 10:02 10:12 10:22
ou
tpu
t /m
V
TGS 2442 TGS 2106 TGS 2600
Figure 24. TGS 2106, 2442 and 2600 POC semiconductor sensor response to clean humid air.

mine fire detector final report -V4.doc 28
7 REFERENCES
BSI (1990)
BS 3289 : 1990 (was current, now withdrawn, replaced by BS 3289 : 2005)
Specification for textile carcase conveyor belting for use in underground mines (including fire
performance)
BSI, London.
BSI (1996)
BS EN 54-1 : 1996 Fire detection and fire alarm systems. Introduction.
BSI London.
Edwards J C, Franks R A, Friel G F, Lazzara C P, Opferman J J (2000).
Mine fire detection in the presence of diesel emissions
J. Mine Ventilation Soc. of South Africa. April/June 2000, 66-71
Edwards J C, Franks R A, Friel G F, Lazzara C P, Opferman J J (2002).
In mine evaluation of discriminating mine fire sensors.
Proc. North American/9th US Mine Ventilation Symp., Kingston, Ontario. June 2002. ed. De Souza E.
A A Balkema Publishers., Lisse. Pp 527-532.
Hambleton R T, Clark R D R, Plant I J, Walsh P T and Scott P B (1997).
Placement and performance of fire detection equipment in underground mines.
Proc. of 27th Int. Conf. of Safety in Mines Research Institutes, New Delhi, India, 1997.
Hoddy JD and Gibson MJ (1977)
Testing of Type 711 Taguchi gas sensor
NCB MRDE Internal Report No. 77/10
Litton C D (2002)
The use of light scattering and ion chamber responses for the detection of fires in diesel contaminated
atmospheres.
Fire Safety Journal. 37, 409-425.
Liu Z and Kim AK (2003)
Review of recent developments in fire detection technologies
J. Fire Protection Engineering, 13, 129-146
Meacham B J (1994). The use of artificial intelligence techniques for signal discrimination in fire
detection systems.
J. Fire Protection Engineering. 6, 125-136.
RJB Mining UK (1998).
Underground environmental fire detection systems: Selection, installation and use. Company Directive
4/98. July 1998.
RJB Mining (UK) Ltd.
Royals B. (2001).
Investigation of fumes produced by a heated conveyor belt. Report carried out for UK Coal Mining
Ltd., Kellingley Colliery. TES Bretby Report No TES/01/384.
TES Bretby.

mine fire detector final report -V4.doc 29
UK Coal (2002).
Products of Combustion Questionnaire. Attachment No 4 to Minutes of 2nd Meeting of HSE/HID
Mine Fire Detection Working Group. 5 Feb. 2002.
Walsh P T and Hunneyball S R (2002)
A review of early warning fire detection techniques for use in underground mines.
HSL Report FMS/02/09.
Watson J and Yates RA (1985)
A solid-state gas sensor
Electronic Engineering. May 1985, 47-57