Embed Size (px)
Citation preview
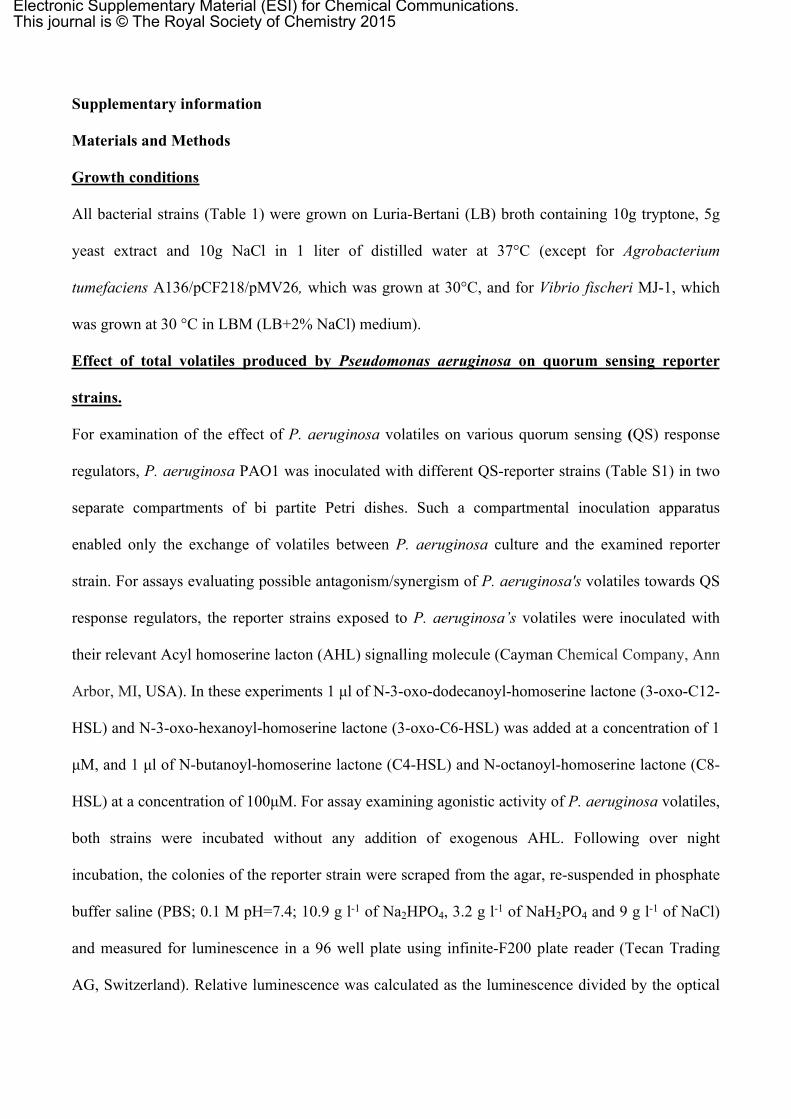
Supplementary information
Materials and Methods
Growth conditions
All bacterial strains (Table 1) were grown on Luria-Bertani (LB) broth containing 10g tryptone, 5g
yeast extract and 10g NaCl in 1 liter of distilled water at 37°C (except for Agrobacterium
tumefaciens A136/pCF218/pMV26, which was grown at 30°C, and for Vibrio fischeri MJ-1, which
was grown at 30 °C in LBM (LB+2% NaCl) medium).
Effect of total volatiles produced by Pseudomonas aeruginosa on quorum sensing reporter
strains.
For examination of the effect of P. aeruginosa volatiles on various quorum sensing (QS) response
regulators, P. aeruginosa PAO1 was inoculated with different QS-reporter strains (Table S1) in two
separate compartments of bi partite Petri dishes. Such a compartmental inoculation apparatus
enabled only the exchange of volatiles between P. aeruginosa culture and the examined reporter
strain. For assays evaluating possible antagonism/synergism of P. aeruginosa's volatiles towards QS
response regulators, the reporter strains exposed to P. aeruginosa’s volatiles were inoculated with
their relevant Acyl homoserine lacton (AHL) signalling molecule (Cayman Chemical Company, Ann
Arbor, MI, USA). In these experiments 1 μl of N-3-oxo-dodecanoyl-homoserine lactone (3-oxo-C12-
HSL) and N-3-oxo-hexanoyl-homoserine lactone (3-oxo-C6-HSL) was added at a concentration of 1
μM, and 1 μl of N-butanoyl-homoserine lactone (C4-HSL) and N-octanoyl-homoserine lactone (C8-
HSL) at a concentration of 100μM. For assay examining agonistic activity of P. aeruginosa volatiles,
both strains were incubated without any addition of exogenous AHL. Following over night
incubation, the colonies of the reporter strain were scraped from the agar, re-suspended in phosphate
buffer saline (PBS; 0.1 M pH=7.4; 10.9 g l-1 of Na2HPO4, 3.2 g l-1 of NaH2PO4 and 9 g l-1 of NaCl)
and measured for luminescence in a 96 well plate using infinite-F200 plate reader (Tecan Trading
AG, Switzerland). Relative luminescence was calculated as the luminescence divided by the optical
Electronic Supplementary Material (ESI) for Chemical Communications.This journal is © The Royal Society of Chemistry 2015
density. Relative green fluorescence produced by B. cenocepacia H111-I/pAS-C8 was measured
with an excitation wavelength of 465 nm and an emission wavelength of 535 nm.
Volatile profiles analysis
500 μl of medium with either PAO1 or PAO1 ΔlasR in triplicates were diluted with 500 μl of DDW.
5 μl of 1ppm benzylacetone in MeOH were added as an internal standard, to a final concentration of
0.33 μM or 5 ppb. Stir Bar Sorptive Extraction was carried out using a 1x10 mm PDMS-coated
Twister bar (Gerstel GmbH, Mülheim an der Ruhr, Germany), for 8 h. The Twisters were wiped and
rinsed with DDW and were subjected to Thermal Desorption coupled to a Programmed-temperature
vaporization (PTV) injector (TDU-CIS-4, Gerstel). Desorption was carried out under TDU splitless
conditions with 40 ml min-1 He flow, and a temperature gradient of 60°C min-1 from 20°C to 170°C
with a 5 mins hold. The PTV inlet was was fitted with a quartz wool liner (Gerstel) and kept under -
20°C for the duration of the desorption process, after which a temperature gradient of 12°C sec-1
ensued, up to 250°C with a 10 min hold.
A 7890 Gas Chromatograph (GC) coupled to a 5375 Mass spectrometer (MS) (Agilent technologies,
Santa Clara, CA), fitted with a Rxi-XLB 30x0.25x0.25 Column (Restek, Bellafonte, PA) were used
to run the analyses. GC oven temperature gradient was 40°C for 3 mins then 15°C min-1 to 280°C for
5 mins. MS was operated in positive EI scan (40-400 amu) mode, 70 eV energy. Obtained
chromatograms were analyzed with Chemstation software (Agilent) and mass spectra were compared
to Wiley9/NIST08 combined mass spectral library (Wiley and Sons, Hoboken, NJ) and/or NIST11
(NIST, Gaitersburg, MD). 2-aminoacetophenone (2-AA) and benzylacetone identification was
verified with commercials standards (Sigma) for spectra and retention times.
Integration was carried out in Chemstation using chemstation integrator. Areas under the curve
(AUCs) were normalized to the AUC of the internal standard.
Effect of 2-aminoacetophenone on specific QS-reporter strains
2-AA was applied to various reporter strains in order to evaluate whether it could inhibit or activate
different QS response regulators. The reporter strains were grown overnight at 30 °C in LB medium
with an appropriate antibiotic and then washed and diluted 1:100 with fresh LB medium, obtaining a
concentration of approximately 107 cells ml-1. 100 µl of the cultures were added per well to a 96-
wells plate (Corning Inc., NY, USA. Cat. number 356701) in four replicates. Assays for
antagonistic/synergistic activity were prepared by the addition of 2-AA together with a specific AHL
to the reporter strains cultures. Agonism assay was carried out by the addition of 2-AA to the
reporter strain without the addition of any AHL. The negative controls lacked both 2-AA and AHL
while the positive controls contained only the appropriate AHL at various concentrations. 2-AA was
added for both agonism and antagonism/synergism assays at concentrations of 1, 10, 25, 50, 100 and
500 μM. C4-HSL, C8-HSL and 3-oxo-C12-HSL were added for positive controls at concentrations
of 1, 10, 25, 50, 100 and 500 μM, while 3-oxo-C6-HSL was added at 1, 10, 25, 50 and 500 nM. For
antagonism/synergism assays C4-HSL, C8-HSL and 3-oxo-C12-HSL were added at concentration of
10 μM, while 3-oxo-C6-HSL was added at 10 nM. 2-AA was added directly to the culture of the
reporter strains before dividing it to the wells of the 96-well plate, while one microliter of various
AHLs at different concentrations, dissolved in acetonitrile, was placed in the well half an hour prior
to the addition of the cultures to allow evaporation of acetonitrile. The bacteria within the plates were
then incubated for 24 h at 37 °C, except for A. tumefaciens A136/pCF218/pMV26, which was
incubated at 30 °C. During the incubation, optical density (OD λ=600nm) and the luminescence or
the fluorescence produced by the reporter strains were measured at 30 min intervals using infinite-
F200 plate reader (Tecan Trading AG, Switzerland).
The effect of 2-AA in its volatile state was examined as follows: Briefly, 10 nmol of 2-AA and 100
µl of overnight incubated reporter strain were added to 2 opposite sides of bi partite Petri dishes.
Following over night incubation of the reporter strain was scraped from the agar plate and relative
luminescence was measured as describe above.
Effect of 2-aminoacetophenone on Vibrio fischeri’s LuxR-regulated luminescence.
2-Acetoaminophenone was added to V. fischeri in order to verify the activity of 2-AA on QS-
regulated traits in a LuxR-harboring wild-type strain. The starters for the experiment were prepared
as follow: prior each experiment, a culture from a glycerol stock was inoculated in LBM medium
and incubated overnight at 30 0C, then diluted 1:1000 and incubated overnight again. The culture
was then washed and diluted 1:1000 prior to addition of 25, 50 or 100 µM of 2-AA, or 10 nM of 3-
oxo-C6-HSL. Luminescence and absorbance of MJ-1 cultures incubated in 96-well plate was
measured as described above. It should be mentioned that in two repeats of the experiment, no
luminescence was measured neither following the addition of AHL nor 2-AA. These repeats were
not included in data analysis and presentation.
Effect of 2-AA analogs on LuxR
Seven analogs of 2-AA were tested against E. coli/pSB401 and E. coli JLD271/pAL103 in order to
evaluate what chemical groups of 2-AA are involved in ligand-receptor interaction. The following
compounds were used: 4-aminoacetophenone, 3-aminoacetophenone, aminoacetophenone, 2-
nitroacetophenone, methyl anthranilate, anthranilic acid and 2-aminobenzaldehyde (Sigma, St. Louis,
USA). These compounds were applied to the reporter strain in the concentrations of 1-50 μM as
describe for 2-AA. Luminescence was measured after 12 h in a plate reader.
Multiple sequence alignment
Multiple sequence analysis (MSA) was done on TraR (PDB code: 1L3L), LasR (PDB code:
2UVO), SdiA (PDB code: 2AVX) and LuxR (Uniprot entry: P12746), using T-Coffee
(http://tcoffee.vital-it.ch/apps/tcoffee/index.html). In addition, LuxR response regulators of the
following species were aligned with LuxR of Vibrio fischeri (accession number CAA68561.1):
Aliivibrio logei (AAQ90213.1), Vibrio mimicus (AAQ90214.1), Photobacterium leiognathi
(AAQ90227.1) and Vibrio parahaemolyticus (AAQ90194.1).
Homology Model Construction
LuxR (Uniprot entry: P12746) was aligned with TraR (PDB code: 1L3L) using T-Coffee
(http://tcoffee.vital-it.ch/apps/tcoffee/index.html). A model of LuxR was created using the Modeller
protocol (1) as implemented in Discovery Studio 4.0 (DS 4.0, Accelrys). Twenty models were
generated and model quality was assessed using the protein report tool (DS 4.0) and the model with
the best score was chosen for further refinement, which included minimization. Default protocol
settings were used.
Identification of a binding site in the model
Binding site was defined using 'define binding site' protocol in DS 4.0. This protocol is based on an
'eraser and flood-filling grid algorithm', where binding sites are identified based on the shape of the
receptor. The best scored site was determined as the binding site for the generated model. Default
algorithm settings were used.
Ligand Docking
Ligands were prepared using ‘prepare ligands’ protocol and conformations were generated using
‘generate conformations’ protocol, both as implemented in DS 4.0. Docking of the ligands was
performed using CDocker protocol (DS 4.0). Default protocols settings were used.
Supplementary figures and tables
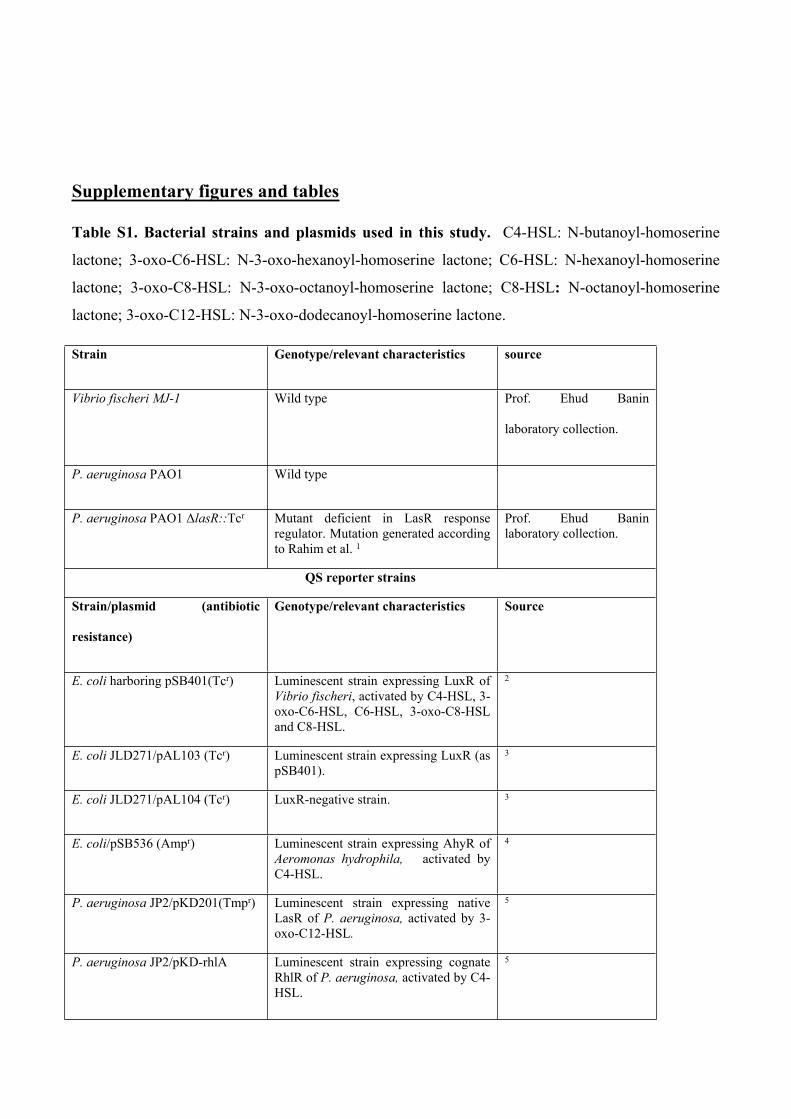
Table S1. Bacterial strains and plasmids used in this study. C4-HSL: N-butanoyl-homoserine
lactone; 3-oxo-C6-HSL: N-3-oxo-hexanoyl-homoserine lactone; C6-HSL: N-hexanoyl-homoserine
lactone; 3-oxo-C8-HSL: N-3-oxo-octanoyl-homoserine lactone; C8-HSL: N-octanoyl-homoserine
lactone; 3-oxo-C12-HSL: N-3-oxo-dodecanoyl-homoserine lactone.
Strain Genotype/relevant characteristics source
Vibrio fischeri MJ-1 Wild type Prof. Ehud Banin
laboratory collection.
P. aeruginosa PAO1 Wild type
P. aeruginosa PAO1 ΔlasR::Tcr Mutant deficient in LasR response regulator. Mutation generated according to Rahim et al. 1
Prof. Ehud Banin laboratory collection.
QS reporter strains
Strain/plasmid (antibiotic
resistance)
Genotype/relevant characteristics Source
E. coli harboring pSB401(Tcr) Luminescent strain expressing LuxR of Vibrio fischeri, activated by C4-HSL, 3-oxo-C6-HSL, C6-HSL, 3-oxo-C8-HSL and C8-HSL.
2
E. coli JLD271/pAL103 (Tcr) Luminescent strain expressing LuxR (as pSB401).
3
E. coli JLD271/pAL104 (Tcr) LuxR-negative strain. 3
E. coli/pSB536 (Ampr) Luminescent strain expressing AhyR of Aeromonas hydrophila, activated by C4-HSL.
4
P. aeruginosa JP2/pKD201(Tmpr) Luminescent strain expressing native LasR of P. aeruginosa, activated by 3-oxo-C12-HSL.
5
P. aeruginosa JP2/pKD-rhlA Luminescent strain expressing cognate RhlR of P. aeruginosa, activated by C4-HSL.
5
(Tmpr)
Salmonella enterica
14028/pBA405E (Tcr)
Luminescent strain expressing cognate SdiA response regulator, activated by 3-oxo-C6-HSL and 3-oxo-C8-HSL.
6
Agrobacterium tumefaciens
A136/pCF218/pMV26 (Tcr)
Luminescent strain expressing cognate TraR response regulator, sensitive to C8-HSL, C6-HSL and 3-oxo-C6-HSL.
7
Burkholderia cenocepacia H111-
I/pAS-C8 (Gmr)
Fluorescent strain expressing its CepR response regulator, activated by C8-HSL.
8
Control PAO1 .
Lum
ines
cenc
e/O
.D.
0
2e+5
4e+5
6e+5
8e+5
a
b
a
lasR
Figure S1. Effect of total volatiles of P. aeruginosa wild type and ΔlasR mutant on LuxR-
expressing biosensor. Luminescence levels of Escherichia coli/pSB401 reporter strain, expressing
LuxR response regulator in response to total volatiles of P. aeruginosa wild type (PAO1) and its
lasR mutant (ΔlasR). n=4; Error bars are the standard error of the mean. Different letters indicate a
statistical difference (P<0.05) according to ANOVA on Ranks and Student–Newman–Keuls post hoc
test.
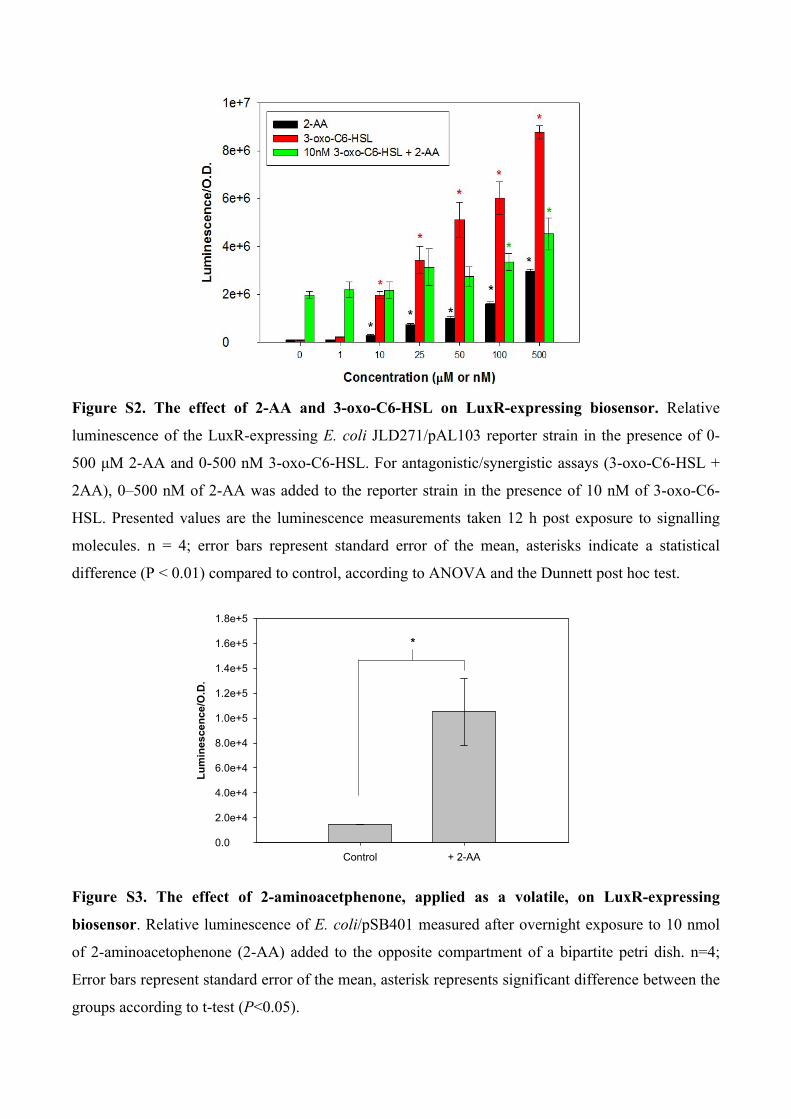
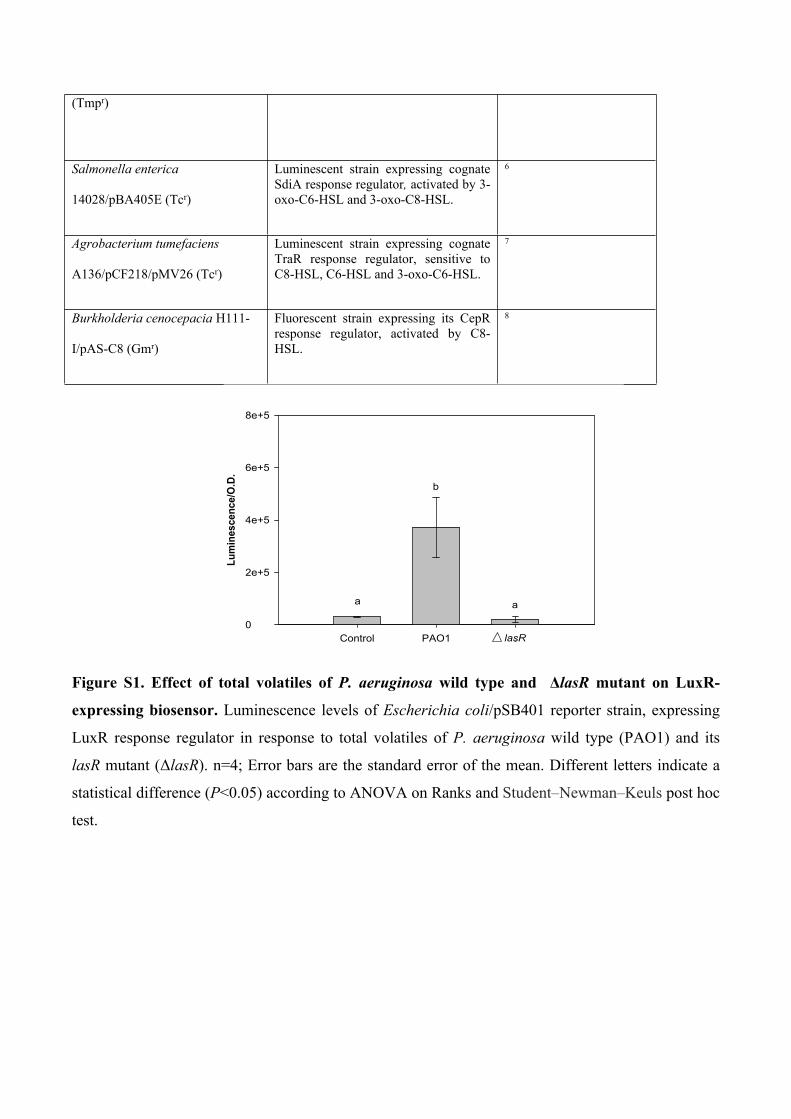
Figure S2. The effect of 2-AA and 3-oxo-C6-HSL on LuxR-expressing biosensor. Relative
luminescence of the LuxR-expressing E. coli JLD271/pAL103 reporter strain in the presence of 0-
500 μM 2-AA and 0-500 nM 3-oxo-C6-HSL. For antagonistic/synergistic assays (3-oxo-C6-HSL +
2AA), 0–500 nM of 2-AA was added to the reporter strain in the presence of 10 nM of 3-oxo-C6-
HSL. Presented values are the luminescence measurements taken 12 h post exposure to signalling
molecules. n = 4; error bars represent standard error of the mean, asterisks indicate a statistical
difference (P < 0.01) compared to control, according to ANOVA and the Dunnett post hoc test.
Control + 2-AA
Lum
ines
cenc
e/O
.D.
0.0
2.0e+4
4.0e+4
6.0e+4
8.0e+4
1.0e+5
1.2e+5
1.4e+5
1.6e+5
1.8e+5
*
Figure S3. The effect of 2-aminoacetphenone, applied as a volatile, on LuxR-expressing
biosensor. Relative luminescence of E. coli/pSB401 measured after overnight exposure to 10 nmol
of 2-aminoacetophenone (2-AA) added to the opposite compartment of a bipartite petri dish. n=4;
Error bars represent standard error of the mean, asterisk represents significant difference between the
groups according to t-test (P<0.05).
AAconcentration
0 1 10 25 50 100 500
Lum
ines
cenc
e/O
.D.
0.0
5.0e+4
1.0e+5
1.5e+5
2.0e+5
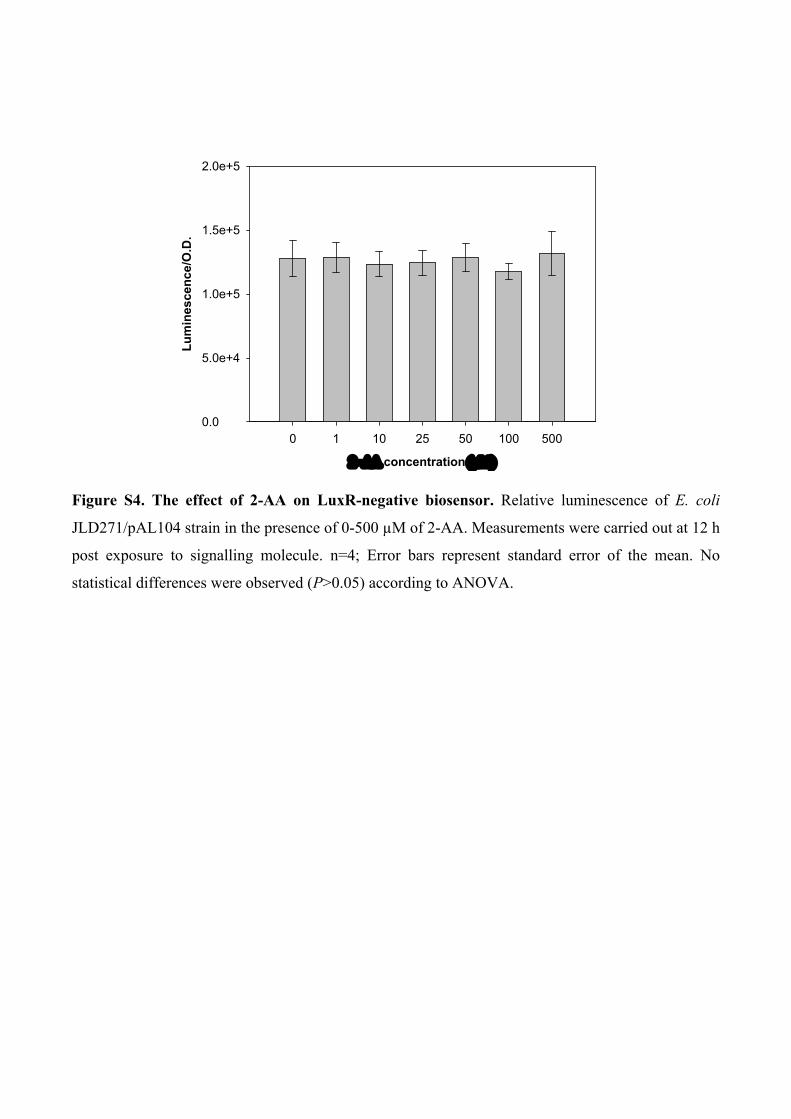
Figure S4. The effect of 2-AA on LuxR-negative biosensor. Relative luminescence of E. coli
JLD271/pAL104 strain in the presence of 0-500 µM of 2-AA. Measurements were carried out at 12 h
post exposure to signalling molecule. n=4; Error bars represent standard error of the mean. No
statistical differences were observed (P>0.05) according to ANOVA.
Concentration (M)
0 1 10 25 50 100 500
Lum
ines
cenc
e/O
.D.
0.01.0e+4
2.0e+5
4.0e+5
6.0e+5
8.0e+5
1.0e+6
1.2e+62-AA C4-HSL 10nM C4-HSL + 2-AA
**
**
*
*
***
******
Concnentration (nM or M)
0 1 10 25 50 100 500
Lum
ines
cenc
e/O
.D.
05e+41e+5
1e+6
2e+6
3e+6
4e+62-AA 3-oxo-C12-HSL 10?M 3-oxo-C12-HSL + 2-AA
*
*
*
* *
*
******
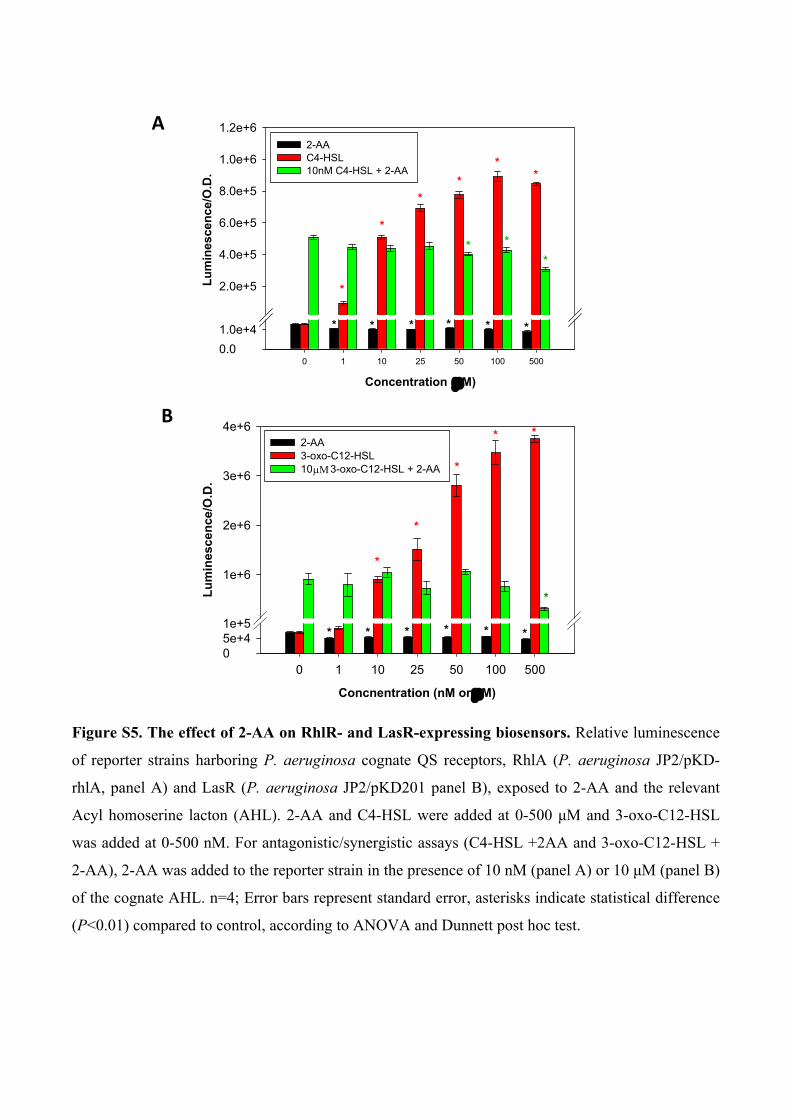
Figure S5. The effect of 2-AA on RhlR- and LasR-expressing biosensors. Relative luminescence
of reporter strains harboring P. aeruginosa cognate QS receptors, RhlA (P. aeruginosa JP2/pKD-
rhlA, panel A) and LasR (P. aeruginosa JP2/pKD201 panel B), exposed to 2-AA and the relevant
Acyl homoserine lacton (AHL). 2-AA and C4-HSL were added at 0-500 μM and 3-oxo-C12-HSL
was added at 0-500 nM. For antagonistic/synergistic assays (C4-HSL +2AA and 3-oxo-C12-HSL +
2-AA), 2-AA was added to the reporter strain in the presence of 10 nM (panel A) or 10 μM (panel B)
of the cognate AHL. n=4; Error bars represent standard error, asterisks indicate statistical difference
(P<0.01) compared to control, according to ANOVA and Dunnett post hoc test.
A
B
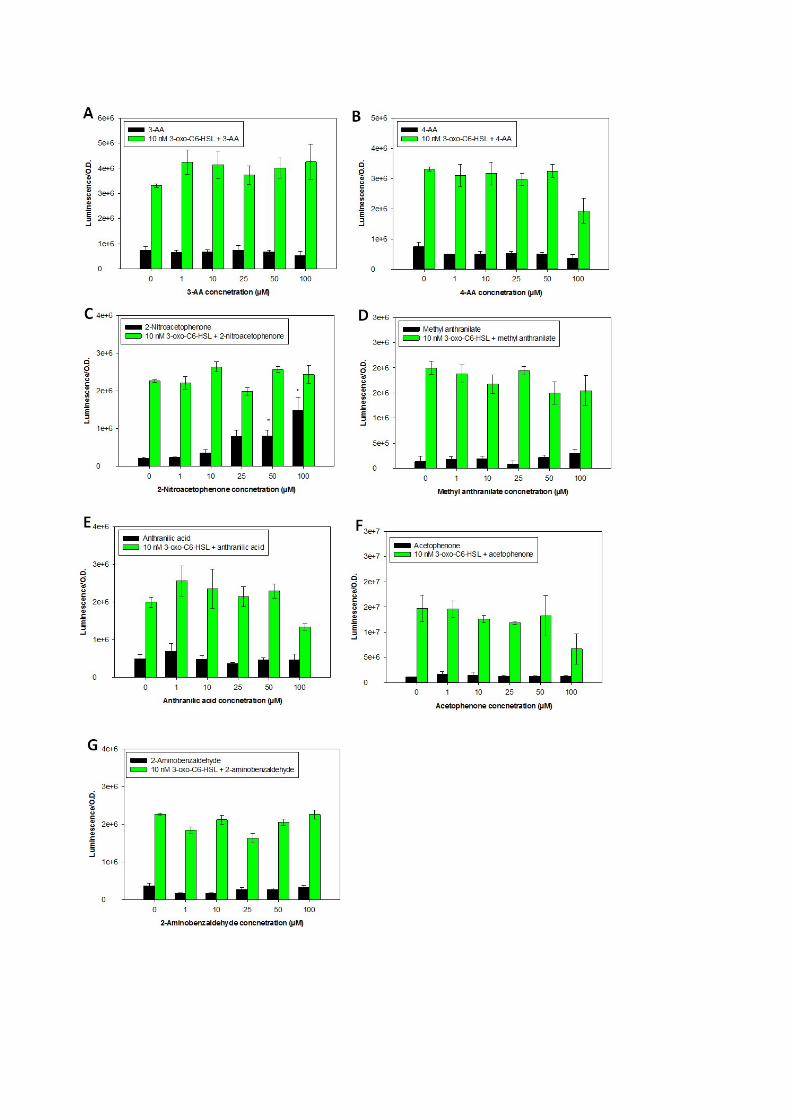
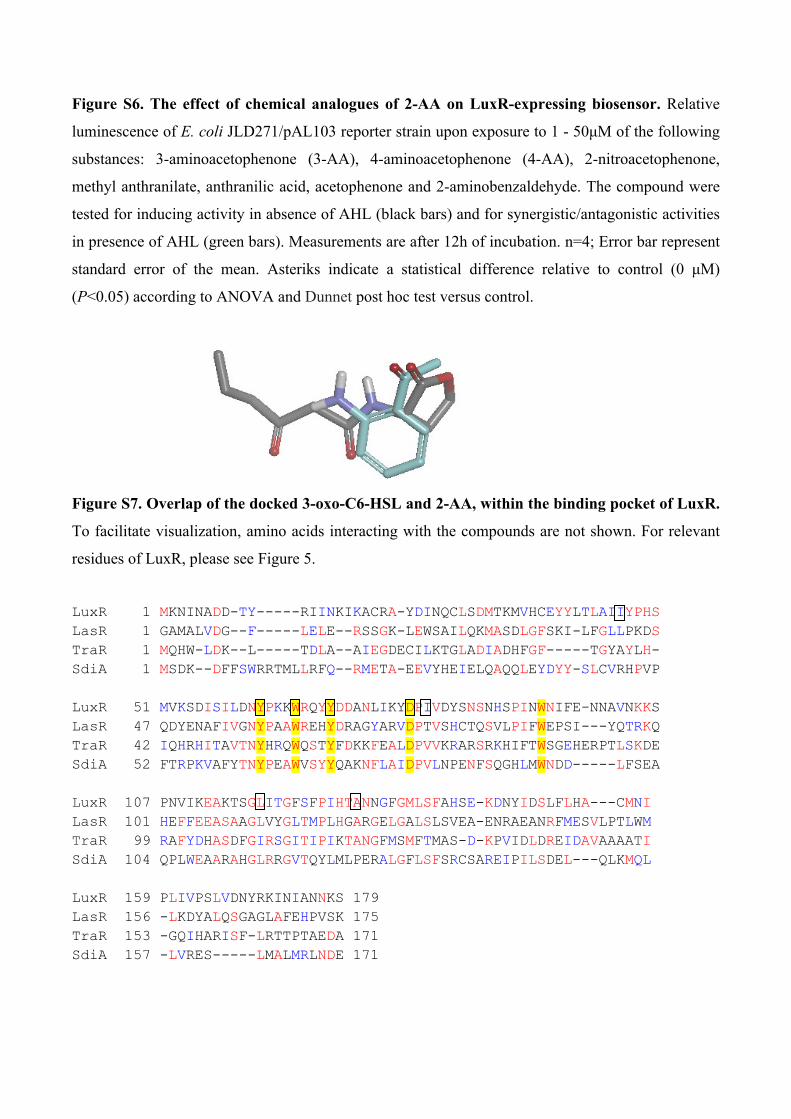
Figure S6. The effect of chemical analogues of 2-AA on LuxR-expressing biosensor. Relative
luminescence of E. coli JLD271/pAL103 reporter strain upon exposure to 1 - 50μM of the following
substances: 3-aminoacetophenone (3-AA), 4-aminoacetophenone (4-AA), 2-nitroacetophenone,
methyl anthranilate, anthranilic acid, acetophenone and 2-aminobenzaldehyde. The compound were
tested for inducing activity in absence of AHL (black bars) and for synergistic/antagonistic activities
in presence of AHL (green bars). Measurements are after 12h of incubation. n=4; Error bar represent
standard error of the mean. Asteriks indicate a statistical difference relative to control (0 μM)
(P<0.05) according to ANOVA and Dunnet post hoc test versus control.
Figure S7. Overlap of the docked 3-oxo-C6-HSL and 2-AA, within the binding pocket of LuxR.
To facilitate visualization, amino acids interacting with the compounds are not shown. For relevant
residues of LuxR, please see Figure 5.
LuxR 1 MKNINADD-TY-----RIINKIKACRA-YDINQCLSDMTKMVHCEYYLTLAIIYPHSLasR 1 GAMALVDG--F-----LELE--RSSGK-LEWSAILQKMASDLGFSKI-LFGLLPKDSTraR 1 MQHW-LDK--L-----TDLA--AIEGDECILKTGLADIADHFGF-----TGYAYLH-SdiA 1 MSDK--DFFSWRRTMLLRFQ--RMETA-EEVYHEIELQAQQLEYDYY-SLCVRHPVP
LuxR 51 MVKSDISILDNYPKKWRQYYDDANLIKYDPIVDYSNSNHSPINWNIFE-NNAVNKKSLasR 47 QDYENAFIVGNYPAAWREHYDRAGYARVDPTVSHCTQSVLPIFWEPSI---YQTRKQTraR 42 IQHRHITAVTNYHRQWQSTYFDKKFEALDPVVKRARSRKHIFTWSGEHERPTLSKDESdiA 52 FTRPKVAFYTNYPEAWVSYYQAKNFLAIDPVLNPENFSQGHLMWNDD-----LFSEA
LuxR 107 PNVIKEAKTSGLITGFSFPIHTANNGFGMLSFAHSE-KDNYIDSLFLHA---CMNILasR 101 HEFFEEASAAGLVYGLTMPLHGARGELGALSLSVEA-ENRAEANRFMESVLPTLWMTraR 99 RAFYDHASDFGIRSGITIPIKTANGFMSMFTMAS-D-KPVIDLDREIDAVAAAATISdiA 104 QPLWEAARAHGLRRGVTQYLMLPERALGFLSFSRCSAREIPILSDEL---QLKMQL
LuxR 159 PLIVPSLVDNYRKINIANNKS 179LasR 156 -LKDYALQSGAGLAFEHPVSK 175TraR 153 -GQIHARISF-LRTTPTAEDA 171SdiA 157 -LVRES-----LMALMRLNDE 171
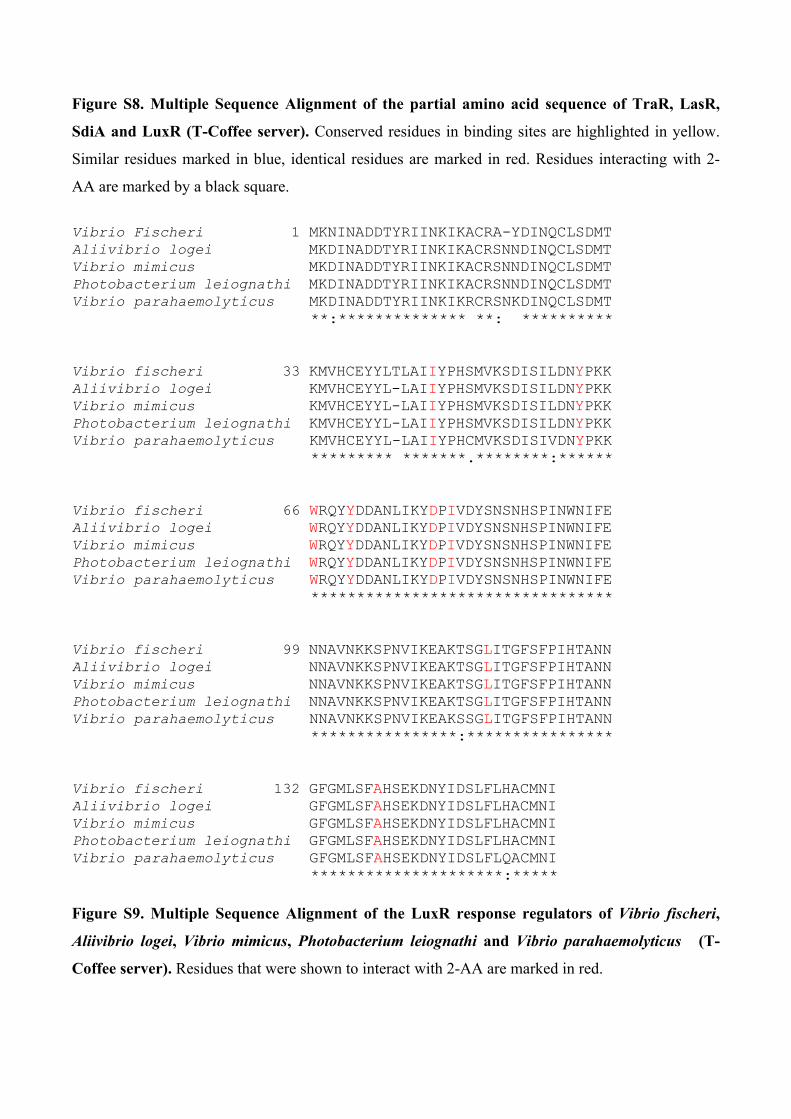
Figure S8. Multiple Sequence Alignment of the partial amino acid sequence of TraR, LasR,
SdiA and LuxR (T-Coffee server). Conserved residues in binding sites are highlighted in yellow.
Similar residues marked in blue, identical residues are marked in red. Residues interacting with 2-
AA are marked by a black square.
Vibrio Fischeri 1 MKNINADDTYRIINKIKACRA-YDINQCLSDMTAliivibrio logei MKDINADDTYRIINKIKACRSNNDINQCLSDMTVibrio mimicus MKDINADDTYRIINKIKACRSNNDINQCLSDMTPhotobacterium leiognathi MKDINADDTYRIINKIKACRSNNDINQCLSDMTVibrio parahaemolyticus MKDINADDTYRIINKIKRCRSNKDINQCLSDMT **:************** **: **********
Vibrio fischeri 33 KMVHCEYYLTLAIIYPHSMVKSDISILDNYPKKAliivibrio logei KMVHCEYYL-LAIIYPHSMVKSDISILDNYPKKVibrio mimicus KMVHCEYYL-LAIIYPHSMVKSDISILDNYPKKPhotobacterium leiognathi KMVHCEYYL-LAIIYPHSMVKSDISILDNYPKKVibrio parahaemolyticus KMVHCEYYL-LAIIYPHCMVKSDISIVDNYPKK ********* *******.********:******
Vibrio fischeri 66 WRQYYDDANLIKYDPIVDYSNSNHSPINWNIFEAliivibrio logei WRQYYDDANLIKYDPIVDYSNSNHSPINWNIFEVibrio mimicus WRQYYDDANLIKYDPIVDYSNSNHSPINWNIFEPhotobacterium leiognathi WRQYYDDANLIKYDPIVDYSNSNHSPINWNIFEVibrio parahaemolyticus WRQYYDDANLIKYDPIVDYSNSNHSPINWNIFE *********************************
Vibrio fischeri 99 NNAVNKKSPNVIKEAKTSGLITGFSFPIHTANNAliivibrio logei NNAVNKKSPNVIKEAKTSGLITGFSFPIHTANNVibrio mimicus NNAVNKKSPNVIKEAKTSGLITGFSFPIHTANNPhotobacterium leiognathi NNAVNKKSPNVIKEAKTSGLITGFSFPIHTANNVibrio parahaemolyticus NNAVNKKSPNVIKEAKSSGLITGFSFPIHTANN ****************:****************
Vibrio fischeri 132 GFGMLSFAHSEKDNYIDSLFLHACMNIAliivibrio logei GFGMLSFAHSEKDNYIDSLFLHACMNIVibrio mimicus GFGMLSFAHSEKDNYIDSLFLHACMNIPhotobacterium leiognathi GFGMLSFAHSEKDNYIDSLFLHACMNIVibrio parahaemolyticus GFGMLSFAHSEKDNYIDSLFLQACMNI *********************:*****
Figure S9. Multiple Sequence Alignment of the LuxR response regulators of Vibrio fischeri,
Aliivibrio logei, Vibrio mimicus, Photobacterium leiognathi and Vibrio parahaemolyticus (T-
Coffee server). Residues that were shown to interact with 2-AA are marked in red.
References
1 R. Rahim, U. A. Ochsner, C. Olvera, M. Graninger, P. Messner, J. S. Lam, and G. Soberón-Chávez, Mol. Microbiol, 2001, 40, 708–718.
2 M. K. Winson, S. Swift, L. Fish, J. P. Throup, F. Jørgensen, S. R. Chhabra, B. W. Bycroft, P. Williams, and G. S. Stewart, FEMS Microbiol. Lett., 1998, 163, 185–192.
3 A. Lindsay and B. M. Ahmer, J. Bacteriol., 2005, 187, 5054–5058.
4 S. Swift, A. V. Karlyshev, L. Fish, E. L. Durant, M. K. Winson, S. R. Chhabra, P. Williams, S. Macintyre, and G. Stewart, J. Bacteriol., 1997, 179, 5271–5281.
5 K. Duan and M. G. Surette, J. Bacteriol., 2007, 189, 4827–4836.
6 B. Michael, J. N. Smith, S. Swift, F. Heffron, and B. M. Ahmer, J. Bacteriol., 2001, 183, 5733–5742.
7 P. Sokol, U. Sajjan, M. Visser, S. Gingues, J. Forstner, and C. Kooi, Microbiol., 2003, 149, 3649–3658.
8 K. Riedel, M. Hentzer, O. Geisenberger, B. Huber, A. Steidle, H. Wu, N. Høiby, M. Givskov, S. Molin, and L. Eberl, Microbiol., 2001, 147, 3249–3262.