Embed Size (px)
Citation preview

HSBC Bank Malta p.l.c.Annual Report and Accounts 2017

HSBC Bank Malta p.l.c. is a member of the HSBC Group, whose ultimate parent company is HSBC Holdings plc. Headquartered in London, HSBC Holdings plc is one of the largest banking and financial services organisations in the world. The HSBC Group’s international network comprises around 3,900 offices in 67 countries and territories in Europe, Asia, North America, Latin America, and the Middle East and North Africa.
The HSBC Group
HSBC Bank Malta p.l.c.Registered in Malta: C3177Registered Office and Head Office: 116 Archbishop StreetValletta VLT 1444Malta Telephone: 356 2380 2380Facsimile: 356 2380 4923www.hsbc.com.mt
HSBC Holdings plcRegistered Office and Group Head Office:8 Canada SquareLondon E14 5HQUnited KingdomTelephone: 44 020 7991 8888www.hsbc.com
1
H S B C B A N K M A L T A p . l . c .
Contents
2 Chairman’s Statement
9 Chief Executive Officer’s Review
20 Board of Directors and Company Secretary
22 Executive Committee
25 Report of the Directors
33 Directors’ Responsibilities Statement
34 Statement of Compliance with the Code of Principles of Good Corporate Governance
46 Remuneration Report
53 Independent Auditor’s Report to the Shareholders of HSBC Bank Malta p.l.c.
61 Income Statements
62 Statements of Comprehensive Income
63 Statements of Financial Position
64 Statements of Changes in Equity
66 Statements of Cash Flows
67 Notes on the Financial Statements
171 Additional Regulatory Disclosures
197 Income Statements and Statements of Comprehensive Income: Five-Year Comparison
198 Statements of Financial Position: Five-Year Comparison
199 Statements of Cash Flows: Five-Year Comparison
200 Accounting Ratios: Five-Year Comparison
201 Branches and Offices

2
H S B C B A N K M A L T A p . l . c .
Chairman’s Statement
2017 was another remarkable year, characterised by continued geopolitical uncertainty, while, by contrast, we have witnessed improvement in many of the world’s largest economies including notably, at long last, some green shoots of progress within the eurozone.
Closer to home, this has been a challenging period for Malta as despite strong ongoing economic performance, which is of course welcome, our country has suffered significant reputational damage which must be repaired. Protecting our reputation as a leading European jurisdiction is particularly important for the long-term development of the financial services sector which depends on access to international networks and the confidence of counterparties. A key test of the financial system’s preparedness to meet international expectations will be the compliance review to be undertaken by the EU organisation Moneyval in November 2018.
From a sector perspective, 2017 represented a difficult trading environment for HSBC given prevailing low interest rates and an intense period of regulatory change. Our proud position as part of the world’s leading international bank has necessitated changes to our business model. While these have reduced short-term profitability, we believe they support long-term value creation for shareholders and support our capacity to pay dividends.
The Board was particularly pleased that following the completion of the majority of our risk management and business model change programme it was able to approve an extraordinary dividend to shareholders. This is a reflection of the strength and high risk management standards of HSBC Malta.
L-2017 kienet sena oħra eċċezzjonali, ikkaratterizzata minn inċertezza ġeopolitika, waqt li b’kuntrast rajna titjib f’ħafna mill-ekonomiji kbar tad-dinja, notevolment fosthom, u fl-aħħar, l-ewwel sinjali ta’ progress fi ħdan iż-żona tal-ewro.
Iżjed qrib tagħna, dan kien perjodu ta’ sfida għal Malta. Minkejja li l-ekonomija kellha prestazzjoni konsistentement b’saħħitha, u aħna lkoll naturalment kuntenti b’dan, madankollu l-pajjiż sofra dannu serju fir-reputazzjoni li jeħtieġ li jissewwa. Il-ħarsien tal-isem tagħna bħala ġurisdizzjoni Ewropea ewlenija huwa importanti speċjalment għall-iżvilupp fit-tul tas-settur tas-servizzi finanzjarji, li jiddependi fuq l-aċċess għan-networks internazzjonali u fuq il-fiduċja tal-partijiet li jittrattaw magħna. Din is-sena, f’Novembru li ġej, se ngħaddu minn prova kruċjali li se turi kemm aħna ppreprati biex nissodisfaw l-aspettattivi internazzjonali meta l-organizzazzjoni Moneyval tal-UE tiġi tagħmel il-verifika tal-osservanza tar-regolamenti.
Mill-perspettiva tas-settur, fl-2017 kien hawn ambjent diffiċli ta’ negozju għall-HSBC. Kien hawn predominanza ta’ rati baxxi tal-imgħax u perjodu qawwi ta’ ċaqliq regolatorju. B’konsiderazzjoni tal-pożizzjoni distinta tagħna fi ħdan l-aqwa bank internazzjonali fid-dinja ħassejna l-ħtieġa li nagħmlu bidliet fil-mudell kummerċjali. Waqt li dawn ġabu tnaqqis fil-profittabilità fit-terminu qasir, naħsbu li se jsostnu l-ħolqien ta’ valur fit-tul għall-azzjonisti u jsaħħu l-kapaċità tagħna għall-ħlas tad-dividendi.
Il-Bord kien tassew ferħan li wara li tlestiet il-parti l-kbira tal-programm ta’ bidliet fil-mudell kummerċjali u tal-immaniġġjar tar-riskju stajna napprovaw il-ħlas ta’ dividend straordinarju lill-azzjonisti. Dan jirrifletti s-saħħa u l-livell għoli tal-istandards ta’ mmaniġġjar tar-riskju li għandu l-HSBC Malta.
3
Results
Profit before tax for the year under review was €49.8m, a decrease of 19.9% when compared to the 2016 results. More details on the financial results can be found in the CEO’s review.
The bank’s capital ratios continued to improve as risk weighted assets decreased year-on-year. Common Equity Tier 1 capital increased to 13.9% from 13.2% and the total capital ratio was 14.4%, up from 14.2% at the end of 2016. The bank remained fully compliant with its end-point regulatory capital requirements during 2017. Its strong capital position enables the bank to sustain its high dividend payout ratio at 65% of profit after tax and to pay an extraordinary dividend out of retained earnings.
Profit attributable to shareholders amounted to €30.9m, resulting in earnings per share of 8.6 cent, compared with 11.2 cent in 2016. The Board recommended maintaining a current dividend payout ratio of 65% of net profit. The Board also made a decision to return part of retained earnings to the shareholders and recommended an extraordinary dividend of €20m in addition to the regular dividend paid out of the net profit for the year. The final gross dividend will be 12.4 cent per share (8.1 cent per share net of tax). Together with the interim dividend paid in September 2017, the total gross dividend will be 17.1 cent per share (11.1 cent per share net of tax).
Thus, the total gross dividend for 2017 will amount to €61.6m (€40.2m net of tax) representing a 54.0% increase on the dividends paid for 2016. The final dividend will be paid on 19 April 2018 to shareholders who are on the bank’s register of shareholders at 13 March 2018.
Riżultati
Il-profitt qabel it-taxxa għall-2017 kien ta’ €49.8m, tnaqqis ta’ 19.9% meta mqabbel mar-riżultati tal-2016. Aktar dettalji dwar ir-riżultati finanzjarji jistgħu jinstabu fir-rapport tas-CEO.
Il-bank kellu relazzjonijiet tal-kapital li baqgħu jitjiebu hekk kif l-assi mwieżna skont ir-riskju naqsu sena b’sena. Il-Common Equity Tier 1 capital tela’ għal 13.9% minn 13.2% u r-relazzjoni tal-kapital totali kienet ta’ 14.4%, ‘il fuq mill-14.2% fl-aħħar tal-2016. Il-bank baqa’ konformi mar-rekwiżiti ta’ kapital regolatorju kollu li kellu jilħaq matul l-2017. Il-pożizzjoni soda tal-kapital jippermetti lill-bank li jsostni l-proporzjon għoli fil-ħlas tad-dividend ta’ 65% tal-profitti wara t-taxxa u li jħallas dividend straordinarju mill-qligħ imfaddal.
Il-profitti li jistgħu jiġu attribwiti lill-azzjonisti ammontaw għal €30.9m, li jirriżulta fi qligħ sehem b’sehem ta’ 8.6 ċenteżmi, mqabbel mal-11.2 ċenteżmi tal-2016. Il-Bord irrakkomanda li l-ħlas tad-dividend jinżamm fil-proporzjon attwali ta’ 65% tal-profitt nett. Il-Bord ħa wkoll deċiżjoni li jagħti lura lill-azzjonisti parti mill-qligħ imfaddal u rrakkomanda dividend straordinarju ta’ €20m apparti d-dividend regolari mħallas mill-profitti netti tas-sena. Id-dividend finali gross se jkun ta’ 12.4 ċenteżmi għal kull sehem (8.1 ċenteżmi wara l-qtugħ tat-taxxa). Meta dan jingħadd mad-dividend interim imħallas f’Settembru 2017, id-dividend totali gross se jkun ta’ 17.1 ċenteżmi għal kull sehem (11.1 ċenteżmi wara t-taxxa).
Hekk id-dividend totali gross għall-2017 se jammonta għal €61.6m (€10.2m wara t-taxxa) li jirrappreżenta żieda ta’ 54.0% fuq id-dividendi mħallsa fl-2016. Id-dividend finali se jitħallas fid-19 ta’ April 2018 lill-azzjonisti li jkunu mniżżla fir-reġistru tal-azzjonisti tal-bank fit-13 ta’ Marzu 2018.
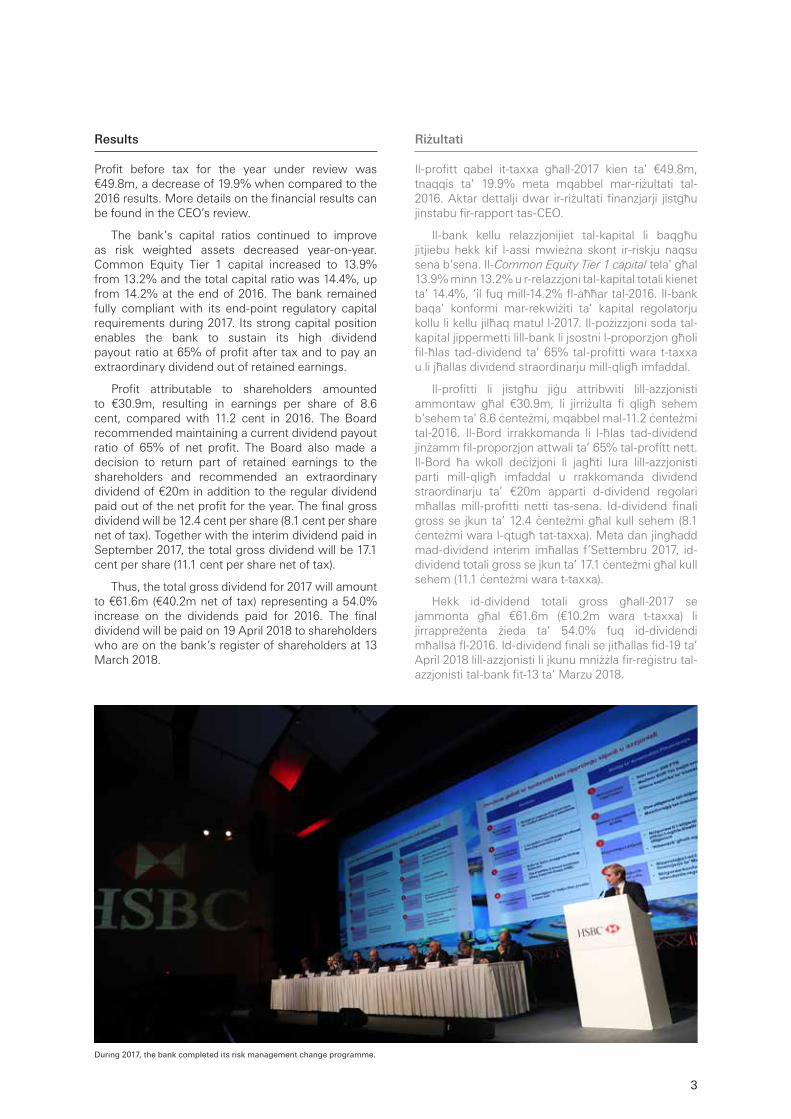
During 2017, the bank completed its risk management change programme.
4
H S B C B A N K M A L T A p . l . c .
Chairman’s Statement (continued)
Our regulatory environment
In keeping ahead of the regulatory agenda, the bank continued with its focus on meeting tighter capital and liquidity requirements, embedding effective risk management and governance, maintaining conduct risk under control and ensuring the sustainability of the banks’ business model. The latter is one of the key supervisory priorities at the same time that banks continued to face the challenges brought about by the prevailing low interest rate environment, increased compliance costs, and competition from alternative sources to traditional banking and finance.
Against this backdrop, during the financial year under review the bank was actively engaged with the principal regulators which carried out a number of supervisory reviews under the Single Supervisory Mechanism (SSM). These activities formed part of the 2017 SSM ongoing supervisory review and evaluation process, which confirmed again that the bank satisfies the minimum capital and liquidity ratio requirements.
The bank was also very active in the implementation of an intense regulatory change programme in order to be compliant with new or updated investor and consumer protection regulations, such as the Markets in Financial Instruments Directive II (MiFID II), the Packaged Retail and Insurance-based Investment Products (PRIIPS) Regulation, and the Insurance Distribution Directive (IDD). These new regulatory requirements include enhanced product governance arrangements, greater disclosure to investors and consumers and increased reporting, which are intended to improve the industry practices around the distribution of investment and insurance products and enhance market conduct.
L-ambjent regolatorju
Bil-għan li jkun minn ta’ quddiem fl-ambitu regolatorju, il-bank kompla jiffoka li jissodisfa rekwiżiti aktar iebsa ta’ kapital u likwidità billi jħaddem reġim aktar effettiv ta’ governanza u ta’ mmaniġġjar ta’ riskju, jrażżan ir-riskju marbut mal-kondotta, u jassigura s-sostenibilità tal-mudelli kummerċjali tal-bank. Din tal-aħħar hija waħda mill-prijoritajiet ta’ sorveljanza ewlenin waqt li fl-istess ħin il-banek komplew jiffaċċaw l-isfidi li ġabu magħhom il-predominanza ta’ rati baxxi tal-imgħax, spejjeż aktar għolja ta’ osservanza u kompetizzjoni minn sorsi meqjusa bħala alternattiva għas-servizzi bankarji u finanzjarji tradizzjonali.
Fuq dan l-isfond, matul is-sena finanzjarja li qed nitkellmu fuqha l-bank kien impenjat attivament mar-regolaturi ewlenin li għamlu għadd ta’ spezzjonijiet ta’ sorveljanza taħt il-Mekkaniżmu Uniku tas-Sorveljanza (SSM). Dawn l-attivitajiet kienu jifformaw parti mill-proċess tal-SSM li kien għaddej fl-2017 ta’ spezzjonijiet ta’ sorveljanza u evalwazzjoni, fejn il-bank ġie kkonfermat li jilħaq ir-rekwiżiti minimi tal-kapital u l-likwidità.
Il-bank kien attiv sew fl-implimentazzjoni ta’ programm intensiv ta’ bidla regolatorja sabiex ikun konformi mar-regolamenti l-ġodda jew aġġornati għall-ħarsien tal-investitur u l-konsumatur, bħalma huma t-Tieni Direttiva għas-Swieq tal-Istrumenti Finanzjarji (MiFID II), ir-Regolament dwar il-Pakketti ta’ Prodotti ta’ Investiment Retail jew Ibbażati fuq Assigurazzjoni (PRIIPS), u d-Direttiva dwar id-Distribuzzjoni tal-Assigurazzjoni (IDD). Dawn il-ħtiġijiet regolatorji ġodda jinkludu arranġamenti għall-governanza aħjar tal-prodotti, żvelar ta’ aktar informazzjoni lill-investituri u ‘l-konsumaturi u rapportaġġ addizzjonali, li għandhom il-ħsieb li jtejbu l-prattiċi adottati fl-industrija fir-rigward tad-distribuzzjoni ta’ prodotti ta’ investiment u assigurazzjoni, u li jwasslu għal kondotta aħjar fis-suq.
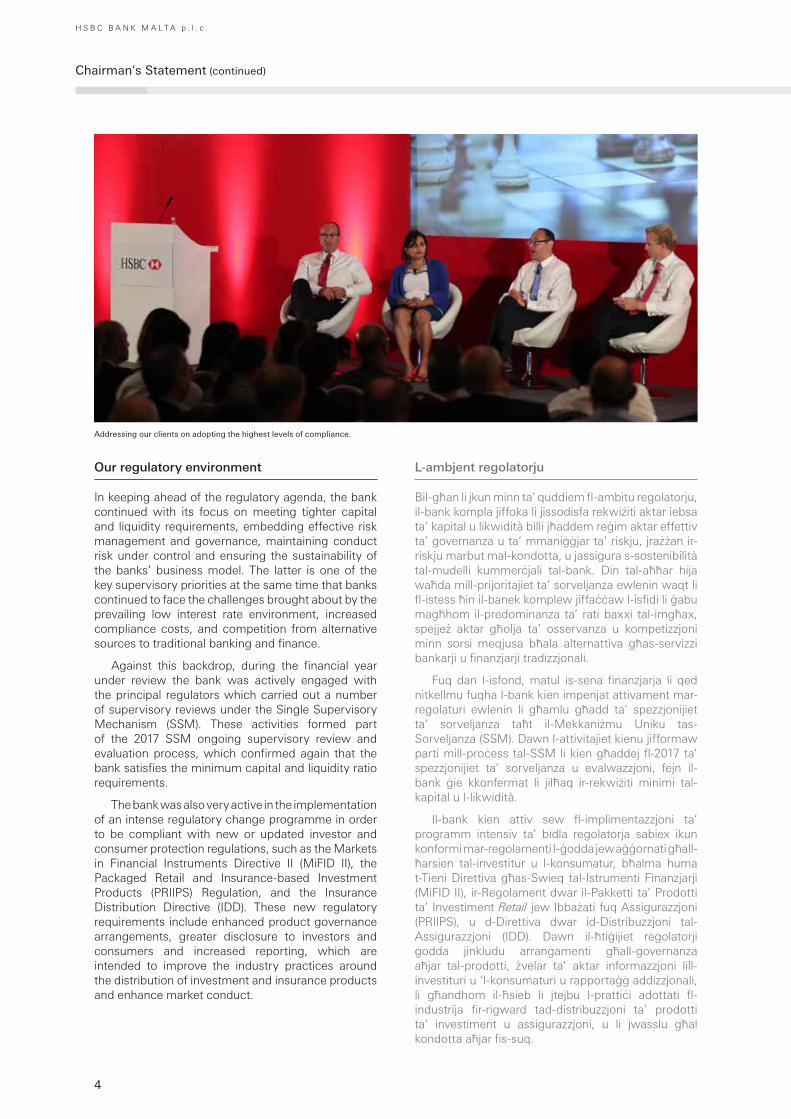
Addressing our clients on adopting the highest levels of compliance.
5
Another regulatory change project involved the implementation of the Payment Services Directive (PSD II), which is an important payments-related legislation. PSD II aims to increase competition amongst payment services operators while bringing into scope new types of payments services and enhanced customer protection and security.
Alongside these regulatory developments, the bank has also been at the forefront participating with regulators and industry bodies in the consultation process of other major regulatory changes such as the Payment Account Directive (PAD), the Fourth Anti-Money Laundering Directive, and the General Data Protection Regulations (GDPR).
The execution of the above regulatory change agenda is testament to the capabilities and resilience of the bank’s multi-disciplinary team of professionals who have worked incessantly and with dedication to meet the high standards of an increasingly challenging and complex regulatory environment.
Our responsibility towards the community
We continue to play an active role in the community we serve. Through the HSBC Malta Foundation, we have assisted various sectors of the community throughout 2017 through a number of key projects and initiatives.
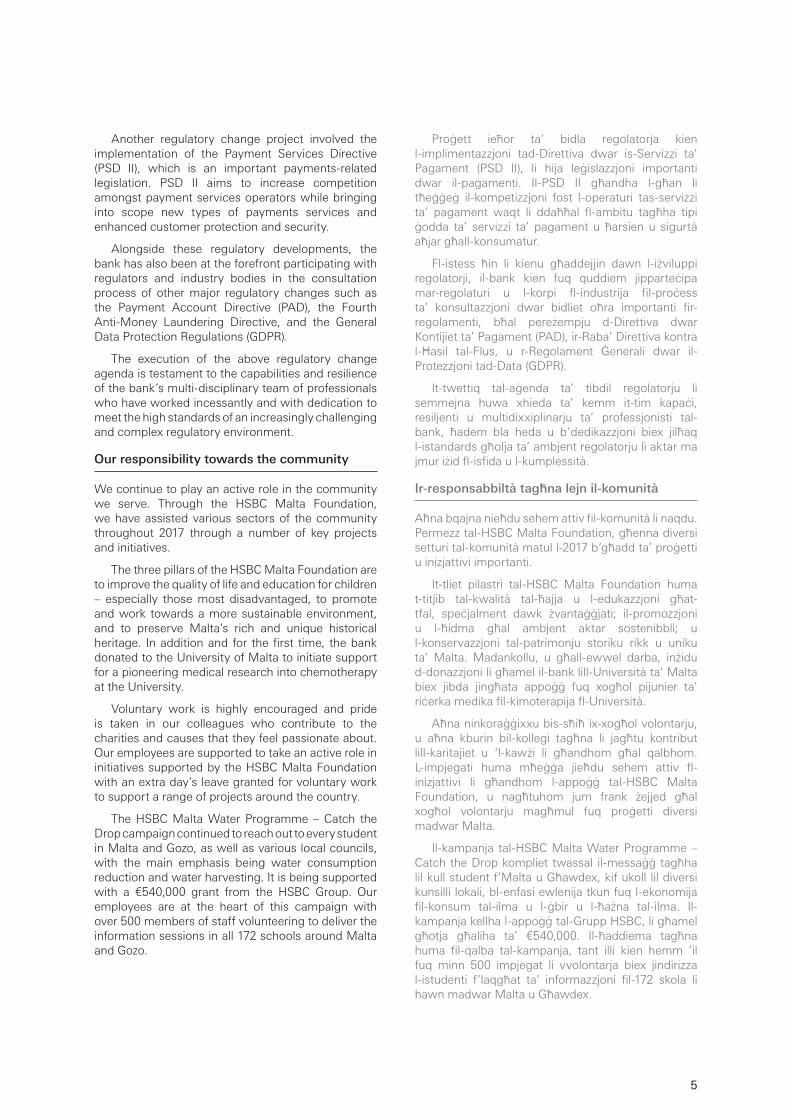
The three pillars of the HSBC Malta Foundation are to improve the quality of life and education for children – especially those most disadvantaged, to promote and work towards a more sustainable environment, and to preserve Malta’s rich and unique historical heritage. In addition and for the first time, the bank donated to the University of Malta to initiate support for a pioneering medical research into chemotherapy at the University.
Voluntary work is highly encouraged and pride is taken in our colleagues who contribute to the charities and causes that they feel passionate about. Our employees are supported to take an active role in initiatives supported by the HSBC Malta Foundation with an extra day’s leave granted for voluntary work to support a range of projects around the country.
The HSBC Malta Water Programme – Catch the Drop campaign continued to reach out to every student in Malta and Gozo, as well as various local councils, with the main emphasis being water consumption reduction and water harvesting. It is being supported with a €540,000 grant from the HSBC Group. Our employees are at the heart of this campaign with over 500 members of staff volunteering to deliver the information sessions in all 172 schools around Malta and Gozo.
Proġett ieħor ta’ bidla regolatorja kien l-implimentazzjoni tad-Direttiva dwar is-Servizzi ta’ Pagament (PSD II), li hija leġislazzjoni importanti dwar il-pagamenti. Il-PSD II għandha l-għan li tħeġġeġ il-kompetizzjoni fost l-operaturi tas-servizzi ta’ pagament waqt li ddaħħal fl-ambitu tagħha tipi ġodda ta’ servizzi ta’ pagament u ħarsien u sigurtà aħjar għall-konsumatur.
Fl-istess ħin li kienu għaddejjin dawn l-iżviluppi regolatorji, il-bank kien fuq quddiem jipparteċipa mar-regolaturi u l-korpi fl-industrija fil-proċess ta’ konsultazzjoni dwar bidliet oħra importanti fir-regolamenti, bħal pereżempju d-Direttiva dwar Kontijiet ta’ Pagament (PAD), ir-Raba’ Direttiva kontra l-Ħasil tal-Flus, u r-Regolament Ġenerali dwar il-Protezzjoni tad-Data (GDPR).
It-twettiq tal-aġenda ta’ tibdil regolatorju li semmejna huwa xhieda ta’ kemm it-tim kapaċi, resiljenti u multidixxiplinarju ta’ professjonisti tal-bank, ħadem bla heda u b’dedikazzjoni biex jilħaq l-istandards għolja ta’ ambjent regolatorju li aktar ma jmur iżid fl-isfida u l-kumplessità.
Ir-responsabbiltà tagħna lejn il-komunità
Aħna bqajna nieħdu sehem attiv fil-komunità li naqdu. Permezz tal-HSBC Malta Foundation, għenna diversi setturi tal-komunità matul l-2017 b’għadd ta’ proġetti u inizjattivi importanti.
It-tliet pilastri tal-HSBC Malta Foundation huma t-titjib tal-kwalità tal-ħajja u l-edukazzjoni għat-tfal, speċjalment dawk żvantaġġjati; il-promozzjoni u l-ħidma għal ambjent aktar sostenibbli; u l-konservazzjoni tal-patrimonju storiku rikk u uniku ta’ Malta. Madankollu, u għall-ewwel darba, inżidu d-donazzjoni li għamel il-bank lill-Università ta’ Malta biex jibda jingħata appoġġ fuq xogħol pijunier ta’ riċerka medika fil-kimoterapija fl-Università.
Aħna ninkoraġġixxu bis-sħiħ ix-xogħol volontarju, u aħna kburin bil-kollegi tagħna li jagħtu kontribut lill-karitajiet u ‘l-kawżi li għandhom għal qalbhom. L-impjegati huma mħeġġa jieħdu sehem attiv fl-inizjattivi li għandhom l-appoġġ tal-HSBC Malta Foundation, u nagħtuhom jum frank żejjed għal xogħol volontarju magħmul fuq proġetti diversi madwar Malta.
Il-kampanja tal-HSBC Malta Water Programme – Catch the Drop kompliet twassal il-messaġġ tagħha lil kull student f’Malta u Għawdex, kif ukoll lil diversi kunsilli lokali, bl-enfasi ewlenija tkun fuq l-ekonomija fil-konsum tal-ilma u l-ġbir u l-ħażna tal-ilma. Il-kampanja kellha l-appoġġ tal-Grupp HSBC, li għamel għotja għaliha ta’ €540,000. Il-ħaddiema tagħna huma fil-qalba tal-kampanja, tant illi kien hemm ‘il fuq minn 500 impjegat li vvolontarja biex jindirizza l-istudenti f’laqgħat ta’ informazzjoni fil-172 skola li hawn madwar Malta u Għawdex.
6
H S B C B A N K M A L T A p . l . c .
Chairman’s Statement (continued)
Additionally, Malta is now part of the international ‘Water Explorer’ programme, delivered locally by Nature Trust – FEE Malta through its Eco-Schools (EkoSkola) programme. This programme is also supported by the HSBC Water Programme with the financial support of $75,000. The Water Explorer is a fun, action-oriented, international online programme that inspires thousands of students to become water ‘Explorers’ and lead action in their school communities on water issues. Managed by NGO Global Action Plan, the programme is being followed in France, Germany, Switzerland, Italy, Spain, Turkey, Poland, South Africa and the UK. Participating schools are encouraged to link up with schools from other countries and share their ideas and top water-saving tips.
Moreover, two youth opportunity programmes ‘Achieve’ and ‘Get Into’, introduced in Malta by HSBC Malta Foundation in cooperation with the Ministry for Education and Employment and the Prince’s Trust International (PTI), are enabling a number of young persons to succeed and secure a strong future for themselves and Malta. The Achieve programme supports young people to re-engage with education whilst improving attendance, behaviour and attainment. The Get Into initiative is a training programme run in partnership with a range of employers from sectors who have identified skills shortages and job opportunities.
At the time of the launch of the Achieve programme in Malta in 2015, HSBC Malta Foundation became the first organisation outside of the UK to introduce one of The Prince’s Trust’s long-standing educational programmes in secondary schools. It was initially introduced in seven schools during the 2015/16 scholastic year across all of Malta and Gozo. However, with effect from the 2017/18 scholastic year, the number of schools increased to 32.
Our community commitment extends also to the field of environmental awareness. HSBC Malta has installed 614 photovoltaic panels and commissioned seven electric vehicles including six charging points at
Apparti dan, Malta issa tifforma parti mill-programm internazzjonali ‘Water Explorer’, li lokalment huwa f’idejn in-Nature Trust – FEE Malta permezz tal-programm EkoSkola. Dan il-programm għandu wkoll l-appoġġ tal-HSBC Water Programme b’għajnuna finanzjarja ta’ $75,000. Il-Water Explorer huwa programm internazzjonali online divertenti u mimli azzjoni li jħajjar eluf ta’ studenti jsiru ‘esploraturi’ tal-ilma u jħeġġu azzjoni fil-komunitajiet tal-iskola tagħhom dwar problemi tal-ilma. Il-programm, li hu ġestit mill-NGO Global Action Plan, huwa segwit fi Franza, il-Ġermanja, l-Isvizzera, l-Italja, Spanja, it-Turkija, il-Polonja, l-Afrika t’Isfel u r-Renju Unit. L-iskejjel parteċipanti huma mħeġġa li jagħmlu kuntatt ma’ skejjel minn pajjiżi oħra u jaqsmu l-ħsibijiet u l-ideat tagħhom dwar kif ma jinħeliex ilma.
Żewġ programmi oħra ta’ opportunità għaż-żgħażagħ huma l-‘Achieve’ u l-‘Get Into’. Dawn iddaħħlu Malta mill-HSBC Malta Foundation bil-kooperazzjoni tal-Ministeru tal-Edukazzjoni u x-Xogħol u l-Prince’s Trust International (PTI), u qed jgħinu għadd ta’ żgħażagħ jirnexxu u jassiguraw futur sabiħ għalihom u għal Malta. Il-programm Achieve jgħin liż-żgħażagħ jerġgħu jidħlu fl-edukazzjoni billi jkollhom attendenza, imġieba u riżultati aħjar. L-inizjattiva Get Into hija programm ta’ taħriġ li jsir bi sħab ma’ numru ta’ sidien ta’ negozji minn setturi fejn instab nuqqas ta’ ħiliet u fejn hemm opportunitajiet ta’ xogħol.
Meta ġie inawgurat il-programm Achieve f’Malta fl-2015, l-HSBC Malta Foundation saret l-ewwel organizzazzjoni barra r-Renju Unit li introduċiet wieħed mill-programmi edukattivi stabbiliti tal-Prince’s Trust fl-iskejjel sekondarji. Il-programm għall-ewwel kien introdott f’seba’ skejjel f’Malta u Għawdex fis-sena skolastika 2015/16. Imma b’effett mis-sena skolastika 2017/18, in-numru ta’ skejjel tela’ għal 32.
L-impenn tagħna lejn il-komunità jinfirex ukoll fil-qasam tal-kuxjenza ambjentali. L-HSBC Malta installa 614-il pannella fotovoltajika u kkommissjona seba’ vetturi bl-elettriku, inklużi sitt posti għall-karigu tal-batteriji fiċ-Ċentru tal-Operazzjonijiet tal-bank f’Ħal
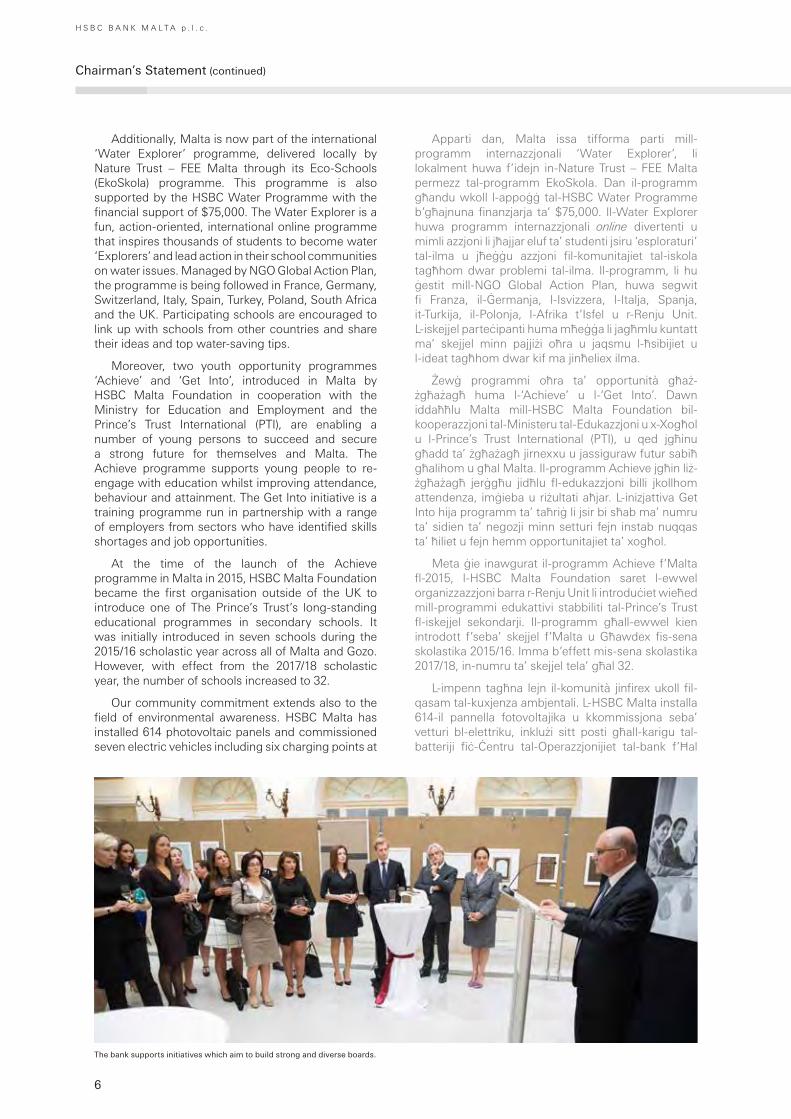
The bank supports initiatives which aim to build strong and diverse boards.

7
the bank’s Operations Centre in Qormi. The PV panels, which were placed on top of 10 of the bank’s offices across Malta and Gozo, power 37 of our offsite ATMs. As a result of this initiative, referred to as ‘Simply Electric’, the bank’s emissions have been reduced by an estimated 186 tonnes of CO2 per annum.
I take this opportunity to thank, on your behalf, the many among our people who support these initiatives by spending their time, capabilities and energies to ensure the success of these impactful projects.
Our Board of Directors
During 2017, there were the following five changes to the directorships on the Board:
Prof. Juanito Camilleri resigned in February, and Philip Farrugia Randon ceased to be a director with effect from April. Dr Gordon Cordina was appointed director in February, and Alison Hewitt together with Yiannos Michaelides were appointed in May.
I thank the outgoing Board members for their service and dedication to the bank, and welcome on board the new joiners.
I feel honoured and privileged to be the Chairman of a Board whose members possess a wealth of knowledge and experience, at both the local and international levels. They contribute to the guidance and oversight of the bank, consistently deploying their vast experience and expertise in many different fields. I am also very proud of our management team, who constantly work diligently, and with courage and integrity, in order to ensure that the bank performs well during these unusually challenging times.
I want to express my shock at the untimely demise of Gareth Williams who served as an excellent Head of Human Resources. His passing away during December 2017 was a tremendous loss for our bank
In addition to its long-standing involvement with education, environment and heritage, HSBC has initiated support for medical and academic research in Malta.
Qormi. Il-pannelli PV, li tqiegħdu fuq il-bjut ta’ għaxra mill-uffiċċji tal-bank f’Malta u Għawdex, jipprovdu l-elettriku għal 37 mill-offsite ATMs tagħna. B’din l-inizjattiva, li nsejħulha ‘Simply Electric’, huwa stmat li l-emissjonijiet tal-bank tnaqqsu b’186 tunnellata ta’ CO2 fis-sena.
Nieħu l-opportunità biex nirringrazzja, f’isimkom, lil dawk il-ħafna fost in-nies tagħna li jsostnu dawn l-inizjattivi billi jagħtu minn ħinhom, il-ħiliet u l-enerġiji tagħhom biex jassiguraw is-suċċess ta’ dawn il-proġetti ta’ fejda.
Il-Bord tad-Diretturi
Matul l-2017 saru ħames bidliet fil-kompożizzjoni tal-Bord tad-Diretturi:
Prof. Juanito Camilleri irriżenja fi Frar, u Philip Farrugia Randon ma baqax direttur b’effett minn April. Dr Gordon Cordina inħatar direttur fi Frar, u Alison Hewitt flimkien ma’ Yiannos Michaelides inħatru f’Mejju.
Nirringrazzja lill-membri tal-Bord li spiċċaw, għas-servizz u d-dedikazzjoni tagħhom lejn il-bank u nilqa’ lill-membri l-ġodda fuq il-Bord.
Huwa unur u privileġġ għalija li nkun iċ-Chairman ta’ Bord li l-membri tiegħu huma mogħnija b’tant għarfien u esperjenza, sew fuq il-livell lokali kemm dak internazzjonali. Huma jikkontribwixxu billi jiddirieġu u jissorveljaw il-bank, billi jirrikorru konsistentement għall-esperjenza vasta u l-għerf espert tagħhom f’oqsma differenti. Jien kburi wkoll bit-tim tal-management, li dejjem imxew bil-għaqal f’xogħolhom, u b’kuraġġ u integrità, biex jaraw li l-bank iġib riżultati tajbin anke f’dawn iż-żminijiet ta’ sfida mhux tas-soltu.
lrrid nesprimi s-sogħba tiegħi kif ukoll tal-Membri kollha tal-Bord għall-mewta mhux mistennija ta’
8
H S B C B A N K M A L T A p . l . c .
Chairman’s Statement (continued)
and all his colleagues. The deepest condolences of the Members of our Board and myself goes to Gareth’s family.
Looking ahead
Despite the initial shoots of economic revival, the global economic uncertainties, especially in the eurozone, coupled with the political changes that took place in the last few years – will have a significant impact on the way we do business.
In February the Board approved a new strategy focused on customer-led growth while completing and sustaining our risk management standards. As we move forward to implement our plans I am encouraged by the knowledge that this bank possesses a highly skilled, competent, experienced and dedicated group of people, who have time and again proved that they can meet any challenge which they face.
On behalf of my colleagues on the Board, I extend my gratitude to all our people for their hard work and commitment to the bank.
My gratitude also goes to you our shareholders, for the continued support and commitment to this bank. We will continue to strive to deliver to you the best results possible, and the highest return on your investment.
I conclude my statement by thanking our clients and promise that we will continue to focus on providing them with the highest quality of products and services and assuring them that they form part of a bank committed to the highest standards of risk management.
Sonny Portelli, Chairman20 February 2018
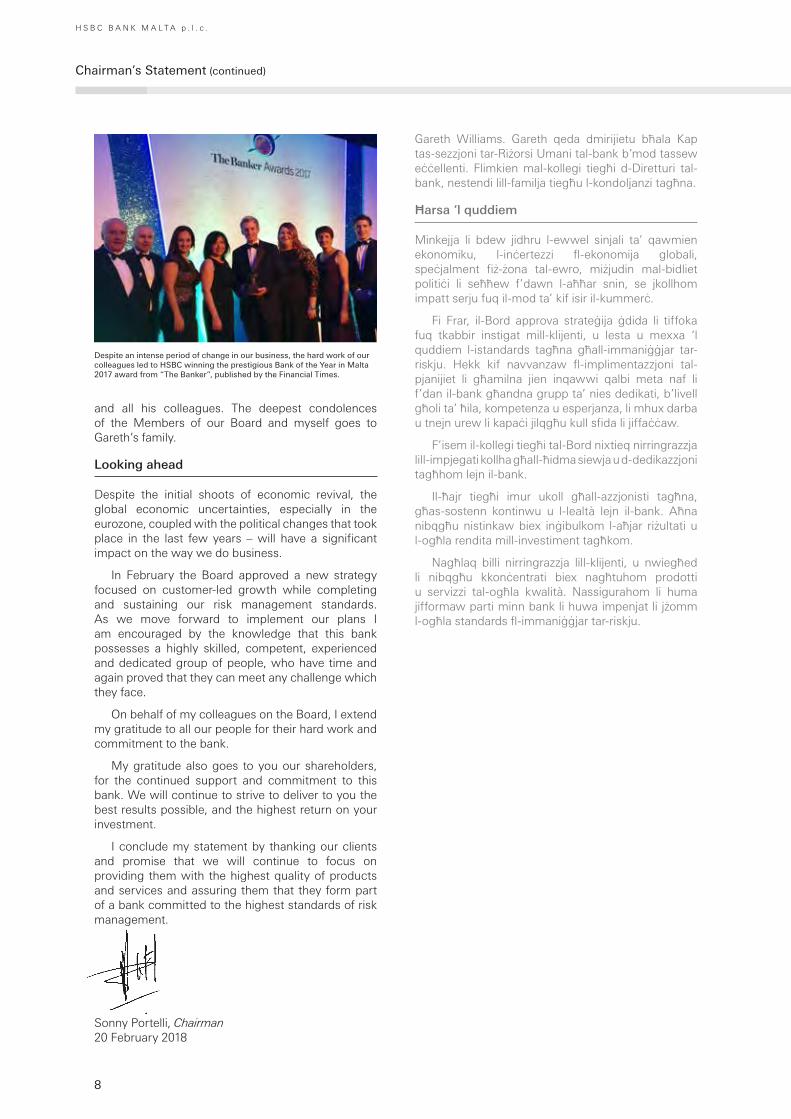
Despite an intense period of change in our business, the hard work of our colleagues led to HSBC winning the prestigious Bank of the Year in Malta 2017 award from “The Banker”, published by the Financial Times.
Gareth Williams. Gareth qeda dmirijietu bħala Kap tas-sezzjoni tar-Riżorsi Umani tal-bank b’mod tassew eċċellenti. Flimkien mal-kollegi tiegħi d-Diretturi tal-bank, nestendi lill-familja tiegħu l-kondoljanzi tagħna.
Ħarsa ‘l quddiem
Minkejja li bdew jidhru l-ewwel sinjali ta’ qawmien ekonomiku, l-inċertezzi fl-ekonomija globali, speċjalment fiż-żona tal-ewro, miżjudin mal-bidliet politiċi li seħħew f’dawn l-aħħar snin, se jkollhom impatt serju fuq il-mod ta’ kif isir il-kummerċ.
Fi Frar, il-Bord approva strateġija ġdida li tiffoka fuq tkabbir instigat mill-klijenti, u lesta u mexxa ‘l quddiem l-istandards tagħna għall-immaniġġjar tar-riskju. Hekk kif navvanzaw fl-implimentazzjoni tal-pjanijiet li għamilna jien inqawwi qalbi meta naf li f’dan il-bank għandna grupp ta’ nies dedikati, b’livell għoli ta’ ħila, kompetenza u esperjanza, li mhux darba u tnejn urew li kapaċi jilqgħu kull sfida li jiffaċċaw.
F’isem il-kollegi tiegħi tal-Bord nixtieq nirringrazzja lill-impjegati kollha għall-ħidma siewja u d-dedikazzjoni tagħhom lejn il-bank.
Il-ħajr tiegħi imur ukoll għall-azzjonisti tagħna, għas-sostenn kontinwu u l-lealtà lejn il-bank. Aħna nibqgħu nistinkaw biex inġibulkom l-aħjar riżultati u l-ogħla rendita mill-investiment tagħkom.
Nagħlaq billi nirringrazzja lill-klijenti, u nwiegħed li nibqgħu kkonċentrati biex nagħtuhom prodotti u servizzi tal-ogħla kwalità. Nassigurahom li huma jifformaw parti minn bank li huwa impenjat li jżomm l-ogħla standards fl-immaniġġjar tar-riskju.

9
H S B C B A N K M A L T A p . l . c .
Chief Executive Officer’s Review
In 2017, the bank made significant progress with changes to its business model in order to meet the highest global standards for compliance and risk management. While these actions reduced profitability during the year due to lower revenues and higher costs, the actions taken have materially strengthened the bank’s risk profile and positioned it well for the future.
Our changed business model is creating value for our shareholders, notably by generating dividends. Indeed, given the strategic progress the bank has made, the Board was pleased to declare an exceptional dividend of €20m in addition to sustaining our 65% payout ratio which reflects HSBC’s capacity to generate more capital than is required by our risk profile.
The local economy continues to perform well and the outlook is favourable as has been confirmed by a number of external credit rating agencies which is welcome. However, considering a long-term view, it is important to ensure that the country’s growth remains sustainable and well diversified including unhindered access to international financial markets which requires, as the Chairman has said, sustained action to address reputational damage suffered over the past year.
Equally it is imperative that conservative credit risk assessment standards are maintained across the financial system in order to protect the economy and society through the full economic cycle. The bank has noted with an increased level of concern that the long-term risk profile of the local bond market is increasing and considers that this requires particular focus in certain areas from the supervisory authorities in order to protect the long-term interest of local investors.
Looking to the future, HSBC Malta is proud to form part of the world’s leading international bank, the HSBC Group, and is able to provide unrivalled access to international trade and capital flows for Malta’s companies and investors. Our changed business model will now increasingly enable the bank to direct investment into revenue growth and customer service while sustaining our conservative risk management culture.
Fl-2017 il-bank għamel progress sostanzjali, b’tibdil fil-mudell kummerċjali biex ikun jista’ jilħaq l-ogħla standards globali fl-osservanza tar-regolamenti u fl-immaniġġjar tar-riskju. Waqt li dawn l-azzjonijiet naqqsu l-profittabilità matul is-sena minħabba fl-introjtu aktar baxx u fl-ispejjeż aktar għolja, min-naħa l-oħra ġabu tisħiħ materjali fil-profil tar-riskju tal-bank u poġġewh f’pożizzjoni soda għall-futur.
Il-mudell kummerċjali kif bdilnieh qiegħed joħloq valur għall-azzjonisti tagħna, l-aktar billi jiġġenera d-dividendi. Tant hu hekk illi, bis-saħħa tal-progress strateġiku li għamel il-bank, il-Bord bi pjaċir iddikjara dividend eċċezzjonali ta’ €20m, barra li żamm il-proporzjon ta’ distribuzzjoni ta’ 65% li jirrifletti l-kapaċità li għandu l-HSBC li jiġġenera kapital lil hinn minn dak li jirrikjedi l-profil tar-riskju tagħna.
L-ekonomija lokali għadha sejra tajjeb u l-prospetti huma favorevoli, kif ikkonfermaw numru ta’ aġenziji barranin tal-klassifikazzjoni tal-kreditu – u din hi aħbar tajba. Madankollu, jekk nitfgħu l-ħarsa tagħna fit-tul, huwa importanti li nkunu ċerti li t-tkabbir tal-pajjiż jibqa’ sostenibbli u diversifikat sew, u dan għandu jinkludi l-aċċess bla xkiel għas-swieq finanzjarji internazzjonali li, kif qal iċ-Chairman, jitlob azzjoni kontinwa biex tiġi indirizzata l-ħsara li ġarrbet ir-reputazzjoni matul is-sena li għaddiet.
Daqstant ieħor huwa essenzjali li jibqgħu jinżammu, fuq il-firxa kollha tas-sistema finanzjarja, standards konservattivi għall-evalwazzjoni tar-riskju tal-kreditu sabiex l-ekonomija u s-soċjetà jkunu mħarsa tul iċ-ċiklu ekonomiku kollu. Il-bank qed ikollu jżid it-tħassib tiegħu meta jinnota li l-profil tar-riskju fit-tul tas-suq lokali tal-bonds qed jogħla u jidhirlu li dan jitlob attenzjoni partikolari f’ċerti oqsma mill-awtoritajiet ta’ sorveljanza sabiex ikunu mħarsa l-interessi fit-tul tal-investituri lokali.
Jekk inħarsu ‘ l quddiem, l-HSBC Malta huwa kburi li jifforma parti mill-bank internazzjonali li huwa fuq quddiem nett fid-dinja, il-Grupp HSBC, u li hu kapaċi joffri lill-kumpaniji u ‘ l-investituri Maltin aċċess bla paragun għall-kummerċ u kapital internazzjonali. Il-mudell kummerċjali tagħna kif mibdul se jkun jista’
10
H S B C B A N K M A L T A p . l . c .
Chief Executive Officer’s Review (continued)
Performance
HSBC Bank Malta p.l.c. reported a profit before tax of €49.8m for the year ended 31 December 2017. This represents an decrease of €12.4m or 19.9% on the previous year.
The reported profit before tax incorporates three notable items which are excluded from the adjusted results as this is considered a better reflection of management’s performance.
In 2016, the bank recognised the gain on disposal of the bank’s membership interest in Visa Europe amounting to €10.8m and raised a provision totalling €8m in relation to a remediation of the legacy operational failure in the bank’s brokerage business. During 2017, the remediation programme was largely completed and it was assessed that a partial reversal of the conservatively estimated provision was warranted. In this regard, a reversal of €1.8m was effected in 2017.
During the year, the bank re-examined its approach to the provision for the collective agreement clauses related to future employee benefits. A longer-term view was assumed in the application of the current clauses which resulted in an additional charge of €7.6m in 2017 as compared with the charge of €2m in 2016. While the movements in this provision will periodically occur depending on the changes in the composition of the bank’s employee base, the provision adjustment in 2017 was not related to the business performance of the year.
2017 2016
€000 €000
Reported profit before tax 49,823 62,221Adjusting items:
Gain on VISA transaction – (10,787)Movement in the brokerage remediation provision (1,800) 8,000Costs of the provision for collective agreement benefits 7,600 2,000
Adjusted profit before tax 55,623 61,434
The year under review was characterised by broadly stable but persistently low interest rates and increasing excess liquidity in the market while attractive investment opportunities remained limited. In this environment, a record number of debt issuances by corporate entities was registered on the Malta Stock Exchange fuelled by investors’ demand for higher yield.
Net interest income of the bank decreased by 4.6% to €120.7m compared with the prior year principally due to the reduction in the corporate loan book and in the bonds portfolio. While lending margins remained largely unchanged, the average yield of the investment book declined further due to continuing amortisation of higher yielding bonds. Retail banking performed well and increased its interest income by
aktar u aktar jgħin lill-bank jiddirieġi l-investiment fi tkabbir tal-introjtu u f’servizz għall-klijenti waqt li fl-istess ħin jippreserva l-kultura konservattiva tagħna fl-immaniġġjar tar-riskju.
Riżultati
L-HSBC Bank Malta p.l.c. irrapporta profitt qabel it-taxxa ta’ €49.8m għas-sena li għalqet fil-31 ta’ Diċembru 2017. Dan jirrappreżenta tnaqqis ta’ €12.4m jew 19.9% mis-sena ta’ qabel.
Il-profitt qabel it-taxxa kif irrapportat jinkorpora fih tliet entrati notevoli li huma esklużi mir-riżultati aġġustati – dan għaliex huwa meqjus li hekk tingħata stampa aktar ċara tal-prestazzjoni tal-management.
Fl-2016, il-bank irrikonoxxa l-qligħ ta’ €10.8m li għamel meta ddispona mill-interess ta’ sħubija li kellu fil-Visa Europe, kif ukoll ħoloq provediment ta’ €8m għar-rigward ta’ kumpens maħsub biex jagħmel tajjeb għal nuqqas operazzjonali ġej mill-antik fin-negozju tal-brokerage li kellu l-bank. Matul l-2017 il-programm ta’ kumpens kien kważi lest u ġie meqjus li jkun ġustifikat li parti mill-provediment konservattiv li kien sar jitreġġa’ lura. F’dan ir-rigward, fl-2017 treġġgħet lura somma ta’ €1.8m.
Matul is-sena, il-bank reġa’ eżamina l-mod ta’ kif jipprovdi għall-klawsoli fil-ftehim kollettiv li għandhom x’jaqsmu mal-benefiċċji futuri għall-impjegati. Ittieħdet perspettiva aktar fit-tul fl-applikazzjoni tal-klawsoli attwali u rriżulta debitu addizzjonali ta’ €7.6m għall-2017 meta mqabbel ma’ debitu ta’ €2m għall-2016. Perjodikament jista’ jkun hemm ċaqliq f’dan il-provediment skont il-bidliet li jkun hemm fil-kompożizzjoni tal-impjegati tal-bank. Madankollu l-aġġustament li sar fil-provediment għall-2017 ma kienx relatat mar-riżultati kummerċjali tas-sena.
2017 2016
€000 €000
Profitt qabel it-taxxa kif irrappurtat 49,823 62,221
Entrati ta’ aġġustament:Il-qligħ fuq it-transazzjoni tal-VISA – (10,787)Il-moviment fuq il-provediment għall-brokerage remediation (1,800) 8,000Il-provediment għall-ispejjeż fuq il-benefiċċji tal-ftehim kollettiv 7,600 2,000
Profitt qabel it-taxxa kif aġġustat 55,623 61,434
Is-sena li qed nirrapportaw fuqha kienet ikkaratterizzata minn rati tal-imgħax li kienu stabbli b’mod ġenerali imma baxxi b’mod persistenti, u b’eċċess dejjem jikber ta’ likwidità fis-suq, waqt li l-opportunitajiet attraenti ta’ investiment baqgħu limitati. F’dan l-ambjent kien hemm għadd rekord ta’ kumpaniji li, imħajra mid-domanda tal-investituri għal rendita ogħla, ħarġu offerti għal strumenti ta’ dejn u rreġistrawhom mal-Borża ta’ Malta.
11
2.9%. The European Central Bank negative deposit rate remained unchanged during 2017 resulting in additional interest expense on the bank’s excess liquidity. The reduction in interest expense due to the maturity of the bank’s subordinated debt in February 2017 partially mitigated the decline in interest income.
Net non-interest income reduced by 9.7% compared with 2016. A lower level of credit activity and the ongoing review of the bank’s risk appetite had an adverse impact on fees and commissions as well as trading income. Other net operating income was adversely impacted by lower valuation of investment property held by the bank.
HSBC Life Assurance (Malta) Limited reported a profit before tax of €7.3m, which was broadly in line with the prior year. In 2017, the volume of new ‘with-profits’ business increased resulting in a higher premium income. In November 2017, the company announced a partial sale of the unit-linked portfolio acquired in 2014 from another HSBC Group entity. As the transfer of this portfolio will be at the consideration of €1, no gain or loss will be registered as a result of this transaction.
Operating expenses were €112.2m, 1.8% higher compared with previous year. Two notable cost items described above had a negative impact on the level of expenses in 2016 and 2017. The bank accelerated the work in raising risk and compliance standards which resulted in higher administrative costs. At the same time, the bank continued to benefit from the early voluntary retirement programme implemented in 2016 and saw a decline in underlying staff costs by 3.0% absorbing the annual pay increase.
A net reversal of loan impairment charges amounting to €1.2m was recorded in 2017. The bank continued to improve the asset quality by managing down non-performing exposures by over 20% year on year notably in the corporate book. Non-performing loans as a percentage of total gross loans reduced further to 5.3% compared with 6.4% in 2016. This resulted in a number of reversals of corporate impairment provisions raised in the past. Furthermore, the bank has reviewed its conservative provisioning approach to certain legacy defaulted mortgage exposures as the observed rates of recovery picked up as a result of improved collection practices. In addition, the collateral securing the relative exposures was prudently assessed as adequate. This led to a net recovery on retail impairment provisions in 2017.
Net loans and advances to customers decreased by 5.8% and stood at €3,129m. The decline was registered in the corporate loan book as a result of lower business activity due to prioritisation of compliance agenda. Moreover, several corporate customers chose to replace bank funding with externally issued debt. The retail loan book grew by 4.9% compared with the prior year partially offsetting the reduction in corporate lending.
Id-dħul nett tal-bank mill-imgħax naqas b’4.6% għal €120.7m meta mqabbel mas-sena ta’ qabel, l-iżjed minħabba tnaqqis fir-reġistru tas-self lill-kumpaniji u fil-portafoll tal-bonds. Waqt li l-marġni tas-self baqa’ ġeneralment l-istess, ir-rendita medja tar-reġistru tal-investimenti żelqet aktar ‘l isfel hekk kif il-bonds ta’ rendita għolja komplew jiġu amortizzati. Is-servizzi bankarji retail komplew sejrin tajjeb u żiedu d-dħul mill-imgħax bi 2.9%. Ir-rata negattiva għad-depożiti fil-Bank Ċentrali Ewropew baqgħet ma nbidlitx fl-2017, u dan irriżulta fi spiża addizzjonali fl-imgħax fuq il-likwidità żejda tal-bank. It-tnaqqis li kien hemm fl-ispiża fl-imgħax wara li mmatura d-dejn subordinat tal-bank fi Frar tal-2017 patta xi ftit għat-tnaqqis mid-dħul mill-imgħax.
Id-dħul nett minn sorsi barra l-imgħax niżel b’9.7% imqabbel mal-2016. Il-livell ta’ attività fil-qasam tal-kreditu kien aktar baxx, u fl-istess ħin reviżjoni kontinwa dwar id-dispożizzjoni tal-bank għar-riskju, kellhom impatt negattiv fuq id-dħul mid-drittijiet u l-kummissjonijiet kif ukoll fuq id-dħul min-negozju finanzjarju. Dħul ieħor nett mill-operat ukoll intlaqat ħażin minħabba valutazzjoni aktar baxxa tal-proprjetà għall-investiment miżmuma mill-bank.
L-HSBC Life Assurance (Malta) Limited irrapportat profitt qabel it-taxxa ta’ €7.3m, li bejn wieħed u ieħor kien fuq l-istess livell tas-sena ta’ qabel. Fl-2017, il-volum ta’ negozju ġdid ‘with-profits’ żdied u ġab dħul ogħla mill-primjums. F’Novembru 2017, il-kumpanija ħabbret il-bejgħ parzjali tal-portafoll unit-linked li kienet akkwistat fl-2014 mingħand entità oħra fil-Grupp HSBC. Peress li l-korrispettiv mit-trasferiment ta’ dan il-portafoll se jkun ta’ €1, mhu se jkun reġistrat ebda qligħ jew telf minn din it-transazzjoni.
L-ispejjeż tal-operat kienu ta’ €112.2m, 1.8% ogħla meta mqabbla mas-sena ta’ qabel. Żewġ entrati notevoli ta’ spiża msemmija fuq kellhom effett negattiv fuq il-livell tal-ispejjeż fl-2016 u l-2017. Il-bank ħaffef ix-xogħol biex jgħolli l-istandards tal-osservanza u tar-riskju, bir-riżultat li telgħu l-ispejjeż amministrattivi. Fl-istess ħin il-bank kompla jibbenefika mill-programm volontarju ta’ irtirar kmieni li ddaħħal fl-2016 u ra l-ispiża tal-impjegati tinżel bi 3.0%, biżżejjed biex tassorbi ż-żieda annwali fil-pagi.
Fl-2017 ġie reġistrat treġġigħ lura nett ta’ telf minn indeboliment tas-self ta’ €1.2m. Il-bank kompla jtejjeb il-kwalità tal-assi billi naqqas l-ammont ta’ djun li ma jirrendux, b’il fuq minn 20% sena b’sena, partikolarment fir-reġistru tas-self lill-kumpaniji. Meta mkejjel bħala perċentwal tas-self gross totali, is-self li ma jirrendix kompla jinżel għal 5.3% imqabbel mas-6.4% tal-2016. Dan irriżulta fit-treġġigħ lura ta’ għadd ta’ provedimenti magħmula fil-passat għall-indeboliment ta’ self lill-kumpaniji. Barra minn hekk il-bank irreveda l-mod konservattiv ta’ kif jipprovdi għal ċertu dejn antik mhux imħallas fuq djar peress li nnota li d-dħul ta’ prassi aktar effiċjenti għall-ġbir ġab titjib fir-rati ta’ rkupru. U wkoll, il-kollaterali li jiggarantixxi dawn id-djun kien evalwat u meqjus, fuq bażi prudenti, li hu adegwat. Dan kollu wassal biex fl-2017 kien hemm irkupru nett mill-provedimenti għall-indeboliment fuq self retail.
12
H S B C B A N K M A L T A p . l . c .
Chief Executive Officer’s Review (continued)
Customer accounts decreased by 4.7% to €4,766m in 2017 driven by the reduction in corporate deposits in line with the ongoing review of the risk appetite. Deposits from retail customers increased by 2.6% compared with prior year as the bank continued to expand its primary-banked customer base. The bank maintained a healthy advances to deposits ratio of 65.6% and its liquidity ratios were well in excess of regulatory requirements.
The available-for-sale financial investments portfolio decreased by 12.1% compared to 2016. The bank’s risk appetite for investment quality remained unchanged – this portfolio is managed as a high-quality liquidity buffer and consists entirely of securities of sovereign and supranational issuers rated A- (S&P) or better. While the bank partially replaced maturing bonds during the year, attractive investment opportunities in an environment of record low interest rates in Europe were extremely limited.
Retail Banking and Wealth Management (RBWM)
2017 has been a year of strategic progress for RBWM and we are pleased with the improvements we have made in meeting our required compliance standards. Financial performance has remained broadly in line with expectations.
During the year we increased the net number of customers that trust us with their full banking relationship through strong growth in our HSBC Premier and HSBC Advance propositions and our mortgage business has continued to perform well within our conservative credit standards.
We were particularly pleased to launch our new small business proposition, HSBC Fusion. HSBC Fusion gives us the opportunity to re-engage with our local communities and economies to support entrepreneurs across the country.
Is-self nett lill-klijenti niżel b’5.8% u kien ta’ €3,129m. It-tnaqqis kien reġistrat fis-self lill-kumpaniji u rriżulta billi kien hemm inqas attività fin-negozju biex tingħata prijorità lill-aġenda tal-osservanza tar-regolamenti. Barra minn hekk, kien hemm bosta kumpaniji li għażlu li joħorġu strumenti ta’ dejn fis-suq minflok ikollhom finanzjament mill-bank. Ir-reġistru tas-self retail kiber b’4.9% imqabbel mas-sena ta’ qabel, u b’hekk patta xi ftit għat-tnaqqis mis-settur tal-kumpaniji.
Il-bilanċi tal-klijenti naqsu b’4.7% għal €4,766m fl-2017. Dan kien misjuq mit-tnaqqis fid-depożiti tal-kumpaniji, u jsegwi skont ir-reviżjoni kontinwa tad-dispożizzjoni tal-bank għar-riskju. Id-depożiti mill-klijenti retail żdiedu bi 2.6% mqabbla mas-sena ta’ qabel, hekk kif il-bank kompla jespandi l-bażi tal-klijenti li jużawh bħala l-bank primarju. Ir-relazzjoni li żamm il-bank bejn self u depożiti kienet waħda sana ta’ 65.6% u r-relazzjonijiet tal-likwidità qabżu sew lil dawk mitluba mir-regolamenti.
Il-portafoll ta’ investimenti “lesti għall-bejgħ” ċkien bi 12.1% mqabbel mal-2016. Id-dispożizzjoni tal-bank li jfittex investimenti ta’ kwalità ma nbidlitx – dan il-portafoll huwa amministrat bħala riżerva ta’ likwidità ta’ kwalità superjuri u jikkonsisti kollu kemm hu minn titoli sovrani jew supranazzjonali bi klassifikazzjoni A- (mingħand S&P) jew aħjar. Waqt li l-bank xtara bonds biex jieħdu post uħud minn dawk li mmaturaw matul is-sena, l-opportunitajiet ta’ investiment attraenti f’ambjent ta’ rati ta’ imgħax li niżlu f’livell rekord fl-Ewropa kienu ftit li xejn.
Is-Servizzi Bankarji Personali u l-Amministrazzjoni tal-Ġid (l-RBWM)
L-2017 kienet sena ta’ progress strateġiku għall-RBWM u aħna kuntenti bit-titjib li għamilna biex nilħqu l-istandards li nistennew fl-osservanza tar-regolamenti. Il-prestazzjoni finanzjarja baqgħet bejn wieħed u ieħor skont l-aspettattivi.
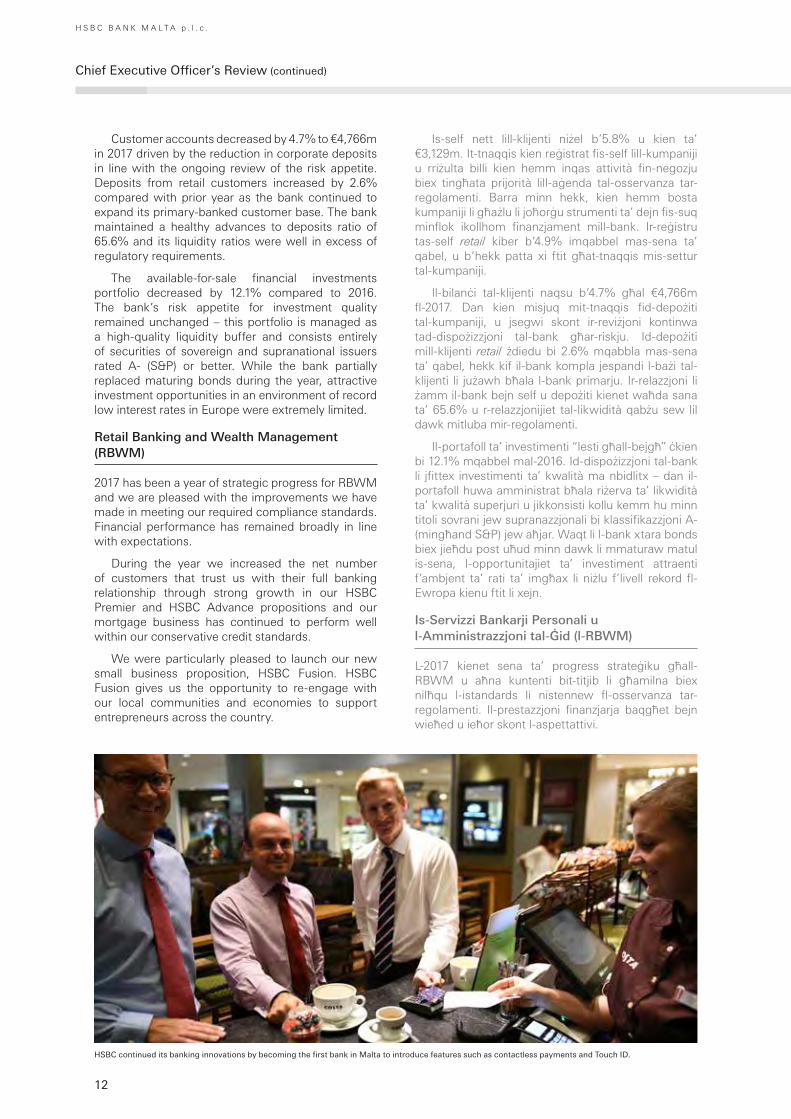
HSBC continued its banking innovations by becoming the first bank in Malta to introduce features such as contactless payments and Touch ID.

13
Our digital change programme is progressing well and we continue to drive engagement through our social media platforms, in particular Facebook and the recently launched YouTube channel. We were delighted to be the first major bank to introduce contactless card technology for our HSBC Premier customers as well as the roll-out of new products in wealth management such as the multi-asset fund and personal pensions.
From a compliance perspective, RBWM has progressed well with the complex instruments remediation programme announced last year and expects to complete the programme in 2018 at a slightly lower cost than originally expected.
Our employee-led change programme has maintained excellent pace delivering over 70 changes to processes and procedures in order to reduce the level of complexity for the benefit of our people and customers. As we look ahead to 2018 we will further increase our focus on improving the experience our customers have when banking with us and our employees have working for us.
Commercial Banking (CMB)
In 2017, our CMB business delivered revenues and profits in line with expectations although lower than the previous year primarily due to a repositioning of the customer portfolio to meet our increased compliance standards which protect longer term value.
Achieving these standards is time-consuming for our customers and for the bank and necessitated that most of our people were focused on this task throughout 2017. This essential work will continue during 2018 even though the most challenging elements have now been completed successfully. The bank believes that meeting the highest compliance standards provides long-term benefit and protection to shareholders and to customers.
Matul is-sena kellna żieda netta fin-numru ta’ klijenti li fdaw lilna bir-relazzjoni sħiħa bankarja tagħhom, billi kellna tkabbir sod fil-propożizzjonijiet HSBC Premier u HSBC Advance, u n-negozju tas-self għad-djar kompla sejjer tajjeb fil-konfini tal-istandards ta’ kreditu konservattivi tagħna.
Kien ta’ pjaċir speċjali għalina li nvaraw il-propożizzjoni ġdida tagħna għan-negozji ż-żgħar, l-HSBC Fusion. L-HSBC Fusion jagħtina l-opportunità li nerġgħu nimpenjaw ruħna mal-komunitajiet u l-ekonomiji lokali biex nappoġġjaw l-imprendituri madwar Malta kollha.
Il-programm tagħna ta’ tibdil diġitali miexi sew u aħna nkomplu nimbuttaw l-involviment permezz tal-preżenza tagħna fil-mezzi soċjali, partikolarment fil-Facebook u fil-kanal imniedi reċentement fuq YouTube. Aħna ferħanin li konna l-ewwel bank maġġuri li daħħal il-kards bit-teknoloġija contactless għall-klijenti tal-HSBC Premier kif ukoll li ħriġna prodotti ġodda fl-amministrazzjoni tal-ġid bħalma huma l-fond multi-asset u l-pensjonijiet personali.
Mil-lat tal-osservanza, l-RBWM mexa ‘l quddiem sew bil-programm imħabbar is-sena l-oħra ta’ rimedju marbut mal-istrumenti kumplessi u jistenna li jtemm ix-xogħol fuqu fl-2018 bi spiża kemm kemm anqas milli maħsub oriġinarjament.
Il-programm għall-bidla li jmexxu l-impjegati baqa’ għaddej b’pass mgħaġġel u ħareġ 70 bidla fil-proċessi u proċeduri biex inaqqas il-livell ta’ kumplessità għall-benefiċċju tan-nies u l-klijenti tagħna. Hekk kif inħarsu ‘l quddiem lejn l-2018 se nkomplu nikkonċentraw biex intejbu l-esperjenza li jkollhom il-klijenti meta jinqdew mingħandna u l-impjegati meta jaħdmu magħna.
Is-Servizzi Bankarji Kummerċjali (is-CMB)
Fl-2017, ix-xogħol tas-CMB ħalla d-dħul u l-profitti li konna qed nistennew, għalkemm dawn kienu inqas minn tas-sena ta’ qabel primarjament minħabba
HSBC placed banking in the heart of the community with the launch of HSBC Fusion.
14
H S B C B A N K M A L T A p . l . c .
Chief Executive Officer’s Review (continued)
During 2017 we continued to invest in up-skilling our people through various local and overseas training courses, offsite meetings and team building activities. We firmly believe that our people are our greatest asset. Achieving good results can only be realised through the professionalism, commitment and engagement of our colleagues.
Our ongoing commitment to the Maltese business community was demonstrated through the continued partnership and sponsorships with Trade Malta and the Malta Chamber of Commerce, Industry and Enterprise. We were also sponsors for another year of the EY Malta Attractiveness Conference and were again the lead sponsors of The Economist event. In addition we organised several Thought Leadership events for our customers which included bringing to Malta two of HSBC’s renowned global economists to discuss and interact with our customers directly. Such activities assist to position HSBC Malta as the bank of choice for business.
The Malta Trade for Growth initiative and the €75m fund launched in June 2015, built on the success of the earlier €50m fund, has been well received by a range of stakeholders. By the end of 2017, the fund was fully utilised.
Global Markets (GM)
Global Markets business continued to face external market challenges. Balance sheet management, which manages Market Risk on the bank’s balance sheet and deploys surplus liquidity, continued to experience challenges from the negative interest rate
r-ripożizzjonament tal-portafoll tal-klijenti li sar biex nilħqu l-istandards ogħla li ffissajna għall-osservanza, li bihom il-valur jibqa’ protett aktar fit-tul.
Biex jintlaħqu, dawn l-istandards jieħdu ħafna ħin minn tal-klijenti u minn tal-bank, u kien hemm bżonn li parti kbira tan-nies tagħna jkunu ffokati fuq dil-biċċa xogħol matul is-sena kollha. Dan ix-xogħol essenzjali se jitkompla tul l-2018, għalkemm l-aktar elementi ta’ sfida issa tlestew b’suċċess. Il-bank jemmen li meta wieħed jilħaq l-ogħla standards ta’ osservanza jkun qed jagħti benefiċċju fit-tul u ħarsien lill-azzjonisti u lill-klijenti.
Tul l-2017 komplejna ninvestu biex intejbu l-ħiliet tan-nies tagħna b’diversi korsijiet ta’ taħriġ f’Malta u barra, kif ukoll b’laqgħat barra mill-uffiċċju u b’attivitajiet li jsaħħu l-ħidma f’tim. Aħna nemmnu bil-qawwa li l-ħaddiema huma l-akbar assi tagħna. Ir-riżultati tajbin nistgħu nilħquhom biss bil-professjonalità, l-impenn u d-dedikazzjoni tal-kollegi tagħna.
L-impenn kontinwu tagħna lejn il-komunità kummerċjali f’Malta ntwera billi komplejna naħdmu bħala sħab u sponsors ma’ Trade Malta u mal-Kamra tal-Kummerċ, Intrapriża u Industrija. Konna wkoll għal sena oħra sponsors tal-EY Malta Attractiveness Conference u erġajna konna l-isponsors ewlenin ta’ The Economist Event. Organizzajna wkoll diversi attivitajiet ta’ Thought Leadership għall-klijenti tagħna, li kienu jinkludu li nġiebu Malta tnejn mill-ekonomisti globali magħrufin tal-HSBC biex jiddiskutu u jitħaddtu direttament mal-klijenti tagħna. Avvenimenti bħal dawn jgħinu biex ipoġġu lill-HSBC Malta bħala l-bank tal-għażla għan-negozju.
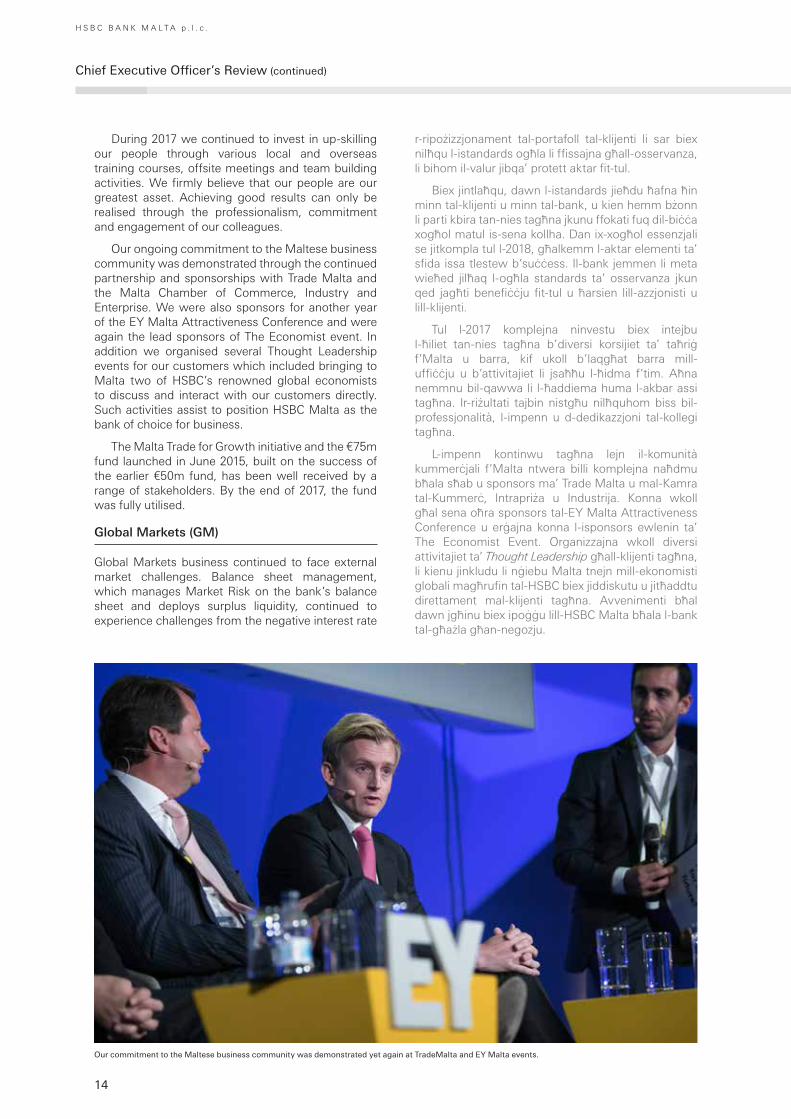
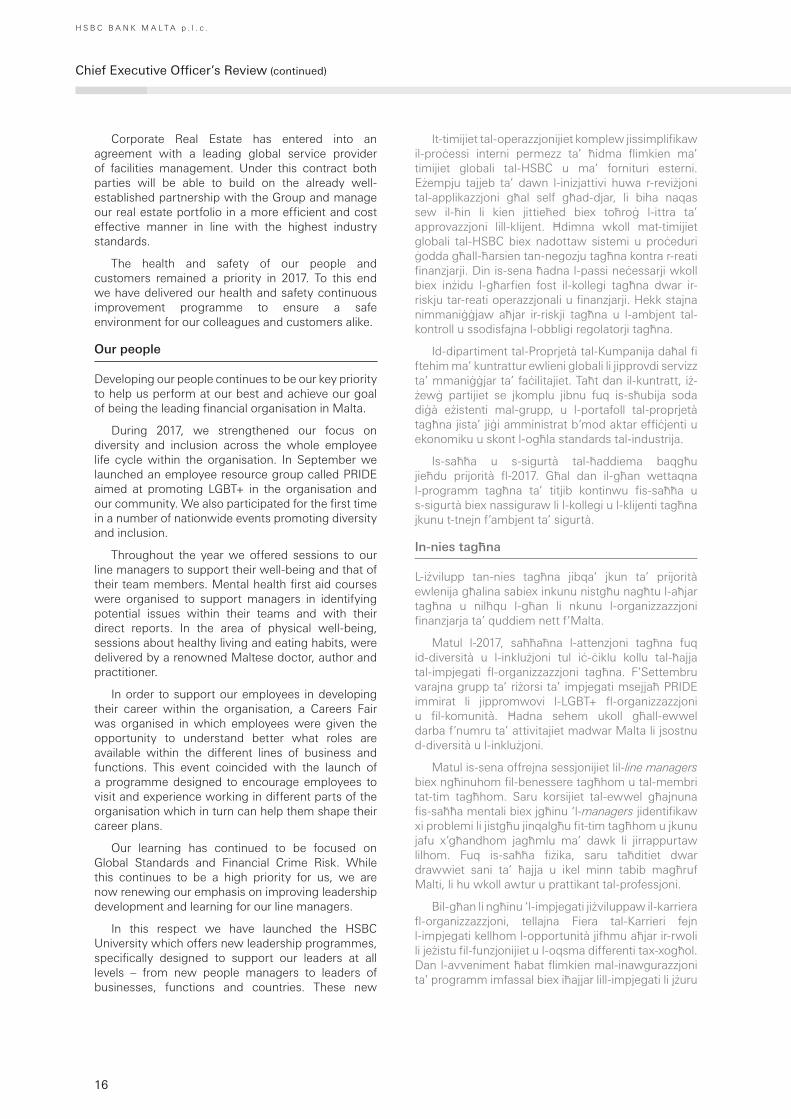
Our commitment to the Maltese business community was demonstrated yet again at TradeMalta and EY Malta events.
15
environment. The available-for-sale portfolio is mainly re-invested in investment grade securities rated A- or higher, reflecting our conservative risk appetite, but delivering very low to negative revenue performance.
Revenues from foreign exchange were impacted by the lower volume of transacted business, reflecting bank’s de-risking strategy and increased competition.
Collaboration with CMB remains one of GM’s strategic priorities. It allows CMB clients to benefit from GM’s product expertise, in particular for foreign exchange, interest rate risk and commodities risk management, where we see a good potential for growth, especially as markets remain volatile and when interest rates start to increase.
Jointly with CMB, we organised a number of seminars for CMB clients and invited industry leading specialists to interact with our clients directly, including HSBC’s Global Head of FX Research.
CMB clients continue to benefit from HSBC’s digital solutions for foreign exchange and we see continuous growth in the value of transactions processed online. We will continue to invest in our digital proposition with the aim to expand it in 2018.
HSBC Operations, Services & Technology (HOST)
Simplifying the bank’s processes to improve efficiencies and enhance our customer experience remained high on the agenda of our teams in HOST.
Our technology team has taken the lead in 2017 in delivering digital solutions by adopting different ways of working with less bureaucracy and shorter deadlines. The introduction of tablets and wi-fi in our branch network was the beginning of a journey to digitise our front office processes using e-signatures and e-forms. Apart from being faster, this process also reduces the use of paper and its associated risks. Later in 2017, HSBC Malta was the first systemic bank in Malta to launch the contactless card to its customers.
Our operations teams continued to simplify our internal processes by working with HSBC global teams and external suppliers. An excellent example of these initiatives is the mortgage application review that significantly reduced the time required to issue a sanction letter to our customers. We have also worked with HSBC’s global teams to adopt new systems and procedures to protect our business against financial crime. This year we have also taken the necessary actions to increase the awareness of operational and financial crime risk amongst our colleagues. This enabled us to better manage our risks and control environment and to meet our regulatory obligations.
L-inizjattiva Malta Trade for Growth u l-fond ta’ €75m varat f’Ġunju 2015, li nbena fuq is-suċċess tal-fond ta’ qablu ta’ €50m, intlaqgħu tajjeb mill-firxa kollha ta’ partijiet interessati. Sal-aħħar tal-2017 il-fond kien eżawrit kollu.
Is-Swieq Globali (GM)
Ix-xogħol tal-GM kompla jiffaċċa sfidi mis-suq estern. L-immaniġġjar tal-karta tal-bilanċ, li bih jiġi kkontrollat ir-riskju tas-suq fil-karta tal-bilanċ tal-bank u jidditermina l-aħjar użu tal-likwidità żejda, kellu jsir f’ambjent ta’ rati ta’ imgħax negattivi. Il-portafoll ta’ investimenti “lesti għall-bejgħ” fil-parti l-kbira jiġi investit mill-ġdid f’titoli ta’ grad ta’ investiment ikklassifikati A- jew ogħla, li jirrifletti d-dispożizzjoni konservattiva tagħna għar-riskju, imma dawn kienu qed jirrendu dħul baxx ħafna jew saħansitra negattiv.
L-introjti mill-kambju ntlaqtu minn volum iċken ta’ transazzjonijiet, li jirrifletti l-istrateġija tal-bank li jnaqqas ir-riskju u l-kompetizzjoni li żdiedet.
Il-kollaborazzjoni mas-CMB għadha waħda mill-prijoritajiet strateġiċi tal-GM. Din tippermetti lill-klijenti tas-CMB li jibbenefikaw mit-tagħrif espert tal-GM dwar il-prodotti, speċjalment dwar il-kambju, l-immaniġġjar tar-riskju tar-rati tal-imgħax u tal-prodotti kummerċjali. Hawn naraw potenzjal tajjeb għat-tkabbir, speċjalment billi s-swieq għadhom volatili u meta r-rati tal-imgħax jibdew jogħlew.
Flimkien mas-CMB organizzajna għadd ta’ seminars għall-klijenti tas-CMB u stedinna speċjalisti magħrufin fl-industrija biex jitkellmu direttament mal-klijenti tagħna. Fost dawn l-ispeċjalisti kien hemm ukoll il-Kap Globali tal-HSBC għar-Riċerka dwar il-Kambju.
Il-klijenti tas-CMB għadhom igawdu mis-soluzzjonijiet diġitali tal-HSBC dwar il-kambju, u qed naraw il-valur tat-transazzjonijiet ipproċessati online dejjem jikber. Fl-2018 bi ħsiebna nkomplu ninvestu fil-propożizzjoni diġitali tagħna bil-għan li nespanduha.
L-Operazzjonijiet, is-Servizzi u t-Teknoloġija tal-HSBC (‘HOST’)
Is-simplifikazzjoni tal-proċessi tal-bank bil-għan li tiżdied l-effiċjenza u titjieb l-esperjenza tal-klijenti nżammet fil-għoli fl-aġenda tat-timijiet tagħna fil-HOST.
It-tim teknoloġiku tagħna kien fuq quddiem fl-2017 fil-ħruġ ta’ soluzzjonijiet diġitali, billi adotta modi differenti ta’ kif isir ix-xogħol u b’hekk għenna naslu għal soluzzjonijiet b’inqas burokrazija u f’iqsar żmien. L-introduzzjoni tat-tablets u l-wifi fil-fergħat tagħna kienet il-bidu ta’ vjaġġ biex il-proċessi fil-postijiet fejn jinqeda l-pubbliku jiġu diġitizzati bl-użu ta’ firem elettroniċi u formoli elettroniċi. Barra li jgħaġġel iżjed, dan il-proċess inaqqas l-użu tal-karti u r-riskji assoċjati miegħu. Aktar tard fis-sena, l-HSBC kien l-ewwel bank sistemiku f’Malta li nieda l-karta ta’ kreditu contactless għall-klijenti tiegħu.
16
H S B C B A N K M A L T A p . l . c .
Chief Executive Officer’s Review (continued)
Corporate Real Estate has entered into an agreement with a leading global service provider of facilities management. Under this contract both parties will be able to build on the already well-established partnership with the Group and manage our real estate portfolio in a more efficient and cost effective manner in line with the highest industry standards.
The health and safety of our people and customers remained a priority in 2017. To this end we have delivered our health and safety continuous improvement programme to ensure a safe environment for our colleagues and customers alike.
Our people
Developing our people continues to be our key priority to help us perform at our best and achieve our goal of being the leading financial organisation in Malta.
During 2017, we strengthened our focus on diversity and inclusion across the whole employee life cycle within the organisation. In September we launched an employee resource group called PRIDE aimed at promoting LGBT+ in the organisation and our community. We also participated for the first time in a number of nationwide events promoting diversity and inclusion.
Throughout the year we offered sessions to our line managers to support their well-being and that of their team members. Mental health first aid courses were organised to support managers in identifying potential issues within their teams and with their direct reports. In the area of physical well-being, sessions about healthy living and eating habits, were delivered by a renowned Maltese doctor, author and practitioner.
In order to support our employees in developing their career within the organisation, a Careers Fair was organised in which employees were given the opportunity to understand better what roles are available within the different lines of business and functions. This event coincided with the launch of a programme designed to encourage employees to visit and experience working in different parts of the organisation which in turn can help them shape their career plans.
Our learning has continued to be focused on Global Standards and Financial Crime Risk. While this continues to be a high priority for us, we are now renewing our emphasis on improving leadership development and learning for our line managers.
In this respect we have launched the HSBC University which offers new leadership programmes, specifically designed to support our leaders at all levels – from new people managers to leaders of businesses, functions and countries. These new
It-timijiet tal-operazzjonijiet komplew jissimplifikaw il-proċessi interni permezz ta’ ħidma flimkien ma’ timijiet globali tal-HSBC u ma’ fornituri esterni. Eżempju tajjeb ta’ dawn l-inizjattivi huwa r-reviżjoni tal-applikazzjoni għal self għad-djar, li biha naqas sew il-ħin li kien jittieħed biex toħroġ l-ittra ta’ approvazzjoni lill-klijent. Ħdimna wkoll mat-timijiet globali tal-HSBC biex nadottaw sistemi u proċeduri ġodda għall-ħarsien tan-negozju tagħna kontra r-reati finanzjarji. Din is-sena ħadna l-passi neċessarji wkoll biex inżidu l-għarfien fost il-kollegi tagħna dwar ir-riskju tar-reati operazzjonali u finanzjarji. Hekk stajna nimmaniġġjaw aħjar ir-riskji tagħna u l-ambjent tal-kontroll u ssodisfajna l-obbligi regolatorji tagħna.
Id-dipartiment tal-Proprjetà tal-Kumpanija daħal fi ftehim ma’ kuntrattur ewlieni globali li jipprovdi servizz ta’ mmaniġġjar ta’ faċilitajiet. Taħt dan il-kuntratt, iż-żewġ partijiet se jkomplu jibnu fuq is-sħubija soda diġà eżistenti mal-grupp, u l-portafoll tal-proprjetà tagħna jista’ jiġi amministrat b’mod aktar effiċjenti u ekonomiku u skont l-ogħla standards tal-industrija.
Is-saħħa u s-sigurtà tal-ħaddiema baqgħu jieħdu prijorità fl-2017. Għal dan il-għan wettaqna l-programm tagħna ta’ titjib kontinwu fis-saħħa u s-sigurtà biex nassiguraw li l-kollegi u l-klijenti tagħna jkunu t-tnejn f’ambjent ta’ sigurtà.
In-nies tagħna
L-iżvilupp tan-nies tagħna jibqa’ jkun ta’ prijorità ewlenija għalina sabiex inkunu nistgħu nagħtu l-aħjar tagħna u nilħqu l-għan li nkunu l-organizzazzjoni finanzjarja ta’ quddiem nett f’Malta.
Matul l-2017, saħħaħna l-attenzjoni tagħna fuq id-diversità u l-inklużjoni tul iċ-ċiklu kollu tal-ħajja tal-impjegati fl-organizzazzjoni tagħna. F’Settembru varajna grupp ta’ riżorsi ta’ impjegati msejjaħ PRIDE immirat li jippromwovi l-LGBT+ fl-organizzazzjoni u fil-komunità. Ħadna sehem ukoll għall-ewwel darba f’numru ta’ attivitajiet madwar Malta li jsostnu d-diversità u l-inklużjoni.
Matul is-sena offrejna sessjonijiet lil-line managers biex ngħinuhom fil-benessere tagħhom u tal-membri tat-tim tagħhom. Saru korsijiet tal-ewwel għajnuna fis-saħħa mentali biex jgħinu ‘l-managers jidentifikaw xi problemi li jistgħu jinqalgħu fit-tim tagħhom u jkunu jafu x’għandhom jagħmlu ma’ dawk li jirrappurtaw lilhom. Fuq is-saħħa fiżika, saru taħditiet dwar drawwiet sani ta’ ħajja u ikel minn tabib magħruf Malti, li hu wkoll awtur u prattikant tal-professjoni.
Bil-għan li ngħinu ‘l-impjegati jiżviluppaw il-karriera fl-organizzazzjoni, tellajna Fiera tal-Karrieri fejn l-impjegati kellhom l-opportunità jifhmu aħjar ir-rwoli li jeżistu fil-funzjonijiet u l-oqsma differenti tax-xogħol. Dan l-avveniment ħabat flimkien mal-inawgurazzjoni ta’ programm imfassal biex iħajjar lill-impjegati li jżuru

17
programmes are complemented by new online resources on a dedicated HSBC University site. From 2018 there will be opportunities for people to come together to learn in dedicated HSBC University premises across the Group.
We were proud to end the year being recognised by the Financial Times as Malta’s best bank which is a tribute to all our people who have continued to work so hard to serve our customers.
Compliance
HSBC is committed to the highest global standards of financial crime compliance and during 2017 this remained a key priority for the bank. HSBC appreciates that our high standards have at times caused inconvenience for clients as we seek to understand our customers and their interaction with the bank, and we take this opportunity to thank them for their patience and understanding. We believe that this important work provides security to the financial system and to all those who use it. High compliance standards in the banking system continue to be a source of strength and competitive advantage not only for our customers but also for the country as we work diligently to support growth in Malta’s economy by facilitating new business and cross-border trade.
HSBC is committed to continue this important work in 2018 as we approach a seminal point for the country with the next Moneyval inspection of Malta’s
partijiet differenti mill-organizzazzjoni u jipprovaw huma stess ix-xogħol, biex imbagħad ikunu jistgħu jifformaw aħjar il-pjani tagħhom għall-karriera.
It-tagħlim tagħna baqa’ ffokat fuq l-Istandards Globali u Riskju tar-Reati Finanzjarji. Waqt li dan jibqa’ ta’ importanza primarja għalina, issa qed inġeddu l-enfasi għal fuq it-titjib tal-iżvilupp u t-tagħlim fit-tmexxija għal-line managers tagħna.
Dwar dan, varajna l-Università tal-HSBC, li toffri programmi ġodda ta’ leadership, maħsuba apposta biex jgħinu lill-mexxejja tagħna fil-livelli kollha – minn managers ġodda tan-nies għal kapijiet ta’ setturi, funzjonijiet u pajjiżi. Dawn il-programmi ġodda huma akkumpanjati minn riżorsi ġodda online fuq sit elettroniku dedikat tal-Università tal-HSBC. Mill-2018 se jkun hemm opportunità biex impjegati jiġu flimkien biex jitgħallmu f’postijiet dedikati għall-Università tal-HSBC mifruxa mal-Grupp kollu.
U aħna kburin li ntemmu s-sena bir-rikonoxximent tagħna mill-Financial Times bħala l-aqwa bank f’Malta, ġieħ għall-ħaddiema kollha tal-bank li tant ħadmu biex jaqdu lill-klijenti tagħna.
L-osservanza tar-regolamenti
L-HSBC huwa kommess li jżomm l-ogħla standards globali fl-osservanza kontra r-reati finanzjarji u fl-2017 din kienet prijorità ewlenija għall-bank. L-HSBC jifhem li l-istandards għoljin tiegħu setgħu xi drabi
Investing in environmental initiatives as well as in our people.
18
H S B C B A N K M A L T A p . l . c .
Chief Executive Officer’s Review (continued)
compliance with international obligations. A positive outcome of this review is an essential building block for the next phase of the country’s economic growth.
Executive Committee (EXCO)
The bank’s Executive Committee during 2017 was comprised of the following team members:
Andrew Beane Chief Executive Officer
Nikolaos Fertakis Chief Operating Officer
Rashid Daurov Chief Financial Officer
Daniel Robinson Head of RBWM
Michel Cordina Head of CMB
Irina Seylanyan Head of GM
Joyce Grech Chief Risk Officer
Gareth Williams Head of Human Resources
Anna Camilleri Head of Internal Audit
Joseph Sammut General Counsel
Sonya Khosla Head of Financial Crime Compliance
Philip Head Head of Financial Crime Compliance Transformation
Anthony P. Abela Head of Regulatory Compliance
Franco Aloisio Head of Communications
George Brancaleone Company Secretary
Tragically our much loved Head of Human Resources, Gareth Williams, passed away unexpectedly over the Christmas period. Gareth was an incredible professional who loved his role leading our Human Resources department. Our success in this area is significantly due to his personal commitment and leadership. Our condolences and sympathy are with Gareth’s family and friends. In 2018 the bank will launch a new award for excellence in Gareth’s name to remember the standards and values that he stood for.
Outlook
Looking to the future, the outlook for the local economy remains favourable with strong GDP growth, low unemployment and inflation and government finances forecast to remain in surplus. As I have commented earlier in this report, amidst this positive economic landscape, it is essential to ensure broad based and sustainable growth.
kienu ta’ inkonvenjent għall-klijenti, u jieħu din l-opportunità biex jirringrazzjahom għall-paċenzja u l-komprensjoni tagħhom. Nemmnu li dan ix-xogħol importanti jġib sigurtà għas-sistema finanzjarja u għal dawk li jużawha. L-istandards għoljin ta’ osservanza fis-sistema bankarja huma sors ta’ saħħa u vantaġġ kompetittiv mhux biss għall-klijenti tagħna imma wkoll għall-pajjiż, hekk kif naħdmu bil-għaqal biex insostnu t-tkabbir tal-ekonomija Maltija billi niffaċilitaw negozju ġdid u kummerċ ma’ pajjiżi oħra.
L-HSBC jimpenja ruħu li jkompli dan ix-xogħol importanti fl-2018 hekk kif nersqu lejn punt seminali għall-pajjiż meta l-Moneyval imissha tispezzjona kif u kemm Malta qed tikkonforma mal-obbligi internazzjonali. Huwa essenzjali li joħroġ riżultat pożittiv minn dan l-eżami biex Malta tgħaddi għall-fażi li jmiss tat-tkabbir ekonomiku.
Il-Kumitat Eżekuttiv (EXCO)
Il-Kumitat Eżekuttiv tal-bank matul l-2017 kien magħmul minn dawn il-membri:
Andrew Beane Kap Eżekuttiv
Nikolaos Fertakis Kap Operattiv
Rashid Daurov Kap tal-Finanzi
Daniel Robinson Kap tal-RBWM
Michel Cordina Kap tas-CMB
Irina Seylanyan Kap tal-GM
Joyce Grech Kap tar-Riskju
Gareth Williams Kap tar-Riżorsi Umani
Anna Camilleri Kap tal-Verifika Interna
Joseph Sammut Kunsill Ġenerali
Sonya Khosla Kap tal-Konformità dwar Reati Finanzjarji
Philip Head Kap tat-Trasformazzjoni għall-Konformità dwar Reati Finanzjarji
Anthony P. Abela Kap tal-Osservanza Regolatorja
Franco Aloisio Kap tal-Komunikazzjoni
George Brancaleone Segretarju tal-Kumpanija
Hu ta’ dispjaċir kbir li Gareth Williams, il-maħbub Kap tar-Riżorsi Umani, ħalla din id-dinja ħesrem fi żmien il-Milied. Gareth kien professjonista inkredibbli li kien iħobb ir-rwol tiegħu ta’ kap fid-dipartiment tar-Riżorsi Umani. Is-suċċess li kellna f’dan il-qasam huwa dovut sostanzjalment għall-impenn u t-tmexxija personali tiegħu. Noffru l-kondoljanzi u s-simpatija tagħna lill-familja ta’ Gareth f’dan iż-żmien diffiċli. Fl-2018 il-bank se jniedi premju ġdid għall-eċċellenza f’isem Gareth biex jibqgħu mfakkra l-valuri u l-istandards li kien jirrappreżenta.

19
In 2018, HSBC will increase investment in customer service and innovation to support measured growth over the medium term while sustaining the bank’s signature conservative credit discipline that supports strong performance through the full economic cycle.
I would like to thank my colleagues for their outstanding commitment to HSBC in 2017 and our customers and shareholders for their continued trust.
Andrew Beane, Chief Executive Officer20 February 2018
HRH the Prince of Wales during a recent visit to Malta, meeting HSBC’s Head of Human Resources, the late Gareth Williams (second from left), who passed away unexpectedly in December 2017.
Ħarsa ‘l quddiem
Jekk inħarsu lejn il-futur naraw li l-prospetti għall-ekonomija lokali għadhom pożittivi, bi tkabbir sod fil-GDP, qgħad u inflazzjoni baxxi u finanzi tal-gvern imbassra li jibqgħu jħallu bilanċ favorevoli. Kif ikkumentajt aktar kmieni f’dan ir-rapport, f’dan ix-xenarju ekonomiku pożittiv huwa essenzjali li nassiguraw li t-tkabbir jibqa’ fuq bażi wiesgħa u jkun sostenibbli.
Fl-2018, bil-mudell kummerċjali mibdul tagħna, l-HSBC se jżid l-investiment fis-servizz lill-klijenti u fl-innovazzjoni biex isostni tkabbir meqjus fuq terminu medju, waqt li jibqa’ jżomm id-dixxiplina konservattiva u distintiva tal-bank fuq il-kreditu, li twassal għal prestazzjoni b’saħħitha tul iċ-ċiklu kollu ekonomiku.
Nixtieq nirringrazzja lill-kollegi tiegħi għad-dedikazzjoni sħiħa li wrew lejn l-HSBC fl-2017 u lill-klijenti u l-azzjonisti tagħna talli komplew jagħtuna l-fiduċja tagħhom.

20
H S B C B A N K M A L T A p . l . c .
Board of Directors and Company Secretary
Saviour sive Sonny Portelli, NON-EXECUTIVE CHAIRMAN
Appointed Chairman of HSBC Bank Malta p.l.c. on 31 May 2013 after having served as Director on the Board since 9 October 2006. Has a background in tourism, the hospitality industry, telecoms and general management, with significant international experience. In connection with these roles, Mr Portelli served on a number of Boards and trade organisations. His previous roles included being Chairman of the Board and of the Executive Committee of GO p.l.c., Executive Chairman of Air Malta p.l.c., Director of Forthnet SA (Greece), and Chairman of the Malta Council for Economic and Social Development. Mr Portelli is also former Chairman of the bank’s Audit and Risk Committee and is presently Chairman of the bank’s Remuneration and Nomination Committee.
Christopher Davies, NON-EXECUTIVE DIRECTOR
Appointed Director of the bank on 9 May 2014. Holds the roles of Group General Manager and Chief Executive Officer International Europe, HSBC Bank plc. Mr Davies also has directorships in companies forming part of the HSBC Group. Former Deputy Chief Executive Officer and Executive Director, HSBC Bank (China) Company Limited. Prior to moving to China, Mr Davies ran HSBC’s Commercial Banking business in North America, following a series of senior appointments across all of HSBC’s major business lines, principally in the UK and the Americas.
Alison Hewitt, NON-EXECUTIVE DIRECTOR
Appointed Director of the bank on 19 May 2017. Presently HSBC Group’s Head of Regulatory Compliance in Europe since 2014. Previously, held various roles in compliance within Lloyds Banking Group, and also various positions with the FSA and UK Government Legal Service. She holds an LLB (Hons) (Law) Degree and a Post Graduate Certification in EU Law from King’s College, London, and attended an RMA/Wharton Advanced Risk Management Programme. Recently appointed advisor to the bank’s Risk Committee.
Andrew Beane, DIRECTOR AND CHIEF EXECUTIVE OFFICER
Appointed Chief Executive Officer in November 2015 and Director in March 2016. Prior to taking up his appointment in Malta, Mr Beane was Chief of Staff to the CEO of HSBC Europe, Middle East and Africa in which capacity he served as a member of the Executive and Risk Committees of HSBC Bank plc. Mr Beane has been with the HSBC Group since 2002 and his previous roles include assignments in the United Kingdom, United Arab Emirates, Hong Kong and the United States, principally in the areas of Commercial Banking and Strategy & Planning.
Yiannos Michaelides, NON-EXECUTIVE DIRECTOR
Appointed Director of the bank on 26 May 2017. Presently Member of the bank’s Risk Committee. Mr Michaelides has over 26 years of international business experience involving telecoms and media. Till 31 March 2017, Mr Michaelides occupied the post of Group CEO of GO p.l.c. Before joining GO p.l.c. he was Senior Executive at EITL Dubai, GO p.l.c.’s prior main shareholder, with responsibilities including portfolio management and value creation at EITL portfolio companies. Prior to that, he worked as Vice-president of Strategic Marketing at du in Dubai, the new integrated telecoms operator in the UAE and Areeba, the second mobile operator in Cyprus. Mr Michaelides holds a B. Eng. (Honours), M. Eng. from McGill University (Montreal, Canada) and an M.B.A. with distinction from Warwick Business School (UK).

21
Maryanne sive Sue Vella, NON-EXECUTIVE DIRECTOR
Appointed Director of the bank on 27 May 2016. Presently Senior Lecturer at the University of Malta on Social Policy and a member of the National Centre for Family Research within the President’s Foundation for Social Wellbeing. Former Chief Executive Officer of Malta Enterprise Corporation and of the Employment and Training Corporation respectively, and former Vice-President of the EU’s Employment Committee. Doctor of Philosophy in Social Policy & Social Work, Master of Science in Social Policy & Planning and Bachelor of Arts in Psychology. Dr Vella is a Member of the bank’s Remuneration and Nomination Committee.
John Bonello, NON-EXECUTIVE DIRECTOR
Appointed Director of the bank on 15 July 2013. Chairman of the bank’s Audit Committee and member of the bank’s Risk Committee and former Chairman of the bank’s Remuneration and Nomination Committee. Mr Bonello is a Chartered Accountant and a Certified Public Accountant. He was formerly the Chairman and Senior Partner of PricewaterhouseCoopers in Malta from where he retired in December 2009. He is a Fellow of the Malta Institute of Accountants and Chairman of the Disciplinary Committee of the Institute and a Member of the Joint Disciplinary Board of the Accountancy Board.
Gordon Cordina, NON-EXECUTIVE DIRECTOR
Appointed Director of the bank on 1 February 2017. Presently operates as a consultant on economic matters at E-Cubed Consultants Ltd, where he is an Executive Director. Dr Cordina also holds a visiting position at the Department of Economics at the University of Malta. Dr Cordina formerly held the following roles: Economist/Head of the Economic Research Department at the Central Bank of Malta, Director General of the National Statistics Office, Head of the Economics Department of the University of Malta and Economic Advisor to the Malta Council for Economic and Social Development. Dr Cordina also occupied the role of Non- Executive Director at Bank of Valletta p.l.c. up to 2013. Holds a B.Com (Hons.) and a doctorate in Economics from the University of Malta and read a Masters in Economics at University of Cambridge.
Andrew Muscat, NON-EXECUTIVE DIRECTOR
Appointed Director of the bank on 16 January 2014. Partner at Mamo TCV Advocates where he heads the Corporate & Banking Department. Professor at the Faculty of Laws of the University of Malta. Professor Muscat also has two directorships in two different groups of companies and two other directorships in other companies. Former Director of Mid-Med Bank p.l.c. and also former member of the Board of Governors of the Malta Financial Services Authority. Presently member of the bank’s Audit Committee and of the bank’s Remuneration and Nomination Committee.
George Brancaleone, COMPANY SECRETARY
Company Secretary of HSBC Bank Malta p.l.c. since June 2004. Joined the bank in 1980, graduated LL.D. in 1988 and read an MA Degree in Contemporary European Studies (Sussex University 1993). Company Secretary of various HSBC subsidiaries in Malta since 2001.

22
H S B C B A N K M A L T A p . l . c .
Executive Committee
Andrew Beane, DIRECTOR AND CHIEF EXECUTIVE OFFICER
Appointed Chief Executive Officer in November 2015 and Director in March 2016. Prior to taking up his appointment in Malta, Mr Beane was Chief of Staff to the CEO of HSBC Europe, Middle East and Africa in which capacity he served as a member of the Executive and Risk Committees of HSBC Bank plc. Mr Beane has been with the HSBC Group since 2002 and his previous roles include assignments in the United Kingdom, United Arab Emirates, Hong Kong and the United States, principally in the areas of Commercial Banking and Strategy & Planning.
Rashid Daurov, CHIEF FINANCIAL OFFICER
Appointed Chief Financial Officer on 29 November 2014. Holds an MSc Degree in Management from University of Bristol, UK and is a Certified Public Accountant (US). Mr Daurov joined HSBC in 2010 and worked as Head of Group Reporting and Planning in Kazakhstan and most recently as Chief Financial Officer for HSBC Kazakhstan. Prior to HSBC, Mr Daurov worked in audit and financial advisory with Ernst and Young, and Deloitte.
Daniel Robinson, HEAD OF RETAIL BANKING AND WEALTH MANAGEMENT
Appointed to the current role in April 2016. Mr Robinson has extensive experience in a range of Senior RBWM leadership roles in the HSBC Group, including Programme Director, Head of Business Management and Performance Director at HSBC UK RBWM. Mr Robinson holds a Bachelor of Engineering in Automotive Engineering from Oxford Brookes University.
Nikolaos Fertakis, CHIEF OPERATING OFFICER
Appointed Chief Operating Officer in April 2016. Mr Fertakis has over 23 years of experience in the banking sector with specialisation in Information Systems and Operations. He joined HSBC in Greece in 2011 initially assuming the duties of IT Director and two years later was promoted to the role of Head of IT Operations International Europe. Since early 2014 Mr Fertakis was appointed Chief Operating Officer of the HSBC’s operations in Greece. He holds a Degree in Mechanical Engineering, an MSc in Information Systems from Kingston University and an MBA with specialisation in Banking and Finance from Kingston University – ICBS Athens Business School.
Michel Cordina, HEAD OF COMMERCIAL BANKING
Appointed Head of Commercial Banking on 1 June 2011. Prior to taking up this appointment, Mr Cordina was Deputy Head of CMB. Mr Cordina is a banking professional and has over 33 years experience with HSBC. He has worked in the United Kingdom as the Head of Sales Performance for CMB, in the branch network in Malta for both retail and commercial banking and in a number of Head Office departments, where he was Deputy Head of Operations and Head of Business Transformation.

23
Gareth Williams, HEAD OF HUMAN RESOURCES
Passed away in December 2017. Appointed as Head of HR Malta in April 2016. Mr Williams had 34 years’ service with HSBC Group, with 18 years HR experience. Previous experience within the Group included management/leadership roles in Retail Banking, Commercial Banking and Credit. For the six years preceding the role he occupied when he passed away, Mr Williams was Regional Head of HR, Europe HSBC Operations, Services & Technology and previously Head of HR International, based in Jersey. He was a Chartered Fellow of the Institute of Financial Services and Chartered Fellow of the Chartered Institute of Personnel and Development.
Irina Seylanyan, HEAD OF GLOBAL MARKETS
Appointed Head of the then Global Banking & Markets in May 2016. Ms Seylanyan has extensive background in Global Markets, most notably as Deputy CEO and Head of Global Markets of HSBC Bank Armenia. Prior to taking up her appointment in Malta, Ms Seylanyan held a senior managerial role with HSBC Global Commercial Banking in London, where she was responsible for regulatory change. Ms Seylanyan is an Automated Systems engineer and a fellow of the Association of Chartered Certified Accountants.
Anna Camilleri, HEAD OF INTERNAL AUDIT
Appointed as Head of Internal Audit on 16 November 2015. Prior to joining the bank Ms Camilleri held the post of Senior Manager – Governance, Risk & Compliance Services at PwC. Ms Camilleri is a fellow of the Association of Chartered Certified Accountants, holds a Maltese Practising Certificate in Auditing and is a retired Information Systems and Controls specialist. She has a strong auditing background and has managed numerous complex internal audit and business process re-engineering assignments both in Malta and internationally.
Joyce Grech, CHIEF RISK OFFICER
Appointed Chief Risk Officer in April 2013. Ms Grech has worked with HSBC for 21 years. During her career, Ms Grech has undertaken a number of roles, principally in Malta. Ms Grech started her career in Trade Finance and Commercial Banking before moving to the bank’s Credit department where she spent over five years, the last three of which she was the Deputy Head of Credit. Before taking up her role as Chief Risk Officer she worked in the bank’s Retail Banking and Wealth Management division where she headed the Customer Value Management department.
Joseph Sammut, GENERAL COUNSEL
Appointed General Counsel in July 2016. Joined the bank in 1981, then Mid-Med Bank, and subsequently read law at the University of Malta, where he graduated in 1989. He obtained his postgraduate degree in European Law at the College of Europe in Bruges in 1989. At the bank’s Legal Office he worked for some years as a contracts lawyer and subsequently focused mainly on financial services. Since 1999 he was entrusted with leading the legal advice team and in 2010 worked at HSBC Head Office in London on a short-term legal assignment. He was appointed Deputy General Counsel in 2012.

24
H S B C B A N K M A L T A p . l . c .
Executive Committee (continued)
Philip Head, HEAD OF FINANCIAL CRIME COMPLIANCE TRANSFORMATION
Joined HSBC Bank Malta in April 2016 and appointed as Head of FCC, transferring to his current role as Head of FCC Transformation in February 2017. Mr Head joined from Standard Chartered Bank, London, where he held the position of Head of FCC for their UK operation, he was previously with Wells Fargo Bank holding a regional FCC risk role. He has over 31 years banking experience in a variety of roles with the past 18 years being spent within the FCC environment with top tier global banks.
Sonya Khosla, HEAD OF FINANCIAL CRIME COMPLIANCE
Appointed Head of Financial Crime Compliance on 1 February 2017. Previously Ms Khosla worked in HSBC London as a Senior Manager in a regional Financial Crime Compliance role looking after a portfolio of European countries including Malta. Before joining the HSBC Group in January 2016 Ms Khosla was the Head of Financial Crime and Regulatory Compliance at the Bank of East Asia. Prior to that she worked at PwC in their London Financial Services Regulatory Practice and for over 10 years as a specialist in Financial Crime and Regulatory Compliance. Originally started her career at Lloyds Banking Group.
Franco Aloisio, HEAD OF COMMUNICATIONS
With 22 years of experience in communications, marketing, media and market research, Mr Aloisio joined HSBC Malta in 2011 as Head of Communications responsible for the bank’s internal and external relations, as well as supporting the bank’s investor relations activities. Mr Aloisio previously worked with GO p.l.c. and its mobile arm – GO Mobile. He also worked with Global Capital plc and, in the early part of his career, Mr Aloisio was a senior journalist with The Malta Business Weekly and The Malta Independent on Sunday. He holds a BA Hons. Degree in Sociology.
Anthony P. Abela, HEAD OF REGULATORY COMPLIANCE
Appointed as Head of Regulatory Compliance for HSBC Bank Malta p.l.c. in March 2014. With 22 years experience in banking and financial services at HSBC, Mr Abela held senior management positions in fund management, securities services, internal audit and compliance. He holds a Bachelor’s Degree in Economics and Psychology, and a Master’s Degree in Business Administration.
George Brancaleone, COMPANY SECRETARY
Company Secretary of HSBC Bank Malta p.l.c. since June 2004. Joined the bank in 1980, graduated LL.D. in 1988 and read a MA Degree in Contemporary European Studies (Sussex University 1993). Company Secretary of various HSBC subsidiaries in Malta since 2001.
25
H S B C B A N K M A L T A p . l . c .
Report of the Directors
The bank provides a comprehensive range of banking and financial related services. The bank is authorised to carry on the business of banking, under the Banking Act, 1994 as a credit institution. It is also a licensed financial intermediary in terms of the Financial Markets Act, 1990. The bank also holds Category 3 and Category 4 Investment Services licences issued by the Malta Financial Services Authority in terms of the Investment Services Act, 1994. These licences authorise the bank to provide investment services to third parties and custodian services for collective investment schemes respectively. As at 31 December 2017 the bank had 28 branches and agencies in Malta, three of which are located in Gozo.
The local group comprised the following subsidiaries at 31 December 2017: HSBC Life Assurance (Malta) Limited and HSBC Global Asset Management (Malta) Limited.
Principal activities of subsidiaries
HSBC Life Assurance (Malta) Limited is authorised by the Malta Financial Services Authority to carry on business of insurance in Malta under the Insurance Business Act, 1998. It offers a range of protection and investment life assurance products distributed mainly through HSBC Bank Malta p.l.c. which is enrolled as a tied insurance intermediary for HSBC Life Assurance (Malta) Limited under the Insurance Intermediaries Act, 2006.
HSBC Global Asset Management (Malta) Limited is the investment solutions provider of the HSBC Group in Malta. It manages an array of funds which have exposure to both Maltese and international financial markets. HSBC Global Asset Management (Malta) Limited specialises in the provision of tailor-made discretionary portfolio management services for institutions and family offices.
Business and strategy
The purpose of the local group is to connect customers to opportunities, enable businesses to thrive and ultimately help people to fulfil their hopes and realise their ambitions. The group is part of HSBC, which has more than 229,000 employees working across the world to provide around 38 million customers with a broad range of banking products and services to meet their financial needs.
In this respect, the local group conducts its business through supporting the sustained success of its people, customers and communities. The local group sees investment in capabilities, employees and processes as a source of long-term competitive advantage. The way the local group carries out its business strengthens the durability of its earnings and its ability to return value to shareholders.
HSBC values underpin how the local group carries out business. It is open to differences and believe diversity makes it stronger. The bank is connected, and deems personal relationships are essential to the way of doing business. The bank is dependable in fulfilling its responsibilities in society and delivering on commitments.
Consequently, the local group’s strategy and strategic direction is embedded in HSBC’s strategy, which aims to capture value from its international network. It is built around long-term trends, which is reinforced by increasing global connectivity through increased international f low of goods, services and finance, aided by the development of technology and data in personal and commercial exchanges. The unrivalled global presence of HSBC reflects the local group’s distinctive advantages.
In line with HSBC’s global banking model, the local group manages its products and services to serve its customers, from individual savers to large multinational corporations, through three businesses: RBWM; CMB and GM.
This banking model enables the local group to effectively meet clients’ diverse financial needs, support a strong capital and funding base, reduce risk profile and volatility, and generate stable returns for shareholders.
Conduct
The local group has sustained the work started earlier to deepen the embedding of the HSBC Group’s Conduct framework, such as through the follow up of the results achieved by the implementation of the ‘Conduct Maturity Assessment’. This work, consisting of a detailed articulation of areas of consideration within each of the fifteen Conduct Outcomes that comprise the Group’s Conduct framework, helped the bank embed conduct within its structures and provided a uniform tool for interpreting conduct standards across the organisation. The outcomes from the assessment informed the bank’s strategy formation for material initiatives, and also served to enhance even further the internal policies and procedures to ensure that the bank’s customers receive a balanced exchange of value and that the bank’s activities consistently uphold market integrity.
The standing and engagement with the bank’s regulators has remained positive, proactive, and transparent, reflective also of solid governance and oversight culture.
26
H S B C B A N K M A L T A p . l . c .
Report of the Directors (continued)
Consonant with HSBC’s values, respect of human rights continued to be a fundamental pillar of the local group’s responsibility to operate fairly and sustainably.
We require a high behavioural standard from all our employees, and our focus on our values of being open, connected and dependable and also of acting with courageous integrity is being embedded at every level of the local group. HSBC employees are made aware of their employment rights through a variety of channels including written contracts, employee handbooks and staff websites and these are articulated in the HSBC Global Standards Manual and HSBC Values.
HSBC is committed to a diverse and inclusive culture where employees can be confident that their views are encouraged, their concerns are attended to and they work in an environment where bias, discrimination and harassment on any matter, including gender, age, ethnicity, religion, sexuality and disability, are not tolerated and where advancement is based on merit. HSBC operates a global Compliance Disclosure Line (telephone and email) which is available to allow employees to make disclosures when the normal channels for airing grievances or concerns are inappropriate.
Results for 2017
HSBC Bank Malta p.l.c. (the bank) and its subsidiaries (collectively referred to as the local group) reported a profit before tax of €49.8m for the year under review. The local group’s profit attributable to shareholders was €30.8m.
A gross interim ordinary dividend of 4.7 cent per share was paid on 11 September 2017. The Directors have proposed a gross final dividend of 12.4 cent per ordinary share. The final dividend will be payable to shareholders on the bank’s register as at 13 March 2018.
No 2017 profits are carried forward to Retained Earnings as with the payment of the interim dividend and the final declared dividend including the extraordinary dividend, all reported 2017 profits will be distributed.
Further information about the results of the local group is provided in the Income Statements and the Statements of Comprehensive Income on pages 61 and 62 respectively.
A detailed review of the financial performance including important events affecting the local group’s results and an indication of future developments are included in the Chief Executive Officer’s Review.
Key performance indicators
The Board of Directors tracks the local group’s progress in implementing its strategy with a range of financial measures or Key Performance Indicators (KPIs). Progress is assessed by comparison with the local group strategic priorities, operating plan targets and historical performance. The local group reviews its KPIs regularly in light of its strategic objectives and may adopt new or refined measures to better align the KPIs to HSBC’s strategy and strategic priorities.
2017 2016
Profit before tax (reported) (€m) 49.8 62.2
Profit before tax (adjusted) (€m) 55.6 61.4
Cost efficiency ratio (reported) (%) 69.8 60.8
Cost efficiency ratio (adjusted) (%) 66.2 58.7
Pre-tax return on equity (reported) (%) 10.5 13.3
Pre-tax return on equity (adjusted) (%) 11.7 13.1
Common Equity Tier 1 ratio (%) 13.9 13.2
Profit before tax (reported/adjusted): Reported profit before tax is the profit as reported under IFRS. Adjusted profit before tax adjusts the reported profit for the effect of significant items as detailed on page 10.
Outcome (reported): Reported profit before tax was lower year-on-year principally due to the reduction in the corporate loan book and in the bonds portfolio. Moreover, a lower level of credit activity and the ongoing review of the bank’s risk appetite had an adverse impact on fees, commissions and trading income. Operating expenses were also higher due to the longer-term view adopted in the application of the collective agreement clauses and the costs associated with the work in raising risk and compliance standards.
Outcome (adjusted): Apart from the reason cited in the reported profit before tax, the adjusted profit before tax excludes the effect of the increase in the collective agreement provision and the movement in the brokerage remediation provision.
27
Cost efficiency ratio (adjusted) is measured as total operating expenses divided by net operating income before loan impairment and other credit risk provisions.
Outcome: The cost efficiency ratio increased from 59% to 66% due to the drop in interest and non-interest income and the costs associated with the work in raising risk and compliance standards.
Pre-tax return on equity (reported/adjusted) is measured as pre-tax profit divided by average equity. The local group targets a return in the medium term of 10%.
Outcome (reported): The reported return on equity was below the target range and prior year due to a higher amount of notable items, lower revenue as a result of reduced CMB loan book and high risk and compliance cost.
Outcome (adjusted): Apart from the reason cited in the reported return on equity, the adjusted return on equity excludes the effect of the notable item refereed to the earlier on.
Common Equity Tier 1 capital ratio (‘CET 1’) represents the ratio of Common Equity Tier 1 capital comprising shareholders’ equity and related non-controlling interests less regulatory deductions and adjustments, to total risk-weighted assets. The group seeks to maintain a strong capital base to support the development of its business and meet regulatory capital requirements at all times.
Outcome: The Common Equity Tier 1 ratio increased compared to prior year due principally to lower risk-weighted assets as a result of lower corporate loan book and a reduction in the defaulted loans.
The Board of Directors does not monitor any specific non-financial KPIs. However, Directors evaluate the outcomes of surveys and reviews undertaken on a regular basis in respect of customers, people, culture and values including customer service satisfaction, employee involvement and engagement, and diversity and sustainability.
Employees
Building a more diverse and inclusive workforce is critical to developing a sustainable and successful business. The local group aims to increase and leverage diversity of thought to improve workforce agility, enhance risk management capability, drive innovation and grow markets. The local group’s diversity and inclusion ambitions are focused on attracting, developing and retaining talent and deploying that talent effectively to anticipate and address expectations.
The local group supports this strategy and focuses on gender, age, working parents/carers and ability. Particularly, there is increased focus on improving gender balance within senior leadership and all global businesses and functions are progressing actions to support those aspirations and embed more inclusive processes throughout the employee life cycle.
There are also training programmes that reinforce a culture grounded in HSBC’s values, called ‘At Our Best’ and ‘Managing at Our Best’ which are offered to all employees. Furthermore the ‘At Our Best’ online recognition tool allows all employees to recognise colleagues’ actions by awarding points that are redeemed for gifts and benefits.
Our continued focus on Global Standards and Financial Crime Risk remained a priority locally. We are now renewing our emphasis on improving leadership development and learning for our line managers. In this respect we have launched the HSBC University which offers new leadership programmes, specifically designed to support our leaders at all levels, from new people managers to leaders of businesses and functions.
Whistleblowing
The local group has a whistleblowing policy based on a global whistleblowing platform, HSBC Confidential, which allows employees to report matters of concern confidentially. Common themes of cases raised concern matters regarding staff behaviour and recruitment practices, allegations of fraud perpetrated by staff, and weaknesses in incentive arrangements and information security.
The stewardship of the policy is entrusted to one of the non-executive Directors.
Diversity and inclusion
Diversity and inclusion are core components at HSBC. We aim to promote and embed diversity and inclusion into our culture, values and practices both within HSBC as well as in the communities in which we operate.
In line with this commitment, in 2010, the HSBC Malta Foundation was set up to invest in the communities in which HSBC operates. This substituted the former HSBC Cares for Children Fund, HSBC Cares for the Environment Fund and HSBC Cares for Malta’s Heritage Fund. The Foundation makes it a point to support various projects to help young people reach their potential.
28
H S B C B A N K M A L T A p . l . c .
Report of the Directors (continued)
In 2001, HSBC Bank Malta introduced Corporate Social Responsibility (CSR) Day, an annual event held on 19 March, where staff from responsible corporates volunteer a day’s work in aid of charity homes. Since then, the local group has worked with leading companies to carry out structural repairs and other necessary works in homes which help vulnerable groups facing social problems.
More detail about the local group’s corporate social activities can be found within the ‘Statement of Compliance with the Code of Principles of Good Corporate Governance’, specifically under Principle 12.
Health and safety
The maintenance of a safe place of work and business for our employees, customers and visitors is a key responsibility for all managers. The local group is committed to proactively manage health and safety risk through the identification, assessment and mitigation of hazards that may otherwise result in injury, fire events and operational failure.
Group policies, standards and guidance for the management of health and safety are set by the Global Corporate Real Estate function. Achieving these in the local group is the responsibility of the Chief Operating Officer with support and coordination provided by the Health and Safety Coordinator together with Global and Regional Corporate Real Estate.
Group Security Risk continuously monitors potential threats from terrorism and violent crime and ensure that HSBC maintains effective measures to protect its staff, buildings, assets and information.
The local group remains committed to maintaining its preparedness for emerging and foreseeable risks in ensuring health and safety compliance.
Sustainability
We continue to play an active role in the community we serve. Through the HSBC Malta Foundation, we have assisted various sectors of the community throughout 2017 via a number of key projects and initiatives. Sustainability and our role as a good corporate citizen remain a core focus of HSBC.
The three pillars of the HSBC Malta Foundation are to improve the quality of life and education for children; especially those disadvantaged, to promote and work towards a more sustainable environment, and to preserve Malta’s rich and unique historical heritage. For the first time in 2017, a donation was made to the University of Malta to initiate support for medical research. Thanks to HSBC Malta Foundation’s foray into the area of medical research, a novel research into chemotherapy at the University received a fresh impetus.
Voluntary work is highly encouraged and pride is taken in our colleagues who contribute to the charities and causes that they feel passionate about. Our employees are encouraged to take an active role in initiatives supported by the HSBC Malta Foundation with an extra day’s leave granted for voluntary work to support a range of projects around the country.
The HSBC Malta Water Programme – Catch the Drop campaign continued to reach out to every student in Malta and Gozo, as well as various local councils, with the main emphasis being on water shortage, water consumption reduction and water harvesting. This national environmental and educational water conservation campaign raises awareness about the water scarcity issue, and provides information and tips as to how people can tackle it. It is being supported with a €540,000 grant from the HSBC Group. Our employees are at the heart of this campaign with over 500 members of staff volunteering to deliver the information sessions in all 172 schools around Malta and Gozo.
Additionally, Malta is now part of the international ‘Water Explorer’ programme, delivered locally by Nature Trust – FEE Malta through its Eco-Schools (EkoSkola) programme. This programme is also supported by the HSBC Water Programme with the financial support of $75,000. The Water Explorer is a fun, action-oriented, international online programme that inspires thousands of students to become water ‘Explorers’ and lead action in their school communities on water issues. Managed by NGO Global Action Plan, the programme is being followed in France, Germany, Switzerland, Italy, Spain, Turkey, Poland, South Africa and the UK. Participating schools are encouraged to link up with schools from other countries and share their ideas and top water-saving tips.
Meanwhile, two youth opportunity programmes ‘Achieve’ and ‘Get Into’, introduced in Malta by HSBC Malta Foundation in cooperation with the Ministry for Education and Employment and the Prince’s Trust International (PTI), are enabling scores of young persons to succeed and secure a strong future for themselves and Malta.
Achieve supports young people to re-engage with education; improving attendance, behaviour and attainment. Get Into is a training programme run in partnership with a range of employers from sectors who have identified skills shortages and job opportunities.
29
At the time of the launch of the Achieve programme in Malta in 2015, HSBC Malta Foundation became the first organisation outside of the UK to introduce one of The Prince’s Trust’s long-standing educational programmes in secondary schools. It was initially introduced in seven schools during the 2015/16 scholastic year across all of Malta and Gozo. However, with effect from the 2017/18 scholastic year, the number of schools increased to 32.
Our community commitment extends also to the field of environmental awareness. HSBC Malta has installed 614 photovoltaic panels and commissioned seven electric vehicles including six charging points at the bank’s Operations Centre in Qormi. The PV panels, which were placed on top of 10 of the bank’s offices across Malta and Gozo, power 37 of our offsite ATMs. As a result of this initiative referred to as ‘Simply Electric’ the bank’s emissions have been reduced by an estimated 186 tonnes of CO2 per annum.
Financial Crime Compliance
As part of financial crime risk management, we have established a financial crime framework and have a dedicated Financial Crime Risk team. We have invested heavily in training and communication for all employees.
We further strengthened governance processes during 2017 by establishing formal financial crime risk governance committees. This will help to ensure appropriate oversight and escalation of issues to the Financial Crime Risk Management Meeting of the bank’s Board.
We are working to develop enhanced risk management capabilities through better use of sophisticated analytical techniques.
We are also working to ensure that the reforms we have put in place are both effective and sustainable over the long term. Work in these areas will continue to be consistent with the terms of the orders by which we are bound and the strategic objectives of the Group.
Anti-bribery and corruption
During 2017, the Executive Committee monitored the local group’s progress on the implementation of Global Standards and Financial Crime Risk (FCR) Management. As part of the FCR framework, the Group has a global anti-bribery and corruption policy which is streamlined with local/foreign legislation, and global initiatives such as the Organisation of Economic Co-operation and Development (OECD) Convention. The local group continues to strengthen efforts to protect customers and the wider financial system from financial crime through further investments in technology and training.
The Committee also reviewed the activities underway to address key bribery and corruption risks and progress with the continued implementation of a revised, more robust anti-bribery and corruption compliance framework.
Risk management
The local group is exposed to a mixed blend of risks and hence operates a risk management strategy with the objective of controlling and minimising their impact on the financial performance and position of the local group.
An established risk governance framework and ownership structure ensures oversight of accountability for the effective management of risk. The local group’s risk management framework fosters the continuous monitoring of the risk environment and an integrated evaluation of risks and their interactions. The local group’s risk management framework is designed to provide appropriate risk monitoring and assessment. The Board sets the local group’s strategy risk appetite, operating plans and performance targets, thereby playing an essential role in embedding a risk culture within the organisation.
Specifically, the local group’s banking risks are credit risk, operational risk, market risk, liquidity and funding risk, regulatory, compliance risk and reputational risk. Owing to the group’s insurance operation in Malta, the local group is also exposed to insurance risk. The Board delegates the day to day risk management responsibilities to individuals within the senior management team. These individuals are accountable for their assigned risks, and report and escalate as necessary through the risk governance structures.
A detailed review of the risk management policies employed by the local group together with the exposures to credit risk, liquidity risk, market risk and insurance risk is included in Note 4 of the Financial Statements.
30
H S B C B A N K M A L T A p . l . c .
Report of the Directors (continued)
Branches and offices
A list of branches and offices is found on page 201.
Additional regulatory disclosures
Banking Rule 07 (Publication of Annual Report and Audited Financial Statements of Credit Institutions Authorised under the Banking Act 1994) partly repealed by certain provisions in the Capital Requirements Regulation (EU) No 575/2013 on prudential requirements for credit institutions and investment firms (CRR) is related to market discipline and aims to make credit institutions more transparent by requiring them to publish specific disclosures on the credit institution’s risk and capital management under the Basel III framework. However the local group is considered as a significant subsidiary of HSBC Holdings plc and therefore exempt, in terms of Article 24 of the revised BR 07 and Article 13 of the CRR, from certain risk disclosure requirements under Pillar 3, on the basis that such disclosures are required at the consolidated level which is HSBC Holdings plc level. HSBC Holdings plc publishes full Pillar 3 disclosures as a separate document on the HSBC Group Investor Relations website.
Shareholder register information pursuant to Listing Rule 5.64
The bank’s authorised share capital is €141,000,000. The issued and fully paid up capital is €108,091,829 divided into 360,306,099 ordinary shares of a nominal value of 30 cent each. The issued share capital consists of one class of ordinary shares with equal voting rights attached and are freely transferable.
The largest single shareholder of the bank, provided it holds at least thirty three per cent (33%) of the ordinary issued share capital of the bank, shall be entitled to appoint the Chairman from amongst the Directors appointed or elected to the Board.
Every shareholder owning eleven per cent (11%) of the ordinary issued share capital, shall be entitled to appoint one Director for each and every eleven per cent (11%) of the ordinary issued share capital of the bank owned by such shareholder. Any fractional shareholding not so utilised in the appointment of Director(s) shall be entitled to participate in the voting for the election of further Directors.
There is a Restricted Share Awards scheme in existence whereby employees in the GCB3 grade and higher can be awarded shares in HSBC Holdings plc. Share awards will be released to the individual staggered over three years, provided the participant remains continuously employed within the Group. Vesting of these awards are generally not subject to performance conditions. During the 3-year period the employee has no voting rights whatsoever.
The rules governing the appointment of Board members are contained in Articles 77 to 80 of the bank’s Articles of Association. An extraordinary resolution approved by the shareholders in the general meeting is required to amend the Articles of Association.
The powers of the Directors are outlined in Articles 73, 74 and 85 of the bank’s Articles of Association. In terms of Article 12 of the said Articles of Association, the bank may, subject to the provisions of the Companies Act, 1995, acquire or hold any of its shares.
The Collective Agreement regulates redundancies, early retirement, resignation or termination of employment of employees. There are no contracts between the bank and the Directors on the bank’s Board providing for compensation on resignation or termination of directorship.
It is hereby declared that the requirements pursuant to Listing Rules 5.64.7 and 5.64.10 that deal with agreements pertaining to changes in control of the bank did not apply to the bank as at 31 December 2017.
Shareholder register information
Directors’ interest in the share capital of the bank at 31 December 2017 was as follows:
Saviour sive Sonny Portelli 5,804 sharesJohn Bonello 40,742 shares
None of the shares in the bank’s subsidiary companies were held by Directors.
There were no changes to Directors’ interest from 31 December 2017 to 31 January 2018.
Shareholders holding five per cent (5%) or more of the equity capital at 31 January 2018:HSBC Europe B.V. 70.03%
Number of shareholders at 31 January 2018:One class of shares 9,652 shareholders(All shares have equal voting rights)
31
Number of shareholders analysed by range
31 January 2018
Range of shareholdingTotal
shareholders Shares
1 – 500 1,499 460,191501 – 1,000 1,225 926,2081,001 – 5,000 4,060 10,317,4265,001 and over 2,868 348,602,274
Total shareholding 9,652 360,306,099
Standard licence conditions applicable under the Investment Services Act, 1994
In accordance with the Malta Financial Services Authority (MFSA) Investment Services Rules (ISRs) Rule R4-5.3.5 for Investment Services Providers and the Standard Licence Conditions (SLCs) SLC 2.30 of the Investment Services Rules applicable to Investment Services Licence Holders which qualify as Custodians, and regulated by the Malta Financial Services Authority, licence holders are required to include breaches of Rules and Standard Licence Conditions applicable under the Investment Services Act, 1994, in the Report of the Directors.
Accordingly, the Directors report that during 2017 the Malta Financial Services Authority (MFSA) imposed an administrative fine of €10,000 on the bank as former Custodian of The Property Fund, a sub-fund of Global Capital Funds Sicav plc (the Scheme), due to a failure by the bank to exercise appropriate monitoring and oversight of the Scheme and the supervision of its Manager during the period 2006 – 2010. The bank was not involved in the sales process of the Fund and had no direct contact with individual investors. Throughout the resolution process the bank consistently upheld good governance standards, and demonstrated its goodwill by making a payment contribution in 2013 to the fund for the losses incurred. When deciding on the amount of the administrative penalty imposed on the bank, the MFSA considered the payment contribution made and also took into account the bank’s transparent and fair approach to resolve this matter.
Apart from the above, the Directors confirm that there were no other breaches of the MFSA’s Investment Services Rules, the Standard Licence Conditions and regulatory requirements.
Board of Directors
The Directors who served during the year and up till the date of this report are as follows:
Saviour sive Sonny PortelliAndrew BeanePhilip Farrugia Randon (resigned 13 April 2017)Alison Hewitt (appointed 19 May 2017)John BonelloAndrew MuscatChristopher DaviesJuanito Camilleri (resigned 1 February 2017)Gordon Cordina (appointed 1 February 2017)Maryanne sive Sue VellaYiannos Michaelides (appointed 26 May 2017)
32
H S B C B A N K M A L T A p . l . c .
Report of the Directors (continued)
Executive Committee
As at 31 December 2017, the bank’s Executive Committee of the local group was composed of the following:
Andrew Beane Chief Executive OfficerNikolaos Fertakis Chief Operating OfficerRashid Daurov Chief Financial OfficerDaniel Robinson Head of RBWMMichel Cordina Head of CMBIrina Seylanyan Head of GMGareth Williams Head of Human Resources (passed away 23 December 2017)Joyce Grech Chief Risk OfficerAnna Camilleri Head of Internal Audit Joseph Sammut General CounselSonya Khosla Head of Financial Crime ComplianceAnthony P. Abela Head of Regulatory CompliancePhilip Head Head of Financial Crime Compliance TransformationFranco Aloisio Head of CommunicationsGeorge Brancaleone Company Secretary
Auditors
PricewaterhouseCoopers have expressed their willingness to continue in office as auditors of the bank and the local group and a resolution proposing their reappointment will be put at the forthcoming Annual General Meeting.
Going concern
As required by Listing Rule 5.62, upon due consideration of the bank’s profitability and statement of financial position, capital adequacy and solvency, the Directors confirm the bank’s ability to continue operating as a going concern for the foreseeable future.
Statement by the Directors pursuant to Listing Rule 5.70.1
Pursuant to Listing Rule 5.70.1 there were no material contracts to which the bank, or anyone of its subsidiary undertakings, was party to and in which anyone of the Directors was directly or indirectly interested.
Statement by the Directors pursuant to Listing Rule 5.68
We, the undersigned, declare that to the best of our knowledge, the financial statements prepared in accordance with the requirements of International Financial Reporting Standards as adopted by the EU, give a true and fair view of the assets, liabilities, financial position and profit or loss of the bank and its subsidiaries and that this report includes a fair review of the development and performance of the business and the position of the bank and its subsidiaries, included in the consolidation taken as a whole, together with a description of the principal risks and uncertainties that they face.
Signed on behalf of the Board on 20 February 2018 by:
Sonny Portelli, Chairman Andrew Beane, Chief Executive Officer
33
H S B C B A N K M A L T A p . l . c .
Directors’ Responsibilities Statement
The Companies Act, 1995 requires the Directors of HSBC Bank Malta p.l.c. to prepare financial statements which give a true and fair view of the financial position of the local group and the bank as at the end of each period and of the profit or loss for that period. In preparing the financial statements, the Directors are responsible for:
• ensuring that the financial statements have been drawn up in accordance with the requirements of International Financial Reporting Standards as adopted by the EU;
• ensuring that the financial statements have been properly prepared in accordance with the provisions of the Companies Act, 1995 and the Banking Act, 1994;
• selecting and applying consistently suitable accounting policies;
• making accounting judgments and estimates that are reasonable; and
• ensuring that the financial statements are prepared on the going concern basis unless it is inappropriate to presume that the local group and the bank will continue in business as a going concern.
The Directors also assume responsibility for publishing Additional Regulatory Disclosure prepared in accordance with Pillar 3 quantitative and qualitative disclosure requirements as governed by Banking Rule 07 (Publication of Annual Report and Audited Financial Statements of Credit Institutions Authorised under the Banking Act 1994) and Regulation (EU) No 575/2013 (Capital Requirements Regulation). The local group is exempt from full regulatory disclosure requirements on the basis that such disclosures are required on a consolidated basis at the level of HSBC Holdings plc.
The Directors are also responsible for safeguarding the assets of the local group and hence for taking reasonable steps for the prevention and detection of fraud and other irregularities.
Through oversight of management, the Directors are responsible for ensuring that the bank and the local group establish and maintain internal control to provide reasonable assurance with regard to reliability of financial reporting, effectiveness and efficiency of operations, compliance with applicable laws and regulations, and as far as possible, the orderly and efficient conduct of the local group’s business. This responsibility includes establishing and maintaining controls pertaining to the preparation of financial statements and for managing risks that may give rise to material misstatements in those financial statements, whether due to fraud or error.
The financial statements of HSBC Bank Malta p.l.c. for the year ended 31 December 2017 are included in the Annual Report 2017, which is being published in printed form and made available on the bank’s website. The Directors are responsible for the maintenance and integrity of the Annual Report on the website in view of their responsibility for the controls over, and the security of, the website. Access to information published on the bank’s website is available in other countries and jurisdictions, where legislation governing the preparation and dissemination of financial statements may differ from requirements or practice in Malta.
Signed on behalf of the Board on 20 February 2018 by:
Sonny Portelli, Chairman Andrew Beane, Chief Executive Officer
34
H S B C B A N K M A L T A p . l . c .
Statement of Compliance with the Code of Principles of Good Corporate Governance
The Board of Directors (the ‘Board’) of HSBC Bank Malta p.l.c. is committed to the HSBC global values of dependability, openness to different ideas and cultures, and connection with customers, communities, regulators and each other. The Board ensures that each employee, through ongoing training, is aware of the obligation to ensure that his or her conduct consistently matches the bank values so as to serve positively the customers who entrust their financial needs to HSBC.
The Board is proud of the fact that the bank and its subsidiaries (the ‘ local group’) has a solid corporate governance framework that is built around the principles of control and accountability. This culture stems from a philosophy that puts the protection of investors and the interest of customers at the forefront.
Corporate governance is subject to regulation by the Malta Financial Services Authority Listing Rules. As a company whose equity securities are listed on a regulated market, HSBC Bank Malta p.l.c. endeavours to adopt the Code of Principles of Good Corporate Governance (the ‘Code’ or ‘Principles’) embodied in Appendix 5.1 to Chapter 5 of the Listing Rules. In terms of Listing Rule 5.94, the bank is obliged to disclose compliance and non-compliance with the provisions of the said Code. The bank strives to maintain the highest standards of disclosure in reporting the effective measures adopted to ensure compliance with the Principles, and to explain the instances of non-compliance.
Compliance with the Code
Principle 1: The Board
The bank is headed by an effective Board that leads and controls the business. The Board is composed of members who are honest, competent and solvent, and thus fit and proper to direct the business of the bank. Directors, individually and collectively, are of the appropriate calibre, having the necessary skills and experience to provide leadership, integrity and judgement in directing the bank. The courageous integrity, honesty and diligence of the Directors guarantee that the bank adheres to HSBC Group’s (the ‘Group’) highly ethical business values and this is ref lected in the bank’s decision and policy-making process. Through their effective contribution Directors enhance shareholders value, protect the bank’s assets and safeguard the interest of third parties.
Board members are accountable for their performance and that of their delegates to shareholders and relevant stakeholders. Besides having a broad knowledge of the bank’s business they are also conversant with the statutory and regulatory requirements regulating this business.
The Board determines the bank’s strategic aims and organisational structures and regularly reviews management performance. It ensures that the bank has the appropriate financial and human resources to meet its objectives. Moreover, it exercises prudent and effective controls which enable risk to be assessed and managed in order to achieve the short and long term sustainability of the business.
As part of a larger International Group the Board assesses the compatibility of Group policy with local legal and regulatory requirements, and where appropriate, amends those policies.
During the year the Board delegated specific responsibilities to a number of committees, namely the Audit Committee, the Risk Committee, the Remuneration and Nomination Committee, the Executive Committee and the Financial Crime Risk Management Committee. Further detail in relation to the committees and their responsibilities can be found under principle 4 of this statement.
The process of appointment of Directors is conducted in terms of the Memorandum and Articles of Association of the company which state that the Board is to consist of not more than nine Directors who are appointed/elected by the shareholders. Every shareholder owning 11 per cent of the ordinary share capital is entitled to appoint one Director for each 11 per cent shareholding. The majority shareholder therefore has the right to appoint six Directors. Furthermore, any excess fractional shareholding not so utilised may be used to participate in the voting for the election of further Directors. Shareholders who own less than 11 per cent of the ordinary share capital participate in the election of the remaining three Directors. The largest single shareholder (subject to a minimum 33 per cent holding of the ordinary issued share capital of the bank) is entitled to appoint a Chairman from amongst the Directors appointed or elected to the Board.
Principle 2: Chairman and Chief Executive Officer
The position of the Chairman and that of the Chief Executive Officer are occupied by different individuals. There is a clear division of responsibilities between the running of the Board and the Chief Executive Officer’s responsibility in managing the bank’s business. This separation of roles of the Chairman and Chief Executive Officer avoids concentration of authority and power in one individual and differentiates the function of leadership of the Board from that of running the business. The Chairman is independent in line with the Code’s independence criteria.
35
The Chairman leads the Board, sets the agenda and ensures that the Directors receive precise, timely and objective information and at the same time ensures effective communication with shareholders. During Board meetings, he encourages active engagement by all Board members for the discussion of complex and contentious issues and ensures that Directors constructively challenge senior management. The Chairman also facilitates the effective contribution of non-executive Directors and ensures constructive relations between executive and non-executive Directors.
The Chief Executive Officer develops, drives and delivers performance within strategic goals, commercial objectives and business plans agreed by the Board. He effectively leads the senior management in the day-to-day running of the bank, ensures compliance with appropriate policies and procedures and maintains an effective framework of internal controls over risk in relation to the business. He makes decisions in all matters affecting the operations, performance and strategy of the business, with the exception of those matters reserved for the Board or specifically delegated by the Board to its Committees. He is also responsible for the recruitment and appointment of senior management, after consultation with the Remuneration and Nomination Committee.
Principle 3: Composition of the Board
Experience has shown that the size of the Board is appropriate to facilitate the effective management and oversight over the bank’s operations. During 2017 the Board was composed of nine Directors. Each of the Directors is skilful, competent, knowledgeable and experienced to fulfil one’s role diligently. The Directors who held office during the year possess the requisite ability to assess business risk, to identify key performance indicators and participate in critical debate in the decision-making process.
Ethnicity, age, culture, and gender diversity, underpinned by meritocracy, are areas of strategic focus for the employee base and the same principle is applied to the composition of the Board in accordance with the Board Diversity Policy approved in February 2015. The bank remains committed to meritocracy in the Boardroom, which requires a diverse and inclusive culture where Directors believe that their views are heard, their concerns are attended to and they serve in an environment where bias, discrimination and harassment on any matter are not tolerated. The benefits of diversity, including that in educational and professional backgrounds, continue to influence the Remuneration and Nomination Committee’s Board succession planning and Board candidates’ selection process. This has resulted in a diverse Board composition with meets the diversity criteria in its widest aspect of ethnicity, age, culture, gender and educational and professional backgrounds.
The changes in the Board’s composition which took place during 2017 with the appointments of Dr Cordina, Ms Hewitt and Mr Michaelides as Directors reflected the Board’s continued adherence to its diversity policy. These appointments demonstrate regard to ethnicity, age, culture, and diversified expertise, ensuring a highly balanced and effective board composition.
As at 31 December 2017 the Board was composed of a non-executive Chairman, an executive Director and seven non-executive Directors, five of whom are deemed to be independent. The non-executive Directors bring an external perspective to the Board when they constructively challenge and help develop proposals on strategy, scrutinise the performance of management, and monitor the risk profile and the reporting of performance. They are proactive in ensuring that financial controls and risk management systems are well established and in satisfying themselves with the integrity of financial information.
Following the appropriate due diligence, the European Central Bank had given its non-objection to all the bank’s Directors. The letter of appointment issued to non-executive Directors stipulates the time commitment expected to be dedicated to the bank. Non-executive Directors undertake that they will have sufficient time to meet what is expected of them. Their other significant commitments are disclosed to the Board before their appointment and subsequent changes are notified to the Board.
In accordance with the Code Provision 3.2, the independent non-executive Directors as at 31 December 2017 were the following:
John BonelloGordon CordinaYiannos Michaelides Andrew Muscat Maryanne sive Sue Vella
In determining the independence or otherwise of its Directors, the Board has considered, inter alia, the principles relating to independence embodied in the Code, the local group’s own practice as well as general principles of good practice.
36
H S B C B A N K M A L T A p . l . c .
Statement of Compliance with the Code of Principles of Good Corporate Governance (continued)
The Board has determined that the fact that Professor Muscat is a partner in a Law firm which provides legal services to the bank and the fact that an economic consultancy firm in which Dr Gordon Cordina is non-executive director, provides consultancy services to the bank, do not in any way influence these Directors’ objective and balanced judgement or in any way reduce their ability to take decisions independently. On the other hand, in accordance with Code Provision 3.2.1, the Board believes that the employment of Chris Davies and Alison Hewitt with the Group renders these Directors non-independent from the bank. This should not however, in any manner, detract from the non-independent Directors’ ability to maintain independence of free judgement and character at all times and are able to make their own sound, objective, judgment and independent decisions and judgments when performing their functions and responsibilities.
In terms of Principle 3.4, each non-executive Director has confirmed in writing to the Board that he/she undertook:
• to maintain in all circumstances his/her independence of analysis, decision and action;
• not to seek or accept any unreasonable advantages that could be considered as compromising his/her independence; and
• to clearly express his/her opposition in the event that he/she finds that a decision of the Board may harm the bank.
Principle 4: The Responsibilities of the Board
The Board develops the bank’s strategy, policies and business plans. Two board informal meetings were held during 2017 focused on strategy review and development. The Board of Directors monitors effectively the implementation of strategy and policy by management within the parameters of all relevant laws, regulations and codes of best practice. The Board ensures that a balance is maintained between enterprise and control. The Board recognises and supports innovation within the management of the bank. The Board remains accountable to the shareholders for its performance and also ensures effective communication with the different groups of stakeholders.
The Board actively engages in the affairs of the bank and keeps up with material changes in the bank’s business and the external environment as well as act in a timely manner to protect the long-term interests of the bank. It plays a leading role in establishing the bank’s corporate culture and values. The Board, together with senior management and the Chief Risk Officer establishes the bank’s risk appetite, taking into account the commercial and regulatory landscape and the bank’s long-term interests, risk exposure and ability to manage risk effectively. It also oversees the bank’s adherence to the Risk Appetite Statement, risk policy and risk limits. The Board is also responsible for approving the approach and overseeing the implementation of key policies pertaining to the bank’s capital adequacy assessment process, capital and liquidity plans, compliance policies and obligations and the internal control system. The Board, through one of its Directors who reports to the Board, oversees the integrity, independence and effectiveness, of the bank’s policies and procedures for whistle blowing.
The regular evaluation of management’s implementation of corporate strategy and financial obligations is based on the use of key performance indicators enabling the bank to adopt expedient corrective measures. These key business risk and performance indicators are benchmarked against industry norms so as to ensure that the bank’s performance is effectively evaluated.
The Board ensures that the bank has appropriate policies and procedures in place that guarantee that the bank and its employees adhere to the highest standards of corporate conduct and comply with the applicable laws, regulations, business and ethical standards.
An effective reporting system that enables the Directors to have relevant and timely information such that the Board can discharge its duties, exercise objective judgement and take pertinent decisions is implemented through:
• presentations during Board meetings delivered by senior management;
• updates provided by the CEO and senior management during intervals between Board/committees’ meetings; and
• accessibility to a common electronic platform hosting bank information, including bank/committees’ documentation and minutes of meetings.
The Board makes certain that its level of power is known by all Directors and the senior management of the bank. Any delegation of responsibility and functions is clearly documented in the Terms of Reference (TOR) embodied in the corporate governance framework.
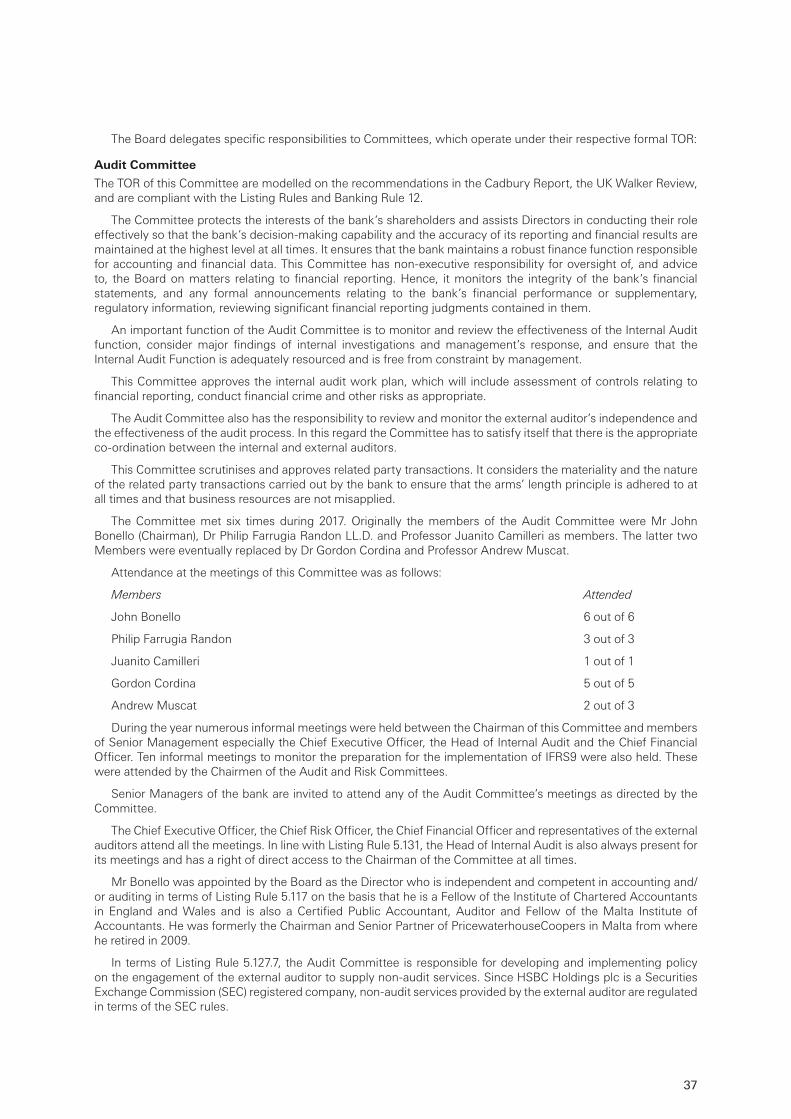
37
The Board delegates specific responsibilities to Committees, which operate under their respective formal TOR:
Audit Committee
The TOR of this Committee are modelled on the recommendations in the Cadbury Report, the UK Walker Review, and are compliant with the Listing Rules and Banking Rule 12.
The Committee protects the interests of the bank’s shareholders and assists Directors in conducting their role effectively so that the bank’s decision-making capability and the accuracy of its reporting and financial results are maintained at the highest level at all times. It ensures that the bank maintains a robust finance function responsible for accounting and financial data. This Committee has non-executive responsibility for oversight of, and advice to, the Board on matters relating to financial reporting. Hence, it monitors the integrity of the bank’s financial statements, and any formal announcements relating to the bank’s financial performance or supplementary, regulatory information, reviewing significant financial reporting judgments contained in them.
An important function of the Audit Committee is to monitor and review the effectiveness of the Internal Audit function, consider major findings of internal investigations and management’s response, and ensure that the Internal Audit Function is adequately resourced and is free from constraint by management.
This Committee approves the internal audit work plan, which will include assessment of controls relating to financial reporting, conduct financial crime and other risks as appropriate.
The Audit Committee also has the responsibility to review and monitor the external auditor’s independence and the effectiveness of the audit process. In this regard the Committee has to satisfy itself that there is the appropriate co-ordination between the internal and external auditors.
This Committee scrutinises and approves related party transactions. It considers the materiality and the nature of the related party transactions carried out by the bank to ensure that the arms’ length principle is adhered to at all times and that business resources are not misapplied.
The Committee met six times during 2017. Originally the members of the Audit Committee were Mr John Bonello (Chairman), Dr Philip Farrugia Randon LL.D. and Professor Juanito Camilleri as members. The latter two Members were eventually replaced by Dr Gordon Cordina and Professor Andrew Muscat.
Attendance at the meetings of this Committee was as follows:
Members Attended
John Bonello 6 out of 6
Philip Farrugia Randon 3 out of 3
Juanito Camilleri 1 out of 1
Gordon Cordina 5 out of 5
Andrew Muscat 2 out of 3
During the year numerous informal meetings were held between the Chairman of this Committee and members of Senior Management especially the Chief Executive Officer, the Head of Internal Audit and the Chief Financial Officer. Ten informal meetings to monitor the preparation for the implementation of IFRS9 were also held. These were attended by the Chairmen of the Audit and Risk Committees.
Senior Managers of the bank are invited to attend any of the Audit Committee’s meetings as directed by the Committee.
The Chief Executive Officer, the Chief Risk Officer, the Chief Financial Officer and representatives of the external auditors attend all the meetings. In line with Listing Rule 5.131, the Head of Internal Audit is also always present for its meetings and has a right of direct access to the Chairman of the Committee at all times.
Mr Bonello was appointed by the Board as the Director who is independent and competent in accounting and/ or auditing in terms of Listing Rule 5.117 on the basis that he is a Fellow of the Institute of Chartered Accountants in England and Wales and is also a Certified Public Accountant, Auditor and Fellow of the Malta Institute of Accountants. He was formerly the Chairman and Senior Partner of PricewaterhouseCoopers in Malta from where he retired in 2009.
In terms of Listing Rule 5.127.7, the Audit Committee is responsible for developing and implementing policy on the engagement of the external auditor to supply non-audit services. Since HSBC Holdings plc is a Securities Exchange Commission (SEC) registered company, non-audit services provided by the external auditor are regulated in terms of the SEC rules.
38
H S B C B A N K M A L T A p . l . c .
Statement of Compliance with the Code of Principles of Good Corporate Governance (continued)
Risk Committee
This Committee is responsible for advising the Board on high level risk related matters. In providing such oversight and advice to the Board, the Committee oversees: current and forward looking risk exposures, the bank’s risk appetite and future risk strategy, including capital and liquidity management strategy, and management of risk within the bank.
In undertaking its responsibility to review the effectiveness of the bank’s risk management framework and internal controls it has to inter alia satisfy itself that that there are adequate procedures for monitoring in a sufficiently timely and accurate manner, large exposures or risk types whose relevance may become of critical importance. It also has to consider any material findings from regulatory reviews and interactions with regulators in relation to risk governance or risk assessment or management process. Moreover, it needs to discuss the internal control systems with management to ensure that management has discharged its duty to have an effective internal control system.
The Committee met five times during 2017. The composition of the Risk Committee was composed of Professor Juanito Camilleri, as Chairman and later substituted by Dr Gordon Cordina, and by Dr Philip Farrugia Randon LL.D, later substituted by Mr Yiannos Michaelides, and Mr John Bonello as Members.
Attendance at the meetings of this Committee was as follows:
Members Attended
Juanito Camilleri 1 out of 1
Philip Farrugia Randon 2 out of 2
Gordon Cordina 4 out of 4
John Bonello 5 out of 5
Yiannos Michaelides 2 out of 2
Senior Managers of the bank are invited to attend any of the meetings as directed by the Committee.
The Chief Executive Officer, the Chief Risk Officer, the Chief Financial Officer, the Head of Financial Crime Compliance and the Head of Regulatory Compliance and representatives of the external auditors are invited to attend the meetings. Alison Hewitt, another Board Director, was appointed as General Advisor to the Committee.
Remuneration and Nomination Committee (REMNOM Committee)
The remuneration aspect of this Committee is dealt with under the Remuneration Report, which also includes the Remuneration Statement in terms of Code Provision 8.A.4.
In its nomination function, the Committee is primarily tasked with identifying and nominating new Board and Board Committees’ candidates for the approval of the Board and to periodically assess the structure, size, composition and performance of the Board and make recommendations to the Board with regard to any changes. It is also tasked with considering issues related to succession planning and reviewing the policy of the Board for selection and appointment of senior management.
This Committee is also responsible to periodically assess the skills, knowledge and experience of individual Directors and report on this to the Board. The Committee always tries to achieve consensus on the recommendations it makes to the Board. Where such consensus is not reached, decisions are made by a majority vote, recording the reasons behind the dissent.
During 2017 REMNOM met seven times and it continued to perform its role regarding ‘fit and proper’ assessments of present and prospective and Board Members. The results of these assessments are then submitted to the Regulator as an integral part of the Regulator’s due diligence exercise.
The members of the REMNOM were Mr Sonny Portelli (Chairman), Professor Andrew Muscat and Dr Maryanne sive Sue Vella as members.
Financial Crime Risk Management Committee (FCRMC)
This Committee was set up directly by the Board in May 2017 and replaced the former Financial Crime Compliance EXCO which used to derive its authority from the Risk Management Meeting. This change underlines the importance that the bank, in line with Group policy, is giving to Financial Crime Risk Compliance. The Committee provides on-going oversight, management and communication of Financial Crime Compliance (FCC) risks, issues and changes impacting the business lines. FCC includes Anti-Money Laundering (AML), Sanctions, Anti-Bribery and Corruption. The membership of this Committee, which is chaired by the bank’s Chief Executive Officer, is composed of most of the bank’s EXCO team, the Head of Anti-Money Laundering/Money Laundering Reporting Officer, the Sanctions and Anti-Bribery and Corruption Lead and the Global Standards Execution Lead.
39
Executive Committee (EXCO)
EXCO meets on a monthly basis to oversee the overall day-to-day management of the bank in accordance with such policies and directions as the Board may from time to time determine. The Chief Executive Officer chairs this Committee which is composed of members of the senior management of the bank. EXCO is empowered by its terms of reference to delegate its powers to sub-committees:
• Risk Management Meeting (RMM)This Committee meets 10 times a year and is chaired by the Chief Risk Officer, with the Chief Executive Officer as alternate chairman. Membership also includes all other EXCO members, namely the Chief Operating Officer, the Chief Financial Officer, the Head of Retail Banking and Wealth Management, the Head of Commercial Banking, the Head of Global Markets, the Head of Internal Audit, the General Counsel, the Head of Regulatory Compliance, the Head of Financial Crime Compliance, the Head of Financial Crime Compliance Transformation, the Company Secretary and the Head of Communications.
The Risk Management Meeting (RMM) is a formal governance committee established to provide recommendations and advice requested to the HSBC Bank Malta p.l.c. Chief Risk Officer on enterprise-wide management of all risks, including key policies and frameworks for the management of risk within the Country. It supports the Chief Risk Officer’s individual accountability for the oversight of enterprise risk. The RMM serves as the governance body for enterprise-wide risk management with particular focus on risk culture, risk appetite, risk profile and integration of risk management into the bank’s strategic objectives. By carrying out the above responsibilities the RMM meets the BCBS requirements of reviewing regular risk management reports which enable the RMM to assess the risks involved in the bank’s business and how they are controlled and monitored and give clear, explicit and dedicated focus to current and forward looking aspects of risk
The RRM is also responsible for the setting and monitoring of a Risk Appetite Framework for EXCO and Board approval, signing off on material credit risk models, and consideration of top and emerging risks and scenario analysis. Individual risk acceptance and approval is not within the TOR of the Committee, and continues to be approved under existing delegated authorities within the management structure of the bank.
Minutes of meetings of this Committee are circulated to the members of the Board. The Chief Risk Officer is also invited to attend Board meetings and meetings of the Audit and Risk Committees in which representations are made about the overall risk profile associated with the business including a comprehensive assessment of the bank’s management of risk.
• Asset and Liability Management Committee (ALCO)ALCO is responsible for managing the balance sheet with a view to achieve efficient allocation and utilisation of all resources.
This Committee reviews the financial risks of the local group and oversees the prudent management of interest rate risk, liquidity and funding risk, capital, foreign exchange risk, solvency risk, market sector risk and country risk. Furthermore, ALCO monitors the external environment and measures the impact on profitability of factors such as interest rate volatility, market liquidity, exchange rate volatility, monetary and fiscal policies and competitor banks’ activity. ALCO monitors the liquidity and capital adequacy, making use of capital forecasts to ensure that enough capital is readily available at all times to meet the demand arising from business expansion and regulation. ALCO monitors and reviews the duration and cash flow matching of assets and liabilities.
The Chief Executive Officer has primary responsibility for ensuring efficient development of Asset and Liability Management. Membership consists of senior executives with responsibility for the following functions: commercial banking, retail banking and wealth management, global markets, finance, insurance services, asset and liability capital management, customer value management and payments and cash management. ALCO, which is chaired by the Chief Financial Officer and deputised by the Chief Executive Officer, meets once a month. The Chief Accounting Officer is also a member of this Committee.
In the selection of the above Committees’ chairmanship and membership, there is recognition of the value in refreshing said appointments and in ensuring that no undue reliance is placed on particular individuals.
Principle 5: Board Meetings
The Board meets as often and as frequently required to discharge its duties effectively. During the period under review the Board held nine meetings and another five informal meetings.
The Chairman ensures that all relevant issues are on the agenda and supported by all the available information. The agenda strikes a balance between long-term strategic objectives and short-term performance issues. Notice of the dates of Board meetings together with supporting materials are circulated to the Directors well in advance of the meetings.
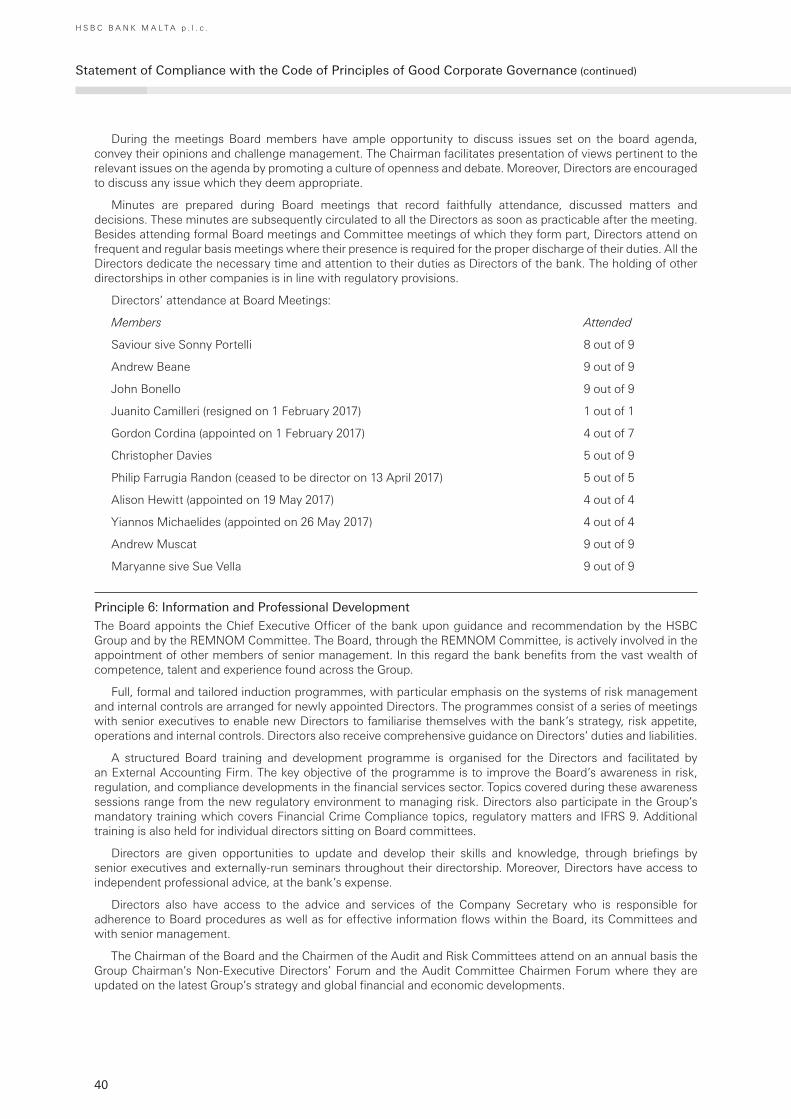
40
H S B C B A N K M A L T A p . l . c .
Statement of Compliance with the Code of Principles of Good Corporate Governance (continued)
During the meetings Board members have ample opportunity to discuss issues set on the board agenda, convey their opinions and challenge management. The Chairman facilitates presentation of views pertinent to the relevant issues on the agenda by promoting a culture of openness and debate. Moreover, Directors are encouraged to discuss any issue which they deem appropriate.
Minutes are prepared during Board meetings that record faithfully attendance, discussed matters and decisions. These minutes are subsequently circulated to all the Directors as soon as practicable after the meeting. Besides attending formal Board meetings and Committee meetings of which they form part, Directors attend on frequent and regular basis meetings where their presence is required for the proper discharge of their duties. All the Directors dedicate the necessary time and attention to their duties as Directors of the bank. The holding of other directorships in other companies is in line with regulatory provisions.
Directors’ attendance at Board Meetings:
Members Attended
Saviour sive Sonny Portelli 8 out of 9
Andrew Beane 9 out of 9
John Bonello 9 out of 9
Juanito Camilleri (resigned on 1 February 2017) 1 out of 1
Gordon Cordina (appointed on 1 February 2017) 4 out of 7
Christopher Davies 5 out of 9
Philip Farrugia Randon (ceased to be director on 13 April 2017) 5 out of 5
Alison Hewitt (appointed on 19 May 2017) 4 out of 4
Yiannos Michaelides (appointed on 26 May 2017) 4 out of 4
Andrew Muscat 9 out of 9
Maryanne sive Sue Vella 9 out of 9
Principle 6: Information and Professional Development
The Board appoints the Chief Executive Officer of the bank upon guidance and recommendation by the HSBC Group and by the REMNOM Committee. The Board, through the REMNOM Committee, is actively involved in the appointment of other members of senior management. In this regard the bank benefits from the vast wealth of competence, talent and experience found across the Group.
Full, formal and tailored induction programmes, with particular emphasis on the systems of risk management and internal controls are arranged for newly appointed Directors. The programmes consist of a series of meetings with senior executives to enable new Directors to familiarise themselves with the bank’s strategy, risk appetite, operations and internal controls. Directors also receive comprehensive guidance on Directors’ duties and liabilities.
A structured Board training and development programme is organised for the Directors and facilitated by an External Accounting Firm. The key objective of the programme is to improve the Board’s awareness in risk, regulation, and compliance developments in the financial services sector. Topics covered during these awareness sessions range from the new regulatory environment to managing risk. Directors also participate in the Group’s mandatory training which covers Financial Crime Compliance topics, regulatory matters and IFRS 9. Additional training is also held for individual directors sitting on Board committees.
Directors are given opportunities to update and develop their skills and knowledge, through briefings by senior executives and externally-run seminars throughout their directorship. Moreover, Directors have access to independent professional advice, at the bank’s expense.
Directors also have access to the advice and services of the Company Secretary who is responsible for adherence to Board procedures as well as for effective information flows within the Board, its Committees and with senior management.
The Chairman of the Board and the Chairmen of the Audit and Risk Committees attend on an annual basis the Group Chairman’s Non-Executive Directors’ Forum and the Audit Committee Chairmen Forum where they are updated on the latest Group’s strategy and global financial and economic developments.
41
As part of succession planning and talent management, the Board and the Chief Executive Officer ensure that the bank implements appropriate schemes to recruit, retain and motivate high quality executive officers. They also encourage members of management to move to the higher ranks within the organisation and seek to maintain high morale amongst the bank’s personnel.
Principle 7: Evaluation of the Board Performance
During the year the Board undertook an evaluation of its own performance, the Chairman’s performance and that of its Committees through a Board Effectiveness Questionnaire modelled on a questionnaire adopted by Group. This process was conducted by the REMNOM Committee through the support of the Company Secretary. No material changes in the governance structures and organisation resulted from this Board evaluation exercise.
Principle 8: Committees
The Remuneration and Nomination Committee is covered under Principle 4 and in the Remuneration Report, which also includes the Remuneration Statement in terms of Code provisions 8.A.4.
Principles 9 and 10: Relations with Shareholders, with the Market, and with Institutional Shareholders
The bank maintains on-going communication with its shareholders and the market on its strategy and performance in order to enhance trust and confidence in the bank. During the period under review the bank issued various company announcements and media releases to explain ongoing corporate developments and material events and transactions which have taken place and their impact on the financial position of the bank.
The bank communicates with shareholders in the following ways:
• through the ‘Annual Report and Accounts’ which is mailed to every shareholder and is available on the bank’s website;
• through the publication of company announcements and media releases; and
• at the Annual General Meeting and Extraordinary General Meetings (further detail is provided under the section ‘General Meetings’).
The bank also holds meetings for stockbrokers, financial intermediaries and the media to explain the salient features of the interim and annual financial results.
The bank maintains an open channel of communication with its shareholders through the Company Secretarial Office and through the Head of Communications. Meetings have also been held between the Chief Executive Officer and the Malta Association of Small Shareholders.
As the Board always endeavours to protect the interests of both the bank and its shareholders, present and future, the Board takes into account the fact that shareholders are constantly changing. This is reflected in the Board’s decisions on long-term sustainability objectives to safeguard the interests of future shareholders. The Chairman ensures that the views of shareholders are communicated to the Board. Moreover, the Chairmen of the Audit Committee, of the Risk Committee and of the REMNOM Committee are available to answer questions during the Annual General Meeting. The conduct of the meeting is conducive to valid discussion and appropriate decision making.
In terms of the bank’s Articles of Association, the Directors shall, on the request of members of the company holding not less than one-tenth of the paid up share capital, proceed duly to convene an Extraordinary General Meeting of the bank.
Principle 11: Conflicts of Interests
Directors are aware that their primary responsibility is always to act in the interest of the bank and its shareholders as a whole, irrespective of who appointed them to the Board. This requires that they avoid conflicts of interest at all times and that their personal interests never take precedence over those of the bank and its shareholders.
In line with HSBC Group best practice, the Board operates a Conflicts Policy. In terms of this policy a Director is to avoid situations in which he or she has, or could have, a direct or indirect interest that conflicts, or possibly may conflict, with the interest of the bank. Without prejudice to Articles 136A (3)(C) and 143 of the Companies Act, this policy stipulates that a director must obtain an authorisation from the Board before a situational conflict arises. Notably, in accordance with this policy, all directorships and other non-HSBC appointments should be authorised by the Board.
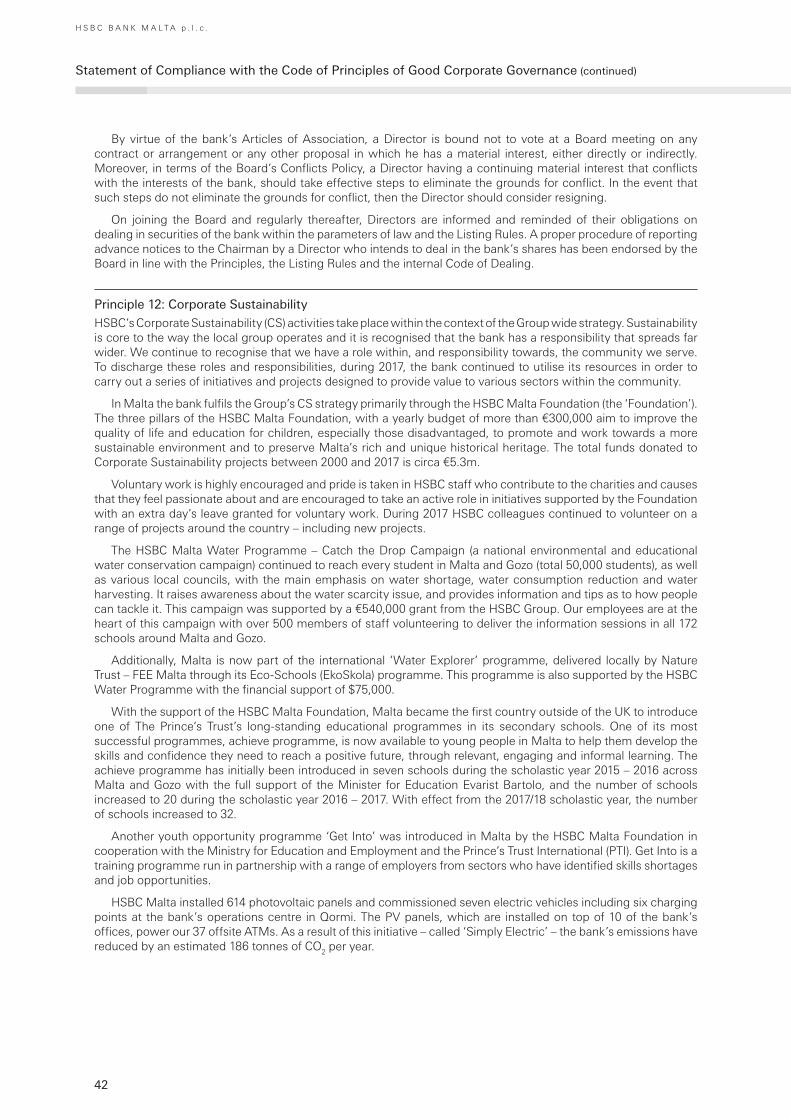
42
H S B C B A N K M A L T A p . l . c .
Statement of Compliance with the Code of Principles of Good Corporate Governance (continued)
By virtue of the bank’s Articles of Association, a Director is bound not to vote at a Board meeting on any contract or arrangement or any other proposal in which he has a material interest, either directly or indirectly. Moreover, in terms of the Board’s Conflicts Policy, a Director having a continuing material interest that conflicts with the interests of the bank, should take effective steps to eliminate the grounds for conflict. In the event that such steps do not eliminate the grounds for conflict, then the Director should consider resigning.
On joining the Board and regularly thereafter, Directors are informed and reminded of their obligations on dealing in securities of the bank within the parameters of law and the Listing Rules. A proper procedure of reporting advance notices to the Chairman by a Director who intends to deal in the bank’s shares has been endorsed by the Board in line with the Principles, the Listing Rules and the internal Code of Dealing.
Principle 12: Corporate Sustainability
HSBC’s Corporate Sustainability (CS) activities take place within the context of the Group wide strategy. Sustainability is core to the way the local group operates and it is recognised that the bank has a responsibility that spreads far wider. We continue to recognise that we have a role within, and responsibility towards, the community we serve. To discharge these roles and responsibilities, during 2017, the bank continued to utilise its resources in order to carry out a series of initiatives and projects designed to provide value to various sectors within the community.
In Malta the bank fulfils the Group’s CS strategy primarily through the HSBC Malta Foundation (the ‘Foundation’). The three pillars of the HSBC Malta Foundation, with a yearly budget of more than €300,000 aim to improve the quality of life and education for children, especially those disadvantaged, to promote and work towards a more sustainable environment and to preserve Malta’s rich and unique historical heritage. The total funds donated to Corporate Sustainability projects between 2000 and 2017 is circa €5.3m.
Voluntary work is highly encouraged and pride is taken in HSBC staff who contribute to the charities and causes that they feel passionate about and are encouraged to take an active role in initiatives supported by the Foundation with an extra day’s leave granted for voluntary work. During 2017 HSBC colleagues continued to volunteer on a range of projects around the country – including new projects.
The HSBC Malta Water Programme – Catch the Drop Campaign (a national environmental and educational water conservation campaign) continued to reach every student in Malta and Gozo (total 50,000 students), as well as various local councils, with the main emphasis on water shortage, water consumption reduction and water harvesting. It raises awareness about the water scarcity issue, and provides information and tips as to how people can tackle it. This campaign was supported by a €540,000 grant from the HSBC Group. Our employees are at the heart of this campaign with over 500 members of staff volunteering to deliver the information sessions in all 172 schools around Malta and Gozo.
Additionally, Malta is now part of the international ‘Water Explorer’ programme, delivered locally by Nature Trust – FEE Malta through its Eco-Schools (EkoSkola) programme. This programme is also supported by the HSBC Water Programme with the financial support of $75,000.
With the support of the HSBC Malta Foundation, Malta became the first country outside of the UK to introduce one of The Prince’s Trust’s long-standing educational programmes in its secondary schools. One of its most successful programmes, achieve programme, is now available to young people in Malta to help them develop the skills and confidence they need to reach a positive future, through relevant, engaging and informal learning. The achieve programme has initially been introduced in seven schools during the scholastic year 2015 – 2016 across Malta and Gozo with the full support of the Minister for Education Evarist Bartolo, and the number of schools increased to 20 during the scholastic year 2016 – 2017. With effect from the 2017/18 scholastic year, the number of schools increased to 32.
Another youth opportunity programme ‘Get Into’ was introduced in Malta by the HSBC Malta Foundation in cooperation with the Ministry for Education and Employment and the Prince’s Trust International (PTI). Get Into is a training programme run in partnership with a range of employers from sectors who have identified skills shortages and job opportunities.
HSBC Malta installed 614 photovoltaic panels and commissioned seven electric vehicles including six charging points at the bank’s operations centre in Qormi. The PV panels, which are installed on top of 10 of the bank’s offices, power our 37 offsite ATMs. As a result of this initiative – called ‘Simply Electric’ – the bank’s emissions have reduced by an estimated 186 tonnes of CO
2 per year.
43
Non-Compliance with the Code
Principle 4 (Code Provision 4.2.7)
Code Provision 4.2.7 recommends ‘the development of a succession policy for the future composition of the Board of Directors and particularly the executive component thereof, for which the Chairman should hold key responsibility’. The bank discloses that it has not formalised a Board succession policy. However, in practice the REMNOM Committee is actively involved in the board succession, specifically in recommending the appointment of new members and also by evaluating any newly proposed appointees.
Principle 9 (Code Provision 9.3)
This Code Provision recommends the bank to have in place a mechanism to resolve conflicts between minority shareholders and controlling shareholders. Although the bank does not have such mechanism in place there is ongoing open dialogue between the bank’s senior management and the non-executive Directors to ensure that no such conflicts arise.
In terms of Code Provision 9.4 minority shareholders should be allowed to formally present an issue to the Board of Directors. The bank discloses that it does not have a policy in terms of this code provision.
Internal control
The Board is ultimately responsible for the bank’s system of internal control and for reviewing its effectiveness. Such procedures are designed to manage and mitigate rather than to eliminate the risk of failure, to achieve business objectives and can only provide reasonable and not absolute assurance against material error, losses or fraud. The Group has reviewed the risk management and internal control structure referred to as the ‘three lines of defence’ to ensure we achieve our commercial aims while meeting regulatory, legal as well as Group requirements. It is a key part of our operational risk management framework.
• First line – The First Line of Defence consists of ‘Risk Owners’ and ‘Control Owners’. The bank’s Global Business employees are the ‘Risk Owners’. They own the risk, set the risk appetite and are accountable for managing the risk associated with their commercial activities. In managing the risk they are responsible to both manage their own controls and work closely with other Control Owners who sit outside of their area. ‘Control Owners’ exist in Global Businesses, Global Functions and HTS (HSBC Technology Services). They are accountable for the controls required to manage the risk associated with our commercial activities. They are required to monitor and provide an opinion on the effectiveness of the controls relied upon by the Risk Owners to manage their risk(s).
• Second line – The Second Line of Defence consists of ‘Risk Stewards’ and their teams. It is made up in part (but not exclusively) by leaders within Global Risk and other Global Functions. They set policy, give advice and provide independent challenge. In doing this, they oversee and assess the risk management activities carried out by the First Line. The Risk Stewards set the overall maximum risk appetite for their particular risk type (e.g. financial crime risk, regulatory compliance risk, legal risk, tax risk, accounting risk, people risk, fraud risk) and support the Risk Owners with setting their risk appetite within Group’s overall risk appetite.
• Third line – The Third Line of Defence is Global Internal Audit, and it independently assures that the design and operating effectiveness of Group’s framework of risk management, governance and internal control are adequate.
The local group’s key risk management and internal control procedures include the following:
• Global standards. Functional, operating, financial reporting and certain management reporting standards are established by global function management committees, for application throughout HSBC globally. These are supplemented by operating standards set by functional and local management as required for the type of business and geographical location of each subsidiary.
• Delegation of authority within limits set by the Board. The Board has delegated specific, clear and unequivocal authority to the Chief Executive Officer to manage the day-to-day affairs of the business for which he is accountable within limits set by the Board. Delegation of authority from the Board requires the CEO to maintain appropriate apportionment of significant responsibilities and to oversee the establishment and maintenance of systems of control that are appropriate to the business.
44
H S B C B A N K M A L T A p . l . c .
Statement of Compliance with the Code of Principles of Good Corporate Governance (continued)
• Risk identification and monitoring. Systems and procedures are in place to identify, control and report on the major risks facing the bank including credit, market, liquidity, capital, financial management, model, reputational, strategic, sustainability and operational (including accounting, tax, legal, compliance, fiduciary, information, external fraud, internal fraud, political, physical, business continuity, systems operations, project and people risk). Exposure to these risks is monitored by the Risk Management Meeting, Asset and Liability Committee and Executive Committee.
• Changes in market conditions/practices. Processes are in place to identify new risks arising from changes in market conditions/practices or customer behaviours, which could expose the bank to heightened risk of loss or reputational damage. During 2017, the focus on actions to address the risks arising from the bank’s exposure to Financial Crime risks continued from the prior year. In addition attention remained focused on regulatory developments including the first year of the Single Supervisory Mechanism; regulatory commitments and consent orders including the Deferred Prosecution Agreement; challenges to achieving our strategy in a downturn; internet crime and fraud; level of change creating operational complexity and heightened execution risk; information security risk.
• IT operations. Centralised functional control is exercised over all IT developments and operations. In order to ensure consistency and benefit from economies of scale Common Group systems are employed for similar business processes wherever practicable.
• Comprehensive annual financial plans are prepared, reviewed and approved by the Board. Results are monitored and progress reports are prepared on a monthly basis to enable comparisons with plan. Financial accounting and management reporting standards have been established.
• Responsibilities for financial performance against plans and for capital expenditure, credit exposures and market risk exposures are delegated with limits to executive management. In addition, functional management in the bank has been given the responsibility to implement HSBC policies, procedures and standards for business and product lines; finance; legal and regulatory compliance; internal audit; human resources; credit risk; market risk; operational risk; computer systems and operations and property management.
• The Chief Risk Officer is responsible for the management of specific risks within the bank including credit risk in the wholesale and retail portfolios, markets risk and operational risk. Risks are monitored via Risk Management Meeting which meets regularly and via reporting to the Executive Committee, the Risk Committee and to the Board.
• Internal Audit. The establishment and maintenance of appropriate systems of risk management and internal control is primarily the responsibility of business management. The Internal Audit function reports to the Board. It provides independent and objective assurance in respect of adequacy of the design and operating effectiveness of the bank’s framework of risk management, control and governance processes focusing on the areas of greatest risk to the bank using a risk-based approach. The Head of Internal Audit also reports to the Head of Global Internal Audit in so far as independence and resourcing are concerned.
• Internal Audit issues. Executive management is responsible for ensuring that any issues raised by the Internal Audit function are remediated within an appropriate and agreed timetable. Confirmation to this effect must be provided to Internal Audit who subsequently validate the remediation.
• The bank’s Compliance Department ensures that the local group maintains the highest standards of corporate conduct including compliance with all the local and international regulatory obligations and HSBC Group ethical standards and regulations.
• Through the Audit Committee and Risk Committee, the Board reviews the processes and procedures to ensure the effectiveness of the system of internal control of the bank and its subsidiaries, which are monitored by Internal Audit.
Listing Rule 5.97.5
The information required by this Listing rule is found in the Directors’ Report.

45
General meetings
The General Meeting is the highest decision making body of the bank. A General Meeting is called by twenty-one days’ notice and it is conducted in accordance with the Articles of Association of the bank.
The Annual General Meeting deals with what is termed as ‘ordinary business’, namely the receiving or adoption of the annual financial statements, the declaration of a dividend, the appointment and remuneration of the Board (which may or may not involve an election), the appointment of the external auditors and the grant of the authority to the Board to fix the external auditors’ emoluments. Other business which may be transacted at a General Meeting will be dealt with as Special Business.
All shareholders registered in the shareholders’ Register on the record date as defined in the Listing Rules, have the right to attend, participate and vote in the General Meeting. A shareholder or shareholders holding not less than 5% in nominal value of all the shares entitled to vote at the General Meeting may request the bank to include items on the agenda of a General Meeting and/or table draft resolutions for items included in the agenda of a general meeting. Such requests are to be received by the bank at least forty-six days before the date set for the relative General Meeting. A shareholder who is unable to participate in the General Meeting can appoint a proxy by written or electronic notification to the bank. Every shareholder represented in person or by proxy is entitled to ask questions which are pertinent and related to items on the agenda of the General Meeting and to have such questions answered by the Directors or such persons as the Directors may delegate for that purpose.
46
H S B C B A N K M A L T A p . l . c .
Remuneration Report
Governance
Role of the Remuneration Committee
The bank’s Remuneration and Nomination Committee (the Committee) within its remuneration oversight responsibilities is primarily responsible for making recommendations on the reward policy, on fixed and variable pay, and for ensuring their implementation.
The Committee is responsible for recommending to the HSBC Bank Malta p.l.c. Board of Directors (Board) the approvals of the total compensation spend within an annual operating plan.
The Chief Risk Officer regularly informs the Committee of risk related issues across the bank to ensure that such matters are considered by the Committee in applying the Policy and making remuneration decisions for the recommendation to the Board. The Chief Risk Officer also updates the Board on the bank’s performance against the Risk Appetite Statement, which describes and measures the amount and types of risk that the bank is prepared to take in executing its strategy. The Board uses these updates in applying the Policy and considering the risk related adjustments made to the variable pay pool, to ensure that return, risk and remuneration are aligned.
The Committee works in conjunction with the HSBC Group Remuneration Committee (the Group’s Committee). However it has its own Terms of Reference, which sets out its key responsibilities in relation to HSBC Bank Malta p.l.c.
Membership & Meetings
The Committee was composed of Mr Saviour sive Sonny Portelli as Chairman, Dr Maryanne sive Sue Vella and Professor Andrew Muscat as members of the committee.
Seven meetings were held by the Committee during 2017 and were attended as follows:
Saviour sive Sonny Portelli (7 out of 7)
Andrew Muscat (6 out of 7)
Maryanne sive Sue Vella (7 out of 7)
During the year, the Chief Executive Officer attended all the Committee’s meetings. The Head of HR and the Chief Risk Officer attended some of the meetings of the Committee when deemed appropriate. None of the executives participated in the discussion regarding their own remuneration.
In 2017, the Committee did not engage any external adviser. It will only seek specific legal and/or remuneration advice independently as and when it considers this to be necessary.
Remuneration Strategy and Policy, and the link to Performance and Risk
HSBC Bank Malta p.l.c. remuneration policy
The bank’s remuneration strategy is designed to reward competitively the achievement of long-term sustainable performance and attract and motivate the very best people who are committed to a long-term career with the HSBC Group in the long-term interests of our shareholders.
In 2014, new regulatory requirements were introduced under the EU’s Capital Requirements Directive (CRD) IV. The consequential changes to the remuneration rules have influenced the bank’s remuneration policy, particularly with respect to those employees identified as having a material impact on the bank’s risk profile, being termed as Material Risk Takers (MRTs).
During 2017 the remuneration policy has been updated with the following changes:
1 Inclusion of reference to Consequence Management Policy to ensure that personal conduct cases and overdue mandatory training are captured in the performance management process and feed through to the determination of discretionary variable compensation.
2 As a result of recent changes to CRDIV guidelines, the deferral of the variable pay portion for Senior Management has been changed from three years to five years effective for Performance Year 2017.
The bank’s reward policy is aligned to the Banking Rule 12, the Capital Requirements Directive and the Group’s reward strategy.
In determining remuneration levels for 2017, the Committee applied the bank’s remuneration strategy and policy, which takes into account the interests of shareholders, HSBC Group and the broader external context.

47
Key principles of the remuneration framework include:
• assessment of performance with reference to clear and relevant objectives set within a performance scorecard framework;
• a focus on total compensation (fixed plus variable pay) with variable pay (namely annual bonus) differentiated by performance and adherence to HSBC values;
• the use of discretion to assess the extent to which performance has been achieved; and
• deferral of a significant proportion of variable pay (where appropriate) to tie recipients to the future performance of the bank and align the relationship between risk and reward.
Within this framework, risk alignment of the remuneration structure is achieved through the following measures:
• Risk and Compliance is a critical part of the assessment process in determining the performance of all employees, especially senior executives and material risk takers.
• Adherence to HSBC values is a pre-requisite for any employee to be considered for variable pay. HSBC values are key to the running of a sound, sustainable bank. Employees have a separate HSBC Values rating which directly influences their overall performance rating, and is therefore considered for their variable pay determinations.
• For senior executives and certain MRTs, part of their variable pay is deferred (where appropriate) and thereby subject to malus, which allows unvested/unpaid deferred awards to be reduced or cancelled if warranted.
• Employees must not use personal hedging strategies or remuneration or liability related contracts of insurance in connection with any unvested deferred remuneration awards or any vested awards subject to a retention period.
• Instances of non-compliance with risk procedures and expected behaviour are escalated for consideration in variable pay decisions, including variable pay adjustments for that performance year and malus of unpaid awards granted in prior years. For MRTs, the Committee and the Board has oversight of such decisions and can make recommendations to the HSBC Group Remuneration Committee to reduce or cancel all or part of any unpaid deferred award.
The bank’s Reward Strategy
The quality and long-term commitment of all employees is fundamental to the bank’s success. The bank therefore aims to attract, retain and motivate the very best people who are committed to maintaining a long-term career with the bank, and who will perform their role in the long-term interests of the shareholders. HSBC’s reward package comprises three key elements:
a Fixed Pay,
b Benefits, and
c Variable Pay.
These elements support the achievement of the bank’s objectives through balancing reward for both short-term and long-term sustainable performance. This strategy is designed to reward success, and aligns employees’ remuneration with the bank’s risk framework and risk outcomes.
For senior employees, where appropriate, part of their reward is deferred, and thereby subject to malus, that is, it can be cancelled if warranted by events. In order to ensure alignment between what the bank pays its employees and the bank’s business strategy, individual performance is assessed against annual and long-term financial and non-financial objectives summarised in performance scorecards. This assessment also takes into account adherence to the HSBC Values of being ‘open, connected and dependable’ and acting with ‘courageous integrity’. Altogether, performance is therefore judged not only on what is achieved over the short and long-term but also importantly on how it is achieved, as the bank believes the latter contributes to the long-term sustainability of the business.
48
H S B C B A N K M A L T A p . l . c .
Remuneration Report (continued)
Structure of Remuneration
The following table shows the purpose and relevant features of each of the three key elements of the HSBC’s reward package. For the purposes of the Annual Variable Pay element, Material Risk Takers represent those members of staff whose professional activities have a material impact on the risk profile of the bank.
Description Purpose, relevant features and link to strategySenior
managementNon-executive
Directors
Fixed Pay Fixed pay reflects the individual’s role, experience and responsibility. It comprises the base salary and in some cases a fixed pay allowance and/or a pension.
Base salary
Base salaries are paid in cash on a monthly basis and are benchmarked on an annual basis against relevant comparator groups.
Y
Fixed pay allowance
This is typically paid in cash on a monthly basis.
Y
Pensions
These consist of cash allowances in lieu of personal/occupational pension arrangements of international assignees appointed to Senior Executive position.
Y
Non-executive Directors’ fees
These refer to fees payable to non-executive Directors and reflect the time commitment and responsibilities required of them. Fees are determined by benchmark against other companies and banks.
Y
Benefits Benefits take account of local market practice and include the provision of medical insurance, health assessment, life assurance, car lease allowance and tax assistance where appropriate.
Y
Variable Pay – annual incentive
Variable Pay award is discretionary, and is determined and paid in line with internal bank policies and procedures. Variable pay awards are made to drive and reward performance against annual financial and non-financial measures and adherence to HSBC Values which are consistent with the medium to long-term strategy and aligns to shareholder interests.
Performance targets are set taking into account the economic environment, strategic priorities and risk appetite.
Variable pay is delivered in the form of cash and shares.
Where variable pay for Material Risk Takers is more than €100,000 or for lower values more than 100% of fixed pay, a minimum of 50% of awards are made in shares.
Total awards are subject to deferral and vest over a period of three years or five years in case of Senior Management or such other period as determined by the Committee, and hence subject to malus or clawback provisions.
The award is non-pensionable.
Y
49
Variable Pay Funding
Funding of the bank’s annual variable pay pool is determined in the context of profitability and affordability. The Committee considers many factors in approving the overall variable pay pool. These include, but are not limited to, the performance of the bank and the performance of the HSBC Group, considered within the context of the bank’s risk appetite. The variable pay pool is also shaped by risk considerations and factors that may arise from any local or Group-wide notable events. The commercial requirement to remain competitive in the market is also taken into account.
Performance Measurement and Risk Adjustment
Under the bank’s remuneration framework, decisions relating to remuneration of individuals are made based on a combination of: performance against objectives, general individual performance of the role, and adherence to the HSBC values, business principles, Group risk-related policies and procedures and Global Standards.
In order to reward genuine performance, individual awards are made on the basis of a risk adjusted view of both financial and non-financial performance. In light of this, the bank has discretion to reduce an employee’s current year variable pay to reflect detrimental conduct or involvement in Group-wide notable events or local issues.
The Committee can also seek advice from the Group Remuneration Committee, at the level of HSBC Holdings plc, to reduce or cancel all or part of any unvested deferred award under the applicable malus and clawback provision. Appropriate circumstances include (but are not limited to) conduct detrimental to the business; past performance being materially worse than originally understood; restatement, correction or amendment of any financial statements; or improper or inadequate risk management. The Group Remuneration Committee can also recommend the forfeiture of unvested awards granted in prior years.
Adjustments would generally be made to the current year variable pay before application of malus and clawback is considered. Details of the circumstances where an adjustment, malus and/or clawback will be considered are set out below:
Type of action
Type of variable pay award affected Circumstances where it may apply (including, but not limited to):
Adjustment Current year variable pay
• Detrimental conduct or conduct which brings the business into disrepute.
• Involvement in Group-wide events resulting in significant operational losses, including events which have caused or have the potential to cause significant harm to HSBC.
• Non-compliance with HSBC Values and other mandatory requirements.
• For specified individuals, insufficient yearly progress in developing an effective AML and sanctions compliance programme or non-compliance with the DPA and other relevant orders.
Malus Unvested deferred awards granted in prior years
• Detrimental conduct or conduct which brings the business into disrepute.
• Past performance being materially worse than originally reported.
• Restatement, correction or amendment of any financial statements.
• Improper or inadequate risk management.
Clawback Vested or paid awards
• Participation in or responsibility for conduct which results in significant losses.
• Failing to meet appropriate standards of fitness and propriety.
• Reasonable evidence of misconduct or material error that would justify, or would have justified, summary termination of a contract of employment.
• HSBC or a business unit suffers a material failure of risk management within the context of Group risk management standards, policies and procedures.
50
H S B C B A N K M A L T A p . l . c .
Remuneration Report (continued)
Remuneration Policy – Non Executive Directors
Non-executive Directors are not employees and receive a fee for their services as Directors. In addition, it is common practice for non-executive Directors to be reimbursed expenses incurred in performing their role and any related tax. They are not eligible to receive a base salary, fixed pay allowance, benefits, pension or any variable pay.
The fee levels payable reflect the time commitment and responsibilities required of a non-executive Director. Fees are determined by reference to other Maltese companies and comparable entities within the HSBC Group.
The Board reviews each component of the fees periodically to assess whether, individually and in aggregate, they remain competitive and appropriate in light of changes in roles, responsibilities, and/or the time commitment required for the non-executive Directors and to ensure that individuals of the appropriate calibre are retained or can be appointed. The Board may approve changes to the fees within the aggregate amount approved by Shareholders at the Annual General Meeting. The Board may also introduce any new component of fee for non-executive Directors subject to the principles, parameters and other requirements set out in the remuneration policy.
The Director’s fees are approved in aggregate by the shareholders at the Annual General Meeting.
Remuneration amounts – Non Executive Directors
Details of non-executive directors’ fees for the financial year under review were as follows:
€
Saviour sive Sonny Portelli 75,600Philip Farrugia Randon 14,262John Bonello 59,700Andrew Muscat 42,500Juanito Camilleri 4,975Maryanne sive Sue Vella 36,300Gordon Cordina 47,375Yiannos Michaelides 24,185
Total 304,897
Directors who are employed with the bank or with HSBC Group are not paid any fees for their directorship.
Remuneration Policy – Material Risk Takers including Executive Directors and Senior Management
Individuals have been identified as MRTs based on qualitative and quantitative criteria set out in the Regulatory Technical Standard EU 604/2014 that came into force in June 2014. Amongst others, MRTs include all Executive Committee members, members of the ALCO and the Risk Management Committee as well as staff that have the authority to approve or veto a decision on any credit transaction representing 0.5% of the bank’s CET 1 capital.
Standard contracts for Senior Executives and other Material Risk Takers employed locally would generally be indefinite. Normal retirement from the bank would be in line with local legislation. A three month notice period is required for Senior Executives, who would similarly be entitled to a notice of a minimum of three months in the event that the bank terminates the employment on grounds of redundancy.
International assignees appointed to Senior Executive positions are covered by the standard Group contracts policy. The period of notice required to be given to terminate by either party can be up to six months.
For the purposes of information provided hereunder ‘Senior Executives’/‘Senior Management’ shall mean Executive Committee members.
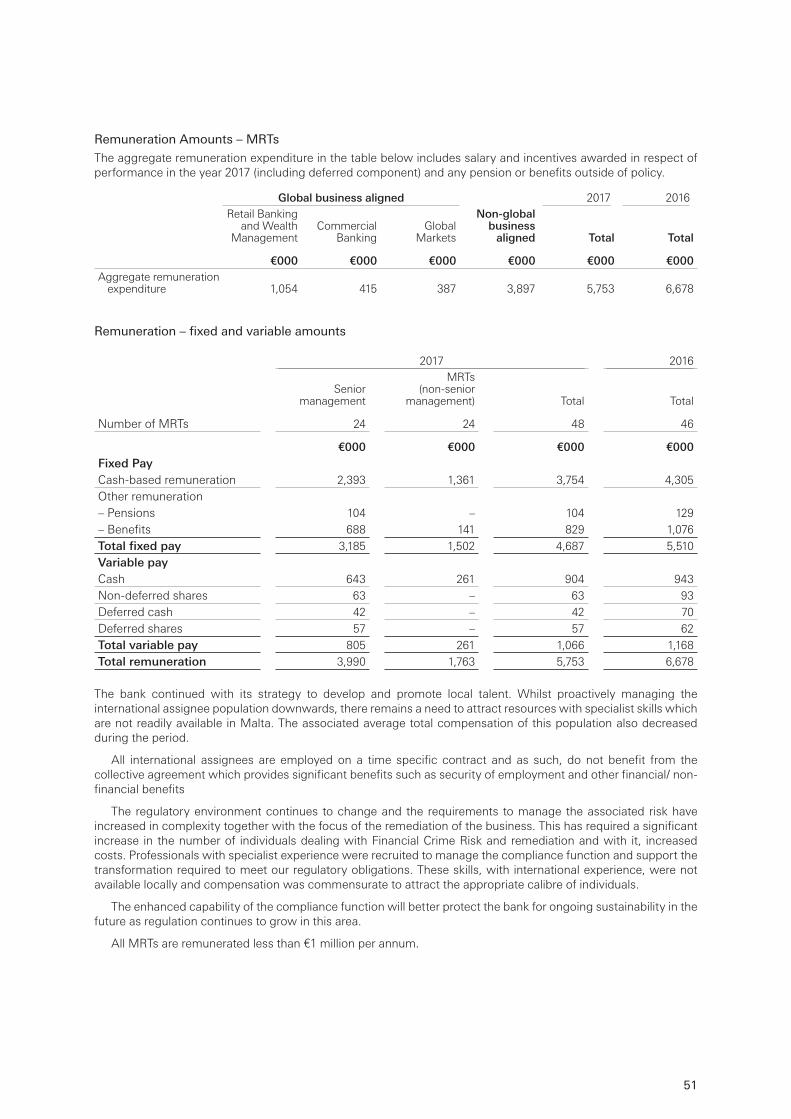
51
Remuneration Amounts – MRTs
The aggregate remuneration expenditure in the table below includes salary and incentives awarded in respect of performance in the year 2017 (including deferred component) and any pension or benefits outside of policy.
Global business aligned 2017 2016Retail Banking
and Wealth Management
Commercial Banking
Global Markets
Non-global business
aligned Total Total
€000 €000 €000 €000 €000 €000Aggregate remuneration
expenditure 1,054 415 387 3,897 5,753 6,678
Remuneration – fixed and variable amounts
2017 2016
Senior management
MRTs (non-senior
management) Total Total
Number of MRTs 24 24 48 46
€000 €000 €000 €000Fixed Pay Cash-based remuneration 2,393 1,361 3,754 4,305
Other remuneration– Pensions 104 – 104 129
– Benefits 688 141 829 1,076
Total fixed pay 3,185 1,502 4,687 5,510
Variable payCash 643 261 904 943
Non-deferred shares 63 – 63 93
Deferred cash 42 – 42 70
Deferred shares 57 – 57 62
Total variable pay 805 261 1,066 1,168
Total remuneration 3,990 1,763 5,753 6,678
The bank continued with its strategy to develop and promote local talent. Whilst proactively managing the international assignee population downwards, there remains a need to attract resources with specialist skills which are not readily available in Malta. The associated average total compensation of this population also decreased during the period.
All international assignees are employed on a time specific contract and as such, do not benefit from the collective agreement which provides significant benefits such as security of employment and other financial/ non-financial benefits
The regulatory environment continues to change and the requirements to manage the associated risk have increased in complexity together with the focus of the remediation of the business. This has required a significant increase in the number of individuals dealing with Financial Crime Risk and remediation and with it, increased costs. Professionals with specialist experience were recruited to manage the compliance function and support the transformation required to meet our regulatory obligations. These skills, with international experience, were not available locally and compensation was commensurate to attract the appropriate calibre of individuals.
The enhanced capability of the compliance function will better protect the bank for ongoing sustainability in the future as regulation continues to grow in this area.
All MRTs are remunerated less than €1 million per annum.
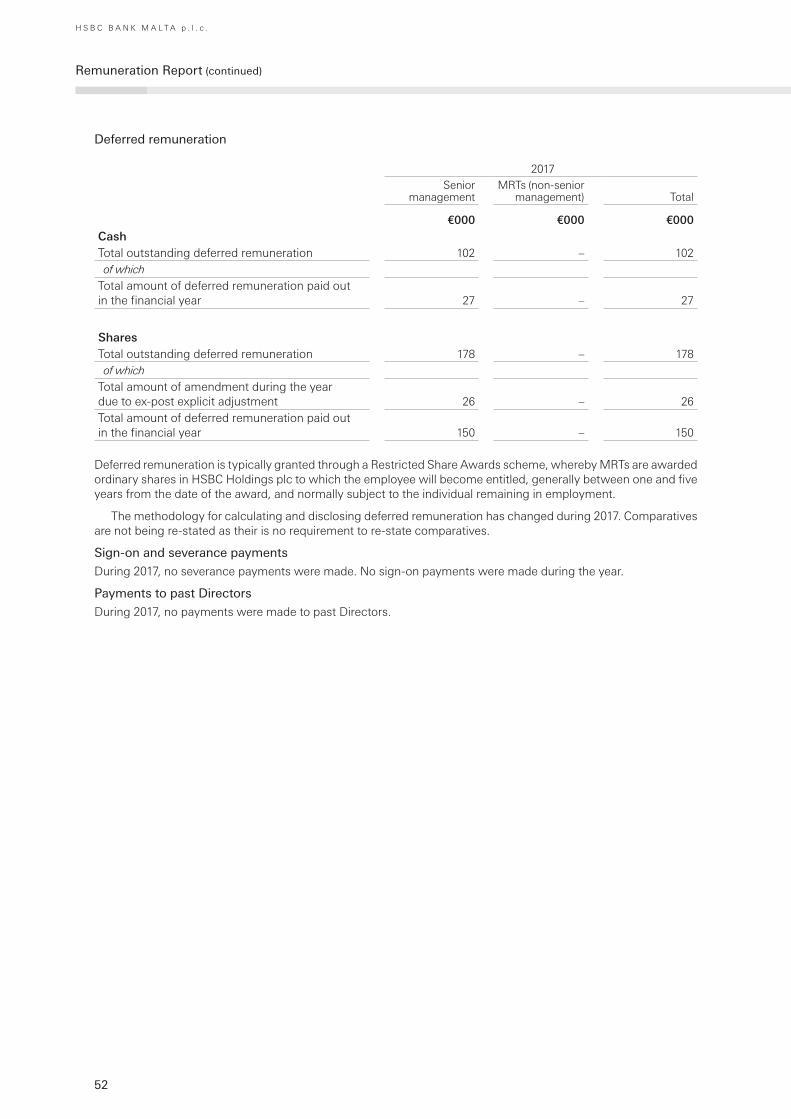
52
H S B C B A N K M A L T A p . l . c .
Remuneration Report (continued)
Deferred remuneration
2017Senior
managementMRTs (non-senior
management) Total
€000 €000 €000CashTotal outstanding deferred remuneration 102 – 102of which
Total amount of deferred remuneration paid out in the financial year 27 – 27
SharesTotal outstanding deferred remuneration 178 – 178of which
Total amount of amendment during the year due to ex-post explicit adjustment 26 – 26
Total amount of deferred remuneration paid out in the financial year 150 – 150
Deferred remuneration is typically granted through a Restricted Share Awards scheme, whereby MRTs are awarded ordinary shares in HSBC Holdings plc to which the employee will become entitled, generally between one and five years from the date of the award, and normally subject to the individual remaining in employment.
The methodology for calculating and disclosing deferred remuneration has changed during 2017. Comparatives are not being re-stated as their is no requirement to re-state comparatives.
Sign-on and severance payments
During 2017, no severance payments were made. No sign-on payments were made during the year.
Payments to past Directors
During 2017, no payments were made to past Directors.
53
Report on the audit of the financial statements
Our opinion
In our opinion:
– HSBC Bank Malta p.l.c.’s consolidated and stand-alone parent company financial statements (the ‘financial statements’) give a true and fair view of the financial position of the local group and bank as at 31 December 2017, and of their financial performance and cash flows for the year then ended in accordance with International Financial Reporting Standards (IFRSs) as adopted by the EU; and
– The financial statements have been prepared in accordance with the requirements of the Banking Act (Cap. 371) and the Maltese Companies Act (Cap. 386).
Our opinion is consistent with our additional report to the Audit Committee.
What we have auditedHSBC Bank Malta p.l.c.’s financial statements, set out on pages 61 to 170, comprise:
– the consolidated and parent company statements of financial position as at 31 December 2017;– the consolidated and parent company income statements and statements of comprehensive income for the
year then ended;– the consolidated and parent company statements of changes in equity for the year then ended;– the consolidated and parent company statements of cash flows for the year then ended; and– the notes on the financial statements, which include a summary of significant accounting policies.
Basis for opinion
We conducted our audit in accordance with International Standards on Auditing (ISAs). Our responsibilities under those standards are further described in the Auditor’s responsibilities for the audit of the financial statements section of our report. We believe that the audit evidence we have obtained is sufficient and appropriate to provide a basis for our opinion.
IndependenceWe are independent of the local group and the bank in accordance with the International Ethics Standards Board for Accountants’ Code of Ethics for Professional Accountants (IESBA Code) together with the ethical requirements of the Accountancy Profession (Code of Ethics for Warrant Holders) Directive issued in terms of the Accountancy Profession Act (Cap. 281) that are relevant to our audit of the financial statements in Malta. We have fulfilled our other ethical responsibilities in accordance with the IESBA Code.
To the best of our knowledge and belief, we declare that non-audit services that we have provided to the parent company and its subsidiaries are in accordance with the applicable law and regulations in Malta and that we have not provided non-audit services that are prohibited under Article 18A of the Accountancy Profession Act (Cap. 281).
During the period starting 1 January 2017 to 31 December 2017, no non-audit services have been provided to the local group and the bank.
Our audit approach
Overview
Materiality
Group scoping
Key audit matters
– Overall group materiality: €2.9 million, which represents 5% of profit before tax adjusted for one-time items.
– The audit carried out by the group engagement team covered all the components within the local group as at and for the year ended 31 December 2017 comprising HSBC Bank Malta p.l.c. and its subsidiaries HSBC Life Assurance (Malta) Limited and HSBC Global Asset Management (Malta) Limited, which are all based in Malta.
– Impairment of loans and advances to customers.
– Measurement of life insurance contract liabilities and of the Present Value of in-force Business (PVIF).
Independent Auditor’s Report to the Shareholders of HSBC Bank Malta p.l.c.
54
As part of designing our audit, we determined materiality and assessed the risks of material misstatement in the consolidated financial statements. In particular, we considered where the Directors made subjective judgements; for example, in respect of significant accounting estimates that involved making assumptions and considering future events that are inherently uncertain. As in all of our audits, we also addressed the risk of management override of internal controls, including among other matters, consideration of whether there was evidence of bias that represented a risk of material misstatement due to fraud.
MaterialityThe scope of our audit was influenced by our application of materiality. An audit is designed to obtain reasonable assurance whether the financial statements are free from material misstatement. Misstatements may arise due to fraud or error. They are considered material if individually or in aggregate, they could reasonably be expected to influence the economic decisions of users taken on the basis of the consolidated financial statements.
Based on our professional judgement, we determined certain quantitative thresholds for materiality, including the overall group materiality for the consolidated financial statements as a whole as set out in the table below. These, together with qualitative considerations, helped us to determine the scope of our audit and the nature, timing and extent of our audit procedures and to evaluate the effect of misstatements, both individually and in aggregate, on the financial statements as a whole.
Overall group materiality €2,885,000
How we determined it 5% of profit before tax adjusted for one-time items
Rationale for the materiality benchmark applied
We chose profit before tax adjusted for one-time items as the benchmark because, in our view, it is the benchmark against which the performance of the local group is most commonly measured by users, and is a generally accepted benchmark. We chose 5% which is within the range of acceptable quantitative materiality thresholds in auditing standards.
We agreed with the Audit Committee that we would report to them misstatements identified during our audit above €288,000 as well as misstatements below that amount that, in our view, warranted reporting for qualitative reasons.
Key audit mattersKey audit matters are those matters that, in our professional judgement, were of most significance in our audit of the financial statements of the current period. These matters were addressed in the context of our audit of the financial statements as a whole, and in forming our opinion thereon, and we do not provide a separate opinion on these matters.
Key audit matter
Impairment of loans and advances to customers of the local group and bank
Impairment allowances in respect of loans and advances to customers represent management’s best estimate of the losses incurred within the loan portfolios at the balance sheet date.
Impairment losses are calculated on an individual basis for significant loans and on a collective basis for homogeneous portfolios of loans that are not considered individually significant. A collective impairment assessment is also performed to cover losses which have been incurred but have not yet been identified on loans subject to individual assessment.
The calculation of both collective and individual impairment allowances is inherently judgemental; judgement is applied to determine appropriate parameters and assumptions used to calculate impairment.
Collective impairment allowances are calculated using statistical models, which approximate the impact of current economic and credit conditions on portfolios of loans.
How our audit addressed the key audit matter
The policies and methodologies used by the bank in respect of impairment of loans and advances were discussed with the Audit Committee. Changes to inputs within the collective allowance models as well as individually significant loan impairments are discussed at Audit Committee and Risk Committee meetings. For collective allowances the appropriateness of the modelling policy and methodology used was independently assessed by reference to the requirements of accounting standards and market practices.
We understood and critically assessed the models used for collective allowances. Since modelling assumptions and parameters are based on historic data, we assessed whether historic experience was representative of current circumstances and of the recent losses incurred within the portfolios. The appropriateness of management’s judgements was also independently considered in respect of calculation methodologies and segmentation, economic factors and judgemental overlays, period of historical loss rates used and loss emergence periods. Model calculations were also tested independently.
Independent Auditor’s Report to the Shareholders of HSBC Bank Malta p.l.c. (continued)

55
Key audit matter
Impairment of loans and advances to customers of the local group and bank
For incurred but not yet identified impairments, these models are based on the bank’s historical loss experience in portfolios of similar risk characteristics, generally by sector, the estimated period between impairment occurring and loss recognition, and management’s judgement as to whether current economic and credit conditions are such that the actual level of inherent losses at the balance sheet date is likely to be greater or less than that suggested by historical experience. For impairment losses in homogenous portfolios, the models used are based on roll rate methodology which employs statistical analyses of historical data and experience of delinquency and default to reliably estimate the amount of loans that will eventually be written off as a result of the events occurring before the balance sheet date and which the local group is not able to identify individually.
The inputs to these models are subject to management judgment and model overlays are often required. Key assumptions and judgements include the emergence period used for unidentified impairment and the historical loss rate for loans and advances across a number of sectors.
The methodologies used by the bank to calculate collective impairment allowances are relatively standard which means that modelling risk is low but changes in individual inputs can have a significant bearing on the impairment charge.
For specific impairments, judgement is required to determine when an impairment event has occurred and then to estimate the expected future cash flows related to that loan, which are dependent on parameters or assumptions such as the valuation of collateral for secured lending. Discounted cash flow models are utilised in this respect.
We focused on impairment due to the subjective nature of the calculations and the subjective judgements involved in both timing of recognition of impairment and the estimation of the size of any such impairment.
Relevant references in the Annual Report and Financial Statements:
– Accounting policy: Note 3(d)(ii);
– Credit risk management: Note 4;
– Note on Loan impairment charges: Note 16;
– Note on Loans and advances to customers: Note 26; and
– Critical accounting judgements and estimates: Note 60(a).
How our audit addressed the key audit matter
We tested the completeness and accuracy of data extracted from underlying systems that is utilised in the models.
Based on the evidence obtained, we found that the model assumptions, data used within the models and overlays to be reasonable.
For specific allowances the appropriateness of provisioning methodologies and policies was independently assessed across portfolios. We understood and evaluated the processes for identifying impairment events within loan portfolios, as well as the impairment assessment processes.
The controls management has established to identify which loans and advances are impaired were tested. For specific impairment charges on individual loans this includes controls over the compilation and review of the credit watch list and the credit file review processes. In particular, we tested the design and operating effectiveness of the key controls to determine which loans and advances are impaired, including testing controls over the timely identification of impaired loans and advances. We determined that we could rely on these controls for the purposes of our audit.
We assessed critically the criteria used for determining whether an impairment event had occurred and therefore whether there was a requirement to compute a specific impairment allowance. We tested a sample of loans with characteristics that might imply an impairment event had occurred (for example a customer experiencing financial difficulty) to challenge whether impairment events had actually occurred and to assess whether impairment events had been identified by management in a timely manner. We also haphazardly selected a sample of performing loans, which had not been identified by management as potentially impaired, to form our own judgement as to whether that was appropriate and to further challenge whether all relevant events had been identified by management.
For a sample of individually impaired loans we understood the latest developments at the level of the borrower and the basis of measuring the impairment provisions and considered whether key judgments were appropriate given the borrowers’ circumstances. An independent view was formed on the levels of provisions booked based on the detailed loan and customer information in the credit file. Calculations within the discounted cash flow models were re-performed. In addition, we tested key inputs to the impairment calculation including the expected future cash flows and valuation of collateral held, and challenged management to demonstrate that the valuations were up to date, consistent with the strategy being followed in respect of the particular borrower and appropriate for the purpose.
56
Key audit matter
Impairment of loans and advances to customers of the local group and bank
How our audit addressed the key audit matter
Testing the estimation of the future expected cash flows from customers including from realisation of collateral held for a sample of loans, involved assessing the work performed by external experts used by the bank to value the collateral or to assess the estimates of future cash flows. We used our experts to assess the appropriateness of valuations and estimates utilised.
In the case of some impairment provisions, we formed a different view from that of management, but in our view the differences were within a reasonable range of outcomes.
Measurement of life insurance contract liabilities and of the Present Value of in-force Business (PVIF) of the local group
Management’s valuation of the provisions for the settlement of future claims attributable to life insurance contracts and of the PVIF involves complex and subjective judgements about future events, both internal and external to the business, for which small changes in assumptions can result in material impacts to the valuation of these items. We focused on this area due to the materiality and subjectivity of the judgements made.
Economic assumptions (investment return and associated discount rates) and non-economic assumptions (mortality, lapse rates and expenses associated with servicing policies), including the respective margins, applied are the key inputs to which the carrying amounts of these long-term liabilities and intangible asset are highly sensitive.
Relevant references in the Annual Report and Financial Statements:
– Accounting policy: Note 3(n)(iii) and Note 3(n)(iv);
– Note on Liabilities under insurance contracts: Note 41;
– Note on Financial assets designated at fair value attributable to insurance operations: Note 23; and
– Critical accounting judgements and estimates: Note 60(c).
Our audit procedures addressing the valuation of the local group’s life insurance contract liabilities and of the PVIF included the following procedures, using our actuarial specialist team members:
– we tested the accuracy of the underlying data utilised for the purposes of measurement by reference to its source;
– we applied our industry knowledge and experience in comparing the methodology, models and assumptions used to recognised actuarial practices; and
– we tested management’s controls in respect of the valuation and assumption setting processes and we assessed management’s key judgements throughout the processes.
In respect of the assumptions underlying the measurement of the life insurance contract liabilities, we performed the following procedures using our actuarial specialist team members:
– we assessed the assumptions for investment mix and projected investment returns by reference to company-specific and market observable data (euro swap curve);
– we considered the appropriateness of the mortality assumptions by reference to company and industry data on historical mortality experience and expectations of future mortality; and
– we tested the future expense assumption by understanding and challenging the basis on which expenses are allocated between new business and renewals and by reference to market observable data (inflation curve).
Independent Auditor’s Report to the Shareholders of HSBC Bank Malta p.l.c. (continued)

57
How our audit addressed the key audit matter
The following procedures addressing the assumptions underlying the valuation of the local group’s PVIF were performed also through the involvement of our actuarial specialist team members:
– we leveraged the testing performed in relation to those assumptions that are aligned with the insurance contract liability valuation, reviewing the differences in margins applied between the two; and
– we considered the appropriateness of the lapse rate assumptions by reference to company data, considering the results of management’s analysis of recent lapse experience.
In respect of all the assumptions referred to above, we have reviewed management’s approach to setting the assumptions, assessed the assumptions’ appropriateness based on internal and external data, and tested management’s governance and controls over the assumption basis review.
We also reviewed the modelled results and manual adjustments, and we assessed the reasonableness of management’s analysis of the changes in the carrying amounts.
Based on the results of our work we concluded that the data and assumptions used by management were reasonable.
Key audit matter
Measurement of life insurance contract liabilities and of the Present Value of in-force Business (PVIF) of the local group
How we tailored our group audit scope The local group is composed of three components: HSBC Bank Malta p.l.c. (the parent company), and its subsidiaries HSBC Life Assurance (Malta) Limited, which is determined to be a financially significant entity, and HSBC Global Asset Management (Malta) Limited.
We tailored the scope of our audit in order to perform sufficient work on all components to enable us to provide an opinion on the consolidated financial statements as a whole, taking into account the structure of the local group, the accounting processes and controls, and the industry in which the local group operates, and local statutory requirements.
The audit team of the local group performed all of this work by applying the overall materiality at the level of the local group’s consolidated financial statements, together with additional procedures performed on the consolidation. This gave us sufficient appropriate audit evidence for our opinion on the local group financial statements as a whole.
Other information
The Directors are responsible for the other information. The other information comprises the Report of the Directors (but does not include the financial statements and our auditor’s report thereon), which we obtained prior to the date of this auditor’s report; and the Chairman’s Statement, the Chief Executive Officer’s Review, the Directors’ Responsibilities Statement, the Remuneration Report, the Five year comparisons and the Additional Regulatory Disclosures, which are expected to be made available to us after that date.
Our opinion on the financial statements does not cover the other information, including the Report of the Directors.
58
Independent Auditor’s Report to the Shareholders of HSBC Bank Malta p.l.c. (continued)
In connection with our audit of the financial statements, our responsibility is to read the other information identified above and, in doing so, consider whether the other information is materially inconsistent with the financial statements or our knowledge obtained in the audit, or otherwise appears to be materially misstated.
With respect to the Report of the Directors, we also considered whether the Report of the Directors includes the disclosures required by Article 177 of the Maltese Companies Act (Cap. 386).
Based on the work we have performed, in our opinion:
– the information given in the Report of the Directors for the financial year for which the financial statements are prepared is consistent with the financial statements; and
– the Report of the Directors has been prepared in accordance with the Maltese Companies Act (Cap. 386).
In addition, in light of the knowledge and understanding of the local group and its environment obtained in the course of the audit, we are required to report if we have identified material misstatements in the Report of the Directors and other information that we obtained prior to the date of this auditor’s report. We have nothing to report in this regard.
When we read Chairman’s Statement, the Chief Executive Officer’s Review, the Directors’ Responsibilities Statement, the Remuneration Report, the Five year comparisons and the Additional Regulatory Disclosures, if we conclude that there is a material misstatement therein, we are required to communicate the matter in accordance with International Standards on Auditing.
Responsibilities of the Directors and those charged with governance for the financial statements
The Directors are responsible for the preparation of financial statements that give a true and fair view in accordance with IFRSs as adopted by the EU and the requirements of the Banking Act (Cap. 371) and the Maltese Companies Act (Cap. 386), and for such internal control as the Directors determine is necessary to enable the preparation of financial statements that are free from material misstatement, whether due to fraud or error.
In preparing the financial statements, the Directors are responsible for assessing the local group’s and the bank’s ability to continue as a going concern, disclosing, as applicable, matters related to going concern and using the going concern basis of accounting unless the Directors either intend to liquidate the local group and the bank or to cease operations, or has no realistic alternative but to do so.
Those charged with governance are responsible for overseeing the local group’s and the bank’s financial reporting process.
Auditor’s responsibilities for the audit of the financial statements
Our objectives are to obtain reasonable assurance about whether the financial statements as a whole are free from material misstatement, whether due to fraud or error, and to issue an auditor’s report that includes our opinion. Reasonable assurance is a high level of assurance, but is not a guarantee that an audit conducted in accordance with ISAs will always detect a material misstatement when it exists. Misstatements can arise from fraud or error and are considered material if, individually or in the aggregate, they could reasonably be expected to influence the economic decisions of users taken on the basis of these financial statements.
As part of an audit in accordance with ISAs, we exercise professional judgement and maintain professional scepticism throughout the audit. We also:
– Identify and assess the risks of material misstatement of the financial statements, whether due to fraud or error, design and perform audit procedures responsive to those risks, and obtain audit evidence that is sufficient and appropriate to provide a basis for our opinion. The risk of not detecting a material misstatement resulting from fraud is higher than for one resulting from error, as fraud may involve collusion, forgery, intentional omissions, misrepresentations or the override of internal control.
– Obtain an understanding of internal control relevant to the audit in order to design audit procedures that are appropriate in the circumstances, but not for the purpose of expressing an opinion on the effectiveness of the local group’s and the bank’s internal control.
– Evaluate the appropriateness of accounting policies used and the reasonableness of accounting estimates and related disclosures made by the Directors.
59
– Conclude on the appropriateness of the Directors’ use of the going concern basis of accounting and, based on the audit evidence obtained, whether a material uncertainty exists related to events or conditions that may cast significant doubt on the local group’s and the bank’s ability to continue as a going concern. If we conclude that a material uncertainty exists, we are required to draw attention in our auditor’s report to the related disclosures in the financial statements or, if such disclosures are inadequate, to modify our opinion. Our conclusions are based on the audit evidence obtained up to the date of our auditor’s report. However, future events or conditions may cause the local group and the bank to cease to continue as a going concern.
– Evaluate the overall presentation, structure and content of the financial statements, including the disclosures, and whether the financial statements represent the underlying transactions and events in a manner that achieves fair presentation.
– Obtain sufficient appropriate audit evidence regarding the financial information of the entities or business activities within the local group to express an opinion on the consolidated financial statements. We are responsible for the direction, supervision and performance of the group audit. We remain solely responsible for our audit opinion.
We communicate with those charged with governance regarding, among other matters, the planned scope and timing of the audit and significant audit findings, including any significant deficiencies in internal control that we identify during our audit.
We also provide those charged with governance with a statement that we have complied with relevant ethical requirements regarding independence, and to communicate with them all relationships and other matters that may reasonably be thought to bear on our independence, and where applicable, related safeguards.
From the matters communicated with those charged with governance, we determine those matters that were of most significance in the audit of the financial statements of the current period and are therefore the key audit matters. We describe these matters in our auditor’s report unless law or regulation precludes public disclosure about the matter or when, in extremely rare circumstances, we determine that a matter should not be communicated in our report because the adverse consequences of doing so would reasonably be expected to outweigh the public interest benefits of such communication.
Report on other legal and regulatory requirements
Report on the statement of compliance with the Principles of Good Corporate Governance
The Listing Rules issued by the Malta Listing Authority require the Directors to prepare and include in their Annual Report a Statement of Compliance providing an explanation of the extent to which they have adopted the Code of Principles of Good Corporate Governance and the effective measures that they have taken to ensure compliance throughout the accounting period with those Principles.
The Listing Rules also require the auditor to include a report on the Statement of Compliance prepared by the Directors.
We read the Statement of Compliance and consider the implications for our report if we become aware of any apparent misstatements or material inconsistencies with the financial statements included in the Annual Report. Our responsibilities do not extend to considering whether this statement is consistent with any other information included in the Annual Report.
We are not required to, and we do not, consider whether the Board’s statements on internal control included in the Statement of Compliance cover all risks and controls, or form an opinion on the effectiveness of the bank’s corporate governance procedures or its risk and control procedures.
In our opinion, the Statement of Compliance set out on pages 34 to 45 has been properly prepared in accordance with the requirements of the Listing Rules issued by the Malta Listing Authority.

60
Opinion on other matters prescribed by the Banking Act (Cap. 371)
In our opinion:
– we have obtained all the information and explanations which to the best of our knowledge and belief were necessary for the purpose of our audit;
– proper books of account have been kept by the bank, so far as appears from our examination of those books;
– the bank’s financial statements are in agreement with the books of account; and
– to the best of our knowledge and according to the explanations given to us, the financial statements give the information required by any law in force in the manner so required.
Other matters on which we are required to report by exception
We also have responsibilities under:
– the Maltese Companies Act (Cap. 386) to report to you if, in our opinion:
– returns adequate for our audit have not been received from branches not visited by us; and
– certain disclosures of Directors’ remuneration specified by law are not made in the financial statements, giving the required particulars in our report.
– the Listing Rules to review the statement made by the directors that the business is a going concern together with supporting assumptions or qualifications as necessary.
We have nothing to report to you in respect of these responsibilities.
Appointment
We were first appointed as auditors of the local group and the bank on 22 April 2015. Our appointment has been renewed annually by shareholder resolution representing a total period of uninterrupted engagement appointment of 3 years. The engagement partner on the audit resulting in this independent auditor’s report is Fabio Axisa.
Fabio Axisa (Partner) for and on behalf of
PricewaterhouseCoopersRegistered Auditors 78 Mill Street, Qormi, Malta
20 February 2018
Independent Auditor’s Report to the Shareholders of HSBC Bank Malta p.l.c. (continued)
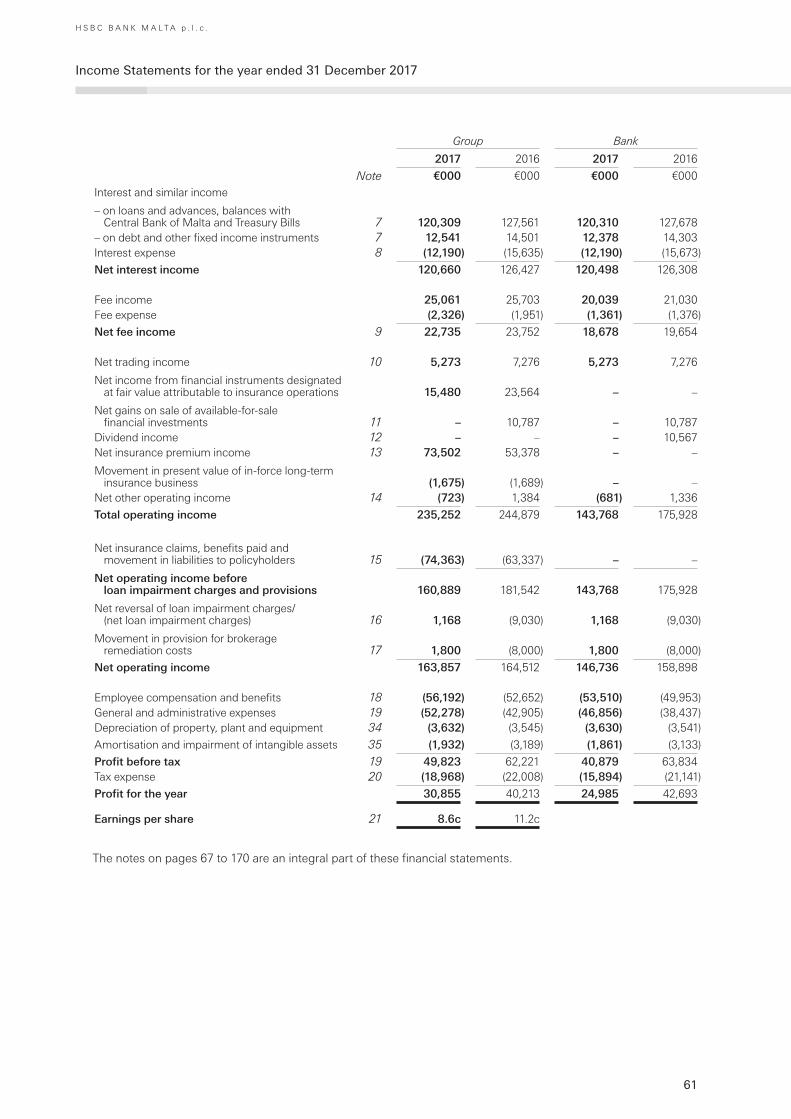
61
H S B C B A N K M A L T A p . l . c .
Income Statements for the year ended 31 December 2017
Group Bank
2017 2016 2017 2016
Note €000 €000 €000 €000
Interest and similar income
– on loans and advances, balances with Central Bank of Malta and Treasury Bills 7 120,309 127,561 120,310 127,678
– on debt and other fixed income instruments 7 12,541 14,501 12,378 14,303 Interest expense 8 (12,190) (15,635) (12,190) (15,673)
Net interest income 120,660 126,427 120,498 126,308
Fee income 25,061 25,703 20,039 21,030 Fee expense (2,326) (1,951) (1,361) (1,376)
Net fee income 9 22,735 23,752 18,678 19,654
Net trading income 10 5,273 7,276 5,273 7,276
Net income from financial instruments designated at fair value attributable to insurance operations 15,480 23,564 – –
Net gains on sale of available-for-sale financial investments 11 – 10,787 – 10,787
Dividend income 12 – – – 10,567 Net insurance premium income 13 73,502 53,378 – –
Movement in present value of in-force long-term insurance business (1,675) (1,689) – –
Net other operating income 14 (723) 1,384 (681) 1,336
Total operating income 235,252 244,879 143,768 175,928
Net insurance claims, benefits paid and movement in liabilities to policyholders 15 (74,363) (63,337) – –
Net operating income before loan impairment charges and provisions 160,889 181,542 143,768 175,928
Net reversal of loan impairment charges/ (net loan impairment charges) 16 1,168 (9,030) 1,168 (9,030)
Movement in provision for brokerage remediation costs 17 1,800 (8,000) 1,800 (8,000)
Net operating income 163,857 164,512 146,736 158,898
Employee compensation and benefits 18 (56,192) (52,652) (53,510) (49,953)General and administrative expenses 19 (52,278) (42,905) (46,856) (38,437)Depreciation of property, plant and equipment 34 (3,632) (3,545) (3,630) (3,541)
Amortisation and impairment of intangible assets 35 (1,932) (3,189) (1,861) (3,133)
Profit before tax 19 49,823 62,221 40,879 63,834 Tax expense 20 (18,968) (22,008) (15,894) (21,141)
Profit for the year 30,855 40,213 24,985 42,693
Earnings per share 21 8.6c 11.2c
The notes on pages 67 to 170 are an integral part of these financial statements.
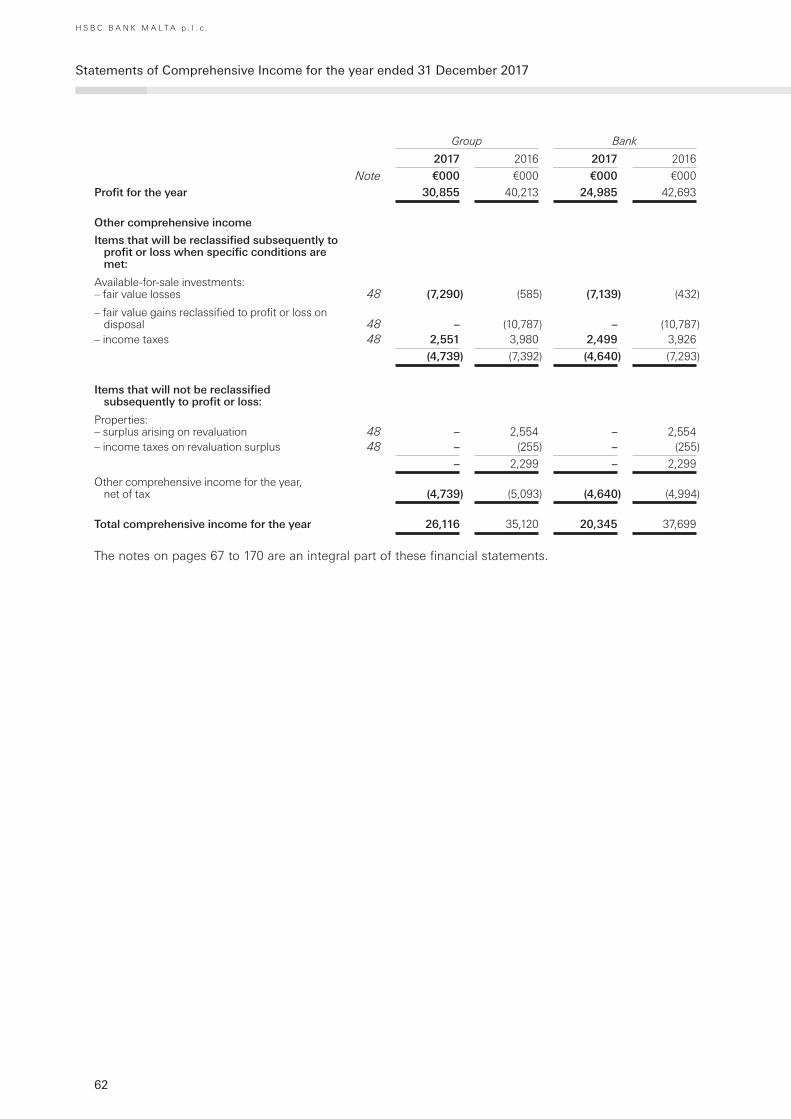
62
H S B C B A N K M A L T A p . l . c .
Statements of Comprehensive Income for the year ended 31 December 2017
Group Bank
2017 2016 2017 2016
Note €000 €000 €000 €000
Profit for the year 30,855 40,213 24,985 42,693
Other comprehensive income
Items that will be reclassified subsequently to profit or loss when specific conditions are met:
Available-for-sale investments:– fair value losses 48 (7,290) (585) (7,139) (432)
– fair value gains reclassified to profit or loss on disposal 48 – (10,787) – (10,787)
– income taxes 48 2,551 3,980 2,499 3,926
(4,739) (7,392) (4,640) (7,293)
Items that will not be reclassified subsequently to profit or loss:
Properties:– surplus arising on revaluation 48 – 2,554 – 2,554– income taxes on revaluation surplus 48 – (255) – (255)
– 2,299 – 2,299
Other comprehensive income for the year, net of tax (4,739) (5,093) (4,640) (4,994)
Total comprehensive income for the year 26,116 35,120 20,345 37,699
The notes on pages 67 to 170 are an integral part of these financial statements.
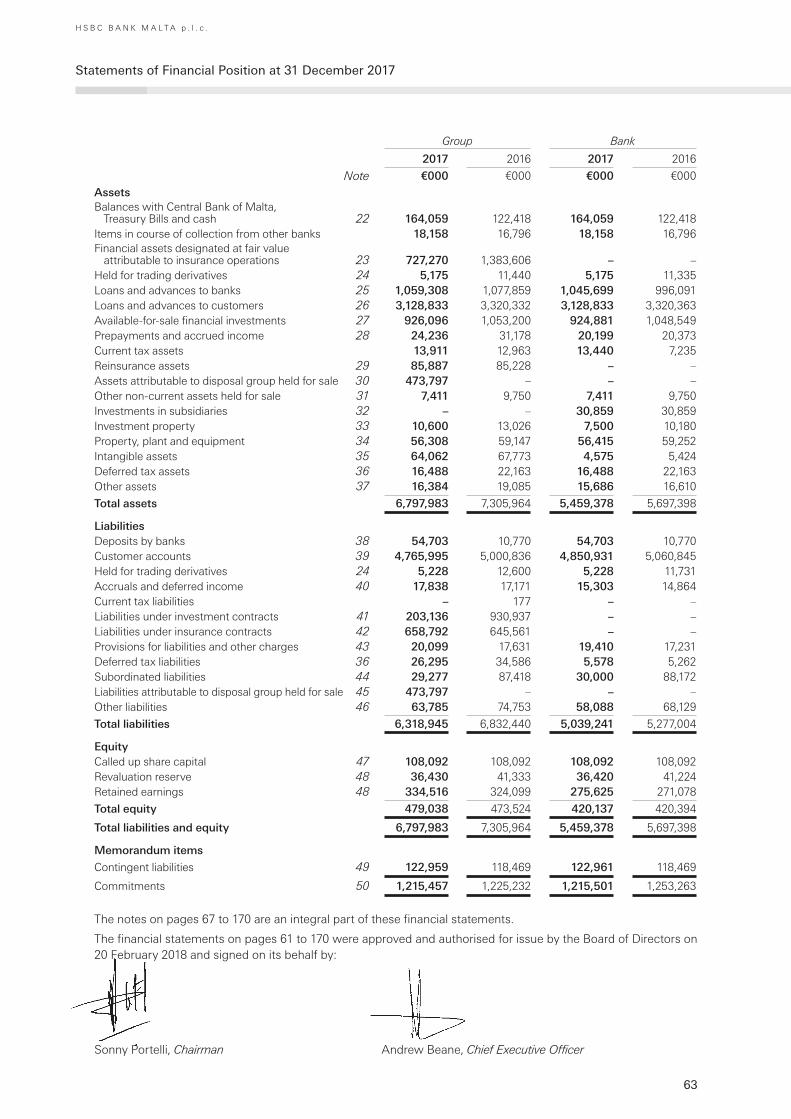
63
H S B C B A N K M A L T A p . l . c .
Statements of Financial Position at 31 December 2017
Group Bank
2017 2016 2017 2016
Note €000 €000 €000 €000
AssetsBalances with Central Bank of Malta,
Treasury Bills and cash 22 164,059 122,418 164,059 122,418 Items in course of collection from other banks 18,158 16,796 18,158 16,796 Financial assets designated at fair value
attributable to insurance operations 23 727,270 1,383,606 – –Held for trading derivatives 24 5,175 11,440 5,175 11,335 Loans and advances to banks 25 1,059,308 1,077,859 1,045,699 996,091 Loans and advances to customers 26 3,128,833 3,320,332 3,128,833 3,320,363 Available-for-sale financial investments 27 926,096 1,053,200 924,881 1,048,549 Prepayments and accrued income 28 24,236 31,178 20,199 20,373 Current tax assets 13,911 12,963 13,440 7,235 Reinsurance assets 29 85,887 85,228 – –Assets attributable to disposal group held for sale 30 473,797 – – –Other non-current assets held for sale 31 7,411 9,750 7,411 9,750 Investments in subsidiaries 32 – – 30,859 30,859 Investment property 33 10,600 13,026 7,500 10,180 Property, plant and equipment 34 56,308 59,147 56,415 59,252 Intangible assets 35 64,062 67,773 4,575 5,424 Deferred tax assets 36 16,488 22,163 16,488 22,163 Other assets 37 16,384 19,085 15,686 16,610
Total assets 6,797,983 7,305,964 5,459,378 5,697,398
LiabilitiesDeposits by banks 38 54,703 10,770 54,703 10,770 Customer accounts 39 4,765,995 5,000,836 4,850,931 5,060,845 Held for trading derivatives 24 5,228 12,600 5,228 11,731 Accruals and deferred income 40 17,838 17,171 15,303 14,864 Current tax liabilities – 177 – – Liabilities under investment contracts 41 203,136 930,937 – –Liabilities under insurance contracts 42 658,792 645,561 – –Provisions for liabilities and other charges 43 20,099 17,631 19,410 17,231 Deferred tax liabilities 36 26,295 34,586 5,578 5,262Subordinated liabilities 44 29,277 87,418 30,000 88,172 Liabilities attributable to disposal group held for sale 45 473,797 – – –Other liabilities 46 63,785 74,753 58,088 68,129
Total liabilities 6,318,945 6,832,440 5,039,241 5,277,004
EquityCalled up share capital 47 108,092 108,092 108,092 108,092 Revaluation reserve 48 36,430 41,333 36,420 41,224 Retained earnings 48 334,516 324,099 275,625 271,078
Total equity 479,038 473,524 420,137 420,394
Total liabilities and equity 6,797,983 7,305,964 5,459,378 5,697,398
Memorandum items
Contingent liabilities 49 122,959 118,469 122,961 118,469
Commitments 50 1,215,457 1,225,232 1,215,501 1,253,263
The notes on pages 67 to 170 are an integral part of these financial statements.
The financial statements on pages 61 to 170 were approved and authorised for issue by the Board of Directors on 20 February 2018 and signed on its behalf by:
Sonny Portelli, Chairman Andrew Beane, Chief Executive Officer
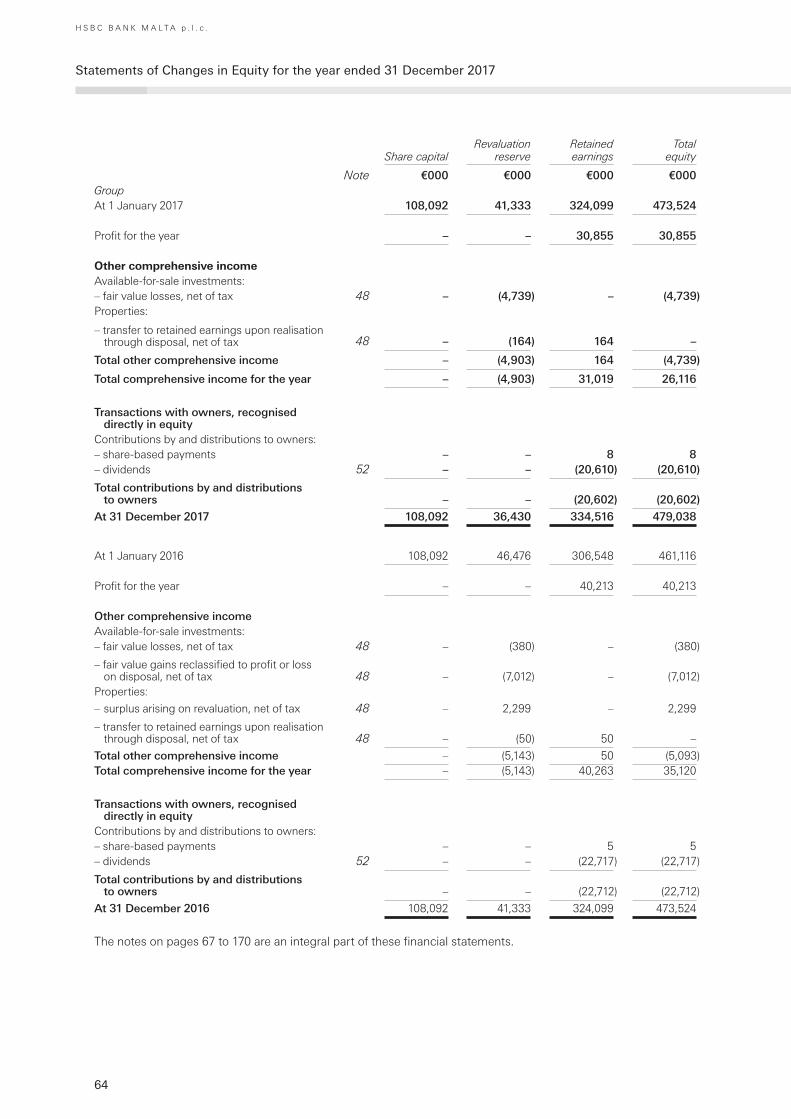
64
H S B C B A N K M A L T A p . l . c .
Statements of Changes in Equity for the year ended 31 December 2017
Share capitalRevaluation
reserve Retained earnings
Total equity
Note €000 €000 €000 €000GroupAt 1 January 2017 108,092 41,333 324,099 473,524
Profit for the year – – 30,855 30,855
Other comprehensive incomeAvailable-for-sale investments:– fair value losses, net of tax 48 – (4,739) – (4,739)Properties:
– transfer to retained earnings upon realisation through disposal, net of tax 48 – (164) 164 –
Total other comprehensive income – (4,903) 164 (4,739)
Total comprehensive income for the year – (4,903) 31,019 26,116
Transactions with owners, recognised directly in equity
Contributions by and distributions to owners: – share-based payments – – 8 8– dividends 52 – – (20,610) (20,610)
Total contributions by and distributions to owners – – (20,602) (20,602)
At 31 December 2017 108,092 36,430 334,516 479,038
At 1 January 2016 108,092 46,476 306,548 461,116
Profit for the year – – 40,213 40,213
Other comprehensive incomeAvailable-for-sale investments:– fair value losses, net of tax 48 – (380) – (380)
– fair value gains reclassified to profit or loss on disposal, net of tax 48 – (7,012) – (7,012)
Properties:
– surplus arising on revaluation, net of tax 48 – 2,299 – 2,299
– transfer to retained earnings upon realisation through disposal, net of tax 48 – (50) 50 –
Total other comprehensive income – (5,143) 50 (5,093)Total comprehensive income for the year – (5,143) 40,263 35,120
Transactions with owners, recognised directly in equity
Contributions by and distributions to owners: – share-based payments – – 5 5 – dividends 52 – – (22,717) (22,717)
Total contributions by and distributions to owners – – (22,712) (22,712)
At 31 December 2016 108,092 41,333 324,099 473,524
The notes on pages 67 to 170 are an integral part of these financial statements.
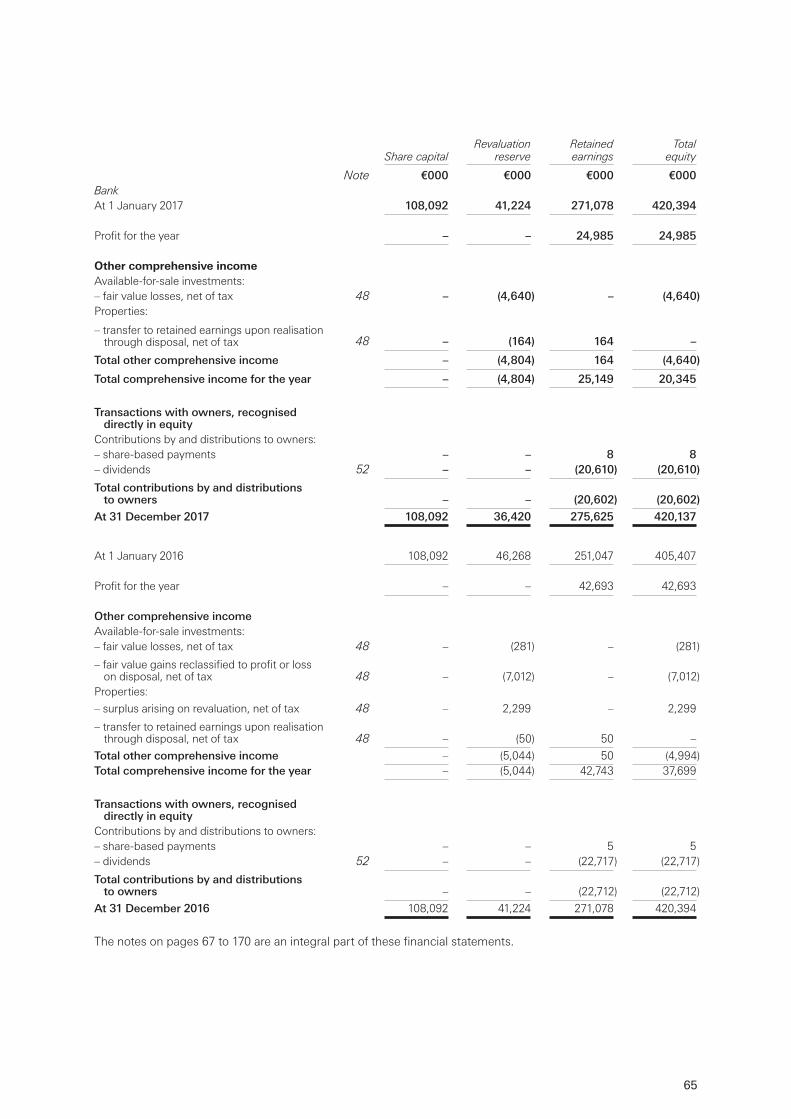
65
Share capitalRevaluation
reserve Retained earnings
Total equity
Note €000 €000 €000 €000BankAt 1 January 2017 108,092 41,224 271,078 420,394
Profit for the year – – 24,985 24,985
Other comprehensive incomeAvailable-for-sale investments:– fair value losses, net of tax 48 – (4,640) – (4,640)Properties:
– transfer to retained earnings upon realisation through disposal, net of tax 48 – (164) 164 –
Total other comprehensive income – (4,804) 164 (4,640)
Total comprehensive income for the year – (4,804) 25,149 20,345
Transactions with owners, recognised directly in equity
Contributions by and distributions to owners: – share-based payments – – 8 8– dividends 52 – – (20,610) (20,610)
Total contributions by and distributions to owners – – (20,602) (20,602)
At 31 December 2017 108,092 36,420 275,625 420,137
At 1 January 2016 108,092 46,268 251,047 405,407
Profit for the year – – 42,693 42,693
Other comprehensive incomeAvailable-for-sale investments:– fair value losses, net of tax 48 – (281) – (281)
– fair value gains reclassified to profit or loss on disposal, net of tax 48 – (7,012) – (7,012)
Properties:
– surplus arising on revaluation, net of tax 48 – 2,299 – 2,299
– transfer to retained earnings upon realisation through disposal, net of tax 48 – (50) 50 –
Total other comprehensive income – (5,044) 50 (4,994)Total comprehensive income for the year – (5,044) 42,743 37,699
Transactions with owners, recognised directly in equity
Contributions by and distributions to owners: – share-based payments – – 5 5 – dividends 52 – – (22,717) (22,717)
Total contributions by and distributions to owners – – (22,712) (22,712)
At 31 December 2016 108,092 41,224 271,078 420,394
The notes on pages 67 to 170 are an integral part of these financial statements.
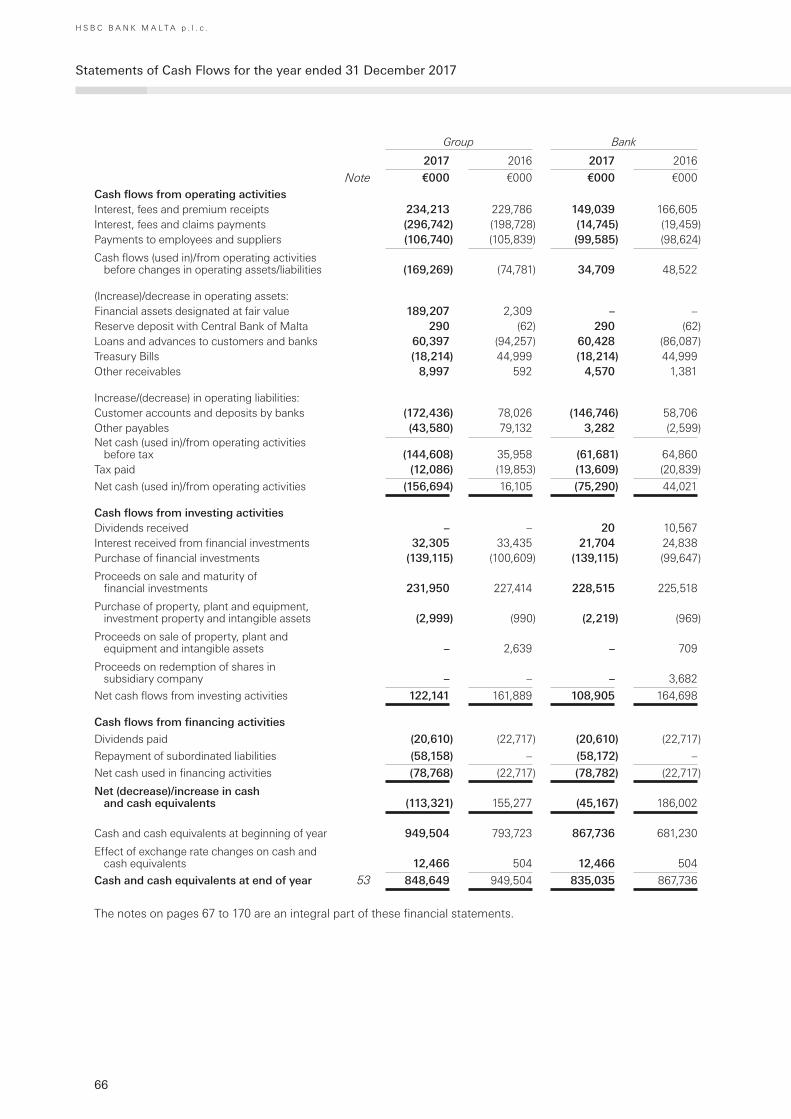
66
H S B C B A N K M A L T A p . l . c .
Statements of Cash Flows for the year ended 31 December 2017
Group Bank
2017 2016 2017 2016
Note €000 €000 €000 €000
Cash flows from operating activitiesInterest, fees and premium receipts 234,213 229,786 149,039 166,605Interest, fees and claims payments (296,742) (198,728) (14,745) (19,459)Payments to employees and suppliers (106,740) (105,839) (99,585) (98,624)
Cash flows (used in)/from operating activities before changes in operating assets/liabilities (169,269) (74,781) 34,709 48,522
(Increase)/decrease in operating assets:Financial assets designated at fair value 189,207 2,309 – –Reserve deposit with Central Bank of Malta 290 (62) 290 (62)Loans and advances to customers and banks 60,397 (94,257) 60,428 (86,087)Treasury Bills (18,214) 44,999 (18,214) 44,999Other receivables 8,997 592 4,570 1,381
Increase/(decrease) in operating liabilities:Customer accounts and deposits by banks (172,436) 78,026 (146,746) 58,706Other payables (43,580) 79,132 3,282 (2,599)Net cash (used in)/from operating activities
before tax (144,608) 35,958 (61,681) 64,860Tax paid (12,086) (19,853) (13,609) (20,839)
Net cash (used in)/from operating activities (156,694) 16,105 (75,290) 44,021
Cash flows from investing activitiesDividends received – – 20 10,567Interest received from financial investments 32,305 33,435 21,704 24,838Purchase of financial investments (139,115) (100,609) (139,115) (99,647)
Proceeds on sale and maturity of financial investments 231,950 227,414 228,515 225,518
Purchase of property, plant and equipment, investment property and intangible assets (2,999) (990) (2,219) (969)
Proceeds on sale of property, plant and equipment and intangible assets – 2,639 – 709
Proceeds on redemption of shares in subsidiary company – – – 3,682
Net cash flows from investing activities 122,141 161,889 108,905 164,698
Cash flows from financing activities
Dividends paid (20,610) (22,717) (20,610) (22,717)
Repayment of subordinated liabilities (58,158) – (58,172) –
Net cash used in financing activities (78,768) (22,717) (78,782) (22,717)
Net (decrease)/increase in cash and cash equivalents (113,321) 155,277 (45,167) 186,002
Cash and cash equivalents at beginning of year 949,504 793,723 867,736 681,230
Effect of exchange rate changes on cash and cash equivalents 12,466 504 12,466 504
Cash and cash equivalents at end of year 53 848,649 949,504 835,035 867,736
The notes on pages 67 to 170 are an integral part of these financial statements.

67
H S B C B A N K M A L T A p . l . c .
Notes on the Financial Statements
1 Reporting entity
HSBC Bank Malta p.l.c. (the ‘local group’) is a limited liability company domiciled and incorporated in Malta.
The consolidated financial statements of the local group as at and for the year ended 31 December 2017 comprise the bank and its subsidiaries. All amounts have been rounded to the nearest thousand, unless otherwise stated.
2 Basis of preparation
a Compliance with IFRSs as adopted by the EU
These consolidated financial statements have been prepared in accordance with the requirements of International Financial Reporting Standards (IFRSs) as adopted by the EU.
These financial statements have also been drawn up in accordance with the provisions of the Banking Act (Cap. 371) and the Maltese Companies Act (Cap. 386), enacted in Malta.
b Historical cost convention
These financial statements have been prepared on the historical cost basis, except for the intangible asset reflecting the present value of in-force long-term insurance business, and the following items that are measured at fair value:
– Held for trading derivatives;
– Financial assets designated at fair value through profit or loss;
– Available-for-sale financial investments;
– Property within ‘Property, plant and equipment’ and ‘Investment property’; and
– Liabilities under investment contracts.
c Interpretations and amendments to standards adopted by the local group
During 2017, the bank adopted a number of interpretations and amendments to standards which had an insignificant effect on the consolidated financial statements of the local group and the separate financial statements of the bank.
d New standards and interpretations not yet adopted
Minor amendments to IFRSs
The IASB has published a number of minor amendments to IFRSs which are effective from 1 January 2018 and 2019, some of which have been endorsed for use in the EU. The local group expects they will have an insignificant effect, when adopted, on the consolidated financial statements of the local group and the separate financial statements of the bank. The local group has not early adopted any of the amendments effective after 31 December 2017.
Major new IFRSs
The IASB has published IFRS 9 ‘Financial Instruments’, IFRS 15 ‘Revenue from Contracts with Customers’, IFRS 16 ‘Leases’ and IFRS 17 ‘Insurance contracts’. IFRS 9 , IFRS 15 and IFRS 16 have been endorsed for use in the EU and IFRS 17 has not yet been endorsed.
The impacts on adoption of IFRS 9 ‘Financial Instruments’ are outlined below. The bank’s Directors are of the view that there are no other pronouncements which will have a possible significant impact on the local group’s financial statements in the period of initial application.
IFRS 9 ‘Financial Instruments’
In July 2014, the IASB issued IFRS 9 ‘Financial Instruments’, which is the comprehensive standard to replace IAS 39 ‘Financial Instruments: Recognition and Measurement’, and includes requirements for classification and measurement of financial assets and liabilities, impairment of financial assets and hedge accounting.
Classification and measurement
The classification and measurement of financial assets will depend on how these are managed (the entity’s business model) and their contractual cash flow characteristics.
68
Notes on the Financial Statements (continued)
H S B C B A N K M A L T A p . l . c .
2 Basis of preparation (continued)
d New standards and interpretations not yet adopted (continued)
Classification and measurement (continued)
If a financial asset is held within a business model other than ‘hold to collect’ or ‘hold to collect and sell’ then the financial asset is required to be measured at fair value through profit or loss (FVTPL) without further analysis. For those financial assets where the contractual cash flows arising on specified dates that are solely payments of principal and interest (SPPI) on the principal amount outstanding, classification at amortised cost or fair value through other comprehensive income (FVOCI) will depend on whether the business model is to hold financial assets for the collection of contractual cash flows or whether the objective of the business model is achieved by both the collection of contractual cash flows and selling financial assets. If an instrument contains contractual cash flows which do not represent solely payments of principal and interest, then the classification to be used is FVTPL even if it is held in a business model that is either hold to collect or hold to collect and sell.
The local group’s business model is determined by key management personnel and reflects the strategic purpose and intention for the portfolio and how the performance of the portfolio is assessed. Since the business model is set at a portfolio level, the classification assessment for this criterion is accordingly performed at that level. Because the key distinction between the two business models identified in IFRS 9 is whether or not ‘sales’ are intrinsic to achieving the desired objectives, it is important to identify what is meant by ‘sales’. For the purposes of the business model assessment, these are transfers which would result in derecognition.
For those assets where the intention of the business model is to hold the financial assets to collect the contractual cash flows or to hold to collect and to sell, the local group assesses whether the cash flow characteristics of these assets meet the SPPI requirements of IFRS 9. ‘Principal’ is the fair value of the financial asset at initial recognition. It is not the amount that is due under the contractual terms of an instrument. ‘Interest’ is the compensation for time value of money and credit risk of a basic lending-type return. A basic lending-type return could also include consideration for other basic lending risks (for example, liquidity risk) and consideration for costs associated with holding the financial asset for a particular period of time (for example, servicing or administrative costs) and/or a profit margin.
Unlike the business model assessment, the SPPI assessment is performed for each individual product or portfolio of products. The following considerations are made when assessing consistency with SPPI:
– variable interest rates and modified relationships with the time value of money;
– leverage, being a contractual cash flow characteristic of some financial assets that increases the variability of the contractual cash flows with the result that they do not have economic characteristics of interest;
– contractual terms that allow the issuer to prepay (or the holder to put a debt instrument back to the issuer) before maturity and the prepayment amount substantially represents unpaid amounts of principal and interest, which may include reasonable compensation for early termination of the contract;
– contractual terms that allow the issuer or holder to extend the contractual term and the terms of the extension option result in contractual cash flows during the extension period that are solely payments of principal and interest, which may include reasonable compensation for the extension of the contract;
– contractual cash flows may be caused by an underlying contingent event (a trigger) such as contractual term resetting interest to a higher amount in the event of a missed payment; and
– contractual changes in interest rates.
More specifically, from the assessment that the local group conducted the following classification and measurement matters have been determined:
– loans and advances to banks and to customers that are classified as loans and receivables under IAS 39 will be measured at amortised cost under IFRS 9;
– financial assets designated at FVTPL will remain at FVTPL, because it is required under IFRS 9 or designation will continue;
– debt securities and treasury bills classified as available-for-sale under IAS 39 will be classified at FVOCI under IFRS 9 given that the objective of the business model is achieved by both the collection of contractual cash flows and selling of the financial assets; and
– equity securities will remain measured at fair value, with fair value movements recognised in other comprehensive income, since the equity securities currently held by the local group are held for reasons other than to generate a capital return.
There is no financial impact arising out of these changed classifications as the accounting measurements are principally the same as under IAS 39.
69
2 Basis of preparation (continued)
d New standards and interpretations not yet adopted (continued)
Impairment
The impairment requirements apply to financial assets measured at amortised cost and FVOCI, and certain loan commitments and financial guarantee contracts. At initial recognition, an impairment allowance (or provision in the case of commitments and guarantees) is required for expected credit losses (ECL) resulting from default events that are possible within the next 12 months (12-month ECL).
In the event of a significant increase in credit risk, an allowance (or provision) is required for ECL resulting from all possible default events over the expected life of the financial instrument (lifetime ECL). Financial assets where 12-month ECL is recognised are considered to be ‘stage 1’; financial assets which are considered to have experienced a significant increase in credit risk would be classified as ‘stage 2’; and financial assets for which there is objective evidence of impairment, and which considered to be in default or otherwise credit impaired, would be classified as ‘stage 3’.
Significant increase in credit risk (SICR)
The general principle of IFRS 9 ECL accounting requires that the credit risk of financial instruments within the scope of impairment to be assessed for significant increase since initial recognition at each balance sheet date. If there is a significant increase in credit risk, the financial instruments are transferred into Stage 2 and lifetime ECL is recognised. The principle of SICR can be achieved by performing an assessment to compare the risk of default occurring at the reporting date with the risk of default occurring at the date of initial recognition.
Wholesale exposures are usually managed on an individual basis for credit purposes, through relationship managers who have access to the customers and their financial information. A Customer Risk Rating (CRR) is assigned to each customer and is reviewed at least annually.
Although the CRR is assigned on an obligor/counterparty level rather than at the financial instrument level, it can still be used to assess significant increase in credit risk as long as it meets the underlying principles.
In applying the above, the CRR of the counterparty is inferred onto the outstanding financial instruments. For example, if a customer has a CRR of 3.1 when a loan is underwritten, the loan will have an initial recognition CRR of 3.1. If at the subsequent period end, the customer’s CRR has deteriorated to 5.2 and a second loan is being granted to the customer, both loans will have CRR of 5.2 on that day. For the first loan, the CRR has increased from 3.1 to 5.2. If this is considered significant, it will be transferred to Stage 2. For the second loan, the initial recognition CRR is 5.2. It will remain in Stage 1 until the CRR has increased significantly in subsequent periods. While all outstanding loans to the same obligor/counterparty will have the same CRR at the reporting date, the respective loans might be in different stages depending on the initial recognition CRR, unless the obligor is in the ‘Watch or Worry Status’, in which case all associated facilities (excluding those cases on the list for non-credit related reasons) will be transferred to Stage 2 immediately.
A CRR on its own is not a measure that meets all the requirements of IFRS 9 (e.g. it does not incorporate forward looking information). However, within the HSBC Group, CRRs are used to determine regulatory Probabilities of Default (PDs), and with appropriate adjustments, these PDs are used for IFRS 9 purposes. Each CRR is associated with an external rating grade by reference to long-run default rates for that grade, represented by the average of issuer-weighted historical default rates. This mapping between internal and external ratings is indicative and may vary over time. Therefore regulatory PD models calibrated at the level of HSBC Group are leveraged to derive a measure that is appropriate to assess significant increase in credit risk under IFRS 9.
As regulatory PDs are generally calculated over 12 months, one of the adjustments required is to incorporate the term structure into the PD to obtain the lifetime PD. The lifetime PD is determined by calculating the PD for each year over the life of the financial instrument. For example, for a five-year loan, PDs are calculated for each of the five years. The year-1 PD is calculated as the probability of the loan defaulting within the first year of it being issued. The year-2 PD is calculated as the probability of the loan surviving the first year but defaulting in the second year. The same principle of survival applies to the PDs of years 3 – 5. These yearly PDs are added together to arrive at the cumulative lifetime PD. As each year passes, the cumulative lifetime PD reduces in line with the reduction in the residual life of the loan. Albeit, significant increase in credit risk is measured by comparing the average PD for the remaining term estimated at origination with the equivalent estimation at reporting date.
Retail exposures, unlike Wholesale exposures, are not managed on a credit by credit basis (e.g. through relationship managers), due to the high volume of relatively low value and homogeneous exposures. As a result, it is not feasible to replicate the Wholesale approach for Retail exposures. The Retail methodology takes into account the nature of the Retail exposures and the underlying credit risk management practices. The Retail portfolio comprises mortgages, personal loans and overdrafts, as well as credit cards.
70
Notes on the Financial Statements (continued)
H S B C B A N K M A L T A p . l . c .
2 Basis of preparation (continued)
d New standards and interpretations not yet adopted (continued)
Impairment (continued)
Significant increase in credit risk (SICR) (continued)
Utilisation of the Retail methodology to determine whether a significant increase in credit risk has occurred is based on meeting the following three criteria:
a the credit risks of exposures within the portfolio are similar;
b any increase in the credit risk below the threshold is not considered significant; and
c the risk measure used (e.g. PD) includes all available information, including forward looking information.
Given how Retail customers are accepted and managed for credit risk, Retail customers within a particular segment will have similar credit risk at initial recognition. The measure, or threshold, used to assess significant increase in credit risk for the Retail portfolios is the average PD twelve months prior to exposures falling more than 30 days past due. Portfolio segments whose 12-month default rate is higher than this threshold would be classified as Stage 2. However, with respect to mortgages, through the look back method, it has been determined that all exposures that are one day past due would require such exposures to be classified as Stage 2. In this respect, the transfer criteria for the mortgages portfolio is assessed on the instrument’s delinquency period.
Definition of default
IFRS 9 requires an assessment of the extent of increase in credit risk of a financial instrument since initial recognition. This assessment is performed by considering the change in the risk of default occurring over the remaining life of the financial instrument. As a result, the definition of default is important.
IFRS 9 does not specifically define default, but requires it to be applied on a consistent basis with internal credit risk management practice for the relevant instruments and requires consideration of qualitative factors where appropriate. In addition, IFRS 9 also introduces a rebuttable presumption that default does not occur later than when a financial asset is 90 days past due unless there is reasonable and supportable information to demonstrate that a more lagging criterion is more appropriate.
In this respect, the local group determines that a financial instrument is credit-impaired and in Stage 3 by considering relevant objective evidence, primarily whether:
– contractual payments of either principal or interest are past due for more than 90 days;
– there are other indications that the borrower is unlikely to pay such as that a concession has been granted to the borrower for economic or legal reasons relating to the borrower’s financial condition; and
– the loan is otherwise considered to be in default. If such unlikeliness to pay is not identified at an earlier stage, it is deemed to occur when an exposure is 90 days past due, even where regulatory rules permit default to be defined based on 180 days past due.
Therefore, the definitions of credit-impaired and default are aligned as far as possible so that Stage 3 represents all loans which are considered defaulted or otherwise credit-impaired.
Renegotiated loans
A ‘renegotiated loan’ is a loan where the contractual payment terms have been renegotiated or otherwise modified because the local group has significant concerns about the borrower’s ability to meet contractual payments when due. In general, renegotiated loans are regarded as credit-impaired upon renegotiation unless the concession is insignificant and there are no other indicators of impairment. Moreover, loans are considered renegotiated irrespective of whether the modification is significant or not. Thus, de-recognition or otherwise of the financial asset would not have a bearing on whether the financial asset remains classified in the respective stage allocation. A range of forbearance strategies are employed upon the renegotiation of a loan in order to improve the management of customer relationships, maximise collection opportunities and, if possible, avoid default, foreclosure or repossession. They include extended payment terms, a reduction in interest or principal repayments, approved external debt management plans, debt consolidations, the deferral of foreclosures, and other forms of loan modifications and re-ageing (re-ageing is an account action where the customer account is reclassified as being up to date without the customer having paid the arrears in full).
The local group’s policies and practices are based on criteria which enable local management to judge whether repayment is likely to continue. Forbearance measures typically provide a customer with terms and conditions that are more favourable than those provided initially. Forbearance/renegotiation is only granted in situations where the customer has showed a willingness to repay the borrowing and is expected to be able to meet the revised obligations.

71
2 Basis of preparation (continued)
d New standards and interpretations not yet adopted (continued)
Impairment (continued)
Definition of default (continued)
Renegotiated loans (continued)
As suggested previously, Wholesale renegotiated loans are considered credit-impaired and accordingly classified as Stage 3 assets. They can be cured out of the credit impaired status subsequently. When evidence suggests that the renegotiated asset is no longer credit-impaired, the asset is transferred out of Stage 3. This is assessed on the basis on historical and forward looking information and an assessment of the credit risk over the expected life of the asset, including information about the circumstances that led to the renegotiation.
Similarly, Retail renegotiated loans are also classified as Stage 3 assets. In contrast, Retail renegotiated loans do not cure out of the credit impaired status. This is due to operational reasons in view of challenges in model monitoring and model limitations. However, the effect of this treatment is considered insignificant.
With respect to Wholesale exposures the local group has incorporated evidence of credit impairment/default into the internal CRR used to rate Wholesale exposures. A defaulted or credit-impaired financial asset is assigned CRR 9 or 10. These exposures are usually managed by the local group’s loan management unit (LMU).
With respect to Retail exposures, evidence of credit impairment/default is also incorporated into the PD model. A retail exposure with a PD of 1 i.e. 100% probability is considered defaulted and credit-impaired.
Expected credit loss
In general, the local group calculates ECL using three main components: PD, loss given default (LGD), and exposure at default (EAD). The local group calculates the ECL for the Wholesale portfolio at an instrument level, whilst the ECL for Retail portfolios is calculated on a collective basis.
The 12-month ECL is calculated by multiplying the 12-month PD, LGD, and EAD. Lifetime ECL is calculated on a similar basis for the residual life of the exposure. The 12-month and lifetime PDs represent the probability of default occurring over the next 12 months and the remaining maturity of the instrument, respectively. With respect to the Wholesale portfolio, given the local group’s inherent lack of history of defaults to derive coherent PDs, proxy PDs are used as part of a Smaller Site Methodology. These proxy PDs are derived from regulatory PDs determined at HSBC Group level, and are adjusted for a scalar and a management overlay to reflect the economic realities of the market the local group operates in. The scalar denotes a risk parameter that helps translate the regulatory PDs into PDs relevant to the local scenario. In contrast, PDs for the Retail portfolio are based on internally developed statistical models using the local group’s data.
The LGD represents expected losses on the EAD given the event of default, taking into account, among other attributes, the mitigating effect of collateral value at the time it is expected to be realised and the time value of money. The LGD used for the Wholesale portfolio is driven by the loan-to-value ratio of the individual facilities, and takes into account other assumptions, including market value haircut (which includes costs to sell), time to sell and discounting the collateral from the date of realisation back to the date of default. Similarly, the LGD for the Mortgages portfolio is also driven by the loan-to-value ratio of exposures, taking into account similar assumptions as those in the Wholesale portfolio. In contrast, the LGD for the remaining Retail portfolios (personal loans, overdrafts and credit cards), is based on the local group’s recovery history.
The EAD represents the expected balance at default, taking into account the repayment of principal and interest from the balance sheet date to the default event together with any expected drawdowns of committed facilities. The ECL is measured from the initial recognition of the financial asset. The maximum period considered when measuring ECL (be it 12-month or lifetime ECL) is the maximum contractual period over which the local group is exposed to credit risk. With respect to non-revolving credit facilities, the contractual life of the facility is considered. In contrast, in respect of revolving credit facilities, the local group distinguishes between individually managed exposures and collectively managed exposures. For individually managed exposures, which mostly form part of the Wholesale portfolio, credit risk management actions are taken no less frequently than on an annual basis and therefore this period is to the expected date of the next substantive credit review. The date of the substantive credit review also represents the initial recognition of the new facility. In contrast, with respect to the remaining revolving credit facilities, the lifetime of such exposures is defined as the point where 95% of the defaults have materialised – thus, the lifetime of such assets may be longer than 12 months.
Forward looking information
The recognition and measurement of ECL is highly complex and involves the use of significant judgement and estimation, including in the formulation and incorporation of multiple forward-looking economic conditions into the ECL estimates to meet the measurement objective of IFRS 9.
Three scenarios are considered to capture non-linearity across credit portfolios. If the economic environment is considered to be particularly adverse and results in a more pronounced non-linearity impact, senior management will exercise judgement, recommend overlays and/or commission additional scenarios. This approach on the whole is operationally feasible and will result in transparent outcomes.
72
Notes on the Financial Statements (continued)
H S B C B A N K M A L T A p . l . c .
2 Basis of preparation (continued)
d New standards and interpretations not yet adopted (continued)
Impairment (continued)
Forward looking information (continued)
The three scenarios will include a central or baseline view driven by a consensus among professional industry forecasts. Two additional outer scenarios – an ‘upside’ and a ‘downside’ – will be constructed using a ‘rules-based’ system supported by a scenario narrative that will reflect the current top and emergent risks. The key point to note is that the ‘outer’ scenarios will be economically plausible states of the world and will not necessarily be as severe as scenarios used in stress testing. The period of forecast is five years after which the forecasts will revert to a more ‘through the cycle’ view.
A Forward Economic Guidance (FEG) methodology has been developed to generate the economic inputs to help drive the IFRS 9 ECL models used by credit risk. The scenarios will have probabilities attached, based on a mixture of quantitative analysis and management judgement, with reference to an assessment of the economic risk landscape. The scenarios will be enriched to produce the necessary variables that are required by the impairment models. For further guidance on the application of FEG, refer to the Report on Transition to IFRS 9 ‘Financial Instruments’ published by HSBC Group.
Presentation of ECL in statement of financial position (SOFP)
For financial assets that are measured at amortised cost, the ECL allowance is presented against the carrying amount of the assets on the balance sheet, thereby reducing the carrying amount.
For financial assets measured at fair value through other comprehensive income, the loss allowance is presented within other comprehensive income and not against the carrying amount of the assets. The carrying amount of the asset is always the fair value.
Transition
The classification and measurement and impairment requirements are applied retrospectively by adjusting the opening balance sheet at the date of initial application, with no requirement to restate comparative periods. The mandatory application date for the standard as a whole is 1 January 2018. The local group has not restated its comparative periods. Accordingly, all adjustments resulting from the transition apply by adjusting the opening balance sheet as at 1 January 2018.
Transitional impact
Adoption is expected to reduce net assets of the local group at 1 January 2018 by €8.1m, net of deferred tax of €4.3m. The local group has adopted the regulatory transitional arrangements adopted by the EU on 27 December 2017. These permit banks to add back to their capital base a proportion of the impact that IFRS 9 has upon their loan loss allowances during the first five years of use. The proportion that banks may add back starts at 95% in 2018, and reduces to 25% by 2022. As a result, the CET 1 after the regulatory transitional period of five years is expected to reduce by 30 basis points.
Disclosures
IFRS 9 requires extensive disclosures both on a quarterly and on an annual basis. Within the HSBC Group, there is a globally consistent production process providing these disclosures which the local group will be making use of. A system of controls has been put in place to ensure that the reported financial information is both consistent and reasonably accurate.
Hedge accounting
The general hedge accounting requirements aim to simplify hedge accounting, creating a stronger link with risk management strategy and permitting hedge accounting to be applied to a greater variety of hedging instruments and risks, but do not explicitly address macro hedge accounting strategies, which are particularly important for banks. As a result, IFRS 9 includes an accounting policy choice to remain with IAS 39 hedge accounting.
Although the local group deploys a number of hedging strategies to mitigate or offset risks that arise from its activities, none of its strategies achieve hedge accounting in terms of IAS 39. Accordingly, the local group expects that IFRS 9 will have no impact in this regard.
IFRS 15 ‘Revenue from Contracts with Customers’
In May 2014, the IASB issued IFRS 15 ‘Revenue from Contracts with Customers’ and it is effective for annual periods beginning on or after 1 January 2018. IFRS 15 provides a principles-based approach for revenue recognition, and introduces the concept of recognising revenue for performance obligations as they are satisfied. The local group will adopt the standard on its mandatory effective date, and the standard will be applied on a retrospective basis, recognising the cumulative effect, if any, of initially applying the standard as an adjustment to the opening balance of retained earnings. The local group has assessed the impact of IFRS 15 and expects that the standard will have no significant effect, when applied, on the consolidated financial statements of the local group and the separate financial statements of the bank.
73
2 Basis of preparation (continued)
d New standards and interpretations not yet adopted (continued)
IFRS 16 ‘Leases’
In January 2016, the IASB issued IFRS 16 ‘Leases’ with an effective date for annual periods beginning on or after 1 January 2019. IFRS 16 results in lessees accounting for most leases within the scope of the standard in a manner similar to the way in which finance leases are currently accounted for under IAS 17 ‘Leases’. Lessees will recognise a ‘right of use’ asset and a corresponding financial liability on the balance sheet. The asset will be amortised over the length of the lease, and the financial liability measured at amortised cost. Lessor accounting remains substantially the same as under IAS 17. The local group is currently assessing the impact of IFRS 16, and it is not practicable to quantify the effect at the date of the publication of these financial statements. Existing operating lease commitments are set out in Note 51.
IFRS 17 ‘Insurance contracts’
IFRS 17 ‘Insurance contracts’ was issued in May 2017, and sets out the requirements that an entity should apply in accounting for insurance contracts it issues and reinsurance contracts it holds. IFRS 17 is effective from 1 January 2021, and the local group is considering its impact.
e Functional and presentation currency
The functional currency of the bank is euro, which is also the presentation currency of the consolidated financial statements of the local group.
f Critical accounting estimates and judgements
The preparation of financial information in accordance with the requirements of IFRSs as adopted by the EU requires the use of estimates and judgements about future conditions. In view of the inherent uncertainties and the high level of subjectivity involved in the recognition or measurement of items listed below, it is possible that the outcomes in the next financial year could differ from those on which management’s estimates are based, resulting in materially different conclusions from those reached by management for the purposes of the 2017 Financial Statements. Management’s selection of the local group’s accounting policies which contain critical estimates and judgements is listed below; it reflects the materiality of the items to which the policies are applied, the high degree of judgement and estimation uncertainty involved:
– Impairment of loans and advances: Note 3(d)(ii) and Note 16;
– Valuation of financial instruments: Note 5;
– Policyholder claims and benefits: Note 3(n)(ii) and Note 15;
– Present value of in-force long-term assurance business (PVIF): Note 3(n)(iv) and Note 35.
Further information about assumptions and estimation uncertainties that have a significant risk of resulting in a material adjustment, related to the matters highlighted above, is included in Note 60.
In management’s view, apart from judgements involving estimations as reflected above, there are no significant or critical judgements made in the process of applying the local group’s accounting policies that have a more significant effect on the amounts recognised in the financial statements.
3 Significant accounting policies
This note provides a list of the significant accounting policies adopted in the preparation of these consolidated financial statements. These policies have been consistently applied to all the years presented, unless otherwise stated.
a Basis of consolidation
i Consolidation
HSBC Bank Malta p.l.c. controls and consequently consolidates an entity when it is exposed, or has rights, to variable returns from its involvement with the entity and has the ability to affect those returns through its power over the entity. Control is initially assessed based on consideration of all facts and circumstances, and is subsequently reassessed when there are significant changes to the initial setup. The local group is considered to have power over an entity when it has existing rights that give it the current ability to direct the relevant activities. For the local group to have power over an entity, it must have the practical ability to exercise those rights.
74
Notes on the Financial Statements (continued)
H S B C B A N K M A L T A p . l . c .
3 Significant accounting policies (continued)
a Basis of consolidation (continued)
i Consolidation (continued)
Where an entity is governed by voting rights, the group would consolidate when it holds, directly or indirectly, the necessary voting rights to pass resolutions by the governing body. In all other cases, the assessment of control is more complex and requires judgement of other factors, including having exposure to variability of returns, power over the relevant activities or holding the power as agent or principal. The local group may have power over an entity even though it holds less than a majority of the voting rights, if it holds additional rights arising through other contractual arrangements or substantive potential voting rights which give it power.
Business combinations are accounted for using the acquisition method. The cost of an acquisition is measured at the fair value of the consideration, including contingent consideration, given at the date of exchange. Acquisition-related costs are recognised as an expense in profit or loss in the period in which they are incurred. The acquired identifiable assets, liabilities and contingent liabilities are generally measured at their fair values at the date of acquisition. Goodwill is measured as the excess of the aggregate of the consideration transferred, the amount of non-controlling interest and the fair value of the local group’s previously held equity interest, if any, over the net of the amounts of the identifiable assets acquired and the liabilities assumed. On an acquisition-by-acquisition basis, the amount of non-controlling interest is measured either at fair value or at the non-controlling interest’s proportionate share of the acquiree’s identifiable net assets. For acquisitions achieved in stages, the previously held equity interest is remeasured at the acquisition-date fair value with the resulting gain or loss recognised in profit or loss.
Changes in the parent’s ownership interest in a subsidiary that do not result in a loss of control are treated as transactions between equity owners of the local group and the net impact is reported within equity.
Subsidiaries are fully consolidated from the date on which control is transferred to the local group. They are deconsolidated from the date that control ceases.
ii Structured entities
A structured entity is an entity that has been designed so that voting or similar rights are not the dominant factor in deciding who controls the entity, for example when any voting rights relate to administrative tasks only, and key activities are directed by contractual arrangements. Structured entities often have restricted activities and a narrow and well defined objective.
Structured entities are assessed for consolidation in accordance with the local group’s accounting policy set out above.
When assessing whether to consolidate HSBC managed investment funds, the local group reviews all facts and circumstances to determine whether the local group, as fund manager, is acting as agent or principal. The local group may be deemed to be a principal, and hence would control and consolidate the funds, i) when it acts as fund manager and cannot be removed without cause, ii) has variable returns through significant unit holdings and/or a guarantee provided, and iii) is able to influence the returns of the funds by exercising its power.
iii Transactions eliminated on consolidation
All intra-group balances and income and expenses arising from intra-group transactions, are eliminated on consolidation. Unrealised losses are eliminated in the same way as unrealised gains, but only to the extent that there is no evidence of impairment of the transferred asset.
b Financial assets
i Initial recognition
The local group recognises a financial asset in its statement of financial position when it becomes a party to the contractual provisions of the instrument. Regular way purchases and sales of financial assets are recognised on the trade date, which is the date on which the local group commits to purchase or sell the asset. Accordingly, the local group uses trade date accounting for regular way contracts when recording financial asset transactions.
ii Classification
The local group classifies its financial assets in the following categories: at fair value through profit or loss, loans and receivables and available-for-sale investments. The classification depends on the purpose for which the financial assets were acquired. Management determines the classification of its financial assets at initial recognition.
75
3 Significant accounting policies (continued)
b Financial assets (continued)
ii Classification (continued)
1 Financial assets at fair value through profit or loss
This category comprises two sub-categories: financial assets classified as held for trading, and financial assets designated by the local group as at fair value through profit or loss upon initial recognition.
a Held for trading
A financial instrument is classified as held for trading if it is acquired or incurred principally for the purpose of selling or repurchasing it in the near term or if it is part of a portfolio of identified financial instruments that are managed together and for which there is evidence of a recent actual pattern of short-term profit-taking. Derivatives are also categorised as held for trading unless they are designated and considered effective as hedging instruments.
b Financial instruments designated at fair value through profit or loss
Financial instruments, other than those held for trading, are classified in this category if they meet one or more of the criteria set out below, and are so designated irrevocably at inception. The local group designates financial instruments at fair value when the designation:
– eliminates or significantly reduces measurement or recognition inconsistencies that would otherwise arise from measuring financial instruments (financial assets or financial liabilities), or recognising gains and losses from related positions, on different bases. Under this criterion, the financial instruments designated by the local group comprise financial assets under unit-linked insurance contracts and unit-linked investment contracts and financial liabilities under unit-linked investment contracts.
Liabilities to customers under unit-linked contracts are determined based on the fair value of the assets held in the linked funds, with changes recognised in profit or loss. If no fair value designation was made for the assets related to these customer liabilities, the assets would be classified as available-for-sale, with the changes in fair value recorded in other comprehensive income. The related financial assets and financial liabilities are managed and reported to management on a fair value basis. Designation at fair value of the financial assets and related liabilities under investment contracts allows the changes in fair values to be recorded in profit or loss and presented in the same line.
– applies to groups of financial instruments (financial assets, financial liabilities or combinations thereof) that are managed, and their performance evaluated, on a fair value basis in accordance with a documented risk management or investment strategy, and where information about the groups of financial instruments is reported to management on that basis. Certain financial assets held to meet liabilities under non-linked insurance contracts are the main class of financial instruments designated at fair value through profit or loss under this criterion. The local group has documented risk management and investment strategies designed to manage and monitor market risk of those assets on a net basis after considering non-linked liabilities.
Financial instruments classified within this category are recognised initially at fair value; transaction costs are taken directly to profit or loss. Subsequent to initial recognition, changes in fair values are recognised in profit or loss within ‘Net income from financial instruments designated at fair value attributable to insurance operations’.
2 Loans and receivables
Loans and receivables are non-derivative financial assets with fixed or determinable payments that are not quoted in an active market, other than:
– those that the local group intends to sell immediately or in the short-term, which are classified as held for trading, and those that the entity upon initial recognition designates as at fair value through profit or loss;
– those that the local group upon initial recognition designates as available-for-sale; or
– those for which the holders may not recover substantially all of their initial investment, other than because of credit deterioration.
76
Notes on the Financial Statements (continued)
H S B C B A N K M A L T A p . l . c .
3 Significant accounting policies (continued)
b Financial assets (continued)
ii Classification (continued)
2 Loans and receivables (continued)
The local group’s loans and receivables principally comprise loans and advances to banks and customers. Loans and receivables are recognised when cash is advanced to a borrower or funds placed with a counterparty. They are initially recorded at fair value – which is the case consideration to originate or purchase the loan – plus any directly attributable transaction costs and are subsequently measured at amortised cost using the effective interest method, less impairment allowance. Amortised cost is the initial measurement amount adjusted for the amortisation of any difference between the initial and maturity amounts using the effective interest method.
3 Available-for-sale financial investments
Available-for-sale investments are financial assets that are intended to be held for an indefinite period of time, which may be sold in response to needs for liquidity or changes in interest rates, exchange rates or equity prices, or that are not classified as loans and receivables or financial assets at fair value through profit or loss. Treasury Bills, debt securities and equity securities intended to be held on a continuing basis, other than those designated at fair value, are classified as available-for-sale.
Available-for-sale financial assets are initially measured at fair value plus direct and incremental transaction costs. They are subsequently re-measured at fair value, and changes therein are recognised in other comprehensive income until the financial assets are either sold or become impaired. When available-for-sale financial investments are sold, the cumulative gains or losses previously recognised in other comprehensive income are reclassified to profit or loss as ‘Net gains on sale of available-for-sale financial investments’.
Interest income is recognised in profit or loss over the debt asset’s expected life using the effective interest method. Premiums and/or discounts arising on the purchase of dated debt securities are included in the interest recognised. Dividends from equity assets are recognised in profit or loss when the right to receive payment is established. Foreign currency gains and losses arising on retranslation of monetary assets classified as available-for-sale are recognised in profit or loss.
Unquoted equity securities, the fair value of which cannot be reliably measured, are carried at cost less impairment.
iii Derecognition of financial assets
Financial assets are derecognised when the contractual rights to receive cash flows from the assets have expired or when the local group has transferred its contractual right to receive the cash flows of the financial assets, and either:
– substantially all the risks and rewards of ownership have been transferred; or
– the local group has neither retained nor transferred substantially all the risks and rewards, but has not retained control.
c Derivative financial instruments
Derivatives are initially recognised and are subsequently re-measured at fair value. Fair values of exchange traded derivatives are obtained from quoted market prices. Fair values of over-the-counter derivatives are obtained using valuation techniques, including discounted cash flow models and option pricing models. Derivatives are classified as assets when their fair value is positive or as liabilities when their fair value is negative.
Embedded derivatives are bifurcated from the host contract when their economic characteristics and risks are not clearly and closely related to those of the host non-derivative contract, their contractual terms would otherwise meet the definition of a stand-alone derivative and the combined contract is not held for trading or designated at fair value through profit or loss. The bifurcated embedded derivatives are measured at fair value with changes therein recognised in profit or loss.
All the local group’s derivative financial instruments are designated as held for trading as they are not designated as hedging instruments in accordance with the requirements of IAS 39.
Accordingly, all gains and losses from changes in the fair values of derivatives that do not qualify for hedge accounting are recognised immediately in profit or loss. These gains and losses are reported in Net trading income, except where derivatives are managed in conjunction with financial instruments designated at fair value through profit or loss in which case gains and losses are reported in ‘Net income/(expense) from financial instruments designated at fair value attributable to insurance operations’.
77
3 Significant accounting policies (continued)
d Impairment of financial assets
i Financial investments: available-for-sale securities
Available-for-sale financial assets are assessed at each reporting date for objective evidence of impairment. If such evidence exists as a result of one or more events that occurred after the initial recognition of the financial asset (a ‘loss event’) and that loss event has an impact, which can be reliably measured, on the estimated future cash flows of the financial asset an impairment loss is recognised.
If the available-for-sale financial asset is impaired, the difference between the financial asset’s acquisition cost (net of any principal repayments and amortisation) and the current fair value, less any previous impairment loss recognised in profit or loss, is reclassified from other comprehensive income and recognised in profit or loss as a reclassification adjustment.
In assessing objective evidence of impairment at the reporting date in relation to available-for-sale debt securities, the local group considers all available evidence, including observable data or information about events specifically relating to the securities which may result in a shortfall in recovery of future cash flows. Financial difficulties of the issuer, as well as other factors such as information about the issuers’ liquidity, business and financial risk exposures, levels of and trends in default for similar financial assets, national and local economic trends and conditions, and the fair value of collateral and guarantees may be considered individually, or in combination, to determine if there is objective evidence of impairment.
The primary indicators of potential impairment are considered to be adverse fair value movements and the disappearance of an active market for a security, while changes in credit ratings are of secondary importance.
Objective evidence of impairment for available-for-sale equity securities may include specific information about the issuer as detailed above, but may also include information about significant changes in technology, markets, economics or the law that provides evidence that the cost of the equity securities may not be recovered.
A significant or prolonged decline in the fair value of the equity security classified as available-for-sale below its cost is also objective evidence of impairment. In assessing whether it is significant, the decline in fair value is evaluated against the original cost of the asset at initial recognition. In assessing whether it is prolonged, the decline is evaluated against the continuous period in which the fair value of the asset has been below its original cost at initial recognition.
Once an impairment loss has been recognised on an available-for-sale financial asset, the subsequent accounting treatment for changes in the fair value of that asset differs depending on the type of asset:
– for an available-for-sale debt security, a subsequent decline in the fair value of the instrument is recognised in profit or loss when there is further objective evidence of impairment as a result of further decreases in the estimated future cash flows of the financial asset. Where there is no further objective evidence of impairment, the decline in the fair value of the financial asset is recognised in other comprehensive income. If the fair value of a debt security increases in a subsequent period, and the increase can be objectively related to an event occurring after the impairment loss was recognised in profit or loss, or the instrument is no longer impaired, the impairment loss is reversed through profit or loss.
– for an available-for-sale equity security, all subsequent increases in the fair value of the instrument are treated as a revaluation and are recognised in other comprehensive income. Impairment losses recognised on the equity security are not reversed through profit or loss. Subsequent decreases in the fair value of the available-for-sale equity security are recognised in profit or loss, to the extent that further cumulative impairment losses have been incurred.
ii Loans and receivables
Losses for impaired loans are recognised promptly when there is objective evidence that impairment of a loan or portfolio of loans has occurred. Impairment allowances are calculated on individual loans and on groups of loans assessed collectively, are recorded as charges in profit or loss, and are recorded against the carrying amount of impaired loans through the use of impairment allowance accounts. Losses which may arise from future events are not recognised.
78
Notes on the Financial Statements (continued)
H S B C B A N K M A L T A p . l . c .
3 Significant accounting policies (continued)
d Impairment of financial assets (continued)
ii Loans and receivables (continued)
Individually assessed loans and advances
The factors considered in determining whether a loan is individually significant for the purposes of assessing impairment include:
– the size of the loan;
– the number of loans in the portfolio; and
– the importance of the individual loan relationship, and how this is managed.
Loans that are determined to be individually assessed for impairment, except when volumes of defaults and losses are sufficient to justify treatment under a collective assessment methodology.
For all loans that are considered individually significant, the local group considers on a case-by-case basis at each reporting date whether there is any objective evidence that a loan is impaired. The criteria used by the local group to make this assessment include:
– known cash flow difficulties experienced by the borrower;
– contractual payments of either principal or interest being past due for more than 90 days;
– the probability that the borrower will enter bankruptcy or other financial realisation;
– a concession granted to the borrower for economic or legal reasons relating to the borrower’s financial difficulty that results in forgiveness or postponement of principal, interest or fees, where the concession is not insignificant; and
– there has been deterioration in the financial condition or outlook of the borrower such that its ability to repay is considered doubtful.
For loans where objective evidence of impairment exists, impaired losses are determined considering the following factors:
– the local group’s aggregate exposure to the customer;
– the viability of the customer’s business model and their capability to trade successfully out of financial difficulties and generate sufficient cash flow to service debt obligations;
– the amount and timing of expected receipts and recoveries;
– the likely dividend available on liquidation or bankruptcy;
– the extent of other creditors’ commitments ranking ahead of, or pari passu with, the local group and the likelihood of other creditors continuing to support the customer;
– the complexity of determining the aggregate amount and ranking of all creditor claims and the extent to which legal and insurance uncertainties are evident;
– the realisable value of security (or other credit risk mitigants) and likelihood of successful repossession; and
– the likely costs of obtaining and selling collateral as part of foreclosure.
Determination of the realisable value of security is based on the current market value when the impairment assessment is performed. The value is not adjusted for expected future changes in market prices, though adjustments are made to reflect local conditions, such as forced sale discounts.
Impairment losses are calculated by discounting the expected future cash flows of a loan, which includes expected future receipts of contractual interest, at the loan’s original effective interest rate and comparing the resultant present value with the loan’s current carrying amount. The impairment allowances on individually significant accounts are reviewed at least annually and more regularly when circumstances necessitate review. This normally encompasses re-assessment of the enforceability of any collateral held and the timing and amount of actual and anticipated receipts. Individually assessed impairment allowances are only released when there is reasonable and objective evidence of a reduction in the established loss estimate.
79
3 Significant accounting policies (continued)
d Impairment of financial assets (continued)
ii Loans and receivables (continued)
Collectively assessed loans and advances
Impairment is assessed on a collective basis:
– to cover losses which have been incurred but have not yet been identified on loans subject to individual assessment; and
– for homogeneous groups of loans that are not considered individually significant.
a Incurred but not yet identified impairment
Individually assessed loans for which no evidence of loss has been specifically identified on an individual basis are grouped together according to their credit risk characteristics for a collective impairment assessment. These credit risk characteristics may include type of business involved, type of products offered, security obtained or other relevant factors. This assessment captures impairment losses that the local group has incurred as a result of events occurring before the reporting date, which the local group is not able to identify on an individual loan basis, and that can be reliably estimated. These losses would only be identified individually in the future. When information becomes available which identifies losses on individual loans within the group, those loans are removed from the group and assessed on an individual basis.
The collective impairment allowance is determined after taking into account:
– historical loss experience in portfolios of similar risk characteristics (for example, by industry sector, loan grade or product);
– the estimated period between impairment occurring and the loss being identified and evidenced by the establishment of an appropriate allowance against the individual loan; and
– management’s judgement as to whether the current economic and credit conditions are such that the actual level of inherent losses at the reporting date is likely to be greater or less than that suggested by historical experience.
The period between a loss occurring and its identification is estimated by local management for each identified portfolio based on economic and market conditions, customer behaviour, portfolio management information, credit management techniques and collection and recovery experiences in the market. As it is assessed empirically on a periodic basis the estimated period between a loss occurring and its identification may vary over time as these factors change.
b Homogeneous groups of loans and advances
For homogeneous groups of loans that are not considered individually significant, two alternative methods are used to calculate allowances on a portfolio basis:
– When appropriate empirical information is available, the local group utilises roll rate methodology. This methodology employs statistical analysis of historical data and experience of delinquency and default to estimate the amount of the loans that will eventually be written off as a result of the events occurring before the reporting date but which the group is not able to identify individually. Individual loans are grouped using ranges of past due days; statistical analysis is then used to estimate the likelihood that loans in each range will progress through the various stages of delinquency and become irrecoverable. In applying this methodology, adjustments are made to estimate the periods of time between a loss event occurring and its discovery, for example through a missed payment, (known as the emergence period) and the period of time between discovery and write-off (known as the outcome period). Current economic conditions are also evaluated when calculating the appropriate level of allowance required to cover inherent loss.
– When the portfolio size is small or when information is insufficient or not reliable enough to adopt a roll rate methodology, the local group adopts a formulaic approach based on historical loss rate experience. Where a basic formulaic approach is undertaken, the period between a loss event occurring and its identification is explicitly estimated by local management.
80
Notes on the Financial Statements (continued)
H S B C B A N K M A L T A p . l . c .
3 Significant accounting policies (continued)
d Impairment of financial assets (continued)
ii Loans and receivables (continued)
Collectively assessed loans and advances (continued)
b Homogeneous groups of loans and advances (continued)
The inherent loss within each portfolio is assessed on the basis of statistical models using historical data observations, which are updated periodically to reflect recent portfolio and economic trends. When the most recent trends arising from changes in economic, regulatory or behavioural conditions are not fully reflected in the statistical models, they are taken into account by adjusting the impairment allowances derived from the statistical models to reflect these changes as at the reporting date.
Write-off of loans and advances
Loans (and the related impairment allowance accounts) are normally written off, either partially or in full, when there is no realistic prospect of recovery. Where loans are secured, this is generally after receipt of any proceeds from the realisation of security. In circumstances where the net realisable value of any collateral has been determined and there is no reasonable expectation of further recovery, write-off may be earlier.
Reversals of impairment
If the amount of an impairment loss decreases in a subsequent period, and the decrease can be related objectively to an event occurring after the impairment was recognised, the excess is written back by reducing the loan impairment allowance account accordingly. The reversal is recognised in profit or loss.
Assets acquired in exchange for loans
When non-financial assets acquired in exchange for loans as part of an orderly realisation are held for sale, these assets are recorded as ‘Assets held for sale’ and reported in ‘Non-current assets held for sale’.
Renegotiated loans
Loans subject to individual impairment assessment, whose terms have been renegotiated, are subject to ongoing review to determine whether they remain impaired. The carrying amounts of loans that have been classified as renegotiated retain this classification until maturity or derecognition.
A loan that is renegotiated is derecognised if the existing agreement is cancelled and a new agreement made on substantially different terms, or if the terms of an existing agreement are modified, such that the renegotiated loan is substantially a different financial instrument. Any new agreements arising due to derecognition events will continue to be disclosed as renegotiated loans.
e Financial liabilities
The local group recognises a financial liability on its statement of financial position when it becomes a party to the contractual provisions of the instrument. The local group’s financial liabilities are classified into two categories: i) financial liabilities which are designated at fair value through profit or loss and ii) other liabilities (not at fair value through profit or loss). The criteria for designating financial liabilities at fair value and their measurement are described in Note 3(b)(ii).
Financial liabilities not at fair value through profit or loss are recognised initially at fair value, being the fair value of consideration received, net of transaction costs that are directly attributable to the acquisition or the issue of the financial liability. These liabilities are subsequently measured at amortised cost using the effective interest rate method to amortise the difference between proceeds received, net of directly attributable transaction costs incurred, and the redemption amount over the expected life of the instrument.
The local group derecognises a financial liability from its statement of financial position when it is extinguished, that is the obligation specified in the contract or arrangement is discharged, is cancelled or expires.
Financial liabilities measured at amortised cost comprise principally subordinated liabilities, deposits by banks and customer accounts.
81
3 Significant accounting policies (continued)
f Reverse repurchase and repurchase agreements
When securities are sold subject to a commitment to repurchase them at a predetermined price, they remain on the statement of financial position and a liability is recorded in respect of the consideration received. Securities purchased under commitments to resell are not recognised on the statement of financial position and the right to receive back the initial consideration paid is recorded in ‘Loans and advances to banks’ or ‘Loans and advances to customers’ as appropriate. The difference between the sale and repurchase price or between the purchase and resale price is treated as interest and recognised in net interest income over the life of the agreement, for loans and advances to banks and customers. Securities lending and borrowing transactions are generally secured against cash or non-cash collateral. Securities lent or borrowed do not normally result in derecognition or recognition on the statement of financial position. Cash collateral advanced or received is recorded as an asset or a liability respectively.
g Offsetting financial assets and financial liabilities
Financial assets and financial liabilities are offset and the net amount is reported in the statement of financial position when there is a legally enforceable right to offset the recognised amounts and there is an intention to settle on a net basis, or realise the asset and settle the liability simultaneously (the offset criteria).
h Investments in subsidiaries
The local group classifies investments in entities which it controls as subsidiaries.
The bank’s investments in subsidiaries are stated at cost less impairment losses. Impairment losses recognised in prior periods are reversed through profit or loss if there has been a change in the estimates used to determine the investment’s recoverable amount since the last impairment loss was recognised.
i Intangible assets
Intangible assets are recognised when they are separable or arise from contractual or other legal rights, and their fair value can be measured reliably.
Where intangible assets have a finite useful life, except for ‘Present value of in-force long-term insurance business’, they are stated at cost less accumulated amortisation and impairment losses.
Intangible assets with finite useful lives, such as purchased computer software, are amortised, on a straight line basis, over their estimated useful lives. Estimated useful life is the lower of legal duration and expected useful life. The estimated useful life of purchased software ranges between 3 – 5 years. Costs incurred in the ongoing maintenance of software are expensed immediately as incurred.
Intangible assets are subject to impairment review if there are events or changes in circumstances that indicate that the carrying amount may not be recoverable.
The accounting policy in respect of the present value of in-force long-term insurance business is reflected within Note 3(n)(iv).
Deferred acquisition costs
Incremental costs that are incurred in acquiring investment management contracts and creditor protection business are deferred and amortised as the related revenue is recognised. All deferred acquisition costs are reviewed regularly to determine if they are recoverable from future cash flows on the associated contracts.
Deferred acquisition costs that are not deemed to be recoverable are charged to profit or loss. The test for recoverability is performed at a portfolio level, on portfolios of relatively homogeneous contracts. Deferred acquisition costs are amortised in profit or loss on a straight line basis over the estimated useful life of the contract.
j Property, plant and equipment
All property, plant and equipment is initially recorded at historical cost, including transaction costs. Historical cost includes expenditure that is directly attributable to the acquisition of the items.
Freehold and long leasehold properties (land and buildings) are subsequently measured at fair value based on periodic valuations by external professionally qualified and independent valuers, less subsequent depreciation for buildings. Valuations are carried out on a regular basis such that the carrying amount of property does not differ materially from that which would be determined using fair values at the end of the reporting period. Any accumulated depreciation at the date of revaluation is eliminated against the gross carrying amount of the asset, and the net amount is restated to the revalued amount of the asset.
All other property, plant and equipment is subsequently stated at historical cost less accumulated depreciation and impairment losses.
82
Notes on the Financial Statements (continued)
H S B C B A N K M A L T A p . l . c .
3 Significant accounting policies (continued)
j Property, plant and equipment (continued)
Subsequent costs are included in the asset’s carrying amount or recognised as a separate asset, as appropriate, only when it is probable that future economic benefits associated with the item will flow to the local group and the cost of the item can be measured reliably. The carrying amount of any part accounted for separately is derecognised when replaced. All other repairs and maintenance are charged to profit or loss during the financial period in which they are incurred.
Increases in the carrying amount arising on revaluation of land and buildings are credited to other comprehensive income and shown as a revaluation reserve in shareholders’ equity. Decreases that offset previous increases of the same asset are charged to other comprehensive income and debited against the revaluation reserve directly in equity; all other decreases are charged to profit or loss.
Land is not depreciated as it is deemed to have an indefinite life. Depreciation on all other assets recognised in profit or loss is calculated using the straight-line method to allocate their cost or revalued amounts to their residual values over their estimated useful lives, as follows:
– long leaseholds, freehold buildings and improvements 50 years;
– short leaseholds and improvements to rented property over term of lease; and
– equipment, furniture and fittings 3 – 10 years.
The assets’ residual values and useful lives are reviewed, and adjusted if appropriate, at the end of each reporting period.
An asset’s carrying amount is written down immediately to its recoverable amount if the asset’s carrying amount is greater than its estimated recoverable amount (see Note 3(l)).
Gains and losses on disposals are determined by comparing the proceeds with the carrying amount and are recognised in profit or loss. When revalued assets are sold, the amounts included in the revaluation reserve relating to that asset are transferred to retained earnings.
k Investment property
Property held for long-term rental yields or for capital appreciation or both that is not occupied by the local group is classified as investment property.
Investment properties are measured initially at historical cost, including transaction costs. Historical cost includes expenditure that is directly attributable to the acquisition of the items.
Subsequent to initial recognition, investment properties are stated at fair value, representing open market value determined annually, which reflects market conditions at the end of the reporting period.
Gains or losses arising from changes in the fair value of investment properties are included in profit or loss in the year in which they arise. Subsequent expenditure is capitalised to the asset’s carrying amount only when it is probable that future economic benefits associated with the item will flow to the local group and the cost of the item can be measured reliably. All other repairs and maintenance costs are charged to the profit or loss during the financial period in which they are incurred.
The fair value of investment properties is based on the nature, location and condition of the specific asset. Fair values are determined by external professionally qualified and independent valuers who apply recognised valuation techniques. Any gain or loss on the disposal of an investment property is recognised in profit or loss. When the use of property changes such that it is reclassified as property, plant and equipment, its fair value at the date of reclassification becomes its carrying amount for subsequent accounting.
l Impairment of non-financial assets
The carrying amounts of the local group’s non-financial assets are reviewed at each reporting date to determine whether there is any indication of impairment. If any such indication exists, the asset’s recoverable amount is estimated.
For the purposes of assessing impairment, assets are grouped at the lowest levels for which there are separate identifiable cash inflows (cash-generating units). An impairment loss is recognised if the carrying amount of an asset or its cash-generating unit exceeds its estimated recoverable amount. Impairment losses are recognised in profit or loss, unless the asset is carried at a revalued amount.
83
3 Significant accounting policies (continued)
l Impairment of non-financial assets (continued)
The recoverable amount of non-financial assets is the greater of their fair value less cost to sell and value in use. In assessing value in use, the estimated future cash flows are discounted to their present value using a pre-tax discount rate that reflects current market assessments of the time value of money and the risks specific to the asset.
Impairment losses recognised in prior periods are assessed at each reporting date for any indications that the loss has decreased or no longer exists. An impairment loss is reversed if the reversal can be related objectively to an event occurring after the impairment loss was recognised.
An impairment loss on non-financial assets is reversed only to the extent that the asset’s carrying amount does not exceed the carrying amount that would have been determined, net of depreciation or amortisation, if no impairment loss had been recognised.
m Non-current assets (or disposal groups) held for sale
Non-current assets (or disposal groups i.e. assets and liabilities forming part of disposal groups) are classified as held for sale when their carrying amounts will be recovered principally through sale rather than through continuing use, they are available for sale in their present condition and their sale is highly probable. Immediately before the initial classification as held for sale, the carrying amount of the assets and liabilities is measured in accordance with the local group’s accounting policies. Non-current assets (or disposal groups) classified as held for sale are generally measured at the lower of their carrying amount and fair value less cost to sell except for those assets and liabilities that are not within the scope of the measurement requirements of IFRS 5 ‘Non-current Assets Held for sale and Discontinued Operations’, such as those measured in accordance with IAS 39.
On subsequent remeasurement of a disposal group, the carrying amounts of any assets and liabilities that are not within the scope of the measurement requirements of IFRS 5, but are included in a disposal group classified as held for sale, are remeasured under applicable IFRSs before the fair value less costs to sell of the disposal group is determined.
n Insurance and investment contracts
Through its insurance subsidiary, the local group issues contracts to customers that contain insurance risk, financial risk or a combination thereof. A contract under which the local group accepts significant insurance risk from another party by agreeing to compensate that party on the occurrence of a specified uncertain future event, is classified as an insurance contract. An insurance contract may also transfer financial risk, but is accounted for as an insurance contract if the insurance risk is significant.
i Net insurance premium income
Premiums for life insurance contracts are accounted for when receivable, except in unit-linked business where premiums are accounted for when liabilities are established.
Reinsurance premiums are accounted for in the same accounting period as the premiums for the direct insurance contracts to which they relate.
ii Net insurance claims, benefits paid and movement in liabilities to policyholders
Gross insurance claims for life insurance contracts reflect the total cost of claims arising during the year, including claim handling costs and any policyholder bonuses allocated in anticipation of a bonus declaration. Claims arising during the year include maturities, surrenders and death claims. Maturity claims are recognised when due for payment. Surrenders are recognised when paid or at an earlier date on which, following notification, the policy ceases to be included within the calculation of the related insurance liabilities. Death claims are recognised when notified.
Reinsurance recoveries are accounted for in the same period as the related claims.
84
Notes on the Financial Statements (continued)
H S B C B A N K M A L T A p . l . c .
3 Significant accounting policies (continued)
n Insurance and investment contracts (continued)
iii Liabilities under insurance contracts
Liabilities under non-linked life insurance contracts are calculated based on actuarial principles.
Liabilities under unit-linked life insurance contracts are at least equivalent to the surrender or transfer value which is calculated by reference to the value of the relevant underlying funds or indices.
A liability adequacy test is carried out on insurance liabilities to ensure that the carrying amount of the liabilities is sufficient in the light of current estimates of future cash flows. When performing the liability adequacy test, all contractual cash flows are discounted and compared with the carrying value of the liability. When a shortfall is identified it is charged immediately to profit or loss.
iv Present value of in-force long-term insurance business
The value placed on insurance contracts that are classified as long-term insurance business and are in force at the reporting date, is recognised as an asset.
The asset represents the present value of the equity holders’ interest in the issuing insurance company’s profits expected to emerge from these contracts written at the reporting date. The PVIF is determined by discounting the equity holders’ interest in future profits expected to emerge from business currently in force using appropriate assumptions in assessing factors such as future mortality, lapse rates and levels of expenses, and a risk discount rate that reflects the risk premium attributable to the respective contracts. The PVIF asset is presented gross of attributable tax in the balance sheet and movements in the PVIF asset are included in ‘Movement in present value of in-force long-term insurance business’ on a gross of tax basis.
v Investment contracts
Investment contracts are those contracts where there is no significant insurance risk. A contract under which the local group accepts insignificant insurance risk from another party is not classified as an insurance contract, but is accounted for as a financial liability.
Customer liabilities under unit-linked investment contracts and the linked financial assets are designated at fair value through profit or loss, and the movements in fair value are recognised in profit or loss in ‘Net income from financial instruments designated at fair value attributable to insurance operations’. Liabilities under unit-linked investment contracts are at least equivalent to the surrender or transfer value which is calculated by reference to the value of the relevant underlying funds or indices.
Premiums receivable and amounts withdrawn are accounted for as increases or decreases in the liability recorded in respect of investment contracts.
Investment management fees receivable are recognised in profit or loss over the period of the provision of the investment management services in ‘Net fee and commission income’.
o Provisions
Provisions are recognised when it is probable that an outflow of economic benefits will be required to settle a current legal or constructive obligation which has arisen as a result of past events, and for which a reliable estimate can be made. A provision for restructuring is recognised when the local group has approved a detailed and formal restructuring plan and the restructuring either has commenced or has been announced publicly. Future operating losses are not provided for.
p Contingent liabilities
Contingent liabilities, which include certain guarantees and letters of credit pledged as collateral security, as well as contingent liabilities related to legal proceedings or regulatory matters, are possible obligations that arise from past events whose existence will be confirmed only by the occurrence, or non-occurrence, of one or more uncertain future events not wholly within the control of the local group; or are present obligations that have arisen from past events but are not recognised because it is not probable that settlement will require the outflow of economic benefits, or because the amount of the obligations cannot be reliably measured. Contingent liabilities are not recognised in the financial statements but are disclosed unless the probability of settlement is remote.
85
3 Significant accounting policies (continued)
q Financial guarantee contracts
Financial guarantees are contracts that require the local group to make specified payments to reimburse the holder for a loss it incurs because a specified debtor fails to make payment when due in accordance with the terms of a debt instrument.
Liabilities under financial guarantee contracts are recorded initially at their fair value, which is generally the fee received or present value of the fee receivable. The initial fair value is amortised over the term of the financial guarantee contract. Subsequently, financial guarantee liabilities are measured at the higher of the initial fair value, less cumulative amortisation, and the best estimate of the expenditure required to settle the obligations.
r Interest income and expense
Interest income and expense for all interest-bearing financial instruments except those classified as held for trading or designated at fair value through profit or loss are recognised in ‘Net interest income’ in profit or loss using the effective interest method. The effective interest method is a method of calculating the amortised cost of a financial asset or a financial liability (and groups of financial assets or financial liabilities) and of allocating the ‘Net interest income’ over the relevant period.
The effective interest rate is the rate that exactly discounts estimated future cash receipts or payments through the expected life of the financial instrument or, where appropriate, a shorter period, to the net carrying amount of the financial asset or financial liability. When calculating the effective interest rate, the local group estimates cash flows considering all contractual terms of the financial instrument but excluding future credit losses. The calculation includes all fees and points paid or received by the local group that are an integral part of the effective interest rate of a financial instrument, including transaction costs and all other premiums or discounts.
Interest on impaired financial assets is recognised using the rate of interest used to discount the future cash flows for the purpose of measuring the impairment loss.
s Non-interest income
i Net fee and commission income
Fee income is earned from a diverse range of services provided by the local group to its customers. Fee income is accounted for as follows:
– income earned on the execution of a significant act is recognised as revenue when the act is completed;
– income earned from the provision of services is recognised as revenue as the services are provided; and
– income that forms an integral part of the effective interest rate of a financial instrument is recognised as an adjustment to the effective interest rate and recorded in ‘Interest income’.
ii Dividend income
Dividend income is recognised when the right to receive payment is established. This is the ex-dividend date for listed equity securities, and usually the date when shareholders have approved the dividend for unlisted equity securities.
iii Net income from financial instruments designated at fair value attributable to insurance operations
Net income from financial instruments designated at fair value includes:
– all gains and losses from changes in the fair value of financial assets and financial liabilities designated at fair value through profit or loss, including liabilities under investment contracts; and
– interest income and expense and dividend income in respect of financial assets and financial liabilities designated at fair value through profit or loss.
t Employee benefits
i Contributions to defined contribution pension plan
The local group contributes towards the State defined contribution pension plan in accordance with local legislation in exchange for services rendered by employees and to which it has no commitment beyond the payment of fixed contributions. Obligations for contributions are recognised as an employee benefit in profit or loss in the periods during which services are rendered by employees.
86
Notes on the Financial Statements (continued)
H S B C B A N K M A L T A p . l . c .
3 Significant accounting policies (continued)
t Employee benefits (continued)
ii Long-term employee benefit obligations
The local group’s liabilities for long service bonuses, retirement bonuses and benefits upon retirement on medical grounds, emanating from obligations within the collective agreement, are not expected to be settled wholly within 12 months after the end of the period in which the employees render the related service. They are therefore measured as the present value of expected future payments to be made in respect of services provided by employees up to the end of the reporting period using the projected unit credit method. The projected unit credit method considers each period of service as giving rise to an additional unit of benefit entitlement and measures each unit separately to build the final obligation. Consideration is given to expected future salary levels, experience of employee departures and periods of service.
The liability recognised in the balance sheet is the present value of the defined benefit obligation at the end of the reporting period. The defined benefit obligation is calculated annually by independent actuaries using the projected unit credit method. The projected unit credit method requires the local group to attribute benefit to the current period in order to determine current service cost and to the current and prior periods in order to determine the present value of the defined benefit obligations.
The present value of the defined benefit obligation is determined by discounting the estimated future cash outflows using interest rates of high-quality corporate bonds that are denominated in the currency in which the benefits will be paid, and that have terms approximating to the terms of the related obligation.
The net interest cost is calculated by applying the discount rate to the net balance of the defined benefit obligation. This cost is reflected in profit or loss. Actuarial gains and losses, comprising remeasurement gains and losses arising from experience adjustments and changes in actuarial assumptions, are recognised in profit or loss in the period in which they occur. Amounts recognised in profit or loss in respect of these long-term employee benefit obligations are presented within ‘Employee compensation and benefits’.
iii Termination benefits
The local group recognises a liability and expense for termination benefits when the local group can no longer withdraw the offer of those benefits. For termination benefits payable as a result of an employee’s decision to accept an offer of benefits in exchange for the termination of employment, the time when the group can no longer withdraw the offer of termination benefits is the earlier of:
– when the employee accepts the offer; and
– when a restriction on the group’s ability to withdraw the offer takes effect.
For termination benefits payable as a result of the local group’s decision to terminate an employee’s employment, the local group can no longer withdraw the offer when it has communicated to the affected employees a plan of termination meeting all of the following criteria:
– actions required to complete the plan indicate that it is unlikely that significant changes to the plan will be made;
– the plan identifies the number of employees whose employment is to be terminated, their job classifications or functions and the expected completion date; and
– the plan establishes the termination benefits that employees will receive in sufficient detail that employees can determine the type and amount of benefits they will receive when their employment is terminated.
iv Share-based payments
The local group enters into equity-settled share-based payment arrangements with its employees as compensation for services provided by employees.
The cost of share-based payment arrangements with employees is measured by reference to the fair value of equity instruments on the date they are granted and recognised as an expense on a straight-line basis over the vesting period, with a corresponding credit to retained earnings.
Fair value is determined by using appropriate valuation models. Vesting conditions include service conditions and performance conditions; any other features of the arrangement are non-vesting conditions. Market performance conditions and non-vesting conditions are taken into account when estimating the fair value of the award at the date of the award. Vesting conditions, other than market performance conditions, are not taken into account in the initial estimate of the fair value at the grant date. They are taken into account by adjusting the number of equity instruments included in the measurement of the transaction.
87
3 Significant accounting policies (continued)
t Employee benefits (continued)
iv Share-based payments (continued)
HSBC Holdings is the grantor of its equity instrument for all share awards and share options across the Group. The credit to retained earnings over the vesting period on expensing an award represents the effective capital contribution from HSBC Holdings. To the extent the local group will be, or has been, required to fund a share-based payment arrangement, this capital contribution is reduced and the fair value of shares expected to be released to employees is recorded within liabilities.
u Operating Leases
All leases which do not transfer to the lessee substantially all the risks and rewards incidental to the ownership of assets are classified as operating leases. As a lessor, the local group presents assets subject to operating leases within the statement of financial position. Impairment losses are recognised to the extent that the carrying values are not fully recoverable. As a lessee, leased assets are not recognised on the statement of financial position with the exception of long leasehold interests.
Rentals payable and receivable under operating leases are spread on a straight-line basis over the lease periods and are recognised in ‘General and administrative expenses’ and in ‘Net other operating income’ respectively.
v Foreign currencies
Transactions in foreign currencies are recorded in the functional currency at the rate of exchange prevailing on the date of the transaction. Monetary assets and liabilities denominated in foreign currencies are translated into the functional currency at the rate of exchange at the reporting date. Any resulting exchange differences are recognised in profit or loss. Non-monetary assets and liabilities that are measured at historical cost in a foreign currency are translated into the functional currency using the rate of exchange at the date of the initial transaction. Non-monetary assets and liabilities measured at fair value in a foreign currency are translated into the functional currency using the rate of exchange at the date the fair value was determined. Any foreign exchange component of a gain or loss on a non-monetary item is recognised either in other comprehensive income or in profit or loss depending where the gain or loss on the underlying non-monetary item is recognised.
w Income tax
Income tax comprises current tax and deferred tax. Income tax is recognised in profit or loss except to the extent that it relates to items recognised in other comprehensive income or directly in equity, in which case it is recognised in the same statement in which the related item appears.
Current tax is the tax expected to be payable on the taxable profit for the year, calculated using tax rates enacted or substantively enacted by the reporting date, and any adjustment to tax payable in respect of previous years. Current tax assets and liabilities are offset when the local group intends to settle on a net basis and the legal right to offset exists.
Deferred tax is recognised on temporary differences between the carrying amounts of assets and liabilities in the statement of financial position and the amounts attributed to such assets and liabilities for tax purposes. Deferred tax liabilities are generally recognised for all taxable temporary differences and deferred tax assets are recognised to the extent that it is probable that future taxable profits will be available against which deductible temporary differences and unutilised tax losses can be utilised.
Deferred tax is calculated using the tax rates expected to apply in the periods in which the assets will be realised or the liabilities settled based on tax rates and laws enacted, or substantively enacted, by the reporting date. Deferred tax assets and liabilities are offset when they arise in the same tax reporting group and relate to income taxes levied by the same taxation authority, and when the local group has a legal right to offset.
x Cash and cash equivalents
Cash and cash equivalents comprise cash balances, highly liquid investments and deposits with contractual maturity of three months or less. Cash and cash equivalents include highly liquid investments that are readily convertible to known amounts of cash and which are subject to an insignificant risk of change in value. Such investments are normally those with less than three months’ maturity from the date of acquisition. ‘Loans and advances to banks’ that are repayable on demand or have a contractual maturity of three months or less and which form an integral part of the local group’s cash management are included as a component of cash and cash equivalents for the purpose of the Statements of Cash Flows.

88
Notes on the Financial Statements (continued)
H S B C B A N K M A L T A p . l . c .
3 Significant accounting policies (continued)
y Segment analysis
Measurement of segmental assets, liabilities, income and expenses is in accordance with the local group’s accounting policies. Segmental income and expenses include transfers between segments and these transfers are conducted on arm’s length terms and conditions. Shared costs are included in segments on the basis of the actual recharges made.
z Equity instruments
Financial instruments issued are classified as equity when there is no contractual obligation to transfer cash, other financial assets or issue a variable number of own equity instruments. Incremental costs directly attributable to the issue of equity instruments are shown in equity as a deduction from the proceeds, net of tax.
4 Financial risk management
a Introduction
The nature of the local group’s core banking operations implies that financial instruments are extensively used in the course of its routine business. The local group’s financial instruments include cash balances with banks, loans and advances to customers, securities and amounts due to banks and customers.
The local group is exposed to a mixed blend of risks and hence operates a risk management strategy with the objective of controlling and minimising their impact on local group financial performance and position.
All of the local group’s activities involve to varying degrees, the analysis, evaluation, acceptance and management of risks or combination of risks.
An established risk governance framework and ownership structure ensures oversight of and accountability for the effective management of risk. The local group’s risk management framework fosters the continuous monitoring of the risk environment and an integrated evaluation of risks and their interactions.
The local group’s risk management framework is designed to provide appropriate risk monitoring and assessment. The bank’s Risk Committee focuses on risk governance and provides a forward looking view of risks and their mitigation.
The Risk Committee is a committee of the Board and has responsibility for oversight and advice to the Board on, inter alia, the bank’s risk appetite, tolerance and strategy, systems of risk management, internal control and compliance.
The Risk Committee maintains and develops a supportive culture in relation to the management of risk, appropriately embedded by executive management through procedures, training and leadership actions.
In carrying out its responsibilities, the Risk Committee is closely supported by the Chief Risk Officer, the Chief Financial Officer, the Head of Internal Audit and the Head of Compliance, together with other business functions on risks within their respective areas of responsibility.
The most important types of risk include financial risk, which comprises credit risk, market risk and liquidity risk. These categories of risk in relation to life insurance business are described in Note 4(f).
b Credit risk excluding Insurance credit risk which is reported under 4(f)
i Credit risk management
Credit risk is the risk of financial loss if a customer or counterparty fails to meet an obligation under a contract. It arises principally from lending, trade finance and treasury business, mainly through the holdings of debt securities, but also from off-balance sheet products such as guarantees. The local group has standards, policies and procedures dedicated to control and monitor the risk arising from all such activities.
Within the overall framework of the local group policy, the local group has an established risk management process encompassing credit approvals, the control of exposures, credit policy direction to business units and the monitoring and reporting of exposures both on an individual and a portfolio basis which includes the management of adverse trends. Management is responsible for the quality of its credit portfolios and follows a credit process involving delegated approval authorities and credit procedures, the objective of which is to build and maintain risk assets of high quality. Regular reviews are undertaken to assess and evaluate levels of risk concentrations by market sector and product.
89
4 Financial risk management (continued)
b Credit risk excluding Insurance credit risk which is reported under 4(f) (continued)
i Credit risk management (continued)
The bank’s credit risk rating systems and processes differentiate exposures in order to highlight those with greater risk factors and higher potential severity of loss. In the case of individually significant accounts, risk ratings are reviewed regularly and any amendments are implemented promptly.
The principal objectives of the local group’s credit risk management are:
– to maintain a strong culture of responsible lending and a robust risk policy and control framework;
– to both partner and challenge global businesses in defining, implementing, and continually re-evaluating risk appetite under actual and scenario conditions; and
– to ensure there is independent, expert scrutiny of credit risks.
Within the bank, the credit risk function’s responsibilities include:
– formulating credit policy;
– guiding business on appetite for credit risk exposure to specified market sectors, activities and banking products and controlling exposures to certain higher-risk sectors;
– undertaking an independent review and objective assessment of risk and exposures over designated limits, prior to the facilities being committed to customers or transactions being undertaken;
– monitoring the performance and management of portfolios;
– controlling exposure to sovereign entities, banks and other financial institutions, as well as debt securities;
– setting policy on large credit exposures, ensuring that concentrations of exposure by counterparty, sector or geography do not become excessive in relation to the capital base, and remain within internal and regulatory limits;
– maintaining and developing the risk rating framework and systems and overseeing risk rating system governance for both wholesale and retail businesses; and
– reporting on retail portfolio performance, high risk portfolios, risk concentrations, large impaired accounts, impairment allowances and stress testing results.
Special attention is paid to problem exposures in order to accelerate remedial action. The local group uses specialist units to provide customers with support in order to help them avoid default wherever possible.
Internal approval limits are in place depending on the magnitude and particular risks attached to the respective facility. The bank has set limits of authority for the business and the credit risk functions, ensuring segregation of duties so as to maintain independence during the approval process. The local group structures the level of credit risk it undertakes by placing limits in relation to products, counterparties, sectors and other parameters. Certain actual exposures against limits are monitored at end of day and on a real-time basis too.
Maximum exposure to credit risk
The following table presents the maximum exposure to credit risk from balance sheet and off-balance sheet financial instruments, before taking account of any collateral held or other credit enhancements. For financial assets recognised on the balance sheet, the maximum exposure to credit risk equals their carrying amount; for financial guarantees granted, it is the maximum amount that the local group would have to pay if the guarantees were called upon. For loan commitments and other credit-related commitments that are irrevocable over the life of the respective facilities, it is generally the full amount of the committed facilities.
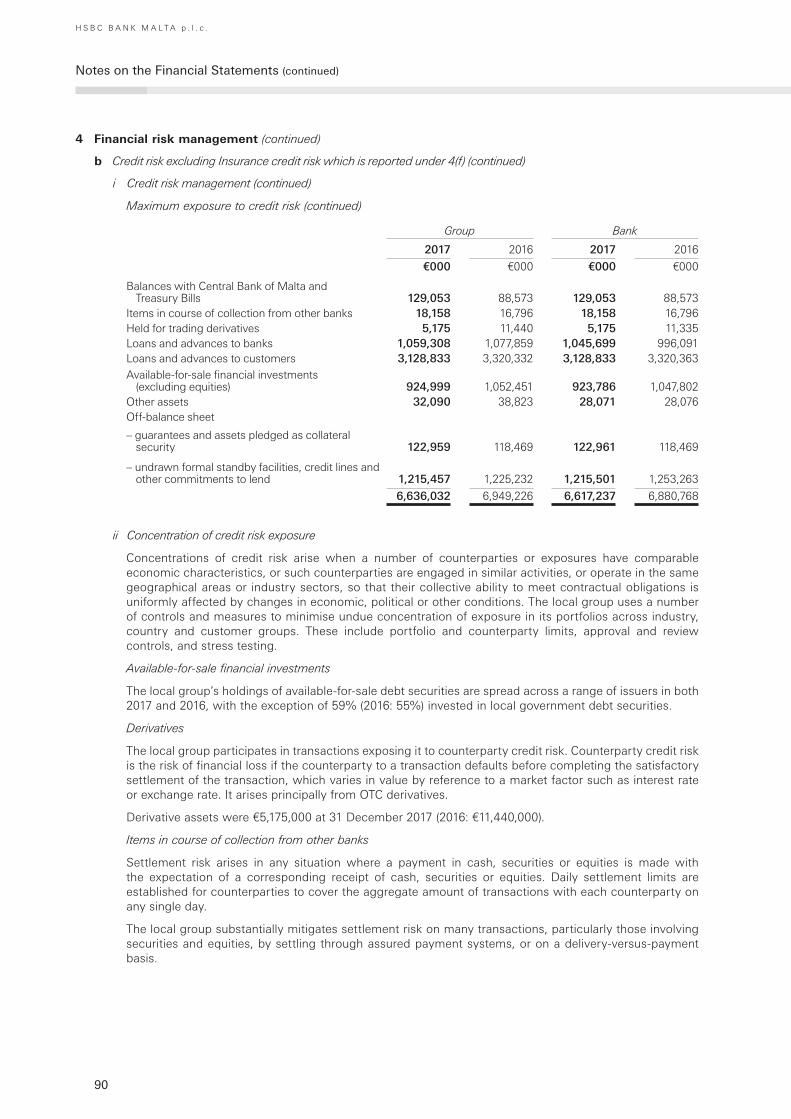
90
Notes on the Financial Statements (continued)
H S B C B A N K M A L T A p . l . c .
4 Financial risk management (continued)
b Credit risk excluding Insurance credit risk which is reported under 4(f) (continued)
i Credit risk management (continued)
Maximum exposure to credit risk (continued)
Group Bank
2017 2016 2017 2016
€000 €000 €000 €000
Balances with Central Bank of Malta and Treasury Bills 129,053 88,573 129,053 88,573
Items in course of collection from other banks 18,158 16,796 18,158 16,796 Held for trading derivatives 5,175 11,440 5,175 11,335 Loans and advances to banks 1,059,308 1,077,859 1,045,699 996,091 Loans and advances to customers 3,128,833 3,320,332 3,128,833 3,320,363 Available-for-sale financial investments
(excluding equities) 924,999 1,052,451 923,786 1,047,802 Other assets 32,090 38,823 28,071 28,076Off-balance sheet
– guarantees and assets pledged as collateral security 122,959 118,469 122,961 118,469
– undrawn formal standby facilities, credit lines and other commitments to lend 1,215,457 1,225,232 1,215,501 1,253,263
6,636,032 6,949,226 6,617,237 6,880,768
ii Concentration of credit risk exposure
Concentrations of credit risk arise when a number of counterparties or exposures have comparable economic characteristics, or such counterparties are engaged in similar activities, or operate in the same geographical areas or industry sectors, so that their collective ability to meet contractual obligations is uniformly affected by changes in economic, political or other conditions. The local group uses a number of controls and measures to minimise undue concentration of exposure in its portfolios across industry, country and customer groups. These include portfolio and counterparty limits, approval and review controls, and stress testing.
Available-for-sale financial investments
The local group’s holdings of available-for-sale debt securities are spread across a range of issuers in both 2017 and 2016, with the exception of 59% (2016: 55%) invested in local government debt securities.
Derivatives
The local group participates in transactions exposing it to counterparty credit risk. Counterparty credit risk is the risk of financial loss if the counterparty to a transaction defaults before completing the satisfactory settlement of the transaction, which varies in value by reference to a market factor such as interest rate or exchange rate. It arises principally from OTC derivatives.
Derivative assets were €5,175,000 at 31 December 2017 (2016: €11,440,000).
Items in course of collection from other banks
Settlement risk arises in any situation where a payment in cash, securities or equities is made with the expectation of a corresponding receipt of cash, securities or equities. Daily settlement limits are established for counterparties to cover the aggregate amount of transactions with each counterparty on any single day.
The local group substantially mitigates settlement risk on many transactions, particularly those involving securities and equities, by settling through assured payment systems, or on a delivery-versus-payment basis.
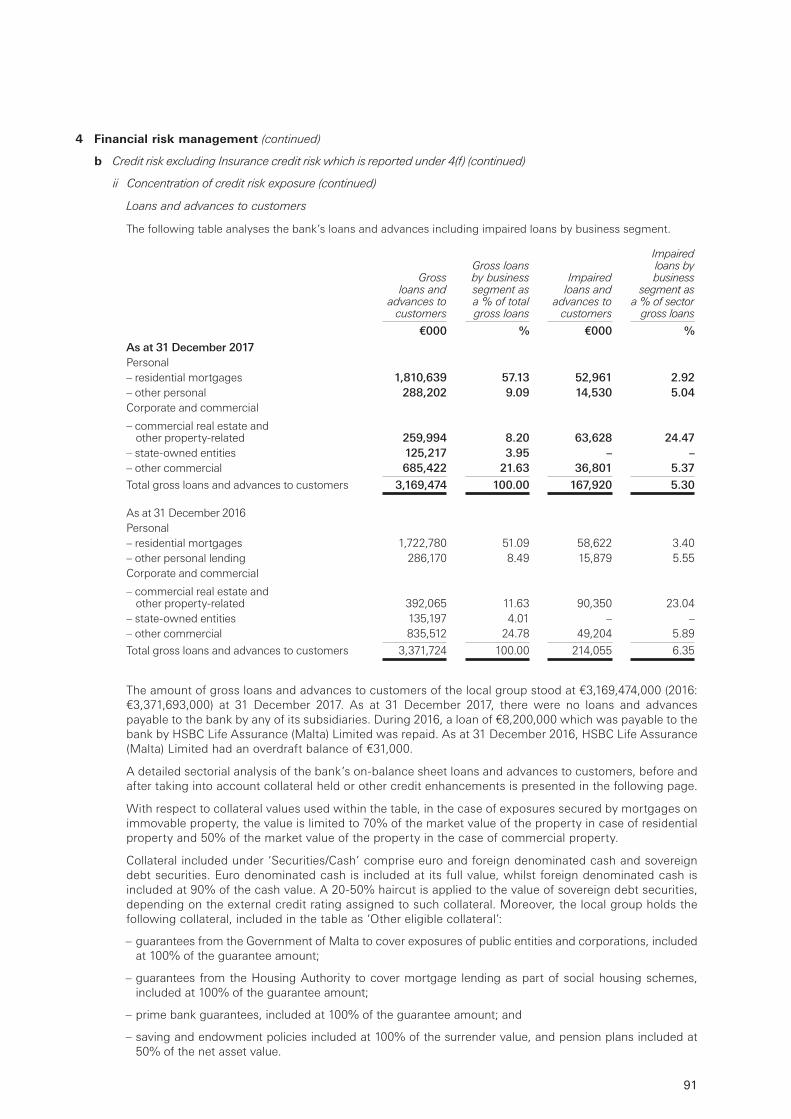
91
4 Financial risk management (continued)
b Credit risk excluding Insurance credit risk which is reported under 4(f) (continued)
ii Concentration of credit risk exposure (continued)
Loans and advances to customers
The following table analyses the bank’s loans and advances including impaired loans by business segment.
Gross loans and
advances to customers
Gross loans by business segment as a % of total gross loans
Impaired loans and
advances to customers
Impaired loans by business
segment as a % of sector
gross loans
€000 % €000 %As at 31 December 2017Personal– residential mortgages 1,810,639 57.13 52,961 2.92– other personal 288,202 9.09 14,530 5.04Corporate and commercial
– commercial real estate and other property-related 259,994 8.20 63,628 24.47
– state-owned entities 125,217 3.95 – –– other commercial 685,422 21.63 36,801 5.37
Total gross loans and advances to customers 3,169,474 100.00 167,920 5.30
As at 31 December 2016Personal– residential mortgages 1,722,780 51.09 58,622 3.40– other personal lending 286,170 8.49 15,879 5.55Corporate and commercial
– commercial real estate and other property-related 392,065 11.63 90,350 23.04
– state-owned entities 135,197 4.01 – –– other commercial 835,512 24.78 49,204 5.89
Total gross loans and advances to customers 3,371,724 100.00 214,055 6.35
The amount of gross loans and advances to customers of the local group stood at €3,169,474,000 (2016: €3,371,693,000) at 31 December 2017. As at 31 December 2017, there were no loans and advances payable to the bank by any of its subsidiaries. During 2016, a loan of €8,200,000 which was payable to the bank by HSBC Life Assurance (Malta) Limited was repaid. As at 31 December 2016, HSBC Life Assurance (Malta) Limited had an overdraft balance of €31,000.
A detailed sectorial analysis of the bank’s on-balance sheet loans and advances to customers, before and after taking into account collateral held or other credit enhancements is presented in the following page.
With respect to collateral values used within the table, in the case of exposures secured by mortgages on immovable property, the value is limited to 70% of the market value of the property in case of residential property and 50% of the market value of the property in the case of commercial property.
Collateral included under ‘Securities/Cash’ comprise euro and foreign denominated cash and sovereign debt securities. Euro denominated cash is included at its full value, whilst foreign denominated cash is included at 90% of the cash value. A 20-50% haircut is applied to the value of sovereign debt securities, depending on the external credit rating assigned to such collateral. Moreover, the local group holds the following collateral, included in the table as ‘Other eligible collateral’:
– guarantees from the Government of Malta to cover exposures of public entities and corporations, included at 100% of the guarantee amount;
– guarantees from the Housing Authority to cover mortgage lending as part of social housing schemes, included at 100% of the guarantee amount;
– prime bank guarantees, included at 100% of the guarantee amount; and
– saving and endowment policies included at 100% of the surrender value, and pension plans included at 50% of the net asset value.
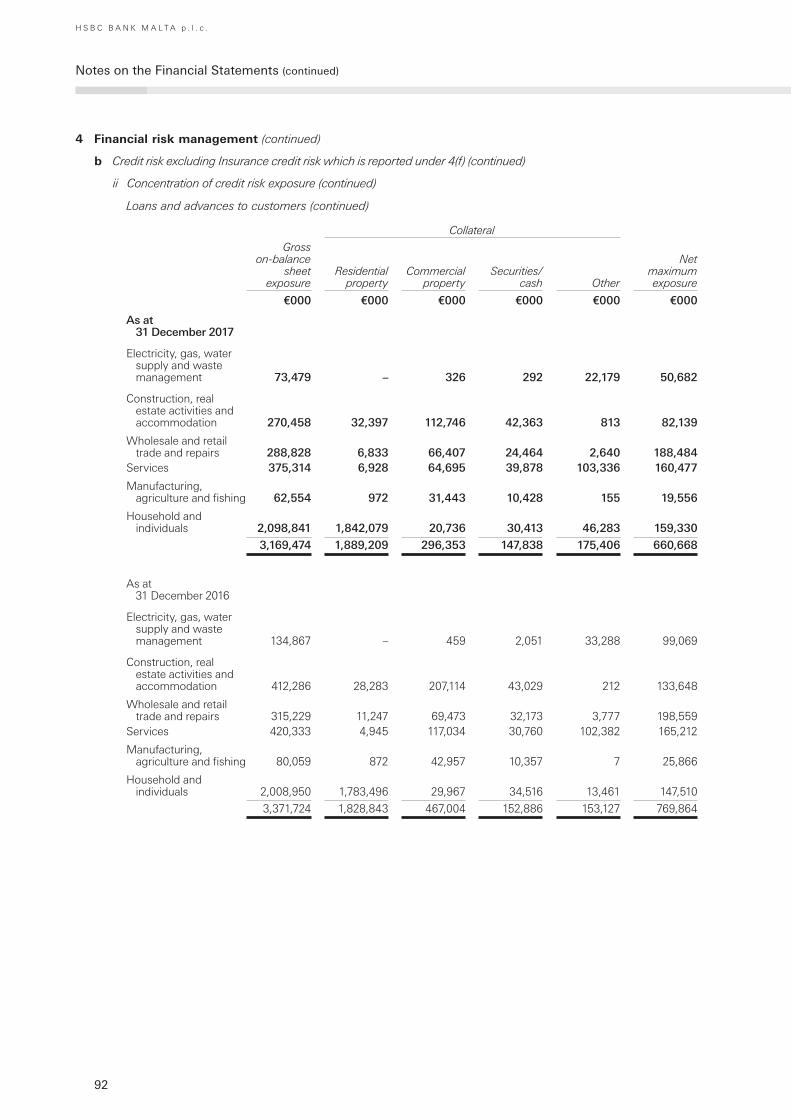
92
Notes on the Financial Statements (continued)
H S B C B A N K M A L T A p . l . c .
4 Financial risk management (continued)
b Credit risk excluding Insurance credit risk which is reported under 4(f) (continued)
ii Concentration of credit risk exposure (continued)
Loans and advances to customers (continued)
Collateral
Gross on-balance
sheet exposure
Residential property
Commercial property
Securities/cash Other
Net maximum exposure
€000 €000 €000 €000 €000 €000
As at 31 December 2017
Electricity, gas, water supply and waste management 73,479 – 326 292 22,179 50,682
Construction, real estate activities and accommodation 270,458 32,397 112,746 42,363 813 82,139
Wholesale and retail trade and repairs 288,828 6,833 66,407 24,464 2,640 188,484
Services 375,314 6,928 64,695 39,878 103,336 160,477
Manufacturing, agriculture and fishing 62,554 972 31,443 10,428 155 19,556
Household and individuals 2,098,841 1,842,079 20,736 30,413 46,283 159,330
3,169,474 1,889,209 296,353 147,838 175,406 660,668
As at 31 December 2016
Electricity, gas, water supply and waste management 134,867 – 459 2,051 33,288 99,069
Construction, real estate activities and accommodation 412,286 28,283 207,114 43,029 212 133,648
Wholesale and retail trade and repairs 315,229 11,247 69,473 32,173 3,777 198,559
Services 420,333 4,945 117,034 30,760 102,382 165,212
Manufacturing, agriculture and fishing 80,059 872 42,957 10,357 7 25,866
Household and individuals 2,008,950 1,783,496 29,967 34,516 13,461 147,510
3,371,724 1,828,843 467,004 152,886 153,127 769,864
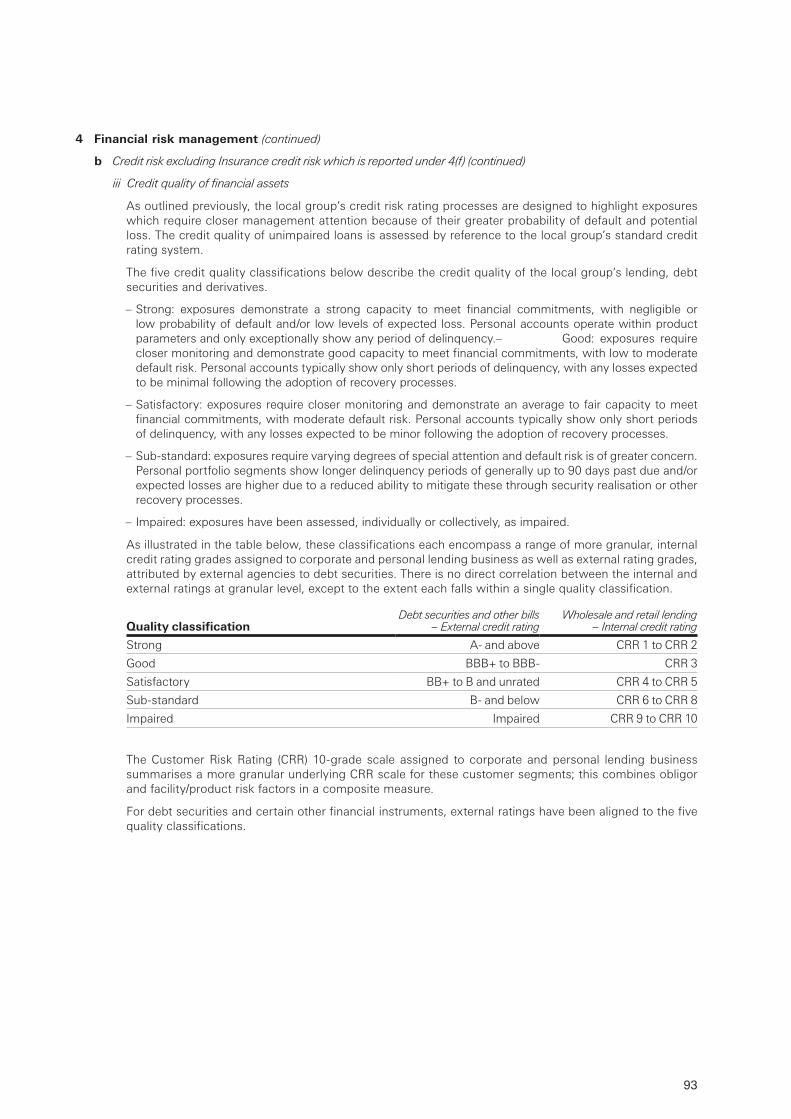
93
4 Financial risk management (continued)
b Credit risk excluding Insurance credit risk which is reported under 4(f) (continued)
iii Credit quality of financial assets
As outlined previously, the local group’s credit risk rating processes are designed to highlight exposures which require closer management attention because of their greater probability of default and potential loss. The credit quality of unimpaired loans is assessed by reference to the local group’s standard credit rating system.
The five credit quality classifications below describe the credit quality of the local group’s lending, debt securities and derivatives.
– Strong: exposures demonstrate a strong capacity to meet financial commitments, with negligible or low probability of default and/or low levels of expected loss. Personal accounts operate within product parameters and only exceptionally show any period of delinquency.– Good: exposures require closer monitoring and demonstrate good capacity to meet financial commitments, with low to moderate default risk. Personal accounts typically show only short periods of delinquency, with any losses expected to be minimal following the adoption of recovery processes.
– Satisfactory: exposures require closer monitoring and demonstrate an average to fair capacity to meet financial commitments, with moderate default risk. Personal accounts typically show only short periods of delinquency, with any losses expected to be minor following the adoption of recovery processes.
– Sub-standard: exposures require varying degrees of special attention and default risk is of greater concern. Personal portfolio segments show longer delinquency periods of generally up to 90 days past due and/or expected losses are higher due to a reduced ability to mitigate these through security realisation or other recovery processes.
– Impaired: exposures have been assessed, individually or collectively, as impaired.
As illustrated in the table below, these classifications each encompass a range of more granular, internal credit rating grades assigned to corporate and personal lending business as well as external rating grades, attributed by external agencies to debt securities. There is no direct correlation between the internal and external ratings at granular level, except to the extent each falls within a single quality classification.
Quality classificationDebt securities and other bills
– External credit ratingWholesale and retail lending
– Internal credit rating
Strong A- and above CRR 1 to CRR 2
Good BBB+ to BBB- CRR 3
Satisfactory BB+ to B and unrated CRR 4 to CRR 5
Sub-standard B- and below CRR 6 to CRR 8
Impaired Impaired CRR 9 to CRR 10
The Customer Risk Rating (CRR) 10-grade scale assigned to corporate and personal lending business summarises a more granular underlying CRR scale for these customer segments; this combines obligor and facility/product risk factors in a composite measure.
For debt securities and certain other financial instruments, external ratings have been aligned to the five quality classifications.
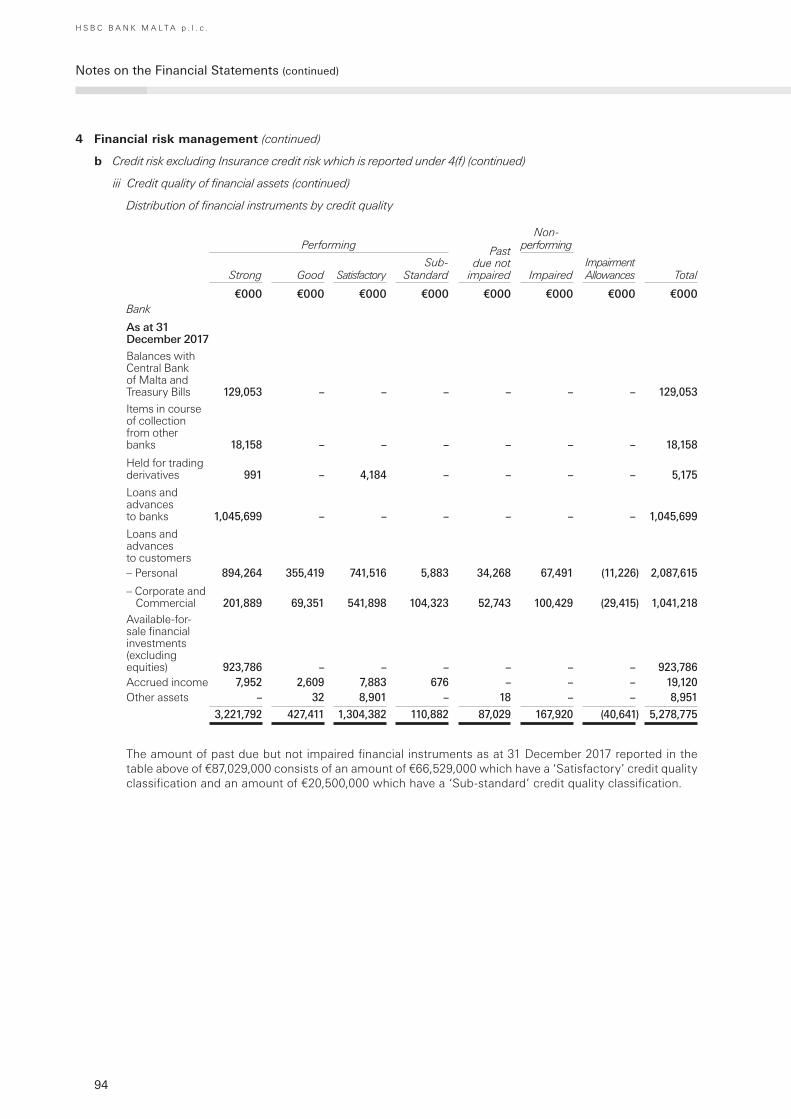
94
Notes on the Financial Statements (continued)
H S B C B A N K M A L T A p . l . c .
4 Financial risk management (continued)
b Credit risk excluding Insurance credit risk which is reported under 4(f) (continued)
iii Credit quality of financial assets (continued)
Distribution of financial instruments by credit quality
Performing Past due not
impaired
Non- performing
Strong Good SatisfactorySub-
Standard ImpairedImpairment Allowances Total
€000 €000 €000 €000 €000 €000 €000 €000Bank
As at 31 December 2017
Balances with Central Bank of Malta and Treasury Bills 129,053 – – – – – – 129,053
Items in course of collection from other banks 18,158 – – – – – – 18,158
Held for trading derivatives 991 – 4,184 – – – – 5,175
Loans and advances to banks 1,045,699 – – – – – – 1,045,699
Loans and advances to customers– Personal 894,264 355,419 741,516 5,883 34,268 67,491 (11,226) 2,087,615
– Corporate and Commercial 201,889 69,351 541,898 104,323 52,743 100,429 (29,415) 1,041,218
Available-for-sale financial investments (excluding equities) 923,786 – – – – – – 923,786Accrued income 7,952 2,609 7,883 676 – – – 19,120 Other assets – 32 8,901 – 18 – – 8,951
3,221,792 427,411 1,304,382 110,882 87,029 167,920 (40,641) 5,278,775
The amount of past due but not impaired financial instruments as at 31 December 2017 reported in the table above of €87,029,000 consists of an amount of €66,529,000 which have a ‘Satisfactory’ credit quality classification and an amount of €20,500,000 which have a ‘Sub-standard’ credit quality classification.

95
4 Financial risk management (continued)
b Credit risk excluding Insurance credit risk which is reported under 4(f) (continued)
iii Credit quality of financial assets (continued)
Distribution of financial instruments by credit quality (continued)
Performing Past due not
impaired
Non- performing
Strong Good SatisfactorySub-
Standard ImpairedImpairment Allowances Total
€000 €000 €000 €000 €000 €000 €000 €000Bank
As at 31 December 2016
Balances with Central Bank of Malta and Treasury Bills 88,573 – – – – – – 88,573
Items in course of collection from other banks 16,796 – – – – – – 16,796
Held for trading derivatives 1,054 – 10,281 – – – – 11,335
Loans and advances to banks 996,091 – – – – – – 996,091
Loans and advances to customers– Personal 844,504 326,519 718,175 7,053 38,197 74,501 (14,750) 1,994,199
– Corporate and Commercial 226,265 113,883 720,691 104,090 58,292 139,554 (36,611) 1,326,164
Available-for-sale financial investments (excluding equities) 1,047,802 – – – – – – 1,047,802 Accrued income 10,367 974 5,299 682 421 1,635 – 19,378 Other assets 4,202 – 4,470 26 – – – 8,698
3,235,654 441,376 1,458,916 111,851 96,910 215,690 (51,361) 5,509,036
The amount of past due but not impaired financial instruments as at 31 December 2016 reported in the table above of €96,910,000 consists of an amount of €69,451,000 which have a ‘Satisfactory’ credit quality classification and an amount of €27,459,000 which have a ‘Sub-standard’ credit quality classification.
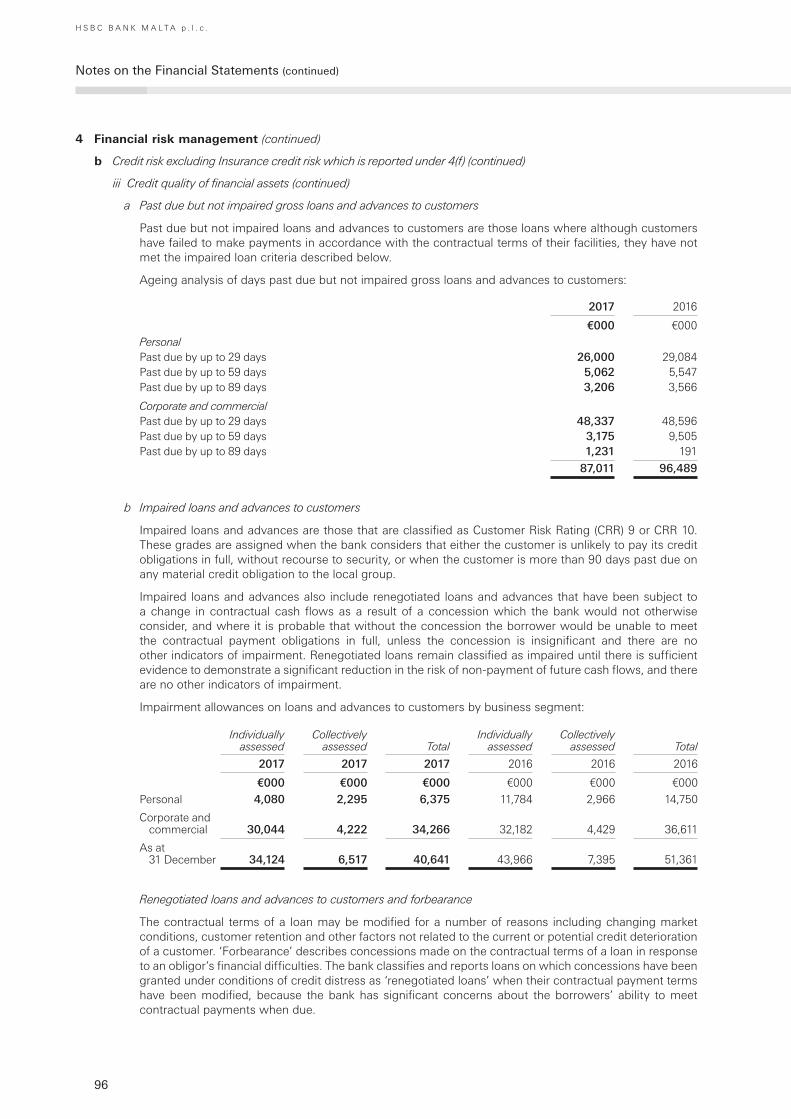
96
Notes on the Financial Statements (continued)
H S B C B A N K M A L T A p . l . c .
4 Financial risk management (continued)
b Credit risk excluding Insurance credit risk which is reported under 4(f) (continued)
iii Credit quality of financial assets (continued)
a Past due but not impaired gross loans and advances to customers
Past due but not impaired loans and advances to customers are those loans where although customers have failed to make payments in accordance with the contractual terms of their facilities, they have not met the impaired loan criteria described below.
Ageing analysis of days past due but not impaired gross loans and advances to customers:
2017 2016
€000 €000
Personal Past due by up to 29 days 26,000 29,084 Past due by up to 59 days 5,062 5,547 Past due by up to 89 days 3,206 3,566
Corporate and commercial Past due by up to 29 days 48,337 48,596 Past due by up to 59 days 3,175 9,505 Past due by up to 89 days 1,231 191
87,011 96,489
b Impaired loans and advances to customers
Impaired loans and advances are those that are classified as Customer Risk Rating (CRR) 9 or CRR 10. These grades are assigned when the bank considers that either the customer is unlikely to pay its credit obligations in full, without recourse to security, or when the customer is more than 90 days past due on any material credit obligation to the local group.
Impaired loans and advances also include renegotiated loans and advances that have been subject to a change in contractual cash flows as a result of a concession which the bank would not otherwise consider, and where it is probable that without the concession the borrower would be unable to meet the contractual payment obligations in full, unless the concession is insignificant and there are no other indicators of impairment. Renegotiated loans remain classified as impaired until there is sufficient evidence to demonstrate a significant reduction in the risk of non-payment of future cash flows, and there are no other indicators of impairment.
Impairment allowances on loans and advances to customers by business segment:
Individually assessed
Collectively assessed Total
Individually assessed
Collectively assessed Total
2017 2017 2017 2016 2016 2016
€000 €000 €000 €000 €000 €000
Personal 4,080 2,295 6,375 11,784 2,966 14,750
Corporate and commercial 30,044 4,222 34,266 32,182 4,429 36,611
As at 31 December 34,124 6,517 40,641 43,966 7,395 51,361
Renegotiated loans and advances to customers and forbearance
The contractual terms of a loan may be modified for a number of reasons including changing market conditions, customer retention and other factors not related to the current or potential credit deterioration of a customer. ‘Forbearance’ describes concessions made on the contractual terms of a loan in response to an obligor’s financial difficulties. The bank classifies and reports loans on which concessions have been granted under conditions of credit distress as ‘renegotiated loans’ when their contractual payment terms have been modified, because the bank has significant concerns about the borrowers’ ability to meet contractual payments when due.
97
4 Financial risk management (continued)
b Credit risk excluding Insurance credit risk which is reported under 4(f) (continued)
iii Credit quality of financial assets (continued)
b Impaired loans and advances to customers (continued)
Renegotiated loans and advances to customers and forbearance (continued)
On renegotiation, where the existing agreement is cancelled and a new agreement is made on substantially different terms, or if the terms of an existing agreement are modified, such that the renegotiated loan is substantially a different financial instrument, the loan would be derecognised and recognised as a new loan, for accounting purposes. However, newly recognised loans retain the ‘renegotiated loans’ classification.
A range of forbearance strategies is employed in order to improve the management of customer relationships, maximise collection opportunities and, if possible, avoid default, foreclosure or repossession. They include extended payment terms, a reduction in interest or principal repayments, approved external debt management plans, debt consolidations, the deferral of foreclosures, and other forms of loan modifications and re-ageing.
The bank’s policies and practices are based on criteria which enable management to judge whether repayment is likely to continue. These typically provide a customer with terms and conditions that are more favourable than those provided initially. Loan forbearance is only granted in situations where the customer has showed a willingness to repay the borrowing and is expected to be able to meet the revised obligations.
For personal lending the bank’s credit risk management policy sets out restrictions on the number and frequency of renegotiations, the minimum period an account must have been opened before any renegotiation can be considered and the number of qualifying payments that must be received.
When the bank grants a concession to a customer that the bank would not otherwise consider, as a result of their financial difficulty, this is objective evidence of impairment and impairment losses are measured accordingly. A renegotiated loan is presented as impaired when there has been a change in contractual cash flows as a result of a concession which the lender would otherwise not consider; and it is probable that without the concession, the borrower would be unable to meet contractual payment obligations in full. Accordingly, where the customer is not meeting contractual repayments or it is evident that they will be unable to do so without the renegotiation, there will be a significant concern regarding their ability to meet contractual payments, and the loan will be disclosed as impaired, unless the concession granted is insignificant. The renegotiated loan will continue to be disclosed as impaired until there is sufficient evidence to demonstrate a significant reduction in the risk of non-payment of future cash flows, and there are no other indicators of impairment.
Renegotiated loans are classified as unimpaired where the renegotiation has resulted from significant concern about a borrower’s ability to meet their contractual payment terms but the renegotiated terms are based on current market rates and contractual cash flows are expected to be collected in full following the renegotiation.
Unimpaired renegotiated loans also include previously impaired renegotiated loans that have demonstrated satisfactory performance over a period of time or have been assessed based on all available evidence as having no remaining indicators of impairment.
Loans that have been identified as renegotiated retain this designation until maturity or derecognition. When a loan is restructured as part of a forbearance strategy and the restructuring results in a derecognition of the existing loan, the new loan is disclosed as renegotiated. A loan that is renegotiated is derecognised if the existing agreement is cancelled and a new agreement made on substantially different terms, or if the terms of an existing agreement are modified, such that the renegotiated loan is substantially a different financial instrument as outlined previously.
When determining whether a loan that is restructured should be derecognised and a new loan recognised, the bank considers the extent to which the changes to the original contractual terms result in the renegotiated loan, considered as a whole, being a substantially different financial instrument.
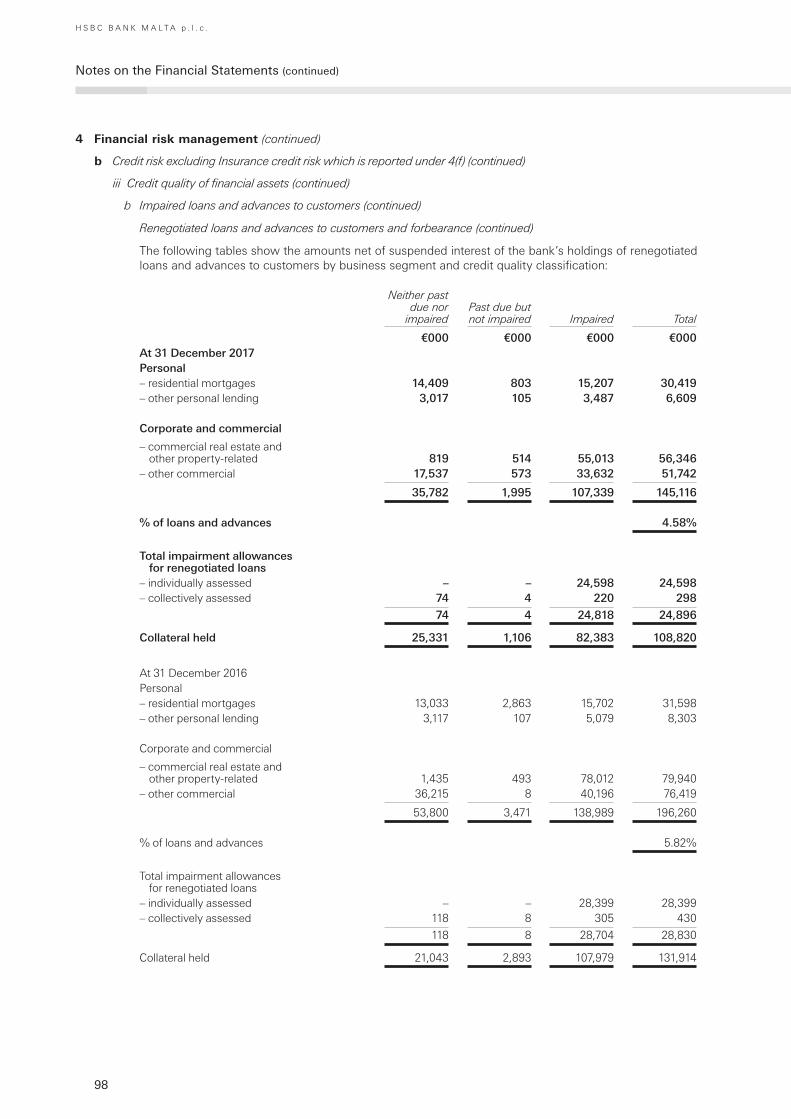
98
Notes on the Financial Statements (continued)
H S B C B A N K M A L T A p . l . c .
4 Financial risk management (continued)
b Credit risk excluding Insurance credit risk which is reported under 4(f) (continued)
iii Credit quality of financial assets (continued)
b Impaired loans and advances to customers (continued)
Renegotiated loans and advances to customers and forbearance (continued)
The following tables show the amounts net of suspended interest of the bank’s holdings of renegotiated loans and advances to customers by business segment and credit quality classification:
Neither past due nor
impairedPast due but not impaired Impaired Total
€000 €000 €000 €000At 31 December 2017Personal– residential mortgages 14,409 803 15,207 30,419 – other personal lending 3,017 105 3,487 6,609
Corporate and commercial
– commercial real estate and other property-related 819 514 55,013 56,346
– other commercial 17,537 573 33,632 51,742
35,782 1,995 107,339 145,116
% of loans and advances 4.58%
Total impairment allowances for renegotiated loans
– individually assessed – – 24,598 24,598 – collectively assessed 74 4 220 298
74 4 24,818 24,896
Collateral held 25,331 1,106 82,383 108,820
At 31 December 2016Personal– residential mortgages 13,033 2,863 15,702 31,598 – other personal lending 3,117 107 5,079 8,303
Corporate and commercial
– commercial real estate and other property-related 1,435 493 78,012 79,940
– other commercial 36,215 8 40,196 76,419
53,800 3,471 138,989 196,260
% of loans and advances 5.82%
Total impairment allowances for renegotiated loans
– individually assessed – – 28,399 28,399 – collectively assessed 118 8 305 430
118 8 28,704 28,830
Collateral held 21,043 2,893 107,979 131,914
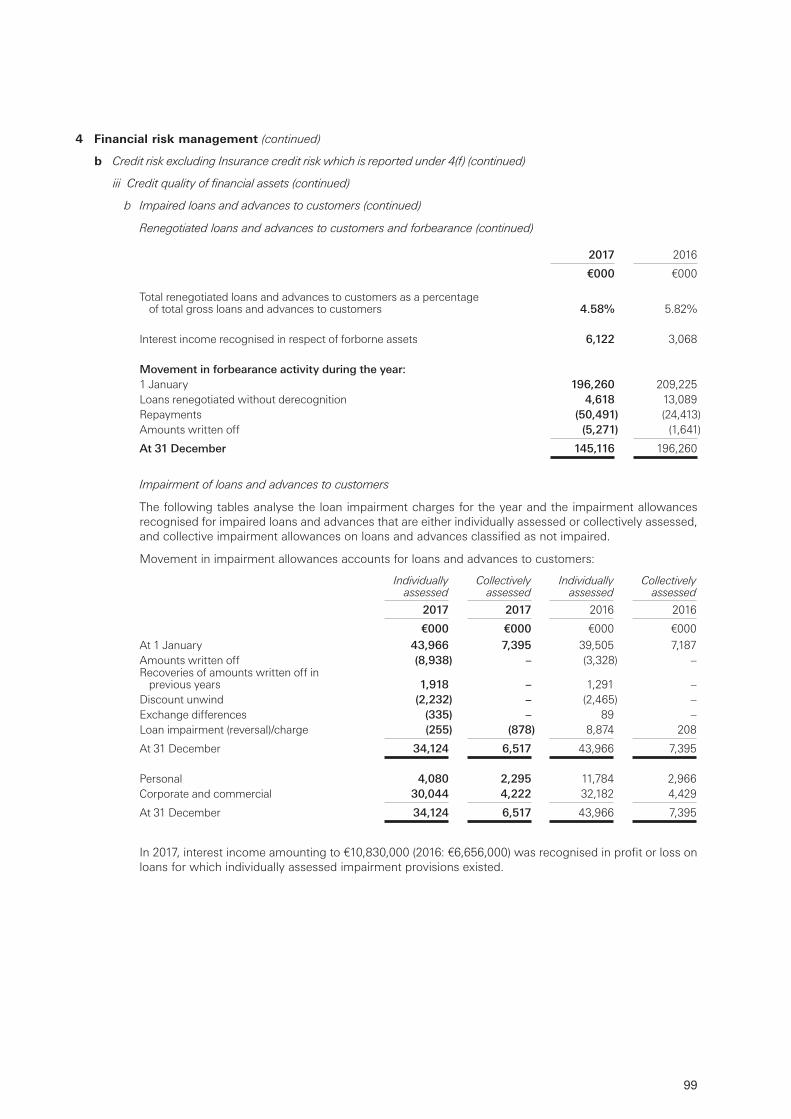
99
4 Financial risk management (continued)
b Credit risk excluding Insurance credit risk which is reported under 4(f) (continued)
iii Credit quality of financial assets (continued)
b Impaired loans and advances to customers (continued)
Renegotiated loans and advances to customers and forbearance (continued)
2017 2016
€000 €000
Total renegotiated loans and advances to customers as a percentage of total gross loans and advances to customers 4.58% 5.82%
Interest income recognised in respect of forborne assets 6,122 3,068
Movement in forbearance activity during the year:1 January 196,260 209,225Loans renegotiated without derecognition 4,618 13,089Repayments (50,491) (24,413)Amounts written off (5,271) (1,641)
At 31 December 145,116 196,260
Impairment of loans and advances to customers
The following tables analyse the loan impairment charges for the year and the impairment allowances recognised for impaired loans and advances that are either individually assessed or collectively assessed, and collective impairment allowances on loans and advances classified as not impaired.
Movement in impairment allowances accounts for loans and advances to customers:
Individually assessed
Collectively assessed
Individually assessed
Collectively assessed
2017 2017 2016 2016
€000 €000 €000 €000
At 1 January 43,966 7,395 39,505 7,187 Amounts written off (8,938) – (3,328) –Recoveries of amounts written off in
previous years 1,918 – 1,291 –Discount unwind (2,232) – (2,465) –Exchange differences (335) – 89 –Loan impairment (reversal)/charge (255) (878) 8,874 208
At 31 December 34,124 6,517 43,966 7,395
Personal 4,080 2,295 11,784 2,966 Corporate and commercial 30,044 4,222 32,182 4,429
At 31 December 34,124 6,517 43,966 7,395
In 2017, interest income amounting to €10,830,000 (2016: €6,656,000) was recognised in profit or loss on loans for which individually assessed impairment provisions existed.
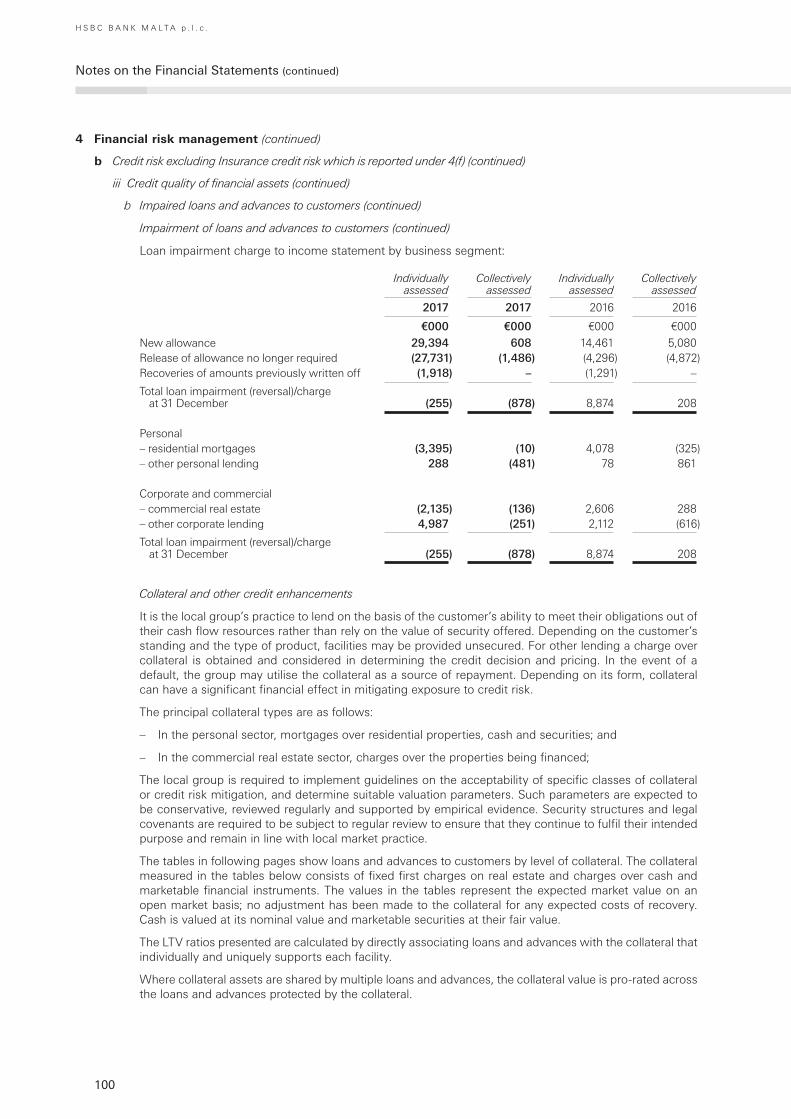
100
Notes on the Financial Statements (continued)
H S B C B A N K M A L T A p . l . c .
4 Financial risk management (continued)
b Credit risk excluding Insurance credit risk which is reported under 4(f) (continued)
iii Credit quality of financial assets (continued)
b Impaired loans and advances to customers (continued)
Impairment of loans and advances to customers (continued)
Loan impairment charge to income statement by business segment:
Individually assessed
Collectively assessed
Individually assessed
Collectively assessed
2017 2017 2016 2016
€000 €000 €000 €000
New allowance 29,394 608 14,461 5,080 Release of allowance no longer required (27,731) (1,486) (4,296) (4,872)Recoveries of amounts previously written off (1,918) – (1,291) –
Total loan impairment (reversal)/charge at 31 December (255) (878) 8,874 208
Personal– residential mortgages (3,395) (10) 4,078 (325)– other personal lending 288 (481) 78 861
Corporate and commercial– commercial real estate (2,135) (136) 2,606 288– other corporate lending 4,987 (251) 2,112 (616)
Total loan impairment (reversal)/charge at 31 December (255) (878) 8,874 208
Collateral and other credit enhancements
It is the local group’s practice to lend on the basis of the customer’s ability to meet their obligations out of their cash flow resources rather than rely on the value of security offered. Depending on the customer’s standing and the type of product, facilities may be provided unsecured. For other lending a charge over collateral is obtained and considered in determining the credit decision and pricing. In the event of a default, the group may utilise the collateral as a source of repayment. Depending on its form, collateral can have a significant financial effect in mitigating exposure to credit risk.
The principal collateral types are as follows:
– In the personal sector, mortgages over residential properties, cash and securities; and
– In the commercial real estate sector, charges over the properties being financed;
The local group is required to implement guidelines on the acceptability of specific classes of collateral or credit risk mitigation, and determine suitable valuation parameters. Such parameters are expected to be conservative, reviewed regularly and supported by empirical evidence. Security structures and legal covenants are required to be subject to regular review to ensure that they continue to fulfil their intended purpose and remain in line with local market practice.
The tables in following pages show loans and advances to customers by level of collateral. The collateral measured in the tables below consists of fixed first charges on real estate and charges over cash and marketable financial instruments. The values in the tables represent the expected market value on an open market basis; no adjustment has been made to the collateral for any expected costs of recovery. Cash is valued at its nominal value and marketable securities at their fair value.
The LTV ratios presented are calculated by directly associating loans and advances with the collateral that individually and uniquely supports each facility.
Where collateral assets are shared by multiple loans and advances, the collateral value is pro-rated across the loans and advances protected by the collateral.
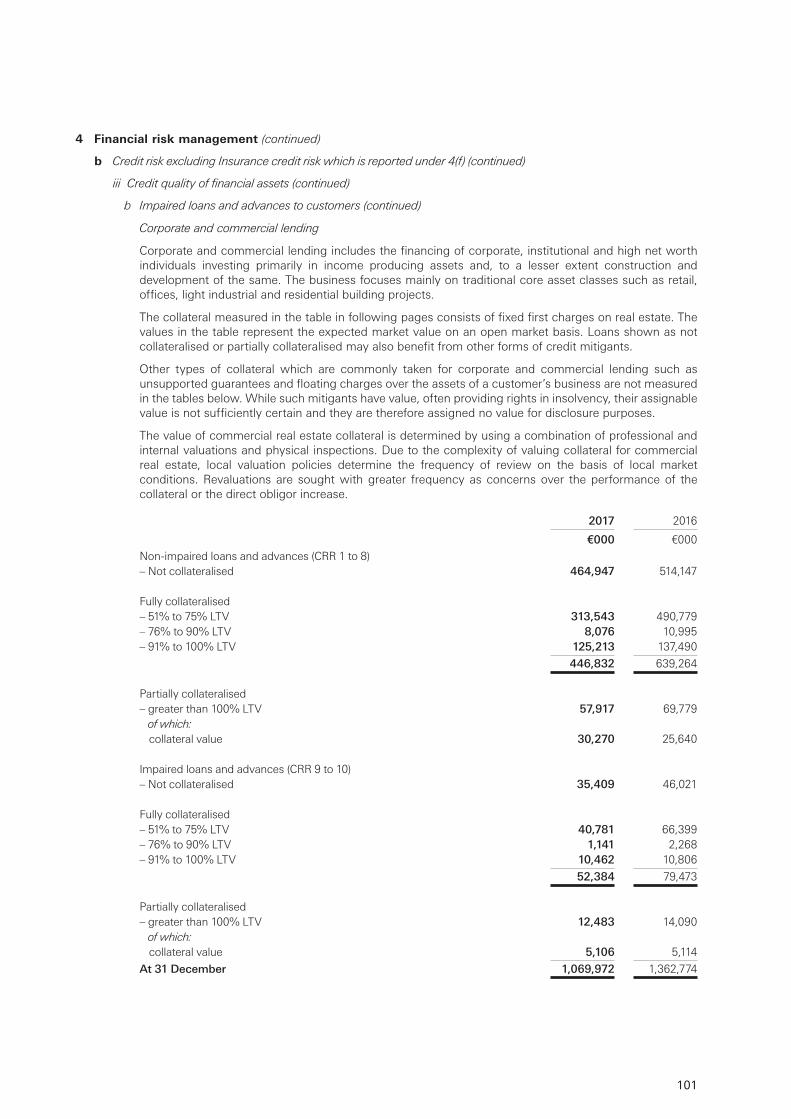
101
4 Financial risk management (continued)
b Credit risk excluding Insurance credit risk which is reported under 4(f) (continued)
iii Credit quality of financial assets (continued)
b Impaired loans and advances to customers (continued)
Corporate and commercial lending
Corporate and commercial lending includes the financing of corporate, institutional and high net worth individuals investing primarily in income producing assets and, to a lesser extent construction and development of the same. The business focuses mainly on traditional core asset classes such as retail, offices, light industrial and residential building projects.
The collateral measured in the table in following pages consists of fixed first charges on real estate. The values in the table represent the expected market value on an open market basis. Loans shown as not collateralised or partially collateralised may also benefit from other forms of credit mitigants.
Other types of collateral which are commonly taken for corporate and commercial lending such as unsupported guarantees and floating charges over the assets of a customer’s business are not measured in the tables below. While such mitigants have value, often providing rights in insolvency, their assignable value is not sufficiently certain and they are therefore assigned no value for disclosure purposes.
The value of commercial real estate collateral is determined by using a combination of professional and internal valuations and physical inspections. Due to the complexity of valuing collateral for commercial real estate, local valuation policies determine the frequency of review on the basis of local market conditions. Revaluations are sought with greater frequency as concerns over the performance of the collateral or the direct obligor increase.
2017 2016
€000 €000
Non-impaired loans and advances (CRR 1 to 8)– Not collateralised 464,947 514,147
Fully collateralised– 51% to 75% LTV 313,543 490,779– 76% to 90% LTV 8,076 10,995– 91% to 100% LTV 125,213 137,490
446,832 639,264
Partially collateralised– greater than 100% LTV 57,917 69,779 of which:collateral value 30,270 25,640
Impaired loans and advances (CRR 9 to 10)– Not collateralised 35,409 46,021
Fully collateralised– 51% to 75% LTV 40,781 66,399– 76% to 90% LTV 1,141 2,268 – 91% to 100% LTV 10,462 10,806
52,384 79,473
Partially collateralised– greater than 100% LTV 12,483 14,090 of which:collateral value 5,106 5,114
At 31 December 1,069,972 1,362,774
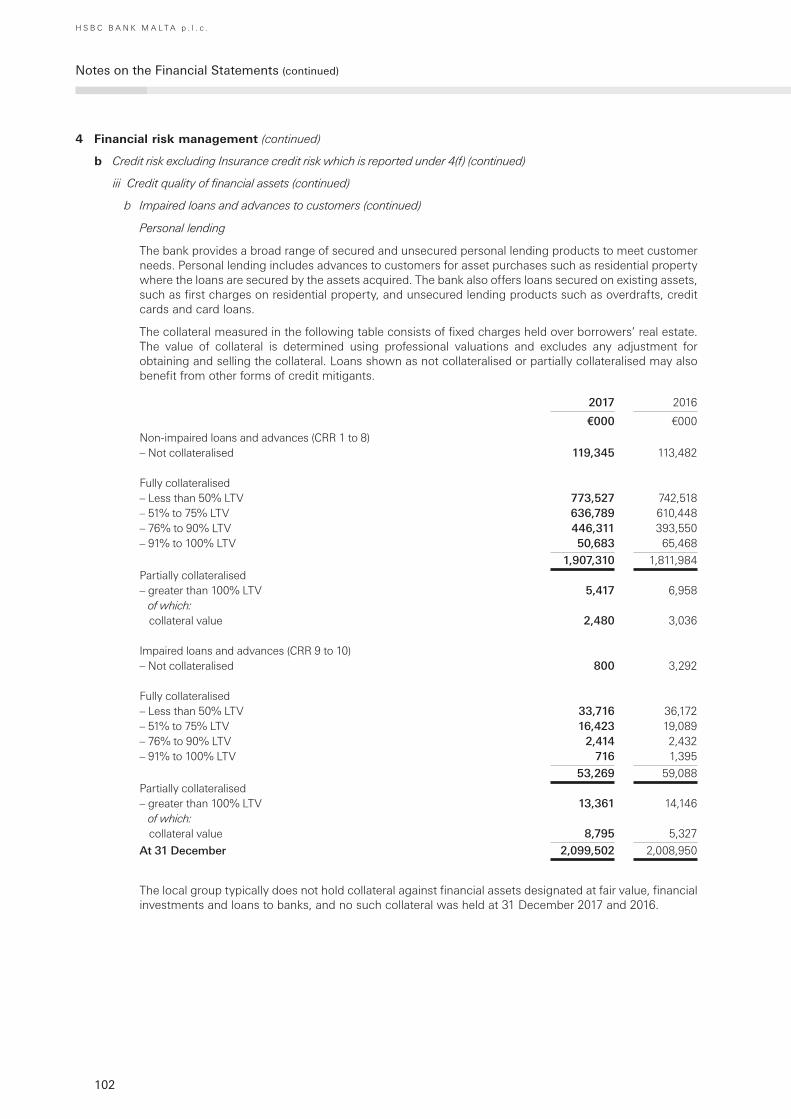
102
Notes on the Financial Statements (continued)
H S B C B A N K M A L T A p . l . c .
4 Financial risk management (continued)
b Credit risk excluding Insurance credit risk which is reported under 4(f) (continued)
iii Credit quality of financial assets (continued)
b Impaired loans and advances to customers (continued)
Personal lending
The bank provides a broad range of secured and unsecured personal lending products to meet customer needs. Personal lending includes advances to customers for asset purchases such as residential property where the loans are secured by the assets acquired. The bank also offers loans secured on existing assets, such as first charges on residential property, and unsecured lending products such as overdrafts, credit cards and card loans.
The collateral measured in the following table consists of fixed charges held over borrowers’ real estate. The value of collateral is determined using professional valuations and excludes any adjustment for obtaining and selling the collateral. Loans shown as not collateralised or partially collateralised may also benefit from other forms of credit mitigants.
2017 2016
€000 €000
Non-impaired loans and advances (CRR 1 to 8)– Not collateralised 119,345 113,482
Fully collateralised– Less than 50% LTV 773,527 742,518 – 51% to 75% LTV 636,789 610,448 – 76% to 90% LTV 446,311 393,550 – 91% to 100% LTV 50,683 65,468
1,907,310 1,811,984 Partially collateralised– greater than 100% LTV 5,417 6,958 of which:collateral value 2,480 3,036
Impaired loans and advances (CRR 9 to 10)– Not collateralised 800 3,292
Fully collateralised– Less than 50% LTV 33,716 36,172 – 51% to 75% LTV 16,423 19,089 – 76% to 90% LTV 2,414 2,432 – 91% to 100% LTV 716 1,395
53,269 59,088 Partially collateralised– greater than 100% LTV 13,361 14,146 of which:collateral value 8,795 5,327
At 31 December 2,099,502 2,008,950
The local group typically does not hold collateral against financial assets designated at fair value, financial investments and loans to banks, and no such collateral was held at 31 December 2017 and 2016.
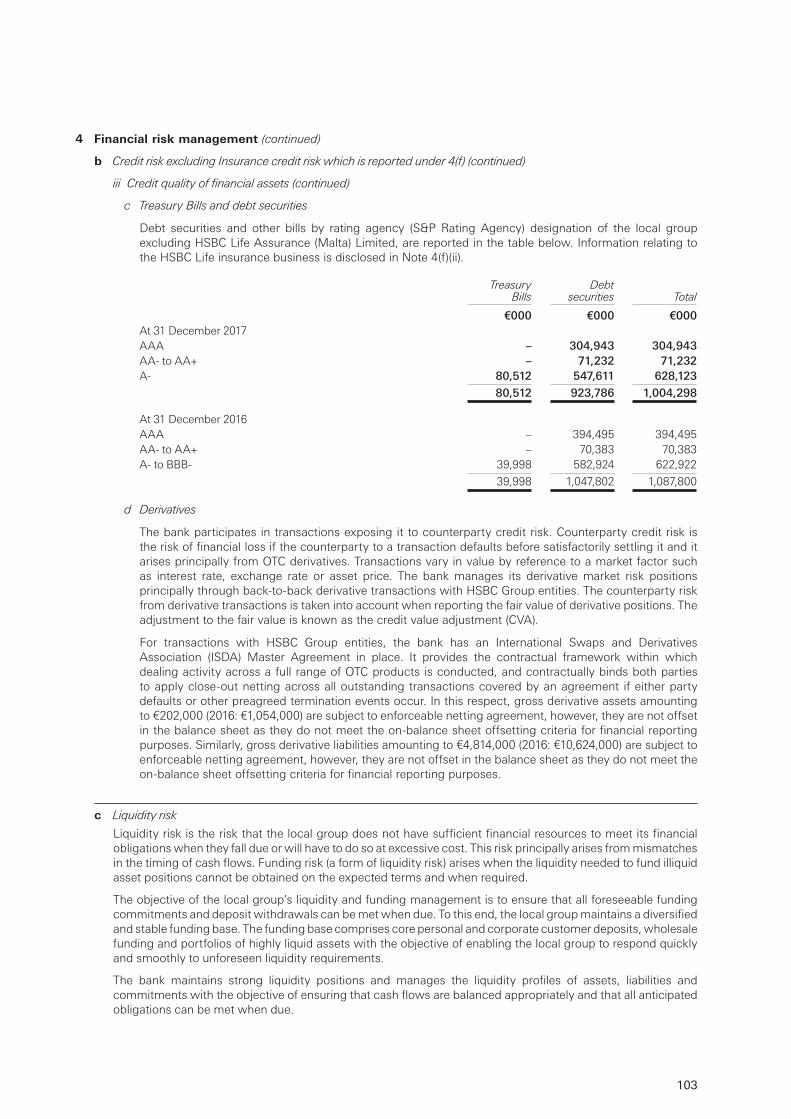
103
4 Financial risk management (continued)
b Credit risk excluding Insurance credit risk which is reported under 4(f) (continued)
iii Credit quality of financial assets (continued)
c Treasury Bills and debt securities
Debt securities and other bills by rating agency (S&P Rating Agency) designation of the local group excluding HSBC Life Assurance (Malta) Limited, are reported in the table below. Information relating to the HSBC Life insurance business is disclosed in Note 4(f)(ii).
Treasury Bills
Debt securities Total
€000 €000 €000At 31 December 2017AAA – 304,943 304,943 AA- to AA+ – 71,232 71,232 A- 80,512 547,611 628,123
80,512 923,786 1,004,298
At 31 December 2016AAA – 394,495 394,495 AA- to AA+ – 70,383 70,383 A- to BBB- 39,998 582,924 622,922
39,998 1,047,802 1,087,800
d Derivatives
The bank participates in transactions exposing it to counterparty credit risk. Counterparty credit risk is the risk of financial loss if the counterparty to a transaction defaults before satisfactorily settling it and it arises principally from OTC derivatives. Transactions vary in value by reference to a market factor such as interest rate, exchange rate or asset price. The bank manages its derivative market risk positions principally through back-to-back derivative transactions with HSBC Group entities. The counterparty risk from derivative transactions is taken into account when reporting the fair value of derivative positions. The adjustment to the fair value is known as the credit value adjustment (CVA).
For transactions with HSBC Group entities, the bank has an International Swaps and Derivatives Association (ISDA) Master Agreement in place. It provides the contractual framework within which dealing activity across a full range of OTC products is conducted, and contractually binds both parties to apply close-out netting across all outstanding transactions covered by an agreement if either party defaults or other preagreed termination events occur. In this respect, gross derivative assets amounting to €202,000 (2016: €1,054,000) are subject to enforceable netting agreement, however, they are not offset in the balance sheet as they do not meet the on-balance sheet offsetting criteria for financial reporting purposes. Similarly, gross derivative liabilities amounting to €4,814,000 (2016: €10,624,000) are subject to enforceable netting agreement, however, they are not offset in the balance sheet as they do not meet the on-balance sheet offsetting criteria for financial reporting purposes.
c Liquidity risk
Liquidity risk is the risk that the local group does not have sufficient financial resources to meet its financial obligations when they fall due or will have to do so at excessive cost. This risk principally arises from mismatches in the timing of cash flows. Funding risk (a form of liquidity risk) arises when the liquidity needed to fund illiquid asset positions cannot be obtained on the expected terms and when required.
The objective of the local group’s liquidity and funding management is to ensure that all foreseeable funding commitments and deposit withdrawals can be met when due. To this end, the local group maintains a diversified and stable funding base. The funding base comprises core personal and corporate customer deposits, wholesale funding and portfolios of highly liquid assets with the objective of enabling the local group to respond quickly and smoothly to unforeseen liquidity requirements.
The bank maintains strong liquidity positions and manages the liquidity profiles of assets, liabilities and commitments with the objective of ensuring that cash flows are balanced appropriately and that all anticipated obligations can be met when due.
104
Notes on the Financial Statements (continued)
H S B C B A N K M A L T A p . l . c .
4 Financial risk management (continued)
c Liquidity risk (continued)
The bank employs a number of measures to monitor liquidity risk. The local group also manages its intra-day liquidity positions so that it is able to meet payment and settlement obligations on a timely basis. Expected peak payment flows and large time-critical payments are monitored during the day.
The local group’s liquidity and funding management processes include:
– projecting cash flows by major currency under various stress scenarios considering the level of liquid assets necessary in relation thereto;
– monitoring liquidity ratios against internal and regulatory requirements;
– maintaining a diverse range of funding sources with adequate back-up facilities;
– managing the concentration and profile of debt maturities;
– monitoring depositor concentration in order to avoid undue reliance on large individual depositors and ensure a satisfactory overall funding mix; and
– maintaining liquidity and funding contingency plans. These plans identify early indicators of stress conditions and describe actions to be taken in the event of difficulties arising from systematic or other crises while minimising adverse long-term implications for the business.
Primary sources of funding
Customer deposits in the form of current accounts and savings deposits payable on demand or at short notice form a significant part of the local group’s funding, and thus considerable importance is placed on maintaining their stability. For deposits, stability depends upon maintaining depositor confidence in the local group’s capital strength and liquidity, and on competitive and transparent pricing.
The local group also accesses the local wholesale funding market by issuing unsecured debt securities to align asset and liability maturities and to maintain a presence in the local wholesale market.
Management of liquidity and funding risk
The bank’s liquidity and funding risk management framework employs two key measures to define, monitor and control the liquidity and funding risk. The Net Stable Funding Ratio (NSFR) ratio is used to monitor the structural long-term funding position of the bank, and the Liquidity Coverage Ratio (LCR) ratio metric is used to gauge the short-term resilience of the bank’s liquidity profile. The bank also monitors the contractual maturity ladder, which provides insight into the extent to which the bank relies on maturity transformation in respect of contractual cash flows. More precisely, the maturity ladder is used by the bank to determine the availability of liquid assets to meet the liquidity gaps for diverse time horizons.
The bank’s ALCO focuses on the management process with respect to liquidity and funding risks. Compliance with established limits is monitored by the local ALCO.
105
4 Financial risk management (continued)
c Liquidity risk (continued)
i Liquidity Coverage Ratio
The LCR metric is designed to promote the short-term resilience of a bank’s liquidity profile, and became a minimum regulatory standard from 1 October 2015, under European Commission (EC) Delegated Regulation 2015/61. It aims to ensure that a bank has sufficient unencumbered high-quality liquid assets (HQLA) to meet its liquidity needs in a 30-calendar-day liquidity stress scenario. HQLA consist of cash or assets that can be converted into cash at little or no loss of value in the markets.
The table below displays the LCR year end levels for the bank.
2017 2016
% %
At 31 DecemberActual LCR Ratio 456 479Regulatory Minimum 100 100
During the years ended 31 December 2017 and 2016 the LCR ratio was within both the regulatory minimum and the risk appetite set by the bank.
ii Net stable funding ratio
The NSFR requires institutions to maintain sufficient stable funding relative to required stable funding, and reflects a bank’s long-term funding profile (funding with a term of more than a year). It is designed to complement the LCR.
The bank calculates NSFR in line with Basel Committee on Banking Supervision publication 295. This calculation requires various interpretations of the text, and therefore HSBC’s NSFR may not be directly comparable with the ratios of other institutions.
2017 2016
% %
At 31 DecemberActual NSFR Ratio 135 136Regulatory Minimum 100 100
During the years ended 31 December 2017 and 2016 the NSFR was within both the regulatory minimum and the risk appetite set by the bank.
iii Depositor Concentration
The LCR and NSFR metrics assume a stressed outflow based on a portfolio of depositors within each deposit segment. The validity of these assumptions is challenged if the underlying depositors do not represent a large enough portfolio so that a depositor concentration exists. The bank is exposed to term re-financing concentration risk if the current maturity profile results in future maturities being overly concentrated in any defined period.
As at 31 December 2017, the bank was within the risk appetite levels set for depositor concentration and term funding maturity concentration.
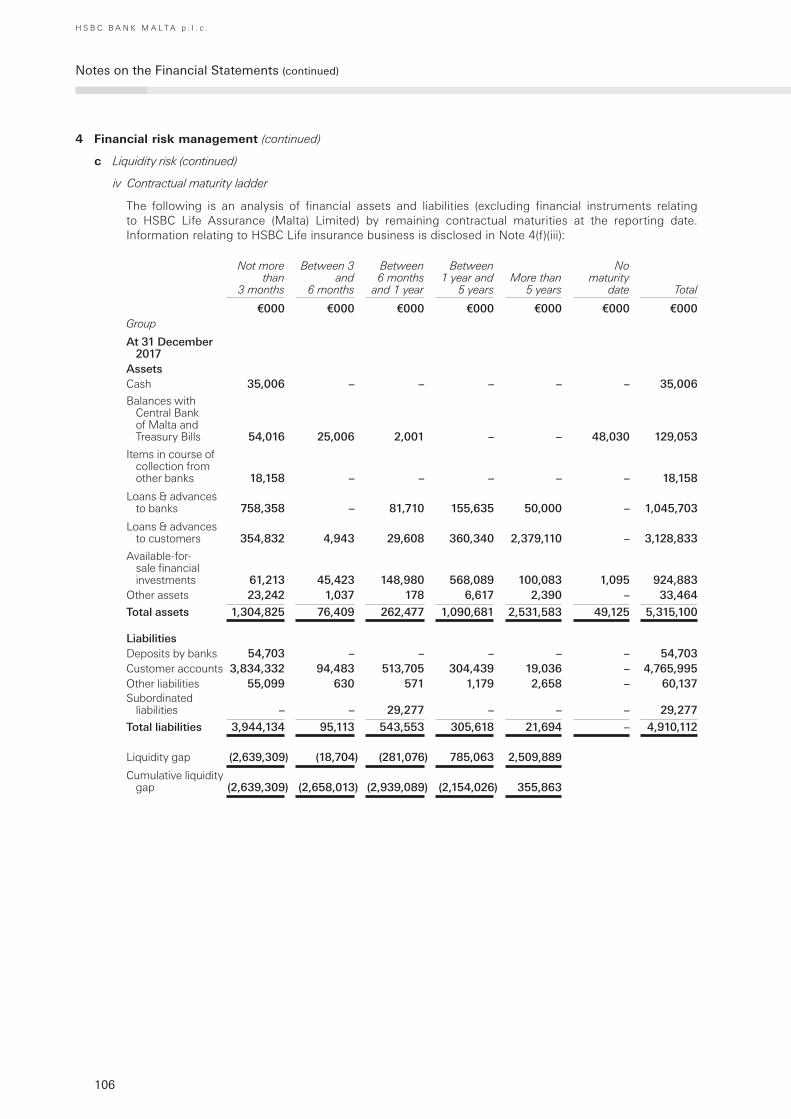
106
Notes on the Financial Statements (continued)
H S B C B A N K M A L T A p . l . c .
4 Financial risk management (continued)
c Liquidity risk (continued)
iv Contractual maturity ladder
The following is an analysis of financial assets and liabilities (excluding financial instruments relating to HSBC Life Assurance (Malta) Limited) by remaining contractual maturities at the reporting date. Information relating to HSBC Life insurance business is disclosed in Note 4(f)(iii):
Not more than
3 months
Between 3 and
6 months
Between 6 months
and 1 year
Between 1 year and
5 yearsMore than
5 years
No maturity
date Total
€000 €000 €000 €000 €000 €000 €000Group
At 31 December 2017
AssetsCash 35,006 – – – – – 35,006
Balances with Central Bank of Malta and Treasury Bills 54,016 25,006 2,001 – – 48,030 129,053
Items in course of collection from other banks 18,158 – – – – – 18,158
Loans & advances to banks 758,358 – 81,710 155,635 50,000 – 1,045,703
Loans & advances to customers 354,832 4,943 29,608 360,340 2,379,110 – 3,128,833
Available-for-sale financial investments 61,213 45,423 148,980 568,089 100,083 1,095 924,883
Other assets 23,242 1,037 178 6,617 2,390 – 33,464
Total assets 1,304,825 76,409 262,477 1,090,681 2,531,583 49,125 5,315,100
LiabilitiesDeposits by banks 54,703 – – – – – 54,703 Customer accounts 3,834,332 94,483 513,705 304,439 19,036 – 4,765,995 Other liabilities 55,099 630 571 1,179 2,658 – 60,137 Subordinated
liabilities – – 29,277 – – – 29,277
Total liabilities 3,944,134 95,113 543,553 305,618 21,694 – 4,910,112
Liquidity gap (2,639,309) (18,704) (281,076) 785,063 2,509,889
Cumulative liquidity gap
(2,639,309)
(2,658,013)
(2,939,089) (2,154,026) 355,863
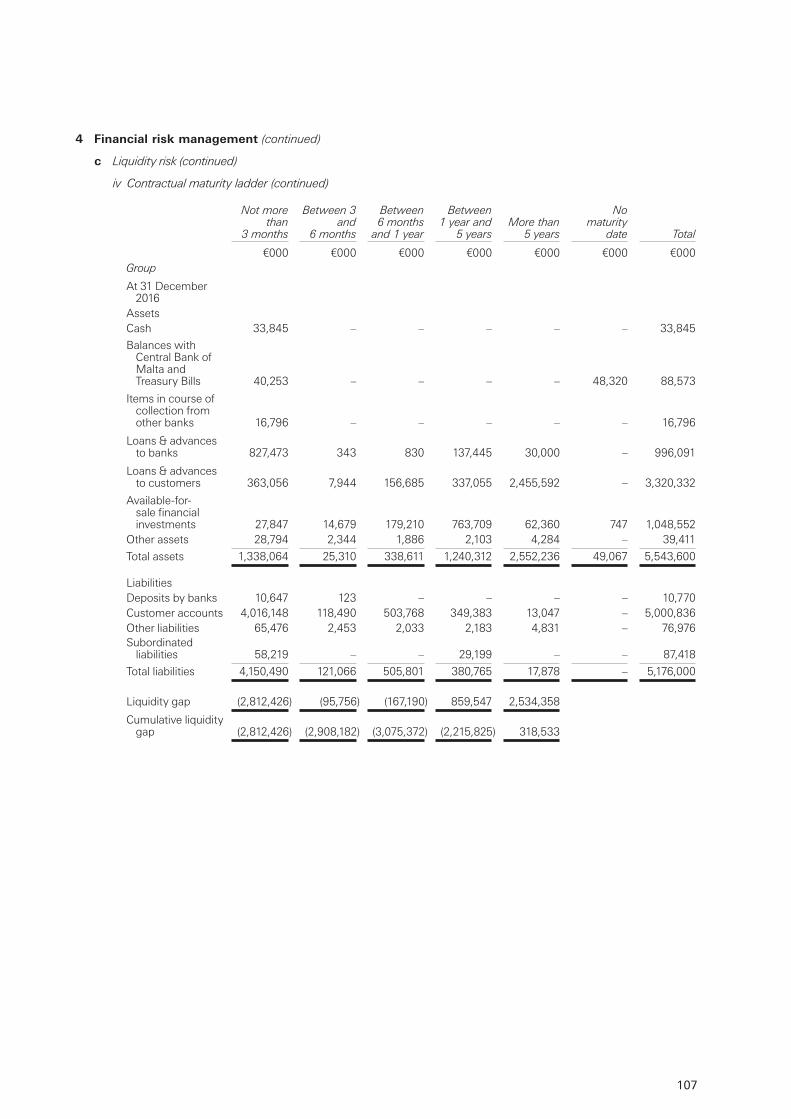
107
4 Financial risk management (continued)
c Liquidity risk (continued)
iv Contractual maturity ladder (continued)
Not more than
3 months
Between 3 and
6 months
Between 6 months
and 1 year
Between 1 year and
5 yearsMore than
5 years
No maturity
date Total
€000 €000 €000 €000 €000 €000 €000Group
At 31 December 2016
AssetsCash 33,845 – – – – – 33,845
Balances with Central Bank of Malta and Treasury Bills 40,253 – – – – 48,320 88,573
Items in course of collection from other banks 16,796 – – – – – 16,796
Loans & advances to banks 827,473 343 830 137,445 30,000 – 996,091
Loans & advances to customers 363,056 7,944 156,685 337,055 2,455,592 – 3,320,332
Available-for-sale financial investments 27,847 14,679 179,210 763,709 62,360 747 1,048,552
Other assets 28,794 2,344 1,886 2,103 4,284 – 39,411
Total assets 1,338,064 25,310 338,611 1,240,312 2,552,236 49,067 5,543,600
LiabilitiesDeposits by banks 10,647 123 – – – – 10,770 Customer accounts 4,016,148 118,490 503,768 349,383 13,047 – 5,000,836 Other liabilities 65,476 2,453 2,033 2,183 4,831 – 76,976Subordinated
liabilities 58,219 – – 29,199 – – 87,418
Total liabilities 4,150,490 121,066 505,801 380,765 17,878 – 5,176,000
Liquidity gap (2,812,426) (95,756) (167,190) 859,547 2,534,358
Cumulative liquidity gap (2,812,426) (2,908,182) (3,075,372) (2,215,825) 318,533

108
Notes on the Financial Statements (continued)
H S B C B A N K M A L T A p . l . c .
4 Financial risk management (continued)
c Liquidity risk (continued)
iv Contractual maturity ladder (continued)
Not more than
3 months
Between 3 and
6 months
Between 6 months
and 1 year
Between 1 year and
5 yearsMore than
5 years
No maturity
date Total
€000 €000 €000 €000 €000 €000 €000Bank
At 31 December 2017
AssetsCash 35,006 – – – – – 35,006
Balances with Central Bank of Malta and Treasury Bills 54,016 25,006 2,001 – – 48,030 129,053
Items in course of collection from other banks 18,158 – – – – – 18,158
Loans & advances to banks 758,354 – 81,710 155,635 50,000 – 1,045,699
Loans & advances to customers 354,832 4,943 29,608 360,340 2,379,110 – 3,128,833
Available-for-sale financial investments 61,213 45,423 148,980 568,087 100,083 1,095 924,881
Other assets 23,024 1,037 178 6,617 2,390 – 33,246
Total assets 1,304,603 76,409 262,477 1,090,679 2,531,583 49,125 5,314,876
LiabilitiesDeposits by banks 54,703 – – – – – 54,703 Customer accounts 3,919,268 94,483 513,705 304,439 19,036 – 4,850,931 Other liabilities 54,676 630 571 1,179 2,658 – 59,714 Subordinated
liabilities – – 30,000 – – – 30,000
Total liabilities 4,028,647 95,113 544,276 305,618 21,694 – 4,995,348
Liquidity gap (2,724,044) (18,704) (281,799) 785,061 2,509,889
Cumulative liquidity gap (2,724,044)
(2,742,748) (3,024,547) (2,239,486) 270,403
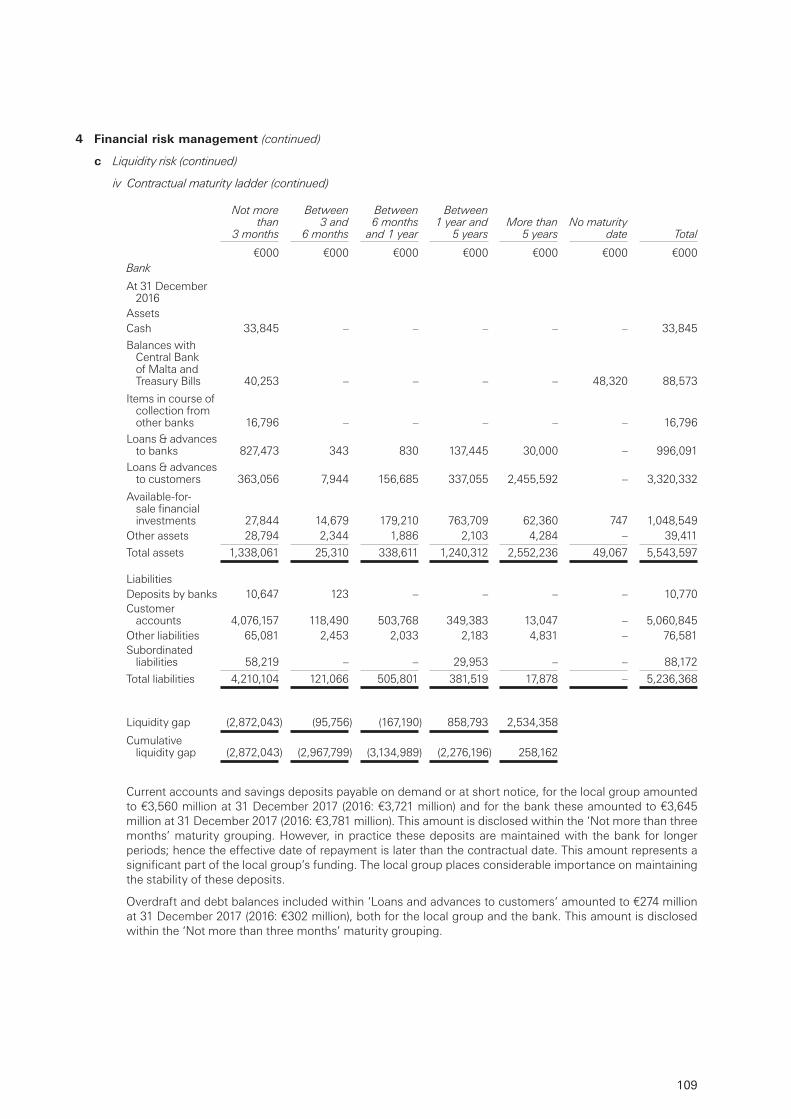
109
4 Financial risk management (continued)
c Liquidity risk (continued)
iv Contractual maturity ladder (continued)
Not more than
3 months
Between 3 and
6 months
Between 6 months
and 1 year
Between 1 year and
5 yearsMore than
5 yearsNo maturity
date Total
€000 €000 €000 €000 €000 €000 €000Bank
At 31 December 2016
AssetsCash 33,845 – – – – – 33,845
Balances with Central Bank of Malta and Treasury Bills 40,253 – – – – 48,320 88,573
Items in course of collection from other banks 16,796 – – – – – 16,796
Loans & advances to banks 827,473 343 830 137,445 30,000 – 996,091
Loans & advances to customers 363,056 7,944 156,685 337,055 2,455,592 – 3,320,332
Available-for-sale financial investments 27,844 14,679 179,210 763,709 62,360 747 1,048,549
Other assets 28,794 2,344 1,886 2,103 4,284 – 39,411
Total assets 1,338,061 25,310 338,611 1,240,312 2,552,236 49,067 5,543,597
LiabilitiesDeposits by banks 10,647 123 – – – – 10,770 Customer
accounts 4,076,157 118,490 503,768 349,383 13,047 – 5,060,845 Other liabilities 65,081 2,453 2,033 2,183 4,831 – 76,581Subordinated
liabilities 58,219 – – 29,953 – – 88,172
Total liabilities 4,210,104 121,066 505,801 381,519 17,878 – 5,236,368
Liquidity gap (2,872,043) (95,756) (167,190) 858,793 2,534,358
Cumulative liquidity gap (2,872,043) (2,967,799) (3,134,989) (2,276,196) 258,162
Current accounts and savings deposits payable on demand or at short notice, for the local group amounted to €3,560 million at 31 December 2017 (2016: €3,721 million) and for the bank these amounted to €3,645 million at 31 December 2017 (2016: €3,781 million). This amount is disclosed within the ‘Not more than three months’ maturity grouping. However, in practice these deposits are maintained with the bank for longer periods; hence the effective date of repayment is later than the contractual date. This amount represents a significant part of the local group’s funding. The local group places considerable importance on maintaining the stability of these deposits.
Overdraft and debt balances included within ‘Loans and advances to customers‘ amounted to €274 million at 31 December 2017 (2016: €302 million), both for the local group and the bank. This amount is disclosed within the ‘Not more than three months’ maturity grouping.
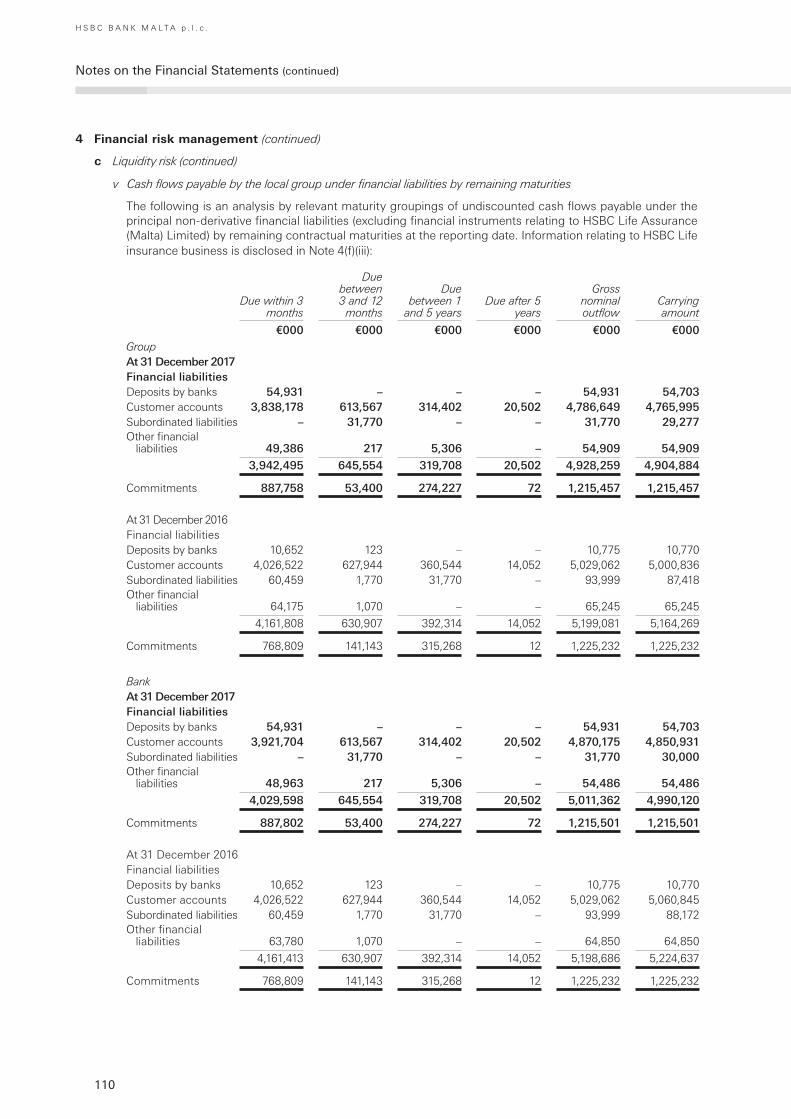
110
Notes on the Financial Statements (continued)
H S B C B A N K M A L T A p . l . c .
4 Financial risk management (continued)
c Liquidity risk (continued)
v Cash flows payable by the local group under financial liabilities by remaining maturities
The following is an analysis by relevant maturity groupings of undiscounted cash flows payable under the principal non-derivative financial liabilities (excluding financial instruments relating to HSBC Life Assurance (Malta) Limited) by remaining contractual maturities at the reporting date. Information relating to HSBC Life insurance business is disclosed in Note 4(f)(iii):
Due within 3 months
Due between 3 and 12
months
Due between 1
and 5 yearsDue after 5
years
Gross nominal outflow
Carrying amount
€000 €000 €000 €000 €000 €000GroupAt 31 December 2017Financial liabilitiesDeposits by banks 54,931 – – – 54,931 54,703 Customer accounts 3,838,178 613,567 314,402 20,502 4,786,649 4,765,995 Subordinated liabilities – 31,770 – – 31,770 29,277 Other financial
liabilities 49,386 217 5,306 – 54,909 54,909
3,942,495 645,554 319,708 20,502 4,928,259 4,904,884
Commitments 887,758 53,400 274,227 72 1,215,457 1,215,457
At 31 December 2016Financial liabilitiesDeposits by banks 10,652 123 – – 10,775 10,770 Customer accounts 4,026,522 627,944 360,544 14,052 5,029,062 5,000,836 Subordinated liabilities 60,459 1,770 31,770 – 93,999 87,418 Other financial
liabilities 64,175 1,070 – – 65,245 65,245
4,161,808 630,907 392,314 14,052 5,199,081 5,164,269
Commitments 768,809 141,143 315,268 12 1,225,232 1,225,232
BankAt 31 December 2017Financial liabilitiesDeposits by banks 54,931 – – – 54,931 54,703 Customer accounts 3,921,704 613,567 314,402 20,502 4,870,175 4,850,931 Subordinated liabilities – 31,770 – – 31,770 30,000 Other financial
liabilities 48,963 217 5,306 – 54,486 54,486
4,029,598 645,554 319,708 20,502 5,011,362 4,990,120
Commitments 887,802 53,400 274,227 72 1,215,501 1,215,501
At 31 December 2016Financial liabilitiesDeposits by banks 10,652 123 – – 10,775 10,770 Customer accounts 4,026,522 627,944 360,544 14,052 5,029,062 5,060,845 Subordinated liabilities 60,459 1,770 31,770 – 93,999 88,172 Other financial
liabilities 63,780 1,070 – – 64,850 64,850
4,161,413 630,907 392,314 14,052 5,198,686 5,224,637
Commitments 768,809 141,143 315,268 12 1,225,232 1,225,232
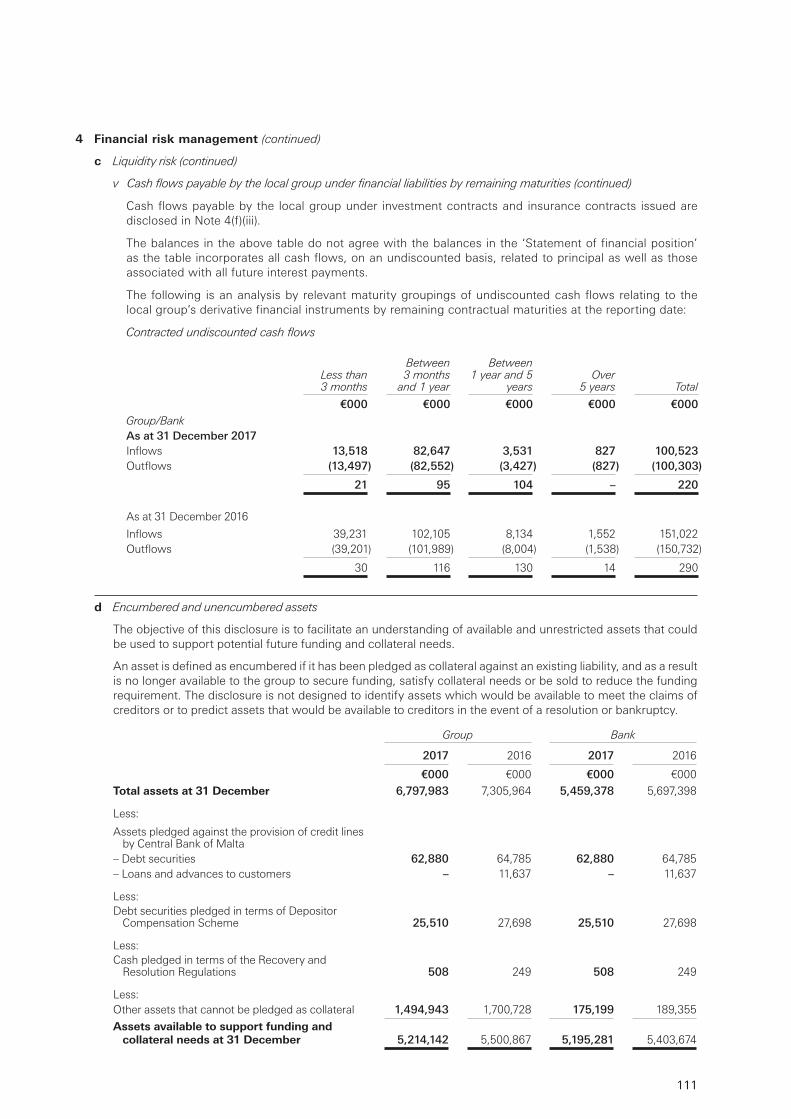
111
4 Financial risk management (continued)
c Liquidity risk (continued)
v Cash flows payable by the local group under financial liabilities by remaining maturities (continued)
Cash flows payable by the local group under investment contracts and insurance contracts issued are disclosed in Note 4(f)(iii).
The balances in the above table do not agree with the balances in the ‘Statement of financial position’ as the table incorporates all cash flows, on an undiscounted basis, related to principal as well as those associated with all future interest payments.
The following is an analysis by relevant maturity groupings of undiscounted cash flows relating to the local group’s derivative financial instruments by remaining contractual maturities at the reporting date:
Contracted undiscounted cash flows
Less than 3 months
Between 3 months
and 1 year
Between 1 year and 5
yearsOver
5 years Total
€000 €000 €000 €000 €000Group/BankAs at 31 December 2017Inflows 13,518 82,647 3,531 827 100,523 Outflows (13,497) (82,552) (3,427) (827) (100,303)
21 95 104 – 220
As at 31 December 2016
Inflows 39,231 102,105 8,134 1,552 151,022 Outflows (39,201) (101,989) (8,004) (1,538) (150,732)
30 116 130 14 290
d Encumbered and unencumbered assets
The objective of this disclosure is to facilitate an understanding of available and unrestricted assets that could be used to support potential future funding and collateral needs.
An asset is defined as encumbered if it has been pledged as collateral against an existing liability, and as a result is no longer available to the group to secure funding, satisfy collateral needs or be sold to reduce the funding requirement. The disclosure is not designed to identify assets which would be available to meet the claims of creditors or to predict assets that would be available to creditors in the event of a resolution or bankruptcy.
Group Bank
2017 2016 2017 2016
€000 €000 €000 €000
Total assets at 31 December 6,797,983 7,305,964 5,459,378 5,697,398
Less:
Assets pledged against the provision of credit lines by Central Bank of Malta
– Debt securities 62,880 64,785 62,880 64,785– Loans and advances to customers – 11,637 – 11,637
Less:Debt securities pledged in terms of Depositor
Compensation Scheme 25,510 27,698 25,510 27,698
Less:Cash pledged in terms of the Recovery and
Resolution Regulations 508 249 508 249
Less:Other assets that cannot be pledged as collateral 1,494,943 1,700,728 175,199 189,355
Assets available to support funding and collateral needs at 31 December 5,214,142 5,500,867 5,195,281 5,403,674
112
Notes on the Financial Statements (continued)
H S B C B A N K M A L T A p . l . c .
4 Financial risk management (continued)
e Market risk
Market risk is the risk that movements in market risk factors, including foreign exchange rates, interest rates and market prices will impact the local group’s income or the value of its portfolios. Exposure to market risk arises from positions that primarily emanate from the interest rate management of the local group’s retail and commercial banking assets and liabilities and financial investments designated as available-for-sale.
The objective of the local group’s market risk management is to manage and control market risk exposures in order to optimise return on risk while maintaining a market profile consistent with the local group’s status as a premier provider of financial products and services.
Market risk is managed and controlled through limits approved by HSBC Holdings and the global businesses. These limits are allocated across business lines and agreed with the Group’s legal entities. The management of market risk is principally undertaken using risk limits allocated from the risk appetite. Limits are set for portfolios, products and risk types, with market liquidity being a principal factor in determining the level of limits set. Risk, as an independent function, is responsible for market risk management and measurement techniques. The bank has an independent market risk management and control function which is responsible for measuring market risk exposures in accordance with policies, and monitoring and reporting these exposures against the prescribed limits on a daily basis.
Each line of business is requested to assess the market risks which arise on each product in the business and, where there is a risk that can be hedged in the markets, this is transferred to the local Global Markets for management. Where market risk is identified but there is no viable hedge in the market then the risk is managed under the local ALCO.
Monitoring and limiting market risk exposure
The bank uses a range of tools to monitor and limit market risk exposures including sensitivity analysis, value at risk (VaR), and stress testing.
i Sensitivity analysis
Sensitivity analysis measures the impact of individual market factor movements on specific instruments or portfolios including interest rates, foreign exchange rates and equity prices such as the impact of a one basis point change in yield. The bank uses sensitivity measures to monitor the market risk positions within each risk type, for example, the present value of a basis point movement in interest rates for interest rate risk. Sensitivity limits are set for portfolios, products and risk types, with the depth of the market being one of the principal factors in determining the level of limits set.
ii Value at risk (VaR)
VaR is a technique that estimates the potential losses on risk positions in a portfolio as a result of movement in market rates and prices over a specified time horizon and to a given level of confidence. The use of VaR is integrated into market risk management.
The VaR model used by the local group is based predominantly on historical simulation. This model derives plausible future scenarios from past series of recorded market rates and prices, taking into account inter-relationships between different markets and rates such as interest rates and foreign exchange rates.
The historical simulation models used incorporate the following features:
– historical market rates and prices are calculated with reference to foreign exchange rates, interest rates, equity prices and the associated volatilities;
– potential market movements utilised for VaR are calculated with reference to data from the past two years; and
– VaR measures are calculated to a 99 per cent confidence level and use a one-day holding period.
The nature of VaR models means that an increase in observed market volatility will lead to an increase in VaR without any changes in the underlying positions. The local group routinely validates the accuracy of the VaR models by back-testing the hypothetical daily results. Although a valuable guide to risk, VaR should always be viewed in the context of its limitations. For example:
– the use of historical data as a proxy for estimating future events may not encompass all potential events, particularly those which are extreme in nature;
– the use of a holding period assumes that all positions can be liquidated or the risks offset during that period. This may not fully reflect the market risk arising at times of severe illiquidity, when the holding period may be insufficient to liquidate or hedge all positions fully;
113
4 Financial risk management (continued)
e Market risk (continued)
ii Value at risk (VaR) (continued)
– the use of a 99 per cent confidence level, by definition does not take into account losses that might occur beyond this level of confidence;
– VaR is calculated on the basis of exposures outstanding at the close of business and therefore does not necessarily reflect intra-day exposures; and
– VaR is unlikely to reflect loss potential on exposures that only arise under significant market movements.
The local group recognises these limitations and thus resorts to the use of other tools.
The VaR for the bank was as follows:
2017 2016
€000 €000
At 31 December 479 657Average 667 732Minimum 479 657Maximum 759 798
iii Stress testing
Stress testing is an important tool that is integrated into the local group’s market risk management to evaluate the potential impact on portfolio values of more extreme, although plausible, events or movements in a set of financial variables. In such abnormal scenarios, losses can be much greater than those predicted by VaR modelling. A standard set of scenarios is utilised consistently across the Group, which are however tailored in order to capture the relevant events or market movements happening locally. The risk appetite around potential stress losses is set and monitored against referral limits.
iv Interest rate risk
Interest rate risk in the bank’s portfolios arises principally from mismatches between the future yield on assets and their funding cost, as a result of interest rate changes. Analysis of this risk is complicated by having to make assumptions on embedded optionality within certain product areas such as the incidence of mortgage prepayments, and from behavioural assumptions regarding the economic duration of liabilities which are contractually repayable on demand such as current accounts.
Interest rate risk is assessed and managed according to ‘business as usual’ conditions. The bank’s aim in this respect is to mitigate the effect of prospective interest rate movements which could reduce future net interest income. The bank’s ALCO is responsible for oversight over the bank’s interest rate risk management process and monitors actively the interest rate risk measures utilised.
Sensitivity of net interest income
A principal element of the local group’s management of interest rate risk is monitoring the sensitivity of projected net interest income under varying interest rate scenarios (simulation modelling). The local group applies a combination of scenarios and assumptions which are required throughout the HSBC Group.
Projected net interest income sensitivity figures represent the effect of the pro forma movements in net interest income based on the projected yield curve scenarios and the current interest rate risk profile. This effect, however, does not incorporate actions which would probably be taken by the local group to mitigate the effect of interest rate risk. In reality, the local group seeks actively to change the interest rate risk profile to minimise losses and optimise net revenues.
The net interest income sensitivity calculations shown in the table below, assume that interest rates of all maturities move by the same amount in the ‘up-shock’ scenario and ‘down-shock’ scenario subject to an established response strategy set by the bank. The net interest income sensitivity calculations take account of the effect on net interest income of anticipated differences in changes between interbank interest rates and interest rates over which the bank has discretion in terms of the timing and extent of rate changes.
The table below sets out the impact on future one year net income of an incremental 100 basis points parallel fall or rise in the yield curves, based on current financial position/risk profiles and current managed interest rate policy.
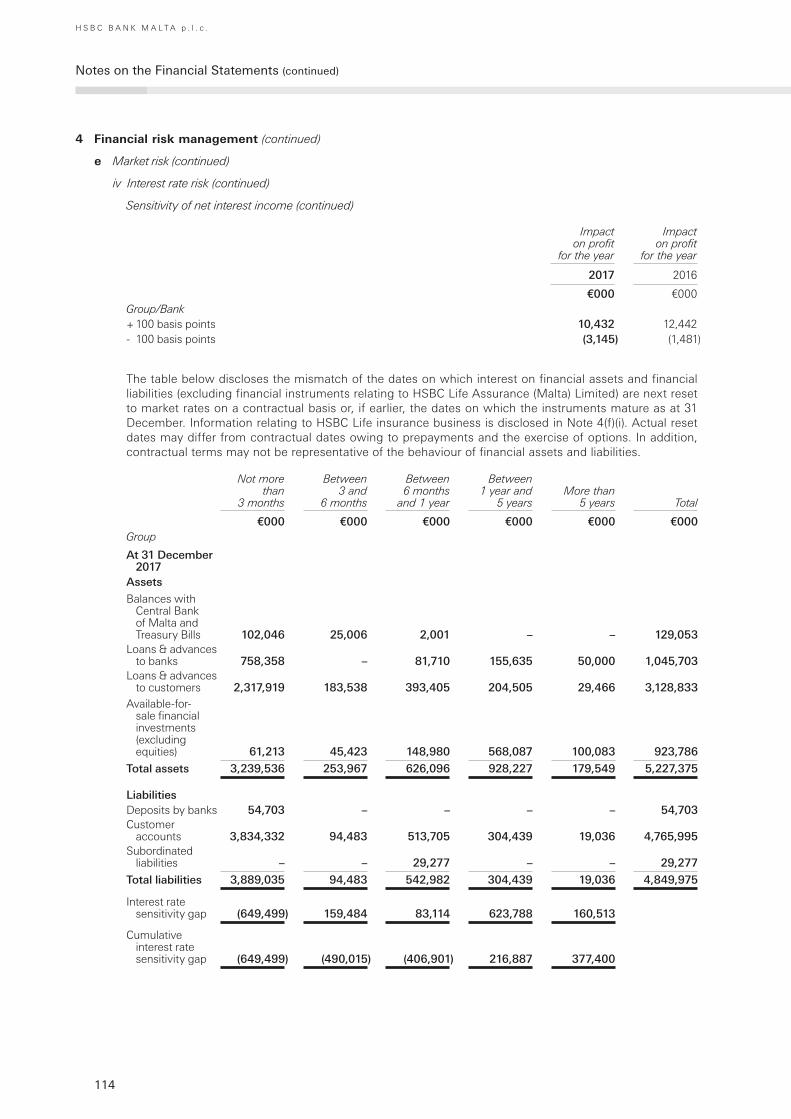
114
Notes on the Financial Statements (continued)
H S B C B A N K M A L T A p . l . c .
4 Financial risk management (continued)
e Market risk (continued)
iv Interest rate risk (continued)
Sensitivity of net interest income (continued)
Impact on profit
for the year
Impact on profit
for the year
2017 2016
€000 €000Group/Bank+ 100 basis points 10,432 12,442- 100 basis points (3,145) (1,481)
The table below discloses the mismatch of the dates on which interest on financial assets and financial liabilities (excluding financial instruments relating to HSBC Life Assurance (Malta) Limited) are next reset to market rates on a contractual basis or, if earlier, the dates on which the instruments mature as at 31 December. Information relating to HSBC Life insurance business is disclosed in Note 4(f)(i). Actual reset dates may differ from contractual dates owing to prepayments and the exercise of options. In addition, contractual terms may not be representative of the behaviour of financial assets and liabilities.
Not more than
3 months
Between 3 and
6 months
Between 6 months
and 1 year
Between 1 year and
5 yearsMore than
5 years Total
€000 €000 €000 €000 €000 €000Group
At 31 December 2017
Assets
Balances with Central Bank of Malta and Treasury Bills 102,046 25,006 2,001 – – 129,053
Loans & advances to banks 758,358 – 81,710 155,635 50,000 1,045,703
Loans & advances to customers 2,317,919 183,538 393,405 204,505 29,466 3,128,833
Available-for-sale financial investments (excluding equities) 61,213 45,423 148,980 568,087 100,083 923,786
Total assets 3,239,536 253,967 626,096 928,227 179,549 5,227,375
LiabilitiesDeposits by banks 54,703 – – – – 54,703 Customer
accounts 3,834,332 94,483 513,705 304,439 19,036 4,765,995 Subordinated
liabilities – – 29,277 – – 29,277
Total liabilities 3,889,035 94,483 542,982 304,439 19,036 4,849,975
Interest rate sensitivity gap (649,499) 159,484 83,114 623,788 160,513
Cumulative interest rate sensitivity gap (649,499) (490,015) (406,901) 216,887 377,400
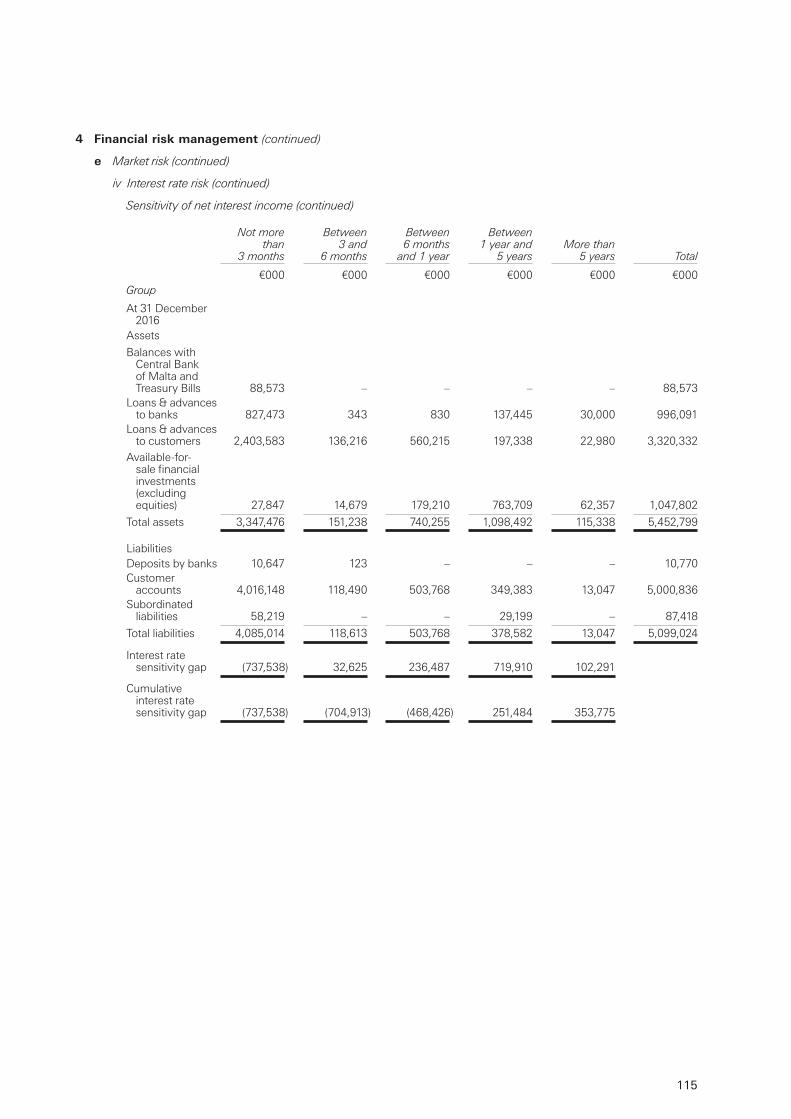
115
4 Financial risk management (continued)
e Market risk (continued)
iv Interest rate risk (continued)
Sensitivity of net interest income (continued)
Not more than
3 months
Between 3 and
6 months
Between 6 months
and 1 year
Between 1 year and
5 yearsMore than
5 years Total
€000 €000 €000 €000 €000 €000Group
At 31 December 2016
Assets
Balances with Central Bank of Malta and Treasury Bills 88,573 – – – – 88,573
Loans & advances to banks 827,473 343 830 137,445 30,000 996,091
Loans & advances to customers 2,403,583 136,216 560,215 197,338 22,980 3,320,332
Available-for-sale financial investments (excluding equities) 27,847 14,679 179,210 763,709 62,357 1,047,802
Total assets 3,347,476 151,238 740,255 1,098,492 115,338 5,452,799
LiabilitiesDeposits by banks 10,647 123 – – – 10,770 Customer
accounts 4,016,148 118,490 503,768 349,383 13,047 5,000,836 Subordinated
liabilities 58,219 – – 29,199 – 87,418
Total liabilities 4,085,014 118,613 503,768 378,582 13,047 5,099,024
Interest rate sensitivity gap (737,538) 32,625 236,487 719,910 102,291
Cumulative interest rate sensitivity gap (737,538) (704,913) (468,426) 251,484 353,775
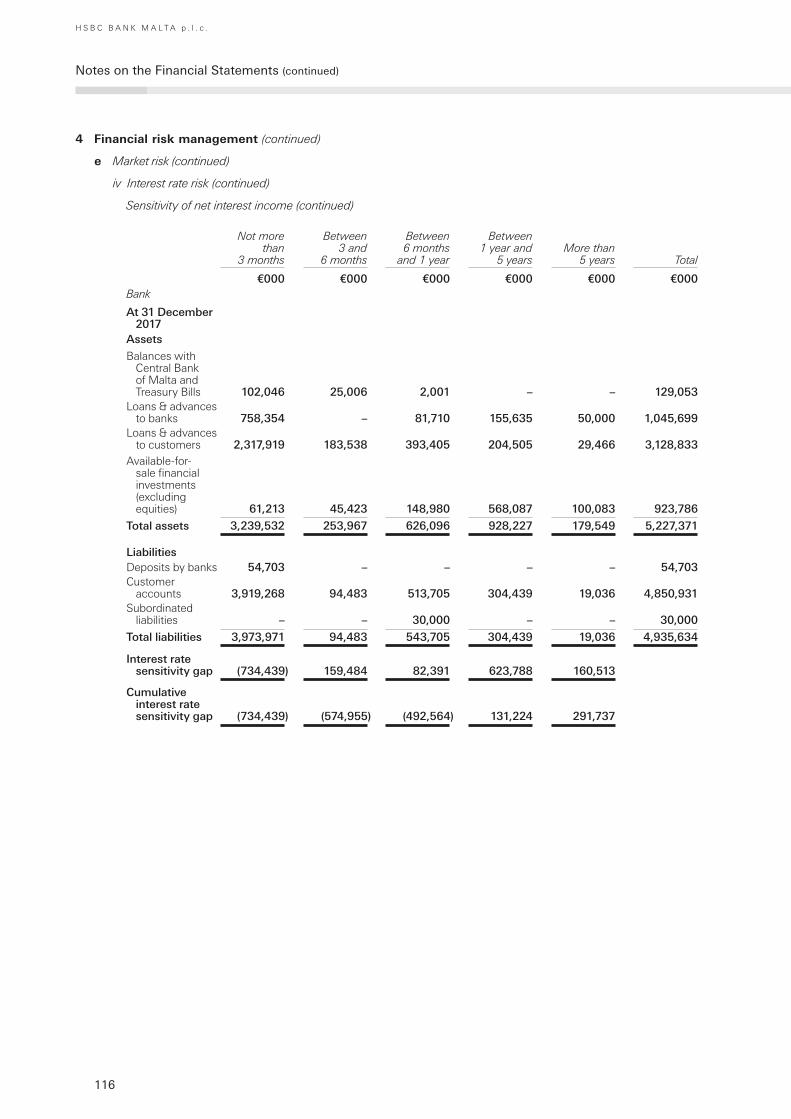
116
Notes on the Financial Statements (continued)
H S B C B A N K M A L T A p . l . c .
4 Financial risk management (continued)
e Market risk (continued)
iv Interest rate risk (continued)
Sensitivity of net interest income (continued)
Not more than
3 months
Between 3 and
6 months
Between 6 months
and 1 year
Between 1 year and
5 yearsMore than
5 years Total
€000 €000 €000 €000 €000 €000Bank
At 31 December 2017
Assets
Balances with Central Bank of Malta and Treasury Bills 102,046 25,006 2,001 – – 129,053
Loans & advances to banks 758,354 – 81,710 155,635 50,000 1,045,699
Loans & advances to customers 2,317,919 183,538 393,405 204,505 29,466 3,128,833
Available-for-sale financial investments (excluding equities) 61,213 45,423 148,980 568,087 100,083 923,786
Total assets 3,239,532 253,967 626,096 928,227 179,549 5,227,371
LiabilitiesDeposits by banks 54,703 – – – – 54,703 Customer
accounts 3,919,268 94,483 513,705 304,439 19,036 4,850,931 Subordinated
liabilities – – 30,000 – – 30,000
Total liabilities 3,973,971 94,483 543,705 304,439 19,036 4,935,634
Interest rate sensitivity gap (734,439) 159,484 82,391 623,788 160,513
Cumulative interest rate sensitivity gap (734,439) (574,955) (492,564) 131,224 291,737
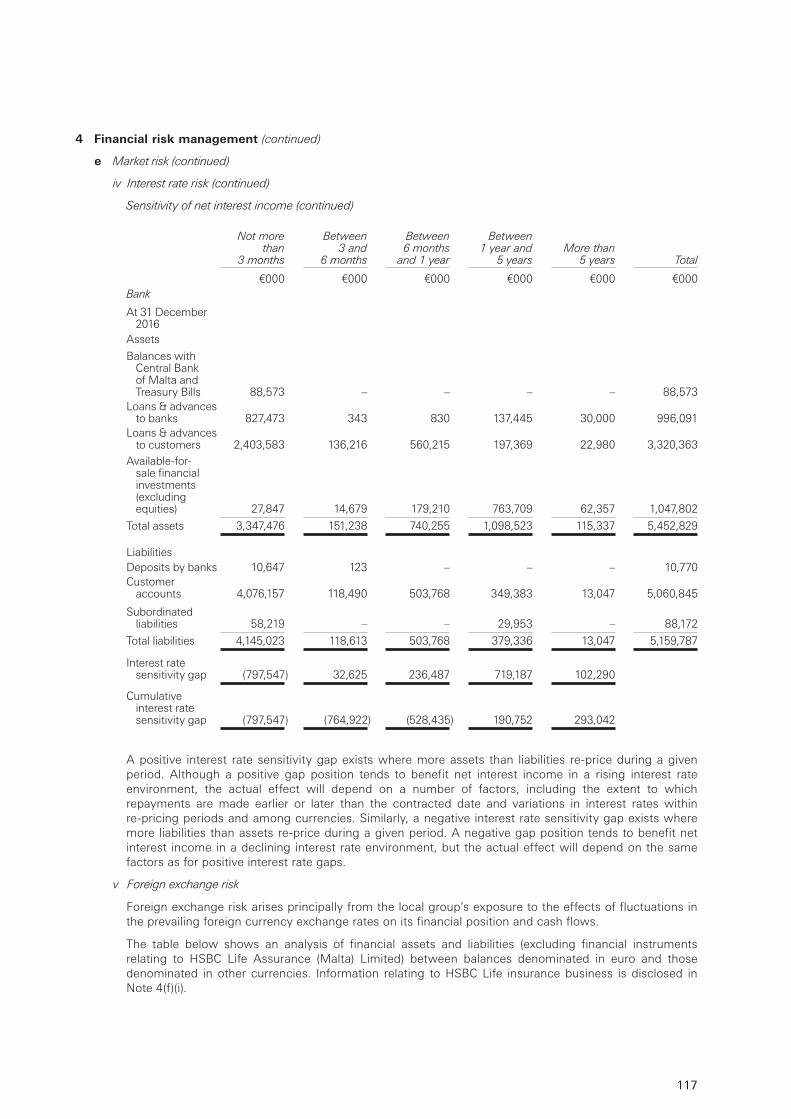
117
4 Financial risk management (continued)
e Market risk (continued)
iv Interest rate risk (continued)
Sensitivity of net interest income (continued)
Not more than
3 months
Between 3 and
6 months
Between 6 months
and 1 year
Between 1 year and
5 yearsMore than
5 years Total
€000 €000 €000 €000 €000 €000Bank
At 31 December 2016
Assets
Balances with Central Bank of Malta and Treasury Bills 88,573 – – – – 88,573
Loans & advances to banks 827,473 343 830 137,445 30,000 996,091
Loans & advances to customers 2,403,583 136,216 560,215 197,369 22,980 3,320,363
Available-for-sale financial investments (excluding equities) 27,847 14,679 179,210 763,709 62,357 1,047,802
Total assets 3,347,476 151,238 740,255 1,098,523 115,337 5,452,829
LiabilitiesDeposits by banks 10,647 123 – – – 10,770 Customer
accounts 4,076,157 118,490 503,768 349,383 13,047 5,060,845
Subordinated liabilities 58,219 – – 29,953 – 88,172
Total liabilities 4,145,023 118,613 503,768 379,336 13,047 5,159,787
Interest rate sensitivity gap (797,547) 32,625 236,487 719,187 102,290
Cumulative interest rate sensitivity gap (797,547) (764,922) (528,435) 190,752 293,042
A positive interest rate sensitivity gap exists where more assets than liabilities re-price during a given period. Although a positive gap position tends to benefit net interest income in a rising interest rate environment, the actual effect will depend on a number of factors, including the extent to which repayments are made earlier or later than the contracted date and variations in interest rates within re-pricing periods and among currencies. Similarly, a negative interest rate sensitivity gap exists where more liabilities than assets re-price during a given period. A negative gap position tends to benefit net interest income in a declining interest rate environment, but the actual effect will depend on the same factors as for positive interest rate gaps.
v Foreign exchange risk
Foreign exchange risk arises principally from the local group’s exposure to the effects of fluctuations in the prevailing foreign currency exchange rates on its financial position and cash flows.
The table below shows an analysis of financial assets and liabilities (excluding financial instruments relating to HSBC Life Assurance (Malta) Limited) between balances denominated in euro and those denominated in other currencies. Information relating to HSBC Life insurance business is disclosed in Note 4(f)(i).
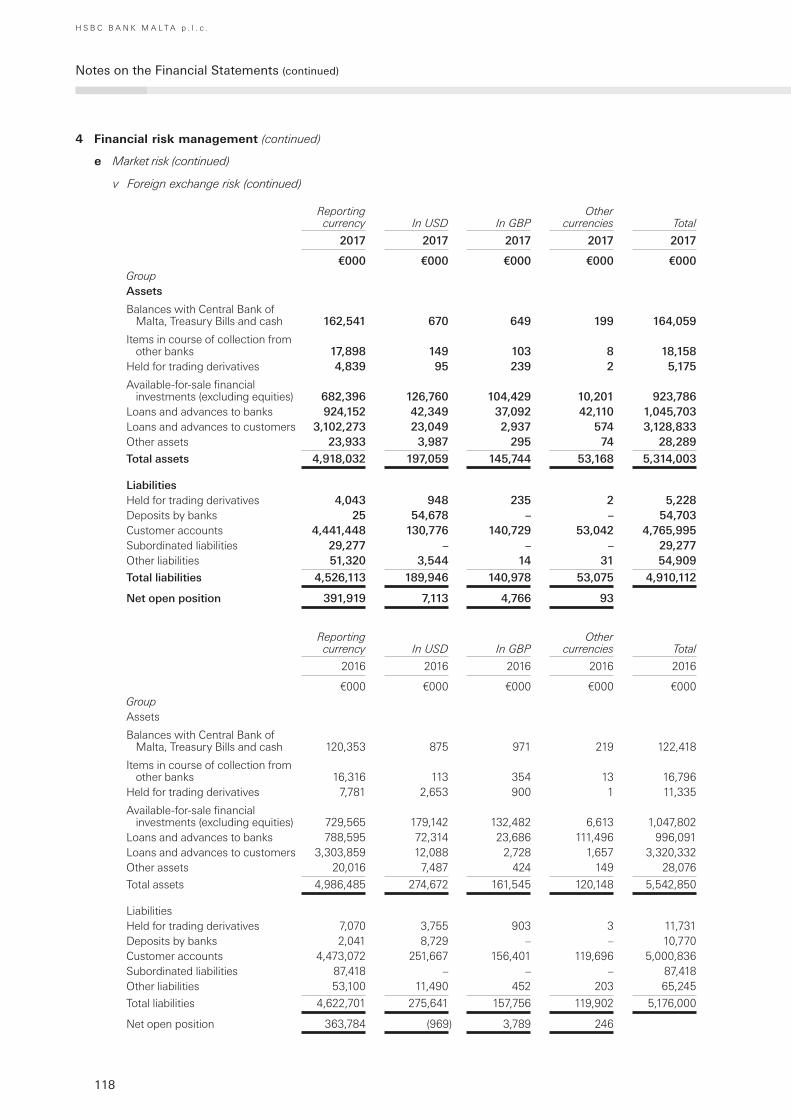
118
Notes on the Financial Statements (continued)
H S B C B A N K M A L T A p . l . c .
4 Financial risk management (continued)
e Market risk (continued)
v Foreign exchange risk (continued)
Reporting currency In USD In GBP
Other currencies Total
2017 2017 2017 2017 2017
€000 €000 €000 €000 €000GroupAssets
Balances with Central Bank of Malta, Treasury Bills and cash 162,541 670 649 199 164,059
Items in course of collection from other banks 17,898 149 103 8 18,158
Held for trading derivatives 4,839 95 239 2 5,175
Available-for-sale financial investments (excluding equities) 682,396 126,760 104,429 10,201 923,786
Loans and advances to banks 924,152 42,349 37,092 42,110 1,045,703 Loans and advances to customers 3,102,273 23,049 2,937 574 3,128,833 Other assets 23,933 3,987 295 74 28,289
Total assets 4,918,032 197,059 145,744 53,168 5,314,003
LiabilitiesHeld for trading derivatives 4,043 948 235 2 5,228 Deposits by banks 25 54,678 – – 54,703 Customer accounts 4,441,448 130,776 140,729 53,042 4,765,995 Subordinated liabilities 29,277 – – – 29,277 Other liabilities 51,320 3,544 14 31 54,909
Total liabilities 4,526,113 189,946 140,978 53,075 4,910,112
Net open position 391,919 7,113 4,766 93
Reporting currency In USD In GBP
Other currencies Total
2016 2016 2016 2016 2016
€000 €000 €000 €000 €000GroupAssets
Balances with Central Bank of Malta, Treasury Bills and cash 120,353 875 971 219 122,418
Items in course of collection from other banks 16,316 113 354 13 16,796
Held for trading derivatives 7,781 2,653 900 1 11,335
Available-for-sale financial investments (excluding equities) 729,565 179,142 132,482 6,613 1,047,802
Loans and advances to banks 788,595 72,314 23,686 111,496 996,091Loans and advances to customers 3,303,859 12,088 2,728 1,657 3,320,332 Other assets 20,016 7,487 424 149 28,076
Total assets 4,986,485 274,672 161,545 120,148 5,542,850
LiabilitiesHeld for trading derivatives 7,070 3,755 903 3 11,731Deposits by banks 2,041 8,729 – – 10,770 Customer accounts 4,473,072 251,667 156,401 119,696 5,000,836 Subordinated liabilities 87,418 – – – 87,418 Other liabilities 53,100 11,490 452 203 65,245
Total liabilities 4,622,701 275,641 157,756 119,902 5,176,000
Net open position 363,784 (969) 3,789 246

119
4 Financial risk management (continued)
e Market risk (continued)
v Foreign exchange risk (continued)
Reporting currency In USD In GBP
Other currencies Total
2017 2017 2017 2017 2017
€000 €000 €000 €000 €000BankAssets
Balances with Central Bank of Malta, Treasury Bills and cash 162,541 670 649 199 164,059
Items in course of collection from other banks 17,898 149 103 8 18,158
Held for trading derivatives 4,839 95 239 2 5,175
Available-for-sale financial investments (excluding equities) 682,396 126,760 104,429 10,201 923,786
Loans and advances to banks 924,148 42,349 37,092 42,110 1,045,699 Loans and advances to customers 3,102,273 23,049 2,937 574 3,128,833 Other assets 23,715 3,987 295 74 28,071
Total assets 4,917,810 197,059 145,744 53,168 5,313,781
LiabilitiesHeld for trading derivatives 4,043 948 235 2 5,228 Deposits by banks 25 54,678 – – 54,703 Customer accounts 4,517,256 135,953 144,666 53,056 4,850,931 Subordinated liabilities 30,000 – – – 30,000 Other liabilities 50,897 3,544 14 31 54,486
Total liabilities 4,602,221 195,123 144,915 53,089 4,995,348
Net open position 315,589 1,936 829 79
Reporting currency In USD In GBP
Other currencies Total
2016 2016 2016 2016 2016
€000 €000 €000 €000 €000BankAssets
Balances with Central Bank of Malta, Treasury Bills and cash 120,353 875 971 219 122,418
Items in course of collection from other banks 16,316 113 354 13 16,796
Held for trading derivatives 7,781 2,653 900 1 11,335
Available-for-sale financial investments (excluding equities) 729,565 179,142 132,482 6,613 1,047,802
Loans and advances to banks 788,595 72,314 23,686 111,496 996,091 Loans and advances to customers 3,303,890 12,088 2,728 1,657 3,320,363 Other assets 20,016 7,487 424 149 28,076
Total assets 4,986,516 274,672 161,545 120,148 5,542,881
LiabilitiesHeld for trading derivatives 7,070 3,755 903 3 11,731 Deposits by banks 2,041 8,729 – – 10,770 Customer accounts 4,521,134 259,502 160,496 119,713 5,060,845 Subordinated liabilities 88,172 – – – 88,172 Other liabilities 52,075 11,490 452 203 64,850
Total liabilities 4,671,122 283,476 161,851 119,919 5,236,368
Net open position 315,394 (8,804) (306) 229
120
Notes on the Financial Statements (continued)
H S B C B A N K M A L T A p . l . c .
4 Financial risk management (continued)
e Market risk (continued)
v Foreign exchange risk (continued)
The bank essentially manages this risk by matching asset and liability positions in each respective foreign currency, as much as is practicable. The bank maintains exposures to foreign currencies within prescribed limits. The bank’s ALCO is responsible for overnight over the foreign currency risk management process, whereby overnight and intra-day net positions are monitored.
f Insurance risk
The local group operates an integrated bancassurance model which provides wealth and protection insurance products principally for customers with whom the local group has a banking relationship. Insurance products are sold through all global businesses, predominantly by RBWM and CMB. The subsidiary also holds a portfolio of unit-linked investment products and non-linked insurance products that were transferred from HSBC Life (Europe) Limited during 2014.
The majority of the risk in the local group’s insurance business derives from manufacturing activities and can be categorised as insurance risk and financial risk. Insurance risk is the risk, other than financial risk, of loss transferred from the holder of the insurance contract to the issuer, the local group’s insurance subsidiary company.
The risk under any insurance contract is the possibility that the insured event occurs and the uncertainty of the amount of the resulting claim. By the very nature of an insurance contract, this risk is random and therefore unpredictable.
For a portfolio of insurance contracts where the theory of probability is applied to pricing and provisioning, the principal risk that the local group faces under its insurance contracts is that the actual claims and benefit payments exceed the carrying amount of the insurance liabilities. This could occur because the frequency or severity of claims and benefits are greater than estimated. Insurance events are random and the actual number and amount of claims and benefits will vary from year to year and from the estimate established using statistical techniques.
Experience shows that the larger the portfolio of similar insurance contracts, the smaller the relative variability about the expected outcome will be. The local group uses reinsurance appropriately to reduce variability of the expected outcome. Factors that aggravate insurance risk include lack of risk diversification in terms of type and amount of risk and geographical location. For contracts with Discretionary Participation Feature (DPF), the participating nature of these contracts results in a significant portion of the insurance risk being shared with the insured party.
Frequency and severity of claims
For contracts where death is the insured risk, the most significant factors that could increase the overall frequency of claims are epidemics or wide spread changes in lifestyle resulting in earlier or more claims than expected.
At present these risks do not vary significantly in relation to the location of the risk insured by the local group. However, undue concentration by amounts could have an impact on the severity of benefit payments on a portfolio basis.
For contracts with fixed and guaranteed benefits and fixed future premiums, there are no mitigating terms and conditions that reduce the insurance risk accepted. For contracts with DPF, the participating nature of the contracts results in a portion of the insurance risk being reduced over the term of the policy. Investment contracts with DPF carry negligible insurance risk.
The local group manages its insurance risk through strict underwriting limits and claims management; approval procedures for new products and pricing reviews; close monitoring of reinsurance arrangements and monitoring of emerging issues.
The local group’s underwriting strategy is intended to ensure that the risks underwritten are well diversified in terms of type of risk and the level of insured benefits. For example, the local group balances death risk across its portfolio. Medical selection is also included in the local group’s underwriting procedures, with premium varied to reflect the health condition and family medical history of the applicants.
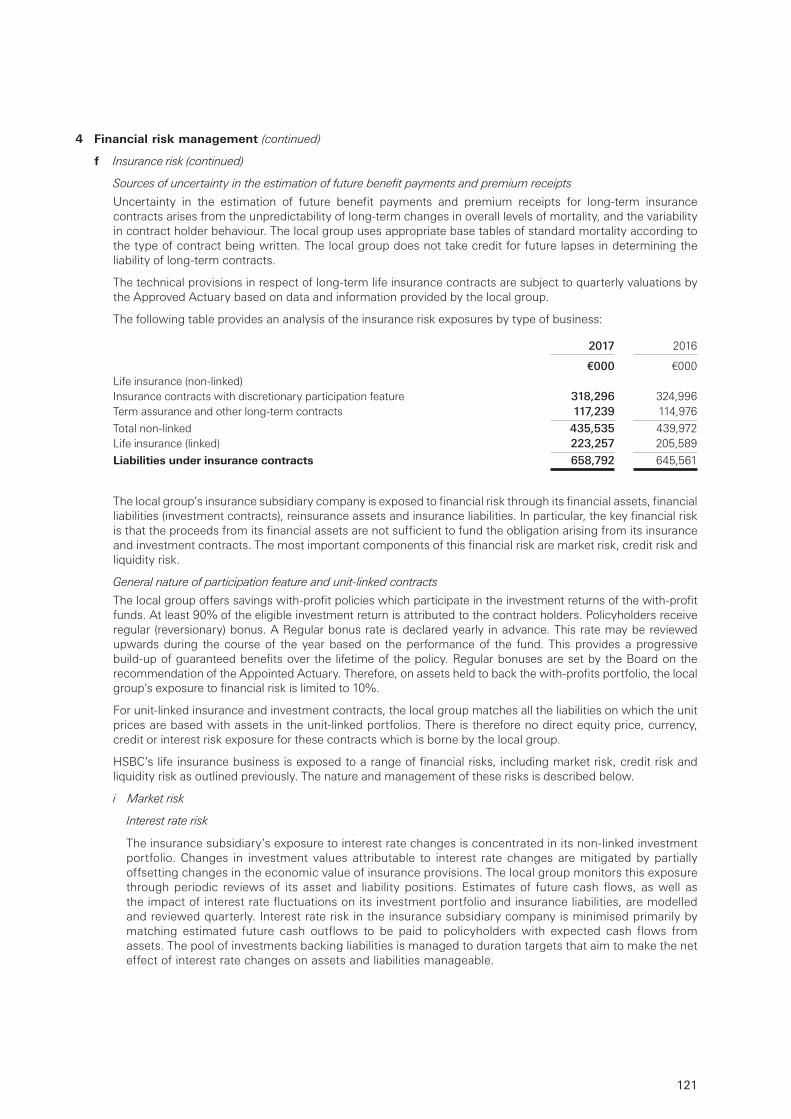
121
4 Financial risk management (continued)
f Insurance risk (continued)
Sources of uncertainty in the estimation of future benefit payments and premium receipts
Uncertainty in the estimation of future benefit payments and premium receipts for long-term insurance contracts arises from the unpredictability of long-term changes in overall levels of mortality, and the variability in contract holder behaviour. The local group uses appropriate base tables of standard mortality according to the type of contract being written. The local group does not take credit for future lapses in determining the liability of long-term contracts.
The technical provisions in respect of long-term life insurance contracts are subject to quarterly valuations by the Approved Actuary based on data and information provided by the local group.
The following table provides an analysis of the insurance risk exposures by type of business:
2017 2016
€000 €000Life insurance (non-linked)Insurance contracts with discretionary participation feature 318,296 324,996Term assurance and other long-term contracts 117,239 114,976
Total non-linked 435,535 439,972Life insurance (linked) 223,257 205,589
Liabilities under insurance contracts 658,792 645,561
The local group’s insurance subsidiary company is exposed to financial risk through its financial assets, financial liabilities (investment contracts), reinsurance assets and insurance liabilities. In particular, the key financial risk is that the proceeds from its financial assets are not sufficient to fund the obligation arising from its insurance and investment contracts. The most important components of this financial risk are market risk, credit risk and liquidity risk.
General nature of participation feature and unit-linked contracts
The local group offers savings with-profit policies which participate in the investment returns of the with-profit funds. At least 90% of the eligible investment return is attributed to the contract holders. Policyholders receive regular (reversionary) bonus. A Regular bonus rate is declared yearly in advance. This rate may be reviewed upwards during the course of the year based on the performance of the fund. This provides a progressive build-up of guaranteed benefits over the lifetime of the policy. Regular bonuses are set by the Board on the recommendation of the Appointed Actuary. Therefore, on assets held to back the with-profits portfolio, the local group’s exposure to financial risk is limited to 10%.
For unit-linked insurance and investment contracts, the local group matches all the liabilities on which the unit prices are based with assets in the unit-linked portfolios. There is therefore no direct equity price, currency, credit or interest risk exposure for these contracts which is borne by the local group.
HSBC’s life insurance business is exposed to a range of financial risks, including market risk, credit risk and liquidity risk as outlined previously. The nature and management of these risks is described below.
i Market risk
Interest rate risk
The insurance subsidiary’s exposure to interest rate changes is concentrated in its non-linked investment portfolio. Changes in investment values attributable to interest rate changes are mitigated by partially offsetting changes in the economic value of insurance provisions. The local group monitors this exposure through periodic reviews of its asset and liability positions. Estimates of future cash flows, as well as the impact of interest rate fluctuations on its investment portfolio and insurance liabilities, are modelled and reviewed quarterly. Interest rate risk in the insurance subsidiary company is minimised primarily by matching estimated future cash outflows to be paid to policyholders with expected cash flows from assets. The pool of investments backing liabilities is managed to duration targets that aim to make the net effect of interest rate changes on assets and liabilities manageable.

122
Notes on the Financial Statements (continued)
H S B C B A N K M A L T A p . l . c .
4 Financial risk management (continued)
f Insurance risk (continued)
i Market risk (continued)
Exchange risk
The insurance subsidiary company is exposed to currency risk on its investment portfolio and to 10% of the investments backing contracts with DPF. The net exposure amounts to €4,761,000 and a sensitivity analysis is not deemed necessary on the basis of insignificance.
Equity price risk
The insurance subsidiary company manages the equity risk arising from its holdings of equity securities by setting limits on the maximum market value of equities that it may hold. Equity risk is also monitored by estimating the effect of predetermined movements in equity prices on the profit and total net assets of the insurance underwriting business.
Sensitivity analysis
The local group performs various sensitivity analysis as summarised below. An immediate and permanent movement in interest yield curves or equity prices as at the reporting date would have the following impact on the profit for the year and net assets at that date:
Impact on profits and net assets for the year
2017 2016
€000 €000+100 basis points shift in yield curves 195 (248)-100 basis points shift in yield curves (1,030) (79)+10 per cent increase in equity prices 902 756-10 per cent decrease in equity prices (1,081) (782)
The impact of the above sensitivity analysis on other comprehensive income is negligible in light of the level of available-for-sale investments held by the insurance subsidiary company.
ii Credit risk
The main areas where the insurance subsidiary company is exposed to credit risk are:
– reinsurers’ share of insurance liabilities;
– amounts due from reinsurers in respect of claims already paid;
– investment portfolios of debt securities;
– insurance and other receivables; and
– call and term deposits.
The insurance subsidiary company structures the levels of credit risk it accepts by placing limits on its exposure to investment grade single counterparty, or groups of counterparties, and to geographical and industry segments. Investment credit exposures positions are reviewed on a quarterly basis by the insurance subsidiary company’s Asset Liability Committee.
The selection of reinsurers also includes restrictions designed to minimise the risk of credit exposure.
The insurance subsidiary company currently manages the majority of reinsurance risk by using reinsurers with a minimum rating of AA-. The creditworthiness of reinsurers is confirmed from public rating information and considered on an annual basis by reviewing their financial strength prior to finalisation of any contract.
The third party banks with whom cash and cash equivalents are held are rated A– and above.
Investments in bonds are made within the credit limits permitted within the investment credit risk mandate conferred by HSBC Group.
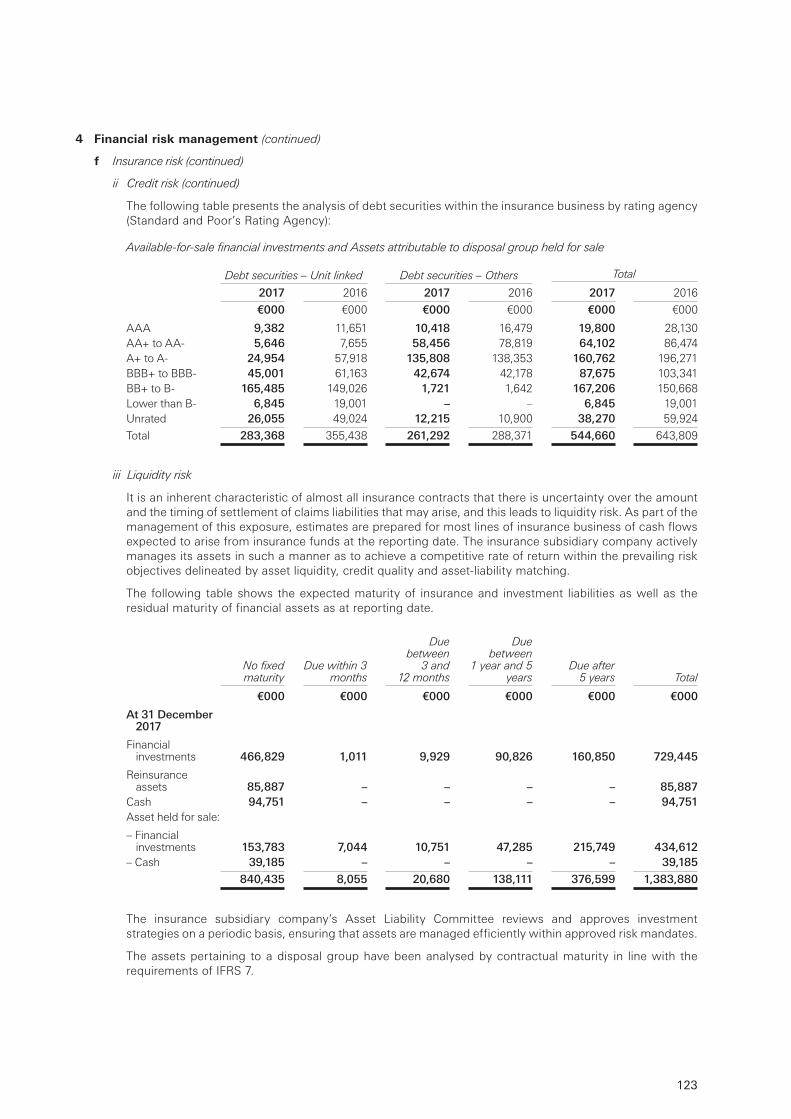
123
4 Financial risk management (continued)
f Insurance risk (continued)
ii Credit risk (continued)
The following table presents the analysis of debt securities within the insurance business by rating agency (Standard and Poor’s Rating Agency):
Available-for-sale financial investments and Assets attributable to disposal group held for sale
Debt securities – Unit linked Debt securities – Others Total
2017 2016 2017 2016 2017 2016
€000 €000 €000 €000 €000 €000
AAA 9,382 11,651 10,418 16,479 19,800 28,130AA+ to AA- 5,646 7,655 58,456 78,819 64,102 86,474A+ to A- 24,954 57,918 135,808 138,353 160,762 196,271BBB+ to BBB- 45,001 61,163 42,674 42,178 87,675 103,341BB+ to B- 165,485 149,026 1,721 1,642 167,206 150,668Lower than B- 6,845 19,001 – – 6,845 19,001Unrated 26,055 49,024 12,215 10,900 38,270 59,924
Total 283,368 355,438 261,292 288,371 544,660 643,809
iii Liquidity risk
It is an inherent characteristic of almost all insurance contracts that there is uncertainty over the amount and the timing of settlement of claims liabilities that may arise, and this leads to liquidity risk. As part of the management of this exposure, estimates are prepared for most lines of insurance business of cash flows expected to arise from insurance funds at the reporting date. The insurance subsidiary company actively manages its assets in such a manner as to achieve a competitive rate of return within the prevailing risk objectives delineated by asset liquidity, credit quality and asset-liability matching.
The following table shows the expected maturity of insurance and investment liabilities as well as the residual maturity of financial assets as at reporting date.
No fixed maturity
Due within 3 months
Due between
3 and 12 months
Due between
1 year and 5 years
Due after 5 years Total
€000 €000 €000 €000 €000 €000
At 31 December 2017
Financial investments 466,829 1,011 9,929 90,826 160,850 729,445
Reinsurance assets 85,887 – – – – 85,887
Cash 94,751 – – – – 94,751 Asset held for sale:
– Financial investments 153,783 7,044 10,751 47,285 215,749 434,612
– Cash 39,185 – – – – 39,185
840,435 8,055 20,680 138,111 376,599 1,383,880
The insurance subsidiary company’s Asset Liability Committee reviews and approves investment strategies on a periodic basis, ensuring that assets are managed efficiently within approved risk mandates.
The assets pertaining to a disposal group have been analysed by contractual maturity in line with the requirements of IFRS 7.
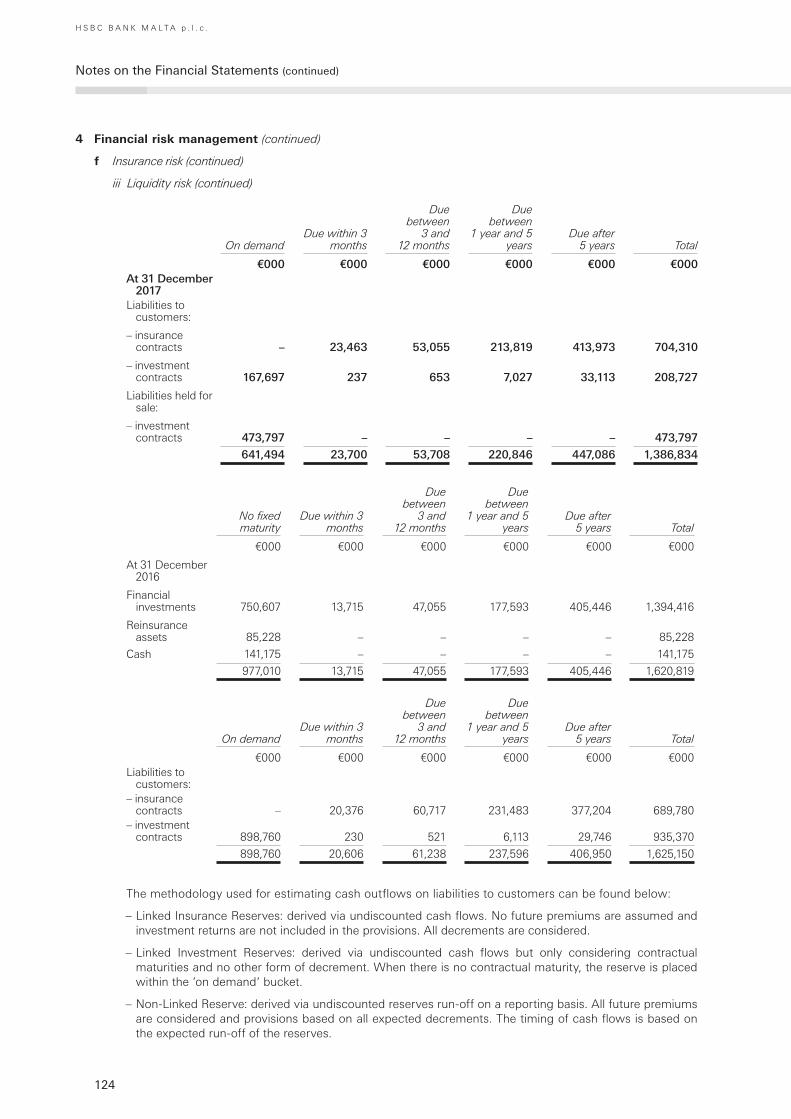
124
Notes on the Financial Statements (continued)
H S B C B A N K M A L T A p . l . c .
4 Financial risk management (continued)
f Insurance risk (continued)
iii Liquidity risk (continued)
On demandDue within 3
months
Due between
3 and 12 months
Due between
1 year and 5 years
Due after 5 years Total
€000 €000 €000 €000 €000 €000At 31 December
2017Liabilities to
customers:
– insurance contracts – 23,463 53,055 213,819 413,973 704,310
– investment contracts 167,697 237 653 7,027 33,113 208,727
Liabilities held for sale:
– investment contracts 473,797 – – – – 473,797
641,494 23,700 53,708 220,846 447,086 1,386,834
No fixed maturity
Due within 3 months
Due between
3 and 12 months
Due between
1 year and 5 years
Due after 5 years Total
€000 €000 €000 €000 €000 €000
At 31 December 2016
Financial investments 750,607 13,715 47,055 177,593 405,446 1,394,416
Reinsurance assets 85,228 – – – – 85,228
Cash 141,175 – – – – 141,175
977,010 13,715 47,055 177,593 405,446 1,620,819
On demandDue within 3
months
Due between
3 and 12 months
Due between
1 year and 5 years
Due after 5 years Total
€000 €000 €000 €000 €000 €000Liabilities to
customers:– insurance
contracts – 20,376 60,717 231,483 377,204 689,780 – investment
contracts 898,760 230 521 6,113 29,746 935,370
898,760 20,606 61,238 237,596 406,950 1,625,150
The methodology used for estimating cash outflows on liabilities to customers can be found below:
– Linked Insurance Reserves: derived via undiscounted cash flows. No future premiums are assumed and investment returns are not included in the provisions. All decrements are considered.
– Linked Investment Reserves: derived via undiscounted cash flows but only considering contractual maturities and no other form of decrement. When there is no contractual maturity, the reserve is placed within the ‘on demand‘ bucket.
– Non-Linked Reserve: derived via undiscounted reserves run-off on a reporting basis. All future premiums are considered and provisions based on all expected decrements. The timing of cash flows is based on the expected run-off of the reserves.
125
5 Fair value of financial and non-financial instruments
i Valuation of financial instruments
All financial instruments are recognised initially at fair value. Fair value is the price that would be received to sell an asset or paid to transfer a liability in an orderly transaction between market participants at the measurement date. The fair value of a financial instrument on initial recognition is generally its transaction price (that is, the fair value of the consideration given or received). However, sometimes the fair value will be based on other observable current market transactions in the same instrument, without modification or repackaging, or on a valuation technique whose variables include only data from observable markets, such as interest rate yield curves, option volatilities and currency rates. When such evidence exists, the local group recognises a trading gain or loss on day one, being the difference between the transaction price and the fair value. When significant unobservable parameters are used, the entire day one gain or loss is deferred and is recognised in the income statement over the life of the transaction until the transaction matures, is closed out, the valuation inputs become observable, or when the local group enters into an offsetting transaction.
The fair value of financial instruments is generally measured on an individual basis. However, in cases where HSBC manages a group of financial assets and liabilities according to its net market or credit risk exposure, the local group measures the fair value of the group of financial instruments on a net basis but presents the underlying financial assets and liabilities separately in the financial statements, unless they satisfy the IFRS offsetting criteria as described in Note 3(g).
ii Control framework
Fair values are subject to a control framework designed to ensure that they are either determined, or validated, by a function independent of the risk-taker.
For all financial instruments where fair values are determined by reference to externally quoted prices or observable pricing inputs to models, independent price determination or validation is utilised. In inactive markets, direct observation of a traded price may not be possible. In these circumstances, the local group will source alternative market information to validate the financial instrument’s fair value, with greater weight given to information that is considered to be more relevant and reliable. The factors that are considered in this regard are, inter alia:
– the extent to which prices may be expected to represent genuine traded or tradable prices;
– the degree of similarity between financial instruments;
– the degree of consistency between different sources;
– the process followed by the pricing provider to derive the data;
– the elapsed time between the date to which the market data relates and the reporting date; and
– the manner in which the data was sourced.
For fair values determined using a valuation model, the control framework may include, as applicable, development or validation by independent support functions of (i) the logic within valuation models; (ii) the inputs to those models; (iii) any adjustments required outside the valuation models; and, where possible, (iv) model outputs. Valuation models are subject to a process of due diligence and calibration before becoming operational and are calibrated against external market data on an ongoing basis.
iii Fair value hierarchy
Fair values are determined according to the following hierarchy:
a Level 1 – valuation technique using quoted market price: financial instruments with quoted prices for identical instruments in active markets.
b Level 2 – valuation technique using observable inputs: financial instruments with quoted prices for similar instruments in active markets or quoted prices for identical or similar instruments in inactive markets and financial instruments valued using models where all significant inputs are observable.
c Level 3 – valuation technique with significant unobservable inputs: financial instruments valued using models where one or more significant inputs are unobservable.

126
Notes on the Financial Statements (continued)
H S B C B A N K M A L T A p . l . c .
5 Fair value of financial and non-financial instruments (continued)
iv Critical accounting estimates and judgements
The best evidence of fair value is a quoted price in an actively traded market. The fair values of financial instruments that are quoted in active markets are based on bid prices for assets held and offer prices for liabilities issued. Where a financial instrument has a quoted price in an active market, the fair value of the total holding of the financial instrument is calculated as the product of the number of units and quoted price.
The judgement as to whether a market is active may include, but is not restricted to, the consideration of factors such as the magnitude and frequency of trading activity, the availability of prices and the size of bid/offer spreads. The bid/offer spread represents the difference in prices at which a market participant would be willing to buy compared with the price at which they would be willing to sell.
In the event that the market for a financial instrument is not active, a valuation technique is used. Valuation techniques may incorporate assumptions about factors that other market participants would use in their valuations, including:
– the likelihood and expected timing of future cash flows on the instrument. Judgement may be required to assess the counterparty’s ability to service the instrument in accordance with its contractual terms. Future cash flows may be sensitive to changes in market rates;
– selecting an appropriate discount rate for the instrument. Judgement is required to assess what a market participant would regard as the appropriate spread of the rate for an instrument over the appropriate risk-free rate;
– judgement to determine what model to use to calculate fair value in areas where the choice of valuation model is particularly subjective, for example, when valuing complex derivative products.
A range of valuation techniques is employed, dependent on the instrument type and available market data. Most valuation techniques are based upon discounted cash flow analyses, in which expected future cash flows are calculated and discounted to present value using a discounting curve. Prior to considering credit risk, the expected future cash flows may be known, as would be the case for the fixed leg of an interest rate swap, or may be uncertain and require projection, as would be the case for the floating leg of an interest rate swap. ‘Projection’ utilises market forward curves, if available. In option models, the probability of different potential future outcomes is considered. In addition, the value of some products are dependent on more than one market factor, and in these cases is typically necessary to consider how movements in one market factor may affect the other market factors.
The model inputs necessary to perform such calculations include interest rate yield curves, exchange rates, volatilities, correlations, prepayment and default rates.
The majority of valuation techniques employ only observable market data. However certain financial instruments are valued on the basis of valuation techniques that feature one or more significant market inputs that are unobservable, and for them the derivation of fair value is more judgemental. An instrument in its entirety is classified as valued using significant unobservable inputs if, in the opinion of management, a significant proportion of the instrument’s inception profit (‘day 1 gain or loss’) or greater than 5% of the instrument’s carrying value is driven by unobservable inputs. ‘Unobservable’ in this context means that there is little or no current market data available from which to determine the price at which an arm’s length transaction would be likely to occur. It generally does not mean that there is no data available at all upon which to base a determination of fair value (consensus pricing data may, for example, be used).
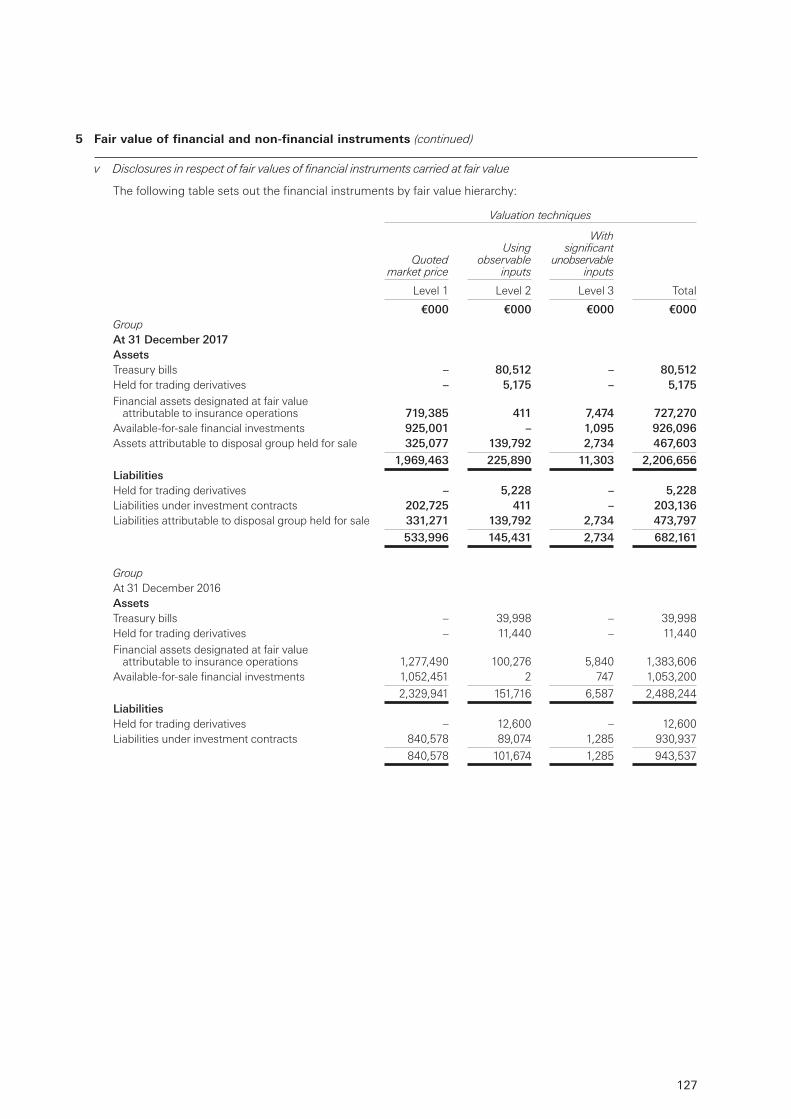
127
5 Fair value of financial and non-financial instruments (continued)
v Disclosures in respect of fair values of financial instruments carried at fair value
The following table sets out the financial instruments by fair value hierarchy:
Valuation techniques
Quoted market price
Using observable
inputs
With significant
unobservable inputs
Level 1 Level 2 Level 3 Total
€000 €000 €000 €000GroupAt 31 December 2017AssetsTreasury bills – 80,512 – 80,512 Held for trading derivatives – 5,175 – 5,175 Financial assets designated at fair value
attributable to insurance operations 719,385 411 7,474 727,270 Available-for-sale financial investments 925,001 – 1,095 926,096 Assets attributable to disposal group held for sale 325,077 139,792 2,734 467,603
1,969,463 225,890 11,303 2,206,656LiabilitiesHeld for trading derivatives – 5,228 – 5,228 Liabilities under investment contracts 202,725 411 – 203,136 Liabilities attributable to disposal group held for sale 331,271 139,792 2,734 473,797
533,996 145,431 2,734 682,161
GroupAt 31 December 2016AssetsTreasury bills – 39,998 – 39,998 Held for trading derivatives – 11,440 – 11,440 Financial assets designated at fair value
attributable to insurance operations 1,277,490 100,276 5,840 1,383,606 Available-for-sale financial investments 1,052,451 2 747 1,053,200
2,329,941 151,716 6,587 2,488,244 LiabilitiesHeld for trading derivatives – 12,600 – 12,600 Liabilities under investment contracts 840,578 89,074 1,285 930,937
840,578 101,674 1,285 943,537
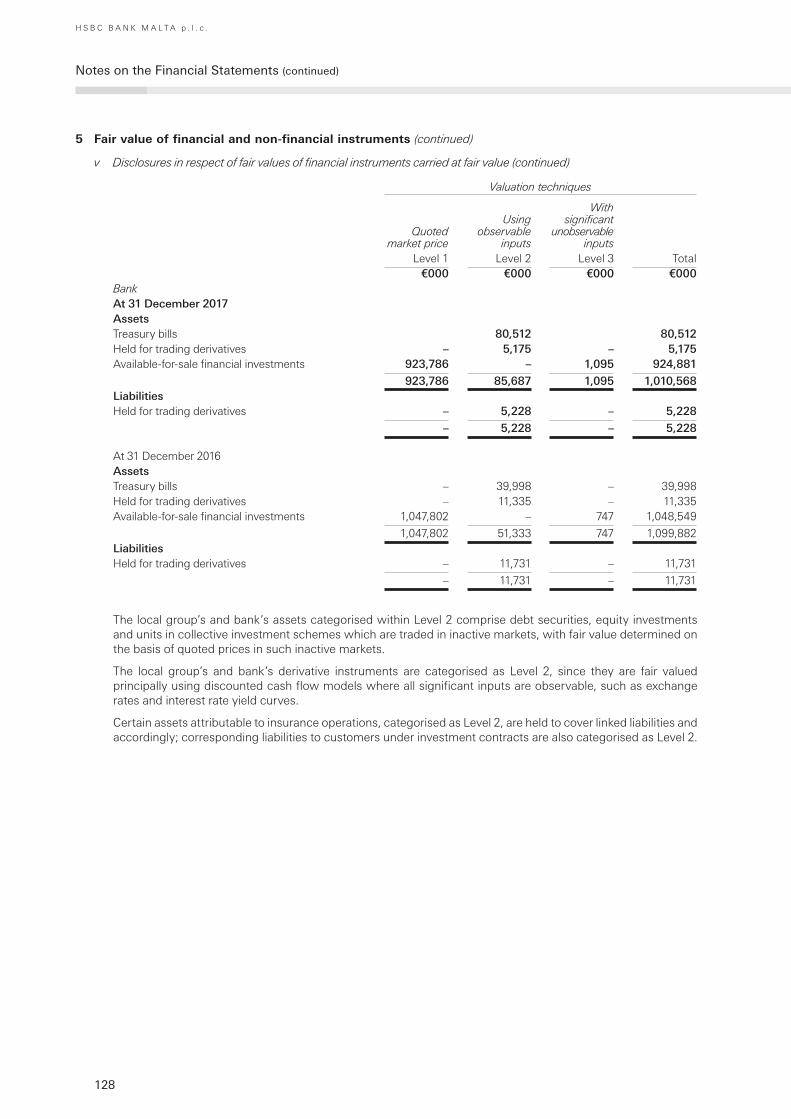
128
Notes on the Financial Statements (continued)
H S B C B A N K M A L T A p . l . c .
5 Fair value of financial and non-financial instruments (continued)
v Disclosures in respect of fair values of financial instruments carried at fair value (continued)
Valuation techniques
Quoted market price
Using observable
inputs
With significant
unobservable inputs
Level 1 Level 2 Level 3 Total€000 €000 €000 €000
BankAt 31 December 2017AssetsTreasury bills 80,512 80,512 Held for trading derivatives – 5,175 – 5,175 Available-for-sale financial investments 923,786 – 1,095 924,881
923,786 85,687 1,095 1,010,568 LiabilitiesHeld for trading derivatives – 5,228 – 5,228
– 5,228 – 5,228
At 31 December 2016AssetsTreasury bills – 39,998 – 39,998 Held for trading derivatives – 11,335 – 11,335 Available-for-sale financial investments 1,047,802 – 747 1,048,549
1,047,802 51,333 747 1,099,882 LiabilitiesHeld for trading derivatives – 11,731 – 11,731
– 11,731 – 11,731
The local group’s and bank’s assets categorised within Level 2 comprise debt securities, equity investments and units in collective investment schemes which are traded in inactive markets, with fair value determined on the basis of quoted prices in such inactive markets.
The local group’s and bank’s derivative instruments are categorised as Level 2, since they are fair valued principally using discounted cash flow models where all significant inputs are observable, such as exchange rates and interest rate yield curves.
Certain assets attributable to insurance operations, categorised as Level 2, are held to cover linked liabilities and accordingly; corresponding liabilities to customers under investment contracts are also categorised as Level 2.
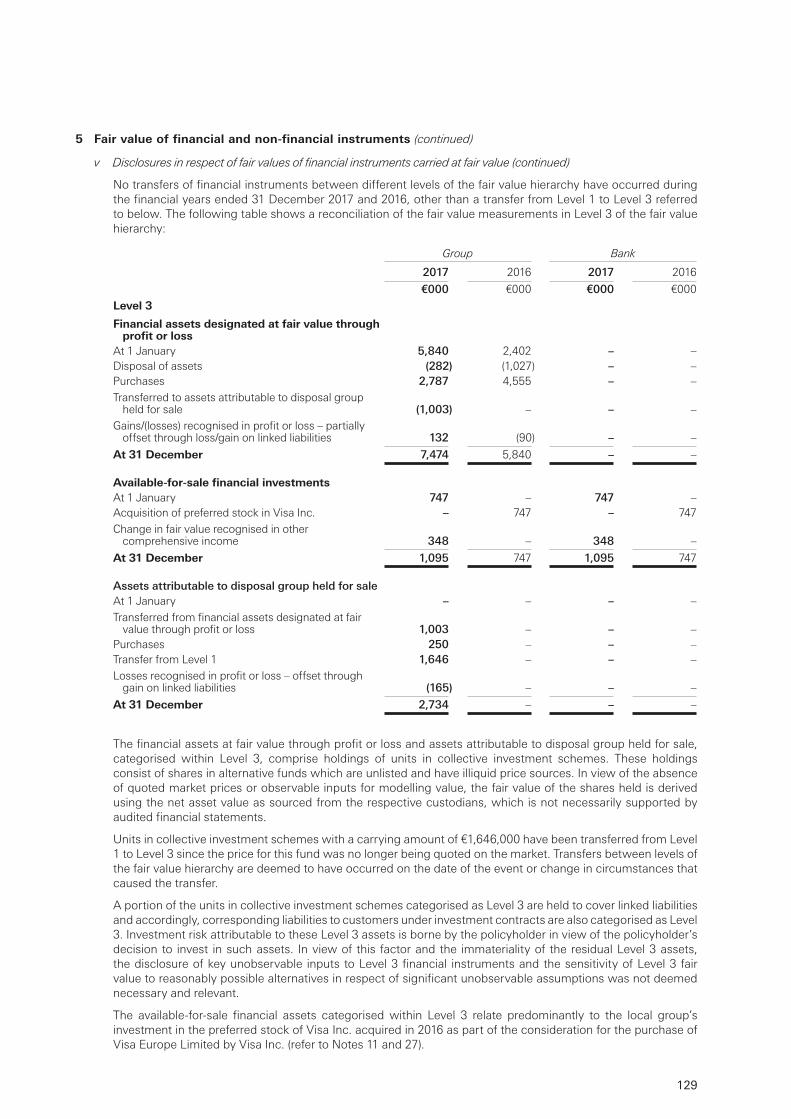
129
5 Fair value of financial and non-financial instruments (continued)
v Disclosures in respect of fair values of financial instruments carried at fair value (continued)
No transfers of financial instruments between different levels of the fair value hierarchy have occurred during the financial years ended 31 December 2017 and 2016, other than a transfer from Level 1 to Level 3 referred to below. The following table shows a reconciliation of the fair value measurements in Level 3 of the fair value hierarchy:
Group Bank
2017 2016 2017 2016
€000 €000 €000 €000
Level 3
Financial assets designated at fair value through profit or loss
At 1 January 5,840 2,402 – –Disposal of assets (282) (1,027) – –Purchases 2,787 4,555 – –Transferred to assets attributable to disposal group
held for sale (1,003) – – –Gains/(losses) recognised in profit or loss – partially
offset through loss/gain on linked liabilities 132 (90) – –
At 31 December 7,474 5,840 – –
Available-for-sale financial investmentsAt 1 January 747 – 747 –Acquisition of preferred stock in Visa Inc. – 747 – 747 Change in fair value recognised in other
comprehensive income 348 – 348 –
At 31 December 1,095 747 1,095 747
Assets attributable to disposal group held for sale At 1 January – – – –Transferred from financial assets designated at fair
value through profit or loss 1,003 – – – Purchases 250 – – –Transfer from Level 1 1,646 – – –Losses recognised in profit or loss – offset through
gain on linked liabilities (165) – – –
At 31 December 2,734 – – –
The financial assets at fair value through profit or loss and assets attributable to disposal group held for sale, categorised within Level 3, comprise holdings of units in collective investment schemes. These holdings consist of shares in alternative funds which are unlisted and have illiquid price sources. In view of the absence of quoted market prices or observable inputs for modelling value, the fair value of the shares held is derived using the net asset value as sourced from the respective custodians, which is not necessarily supported by audited financial statements.
Units in collective investment schemes with a carrying amount of €1,646,000 have been transferred from Level 1 to Level 3 since the price for this fund was no longer being quoted on the market. Transfers between levels of the fair value hierarchy are deemed to have occurred on the date of the event or change in circumstances that caused the transfer.
A portion of the units in collective investment schemes categorised as Level 3 are held to cover linked liabilities and accordingly, corresponding liabilities to customers under investment contracts are also categorised as Level 3. Investment risk attributable to these Level 3 assets is borne by the policyholder in view of the policyholder’s decision to invest in such assets. In view of this factor and the immateriality of the residual Level 3 assets, the disclosure of key unobservable inputs to Level 3 financial instruments and the sensitivity of Level 3 fair value to reasonably possible alternatives in respect of significant unobservable assumptions was not deemed necessary and relevant.
The available-for-sale financial assets categorised within Level 3 relate predominantly to the local group’s investment in the preferred stock of Visa Inc. acquired in 2016 as part of the consideration for the purchase of Visa Europe Limited by Visa Inc. (refer to Notes 11 and 27).
130
Notes on the Financial Statements (continued)
H S B C B A N K M A L T A p . l . c .
5 Fair value of financial and non-financial instruments (continued)
v Disclosures in respect of fair values of financial instruments carried at fair value (continued)
The purpose of the preferred stock categorised as Level 3 is to provide protection to Visa Inc. against potential risk associated with multilateral interchange fees linked to the activity of Visa Europe Limited. The fair value of this stock is dependent on changes in the risk of litigation, in particular around the assumption on the percentage of successful claims that will be settled over time which will reduce the outstanding preferred stock. Based on the fair value of preferred stock the Directors deemed any changes to significant assumptions to have an immaterial impact and the sensitivity analysis in respect of significant unobservable assumptions is accordingly considered unnecessary.
vi Disclosures in respect of fair values of non-financial instruments carried at fair value
Fair valuation of property
The local group’s land and buildings within property, plant and equipment and investment property, were revalued on 31 December 2017 by an independent firm of property valuers having appropriate recognised professional qualifications and experience in the location and category of the property being valued. The Directors have reviewed the carrying amounts of the properties as at 31 December 2017, on the basis of the valuations carried out by the independent property valuers.
Valuations were made on the basis of open market value taking cognisance of the specific location of the properties, the size of the sites together with their development potential, the availability of similar properties in the area, and whenever possible, having regard to recent market transactions for similar properties in the same location.
As reflected in Note 34 ‘Property, plant and equipment’, no adjustments to the carrying amount of the local group’s land and buildings were deemed necessary during 2017. At 31 December 2016 the carrying amounts of the local group’s land and buildings within property, plant and equipment, were adjusted to reflect the properties’ estimated open market value. The carrying amount of investment property both at 31 December 2017 and 2016 was adjusted to reflect the properties’ estimated open market value on an individual asset level.
The local group is required to analyse non-financial assets carried at fair value by level of the fair value hierarchy within which the recurring fair value measurements are categorised in their entirety (Level 1, 2 or 3). The different levels of the fair value hierarchy have been defined above as fair value measurements using:
– Quoted prices (unadjusted) in active markets for identical assets (Level 1);
– Inputs other than quoted prices included within Level 1 that are observable for the asset, either directly (that is, as prices) or indirectly (that is, derived from prices) (Level 2);
– Inputs for the asset that are not based on observable market data (that is, unobservable inputs) (Level 3).
The local group’s land and buildings, within property, plant and equipment, comprises commercial branches, bank offices and other operational premises. Investment property comprises commercial property leased out as offices to third parties including the local group’s intermediate parent (Note 55). All the recurring property fair value measurements at 31 December 2017 and 2016 use significant unobservable inputs and are accordingly categorised within Level 3 of the fair valuation hierarchy.
The local group’s policy is to recognise transfers into and out of fair value hierarchy levels on the date the event or change in circumstances that causes the transfer occurs. There were no transfers between different levels of the fair value hierarchy during the years ended 31 December 2017 and 2016.
A reconciliation from the opening balance to the closing balance of land and buildings for recurring fair value measurements categorised within Level 3 of the value hierarchy for both owner occupied and investment property is reflected in the tables in Notes 33 and 34 respectively.
Valuation Processes
The valuations of the properties are performed regularly on the basis of valuation reports prepared by independent and qualified valuers. These reports are based on both:
– information provided by the local group which is derived from the bank’s financial systems and is subject to the bank’s overall control environment; and
– assumptions and valuation models used by the valuers – the assumptions are typically market-related. These are based on professional judgement and market observation.
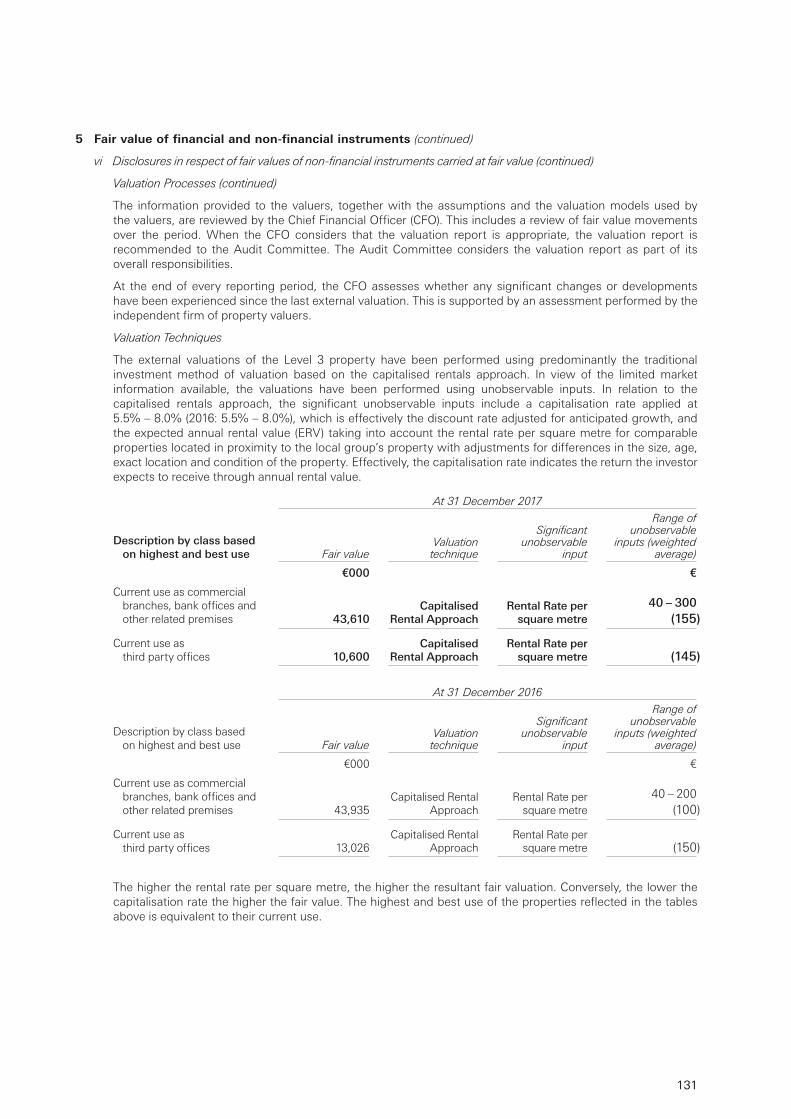
131
5 Fair value of financial and non-financial instruments (continued)
vi Disclosures in respect of fair values of non-financial instruments carried at fair value (continued)
Valuation Processes (continued)
The information provided to the valuers, together with the assumptions and the valuation models used by the valuers, are reviewed by the Chief Financial Officer (CFO). This includes a review of fair value movements over the period. When the CFO considers that the valuation report is appropriate, the valuation report is recommended to the Audit Committee. The Audit Committee considers the valuation report as part of its overall responsibilities.
At the end of every reporting period, the CFO assesses whether any significant changes or developments have been experienced since the last external valuation. This is supported by an assessment performed by the independent firm of property valuers.
Valuation Techniques
The external valuations of the Level 3 property have been performed using predominantly the traditional investment method of valuation based on the capitalised rentals approach. In view of the limited market information available, the valuations have been performed using unobservable inputs. In relation to the capitalised rentals approach, the significant unobservable inputs include a capitalisation rate applied at 5.5% – 8.0% (2016: 5.5% – 8.0%), which is effectively the discount rate adjusted for anticipated growth, and the expected annual rental value (ERV) taking into account the rental rate per square metre for comparable properties located in proximity to the local group’s property with adjustments for differences in the size, age, exact location and condition of the property. Effectively, the capitalisation rate indicates the return the investor expects to receive through annual rental value.
At 31 December 2017
Description by class based on highest and best use Fair value
Valuation technique
Significant unobservable
input
Range of unobservable
inputs (weighted average)
€000 €
Current use as commercial branches, bank offices and other related premises 43,610
Capitalised Rental Approach
Rental Rate per square metre
40 – 300(155)
Current use as third party offices 10,600
Capitalised Rental Approach
Rental Rate per square metre (145)
At 31 December 2016
Description by class based on highest and best use Fair value
Valuation technique
Significant unobservable
input
Range of unobservable
inputs (weighted average)
€000 €
Current use as commercial branches, bank offices and other related premises 43,935
Capitalised Rental Approach
Rental Rate per square metre
40 – 200(100)
Current use as third party offices 13,026
Capitalised Rental Approach
Rental Rate per square metre (150)
The higher the rental rate per square metre, the higher the resultant fair valuation. Conversely, the lower the capitalisation rate the higher the fair value. The highest and best use of the properties reflected in the tables above is equivalent to their current use.
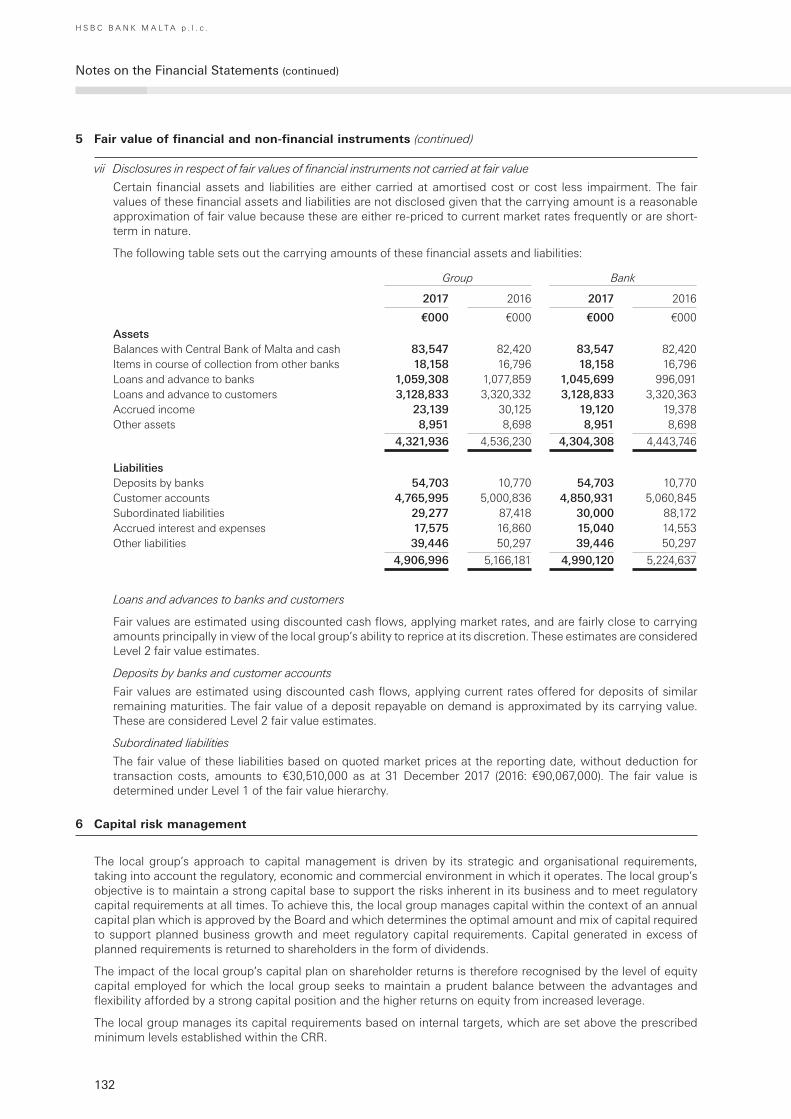
132
Notes on the Financial Statements (continued)
H S B C B A N K M A L T A p . l . c .
5 Fair value of financial and non-financial instruments (continued)
vii Disclosures in respect of fair values of financial instruments not carried at fair value
Certain financial assets and liabilities are either carried at amortised cost or cost less impairment. The fair values of these financial assets and liabilities are not disclosed given that the carrying amount is a reasonable approximation of fair value because these are either re-priced to current market rates frequently or are short-term in nature.
The following table sets out the carrying amounts of these financial assets and liabilities:
Group Bank
2017 2016 2017 2016
€000 €000 €000 €000
AssetsBalances with Central Bank of Malta and cash 83,547 82,420 83,547 82,420 Items in course of collection from other banks 18,158 16,796 18,158 16,796 Loans and advance to banks 1,059,308 1,077,859 1,045,699 996,091 Loans and advance to customers 3,128,833 3,320,332 3,128,833 3,320,363 Accrued income 23,139 30,125 19,120 19,378 Other assets 8,951 8,698 8,951 8,698
4,321,936 4,536,230 4,304,308 4,443,746
LiabilitiesDeposits by banks 54,703 10,770 54,703 10,770 Customer accounts 4,765,995 5,000,836 4,850,931 5,060,845 Subordinated liabilities 29,277 87,418 30,000 88,172 Accrued interest and expenses 17,575 16,860 15,040 14,553Other liabilities 39,446 50,297 39,446 50,297
4,906,996 5,166,181 4,990,120 5,224,637
Loans and advances to banks and customers
Fair values are estimated using discounted cash flows, applying market rates, and are fairly close to carrying amounts principally in view of the local group’s ability to reprice at its discretion. These estimates are considered Level 2 fair value estimates.
Deposits by banks and customer accounts
Fair values are estimated using discounted cash flows, applying current rates offered for deposits of similar remaining maturities. The fair value of a deposit repayable on demand is approximated by its carrying value. These are considered Level 2 fair value estimates.
Subordinated liabilities
The fair value of these liabilities based on quoted market prices at the reporting date, without deduction for transaction costs, amounts to €30,510,000 as at 31 December 2017 (2016: €90,067,000). The fair value is determined under Level 1 of the fair value hierarchy.
6 Capital risk management
The local group’s approach to capital management is driven by its strategic and organisational requirements, taking into account the regulatory, economic and commercial environment in which it operates. The local group’s objective is to maintain a strong capital base to support the risks inherent in its business and to meet regulatory capital requirements at all times. To achieve this, the local group manages capital within the context of an annual capital plan which is approved by the Board and which determines the optimal amount and mix of capital required to support planned business growth and meet regulatory capital requirements. Capital generated in excess of planned requirements is returned to shareholders in the form of dividends.
The impact of the local group’s capital plan on shareholder returns is therefore recognised by the level of equity capital employed for which the local group seeks to maintain a prudent balance between the advantages and flexibility afforded by a strong capital position and the higher returns on equity from increased leverage.
The local group manages its capital requirements based on internal targets, which are set above the prescribed minimum levels established within the CRR.
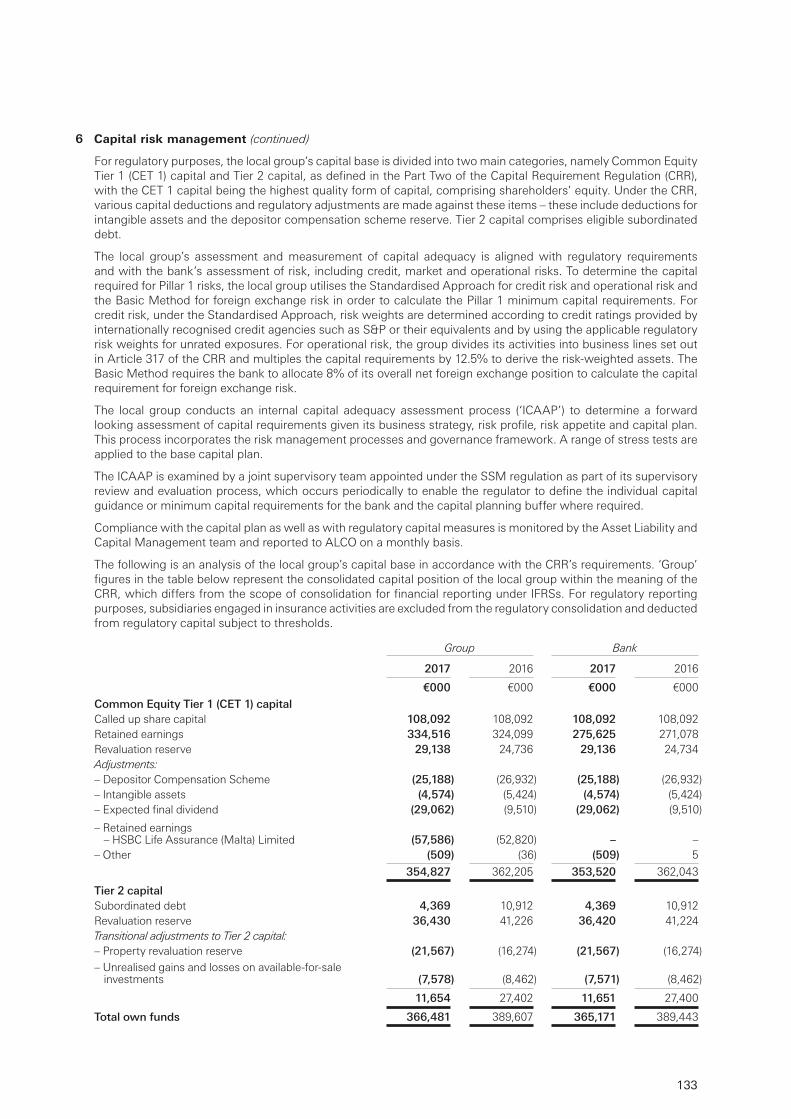
133
6 Capital risk management (continued)
For regulatory purposes, the local group’s capital base is divided into two main categories, namely Common Equity Tier 1 (CET 1) capital and Tier 2 capital, as defined in the Part Two of the Capital Requirement Regulation (CRR), with the CET 1 capital being the highest quality form of capital, comprising shareholders’ equity. Under the CRR, various capital deductions and regulatory adjustments are made against these items – these include deductions for intangible assets and the depositor compensation scheme reserve. Tier 2 capital comprises eligible subordinated debt.
The local group’s assessment and measurement of capital adequacy is aligned with regulatory requirements and with the bank’s assessment of risk, including credit, market and operational risks. To determine the capital required for Pillar 1 risks, the local group utilises the Standardised Approach for credit risk and operational risk and the Basic Method for foreign exchange risk in order to calculate the Pillar 1 minimum capital requirements. For credit risk, under the Standardised Approach, risk weights are determined according to credit ratings provided by internationally recognised credit agencies such as S&P or their equivalents and by using the applicable regulatory risk weights for unrated exposures. For operational risk, the group divides its activities into business lines set out in Article 317 of the CRR and multiples the capital requirements by 12.5% to derive the risk-weighted assets. The Basic Method requires the bank to allocate 8% of its overall net foreign exchange position to calculate the capital requirement for foreign exchange risk.
The local group conducts an internal capital adequacy assessment process (‘ICAAP’) to determine a forward looking assessment of capital requirements given its business strategy, risk profile, risk appetite and capital plan. This process incorporates the risk management processes and governance framework. A range of stress tests are applied to the base capital plan.
The ICAAP is examined by a joint supervisory team appointed under the SSM regulation as part of its supervisory review and evaluation process, which occurs periodically to enable the regulator to define the individual capital guidance or minimum capital requirements for the bank and the capital planning buffer where required.
Compliance with the capital plan as well as with regulatory capital measures is monitored by the Asset Liability and Capital Management team and reported to ALCO on a monthly basis.
The following is an analysis of the local group’s capital base in accordance with the CRR’s requirements. ‘Group’ figures in the table below represent the consolidated capital position of the local group within the meaning of the CRR, which differs from the scope of consolidation for financial reporting under IFRSs. For regulatory reporting purposes, subsidiaries engaged in insurance activities are excluded from the regulatory consolidation and deducted from regulatory capital subject to thresholds.
Group Bank
2017 2016 2017 2016
€000 €000 €000 €000
Common Equity Tier 1 (CET 1) capitalCalled up share capital 108,092 108,092 108,092 108,092 Retained earnings 334,516 324,099 275,625 271,078 Revaluation reserve 29,138 24,736 29,136 24,734 Adjustments:– Depositor Compensation Scheme (25,188) (26,932) (25,188) (26,932)– Intangible assets (4,574) (5,424) (4,574) (5,424)– Expected final dividend (29,062) (9,510) (29,062) (9,510)
– Retained earnings – HSBC Life Assurance (Malta) Limited (57,586) (52,820) – –
– Other (509) (36) (509) 5
354,827 362,205 353,520 362,043
Tier 2 capitalSubordinated debt 4,369 10,912 4,369 10,912Revaluation reserve 36,430 41,226 36,420 41,224Transitional adjustments to Tier 2 capital:– Property revaluation reserve (21,567) (16,274) (21,567) (16,274)– Unrealised gains and losses on available-for-sale
investments (7,578) (8,462) (7,571) (8,462)
11,654 27,402 11,651 27,400
Total own funds 366,481 389,607 365,171 389,443
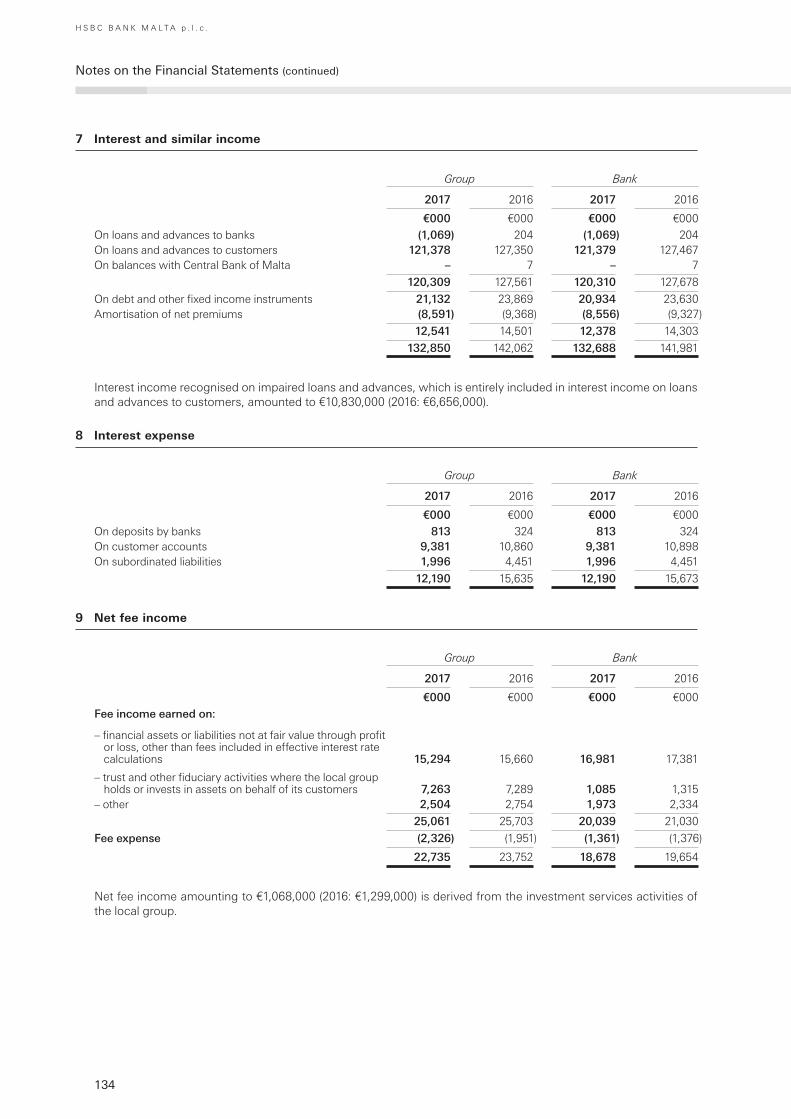
134
Notes on the Financial Statements (continued)
H S B C B A N K M A L T A p . l . c .
7 Interest and similar income
Group Bank
2017 2016 2017 2016
€000 €000 €000 €000
On loans and advances to banks (1,069) 204 (1,069) 204 On loans and advances to customers 121,378 127,350 121,379 127,467 On balances with Central Bank of Malta – 7 – 7
120,309 127,561 120,310 127,678
On debt and other fixed income instruments 21,132 23,869 20,934 23,630 Amortisation of net premiums (8,591) (9,368) (8,556) (9,327)
12,541 14,501 12,378 14,303
132,850 142,062 132,688 141,981
Interest income recognised on impaired loans and advances, which is entirely included in interest income on loans and advances to customers, amounted to €10,830,000 (2016: €6,656,000).
8 Interest expense
Group Bank
2017 2016 2017 2016
€000 €000 €000 €000
On deposits by banks 813 324 813 324 On customer accounts 9,381 10,860 9,381 10,898 On subordinated liabilities 1,996 4,451 1,996 4,451
12,190 15,635 12,190 15,673
9 Net fee income
Group Bank
2017 2016 2017 2016
€000 €000 €000 €000
Fee income earned on:
– financial assets or liabilities not at fair value through profit or loss, other than fees included in effective interest rate calculations 15,294 15,660 16,981 17,381
– trust and other fiduciary activities where the local group holds or invests in assets on behalf of its customers 7,263 7,289 1,085 1,315
– other 2,504 2,754 1,973 2,334
25,061 25,703 20,039 21,030
Fee expense (2,326) (1,951) (1,361) (1,376)
22,735 23,752 18,678 19,654
Net fee income amounting to €1,068,000 (2016: €1,299,000) is derived from the investment services activities of the local group.
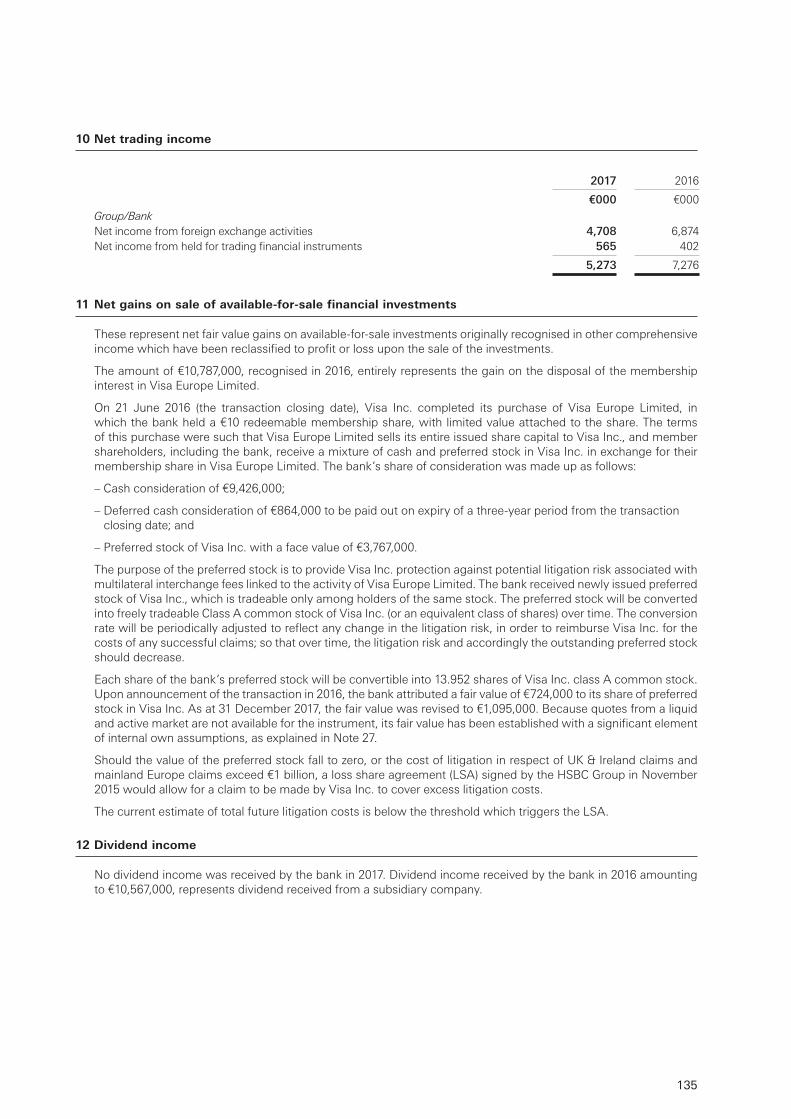
135
10 Net trading income
2017 2016
€000 €000
Group/BankNet income from foreign exchange activities 4,708 6,874 Net income from held for trading financial instruments 565 402
5,273 7,276
11 Net gains on sale of available-for-sale financial investments
These represent net fair value gains on available-for-sale investments originally recognised in other comprehensive income which have been reclassified to profit or loss upon the sale of the investments.
The amount of €10,787,000, recognised in 2016, entirely represents the gain on the disposal of the membership interest in Visa Europe Limited.
On 21 June 2016 (the transaction closing date), Visa Inc. completed its purchase of Visa Europe Limited, in which the bank held a €10 redeemable membership share, with limited value attached to the share. The terms of this purchase were such that Visa Europe Limited sells its entire issued share capital to Visa Inc., and member shareholders, including the bank, receive a mixture of cash and preferred stock in Visa Inc. in exchange for their membership share in Visa Europe Limited. The bank’s share of consideration was made up as follows:
– Cash consideration of €9,426,000;
– Deferred cash consideration of €864,000 to be paid out on expiry of a three-year period from the transaction closing date; and
– Preferred stock of Visa Inc. with a face value of €3,767,000.
The purpose of the preferred stock is to provide Visa Inc. protection against potential litigation risk associated with multilateral interchange fees linked to the activity of Visa Europe Limited. The bank received newly issued preferred stock of Visa Inc., which is tradeable only among holders of the same stock. The preferred stock will be converted into freely tradeable Class A common stock of Visa Inc. (or an equivalent class of shares) over time. The conversion rate will be periodically adjusted to reflect any change in the litigation risk, in order to reimburse Visa Inc. for the costs of any successful claims; so that over time, the litigation risk and accordingly the outstanding preferred stock should decrease.
Each share of the bank’s preferred stock will be convertible into 13.952 shares of Visa Inc. class A common stock. Upon announcement of the transaction in 2016, the bank attributed a fair value of €724,000 to its share of preferred stock in Visa Inc. As at 31 December 2017, the fair value was revised to €1,095,000. Because quotes from a liquid and active market are not available for the instrument, its fair value has been established with a significant element of internal own assumptions, as explained in Note 27.
Should the value of the preferred stock fall to zero, or the cost of litigation in respect of UK & Ireland claims and mainland Europe claims exceed €1 billion, a loss share agreement (LSA) signed by the HSBC Group in November 2015 would allow for a claim to be made by Visa Inc. to cover excess litigation costs.
The current estimate of total future litigation costs is below the threshold which triggers the LSA.
12 Dividend income
No dividend income was received by the bank in 2017. Dividend income received by the bank in 2016 amounting to €10,567,000, represents dividend received from a subsidiary company.
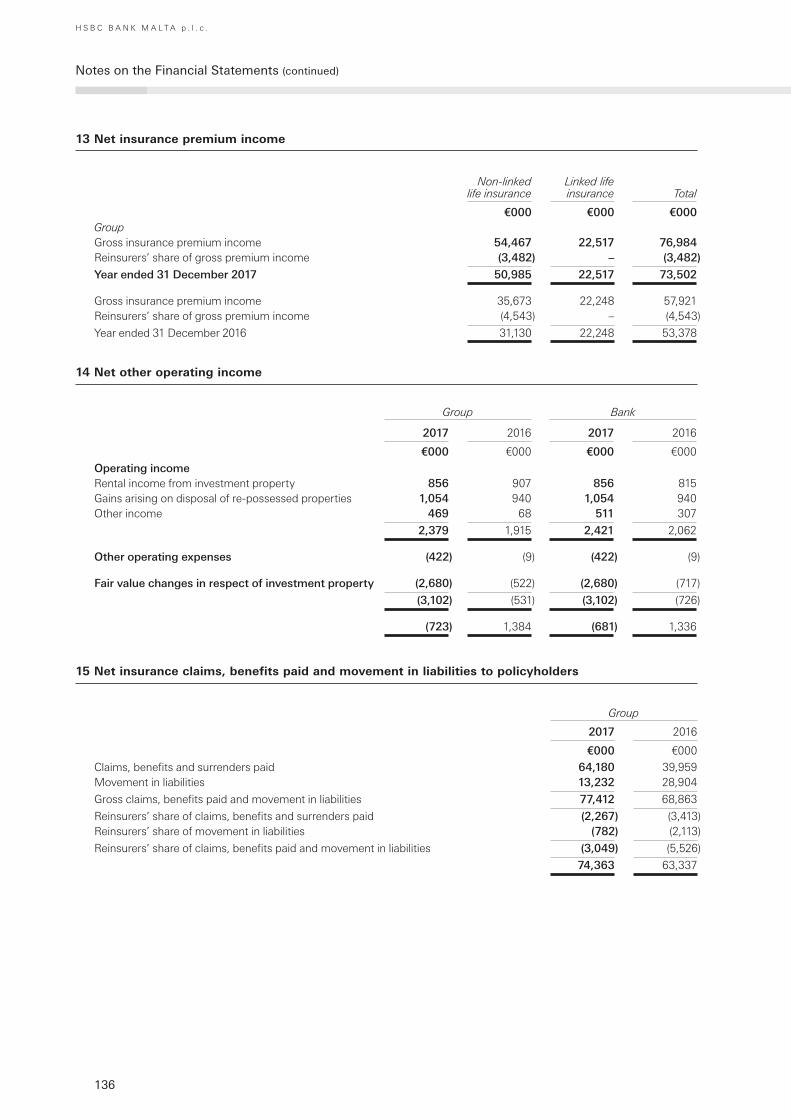
136
Notes on the Financial Statements (continued)
H S B C B A N K M A L T A p . l . c .
13 Net insurance premium income
Non-linked life insurance
Linked life insurance Total
€000 €000 €000GroupGross insurance premium income 54,467 22,517 76,984Reinsurers’ share of gross premium income (3,482) – (3,482)
Year ended 31 December 2017 50,985 22,517 73,502
Gross insurance premium income 35,673 22,248 57,921Reinsurers’ share of gross premium income (4,543) – (4,543)
Year ended 31 December 2016 31,130 22,248 53,378
14 Net other operating income
Group Bank
2017 2016 2017 2016
€000 €000 €000 €000
Operating income Rental income from investment property 856 907 856 815 Gains arising on disposal of re-possessed properties 1,054 940 1,054 940 Other income 469 68 511 307
2,379 1,915 2,421 2,062
Other operating expenses (422) (9) (422) (9)
Fair value changes in respect of investment property (2,680) (522) (2,680) (717)
(3,102) (531) (3,102) (726)
(723) 1,384 (681) 1,336
15 Net insurance claims, benefits paid and movement in liabilities to policyholders
Group
2017 2016
€000 €000
Claims, benefits and surrenders paid 64,180 39,959Movement in liabilities 13,232 28,904
Gross claims, benefits paid and movement in liabilities 77,412 68,863
Reinsurers’ share of claims, benefits and surrenders paid (2,267) (3,413)Reinsurers’ share of movement in liabilities (782) (2,113)
Reinsurers’ share of claims, benefits paid and movement in liabilities (3,049) (5,526)
74,363 63,337
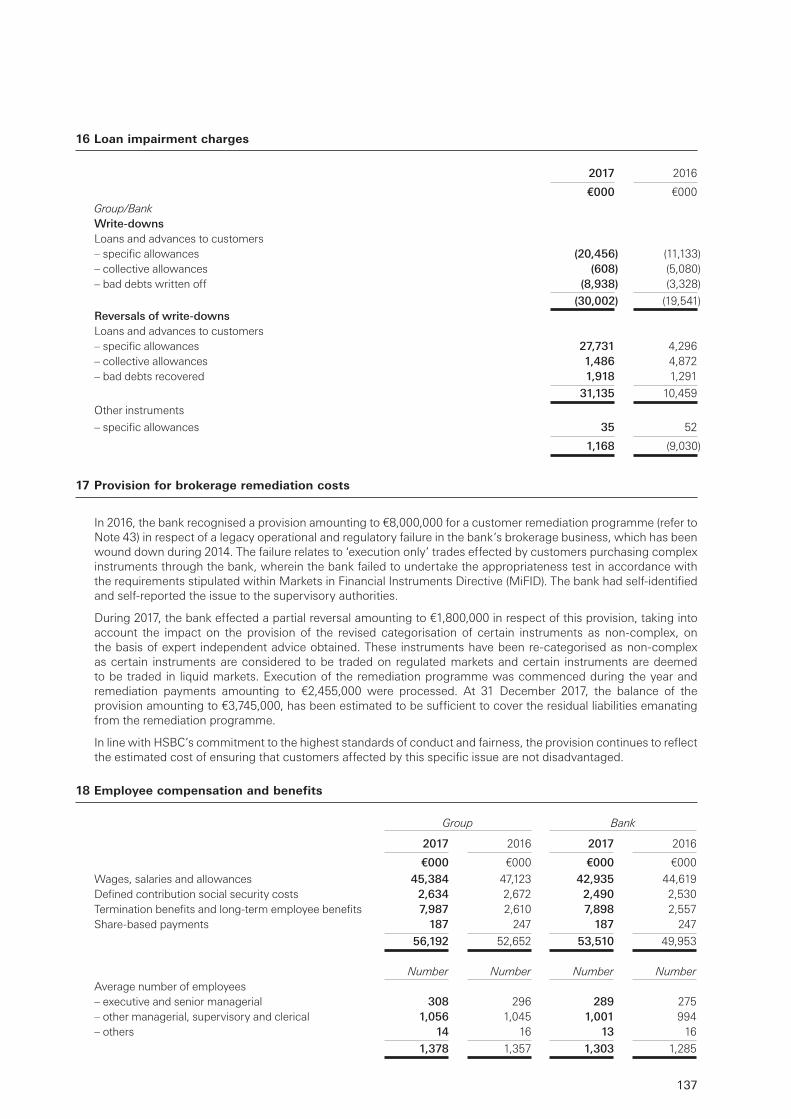
137
16 Loan impairment charges
2017 2016
€000 €000
Group/Bank Write-downsLoans and advances to customers– specific allowances (20,456) (11,133)– collective allowances (608) (5,080)– bad debts written off (8,938) (3,328)
(30,002) (19,541)Reversals of write-downsLoans and advances to customers– specific allowances 27,731 4,296 – collective allowances 1,486 4,872 – bad debts recovered 1,918 1,291
31,135 10,459
Other instruments
– specific allowances 35 52
1,168 (9,030)
17 Provision for brokerage remediation costs
In 2016, the bank recognised a provision amounting to €8,000,000 for a customer remediation programme (refer to Note 43) in respect of a legacy operational and regulatory failure in the bank’s brokerage business, which has been wound down during 2014. The failure relates to ‘execution only’ trades effected by customers purchasing complex instruments through the bank, wherein the bank failed to undertake the appropriateness test in accordance with the requirements stipulated within Markets in Financial Instruments Directive (MiFID). The bank had self-identified and self-reported the issue to the supervisory authorities.
During 2017, the bank effected a partial reversal amounting to €1,800,000 in respect of this provision, taking into account the impact on the provision of the revised categorisation of certain instruments as non-complex, on the basis of expert independent advice obtained. These instruments have been re-categorised as non-complex as certain instruments are considered to be traded on regulated markets and certain instruments are deemed to be traded in liquid markets. Execution of the remediation programme was commenced during the year and remediation payments amounting to €2,455,000 were processed. At 31 December 2017, the balance of the provision amounting to €3,745,000, has been estimated to be sufficient to cover the residual liabilities emanating from the remediation programme.
In line with HSBC’s commitment to the highest standards of conduct and fairness, the provision continues to reflect the estimated cost of ensuring that customers affected by this specific issue are not disadvantaged.
18 Employee compensation and benefits
Group Bank
2017 2016 2017 2016
€000 €000 €000 €000
Wages, salaries and allowances 45,384 47,123 42,935 44,619Defined contribution social security costs 2,634 2,672 2,490 2,530 Termination benefits and long-term employee benefits 7,987 2,610 7,898 2,557Share-based payments 187 247 187 247
56,192 52,652 53,510 49,953
Number Number Number NumberAverage number of employees– executive and senior managerial 308 296 289 275 – other managerial, supervisory and clerical 1,056 1,045 1,001 994– others 14 16 13 16
1,378 1,357 1,303 1,285
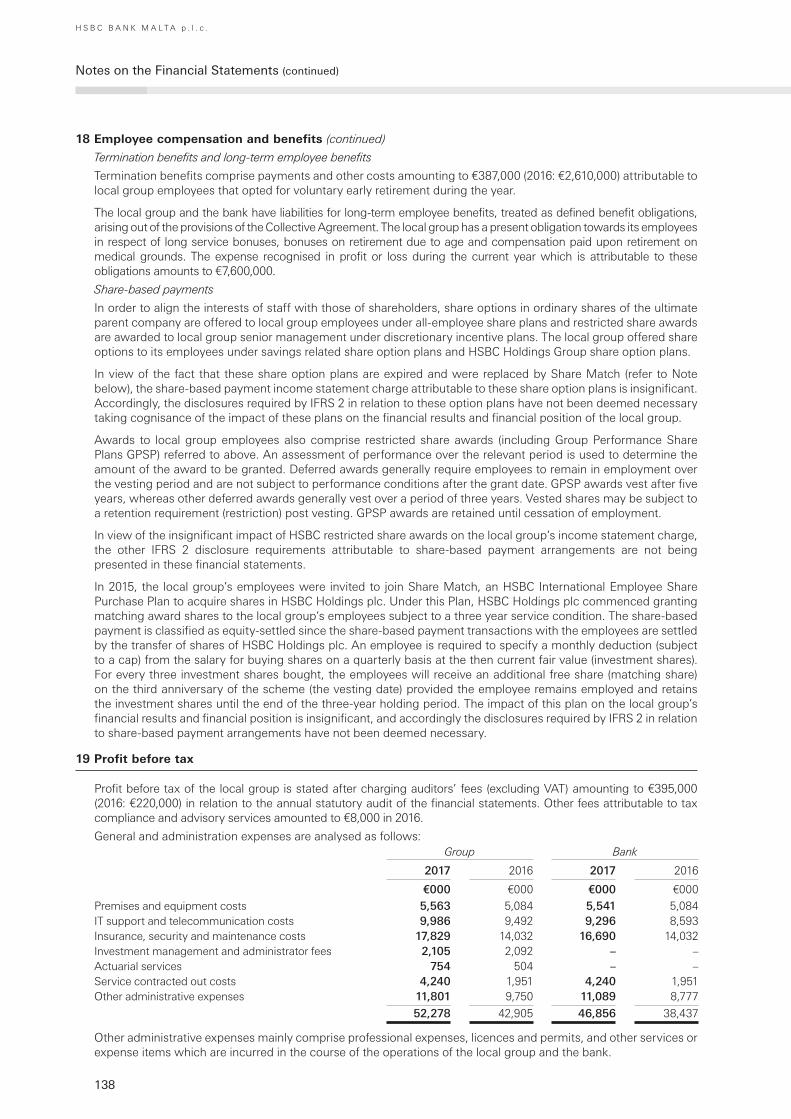
138
Notes on the Financial Statements (continued)
H S B C B A N K M A L T A p . l . c .
18 Employee compensation and benefits (continued)
Termination benefits and long-term employee benefits
Termination benefits comprise payments and other costs amounting to €387,000 (2016: €2,610,000) attributable to local group employees that opted for voluntary early retirement during the year.
The local group and the bank have liabilities for long-term employee benefits, treated as defined benefit obligations, arising out of the provisions of the Collective Agreement. The local group has a present obligation towards its employees in respect of long service bonuses, bonuses on retirement due to age and compensation paid upon retirement on medical grounds. The expense recognised in profit or loss during the current year which is attributable to these obligations amounts to €7,600,000.
Share-based payments
In order to align the interests of staff with those of shareholders, share options in ordinary shares of the ultimate parent company are offered to local group employees under all-employee share plans and restricted share awards are awarded to local group senior management under discretionary incentive plans. The local group offered share options to its employees under savings related share option plans and HSBC Holdings Group share option plans.
In view of the fact that these share option plans are expired and were replaced by Share Match (refer to Note below), the share-based payment income statement charge attributable to these share option plans is insignificant. Accordingly, the disclosures required by IFRS 2 in relation to these option plans have not been deemed necessary taking cognisance of the impact of these plans on the financial results and financial position of the local group.
Awards to local group employees also comprise restricted share awards (including Group Performance Share Plans GPSP) referred to above. An assessment of performance over the relevant period is used to determine the amount of the award to be granted. Deferred awards generally require employees to remain in employment over the vesting period and are not subject to performance conditions after the grant date. GPSP awards vest after five years, whereas other deferred awards generally vest over a period of three years. Vested shares may be subject to a retention requirement (restriction) post vesting. GPSP awards are retained until cessation of employment.
In view of the insignificant impact of HSBC restricted share awards on the local group’s income statement charge, the other IFRS 2 disclosure requirements attributable to share-based payment arrangements are not being presented in these financial statements.
In 2015, the local group’s employees were invited to join Share Match, an HSBC International Employee Share Purchase Plan to acquire shares in HSBC Holdings plc. Under this Plan, HSBC Holdings plc commenced granting matching award shares to the local group’s employees subject to a three year service condition. The share-based payment is classified as equity-settled since the share-based payment transactions with the employees are settled by the transfer of shares of HSBC Holdings plc. An employee is required to specify a monthly deduction (subject to a cap) from the salary for buying shares on a quarterly basis at the then current fair value (investment shares). For every three investment shares bought, the employees will receive an additional free share (matching share) on the third anniversary of the scheme (the vesting date) provided the employee remains employed and retains the investment shares until the end of the three-year holding period. The impact of this plan on the local group’s financial results and financial position is insignificant, and accordingly the disclosures required by IFRS 2 in relation to share-based payment arrangements have not been deemed necessary.
19 Profit before tax
Profit before tax of the local group is stated after charging auditors’ fees (excluding VAT) amounting to €395,000 (2016: €220,000) in relation to the annual statutory audit of the financial statements. Other fees attributable to tax compliance and advisory services amounted to €8,000 in 2016.
General and administration expenses are analysed as follows:Group Bank
2017 2016 2017 2016
€000 €000 €000 €000
Premises and equipment costs 5,563 5,084 5,541 5,084 IT support and telecommunication costs 9,986 9,492 9,296 8,593 Insurance, security and maintenance costs 17,829 14,032 16,690 14,032 Investment management and administrator fees 2,105 2,092 – –Actuarial services 754 504 – –Service contracted out costs 4,240 1,951 4,240 1,951 Other administrative expenses 11,801 9,750 11,089 8,777
52,278 42,905 46,856 38,437
Other administrative expenses mainly comprise professional expenses, licences and permits, and other services or expense items which are incurred in the course of the operations of the local group and the bank.
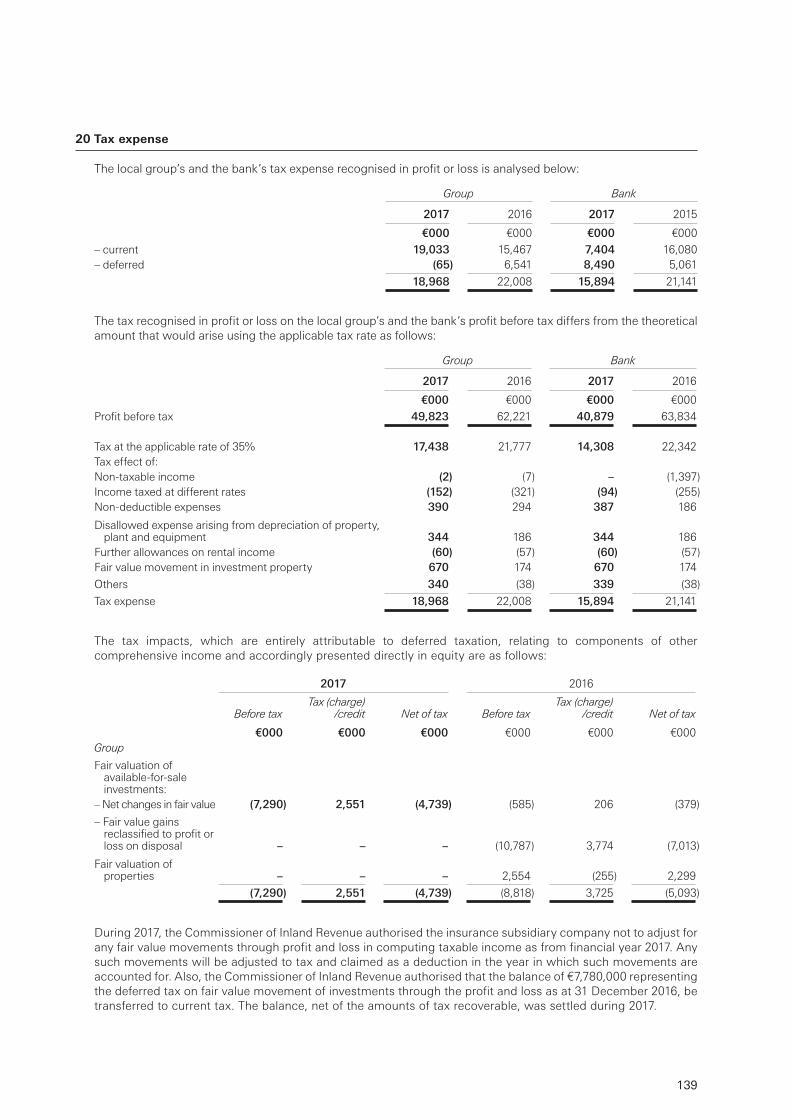
139
20 Tax expense
The local group’s and the bank’s tax expense recognised in profit or loss is analysed below:
Group Bank
2017 2016 2017 2015
€000 €000 €000 €000
– current 19,033 15,467 7,404 16,080 – deferred (65) 6,541 8,490 5,061
18,968 22,008 15,894 21,141
The tax recognised in profit or loss on the local group’s and the bank’s profit before tax differs from the theoretical amount that would arise using the applicable tax rate as follows:
Group Bank
2017 2016 2017 2016
€000 €000 €000 €000
Profit before tax 49,823 62,221 40,879 63,834
Tax at the applicable rate of 35% 17,438 21,777 14,308 22,342 Tax effect of:Non-taxable income (2) (7) – (1,397)Income taxed at different rates (152) (321) (94) (255)Non-deductible expenses 390 294 387 186
Disallowed expense arising from depreciation of property, plant and equipment 344 186 344 186
Further allowances on rental income (60) (57) (60) (57)Fair value movement in investment property 670 174 670 174
Others 340 (38) 339 (38)
Tax expense 18,968 22,008 15,894 21,141
The tax impacts, which are entirely attributable to deferred taxation, relating to components of other comprehensive income and accordingly presented directly in equity are as follows:
2017 2016
Before taxTax (charge)
/credit Net of tax Before taxTax (charge)
/credit Net of tax
€000 €000 €000 €000 €000 €000Group
Fair valuation of available-for-sale investments:
– Net changes in fair value (7,290) 2,551 (4,739) (585) 206 (379)
– Fair value gains reclassified to profit or loss on disposal – – – (10,787) 3,774 (7,013)
Fair valuation of properties – – – 2,554 (255) 2,299
(7,290) 2,551 (4,739) (8,818) 3,725 (5,093)
During 2017, the Commissioner of Inland Revenue authorised the insurance subsidiary company not to adjust for any fair value movements through profit and loss in computing taxable income as from financial year 2017. Any such movements will be adjusted to tax and claimed as a deduction in the year in which such movements are accounted for. Also, the Commissioner of Inland Revenue authorised that the balance of €7,780,000 representing the deferred tax on fair value movement of investments through the profit and loss as at 31 December 2016, be transferred to current tax. The balance, net of the amounts of tax recoverable, was settled during 2017.
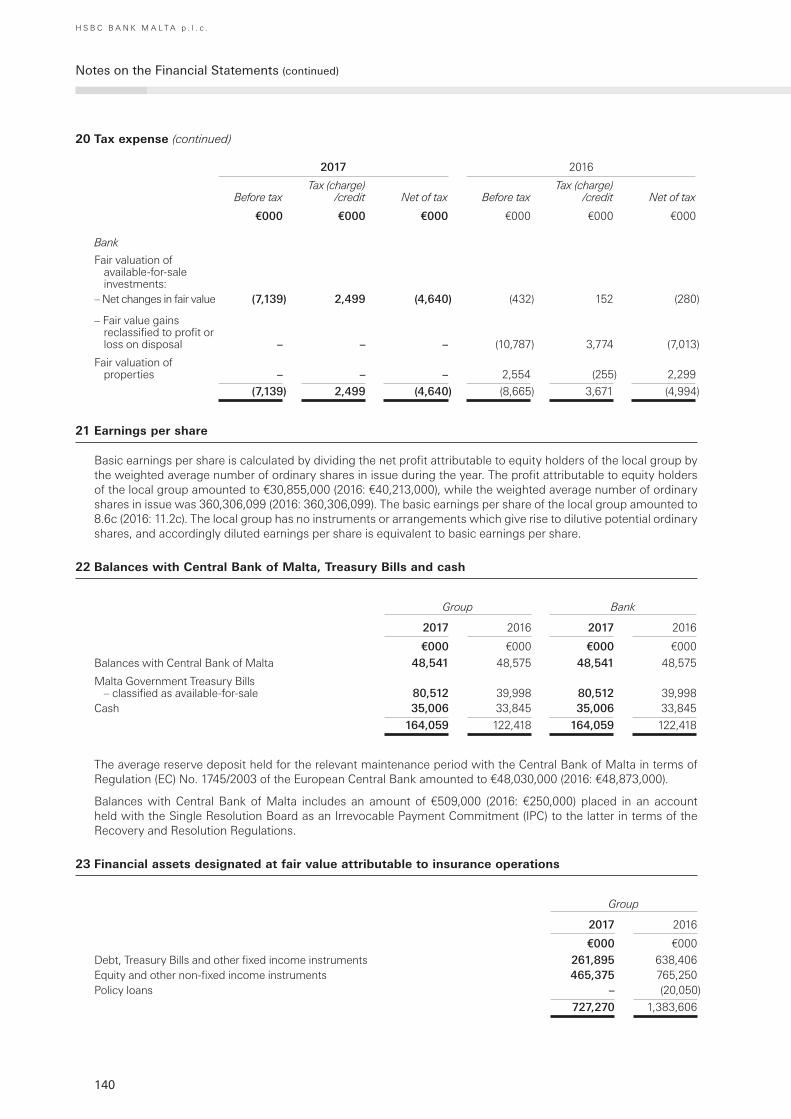
140
Notes on the Financial Statements (continued)
H S B C B A N K M A L T A p . l . c .
20 Tax expense (continued)
2017 2016
Before taxTax (charge)
/credit Net of tax Before taxTax (charge)
/credit Net of tax
€000 €000 €000 €000 €000 €000
Bank
Fair valuation of available-for-sale investments:
– Net changes in fair value (7,139) 2,499 (4,640) (432) 152 (280)
– Fair value gains reclassified to profit or loss on disposal – – – (10,787) 3,774 (7,013)
Fair valuation of properties – – – 2,554 (255) 2,299
(7,139) 2,499 (4,640) (8,665) 3,671 (4,994)
21 Earnings per share
Basic earnings per share is calculated by dividing the net profit attributable to equity holders of the local group by the weighted average number of ordinary shares in issue during the year. The profit attributable to equity holders of the local group amounted to €30,855,000 (2016: €40,213,000), while the weighted average number of ordinary shares in issue was 360,306,099 (2016: 360,306,099). The basic earnings per share of the local group amounted to 8.6c (2016: 11.2c). The local group has no instruments or arrangements which give rise to dilutive potential ordinary shares, and accordingly diluted earnings per share is equivalent to basic earnings per share.
22 Balances with Central Bank of Malta, Treasury Bills and cash
Group Bank
2017 2016 2017 2016
€000 €000 €000 €000
Balances with Central Bank of Malta 48,541 48,575 48,541 48,575
Malta Government Treasury Bills – classified as available-for-sale 80,512 39,998 80,512 39,998
Cash 35,006 33,845 35,006 33,845
164,059 122,418 164,059 122,418
The average reserve deposit held for the relevant maintenance period with the Central Bank of Malta in terms of Regulation (EC) No. 1745/2003 of the European Central Bank amounted to €48,030,000 (2016: €48,873,000).
Balances with Central Bank of Malta includes an amount of €509,000 (2016: €250,000) placed in an account held with the Single Resolution Board as an Irrevocable Payment Commitment (IPC) to the latter in terms of the Recovery and Resolution Regulations.
23 Financial assets designated at fair value attributable to insurance operations
Group
2017 2016
€000 €000
Debt, Treasury Bills and other fixed income instruments 261,895 638,406Equity and other non-fixed income instruments 465,375 765,250Policy loans – (20,050)
727,270 1,383,606
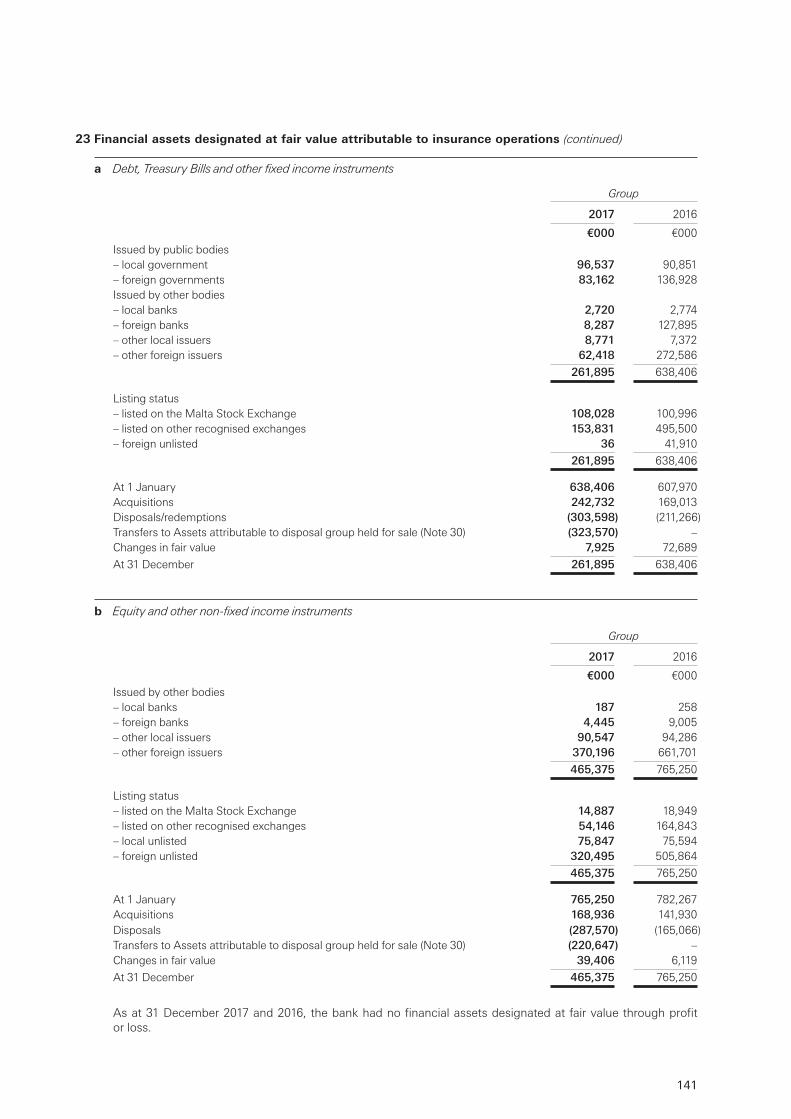
141
23 Financial assets designated at fair value attributable to insurance operations (continued)
a Debt, Treasury Bills and other fixed income instruments
Group
2017 2016
€000 €000
Issued by public bodies– local government 96,537 90,851– foreign governments 83,162 136,928Issued by other bodies– local banks 2,720 2,774– foreign banks 8,287 127,895– other local issuers 8,771 7,372– other foreign issuers 62,418 272,586
261,895 638,406
Listing status– listed on the Malta Stock Exchange 108,028 100,996– listed on other recognised exchanges 153,831 495,500– foreign unlisted 36 41,910
261,895 638,406
At 1 January 638,406 607,970Acquisitions 242,732 169,013Disposals/redemptions (303,598) (211,266)Transfers to Assets attributable to disposal group held for sale (Note 30) (323,570) –Changes in fair value 7,925 72,689
At 31 December 261,895 638,406
b Equity and other non-fixed income instruments
Group
2017 2016
€000 €000
Issued by other bodies– local banks 187 258– foreign banks 4,445 9,005– other local issuers 90,547 94,286– other foreign issuers 370,196 661,701
465,375 765,250
Listing status– listed on the Malta Stock Exchange 14,887 18,949– listed on other recognised exchanges 54,146 164,843– local unlisted 75,847 75,594– foreign unlisted 320,495 505,864
465,375 765,250
At 1 January 765,250 782,267Acquisitions 168,936 141,930Disposals (287,570) (165,066)Transfers to Assets attributable to disposal group held for sale (Note 30) (220,647) –Changes in fair value 39,406 6,119
At 31 December 465,375 765,250
As at 31 December 2017 and 2016, the bank had no financial assets designated at fair value through profit or loss.
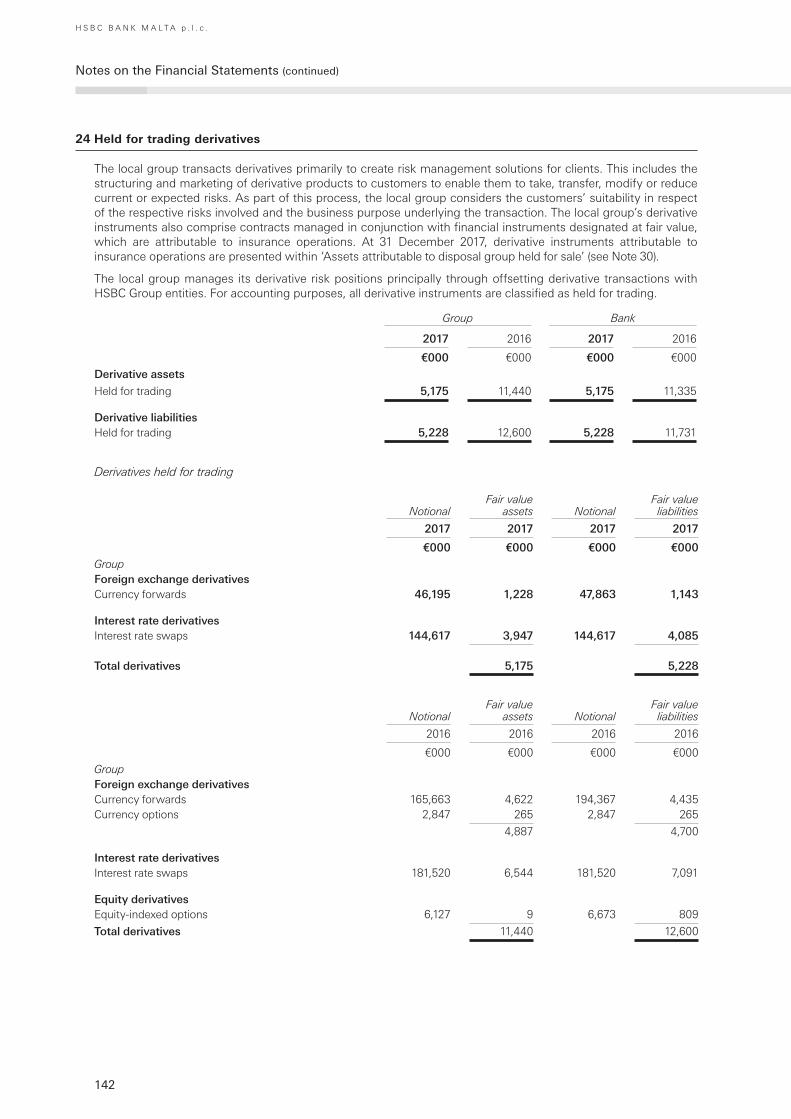
142
Notes on the Financial Statements (continued)
H S B C B A N K M A L T A p . l . c .
24 Held for trading derivatives
The local group transacts derivatives primarily to create risk management solutions for clients. This includes the structuring and marketing of derivative products to customers to enable them to take, transfer, modify or reduce current or expected risks. As part of this process, the local group considers the customers’ suitability in respect of the respective risks involved and the business purpose underlying the transaction. The local group’s derivative instruments also comprise contracts managed in conjunction with financial instruments designated at fair value, which are attributable to insurance operations. At 31 December 2017, derivative instruments attributable to insurance operations are presented within ‘Assets attributable to disposal group held for sale’ (see Note 30).
The local group manages its derivative risk positions principally through offsetting derivative transactions with HSBC Group entities. For accounting purposes, all derivative instruments are classified as held for trading.
Group Bank
2017 2016 2017 2016
€000 €000 €000 €000
Derivative assets
Held for trading 5,175 11,440 5,175 11,335
Derivative liabilitiesHeld for trading 5,228 12,600 5,228 11,731
Derivatives held for trading
NotionalFair value
assets Notional Fair value liabilities
2017 2017 2017 2017
€000 €000 €000 €000GroupForeign exchange derivativesCurrency forwards 46,195 1,228 47,863 1,143
Interest rate derivativesInterest rate swaps 144,617 3,947 144,617 4,085
Total derivatives 5,175 5,228
NotionalFair value
assets Notional Fair value liabilities
2016 2016 2016 2016
€000 €000 €000 €000
GroupForeign exchange derivativesCurrency forwards 165,663 4,622 194,367 4,435 Currency options 2,847 265 2,847 265
4,887 4,700
Interest rate derivativesInterest rate swaps 181,520 6,544 181,520 7,091
Equity derivativesEquity-indexed options 6,127 9 6,673 809
Total derivatives 11,440 12,600
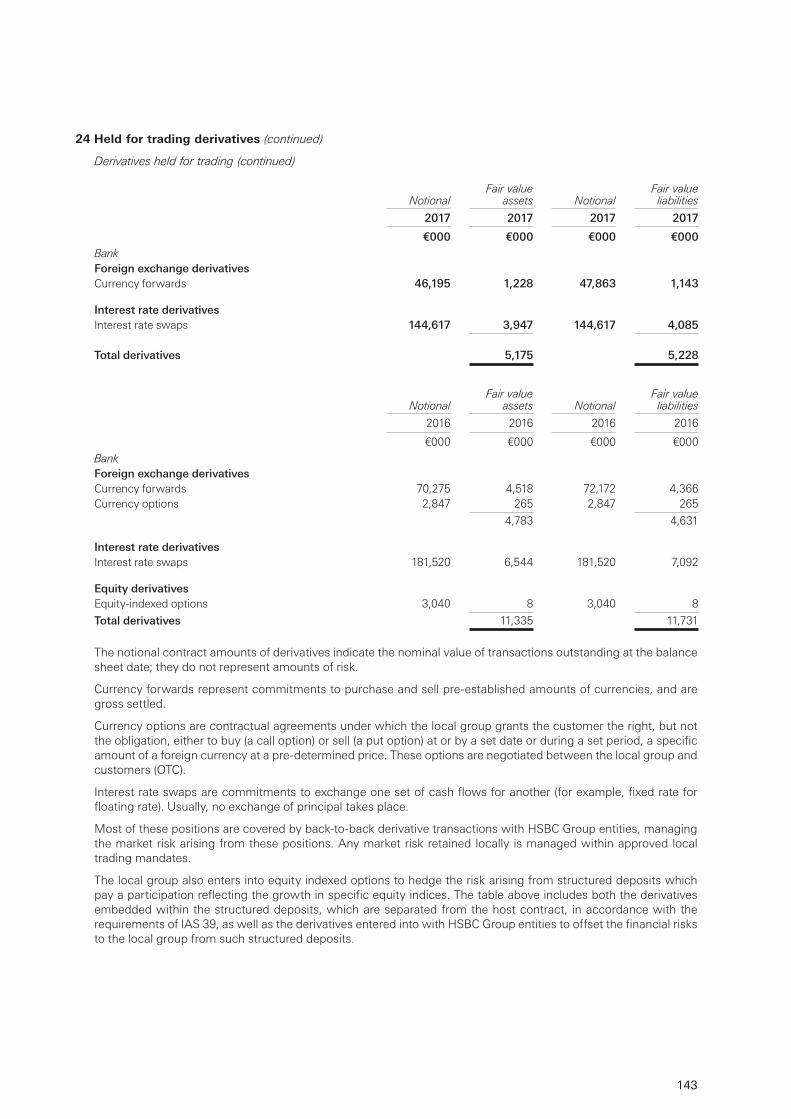
143
24 Held for trading derivatives (continued)
Derivatives held for trading (continued)
NotionalFair value
assets Notional Fair value liabilities
2017 2017 2017 2017
€000 €000 €000 €000BankForeign exchange derivativesCurrency forwards 46,195 1,228 47,863 1,143
Interest rate derivativesInterest rate swaps 144,617 3,947 144,617 4,085
Total derivatives 5,175 5,228
NotionalFair value
assets Notional Fair value liabilities
2016 2016 2016 2016
€000 €000 €000 €000
BankForeign exchange derivativesCurrency forwards 70,275 4,518 72,172 4,366 Currency options 2,847 265 2,847 265
4,783 4,631
Interest rate derivativesInterest rate swaps 181,520 6,544 181,520 7,092
Equity derivativesEquity-indexed options 3,040 8 3,040 8
Total derivatives 11,335 11,731
The notional contract amounts of derivatives indicate the nominal value of transactions outstanding at the balance sheet date; they do not represent amounts of risk.
Currency forwards represent commitments to purchase and sell pre-established amounts of currencies, and are gross settled.
Currency options are contractual agreements under which the local group grants the customer the right, but not the obligation, either to buy (a call option) or sell (a put option) at or by a set date or during a set period, a specific amount of a foreign currency at a pre-determined price. These options are negotiated between the local group and customers (OTC).
Interest rate swaps are commitments to exchange one set of cash flows for another (for example, fixed rate for floating rate). Usually, no exchange of principal takes place.
Most of these positions are covered by back-to-back derivative transactions with HSBC Group entities, managing the market risk arising from these positions. Any market risk retained locally is managed within approved local trading mandates.
The local group also enters into equity indexed options to hedge the risk arising from structured deposits which pay a participation reflecting the growth in specific equity indices. The table above includes both the derivatives embedded within the structured deposits, which are separated from the host contract, in accordance with the requirements of IAS 39, as well as the derivatives entered into with HSBC Group entities to offset the financial risks to the local group from such structured deposits.
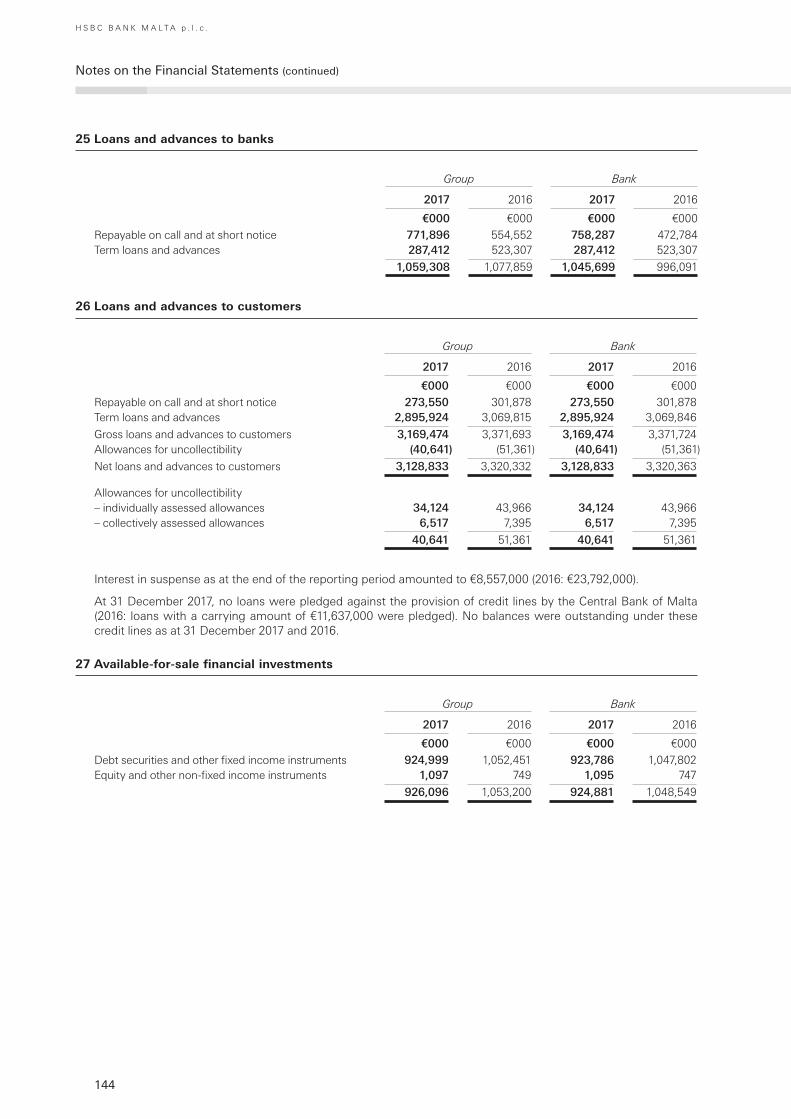
144
Notes on the Financial Statements (continued)
H S B C B A N K M A L T A p . l . c .
25 Loans and advances to banks
Group Bank
2017 2016 2017 2016
€000 €000 €000 €000
Repayable on call and at short notice 771,896 554,552 758,287 472,784 Term loans and advances 287,412 523,307 287,412 523,307
1,059,308 1,077,859 1,045,699 996,091
26 Loans and advances to customers
Group Bank
2017 2016 2017 2016
€000 €000 €000 €000
Repayable on call and at short notice 273,550 301,878 273,550 301,878 Term loans and advances 2,895,924 3,069,815 2,895,924 3,069,846
Gross loans and advances to customers 3,169,474 3,371,693 3,169,474 3,371,724 Allowances for uncollectibility (40,641) (51,361) (40,641) (51,361)
Net loans and advances to customers 3,128,833 3,320,332 3,128,833 3,320,363
Allowances for uncollectibility– individually assessed allowances 34,124 43,966 34,124 43,966 – collectively assessed allowances 6,517 7,395 6,517 7,395
40,641 51,361 40,641 51,361
Interest in suspense as at the end of the reporting period amounted to €8,557,000 (2016: €23,792,000).
At 31 December 2017, no loans were pledged against the provision of credit lines by the Central Bank of Malta (2016: loans with a carrying amount of €11,637,000 were pledged). No balances were outstanding under these credit lines as at 31 December 2017 and 2016.
27 Available-for-sale financial investments
Group Bank
2017 2016 2017 2016
€000 €000 €000 €000
Debt securities and other fixed income instruments 924,999 1,052,451 923,786 1,047,802 Equity and other non-fixed income instruments 1,097 749 1,095 747
926,096 1,053,200 924,881 1,048,549
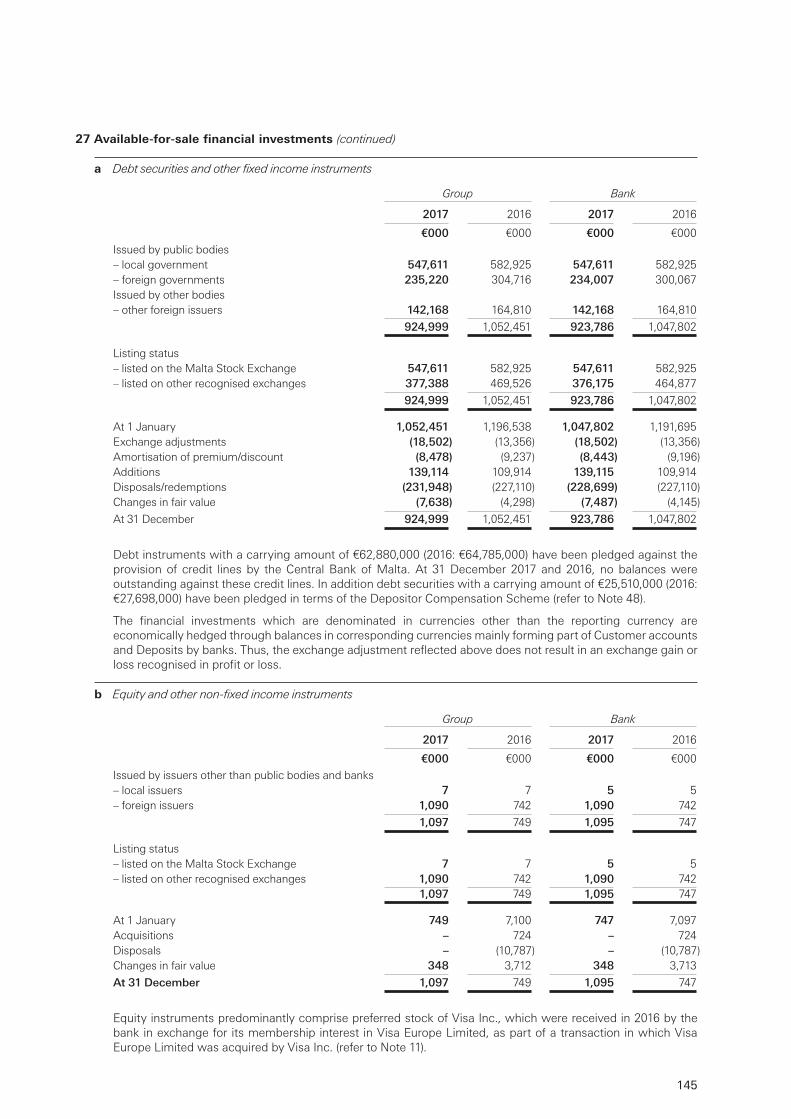
145
27 Available-for-sale financial investments (continued)
a Debt securities and other fixed income instruments
Group Bank
2017 2016 2017 2016
€000 €000 €000 €000
Issued by public bodies– local government 547,611 582,925 547,611 582,925 – foreign governments 235,220 304,716 234,007 300,067 Issued by other bodies– other foreign issuers 142,168 164,810 142,168 164,810
924,999 1,052,451 923,786 1,047,802
Listing status– listed on the Malta Stock Exchange 547,611 582,925 547,611 582,925 – listed on other recognised exchanges 377,388 469,526 376,175 464,877
924,999 1,052,451 923,786 1,047,802
At 1 January 1,052,451 1,196,538 1,047,802 1,191,695 Exchange adjustments (18,502) (13,356) (18,502) (13,356)Amortisation of premium/discount (8,478) (9,237) (8,443) (9,196)Additions 139,114 109,914 139,115 109,914 Disposals/redemptions (231,948) (227,110) (228,699) (227,110)Changes in fair value (7,638) (4,298) (7,487) (4,145)
At 31 December 924,999 1,052,451 923,786 1,047,802
Debt instruments with a carrying amount of €62,880,000 (2016: €64,785,000) have been pledged against the provision of credit lines by the Central Bank of Malta. At 31 December 2017 and 2016, no balances were outstanding against these credit lines. In addition debt securities with a carrying amount of €25,510,000 (2016: €27,698,000) have been pledged in terms of the Depositor Compensation Scheme (refer to Note 48).
The financial investments which are denominated in currencies other than the reporting currency are economically hedged through balances in corresponding currencies mainly forming part of Customer accounts and Deposits by banks. Thus, the exchange adjustment reflected above does not result in an exchange gain or loss recognised in profit or loss.
b Equity and other non-fixed income instruments
Group Bank
2017 2016 2017 2016
€000 €000 €000 €000
Issued by issuers other than public bodies and banks– local issuers 7 7 5 5 – foreign issuers 1,090 742 1,090 742
1,097 749 1,095 747
Listing status– listed on the Malta Stock Exchange 7 7 5 5 – listed on other recognised exchanges 1,090 742 1,090 742
1,097 749 1,095 747
At 1 January 749 7,100 747 7,097 Acquisitions – 724 – 724 Disposals – (10,787) – (10,787)Changes in fair value 348 3,712 348 3,713
At 31 December 1,097 749 1,095 747
Equity instruments predominantly comprise preferred stock of Visa Inc., which were received in 2016 by the bank in exchange for its membership interest in Visa Europe Limited, as part of a transaction in which Visa Europe Limited was acquired by Visa Inc. (refer to Note 11).
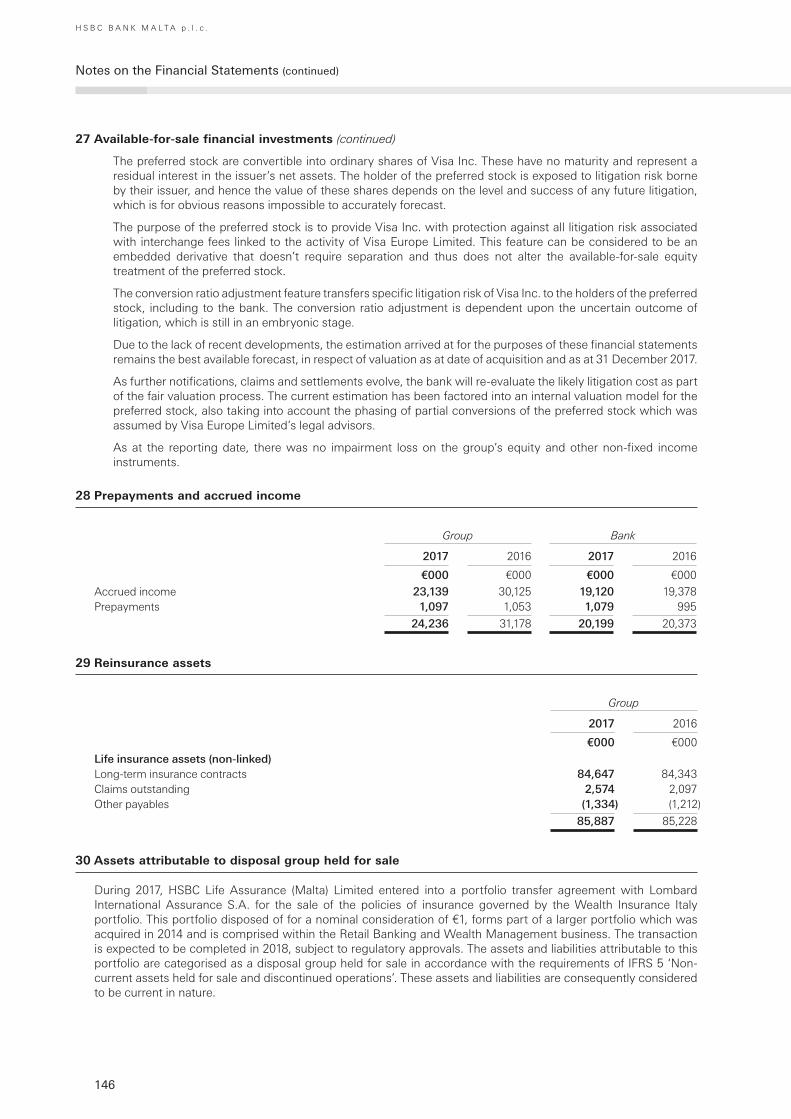
146
Notes on the Financial Statements (continued)
H S B C B A N K M A L T A p . l . c .
27 Available-for-sale financial investments (continued)
The preferred stock are convertible into ordinary shares of Visa Inc. These have no maturity and represent a residual interest in the issuer’s net assets. The holder of the preferred stock is exposed to litigation risk borne by their issuer, and hence the value of these shares depends on the level and success of any future litigation, which is for obvious reasons impossible to accurately forecast.
The purpose of the preferred stock is to provide Visa Inc. with protection against all litigation risk associated with interchange fees linked to the activity of Visa Europe Limited. This feature can be considered to be an embedded derivative that doesn’t require separation and thus does not alter the available-for-sale equity treatment of the preferred stock.
The conversion ratio adjustment feature transfers specific litigation risk of Visa Inc. to the holders of the preferred stock, including to the bank. The conversion ratio adjustment is dependent upon the uncertain outcome of litigation, which is still in an embryonic stage.
Due to the lack of recent developments, the estimation arrived at for the purposes of these financial statements remains the best available forecast, in respect of valuation as at date of acquisition and as at 31 December 2017.
As further notifications, claims and settlements evolve, the bank will re-evaluate the likely litigation cost as part of the fair valuation process. The current estimation has been factored into an internal valuation model for the preferred stock, also taking into account the phasing of partial conversions of the preferred stock which was assumed by Visa Europe Limited’s legal advisors.
As at the reporting date, there was no impairment loss on the group’s equity and other non-fixed income instruments.
28 Prepayments and accrued income
Group Bank
2017 2016 2017 2016
€000 €000 €000 €000
Accrued income 23,139 30,125 19,120 19,378 Prepayments 1,097 1,053 1,079 995
24,236 31,178 20,199 20,373
29 Reinsurance assets
Group
2017 2016
€000 €000
Life insurance assets (non-linked)Long-term insurance contracts 84,647 84,343 Claims outstanding 2,574 2,097 Other payables (1,334) (1,212)
85,887 85,228
30 Assets attributable to disposal group held for sale
During 2017, HSBC Life Assurance (Malta) Limited entered into a portfolio transfer agreement with Lombard International Assurance S.A. for the sale of the policies of insurance governed by the Wealth Insurance Italy portfolio. This portfolio disposed of for a nominal consideration of €1, forms part of a larger portfolio which was acquired in 2014 and is comprised within the Retail Banking and Wealth Management business. The transaction is expected to be completed in 2018, subject to regulatory approvals. The assets and liabilities attributable to this portfolio are categorised as a disposal group held for sale in accordance with the requirements of IFRS 5 ‘Non-current assets held for sale and discontinued operations’. These assets and liabilities are consequently considered to be current in nature.
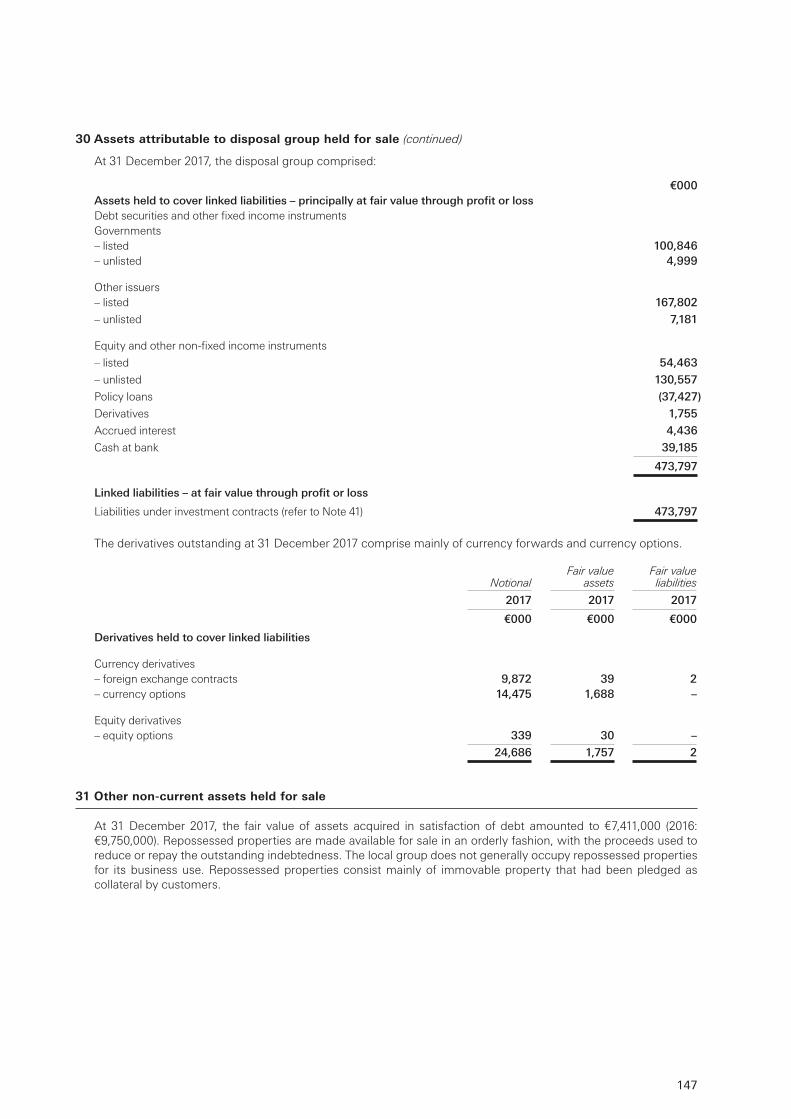
147
30 Assets attributable to disposal group held for sale (continued)
At 31 December 2017, the disposal group comprised:
€000Assets held to cover linked liabilities – principally at fair value through profit or lossDebt securities and other fixed income instrumentsGovernments– listed 100,846– unlisted 4,999
Other issuers– listed 167,802
– unlisted 7,181
Equity and other non-fixed income instruments
– listed 54,463
– unlisted 130,557
Policy loans (37,427)
Derivatives 1,755
Accrued interest 4,436
Cash at bank 39,185
473,797
Linked liabilities – at fair value through profit or loss
Liabilities under investment contracts (refer to Note 41) 473,797
The derivatives outstanding at 31 December 2017 comprise mainly of currency forwards and currency options.
NotionalFair value
assetsFair value liabilities
2017 2017 2017
€000 €000 €000
Derivatives held to cover linked liabilities
Currency derivatives– foreign exchange contracts 9,872 39 2 – currency options 14,475 1,688 –
Equity derivatives– equity options 339 30 –
24,686 1,757 2
31 Other non-current assets held for sale
At 31 December 2017, the fair value of assets acquired in satisfaction of debt amounted to €7,411,000 (2016: €9,750,000). Repossessed properties are made available for sale in an orderly fashion, with the proceeds used to reduce or repay the outstanding indebtedness. The local group does not generally occupy repossessed properties for its business use. Repossessed properties consist mainly of immovable property that had been pledged as collateral by customers.
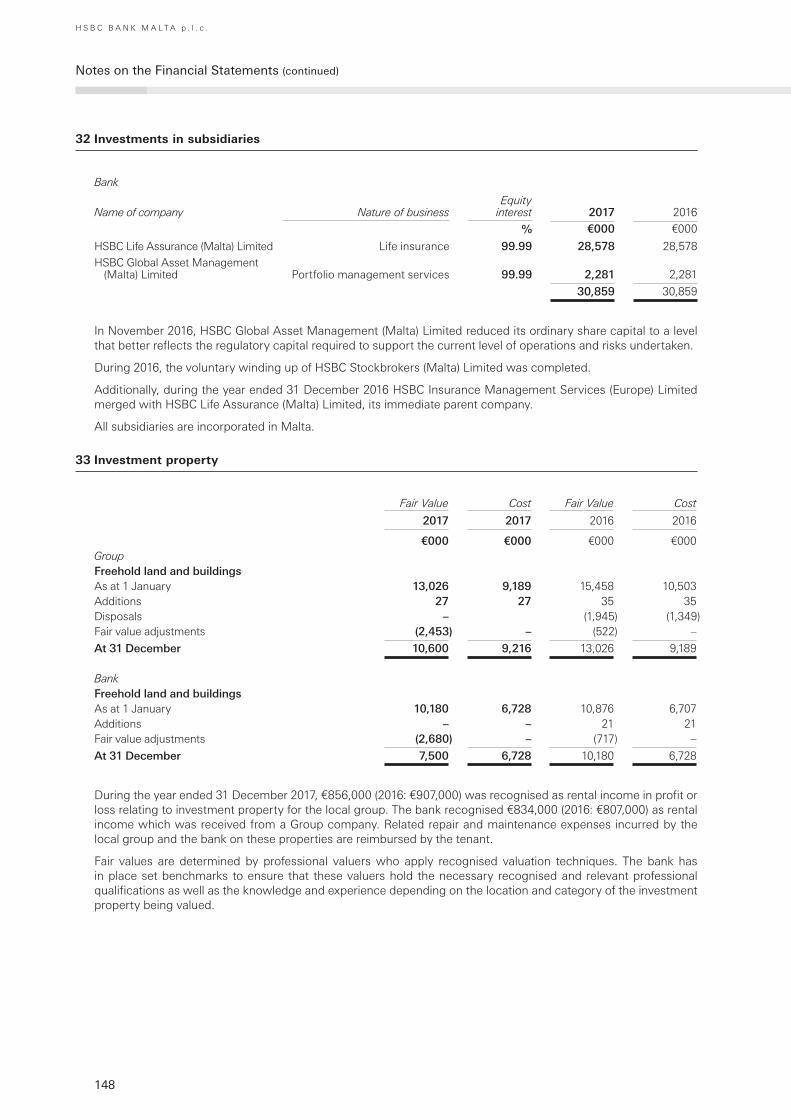
148
Notes on the Financial Statements (continued)
H S B C B A N K M A L T A p . l . c .
32 Investments in subsidiaries
Bank
Name of company Nature of businessEquity
interest 2017 2016
% €000 €000
HSBC Life Assurance (Malta) Limited Life insurance 99.99 28,578 28,578HSBC Global Asset Management
(Malta) Limited Portfolio management services 99.99 2,281 2,281
30,859 30,859
In November 2016, HSBC Global Asset Management (Malta) Limited reduced its ordinary share capital to a level that better reflects the regulatory capital required to support the current level of operations and risks undertaken.
During 2016, the voluntary winding up of HSBC Stockbrokers (Malta) Limited was completed.
Additionally, during the year ended 31 December 2016 HSBC Insurance Management Services (Europe) Limited merged with HSBC Life Assurance (Malta) Limited, its immediate parent company.
All subsidiaries are incorporated in Malta.
33 Investment property
Fair Value Cost Fair Value Cost
2017 2017 2016 2016
€000 €000 €000 €000GroupFreehold land and buildingsAs at 1 January 13,026 9,189 15,458 10,503 Additions 27 27 35 35 Disposals – (1,945) (1,349)Fair value adjustments (2,453) – (522) –
At 31 December 10,600 9,216 13,026 9,189
BankFreehold land and buildingsAs at 1 January 10,180 6,728 10,876 6,707 Additions – – 21 21 Fair value adjustments (2,680) – (717) –
At 31 December 7,500 6,728 10,180 6,728
During the year ended 31 December 2017, €856,000 (2016: €907,000) was recognised as rental income in profit or loss relating to investment property for the local group. The bank recognised €834,000 (2016: €807,000) as rental income which was received from a Group company. Related repair and maintenance expenses incurred by the local group and the bank on these properties are reimbursed by the tenant.
Fair values are determined by professional valuers who apply recognised valuation techniques. The bank has in place set benchmarks to ensure that these valuers hold the necessary recognised and relevant professional qualifications as well as the knowledge and experience depending on the location and category of the investment property being valued.
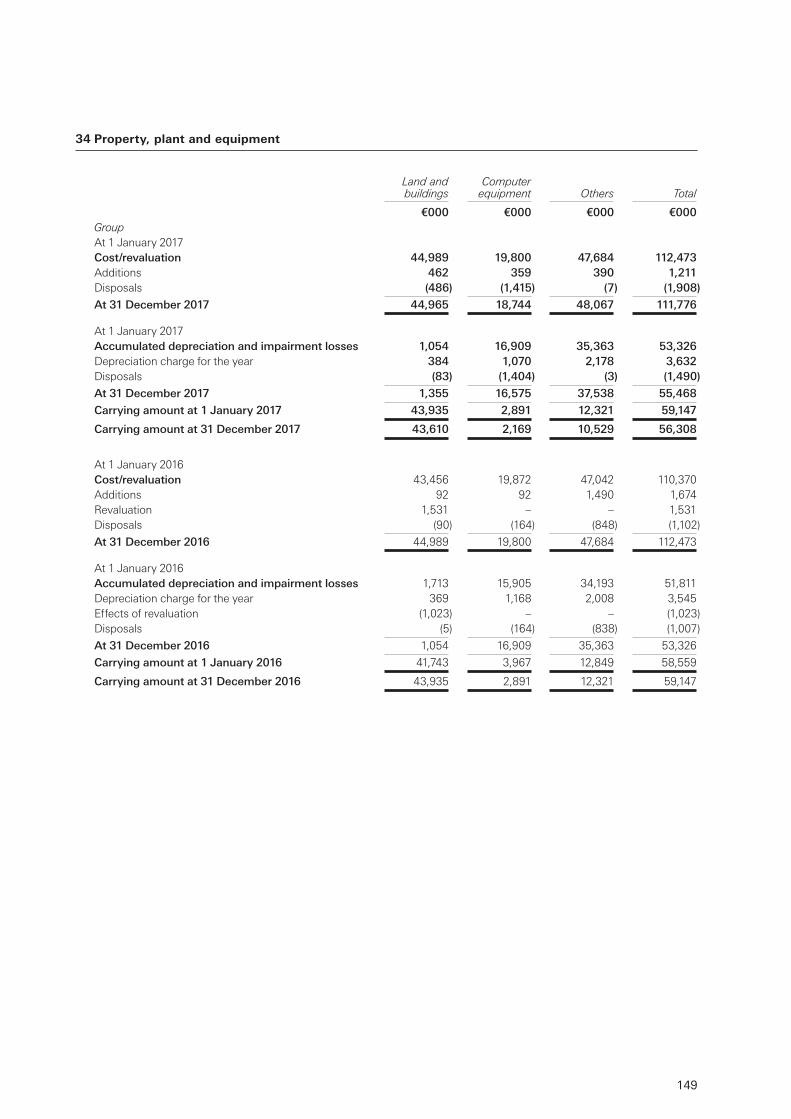
149
34 Property, plant and equipment
Land and buildings
Computer equipment Others Total
€000 €000 €000 €000GroupAt 1 January 2017Cost/revaluation 44,989 19,800 47,684 112,473 Additions 462 359 390 1,211 Disposals (486) (1,415) (7) (1,908)
At 31 December 2017 44,965 18,744 48,067 111,776
At 1 January 2017Accumulated depreciation and impairment losses 1,054 16,909 35,363 53,326 Depreciation charge for the year 384 1,070 2,178 3,632 Disposals (83) (1,404) (3) (1,490)
At 31 December 2017 1,355 16,575 37,538 55,468
Carrying amount at 1 January 2017 43,935 2,891 12,321 59,147
Carrying amount at 31 December 2017 43,610 2,169 10,529 56,308
At 1 January 2016Cost/revaluation 43,456 19,872 47,042 110,370 Additions 92 92 1,490 1,674 Revaluation 1,531 – – 1,531 Disposals (90) (164) (848) (1,102)
At 31 December 2016 44,989 19,800 47,684 112,473
At 1 January 2016Accumulated depreciation and impairment losses 1,713 15,905 34,193 51,811 Depreciation charge for the year 369 1,168 2,008 3,545 Effects of revaluation (1,023) – – (1,023) Disposals (5) (164) (838) (1,007)
At 31 December 2016 1,054 16,909 35,363 53,326
Carrying amount at 1 January 2016 41,743 3,967 12,849 58,559
Carrying amount at 31 December 2016 43,935 2,891 12,321 59,147
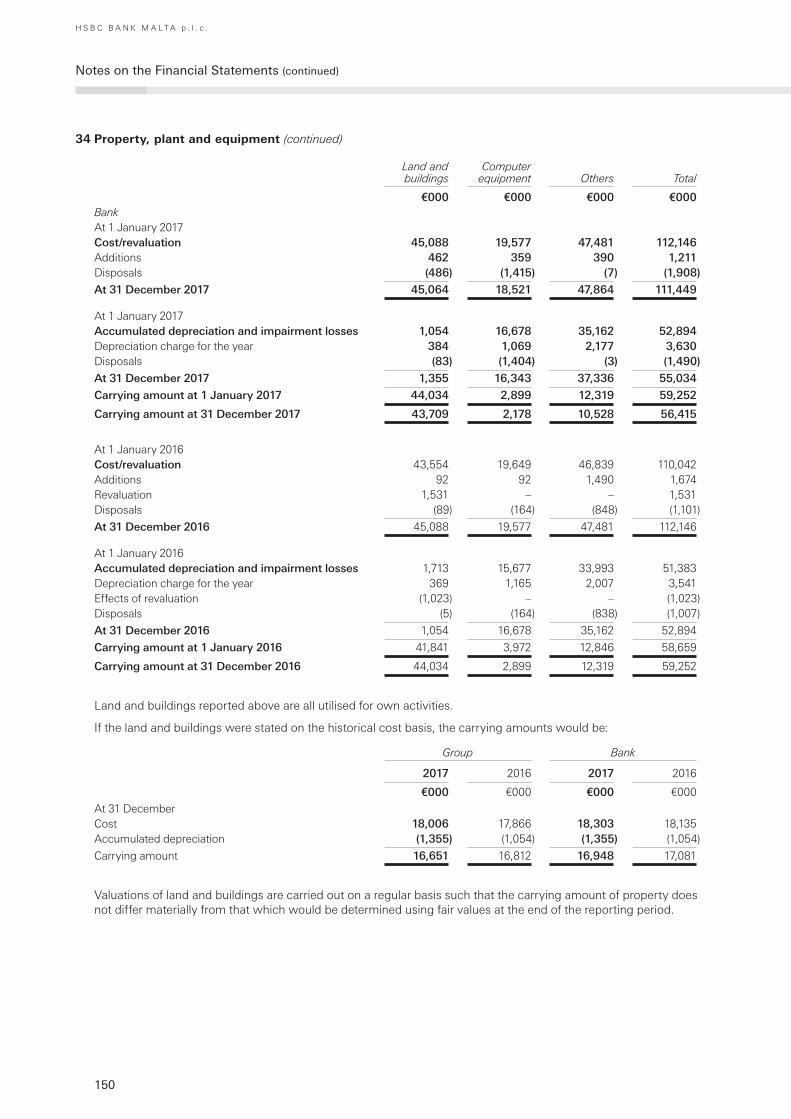
150
Notes on the Financial Statements (continued)
H S B C B A N K M A L T A p . l . c .
34 Property, plant and equipment (continued)
Land and buildings
Computer equipment Others Total
€000 €000 €000 €000BankAt 1 January 2017Cost/revaluation 45,088 19,577 47,481 112,146 Additions 462 359 390 1,211 Disposals (486) (1,415) (7) (1,908)
At 31 December 2017 45,064 18,521 47,864 111,449
At 1 January 2017Accumulated depreciation and impairment losses 1,054 16,678 35,162 52,894 Depreciation charge for the year 384 1,069 2,177 3,630 Disposals (83) (1,404) (3) (1,490)
At 31 December 2017 1,355 16,343 37,336 55,034
Carrying amount at 1 January 2017 44,034 2,899 12,319 59,252
Carrying amount at 31 December 2017 43,709 2,178 10,528 56,415
At 1 January 2016Cost/revaluation 43,554 19,649 46,839 110,042 Additions 92 92 1,490 1,674 Revaluation 1,531 – – 1,531Disposals (89) (164) (848) (1,101)
At 31 December 2016 45,088 19,577 47,481 112,146
At 1 January 2016Accumulated depreciation and impairment losses 1,713 15,677 33,993 51,383 Depreciation charge for the year 369 1,165 2,007 3,541 Effects of revaluation (1,023) – – (1,023) Disposals (5) (164) (838) (1,007)
At 31 December 2016 1,054 16,678 35,162 52,894
Carrying amount at 1 January 2016 41,841 3,972 12,846 58,659
Carrying amount at 31 December 2016 44,034 2,899 12,319 59,252
Land and buildings reported above are all utilised for own activities.
If the land and buildings were stated on the historical cost basis, the carrying amounts would be:
Group Bank
2017 2016 2017 2016
€000 €000 €000 €000
At 31 December Cost 18,006 17,866 18,303 18,135Accumulated depreciation (1,355) (1,054) (1,355) (1,054)
Carrying amount 16,651 16,812 16,948 17,081
Valuations of land and buildings are carried out on a regular basis such that the carrying amount of property does not differ materially from that which would be determined using fair values at the end of the reporting period.
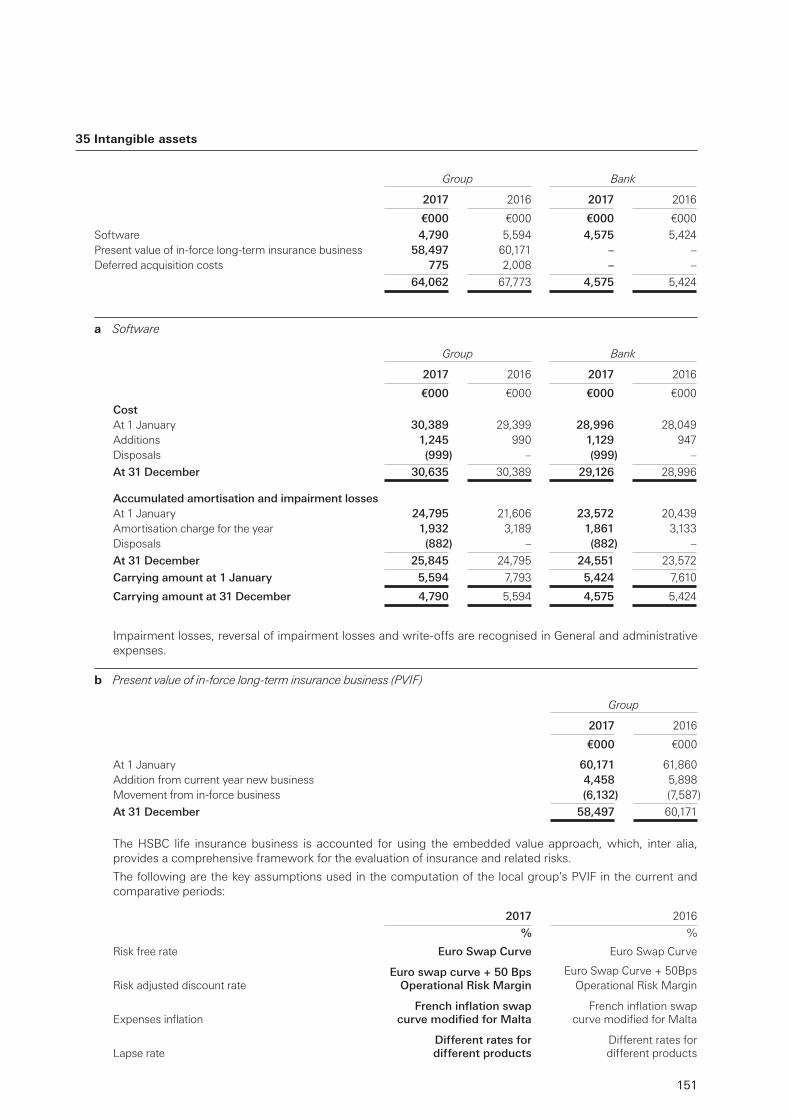
151
35 Intangible assets
Group Bank
2017 2016 2017 2016
€000 €000 €000 €000
Software 4,790 5,594 4,575 5,424 Present value of in-force long-term insurance business 58,497 60,171 – –Deferred acquisition costs 775 2,008 – –
64,062 67,773 4,575 5,424
a Software
Group Bank
2017 2016 2017 2016
€000 €000 €000 €000
CostAt 1 January 30,389 29,399 28,996 28,049 Additions 1,245 990 1,129 947 Disposals (999) – (999) –
At 31 December 30,635 30,389 29,126 28,996
Accumulated amortisation and impairment lossesAt 1 January 24,795 21,606 23,572 20,439 Amortisation charge for the year 1,932 3,189 1,861 3,133 Disposals (882) – (882) –
At 31 December 25,845 24,795 24,551 23,572
Carrying amount at 1 January 5,594 7,793 5,424 7,610
Carrying amount at 31 December 4,790 5,594 4,575 5,424
Impairment losses, reversal of impairment losses and write-offs are recognised in General and administrative expenses.
b Present value of in-force long-term insurance business (PVIF)
Group
2017 2016
€000 €000
At 1 January 60,171 61,860 Addition from current year new business 4,458 5,898 Movement from in-force business (6,132) (7,587)
At 31 December 58,497 60,171
The HSBC life insurance business is accounted for using the embedded value approach, which, inter alia, provides a comprehensive framework for the evaluation of insurance and related risks.
The following are the key assumptions used in the computation of the local group’s PVIF in the current and comparative periods:
2017 2016
% %
Risk free rate Euro Swap Curve Euro Swap Curve
Risk adjusted discount rateEuro swap curve + 50 Bps
Operational Risk MarginEuro Swap Curve + 50Bps
Operational Risk Margin
Expenses inflation French inflation swap
curve modified for MaltaFrench inflation swap
curve modified for Malta
Lapse rate Different rates for different products
Different rates for different products
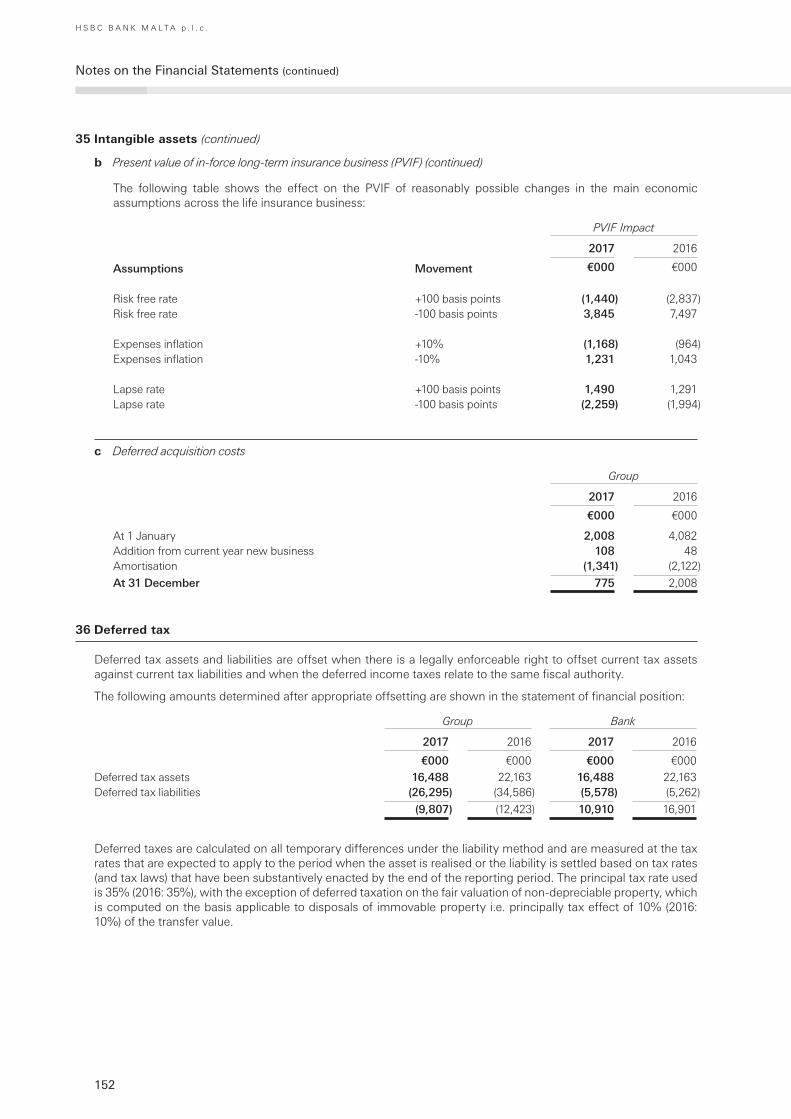
152
Notes on the Financial Statements (continued)
H S B C B A N K M A L T A p . l . c .
35 Intangible assets (continued)
b Present value of in-force long-term insurance business (PVIF) (continued)
The following table shows the effect on the PVIF of reasonably possible changes in the main economic assumptions across the life insurance business:
PVIF Impact
2017 2016
Assumptions Movement €000 €000
Risk free rate +100 basis points (1,440) (2,837)Risk free rate -100 basis points 3,845 7,497
Expenses inflation +10% (1,168) (964)Expenses inflation -10% 1,231 1,043
Lapse rate +100 basis points 1,490 1,291Lapse rate -100 basis points (2,259) (1,994)
c Deferred acquisition costs
Group
2017 2016
€000 €000
At 1 January 2,008 4,082Addition from current year new business 108 48 Amortisation (1,341) (2,122)
At 31 December 775 2,008
36 Deferred tax
Deferred tax assets and liabilities are offset when there is a legally enforceable right to offset current tax assets against current tax liabilities and when the deferred income taxes relate to the same fiscal authority.
The following amounts determined after appropriate offsetting are shown in the statement of financial position:
Group Bank
2017 2016 2017 2016
€000 €000 €000 €000
Deferred tax assets 16,488 22,163 16,488 22,163 Deferred tax liabilities (26,295) (34,586) (5,578) (5,262)
(9,807) (12,423) 10,910 16,901
Deferred taxes are calculated on all temporary differences under the liability method and are measured at the tax rates that are expected to apply to the period when the asset is realised or the liability is settled based on tax rates (and tax laws) that have been substantively enacted by the end of the reporting period. The principal tax rate used is 35% (2016: 35%), with the exception of deferred taxation on the fair valuation of non-depreciable property, which is computed on the basis applicable to disposals of immovable property i.e. principally tax effect of 10% (2016: 10%) of the transfer value.
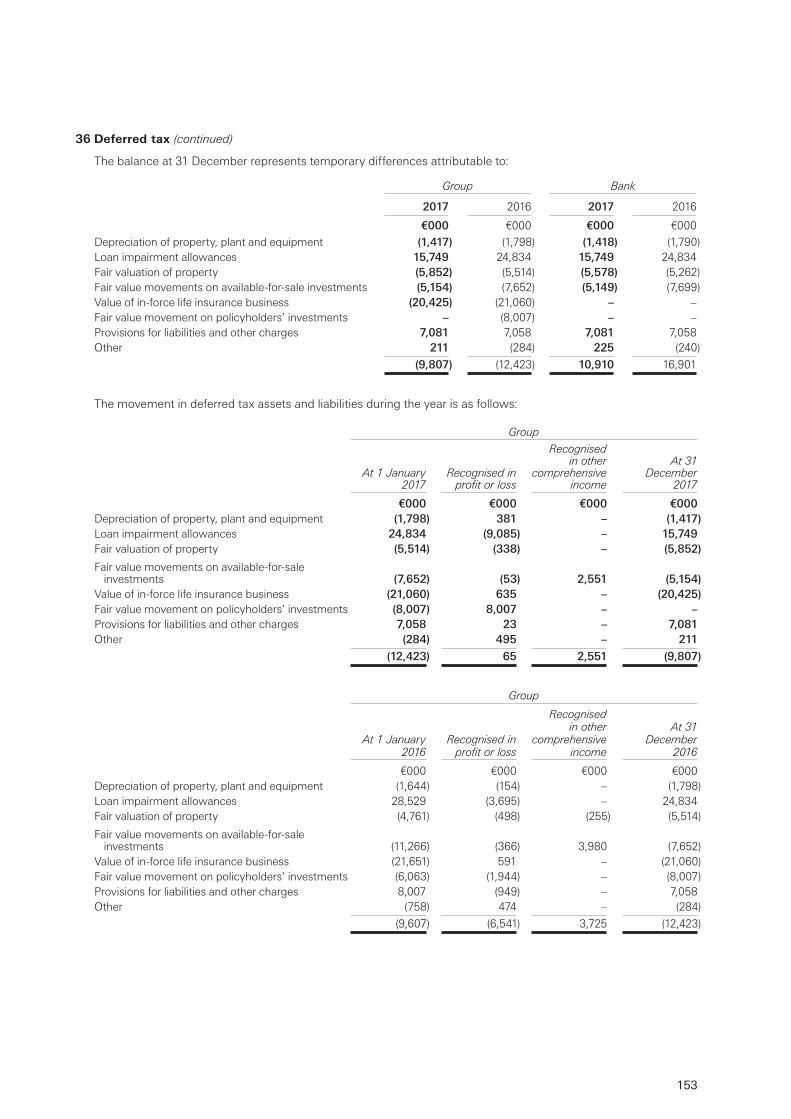
153
36 Deferred tax (continued)
The balance at 31 December represents temporary differences attributable to:
Group Bank
2017 2016 2017 2016
€000 €000 €000 €000
Depreciation of property, plant and equipment (1,417) (1,798) (1,418) (1,790)Loan impairment allowances 15,749 24,834 15,749 24,834 Fair valuation of property (5,852) (5,514) (5,578) (5,262)Fair value movements on available-for-sale investments (5,154) (7,652) (5,149) (7,699)Value of in-force life insurance business (20,425) (21,060) – – Fair value movement on policyholders’ investments – (8,007) – – Provisions for liabilities and other charges 7,081 7,058 7,081 7,058 Other 211 (284) 225 (240)
(9,807) (12,423) 10,910 16,901
The movement in deferred tax assets and liabilities during the year is as follows:
Group
At 1 January 2017
Recognised in profit or loss
Recognised in other
comprehensive income
At 31 December
2017
€000 €000 €000 €000Depreciation of property, plant and equipment (1,798) 381 – (1,417) Loan impairment allowances 24,834 (9,085) – 15,749 Fair valuation of property (5,514) (338) – (5,852)
Fair value movements on available-for-sale investments (7,652) (53) 2,551 (5,154)
Value of in-force life insurance business (21,060) 635 – (20,425) Fair value movement on policyholders’ investments (8,007) 8,007 – –Provisions for liabilities and other charges 7,058 23 – 7,081 Other (284) 495 – 211
(12,423) 65 2,551 (9,807)
Group
At 1 January 2016
Recognised in profit or loss
Recognised in other
comprehensive income
At 31 December
2016
€000 €000 €000 €000Depreciation of property, plant and equipment (1,644) (154) – (1,798)Loan impairment allowances 28,529 (3,695) – 24,834 Fair valuation of property (4,761) (498) (255) (5,514)
Fair value movements on available-for-sale investments (11,266) (366) 3,980 (7,652)
Value of in-force life insurance business (21,651) 591 – (21,060)Fair value movement on policyholders’ investments (6,063) (1,944) – (8,007)Provisions for liabilities and other charges 8,007 (949) – 7,058 Other (758) 474 – (284)
(9,607) (6,541) 3,725 (12,423)
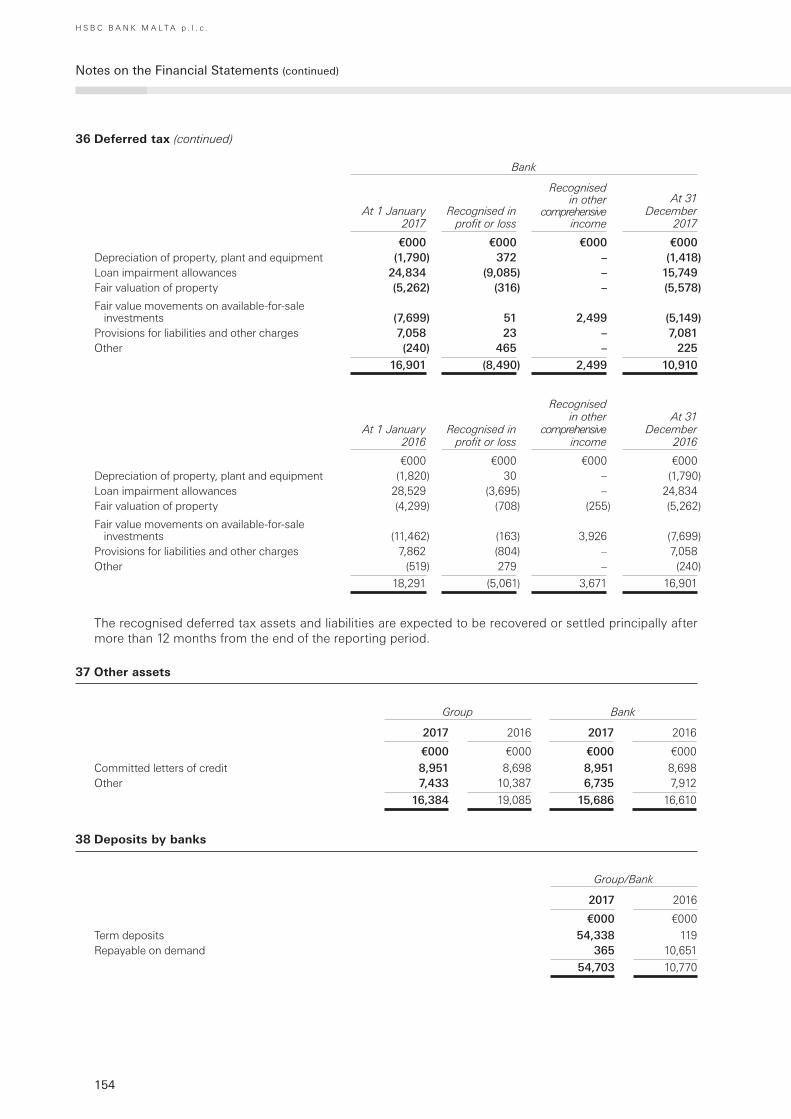
154
Notes on the Financial Statements (continued)
H S B C B A N K M A L T A p . l . c .
36 Deferred tax (continued)
Bank
At 1 January 2017
Recognised in profit or loss
Recognised in other
comprehensive income
At 31 December
2017
€000 €000 €000 €000Depreciation of property, plant and equipment (1,790) 372 – (1,418) Loan impairment allowances 24,834 (9,085) – 15,749 Fair valuation of property (5,262) (316) – (5,578)
Fair value movements on available-for-sale investments (7,699) 51 2,499 (5,149)
Provisions for liabilities and other charges 7,058 23 – 7,081 Other (240) 465 – 225
16,901 (8,490) 2,499 10,910
At 1 January 2016
Recognised in profit or loss
Recognised in other
comprehensive income
At 31 December
2016
€000 €000 €000 €000Depreciation of property, plant and equipment (1,820) 30 – (1,790)Loan impairment allowances 28,529 (3,695) – 24,834 Fair valuation of property (4,299) (708) (255) (5,262)
Fair value movements on available-for-sale investments (11,462) (163) 3,926 (7,699)
Provisions for liabilities and other charges 7,862 (804) – 7,058 Other (519) 279 – (240)
18,291 (5,061) 3,671 16,901
The recognised deferred tax assets and liabilities are expected to be recovered or settled principally after more than 12 months from the end of the reporting period.
37 Other assets
Group Bank
2017 2016 2017 2016
€000 €000 €000 €000
Committed letters of credit 8,951 8,698 8,951 8,698 Other 7,433 10,387 6,735 7,912
16,384 19,085 15,686 16,610
38 Deposits by banks
Group/Bank
2017 2016
€000 €000
Term deposits 54,338 119 Repayable on demand 365 10,651
54,703 10,770

155
39 Customer accounts
Group Bank
2017 2016 2017 2016
€000 €000 €000 €000
Term deposits 1,206,422 1,280,325 1,206,422 1,280,325 Repayable on demand 3,559,573 3,720,511 3,644,509 3,780,520
4,765,995 5,000,836 4,850,931 5,060,845
40 Accruals and deferred income
Group Bank
2017 2016 2017 2016
€000 €000 €000 €000
Accrued interest 4,324 5,538 4,071 5,265 Accrued expenses 13,251 11,322 10,969 9,288Deferred income 263 311 263 311
17,838 17,171 15,303 14,864
41 Liabilities under investment contracts
Group
2017 2016
€000 €000
At 1 January 930,937 987,008 Transfers to Liabilities attributable to disposal group held for sale (Note 45) (495,479) –Premiums received 6,203 7,946 Amounts paid on surrender and other terminations during the year (272,915) (150,927) Changes in unit prices and other movements 34,390 86,910
At 31 December 203,136 930,937
42 Liabilities under insurance contracts
Group
Gross Gross
2017 2016
€000 €000
Life insurance (non-linked)Provisions for policyholders 432,201 436,897Outstanding claims 3,334 3,074
Total non-linked 435,535 439,971
Life insurance (linked)Provisions for policyholders 222,767 205,140Outstanding claims 490 450
Total linked 223,257 205,590
Total liabilities under insurance contracts 658,792 645,561
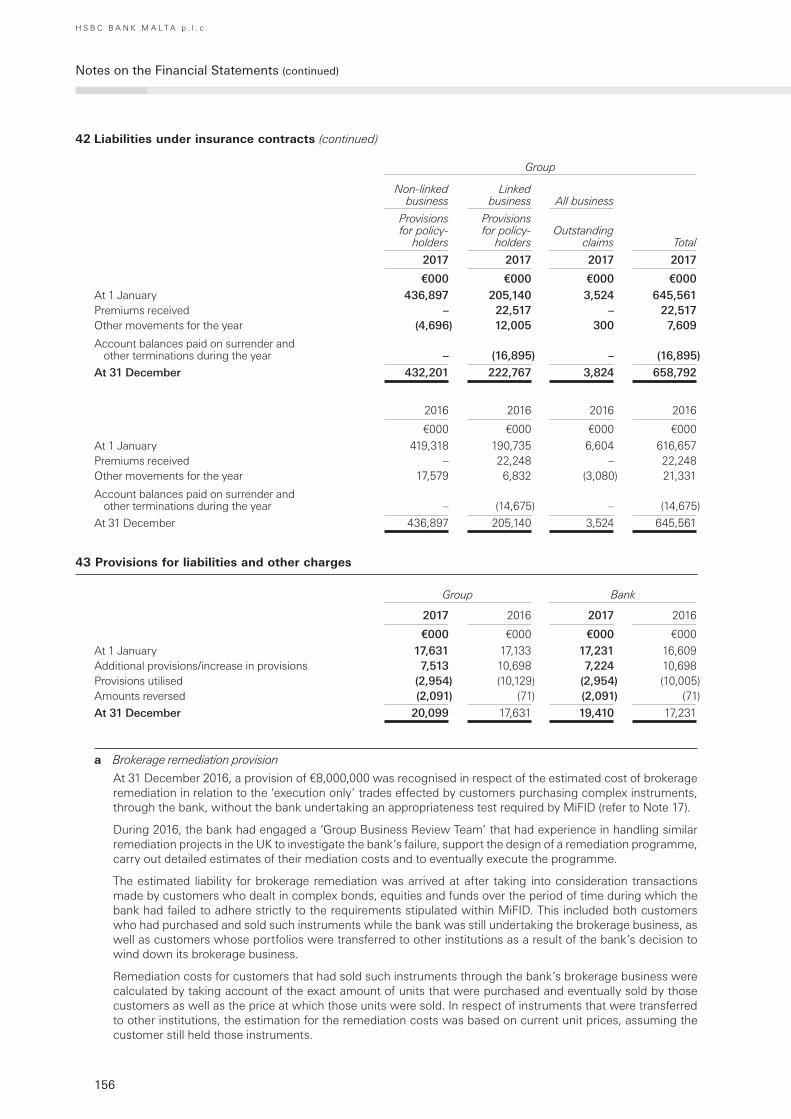
156
Notes on the Financial Statements (continued)
H S B C B A N K M A L T A p . l . c .
42 Liabilities under insurance contracts (continued)
Group
Non-linked business
Linked business All business
Provisions for policy-
holders
Provisions for policy-
holdersOutstanding
claims Total
2017 2017 2017 2017
€000 €000 €000 €000At 1 January 436,897 205,140 3,524 645,561Premiums received – 22,517 – 22,517Other movements for the year (4,696) 12,005 300 7,609
Account balances paid on surrender and other terminations during the year – (16,895) – (16,895)
At 31 December 432,201 222,767 3,824 658,792
2016 2016 2016 2016
€000 €000 €000 €000
At 1 January 419,318 190,735 6,604 616,657Premiums received – 22,248 – 22,248Other movements for the year 17,579 6,832 (3,080) 21,331
Account balances paid on surrender and other terminations during the year – (14,675) – (14,675)
At 31 December 436,897 205,140 3,524 645,561
43 Provisions for liabilities and other charges
Group Bank
2017 2016 2017 2016
€000 €000 €000 €000
At 1 January 17,631 17,133 17,231 16,609 Additional provisions/increase in provisions 7,513 10,698 7,224 10,698 Provisions utilised (2,954) (10,129) (2,954) (10,005)Amounts reversed (2,091) (71) (2,091) (71)
At 31 December 20,099 17,631 19,410 17,231
a Brokerage remediation provision
At 31 December 2016, a provision of €8,000,000 was recognised in respect of the estimated cost of brokerage remediation in relation to the ‘execution only’ trades effected by customers purchasing complex instruments, through the bank, without the bank undertaking an appropriateness test required by MiFID (refer to Note 17).
During 2016, the bank had engaged a ‘Group Business Review Team’ that had experience in handling similar remediation projects in the UK to investigate the bank’s failure, support the design of a remediation programme, carry out detailed estimates of their mediation costs and to eventually execute the programme.
The estimated liability for brokerage remediation was arrived at after taking into consideration transactions made by customers who dealt in complex bonds, equities and funds over the period of time during which the bank had failed to adhere strictly to the requirements stipulated within MiFID. This included both customers who had purchased and sold such instruments while the bank was still undertaking the brokerage business, as well as customers whose portfolios were transferred to other institutions as a result of the bank’s decision to wind down its brokerage business.
Remediation costs for customers that had sold such instruments through the bank’s brokerage business were calculated by taking account of the exact amount of units that were purchased and eventually sold by those customers as well as the price at which those units were sold. In respect of instruments that were transferred to other institutions, the estimation for the remediation costs was based on current unit prices, assuming the customer still held those instruments.
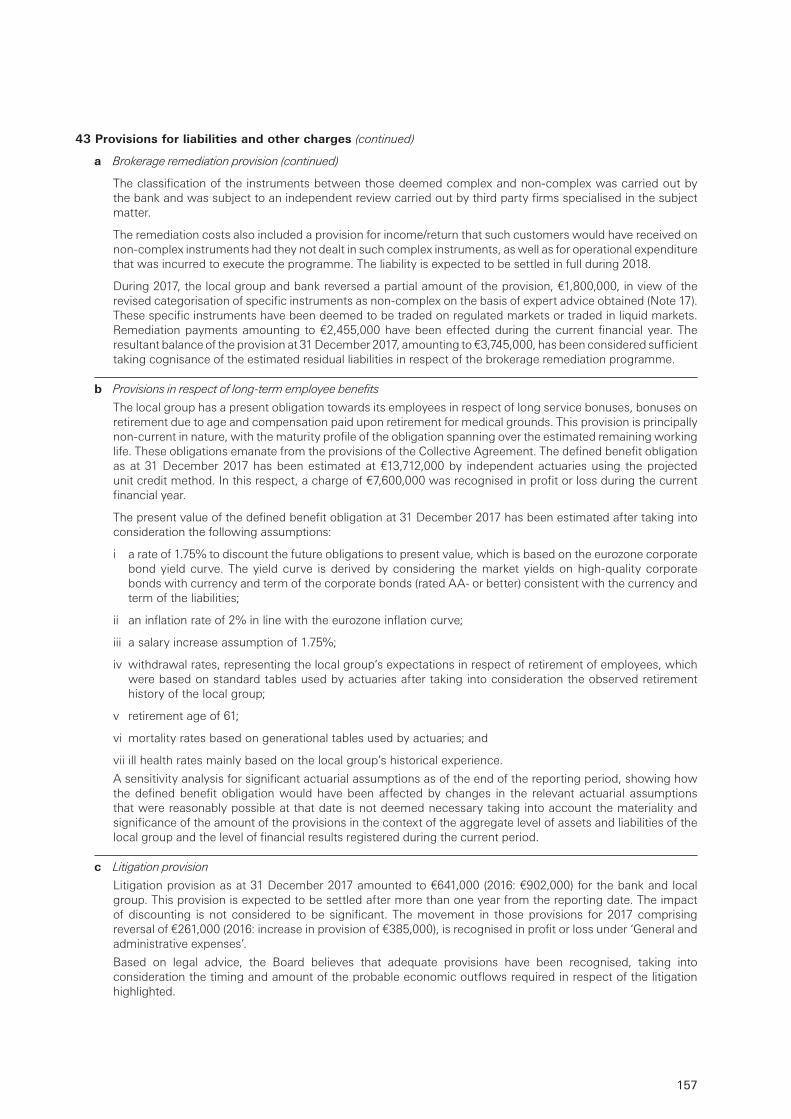
157
43 Provisions for liabilities and other charges (continued)
a Brokerage remediation provision (continued)
The classification of the instruments between those deemed complex and non-complex was carried out by the bank and was subject to an independent review carried out by third party firms specialised in the subject matter.
The remediation costs also included a provision for income/return that such customers would have received on non-complex instruments had they not dealt in such complex instruments, as well as for operational expenditure that was incurred to execute the programme. The liability is expected to be settled in full during 2018.
During 2017, the local group and bank reversed a partial amount of the provision, €1,800,000, in view of the revised categorisation of specific instruments as non-complex on the basis of expert advice obtained (Note 17). These specific instruments have been deemed to be traded on regulated markets or traded in liquid markets. Remediation payments amounting to €2,455,000 have been effected during the current financial year. The resultant balance of the provision at 31 December 2017, amounting to €3,745,000, has been considered sufficient taking cognisance of the estimated residual liabilities in respect of the brokerage remediation programme.
b Provisions in respect of long-term employee benefits
The local group has a present obligation towards its employees in respect of long service bonuses, bonuses on retirement due to age and compensation paid upon retirement for medical grounds. This provision is principally non-current in nature, with the maturity profile of the obligation spanning over the estimated remaining working life. These obligations emanate from the provisions of the Collective Agreement. The defined benefit obligation as at 31 December 2017 has been estimated at €13,712,000 by independent actuaries using the projected unit credit method. In this respect, a charge of €7,600,000 was recognised in profit or loss during the current financial year.
The present value of the defined benefit obligation at 31 December 2017 has been estimated after taking into consideration the following assumptions:
i a rate of 1.75% to discount the future obligations to present value, which is based on the eurozone corporate bond yield curve. The yield curve is derived by considering the market yields on high-quality corporate bonds with currency and term of the corporate bonds (rated AA- or better) consistent with the currency and term of the liabilities;
ii an inflation rate of 2% in line with the eurozone inflation curve;
iii a salary increase assumption of 1.75%;
iv withdrawal rates, representing the local group’s expectations in respect of retirement of employees, which were based on standard tables used by actuaries after taking into consideration the observed retirement history of the local group;
v retirement age of 61;
vi mortality rates based on generational tables used by actuaries; and
vii ill health rates mainly based on the local group’s historical experience.
A sensitivity analysis for significant actuarial assumptions as of the end of the reporting period, showing how the defined benefit obligation would have been affected by changes in the relevant actuarial assumptions that were reasonably possible at that date is not deemed necessary taking into account the materiality and significance of the amount of the provisions in the context of the aggregate level of assets and liabilities of the local group and the level of financial results registered during the current period.
c Litigation provision
Litigation provision as at 31 December 2017 amounted to €641,000 (2016: €902,000) for the bank and local group. This provision is expected to be settled after more than one year from the reporting date. The impact of discounting is not considered to be significant. The movement in those provisions for 2017 comprising reversal of €261,000 (2016: increase in provision of €385,000), is recognised in profit or loss under ‘General and administrative expenses’.
Based on legal advice, the Board believes that adequate provisions have been recognised, taking into consideration the timing and amount of the probable economic outflows required in respect of the litigation highlighted.
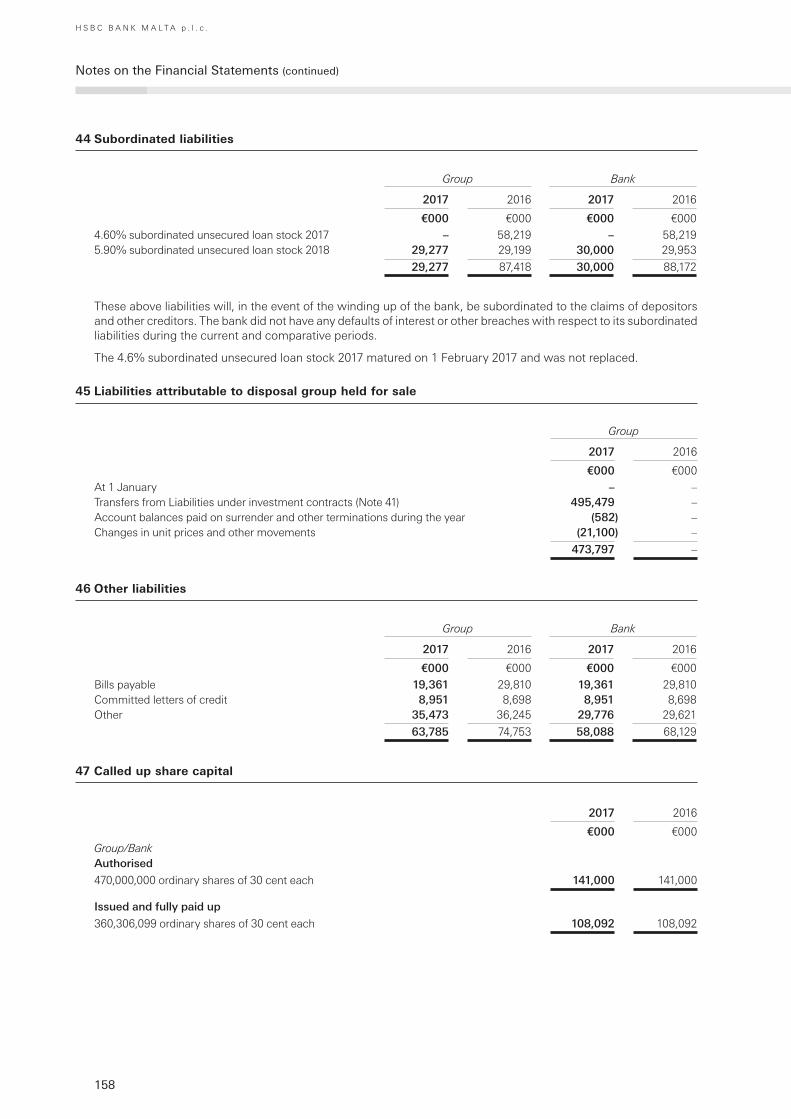
158
Notes on the Financial Statements (continued)
H S B C B A N K M A L T A p . l . c .
44 Subordinated liabilities
Group Bank
2017 2016 2017 2016
€000 €000 €000 €000
4.60% subordinated unsecured loan stock 2017 – 58,219 – 58,219 5.90% subordinated unsecured loan stock 2018 29,277 29,199 30,000 29,953
29,277 87,418 30,000 88,172
These above liabilities will, in the event of the winding up of the bank, be subordinated to the claims of depositors and other creditors. The bank did not have any defaults of interest or other breaches with respect to its subordinated liabilities during the current and comparative periods.
The 4.6% subordinated unsecured loan stock 2017 matured on 1 February 2017 and was not replaced.
45 Liabilities attributable to disposal group held for sale
Group
2017 2016
€000 €000
At 1 January – –Transfers from Liabilities under investment contracts (Note 41) 495,479 –Account balances paid on surrender and other terminations during the year (582) –Changes in unit prices and other movements (21,100) –
473,797 –
46 Other liabilities
Group Bank
2017 2016 2017 2016
€000 €000 €000 €000
Bills payable 19,361 29,810 19,361 29,810 Committed letters of credit 8,951 8,698 8,951 8,698 Other 35,473 36,245 29,776 29,621
63,785 74,753 58,088 68,129
47 Called up share capital
2017 2016
€000 €000
Group/BankAuthorised
470,000,000 ordinary shares of 30 cent each 141,000 141,000
Issued and fully paid up
360,306,099 ordinary shares of 30 cent each 108,092 108,092
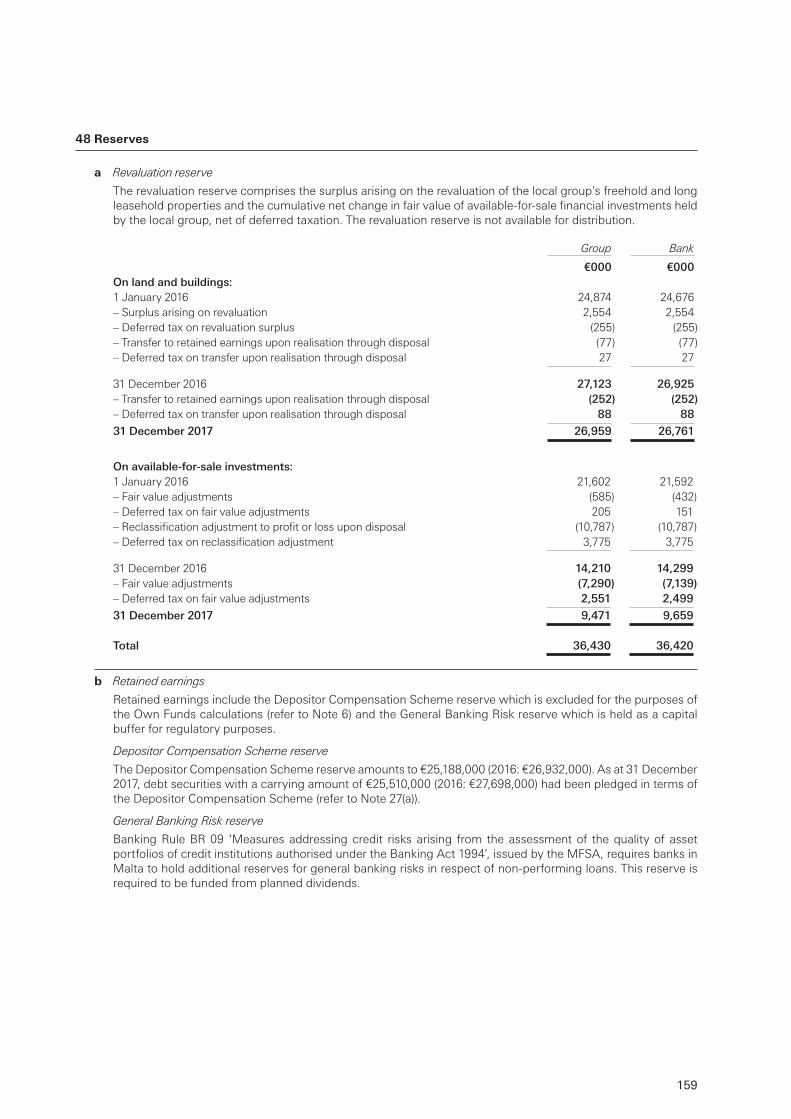
159
48 Reserves
a Revaluation reserve
The revaluation reserve comprises the surplus arising on the revaluation of the local group’s freehold and long leasehold properties and the cumulative net change in fair value of available-for-sale financial investments held by the local group, net of deferred taxation. The revaluation reserve is not available for distribution.
Group Bank
€000 €000On land and buildings:1 January 2016 24,874 24,676 – Surplus arising on revaluation 2,554 2,554 – Deferred tax on revaluation surplus (255) (255)– Transfer to retained earnings upon realisation through disposal (77) (77)– Deferred tax on transfer upon realisation through disposal 27 27
31 December 2016 27,123 26,925 – Transfer to retained earnings upon realisation through disposal (252) (252)– Deferred tax on transfer upon realisation through disposal 88 88
31 December 2017 26,959 26,761
On available-for-sale investments:1 January 2016 21,602 21,592 – Fair value adjustments (585) (432)– Deferred tax on fair value adjustments 205 151 – Reclassification adjustment to profit or loss upon disposal (10,787) (10,787)– Deferred tax on reclassification adjustment 3,775 3,775
31 December 2016 14,210 14,299 – Fair value adjustments (7,290) (7,139)– Deferred tax on fair value adjustments 2,551 2,499
31 December 2017 9,471 9,659
Total 36,430 36,420
b Retained earnings
Retained earnings include the Depositor Compensation Scheme reserve which is excluded for the purposes of the Own Funds calculations (refer to Note 6) and the General Banking Risk reserve which is held as a capital buffer for regulatory purposes.
Depositor Compensation Scheme reserve
The Depositor Compensation Scheme reserve amounts to €25,188,000 (2016: €26,932,000). As at 31 December 2017, debt securities with a carrying amount of €25,510,000 (2016: €27,698,000) had been pledged in terms of the Depositor Compensation Scheme (refer to Note 27(a)).
General Banking Risk reserve
Banking Rule BR 09 ‘Measures addressing credit risks arising from the assessment of the quality of asset portfolios of credit institutions authorised under the Banking Act 1994’, issued by the MFSA, requires banks in Malta to hold additional reserves for general banking risks in respect of non-performing loans. This reserve is required to be funded from planned dividends.
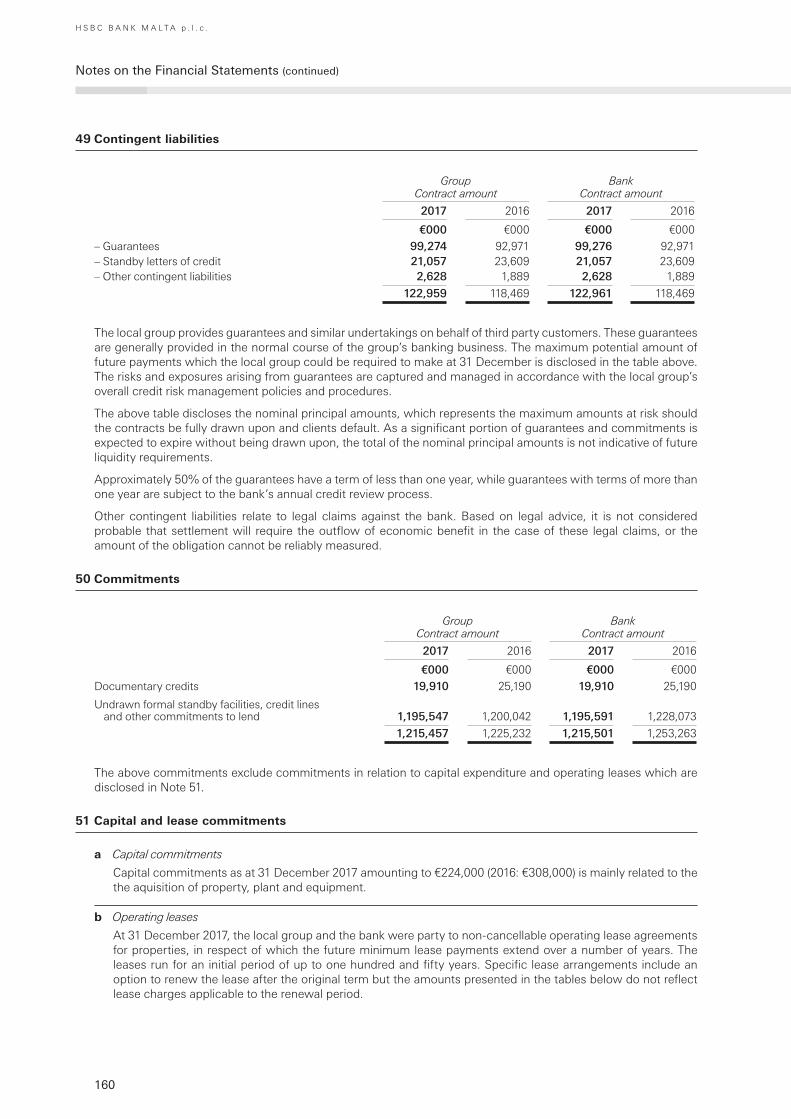
160
Notes on the Financial Statements (continued)
H S B C B A N K M A L T A p . l . c .
49 Contingent liabilities
Group Contract amount
Bank Contract amount
2017 2016 2017 2016
€000 €000 €000 €000
– Guarantees 99,274 92,971 99,276 92,971 – Standby letters of credit 21,057 23,609 21,057 23,609 – Other contingent liabilities 2,628 1,889 2,628 1,889
122,959 118,469 122,961 118,469
The local group provides guarantees and similar undertakings on behalf of third party customers. These guarantees are generally provided in the normal course of the group’s banking business. The maximum potential amount of future payments which the local group could be required to make at 31 December is disclosed in the table above. The risks and exposures arising from guarantees are captured and managed in accordance with the local group’s overall credit risk management policies and procedures.
The above table discloses the nominal principal amounts, which represents the maximum amounts at risk should the contracts be fully drawn upon and clients default. As a significant portion of guarantees and commitments is expected to expire without being drawn upon, the total of the nominal principal amounts is not indicative of future liquidity requirements.
Approximately 50% of the guarantees have a term of less than one year, while guarantees with terms of more than one year are subject to the bank’s annual credit review process.
Other contingent liabilities relate to legal claims against the bank. Based on legal advice, it is not considered probable that settlement will require the outflow of economic benefit in the case of these legal claims, or the amount of the obligation cannot be reliably measured.
50 Commitments
Group Contract amount
Bank Contract amount
2017 2016 2017 2016
€000 €000 €000 €000
Documentary credits 19,910 25,190 19,910 25,190
Undrawn formal standby facilities, credit lines and other commitments to lend 1,195,547 1,200,042 1,195,591 1,228,073
1,215,457 1,225,232 1,215,501 1,253,263
The above commitments exclude commitments in relation to capital expenditure and operating leases which are disclosed in Note 51.
51 Capital and lease commitments
a Capital commitments
Capital commitments as at 31 December 2017 amounting to €224,000 (2016: €308,000) is mainly related to the the aquisition of property, plant and equipment.
b Operating leases
At 31 December 2017, the local group and the bank were party to non-cancellable operating lease agreements for properties, in respect of which the future minimum lease payments extend over a number of years. The leases run for an initial period of up to one hundred and fifty years. Specific lease arrangements include an option to renew the lease after the original term but the amounts presented in the tables below do not reflect lease charges applicable to the renewal period.
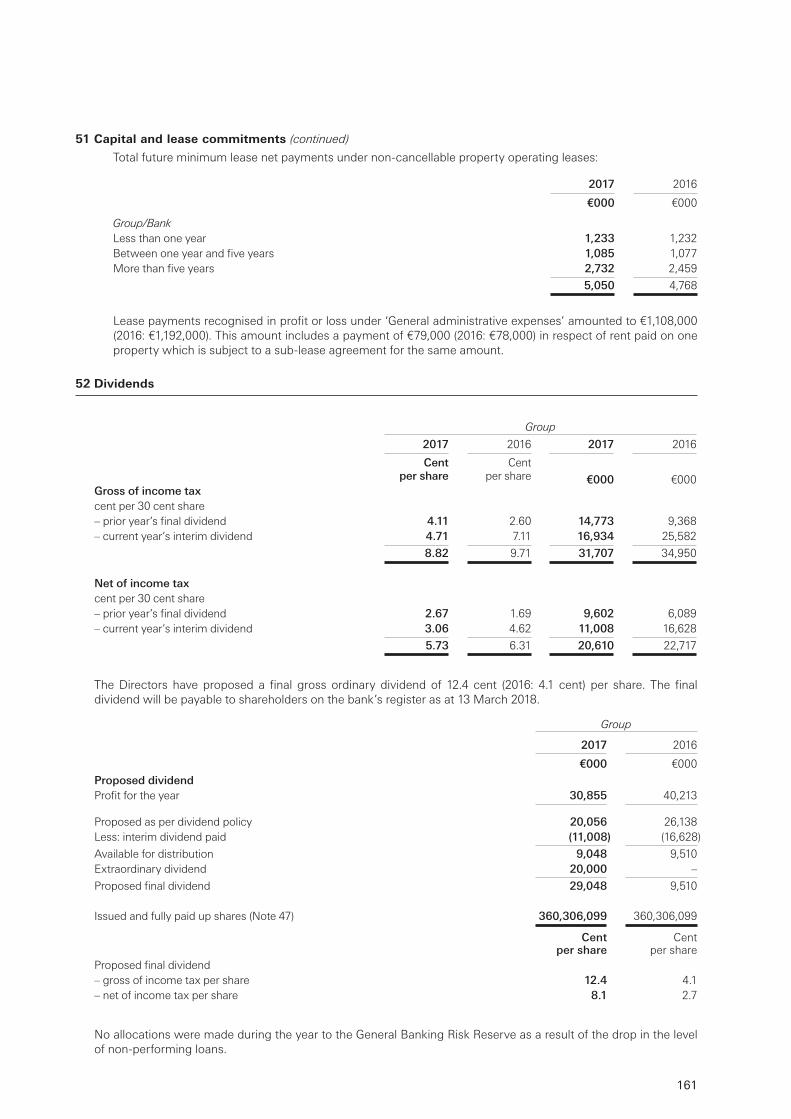
161
51 Capital and lease commitments (continued)
Total future minimum lease net payments under non-cancellable property operating leases:
2017 2016
€000 €000
Group/Bank Less than one year 1,233 1,232 Between one year and five years 1,085 1,077 More than five years 2,732 2,459
5,050 4,768
Lease payments recognised in profit or loss under ‘General administrative expenses’ amounted to €1,108,000 (2016: €1,192,000). This amount includes a payment of €79,000 (2016: €78,000) in respect of rent paid on one property which is subject to a sub-lease agreement for the same amount.
52 Dividends
Group
2017 2016 2017 2016
Cent per share
Cent per share €000 €000
Gross of income taxcent per 30 cent share– prior year’s final dividend 4.11 2.60 14,773 9,368 – current year’s interim dividend 4.71 7.11 16,934 25,582
8.82 9.71 31,707 34,950
Net of income taxcent per 30 cent share– prior year’s final dividend 2.67 1.69 9,602 6,089 – current year’s interim dividend 3.06 4.62 11,008 16,628
5.73 6.31 20,610 22,717
The Directors have proposed a final gross ordinary dividend of 12.4 cent (2016: 4.1 cent) per share. The final dividend will be payable to shareholders on the bank’s register as at 13 March 2018.
Group
2017 2016
€000 €000
Proposed dividendProfit for the year 30,855 40,213
Proposed as per dividend policy 20,056 26,138 Less: interim dividend paid (11,008) (16,628)
Available for distribution 9,048 9,510 Extraordinary dividend 20,000 –
Proposed final dividend 29,048 9,510
Issued and fully paid up shares (Note 47) 360,306,099 360,306,099
Cent per share
Cent per share
Proposed final dividend– gross of income tax per share 12.4 4.1 – net of income tax per share 8.1 2.7
No allocations were made during the year to the General Banking Risk Reserve as a result of the drop in the level of non-performing loans.
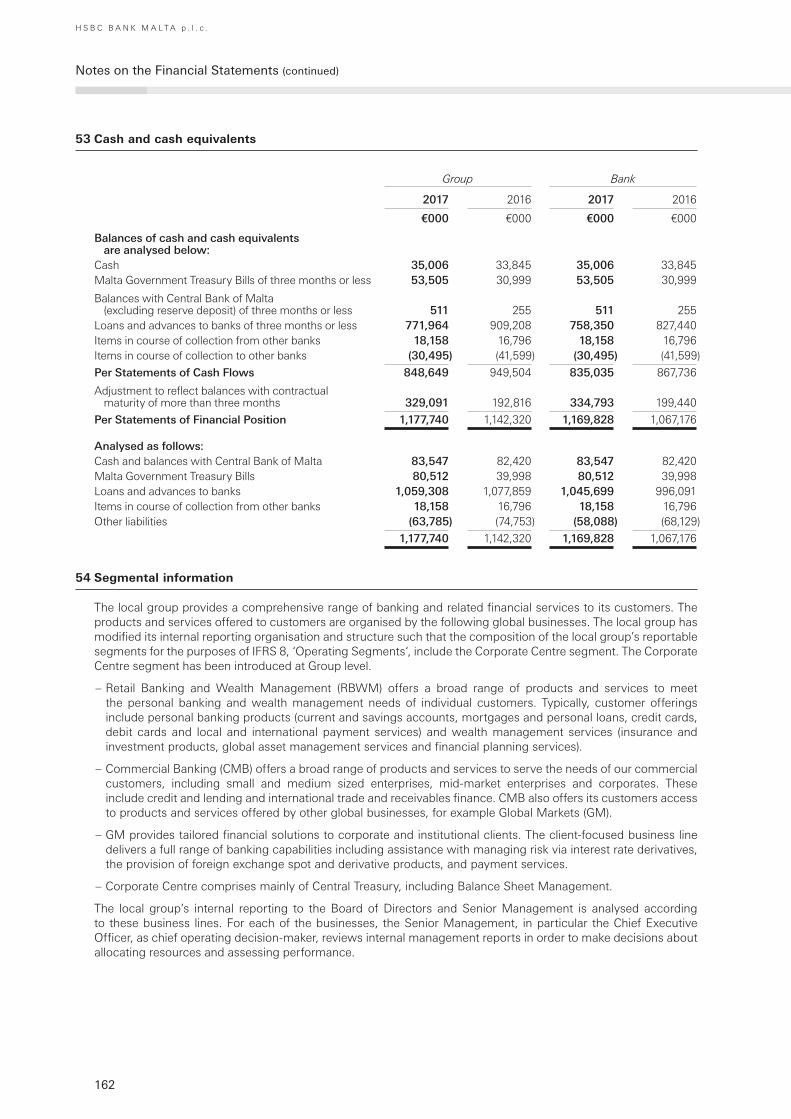
162
Notes on the Financial Statements (continued)
H S B C B A N K M A L T A p . l . c .
53 Cash and cash equivalents
Group Bank
2017 2016 2017 2016
€000 €000 €000 €000
Balances of cash and cash equivalents are analysed below:
Cash 35,006 33,845 35,006 33,845 Malta Government Treasury Bills of three months or less 53,505 30,999 53,505 30,999
Balances with Central Bank of Malta (excluding reserve deposit) of three months or less 511 255 511 255
Loans and advances to banks of three months or less 771,964 909,208 758,350 827,440 Items in course of collection from other banks 18,158 16,796 18,158 16,796 Items in course of collection to other banks (30,495) (41,599) (30,495) (41,599)
Per Statements of Cash Flows 848,649 949,504 835,035 867,736
Adjustment to reflect balances with contractual maturity of more than three months 329,091 192,816 334,793 199,440
Per Statements of Financial Position 1,177,740 1,142,320 1,169,828 1,067,176
Analysed as follows:Cash and balances with Central Bank of Malta 83,547 82,420 83,547 82,420 Malta Government Treasury Bills 80,512 39,998 80,512 39,998 Loans and advances to banks 1,059,308 1,077,859 1,045,699 996,091 Items in course of collection from other banks 18,158 16,796 18,158 16,796 Other liabilities (63,785) (74,753) (58,088) (68,129)
1,177,740 1,142,320 1,169,828 1,067,176
54 Segmental information
The local group provides a comprehensive range of banking and related financial services to its customers. The products and services offered to customers are organised by the following global businesses. The local group has modified its internal reporting organisation and structure such that the composition of the local group’s reportable segments for the purposes of IFRS 8, ‘Operating Segments‘, include the Corporate Centre segment. The Corporate Centre segment has been introduced at Group level.
– Retail Banking and Wealth Management (RBWM) offers a broad range of products and services to meet the personal banking and wealth management needs of individual customers. Typically, customer offerings include personal banking products (current and savings accounts, mortgages and personal loans, credit cards, debit cards and local and international payment services) and wealth management services (insurance and investment products, global asset management services and financial planning services).
– Commercial Banking (CMB) offers a broad range of products and services to serve the needs of our commercial customers, including small and medium sized enterprises, mid-market enterprises and corporates. These include credit and lending and international trade and receivables finance. CMB also offers its customers access to products and services offered by other global businesses, for example Global Markets (GM).
– GM provides tailored financial solutions to corporate and institutional clients. The client-focused business line delivers a full range of banking capabilities including assistance with managing risk via interest rate derivatives, the provision of foreign exchange spot and derivative products, and payment services.
– Corporate Centre comprises mainly of Central Treasury, including Balance Sheet Management.
The local group’s internal reporting to the Board of Directors and Senior Management is analysed according to these business lines. For each of the businesses, the Senior Management, in particular the Chief Executive Officer, as chief operating decision-maker, reviews internal management reports in order to make decisions about allocating resources and assessing performance.

163
54 Segmental information (continued)
The bank has restated the corresponding amounts and items of segment information for the prior financial period as reflected in the tables below.
The Board considers that global businesses represent the most appropriate information for the users of the financial statements to best evaluate the nature and financial effects of the business activities in which the local group engages, and the economic environments in which it operates. As a result, the local group’s operating segments are considered to be the global businesses.
Retail Banking
and Wealth Management
Commercial Banking
Global Markets
Corporate Centre Group Total
2017 2017 2017 2017 2017
€000 €000 €000 €000 €000GroupNet interest income– External 63,338 49,039 (22) 8,305 120,660– Internal 2,804 (6,013) (188) 3,397 –
66,142 43,026 (210) 11,702 120,660
Net non-interest income 28,573 8,996 2,660 – 40,229
Net operating income before loan impairment charges 94,715 52,022 2,450 11,702 160,889
Net reversal of loan impairment charges/ (net loan impairment charges) 2,494 (1,326) – – 1,168
Movement in provision for brokerage remediation costs 1,800 – – – 1,800
Net operating income 101,248 50,696 2,450 11,702 166,096
Employee compensation and benefits (40,466) (14,079) (898) (749) (56,192)
General and administrative expenses (36,364) (14,399) (727) (788) (52,278)Depreciation of property,
plant and equipment (2,476) (1,036) (50) (70) (3,632)
Amortisation of intangible assets (1,336) (534) (26) (36) (1,932)
Profit before tax 18,367 20,648 750 10,058 49,823
AssetsSegment total assets 3,576,285 1,116,437 5,312 2,099,949 6,797,983
Total equity 235,185 172,456 7,727 63,670 479,038
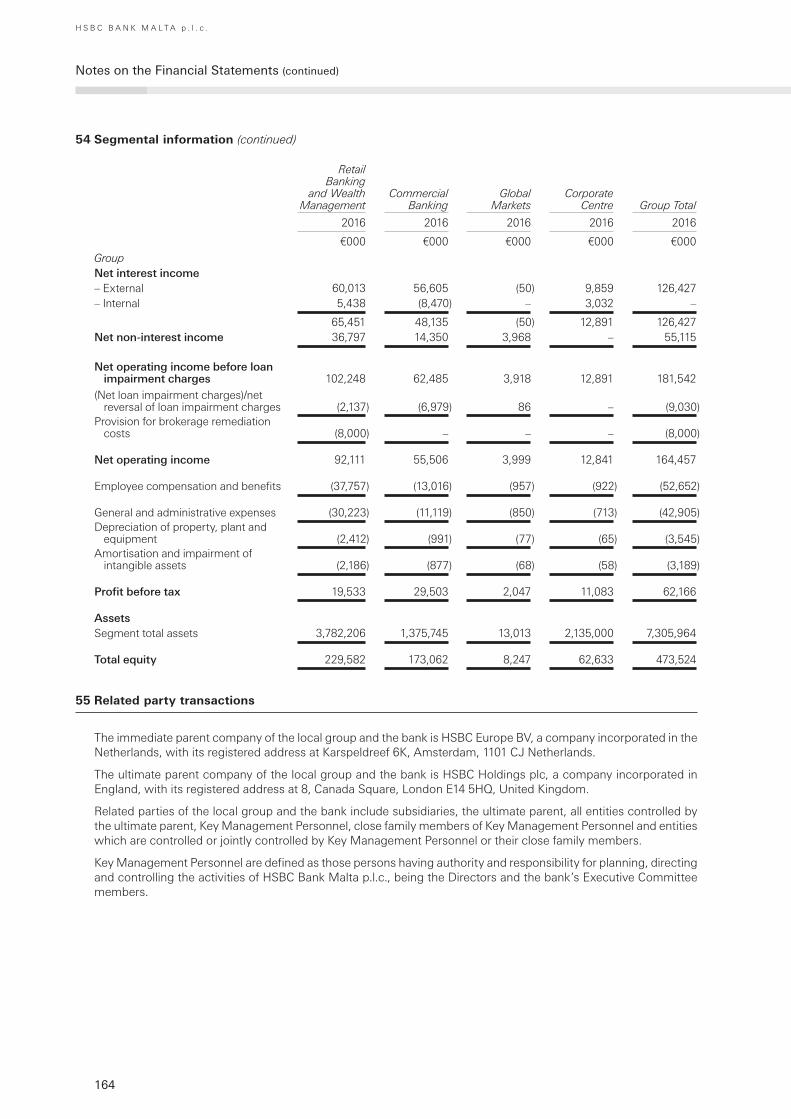
164
Notes on the Financial Statements (continued)
H S B C B A N K M A L T A p . l . c .
54 Segmental information (continued)
Retail Banking
and Wealth Management
Commercial Banking
Global Markets
Corporate Centre Group Total
2016 2016 2016 2016 2016
€000 €000 €000 €000 €000
GroupNet interest income– External 60,013 56,605 (50) 9,859 126,427– Internal 5,438 (8,470) – 3,032 –
65,451 48,135 (50) 12,891 126,427Net non-interest income 36,797 14,350 3,968 – 55,115
Net operating income before loan impairment charges 102,248 62,485 3,918 12,891 181,542
(Net loan impairment charges)/net reversal of loan impairment charges (2,137) (6,979) 86 – (9,030)
Provision for brokerage remediation costs (8,000) – – – (8,000)
Net operating income 92,111 55,506 3,999 12,841 164,457
Employee compensation and benefits (37,757) (13,016) (957) (922) (52,652)
General and administrative expenses (30,223) (11,119) (850) (713) (42,905)Depreciation of property, plant and
equipment (2,412) (991) (77) (65) (3,545)Amortisation and impairment of
intangible assets (2,186) (877) (68) (58) (3,189)
Profit before tax 19,533 29,503 2,047 11,083 62,166
AssetsSegment total assets 3,782,206 1,375,745 13,013 2,135,000 7,305,964
Total equity 229,582 173,062 8,247 62,633 473,524
55 Related party transactions
The immediate parent company of the local group and the bank is HSBC Europe BV, a company incorporated in the Netherlands, with its registered address at Karspeldreef 6K, Amsterdam, 1101 CJ Netherlands.
The ultimate parent company of the local group and the bank is HSBC Holdings plc, a company incorporated in England, with its registered address at 8, Canada Square, London E14 5HQ, United Kingdom.
Related parties of the local group and the bank include subsidiaries, the ultimate parent, all entities controlled by the ultimate parent, Key Management Personnel, close family members of Key Management Personnel and entities which are controlled or jointly controlled by Key Management Personnel or their close family members.
Key Management Personnel are defined as those persons having authority and responsibility for planning, directing and controlling the activities of HSBC Bank Malta p.l.c., being the Directors and the bank’s Executive Committee members.
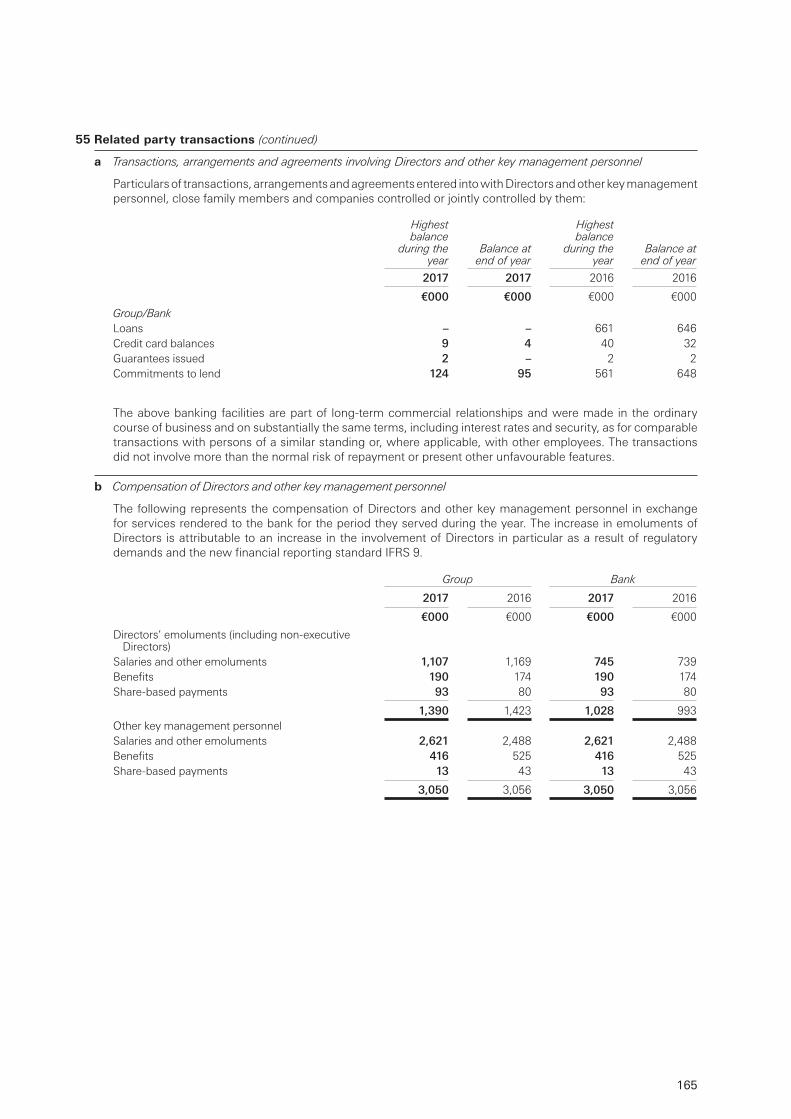
165
55 Related party transactions (continued)
a Transactions, arrangements and agreements involving Directors and other key management personnel
Particulars of transactions, arrangements and agreements entered into with Directors and other key management personnel, close family members and companies controlled or jointly controlled by them:
Highest balance
during the year
Balance at end of year
Highest balance
during the year
Balance at end of year
2017 2017 2016 2016
€000 €000 €000 €000
Group/BankLoans – – 661 646 Credit card balances 9 4 40 32 Guarantees issued 2 – 2 2 Commitments to lend 124 95 561 648
The above banking facilities are part of long-term commercial relationships and were made in the ordinary course of business and on substantially the same terms, including interest rates and security, as for comparable transactions with persons of a similar standing or, where applicable, with other employees. The transactions did not involve more than the normal risk of repayment or present other unfavourable features.
b Compensation of Directors and other key management personnel
The following represents the compensation of Directors and other key management personnel in exchange for services rendered to the bank for the period they served during the year. The increase in emoluments of Directors is attributable to an increase in the involvement of Directors in particular as a result of regulatory demands and the new financial reporting standard IFRS 9.
Group Bank
2017 2016 2017 2016
€000 €000 €000 €000
Directors’ emoluments (including non-executive Directors)
Salaries and other emoluments 1,107 1,169 745 739 Benefits 190 174 190 174 Share-based payments 93 80 93 80
1,390 1,423 1,028 993 Other key management personnelSalaries and other emoluments 2,621 2,488 2,621 2,488 Benefits 416 525 416 525 Share-based payments 13 43 13 43
3,050 3,056 3,050 3,056
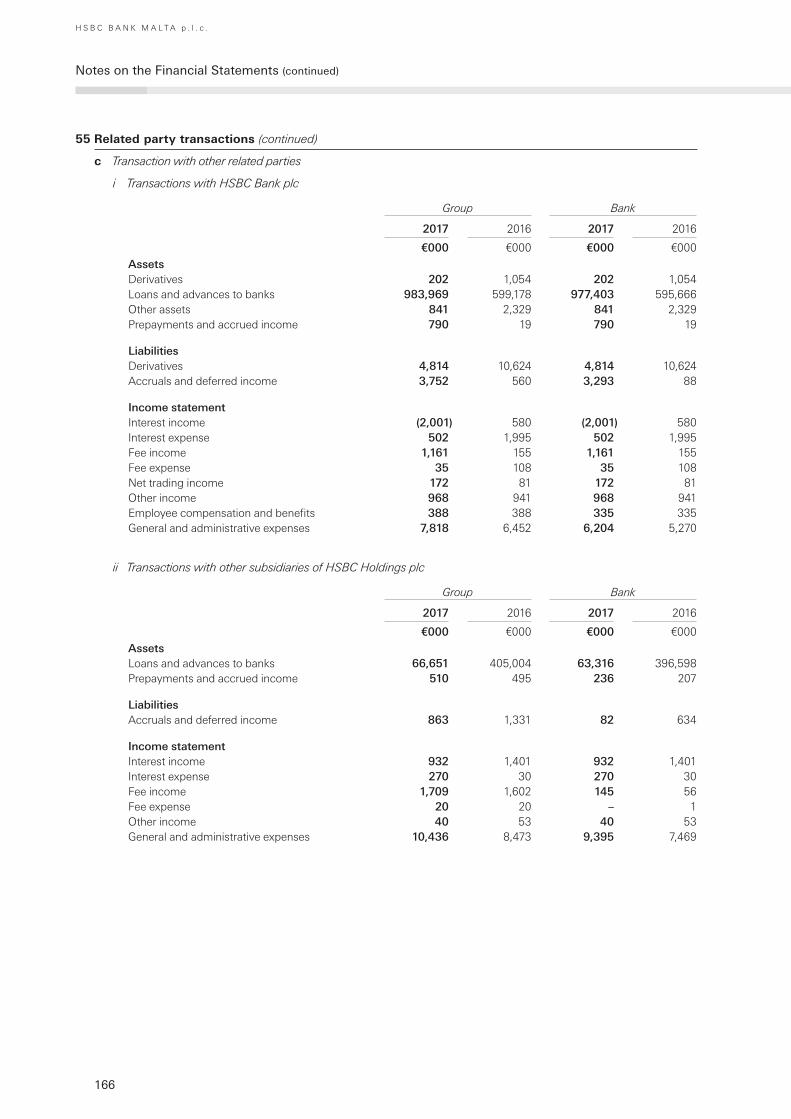
166
Notes on the Financial Statements (continued)
H S B C B A N K M A L T A p . l . c .
55 Related party transactions (continued)
c Transaction with other related parties
i Transactions with HSBC Bank plc
Group Bank
2017 2016 2017 2016
€000 €000 €000 €000
AssetsDerivatives 202 1,054 202 1,054 Loans and advances to banks 983,969 599,178 977,403 595,666 Other assets 841 2,329 841 2,329 Prepayments and accrued income 790 19 790 19
LiabilitiesDerivatives 4,814 10,624 4,814 10,624 Accruals and deferred income 3,752 560 3,293 88
Income statementInterest income (2,001) 580 (2,001) 580Interest expense 502 1,995 502 1,995 Fee income 1,161 155 1,161 155 Fee expense 35 108 35 108 Net trading income 172 81 172 81Other income 968 941 968 941Employee compensation and benefits 388 388 335 335 General and administrative expenses 7,818 6,452 6,204 5,270
ii Transactions with other subsidiaries of HSBC Holdings plc
Group Bank
2017 2016 2017 2016
€000 €000 €000 €000
AssetsLoans and advances to banks 66,651 405,004 63,316 396,598 Prepayments and accrued income 510 495 236 207
LiabilitiesAccruals and deferred income 863 1,331 82 634
Income statementInterest income 932 1,401 932 1,401 Interest expense 270 30 270 30 Fee income 1,709 1,602 145 56 Fee expense 20 20 – 1 Other income 40 53 40 53 General and administrative expenses 10,436 8,473 9,395 7,469
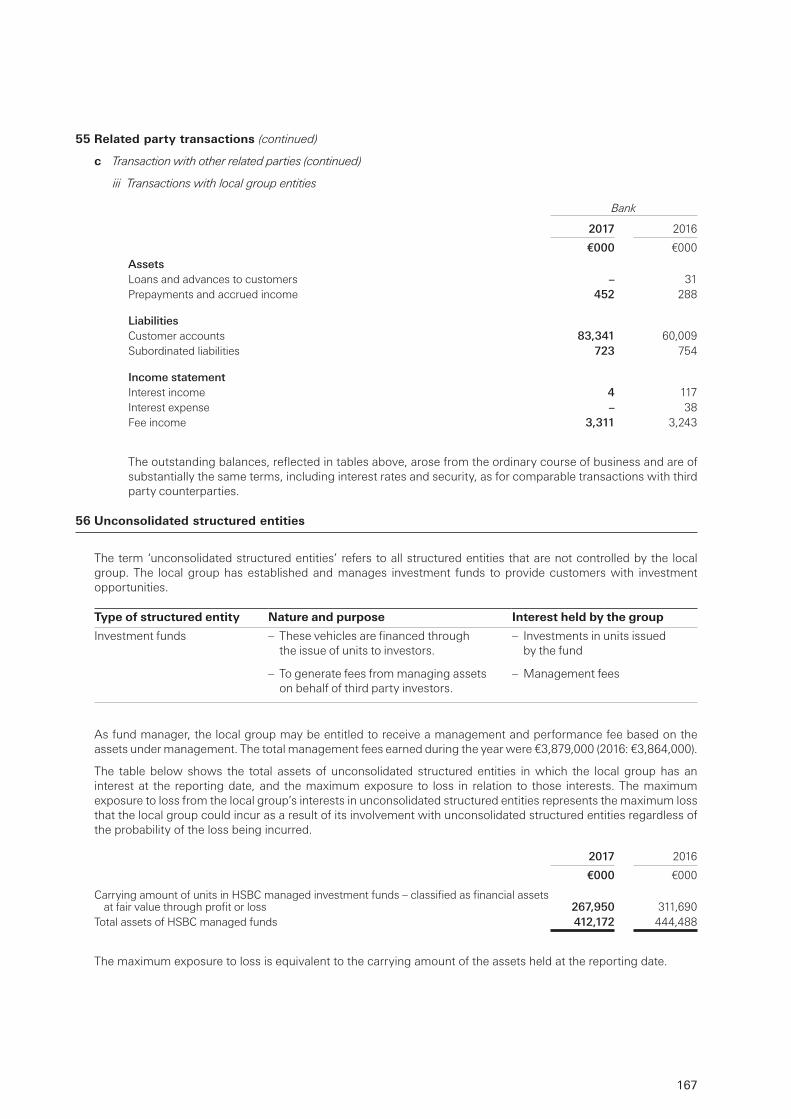
167
55 Related party transactions (continued)
c Transaction with other related parties (continued)
iii Transactions with local group entities
Bank
2017 2016
€000 €000
AssetsLoans and advances to customers – 31 Prepayments and accrued income 452 288
LiabilitiesCustomer accounts 83,341 60,009 Subordinated liabilities 723 754
Income statementInterest income 4 117Interest expense – 38 Fee income 3,311 3,243
The outstanding balances, reflected in tables above, arose from the ordinary course of business and are of substantially the same terms, including interest rates and security, as for comparable transactions with third party counterparties.
56 Unconsolidated structured entities
The term ‘unconsolidated structured entities’ refers to all structured entities that are not controlled by the local group. The local group has established and manages investment funds to provide customers with investment opportunities.
Type of structured entity Nature and purpose Interest held by the group
Investment funds – These vehicles are financed through the issue of units to investors.
– Investments in units issued by the fund
– To generate fees from managing assets on behalf of third party investors.
– Management fees
As fund manager, the local group may be entitled to receive a management and performance fee based on the assets under management. The total management fees earned during the year were €3,879,000 (2016: €3,864,000).
The table below shows the total assets of unconsolidated structured entities in which the local group has an interest at the reporting date, and the maximum exposure to loss in relation to those interests. The maximum exposure to loss from the local group’s interests in unconsolidated structured entities represents the maximum loss that the local group could incur as a result of its involvement with unconsolidated structured entities regardless of the probability of the loss being incurred.
2017 2016
€000 €000
Carrying amount of units in HSBC managed investment funds – classified as financial assets at fair value through profit or loss 267,950 311,690
Total assets of HSBC managed funds 412,172 444,488
The maximum exposure to loss is equivalent to the carrying amount of the assets held at the reporting date.
168
Notes on the Financial Statements (continued)
H S B C B A N K M A L T A p . l . c .
57 Trust and custody activities
The local group provides custody services to individuals and retirement benefit plans, whereby it holds and manages assets or invests funds received in various financial instruments at the direction of the customer. In line with Group strategy, during 2017, the bank continued the process of exiting from its trust business.
The local group receives fee income for providing these services. Trust assets and assets held in custody are not assets of the group and are not recognised in the statements of financial position. The group is not exposed to any credit risk relating to such placements, as it does not guarantee these investments.
At 31 December 2017, total assets held by the group on behalf of customers amounted to €1,652,814,000 (2016: €1,811,710,000).
58 Registered office and ultimate parent company
The addresses of the registered and principal offices of the bank and its subsidiary companies included in the consolidated financial statements can be found in a separate statement which is filed at the Registrar of Companies in accordance with the provisions of the Third Schedule to the Companies Act, 1995.
The ultimate parent company of HSBC Bank Malta p.l.c. is HSBC Holdings plc, and the immediate parent company is HSBC Europe B.V., which are incorporated and registered in the United Kingdom and the Netherlands respectively. The registered address of HSBC Holdings plc is 8, Canada Square, London E14 5HQ, United Kingdom and the registered address of HSBC Europe B.V. is Karspeldreef 6K, Amsterdam, 1101 CJ, Netherlands. Copies of the HSBC Holdings plc Annual Review 2017, Strategic Report 2017, and Annual Report and Accounts 2017 may be obtained from its registered office or viewed on www.hsbc.com.
59 Investor compensation scheme
In accordance with the provisions of the Investor Compensation Scheme Regulations, 2003 issued under the Investment Services Act, 1994, licence holders are required to transfer a variable contribution to an Investor Compensation Scheme Reserve and place the equivalent amount with a bank, pledged in favour of the Scheme. Alternatively licence holders can elect to pay the amount of variable contribution directly to the Scheme.
60 Critical accounting estimates and judgements
This note contains information about critical judgements, significant assumptions and estimation uncertainties that have a significant risk of resulting in a material adjustment and that have the most significant effects on the amounts recognised in the financial statements. Information about assumptions and estimation uncertainties relating to fair valuation of financial instruments is disclosed in Note 5. Estimates and judgements are continually evaluated and are based on historical and other factors, including expectations of future events that are believed to be reasonable under the circumstances.
a Impairment losses on loans and advances
Loan impairment allowances represent management’s best estimate of losses incurred in the loan portfolios at the balance sheet date. Management is required to exercise judgement in making assumptions and estimates when calculating loan impairment allowances on both individually and collectively assessed loans and advances.
Collective impairment allowances are subject to estimation uncertainty, in part because it is not practicable to identify losses on an individual loan basis due to the large number of individually insignificant loans in the portfolio.
The estimation methods include the use of statistical analyses of historical information, supplemented with significant management judgement, to assess whether current economic and credit conditions are such that the actual level of incurred losses is likely to be greater or less than historical experience.
Where changes in economic, regulatory or behavioural conditions result in the most recent trends in portfolio risk factors being not fully reflected in the statistical models, risk factors are taken into account by adjusting the impairment allowances derived solely from historical loss experience.
169
60 Critical accounting estimates and judgements (continued)
a Impairment losses on loans and advances (continued)
Risk factors include loan portfolio growth, product mix, unemployment rates, bankruptcy trends, loan product features, economic conditions such as national and local trends in housing markets, the level of interest rates, portfolio seasoning, account management policies and practices, changes in laws and regulations, and other influences on customer payment patterns. The methodology and the assumptions used in calculating impairment losses are reviewed regularly in the light of differences between loss estimates and actual loss experience. For example, roll rates, loss rates and the expected timing of future recoveries are regularly benchmarked against actual outcomes to ensure they remain appropriate.
For individually assessed loans, judgement is required in determining whether there is objective evidence that a loss event has occurred and, if so, the measurement of the impairment allowance. In determining whether there is objective evidence that a loss event has occurred, judgement is exercised in evaluating all relevant information on indicators of impairment, including the consideration of whether payments are contractually past-due and the consideration of other factors indicating deterioration in the financial condition and outlook of borrowers affecting their ability to pay. A higher level of judgement is required for loans to borrowers showing signs of financial difficulty in market sectors experiencing economic stress, particularly where the likelihood of repayment is affected by the prospects for refinancing or the sale of a specified asset. For those loans where objective evidence of impairment exists, management determine the size of the allowance required based on a range of factors such as the realisable value of security, the likely dividend available on liquidation or bankruptcy, the viability of the customer’s business model and the capacity to trade successfully out of financial difficulties and generate sufficient cash flow to service debt obligations.
The group might provide loan forbearance to borrowers experiencing financial difficulties by agreeing to modify the contractual payment terms of loans in order to improve the management of customer relationships, maximise collection opportunities or avoid default or repossession. Where forbearance activities are significant, higher levels of judgment and estimation uncertainty are involved in determining their effects on loan impairment allowances. Judgements are involved in differentiating the credit risk characteristics of forbearance cases, including those which return to performing status following renegotiation.
The exercise of judgement requires the use of assumptions which are highly subjective and very sensitive to the risk factors, in particular to changes in economic and credit conditions. Many of the factors have a high degree of interdependency and there is no single factor to which the loan impairment allowances as a whole are sensitive.
b Policyholder claims and benefits
The estimation of future benefit payments and premiums arising from long-term insurance contracts is one of the local group’s most critical accounting estimates. The determination of the liabilities under long-term insurance contracts is dependent on estimates made by the local group. Estimates are made as to the expected number of deaths for each of the years in which the local group is exposed to risk. The local group bases these estimates on industry standard mortality tables that reflect recent historical mortality experience, adjusted where appropriate to reflect the local group’s own experience. The estimated number of deaths determines the value of the future benefit payments. The main source of uncertainty is that epidemics such as AIDS, SARS, pandemic flu, swine flu and wide-ranging lifestyle changes, such as in eating, smoking and exercise habits, could result in future mortality being significantly worse than in the past for the age groups in which the local group has significant exposure to mortality risk. New estimates are made each subsequent year to reflect the current long-term outlook.
Estimates are also made as to future investment income arising from the assets backing long-term insurance. These estimates are based on current market returns as well as expectations about future economic and financial developments. Interest rate assumptions for the purposes of valuing liabilities as at reporting date are based on the euro swap rates curve. Appropriate margins were taken for bond portfolio and equities/property portfolio.
If the average future investment returns differ by +/-1% from management’s estimates, the insurance liability would decrease by €16,670,000 (2016: €19,316,000) or increase by €21,838,000 (2016: €26,198,000). In this case there is no relief arising from reinsurance contracts held. This impact is calculated before considering changes to other assets and liabilities which may offset the gross impact of this change.
If the number of deaths in future years differ by +/-10% from management’s estimate, the liability would increase by €1,153,000 (2016: €1,148,000) or decrease by €1,248,000 (2016: €1,193,000).

170
Notes on the Financial Statements (continued)
H S B C B A N K M A L T A p . l . c .
c Present value of in-force long-term assurance business (PVIF)
The PVIF measures the shareholder’s share of the future profits that are expected to be earned in future years attributable to the long-term life insurance business in force at the valuation date. Policies classified as investment contracts are excluded. The approach is to take a present value of the expected future shareholder cash flows discounted using the risk discount rate.
The risk free rate of return used within the valuation is the Euro swap rate curve as at 29 December 2017 (2016: same approach). The risk discount rate is based on the risk free curve with an additional 0.5% margin (2016: 0.5% margin) to allow for operational risk. The PVIF valuation assumes lapse rates varying by product and duration in-force that range from 0% to 18.7% p.a. (2016: from 0% to 18.7% p.a.). Expense inflation is calculated as a blend of wage inflation and price inflation, with the latter based on an adjusted French inflation curve. This results in a term dependent expense inflation assumption increasing from 2.0% p.a. to 2.7% p.a. (2016: 2.0% p.a. to 2.9% p.a.).
As the valuation models are based upon assumptions, changing the assumptions will change the resultant estimate of PVIF. The effect on the PVIF of reasonably possible changes in the main assumptions across the insurance business are included in Note 35 (b).
171
H S B C B A N K M A L T A p . l . c .
Additional Regulatory Disclosures
a Overview
These Additional Regulatory Disclosures (ARDs) are aimed at providing the local group’s stakeholders further insight to the local group’s capital structure, adequacy and risk management practices. The disclosures outlined below have been prepared by the local group in accordance with the Pillar 3 quantitative and qualitative disclosure requirements as governed by Banking Rule BR/07: Publication of Annual Report and Audited Financial Statements of Credit Institutions authorised under the Banking Act, 1994, issued by the Malta Financial Services Authority (MFSA). Banking Rule BR/07 follows the disclosure requirements of Directive 2013/36/EU (Capital Requirements Directive) and EU Regulation No 575/2013 (Capital Requirements Regulation) of the European Parliament and of the Council of 26 June 2013.
In light of the fact that the local group is considered a significant subsidiary of HSBC Holdings plc, consolidated supervision at the level of HSBC Holdings plc, the local group is exempt from full disclosure requirements laid down in Part Eight of the CRR. It is however subject to disclosure requirements in terms of article 13 of the CRR and and the European Banking Authority’s (‘EBA’) final standards on revised Pillar 3 disclosures issued in December 2016.
The basis of consolidation for the purpose of financial reporting under International Financial Reporting Standards (IFRSs), described in note 3 of the Annual Report, differs from that used for regulatory purposes. For regulatory reporting purposes, subsidiaries engaged in insurance activities are excluded from the regulatory consolidation and deducted from regulatory capital subject to thresholds. On the basis of Article 43(a) of the CRR, the investment in HSBC Life Assurance (Malta) Limited is deemed to be significant for the purposes of capital requirements.
The local group publishes these disclosures on an annual basis as part of the Annual Report. As outlined in the requirements of banking regulations, these disclosures are not subject to an external audit, except to the extent that any disclosures are equivalent to those made in the Financial Statements, which have been prepared in accordance with the International Financial Reporting Standards (IFRS) as adopted by the EU. The local group, through its internal verification procedures, is satisfied that these ARDs are presented fairly.
b Capital management
The local group’s approach to capital management is driven by its strategic and organisational requirements, taking into account the regulatory, economic and commercial environment in which it operates. It is the local group’s objective is to maintain a strong capital base to support the risks inherent in its business and to meet regulatory capital requirements at all times. To achieve this, the local group manages capital within the context of an annual capital plan which is approved by the Board and which determines the optimal amount and mix of capital required to support planned business growth and meet regulatory capital requirements. Capital generated in excess of planned requirements is returned to shareholders in the form of dividends.
The impact of the local group’s capital plan on shareholder returns is therefore recognised by the level of equity capital employed for which the local group seeks to maintain a prudent balance between the advantages and flexibility afforded by a strong capital position and the higher returns on equity from increased leverage.
The local group manages its capital requirements based on internal targets, which are set above the prescribed minimum levels established within the CRR.
i Own funds
For regulatory purposes, the bank’s capital base is divided into CET1 capital and Tier 2 capital. The bank’s CET1 capital includes the following items:
– called up share capital;
– retained earnings;
– reserve for general banking risks; and
– other regulatory adjustments relating to items that are included in equity but are treated differently for capital adequacy purposes, including the treatment of investments in financial sector entities, deferred tax assets, deductions relating to amounts pledged in favour of the Depositor Compensation Scheme and deductions relating to intangible assets.
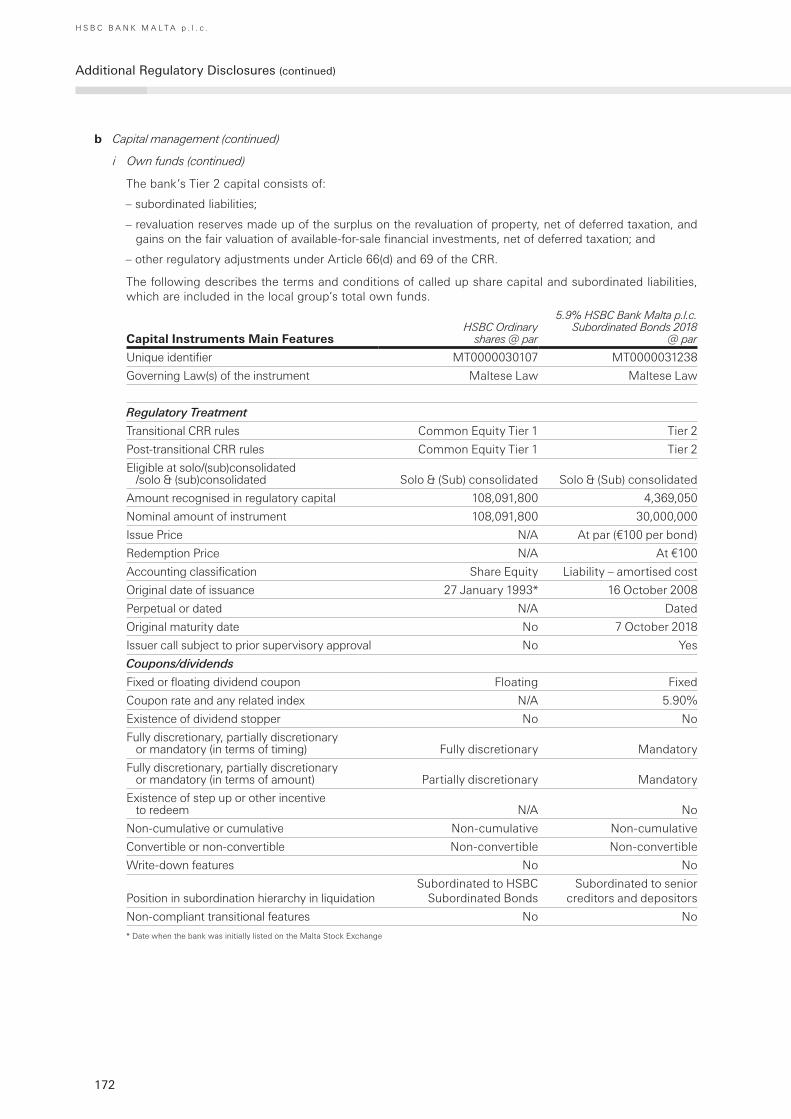
172
H S B C B A N K M A L T A p . l . c .
Additional Regulatory Disclosures (continued)
b Capital management (continued)
i Own funds (continued)
The bank’s Tier 2 capital consists of:
– subordinated liabilities;
– revaluation reserves made up of the surplus on the revaluation of property, net of deferred taxation, and gains on the fair valuation of available-for-sale financial investments, net of deferred taxation; and
– other regulatory adjustments under Article 66(d) and 69 of the CRR.
The following describes the terms and conditions of called up share capital and subordinated liabilities, which are included in the local group’s total own funds.
Capital Instruments Main FeaturesHSBC Ordinary
shares @ par
5.9% HSBC Bank Malta p.l.c. Subordinated Bonds 2018
@ par
Unique identifier MT0000030107 MT0000031238
Governing Law(s) of the instrument Maltese Law Maltese Law
Regulatory Treatment
Transitional CRR rules Common Equity Tier 1 Tier 2
Post-transitional CRR rules Common Equity Tier 1 Tier 2
Eligible at solo/(sub)consolidated /solo & (sub)consolidated Solo & (Sub) consolidated Solo & (Sub) consolidated
Amount recognised in regulatory capital 108,091,800 4,369,050
Nominal amount of instrument 108,091,800 30,000,000
Issue Price N/A At par (€100 per bond)
Redemption Price N/A At €100
Accounting classification Share Equity Liability – amortised cost
Original date of issuance 27 January 1993* 16 October 2008
Perpetual or dated N/A Dated
Original maturity date No 7 October 2018
Issuer call subject to prior supervisory approval No Yes
Coupons/dividends
Fixed or floating dividend coupon Floating Fixed
Coupon rate and any related index N/A 5.90%
Existence of dividend stopper No No
Fully discretionary, partially discretionary or mandatory (in terms of timing) Fully discretionary Mandatory
Fully discretionary, partially discretionary or mandatory (in terms of amount) Partially discretionary Mandatory
Existence of step up or other incentive to redeem N/A No
Non-cumulative or cumulative Non-cumulative Non-cumulative
Convertible or non-convertible Non-convertible Non-convertible
Write-down features No No
Position in subordination hierarchy in liquidationSubordinated to HSBC
Subordinated BondsSubordinated to senior
creditors and depositors
Non-compliant transitional features No No
* Date when the bank was initially listed on the Malta Stock Exchange
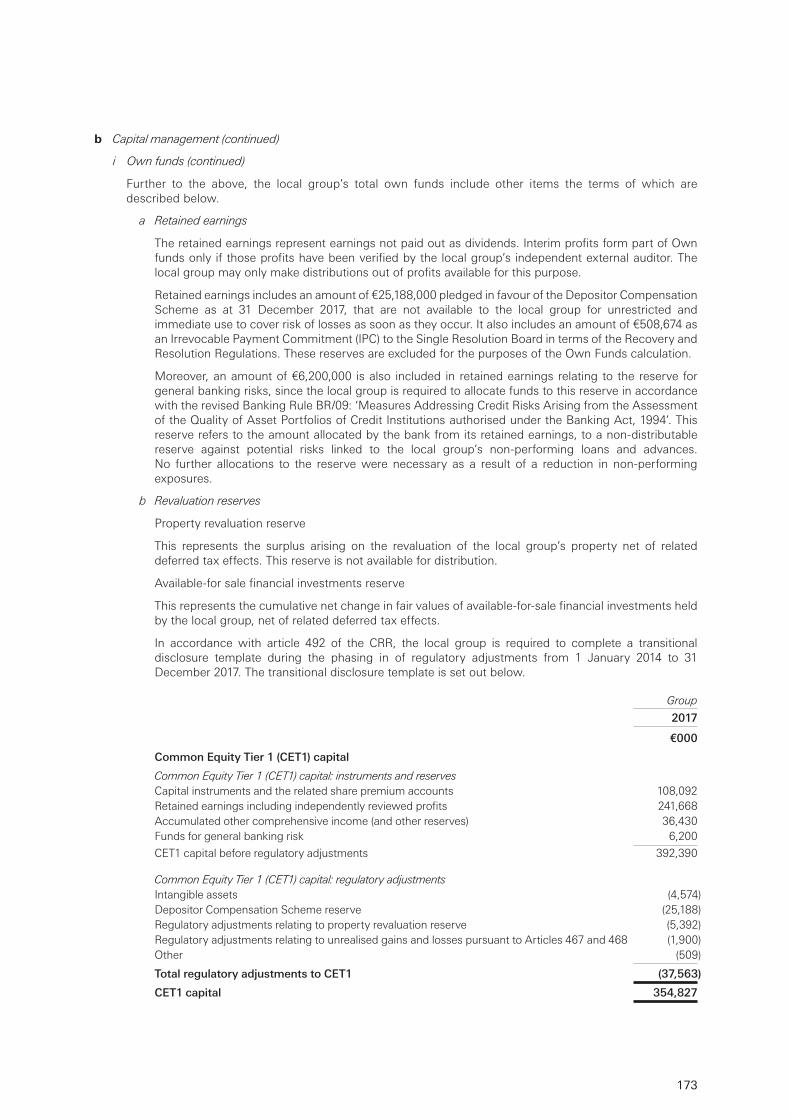
173
b Capital management (continued)
i Own funds (continued)
Further to the above, the local group’s total own funds include other items the terms of which are described below.
a Retained earnings
The retained earnings represent earnings not paid out as dividends. Interim profits form part of Own funds only if those profits have been verified by the local group’s independent external auditor. The local group may only make distributions out of profits available for this purpose.
Retained earnings includes an amount of €25,188,000 pledged in favour of the Depositor Compensation Scheme as at 31 December 2017, that are not available to the local group for unrestricted and immediate use to cover risk of losses as soon as they occur. It also includes an amount of €508,674 as an Irrevocable Payment Commitment (IPC) to the Single Resolution Board in terms of the Recovery and Resolution Regulations. These reserves are excluded for the purposes of the Own Funds calculation.
Moreover, an amount of €6,200,000 is also included in retained earnings relating to the reserve for general banking risks, since the local group is required to allocate funds to this reserve in accordance with the revised Banking Rule BR/09: ‘Measures Addressing Credit Risks Arising from the Assessment of the Quality of Asset Portfolios of Credit Institutions authorised under the Banking Act, 1994’. This reserve refers to the amount allocated by the bank from its retained earnings, to a non-distributable reserve against potential risks linked to the local group’s non-performing loans and advances. No further allocations to the reserve were necessary as a result of a reduction in non-performing exposures.
b Revaluation reserves
Property revaluation reserve
This represents the surplus arising on the revaluation of the local group’s property net of related deferred tax effects. This reserve is not available for distribution.
Available-for sale financial investments reserve
This represents the cumulative net change in fair values of available-for-sale financial investments held by the local group, net of related deferred tax effects.
In accordance with article 492 of the CRR, the local group is required to complete a transitional disclosure template during the phasing in of regulatory adjustments from 1 January 2014 to 31 December 2017. The transitional disclosure template is set out below.
Group
2017
€000
Common Equity Tier 1 (CET1) capital
Common Equity Tier 1 (CET1) capital: instruments and reservesCapital instruments and the related share premium accounts 108,092Retained earnings including independently reviewed profits 241,668Accumulated other comprehensive income (and other reserves) 36,430Funds for general banking risk 6,200
CET1 capital before regulatory adjustments 392,390
Common Equity Tier 1 (CET1) capital: regulatory adjustmentsIntangible assets (4,574)Depositor Compensation Scheme reserve (25,188)Regulatory adjustments relating to property revaluation reserve (5,392)Regulatory adjustments relating to unrealised gains and losses pursuant to Articles 467 and 468 (1,900)Other (509)
Total regulatory adjustments to CET1 (37,563)
CET1 capital 354,827
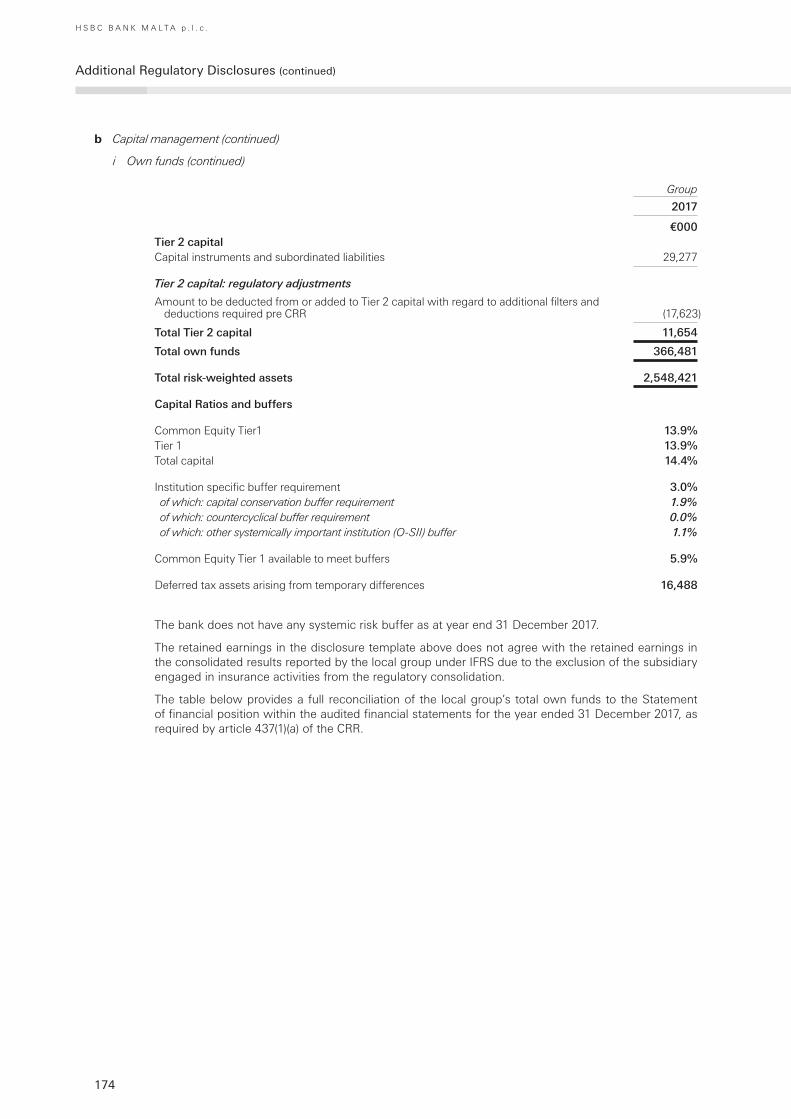
174
H S B C B A N K M A L T A p . l . c .
Additional Regulatory Disclosures (continued)
b Capital management (continued)
i Own funds (continued)
Group
2017
€000Tier 2 capitalCapital instruments and subordinated liabilities 29,277
Tier 2 capital: regulatory adjustments
Amount to be deducted from or added to Tier 2 capital with regard to additional filters and deductions required pre CRR (17,623)
Total Tier 2 capital 11,654
Total own funds 366,481
Total risk-weighted assets 2,548,421
Capital Ratios and buffers
Common Equity Tier1 13.9%Tier 1 13.9%Total capital 14.4%
Institution specific buffer requirement 3.0%of which: capital conservation buffer requirement 1.9%of which: countercyclical buffer requirement 0.0%of which: other systemically important institution (O-SII) buffer 1.1%
Common Equity Tier 1 available to meet buffers 5.9%
Deferred tax assets arising from temporary differences 16,488
The bank does not have any systemic risk buffer as at year end 31 December 2017.
The retained earnings in the disclosure template above does not agree with the retained earnings in the consolidated results reported by the local group under IFRS due to the exclusion of the subsidiary engaged in insurance activities from the regulatory consolidation.
The table below provides a full reconciliation of the local group’s total own funds to the Statement of financial position within the audited financial statements for the year ended 31 December 2017, as required by article 437(1)(a) of the CRR.
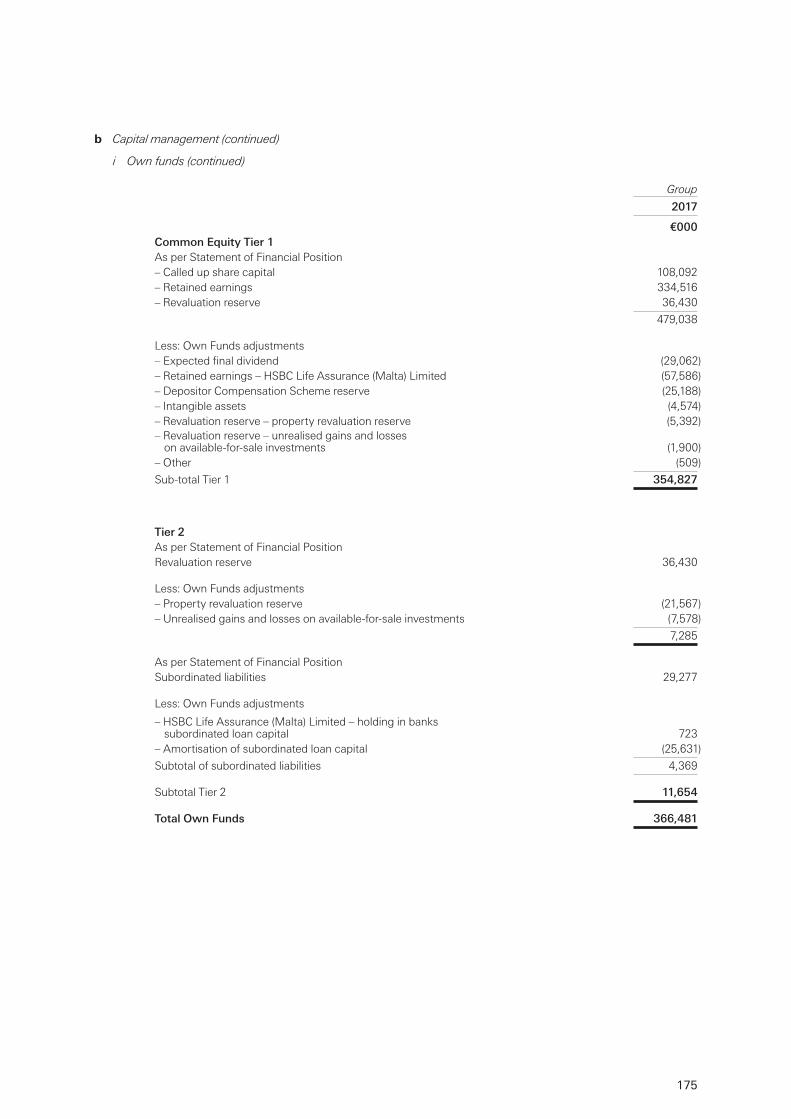
175
b Capital management (continued)
i Own funds (continued)
Group
2017
€000Common Equity Tier 1As per Statement of Financial Position– Called up share capital 108,092 – Retained earnings 334,516 – Revaluation reserve 36,430
479,038
Less: Own Funds adjustments– Expected final dividend (29,062)– Retained earnings – HSBC Life Assurance (Malta) Limited (57,586)– Depositor Compensation Scheme reserve (25,188)– Intangible assets (4,574)– Revaluation reserve – property revaluation reserve (5,392)– Revaluation reserve – unrealised gains and losses
on available-for-sale investments (1,900)– Other (509)
Sub-total Tier 1 354,827
Tier 2As per Statement of Financial PositionRevaluation reserve 36,430
Less: Own Funds adjustments – Property revaluation reserve (21,567)– Unrealised gains and losses on available-for-sale investments (7,578)
7,285
As per Statement of Financial PositionSubordinated liabilities 29,277
Less: Own Funds adjustments
– HSBC Life Assurance (Malta) Limited – holding in banks subordinated loan capital 723
– Amortisation of subordinated loan capital (25,631)
Subtotal of subordinated liabilities 4,369
Subtotal Tier 2 11,654
Total Own Funds 366,481
176
H S B C B A N K M A L T A p . l . c .
Additional Regulatory Disclosures (continued)
b Capital management (continued)
ii Capital requirements
The local group is required to maintain a ratio of total regulatory capital to risk-weighted assets (Total capital ratio) above the prescribed minimum level of 8%.
Pillar 1 capital requirements are based on standard rules and set the minimum own funds requirements to cover credit risk, market risk and operational risk of credit institutions. The local group uses the Standardised Approach for credit risk and operational risk and the Basic Method with respect to market risk in relation to the local group’s foreign exchange risk. Under the Standardised Approach, the local group utilises risk weights determined by exposure class, credit risk mitigation and credit ratings as outlined in the CRR. Capital charge for foreign exchange risk using the Basic Method is calculated at 8% of the higher of the sum of all the net short positions and the sum of all the net long positions in each foreign currency. The Standardised Approach for operational risk, requires the group to divide its activities into the business lines prescribed in Article 317 of the CRR. The risk-weighted assets are derived by apply 12.5% to the capital requirements from each business line.
The local group will be fully implementing the CRD IV capital requirements with effect from January 2019. In respect of the local group, Banking Rule BR/15: ‘Capital Buffers of Credit Institutions authorised under the Banking Act, 1994’, requires additional buffers, namely the ‘capital conservation buffer’, the ‘countercyclical buffer’, ‘other systemically important institutions (O-SII) buffer’ and the ‘systemic risk buffer’. Automatic restrictions on capital distributions apply if the local group’s CET1 capital falls below the level of its CRD IV combined buffer.
The local group is required to maintain a capital conservation buffer of 2.5%, O-SII buffer of 1.5% and the Institution-specific countercyclical buffer as determined by Article 140 (1) of Directive 2013/36/EU. These capital buffers should be composed of CET 1 capital, as a percentage of the Risk Weighted Assets as from 1 January 2019. These buffers are being phased in over the period from 1 January 2016 to 31 December 2018.
CRD IV contemplates a countercyclical buffer in line with Basel III, in the form of an institution-specific countercyclical buffer and the application of increased requirements to address macro-prudential or systemic risk. This is expected to be set in the range of 0 – 2.5% of relevant credit exposure RWAs, whereby the rate shall consist of the weighted average of the ‘countercyclical buffer’ rates that apply in the jurisdiction where the relevant exposures are located. Given that the local group’s exposures are contained within Malta, this buffer results in a marginal percentage.
The tables below provide the geographical distribution of the bank’s credit exposure relevant to the calculation of the institution-specific countercyclical buffer rate and the amount of institution-specific countercyclical capital buffer.
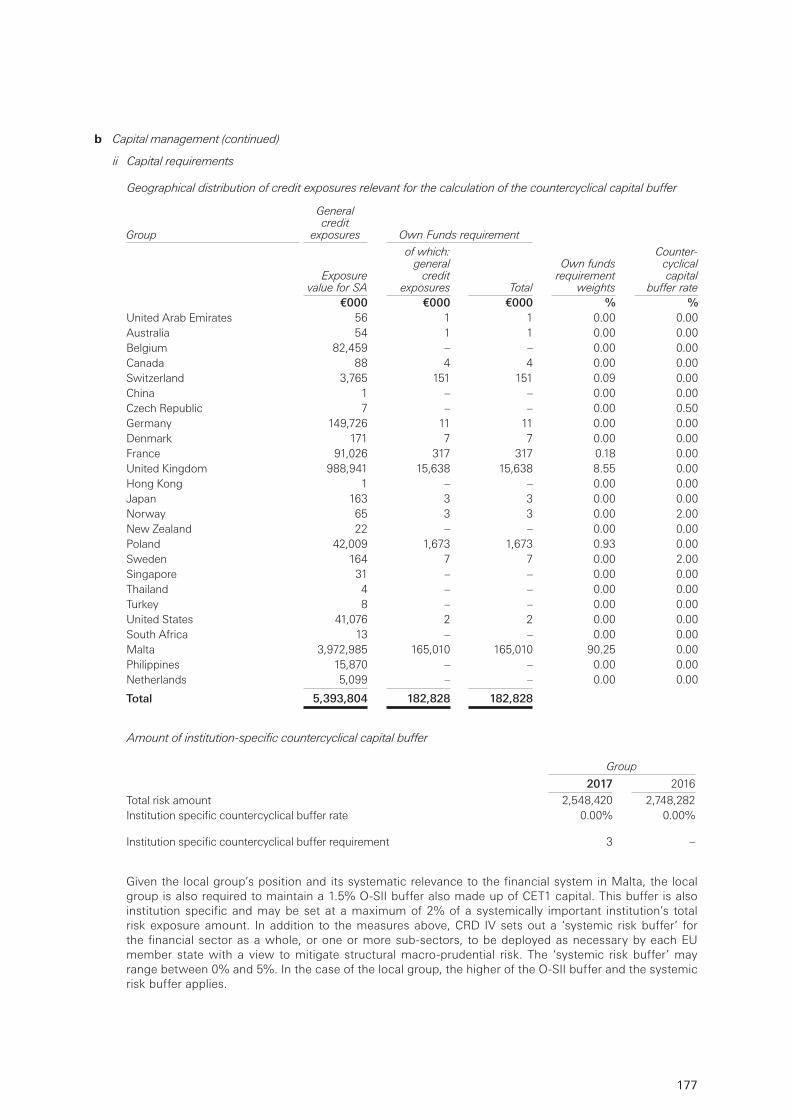
177
b Capital management (continued)
ii Capital requirements
Geographical distribution of credit exposures relevant for the calculation of the countercyclical capital buffer
Group
General credit
exposures Own Funds requirement
Own funds requirement
weights
Counter-cyclical capital
buffer rateExposure
value for SA
of which: general
credit exposures Total
€000 €000 €000 % %United Arab Emirates 56 1 1 0.00 0.00Australia 54 1 1 0.00 0.00Belgium 82,459 – – 0.00 0.00Canada 88 4 4 0.00 0.00Switzerland 3,765 151 151 0.09 0.00China 1 – – 0.00 0.00Czech Republic 7 – – 0.00 0.50Germany 149,726 11 11 0.00 0.00Denmark 171 7 7 0.00 0.00France 91,026 317 317 0.18 0.00United Kingdom 988,941 15,638 15,638 8.55 0.00Hong Kong 1 – – 0.00 0.00Japan 163 3 3 0.00 0.00Norway 65 3 3 0.00 2.00New Zealand 22 – – 0.00 0.00Poland 42,009 1,673 1,673 0.93 0.00Sweden 164 7 7 0.00 2.00Singapore 31 – – 0.00 0.00Thailand 4 – – 0.00 0.00Turkey 8 – – 0.00 0.00United States 41,076 2 2 0.00 0.00South Africa 13 – – 0.00 0.00Malta 3,972,985 165,010 165,010 90.25 0.00Philippines 15,870 – – 0.00 0.00Netherlands 5,099 – – 0.00 0.00
Total 5,393,804 182,828 182,828
Amount of institution-specific countercyclical capital buffer
Group
2017 2016
Total risk amount 2,548,420 2,748,282 Institution specific countercyclical buffer rate 0.00% 0.00%
Institution specific countercyclical buffer requirement 3 –
Given the local group’s position and its systematic relevance to the financial system in Malta, the local group is also required to maintain a 1.5% O-SII buffer also made up of CET1 capital. This buffer is also institution specific and may be set at a maximum of 2% of a systemically important institution’s total risk exposure amount. In addition to the measures above, CRD IV sets out a ‘systemic risk buffer’ for the financial sector as a whole, or one or more sub-sectors, to be deployed as necessary by each EU member state with a view to mitigate structural macro-prudential risk. The ‘systemic risk buffer’ may range between 0% and 5%. In the case of the local group, the higher of the O-SII buffer and the systemic risk buffer applies.

178
H S B C B A N K M A L T A p . l . c .
Additional Regulatory Disclosures (continued)
b Capital management (continued)
ii Capital requirements (continued)
Capital management and allocation
Group
Net value of exposure at
the end of year
Risk weighted
assetsCapital
Required1
2017 2017 2017
€000 €000 €000Central governments or central banks 915,047 – –Public sector entities 234,274 29,785 2,383 Multilateral development banks 142,168 – –Institutions 1,055,732 225,428 18,034 Corporates 379,006 211,964 16,957 Retail exposures 366,512 106,107 8,489 Secured by mortgages on immovable property 2,888,341 1,289,830 103,186 Exposures in default 149,677 180,550 14,444 Items associated with particularly high risk 33,181 39,773 3,182 Equity exposures 25 25 2 Other items 196,267 201,887 16,151
Credit risk 6,360,230 2,285,349 182,828 Operational risk 262,096 20,968 Foreign exchange risk 975 78
Total 2,548,420 203,874 Own fundsCommon Equity Tier 1 354,827 Tier 2 11,654
Total own funds 366,481
Total capital ratio 14.4%
1Capital requirements, here and in all tables where the term is used, represents the Pillar I capital charge at 8% of RWAs.
Total Risk Weighted Assets and minimum capital requirements.
Risk weighted assets
Minimum capital
requirements
2017 2016 2017
€000 €000 €000
1 Credit risk (excluding CCR) 2,172,087 2,351,415 173,767 2 of which the standardised approach 2,172,087 2,351,415 173,767 6 CCR 7,052 7,052 564 7 of which mark to market 7,052 7,052 564
19 Market risk 975 5,381 78 20 of which the standardised approach 975 5,381 78 23 Operational risk 262,096 272,858 20,968 24 of which basic indicator approach 262,096 272,858 20,968 27 Amounts below the thresholds for deduction
(subject to 250% risk weight) 106,210 111,576 8,497 29 Total 2,548,420 2,748,282 203,874
Credit risk exposures and credit risk mitigant techniques
The table below illustrates the effect of all CRM techniques applied in accordance with Part Three, Title II, Chapter 4 of the CRR, including the financial collateral simple method and the financial collateral comprehensive method in the application of Article 222 and Article 223 of the same regulation on standardised approach capital requirements’ calculations. RWA density provides a synthetic metric on the riskiness of each portfolio.
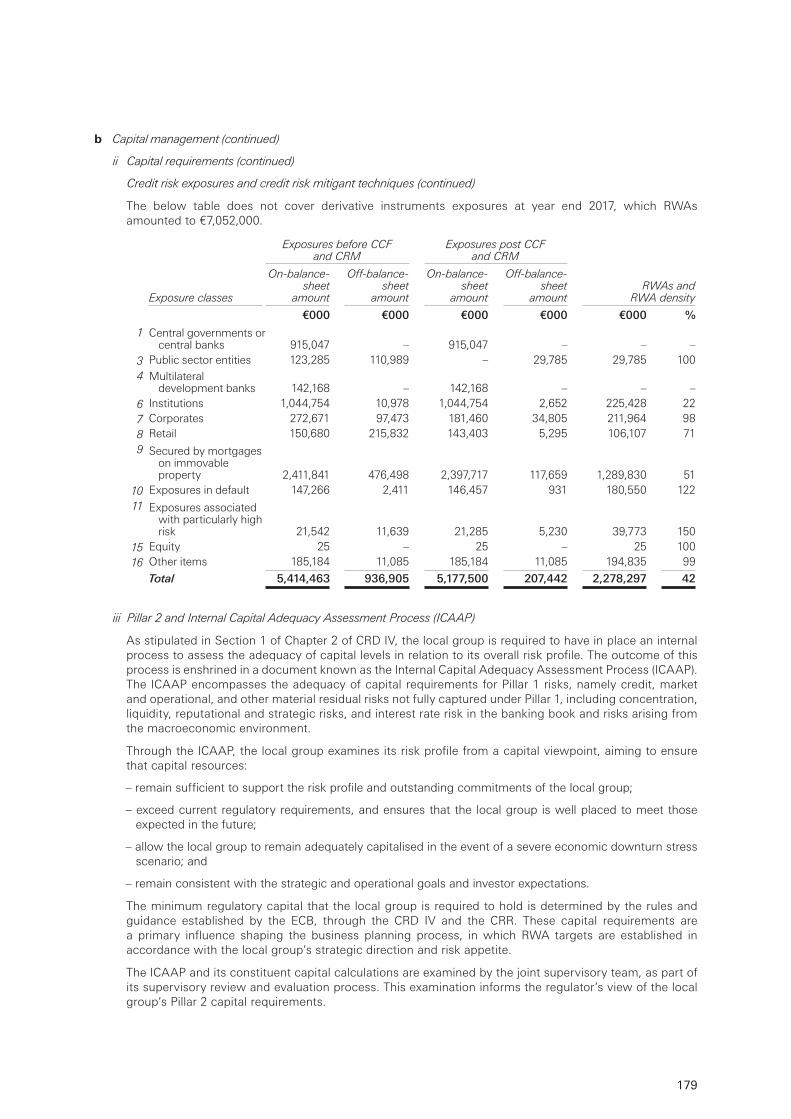
179
b Capital management (continued)
ii Capital requirements (continued)
Credit risk exposures and credit risk mitigant techniques (continued)
The below table does not cover derivative instruments exposures at year end 2017, which RWAs amounted to €7,052,000.
Exposures before CCF and CRM
Exposures post CCF and CRM
Exposure classes
On-balance-sheet
amount
Off-balance-sheet
amount
On-balance-sheet
amount
Off-balance-sheet
amountRWAs and
RWA density
€000 €000 €000 €000 €000 %
1 Central governments or central banks 915,047 – 915,047 – – –
3 Public sector entities 123,285 110,989 – 29,785 29,785 100 4 Multilateral
development banks 142,168 – 142,168 – – –6 Institutions 1,044,754 10,978 1,044,754 2,652 225,428 22 7 Corporates 272,671 97,473 181,460 34,805 211,964 98 8 Retail 150,680 215,832 143,403 5,295 106,107 71 9 Secured by mortgages
on immovable property 2,411,841 476,498 2,397,717 117,659 1,289,830 51
10 Exposures in default 147,266 2,411 146,457 931 180,550 122 11 Exposures associated
with particularly high risk 21,542 11,639 21,285 5,230 39,773 150
15 Equity 25 – 25 – 25 100 16 Other items 185,184 11,085 185,184 11,085 194,835 99
Total 5,414,463 936,905 5,177,500 207,442 2,278,297 42
iii Pillar 2 and Internal Capital Adequacy Assessment Process (ICAAP)
As stipulated in Section 1 of Chapter 2 of CRD IV, the local group is required to have in place an internal process to assess the adequacy of capital levels in relation to its overall risk profile. The outcome of this process is enshrined in a document known as the Internal Capital Adequacy Assessment Process (ICAAP). The ICAAP encompasses the adequacy of capital requirements for Pillar 1 risks, namely credit, market and operational, and other material residual risks not fully captured under Pillar 1, including concentration, liquidity, reputational and strategic risks, and interest rate risk in the banking book and risks arising from the macroeconomic environment.
Through the ICAAP, the local group examines its risk profile from a capital viewpoint, aiming to ensure that capital resources:
– remain sufficient to support the risk profile and outstanding commitments of the local group;
– exceed current regulatory requirements, and ensures that the local group is well placed to meet those expected in the future;
– allow the local group to remain adequately capitalised in the event of a severe economic downturn stress scenario; and
– remain consistent with the strategic and operational goals and investor expectations.
The minimum regulatory capital that the local group is required to hold is determined by the rules and guidance established by the ECB, through the CRD IV and the CRR. These capital requirements are a primary influence shaping the business planning process, in which RWA targets are established in accordance with the local group’s strategic direction and risk appetite.
The ICAAP and its constituent capital calculations are examined by the joint supervisory team, as part of its supervisory review and evaluation process. This examination informs the regulator’s view of the local group’s Pillar 2 capital requirements.
180
H S B C B A N K M A L T A p . l . c .
Additional Regulatory Disclosures (continued)
b Capital management (continued)
iii Pillar 2 and Internal Capital Adequacy Assessment Process (ICAAP) (continued)
Preserving the local group’s strong capital position remains a priority, and the level of integration of risk and capital management helps to optimise the local group’s response to business demand for capital. Risks that are explicitly assessed through capital are credit risk including counterparty credit risk, market and operational risk, interest rate risk in the banking book, insurance risk, pension risk, residual risk and structural foreign exchange risk.
Furthermore, stress testing forms an integral part of the risk and capital management framework and is an important component of ICAAP. Its main purpose is to highlight to senior management potential adverse unexpected outcomes that could arise under hypothetical scenarios, and provides a quantitative indication of how much capital might be required to absorb the losses, should such adverse scenarios occur. Stress testing is used to assess risk concentrations, estimate the impact on revenue, impairments, write-downs and the resultant capital adequacy under a variety of adverse scenarios.
Macroeconomic stress testing considers the impact on both revenue and capital under a range of scenarios. It entails multi-year systemic shocks to assess the local group’s ability to meet its capital requirement and liabilities as they fall due under a downturn in the business cycle and/or macroeconomic environment.
The stress testing framework brings multiple benefits to risk management, including: understanding the impact of recessionary scenarios; assessing material risk concentrations; impact of market price movements; and, forecasting of the balance sheet management and liquidity.
A series of stress events are run on a regular basis to assess the potential impact of an extreme yet plausible event on the local group. In an adverse scenario, a range of mitigating actions is ready to be implemented whenever the need arises. The latter also forms part of the ICAAP document.
From the local group’s 2017 ICAAP, prior to applying stress testing scenarios, the local group maintained a strong capital position throughout the period reviewed. CET1 capital remained robust and comfortably above the risk appetite limit as well as the regulatory requirements, adjusted for the applicable capital buffers. With the application of severe stress scenarios, the local group maintained its strong CET1 capital base for absorbing the impact of the stress whilst continuing to meet its regulatory capital requirements.
c Credit risk
i Introduction to credit risk
Credit risk is the risk of financial loss if a customer or counterparty fails to meet an obligation under a contract. It arises principally from lending, trade finance and treasury business, principally from the holdings of debt securities but also from off-balance sheet products such as guarantees. The local group has standards, policies and procedures dedicated to control and monitor the risk arising from all such activities.
ii Credit risk management
Within the overall framework of the local group policy, the local group has an established risk management process encompassing credit approvals, the control of exposures, credit policy direction to business units and the monitoring and reporting of exposures both on an individual and a portfolio basis which includes the management of adverse trends. Management is responsible for the quality of its credit portfolios and follows a credit process involving delegated approval authorities and credit procedures, the objective of which is to build and maintain risk assets of high quality. Regular reviews are undertaken to assess and evaluate levels of risk concentrations by market sector and product.
The bank’s credit risk rating systems and processes differentiate exposures in order to highlight those with greater risk factors and higher potential severity of loss. In the case of individually significant accounts, risk ratings are reviewed regularly and any amendments are implemented promptly.
The principal objectives of the local group’s credit risk management are:
– to maintain a strong culture of responsible lending and a robust risk policy and control framework;
– to both partner and challenge global businesses in defining, implementing, and continually re-evaluating risk appetite under actual and scenario conditions; and
– to ensure there is independent, expert scrutiny of credit risks.
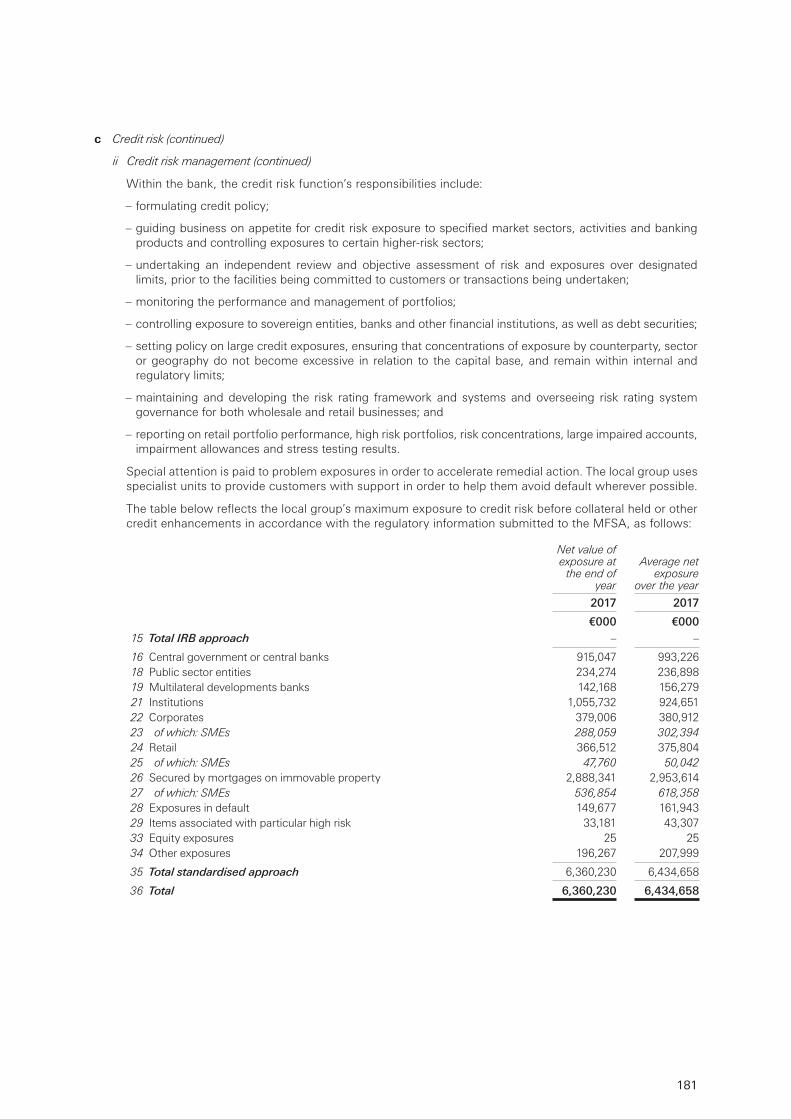
181
c Credit risk (continued)
ii Credit risk management (continued)
Within the bank, the credit risk function’s responsibilities include:
– formulating credit policy;
– guiding business on appetite for credit risk exposure to specified market sectors, activities and banking products and controlling exposures to certain higher-risk sectors;
– undertaking an independent review and objective assessment of risk and exposures over designated limits, prior to the facilities being committed to customers or transactions being undertaken;
– monitoring the performance and management of portfolios;
– controlling exposure to sovereign entities, banks and other financial institutions, as well as debt securities;
– setting policy on large credit exposures, ensuring that concentrations of exposure by counterparty, sector or geography do not become excessive in relation to the capital base, and remain within internal and regulatory limits;
– maintaining and developing the risk rating framework and systems and overseeing risk rating system governance for both wholesale and retail businesses; and
– reporting on retail portfolio performance, high risk portfolios, risk concentrations, large impaired accounts, impairment allowances and stress testing results.
Special attention is paid to problem exposures in order to accelerate remedial action. The local group uses specialist units to provide customers with support in order to help them avoid default wherever possible.
The table below reflects the local group’s maximum exposure to credit risk before collateral held or other credit enhancements in accordance with the regulatory information submitted to the MFSA, as follows:
Net value of exposure at
the end of year
Average net exposure
over the year
2017 2017
€000 €00015 Total IRB approach – –
16 Central government or central banks 915,047 993,226 18 Public sector entities 234,274 236,89819 Multilateral developments banks 142,168 156,279 21 Institutions 1,055,732 924,651 22 Corporates 379,006 380,91223 of which: SMEs 288,059 302,39424 Retail 366,512 375,804 25 of which: SMEs 47,760 50,042 26 Secured by mortgages on immovable property 2,888,341 2,953,614 27 of which: SMEs 536,854 618,358 28 Exposures in default 149,677 161,943 29 Items associated with particular high risk 33,181 43,307 33 Equity exposures 25 25 34 Other exposures 196,267 207,999
35 Total standardised approach 6,360,230 6,434,658
36 Total 6,360,230 6,434,658
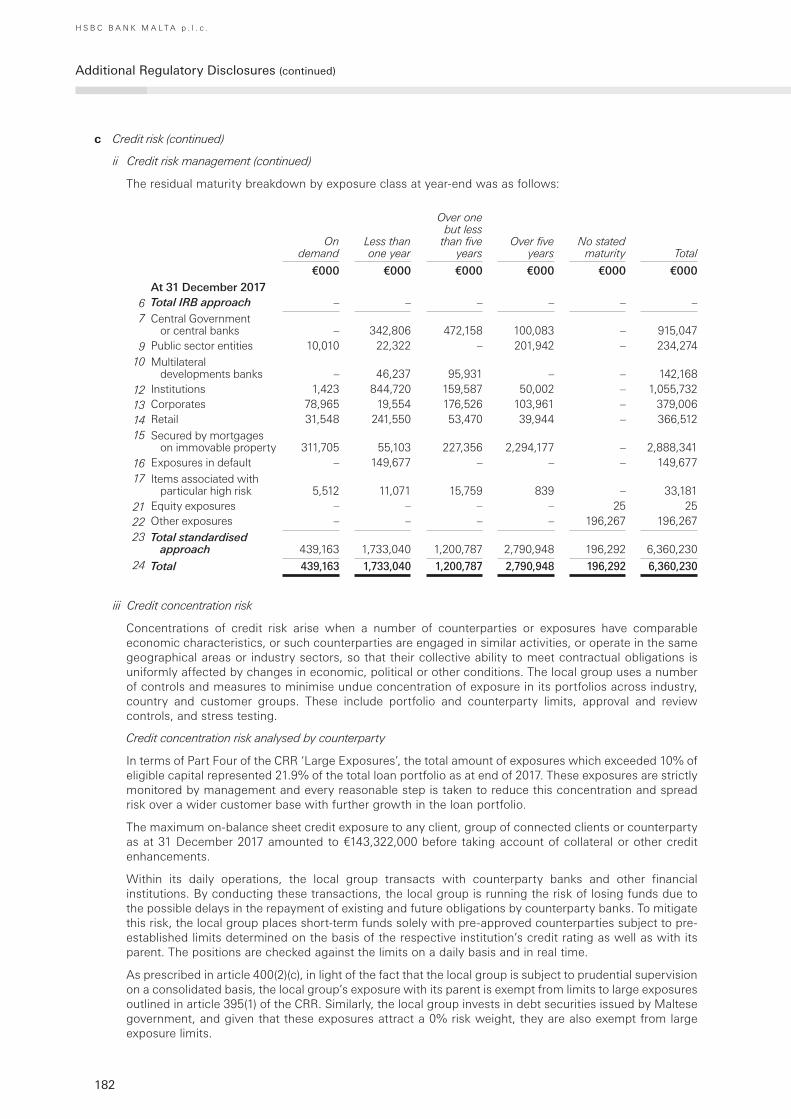
182
H S B C B A N K M A L T A p . l . c .
Additional Regulatory Disclosures (continued)
c Credit risk (continued)
ii Credit risk management (continued)
The residual maturity breakdown by exposure class at year-end was as follows:
On demand
Less than one year
Over one but less
than five years
Over five years
No stated maturity Total
€000 €000 €000 €000 €000 €000At 31 December 2017
6 Total IRB approach – – – – – –7 Central Government
or central banks – 342,806 472,158 100,083 – 915,047 9 Public sector entities 10,010 22,322 – 201,942 – 234,274
10 Multilateral developments banks – 46,237 95,931 – – 142,168
12 Institutions 1,423 844,720 159,587 50,002 – 1,055,732 13 Corporates 78,965 19,554 176,526 103,961 – 379,006 14 Retail 31,548 241,550 53,470 39,944 – 366,512 15 Secured by mortgages
on immovable property 311,705 55,103 227,356 2,294,177 – 2,888,341 16 Exposures in default – 149,677 – – – 149,677 17 Items associated with
particular high risk 5,512 11,071 15,759 839 – 33,181 21 Equity exposures – – – – 25 25 22 Other exposures – – – – 196,267 196,267 23 Total standardised
approach 439,163 1,733,040 1,200,787 2,790,948 196,292 6,360,230 24 Total 439,163 1,733,040 1,200,787 2,790,948 196,292 6,360,230
iii Credit concentration risk
Concentrations of credit risk arise when a number of counterparties or exposures have comparable economic characteristics, or such counterparties are engaged in similar activities, or operate in the same geographical areas or industry sectors, so that their collective ability to meet contractual obligations is uniformly affected by changes in economic, political or other conditions. The local group uses a number of controls and measures to minimise undue concentration of exposure in its portfolios across industry, country and customer groups. These include portfolio and counterparty limits, approval and review controls, and stress testing.
Credit concentration risk analysed by counterparty
In terms of Part Four of the CRR ‘Large Exposures’, the total amount of exposures which exceeded 10% of eligible capital represented 21.9% of the total loan portfolio as at end of 2017. These exposures are strictly monitored by management and every reasonable step is taken to reduce this concentration and spread risk over a wider customer base with further growth in the loan portfolio.
The maximum on-balance sheet credit exposure to any client, group of connected clients or counterparty as at 31 December 2017 amounted to €143,322,000 before taking account of collateral or other credit enhancements.
Within its daily operations, the local group transacts with counterparty banks and other financial institutions. By conducting these transactions, the local group is running the risk of losing funds due to the possible delays in the repayment of existing and future obligations by counterparty banks. To mitigate this risk, the local group places short-term funds solely with pre-approved counterparties subject to pre-established limits determined on the basis of the respective institution’s credit rating as well as with its parent. The positions are checked against the limits on a daily basis and in real time.
As prescribed in article 400(2)(c), in light of the fact that the local group is subject to prudential supervision on a consolidated basis, the local group’s exposure with its parent is exempt from limits to large exposures outlined in article 395(1) of the CRR. Similarly, the local group invests in debt securities issued by Maltese government, and given that these exposures attract a 0% risk weight, they are also exempt from large exposure limits.
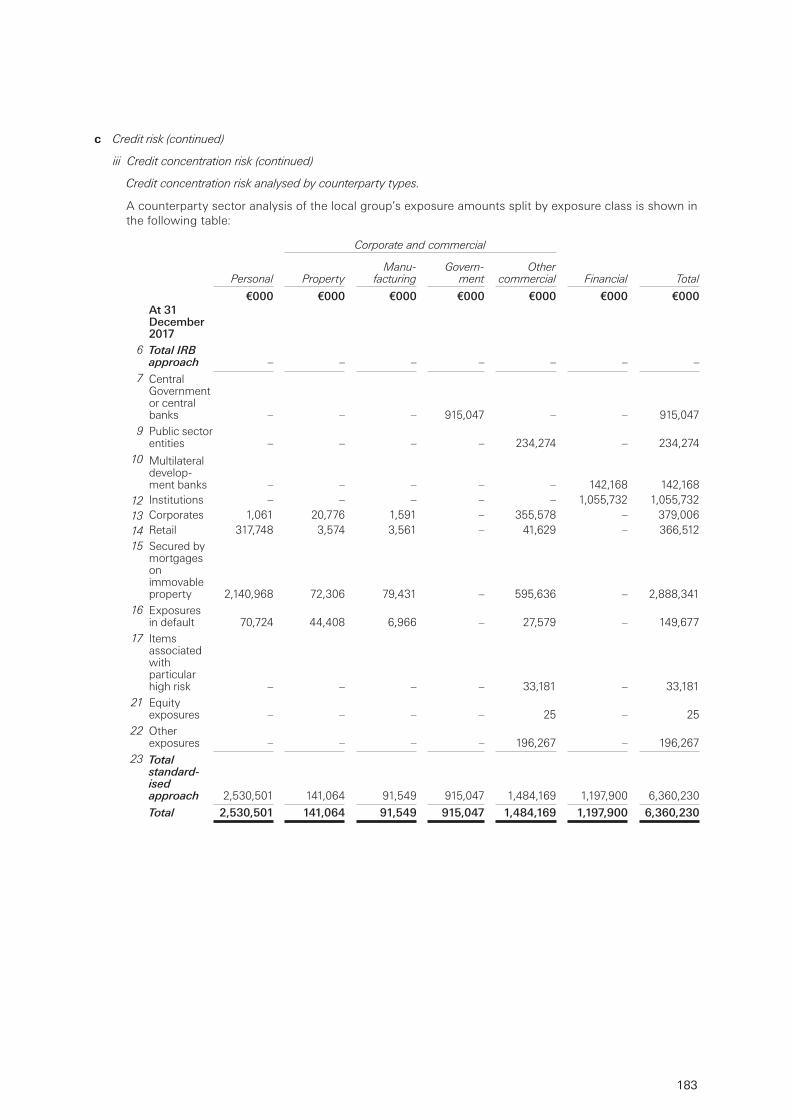
183
c Credit risk (continued)
iii Credit concentration risk (continued)
Credit concentration risk analysed by counterparty types.
A counterparty sector analysis of the local group’s exposure amounts split by exposure class is shown in the following table:
Corporate and commercial
Personal PropertyManu-
facturingGovern-
mentOther
commercial Financial Total
€000 €000 €000 €000 €000 €000 €000At 31 December 2017
6 Total IRB approach – – – – – – –
7 Central Government or central banks – – – 915,047 – – 915,047
9 Public sector entities – – – – 234,274 – 234,274
10 Multilateral develop-ment banks – – – – – 142,168 142,168
12 Institutions – – – – – 1,055,732 1,055,73213 Corporates 1,061 20,776 1,591 – 355,578 – 379,00614 Retail 317,748 3,574 3,561 – 41,629 – 366,51215 Secured by
mortgages on immovable property 2,140,968 72,306 79,431 – 595,636 – 2,888,341
16 Exposures in default 70,724 44,408 6,966 – 27,579 – 149,677
17 Items associated with particular high risk – – – – 33,181 – 33,181
21 Equity exposures – – – – 25 – 25
22 Other exposures – – – – 196,267 – 196,267
23 Total standard-ised approach 2,530,501 141,064 91,549 915,047 1,484,169 1,197,900 6,360,230
Total 2,530,501 141,064 91,549 915,047 1,484,169 1,197,900 6,360,230
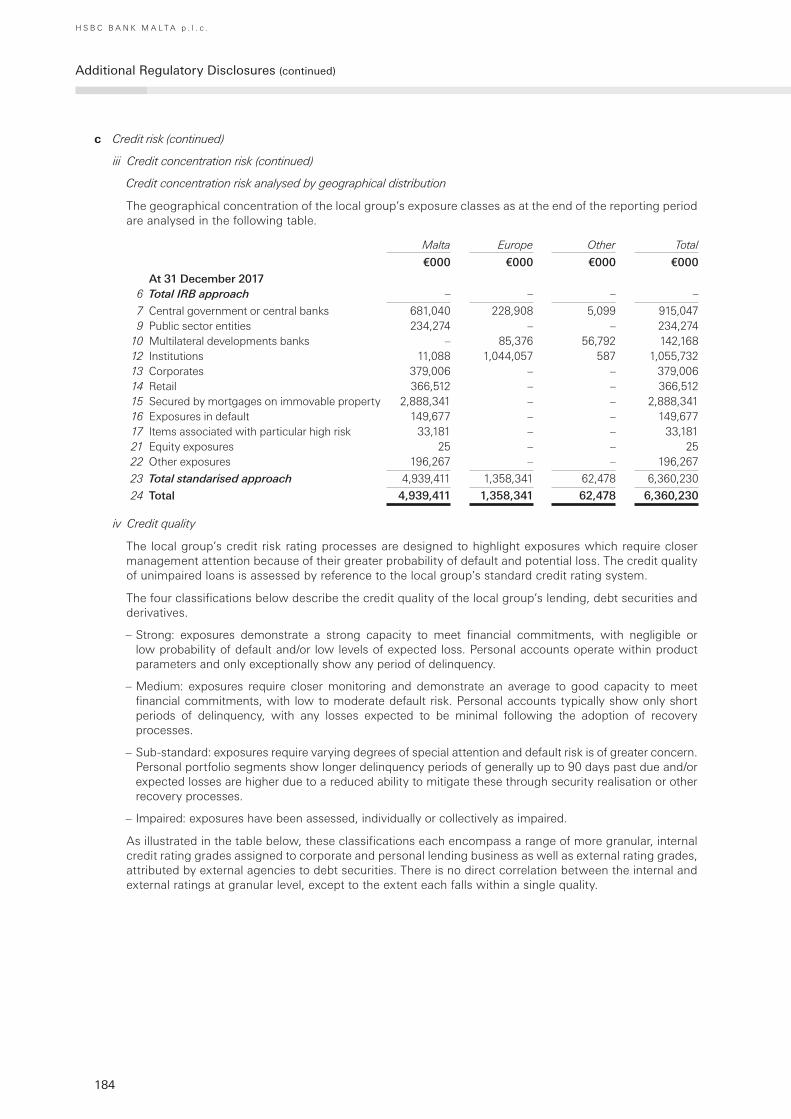
184
H S B C B A N K M A L T A p . l . c .
Additional Regulatory Disclosures (continued)
c Credit risk (continued)
iii Credit concentration risk (continued)
Credit concentration risk analysed by geographical distribution
The geographical concentration of the local group’s exposure classes as at the end of the reporting period are analysed in the following table.
Malta Europe Other Total
€000 €000 €000 €000At 31 December 2017
6 Total IRB approach – – – –
7 Central government or central banks 681,040 228,908 5,099 915,0479 Public sector entities 234,274 – – 234,274
10 Multilateral developments banks – 85,376 56,792 142,16812 Institutions 11,088 1,044,057 587 1,055,73213 Corporates 379,006 – – 379,00614 Retail 366,512 – – 366,51215 Secured by mortgages on immovable property 2,888,341 – – 2,888,34116 Exposures in default 149,677 – – 149,67717 Items associated with particular high risk 33,181 – – 33,18121 Equity exposures 25 – – 2522 Other exposures 196,267 – – 196,267
23 Total standarised approach 4,939,411 1,358,341 62,478 6,360,230
24 Total 4,939,411 1,358,341 62,478 6,360,230
iv Credit quality
The local group’s credit risk rating processes are designed to highlight exposures which require closer management attention because of their greater probability of default and potential loss. The credit quality of unimpaired loans is assessed by reference to the local group’s standard credit rating system.
The four classifications below describe the credit quality of the local group’s lending, debt securities and derivatives.
– Strong: exposures demonstrate a strong capacity to meet financial commitments, with negligible or low probability of default and/or low levels of expected loss. Personal accounts operate within product parameters and only exceptionally show any period of delinquency.
– Medium: exposures require closer monitoring and demonstrate an average to good capacity to meet financial commitments, with low to moderate default risk. Personal accounts typically show only short periods of delinquency, with any losses expected to be minimal following the adoption of recovery processes.
– Sub-standard: exposures require varying degrees of special attention and default risk is of greater concern. Personal portfolio segments show longer delinquency periods of generally up to 90 days past due and/or expected losses are higher due to a reduced ability to mitigate these through security realisation or other recovery processes.
– Impaired: exposures have been assessed, individually or collectively as impaired.
As illustrated in the table below, these classifications each encompass a range of more granular, internal credit rating grades assigned to corporate and personal lending business as well as external rating grades, attributed by external agencies to debt securities. There is no direct correlation between the internal and external ratings at granular level, except to the extent each falls within a single quality.
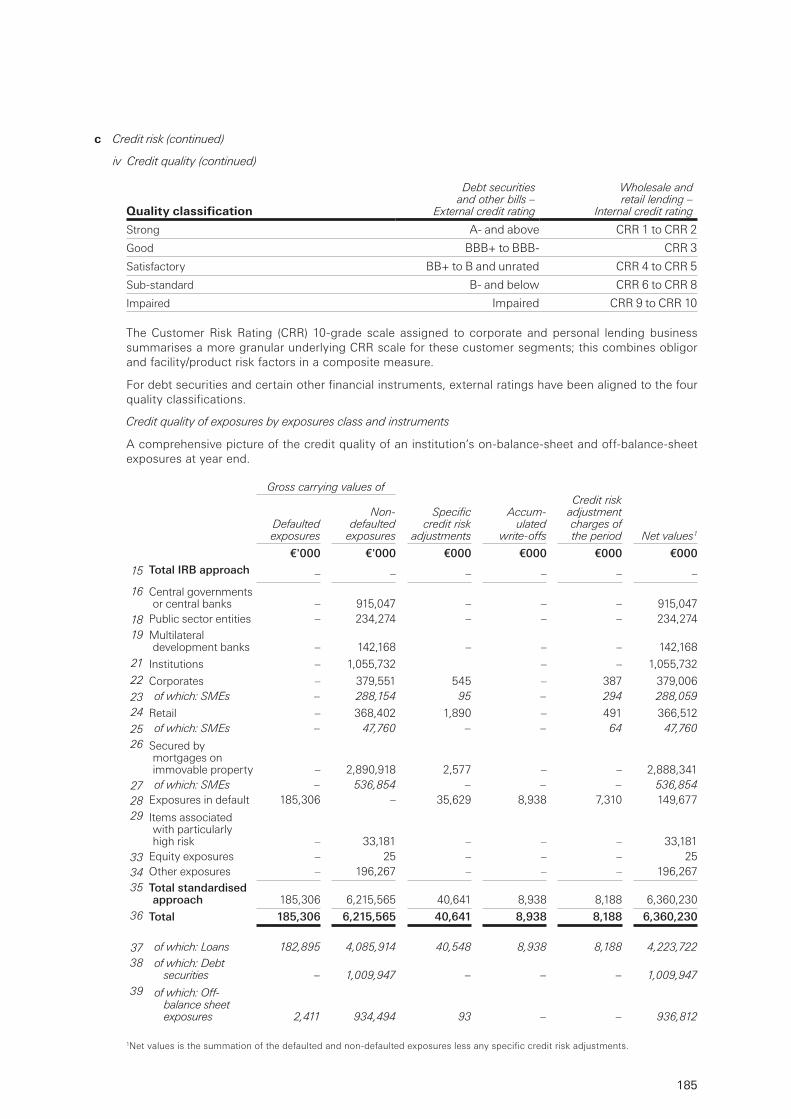
185
c Credit risk (continued)
iv Credit quality (continued)
Quality classification
Debt securities and other bills –
External credit rating
Wholesale and retail lending –
Internal credit rating
Strong A- and above CRR 1 to CRR 2
Good BBB+ to BBB- CRR 3
Satisfactory BB+ to B and unrated CRR 4 to CRR 5
Sub-standard B- and below CRR 6 to CRR 8
Impaired Impaired CRR 9 to CRR 10
The Customer Risk Rating (CRR) 10-grade scale assigned to corporate and personal lending business summarises a more granular underlying CRR scale for these customer segments; this combines obligor and facility/product risk factors in a composite measure.
For debt securities and certain other financial instruments, external ratings have been aligned to the four quality classifications.
Credit quality of exposures by exposures class and instruments
A comprehensive picture of the credit quality of an institution’s on-balance-sheet and off-balance-sheet exposures at year end.
Gross carrying values of
Defaulted exposures
Non-defaulted
exposures
Specific credit risk
adjustments
Accum-ulated
write-offs
Credit risk adjustment charges of the period Net values1
€'000 €'000 €000 €000 €000 €000
15 Total IRB approach – – – – – –
16 Central governments or central banks – 915,047 – – – 915,047
18 Public sector entities – 234,274 – – – 234,274 19 Multilateral
development banks – 142,168 – – – 142,168 21 Institutions – 1,055,732 – – 1,055,732 22 Corporates – 379,551 545 – 387 379,006 23 of which: SMEs – 288,154 95 – 294 288,059 24 Retail – 368,402 1,890 – 491 366,512 25 of which: SMEs – 47,760 – – 64 47,760 26 Secured by
mortgages on immovable property – 2,890,918 2,577 – – 2,888,341
27 of which: SMEs – 536,854 – – – 536,854 28 Exposures in default 185,306 – 35,629 8,938 7,310 149,67729 Items associated
with particularly high risk – 33,181 – – – 33,181
33 Equity exposures – 25 – – – 25 34 Other exposures – 196,267 – – – 196,267 35 Total standardised
approach 185,306 6,215,565 40,641 8,938 8,188 6,360,230 36 Total 185,306 6,215,565 40,641 8,938 8,188 6,360,230
37 of which: Loans 182,895 4,085,914 40,548 8,938 8,188 4,223,722 38 of which: Debt
securities – 1,009,947 – – – 1,009,947 39 of which: Off-
balance sheet exposures 2,411 934,494 93 – – 936,812
1Net values is the summation of the defaulted and non-defaulted exposures less any specific credit risk adjustments.
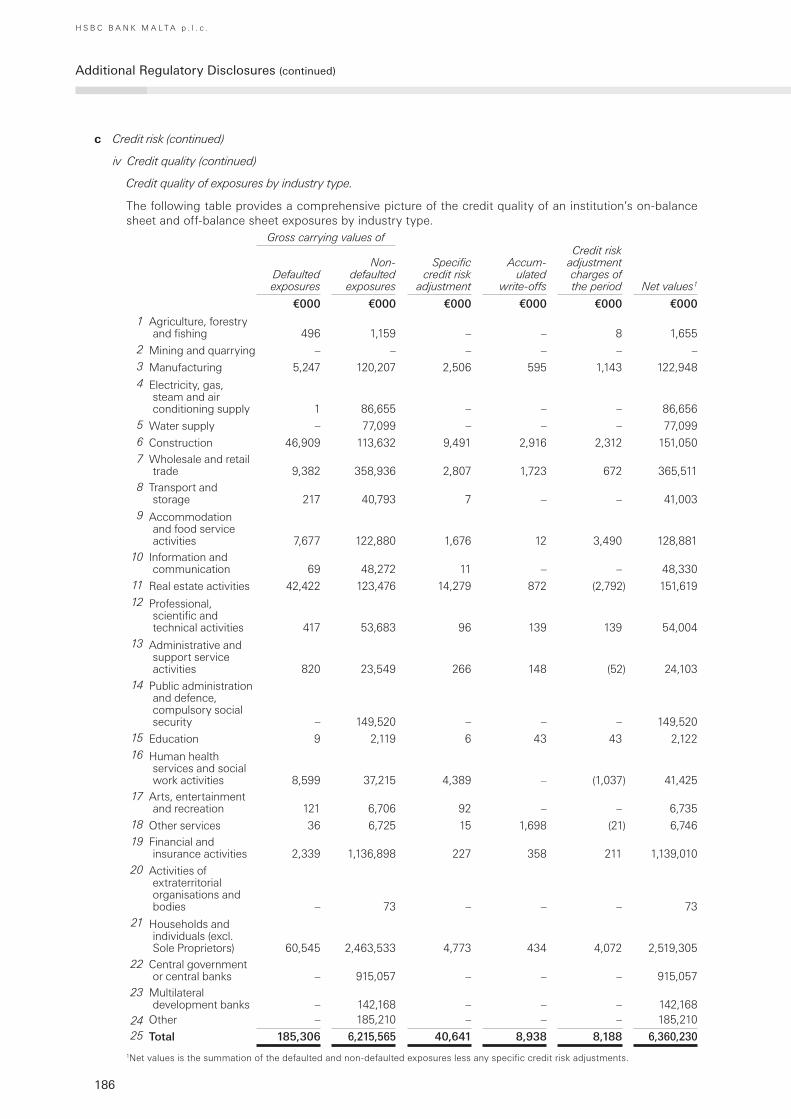
186
H S B C B A N K M A L T A p . l . c .
Additional Regulatory Disclosures (continued)
c Credit risk (continued)
iv Credit quality (continued)
Credit quality of exposures by industry type.
The following table provides a comprehensive picture of the credit quality of an institution’s on-balance sheet and off-balance sheet exposures by industry type.
Gross carrying values of
Defaulted exposures
Non-defaulted
exposures
Specific credit risk
adjustment
Accum-ulated
write-offs
Credit risk adjustment charges of the period Net values1
€000 €000 €000 €000 €000 €000
1 Agriculture, forestry and fishing 496 1,159 – – 8 1,655
2 Mining and quarrying – – – – – – 3 Manufacturing 5,247 120,207 2,506 595 1,143 122,948 4 Electricity, gas,
steam and air conditioning supply 1 86,655 – – – 86,656
5 Water supply – 77,099 – – – 77,099 6 Construction 46,909 113,632 9,491 2,916 2,312 151,050 7 Wholesale and retail
trade 9,382 358,936 2,807 1,723 672 365,511 8 Transport and
storage 217 40,793 7 – – 41,003 9 Accommodation
and food service activities 7,677 122,880 1,676 12 3,490 128,881
10 Information and communication 69 48,272 11 – – 48,330
11 Real estate activities 42,422 123,476 14,279 872 (2,792) 151,619 12 Professional,
scientific and technical activities 417 53,683 96 139 139 54,004
13 Administrative and support service activities 820 23,549 266 148 (52) 24,103
14 Public administration and defence, compulsory social security – 149,520 – – – 149,520
15 Education 9 2,119 6 43 43 2,122 16 Human health
services and social work activities 8,599 37,215 4,389 – (1,037) 41,425
17 Arts, entertainment and recreation 121 6,706 92 – – 6,735
18 Other services 36 6,725 15 1,698 (21) 6,746 19 Financial and
insurance activities 2,339 1,136,898 227 358 211 1,139,010 20 Activities of
extraterritorial organisations and bodies – 73 – – – 73
21 Households and individuals (excl. Sole Proprietors) 60,545 2,463,533 4,773 434 4,072 2,519,305
22 Central government or central banks – 915,057 – – – 915,057
23 Multilateral development banks – 142,168 – – – 142,168
24 Other – 185,210 – – – 185,210 25 Total 185,306 6,215,565 40,641 8,938 8,188 6,360,230
1Net values is the summation of the defaulted and non-defaulted exposures less any specific credit risk adjustments.
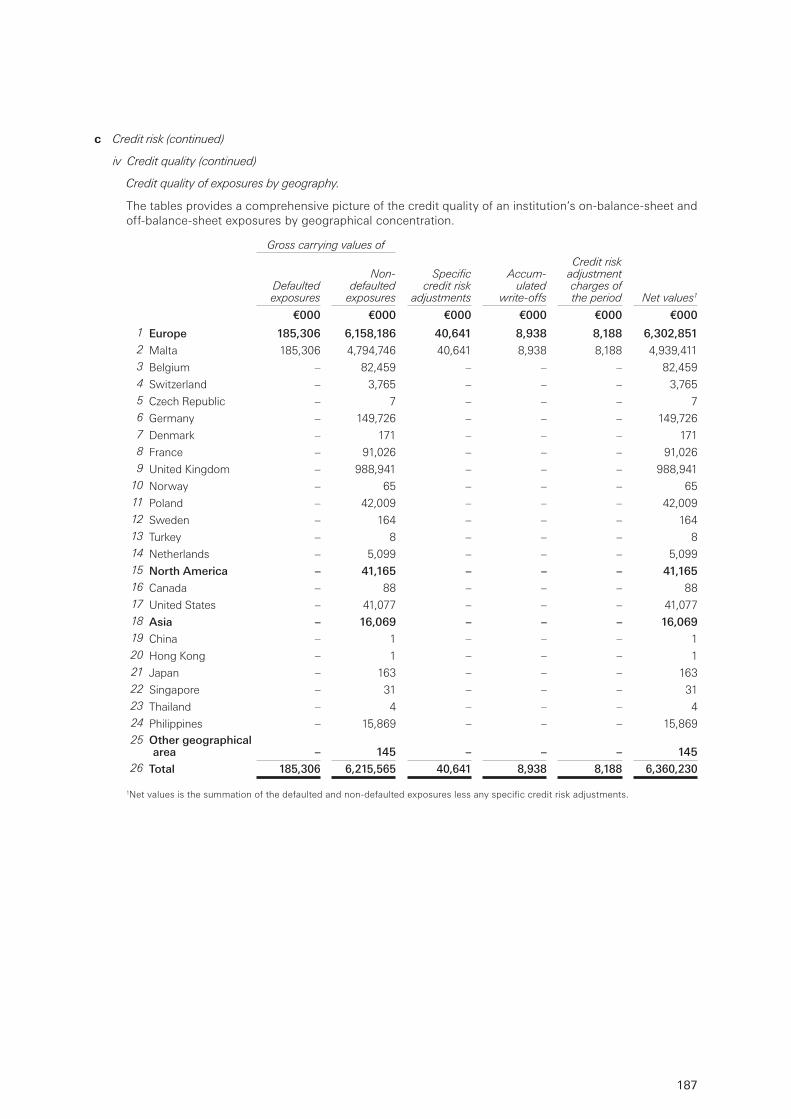
187
c Credit risk (continued)
iv Credit quality (continued)
Credit quality of exposures by geography.
The tables provides a comprehensive picture of the credit quality of an institution’s on-balance-sheet and off-balance-sheet exposures by geographical concentration.
Gross carrying values of
Defaulted exposures
Non-defaulted
exposures
Specific credit risk
adjustments
Accum-ulated
write-offs
Credit risk adjustment charges of the period Net values1
€000 €000 €000 €000 €000 €000
1 Europe 185,306 6,158,186 40,641 8,938 8,188 6,302,851 2 Malta 185,306 4,794,746 40,641 8,938 8,188 4,939,411 3 Belgium – 82,459 – – – 82,459 4 Switzerland – 3,765 – – – 3,765 5 Czech Republic – 7 – – – 7 6 Germany – 149,726 – – – 149,726 7 Denmark – 171 – – – 171 8 France – 91,026 – – – 91,026 9 United Kingdom – 988,941 – – – 988,941
10 Norway – 65 – – – 65 11 Poland – 42,009 – – – 42,009 12 Sweden – 164 – – – 164 13 Turkey – 8 – – – 8 14 Netherlands – 5,099 – – – 5,099 15 North America – 41,165 – – – 41,165 16 Canada – 88 – – – 88 17 United States – 41,077 – – – 41,077 18 Asia – 16,069 – – – 16,069 19 China – 1 – – – 1 20 Hong Kong – 1 – – – 1 21 Japan – 163 – – – 163 22 Singapore – 31 – – – 31 23 Thailand – 4 – – – 4 24 Philippines – 15,869 – – – 15,869 25 Other geographical
area – 145 – – – 145 26 Total 185,306 6,215,565 40,641 8,938 8,188 6,360,230
1Net values is the summation of the defaulted and non-defaulted exposures less any specific credit risk adjustments.
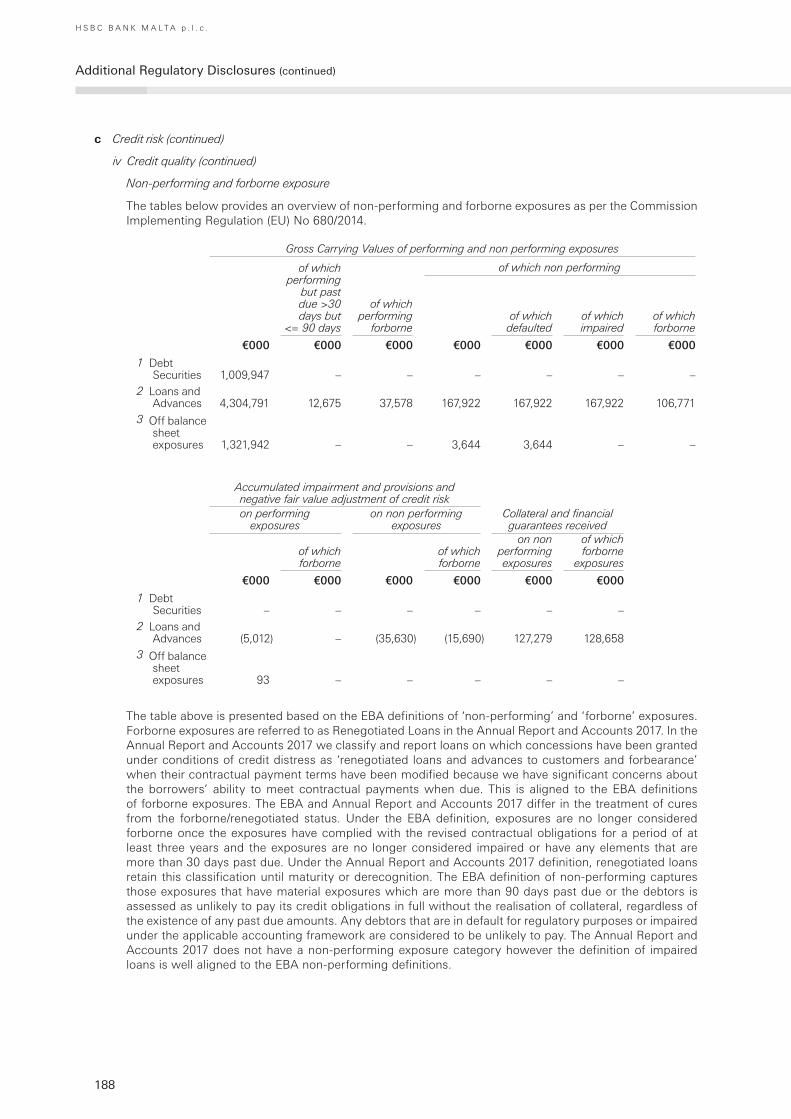
188
H S B C B A N K M A L T A p . l . c .
Additional Regulatory Disclosures (continued)
c Credit risk (continued)
iv Credit quality (continued)
Non-performing and forborne exposure
The tables below provides an overview of non-performing and forborne exposures as per the Commission Implementing Regulation (EU) No 680/2014.
Gross Carrying Values of performing and non performing exposures
of which performing
but past due >30 days but
<= 90 days
of which performing
forborne
of which non performing
of which defaulted
of which impaired
of which forborne
€000 €000 €000 €000 €000 €000 €000
1 Debt Securities 1,009,947 – – – – – –
2 Loans and Advances 4,304,791 12,675 37,578 167,922 167,922 167,922 106,771
3 Off balance sheet exposures 1,321,942 – – 3,644 3,644 – –
Accumulated impairment and provisions and negative fair value adjustment of credit risk
Collateral and financial guarantees received
on performing exposures
on non performing exposures
of which forborne
of which forborne
on non performing exposures
of which forborne
exposures
€000 €000 €000 €000 €000 €000
1 Debt Securities – – – – – –
2 Loans and Advances (5,012) – (35,630) (15,690) 127,279 128,658
3 Off balance sheet exposures 93 – – – – –
The table above is presented based on the EBA definitions of ‘non-performing’ and ‘forborne’ exposures. Forborne exposures are referred to as Renegotiated Loans in the Annual Report and Accounts 2017. In the Annual Report and Accounts 2017 we classify and report loans on which concessions have been granted under conditions of credit distress as ‘renegotiated loans and advances to customers and forbearance’ when their contractual payment terms have been modified because we have significant concerns about the borrowers’ ability to meet contractual payments when due. This is aligned to the EBA definitions of forborne exposures. The EBA and Annual Report and Accounts 2017 differ in the treatment of cures from the forborne/renegotiated status. Under the EBA definition, exposures are no longer considered forborne once the exposures have complied with the revised contractual obligations for a period of at least three years and the exposures are no longer considered impaired or have any elements that are more than 30 days past due. Under the Annual Report and Accounts 2017 definition, renegotiated loans retain this classification until maturity or derecognition. The EBA definition of non-performing captures those exposures that have material exposures which are more than 90 days past due or the debtors is assessed as unlikely to pay its credit obligations in full without the realisation of collateral, regardless of the existence of any past due amounts. Any debtors that are in default for regulatory purposes or impaired under the applicable accounting framework are considered to be unlikely to pay. The Annual Report and Accounts 2017 does not have a non-performing exposure category however the definition of impaired loans is well aligned to the EBA non-performing definitions.
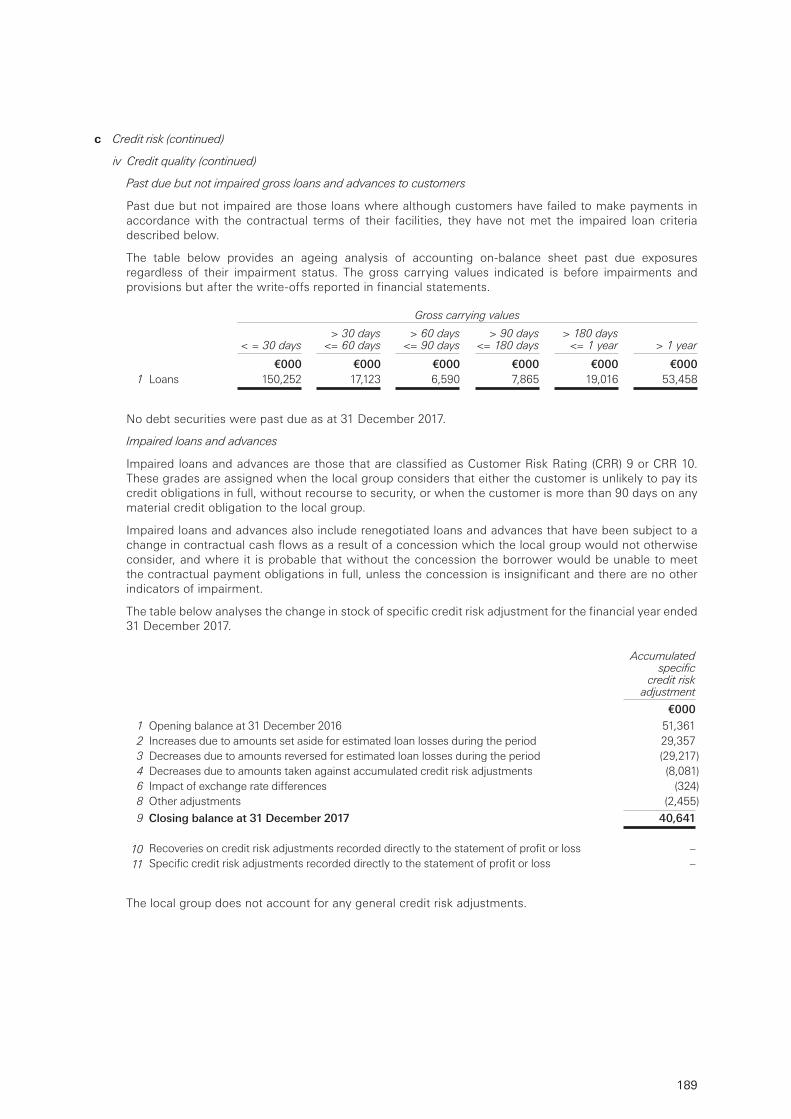
189
c Credit risk (continued)
iv Credit quality (continued)
Past due but not impaired gross loans and advances to customers
Past due but not impaired are those loans where although customers have failed to make payments in accordance with the contractual terms of their facilities, they have not met the impaired loan criteria described below.
The table below provides an ageing analysis of accounting on-balance sheet past due exposures regardless of their impairment status. The gross carrying values indicated is before impairments and provisions but after the write-offs reported in financial statements.
Gross carrying values
< = 30 days> 30 days
<= 60 days> 60 days
<= 90 days> 90 days
<= 180 days> 180 days
<= 1 year > 1 year
€000 €000 €000 €000 €000 €0001 Loans 150,252 17,123 6,590 7,865 19,016 53,458
No debt securities were past due as at 31 December 2017.
Impaired loans and advances
Impaired loans and advances are those that are classified as Customer Risk Rating (CRR) 9 or CRR 10. These grades are assigned when the local group considers that either the customer is unlikely to pay its credit obligations in full, without recourse to security, or when the customer is more than 90 days on any material credit obligation to the local group.
Impaired loans and advances also include renegotiated loans and advances that have been subject to a change in contractual cash flows as a result of a concession which the local group would not otherwise consider, and where it is probable that without the concession the borrower would be unable to meet the contractual payment obligations in full, unless the concession is insignificant and there are no other indicators of impairment.
The table below analyses the change in stock of specific credit risk adjustment for the financial year ended 31 December 2017.
Accumulated specific
credit risk adjustment
€0001 Opening balance at 31 December 2016 51,361 2 Increases due to amounts set aside for estimated loan losses during the period 29,357 3 Decreases due to amounts reversed for estimated loan losses during the period (29,217)4 Decreases due to amounts taken against accumulated credit risk adjustments (8,081)6 Impact of exchange rate differences (324)8 Other adjustments (2,455)
9 Closing balance at 31 December 2017 40,641
10 Recoveries on credit risk adjustments recorded directly to the statement of profit or loss –11 Specific credit risk adjustments recorded directly to the statement of profit or loss –
The local group does not account for any general credit risk adjustments.
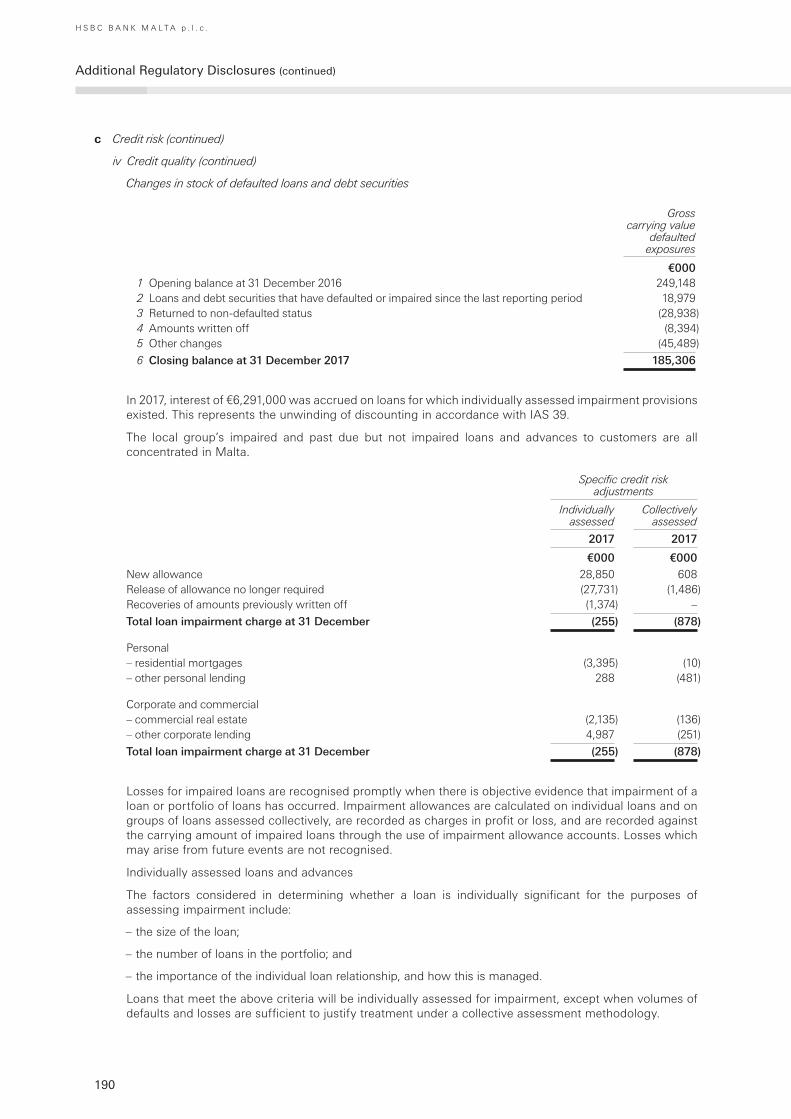
190
H S B C B A N K M A L T A p . l . c .
Additional Regulatory Disclosures (continued)
c Credit risk (continued)
iv Credit quality (continued)
Changes in stock of defaulted loans and debt securities
Gross carrying value
defaulted exposures
€0001 Opening balance at 31 December 2016 249,1482 Loans and debt securities that have defaulted or impaired since the last reporting period 18,9793 Returned to non-defaulted status (28,938)4 Amounts written off (8,394)5 Other changes (45,489)
6 Closing balance at 31 December 2017 185,306
In 2017, interest of €6,291,000 was accrued on loans for which individually assessed impairment provisions existed. This represents the unwinding of discounting in accordance with IAS 39.
The local group’s impaired and past due but not impaired loans and advances to customers are all concentrated in Malta.
Specific credit risk adjustments
Individually assessed
Collectively assessed
2017 2017
€000 €000New allowance 28,850 608 Release of allowance no longer required (27,731) (1,486)Recoveries of amounts previously written off (1,374) –
Total loan impairment charge at 31 December (255) (878)
Personal– residential mortgages (3,395) (10)– other personal lending 288 (481)
Corporate and commercial– commercial real estate (2,135) (136)– other corporate lending 4,987 (251)
Total loan impairment charge at 31 December (255) (878)
Losses for impaired loans are recognised promptly when there is objective evidence that impairment of a loan or portfolio of loans has occurred. Impairment allowances are calculated on individual loans and on groups of loans assessed collectively, are recorded as charges in profit or loss, and are recorded against the carrying amount of impaired loans through the use of impairment allowance accounts. Losses which may arise from future events are not recognised.
Individually assessed loans and advances
The factors considered in determining whether a loan is individually significant for the purposes of assessing impairment include:
– the size of the loan;
– the number of loans in the portfolio; and
– the importance of the individual loan relationship, and how this is managed.
Loans that meet the above criteria will be individually assessed for impairment, except when volumes of defaults and losses are sufficient to justify treatment under a collective assessment methodology.
191
c Credit risk (continued)
iv Credit quality (continued)
Changes in stock of defaulted loans and debt securities (continued)
For all loans that are considered individually significant, the local group considers on a case-by-case basis at each reporting date whether there is any objective evidence that a loan is impaired. The criteria used by the local group to make this assessment include:
– known cash flow difficulties experienced by the borrower;
– contractual payments of either principal or interest being past due for more than 90 days;
– the probability that the borrower will enter bankruptcy or other financial realisation;
– a concession granted to the borrower for economic or legal reasons relating to the borrower’s financial difficulty that results in forgiveness or postponement of principal, interest or fees, where the concession is not insignificant; and
– there has been deterioration in the financial condition or outlook of the borrower such that its ability to repay is considered doubtful.
For loans where objective evidence of impairment exists, impaired losses are determined considering the following factors:
– the local group’s aggregate exposure to the customer;
– the viability of the customer’s business model and their capability to trade successfully out of financial difficulties and generate sufficient cash flow to service debt obligations;
– the amount and timing of expected receipts and recoveries;
– the likely dividend available on liquidation or bankruptcy;
– the extent of other creditors’ commitments ranking ahead of, or pari passu with, the local group and the likelihood of other creditors continuing to support the customer;
– the complexity of determining the aggregate amount and ranking of all creditor claims and the extent to which legal and insurance uncertainties are evident;
– the realisable value of security (or other credit risk mitigants) and likelihood of successful repossession; and
– the likely costs of obtaining and selling collateral as part of foreclosure.
Determination of the realisable value of security is based on the current market value when the impairment assessment is performed. The value is not adjusted for expected future changes in market prices, though adjustments are made to reflect local conditions, such as forced sale discounts.
Impairment losses are calculated by discounting the expected future cash flows of a loan, which includes expected future receipts of contractual interest, at the loan’s original effective interest rate and comparing the resultant present value with the loan’s current carrying amount. The impairment allowances on individually significant accounts are reviewed at least annually and more regularly when circumstances necessitate review. This normally encompasses re-assessment of the enforceability of any collateral held and the timing and amount of actual and anticipated receipts. Individually assessed impairment allowances are only released when there is reasonable and objective evidence of a reduction in the established loss estimate.
Collectively assessed loans and advances
Impairment is assessed on a collective basis:
– to cover losses which have been incurred but have not yet been identified on loans subject to individual assessment; and
– for homogeneous groups of loans that are not considered individually significant.
192
H S B C B A N K M A L T A p . l . c .
Additional Regulatory Disclosures (continued)
c Credit risk (continued)
iv Credit quality (continued)
Changes in stock of defaulted loans and debt securities (continued)
Incurred but not yet identified impairment
Individually assessed loans for which no evidence of loss has been specifically identified on an individual basis are grouped together according to their credit risk characteristics for a collective impairment assessment. These credit risk characteristics may include type of business involved, type of products offered, security obtained or other relevant factors. This assessment captures impairment losses that the local group has incurred as a result of events occurring before the reporting date, which the local group is not able to identify on an individual loan basis, and that can be reliably estimated. These losses would only be identified individually in the future. When information becomes available which identifies losses on individual loans within the group, those loans are removed from the group and assessed on an individual basis.
The collective impairment allowance is determined after taking into account:
– historical loss experience in portfolios of similar risk characteristics (for example, by industry sector, loan grade or product);
– the estimated period between impairment occurring and the loss being identified and evidenced by the establishment of an appropriate allowance against the individual loan; and
– management’s judgement as to whether the current economic and credit conditions are such that the actual level of inherent losses at the reporting date is likely to be greater or less than that suggested by historical experience.
The period between a loss occurring and its identification is estimated by local management for each identified portfolio based on economic and market conditions, customer behaviour, portfolio management information, credit management techniques and collection and recovery experiences in the market. As it is assessed empirically on a periodic basis the estimated period between a loss occurring and its identification may vary over time as these factors change.
Homogeneous groups of loans and advances
For homogeneous groups of loans that are not considered individually significant, two alternative methods are used to calculate allowances on a portfolio basis:
– When appropriate empirical information is available, the local group utilises roll rate methodology. This methodology employs statistical analysis of historical data and experience of delinquency and default to estimate the loans that will eventually be written off as a result of the events occurring before the balance sheet date but which the group is not able to identify individually. Individual loans are grouped using ranges of past due days; statistical analysis is then used to estimate the likelihood that loans in each range will progress through the various stages of delinquency and become irrecoverable. In applying this methodology, adjustments are made to estimate the periods of time between a loss event occurring and its discovery, for example through a missed payment, (known as the emergence period) and the period of time between discovery and write-off (known as the outcome period). Current economic conditions are also evaluated when calculating the appropriate level of allowance required to cover inherent loss.
– When the portfolio size is small or when information is insufficient or not reliable enough to adopt a roll rate methodology, the local group adopts a formulaic approach based on historical loss rate experience. Where a basic formulaic approach is undertaken, the period between a loss event occurring and its identification is explicitly estimated by local management.
The inherent loss within each portfolio is assessed on the basis of statistical models using historical data observations, which are updated periodically to reflect recent portfolio and economic trends. When the most recent trends arising from changes in economic, regulatory or behavioural conditions are not fully reflected in the statistical models, they are taken into account by adjusting the impairment allowances derived from the statistical models to reflect these changes as at the reporting date.
Reversals of impairment
If the amount of an impairment loss decreases in a subsequent period, and the decrease can be related objectively to an event occurring after the impairment was recognised, the excess is written back by reducing the loan impairment allowance account accordingly. The reversal is recognised in profit or loss.
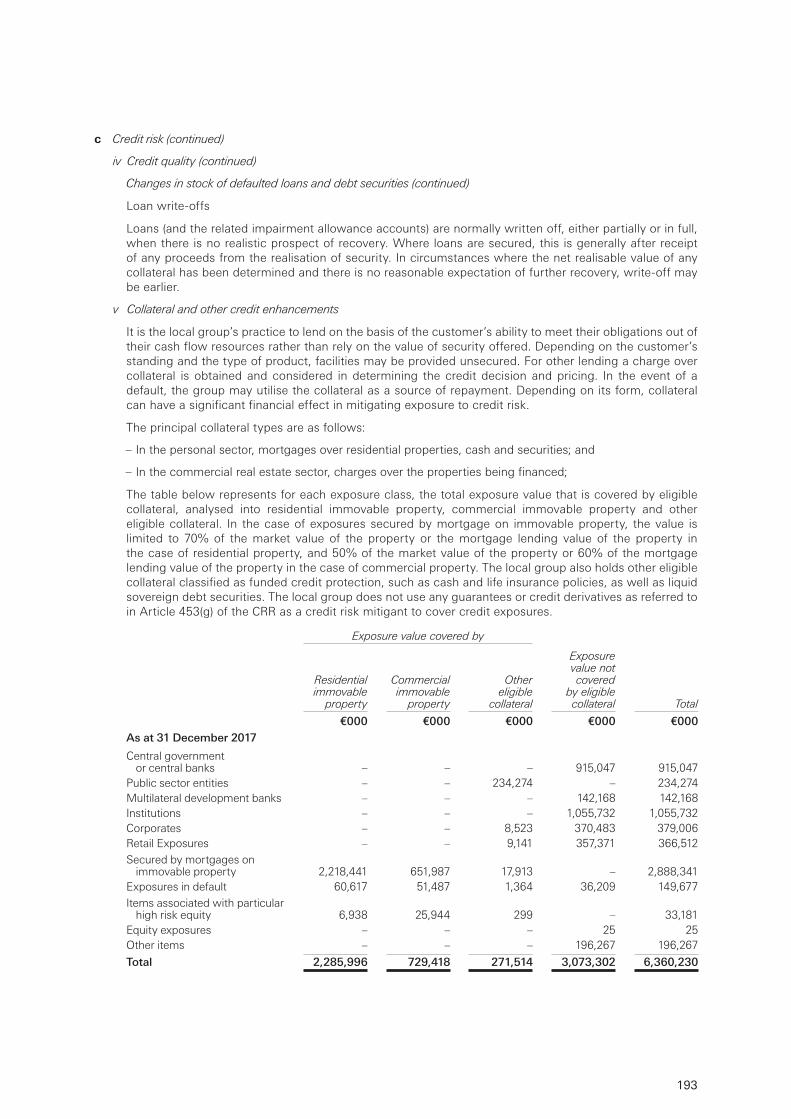
193
c Credit risk (continued)
iv Credit quality (continued)
Changes in stock of defaulted loans and debt securities (continued)
Loan write-offs
Loans (and the related impairment allowance accounts) are normally written off, either partially or in full, when there is no realistic prospect of recovery. Where loans are secured, this is generally after receipt of any proceeds from the realisation of security. In circumstances where the net realisable value of any collateral has been determined and there is no reasonable expectation of further recovery, write-off may be earlier.
v Collateral and other credit enhancements
It is the local group’s practice to lend on the basis of the customer’s ability to meet their obligations out of their cash flow resources rather than rely on the value of security offered. Depending on the customer’s standing and the type of product, facilities may be provided unsecured. For other lending a charge over collateral is obtained and considered in determining the credit decision and pricing. In the event of a default, the group may utilise the collateral as a source of repayment. Depending on its form, collateral can have a significant financial effect in mitigating exposure to credit risk.
The principal collateral types are as follows:
– In the personal sector, mortgages over residential properties, cash and securities; and
– In the commercial real estate sector, charges over the properties being financed;
The table below represents for each exposure class, the total exposure value that is covered by eligible collateral, analysed into residential immovable property, commercial immovable property and other eligible collateral. In the case of exposures secured by mortgage on immovable property, the value is limited to 70% of the market value of the property or the mortgage lending value of the property in the case of residential property, and 50% of the market value of the property or 60% of the mortgage lending value of the property in the case of commercial property. The local group also holds other eligible collateral classified as funded credit protection, such as cash and life insurance policies, as well as liquid sovereign debt securities. The local group does not use any guarantees or credit derivatives as referred to in Article 453(g) of the CRR as a credit risk mitigant to cover credit exposures.
Exposure value covered by
Residential immovable
property
Commercial immovable
property
Other eligible
collateral
Exposure value not covered
by eligible collateral Total
€000 €000 €000 €000 €000As at 31 December 2017
Central government or central banks – – – 915,047 915,047
Public sector entities – – 234,274 – 234,274Multilateral development banks – – – 142,168 142,168Institutions – – – 1,055,732 1,055,732Corporates – – 8,523 370,483 379,006Retail Exposures – – 9,141 357,371 366,512Secured by mortgages on
immovable property 2,218,441 651,987 17,913 – 2,888,341Exposures in default 60,617 51,487 1,364 36,209 149,677Items associated with particular
high risk equity 6,938 25,944 299 – 33,181Equity exposures – – – 25 25Other items – – – 196,267 196,267
Total 2,285,996 729,418 271,514 3,073,302 6,360,230
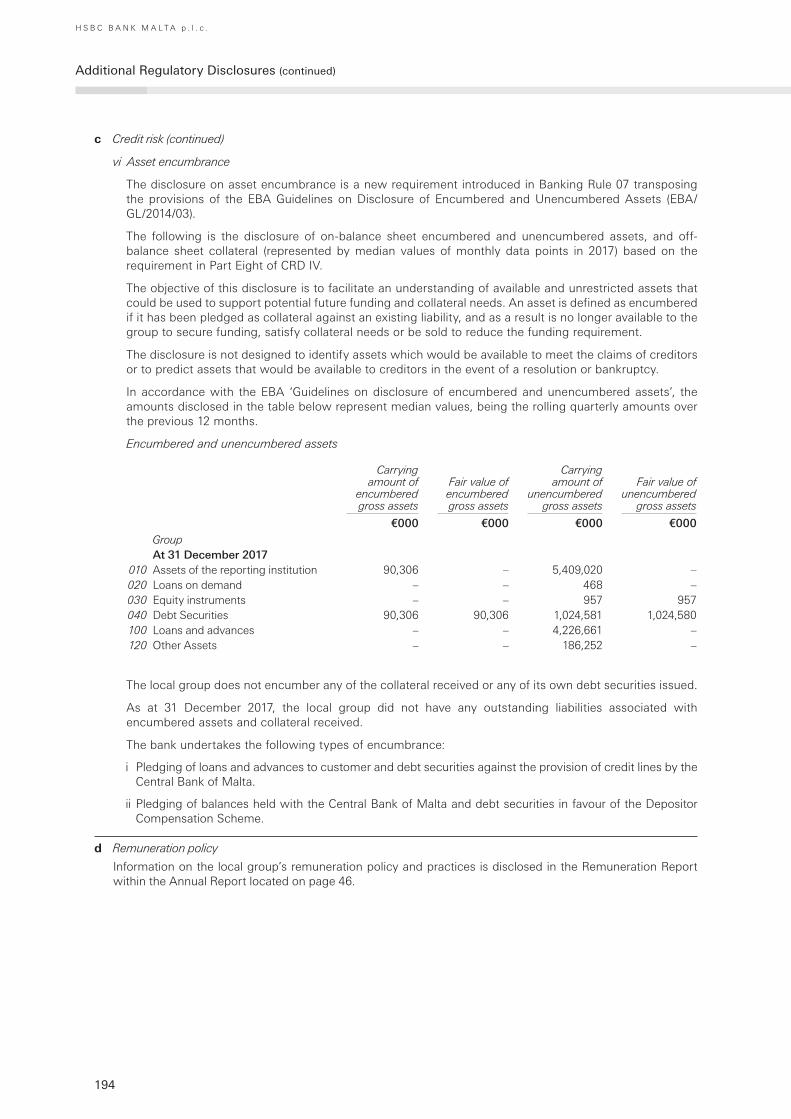
194
H S B C B A N K M A L T A p . l . c .
Additional Regulatory Disclosures (continued)
c Credit risk (continued)
vi Asset encumbrance
The disclosure on asset encumbrance is a new requirement introduced in Banking Rule 07 transposing the provisions of the EBA Guidelines on Disclosure of Encumbered and Unencumbered Assets (EBA/GL/2014/03).
The following is the disclosure of on-balance sheet encumbered and unencumbered assets, and off-balance sheet collateral (represented by median values of monthly data points in 2017) based on the requirement in Part Eight of CRD IV.
The objective of this disclosure is to facilitate an understanding of available and unrestricted assets that could be used to support potential future funding and collateral needs. An asset is defined as encumbered if it has been pledged as collateral against an existing liability, and as a result is no longer available to the group to secure funding, satisfy collateral needs or be sold to reduce the funding requirement.
The disclosure is not designed to identify assets which would be available to meet the claims of creditors or to predict assets that would be available to creditors in the event of a resolution or bankruptcy.
In accordance with the EBA ‘Guidelines on disclosure of encumbered and unencumbered assets’, the amounts disclosed in the table below represent median values, being the rolling quarterly amounts over the previous 12 months.
Encumbered and unencumbered assets
Carrying amount of
encumbered gross assets
Fair value of encumbered gross assets
Carrying amount of
unencumbered gross assets
Fair value of unencumbered
gross assets
€000 €000 €000 €000GroupAt 31 December 2017
010 Assets of the reporting institution 90,306 – 5,409,020 –020 Loans on demand – – 468 –030 Equity instruments – – 957 957 040 Debt Securities 90,306 90,306 1,024,581 1,024,580 100 Loans and advances – – 4,226,661 –120 Other Assets – – 186,252 –
The local group does not encumber any of the collateral received or any of its own debt securities issued.
As at 31 December 2017, the local group did not have any outstanding liabilities associated with encumbered assets and collateral received.
The bank undertakes the following types of encumbrance:
i Pledging of loans and advances to customer and debt securities against the provision of credit lines by the Central Bank of Malta.
ii Pledging of balances held with the Central Bank of Malta and debt securities in favour of the Depositor Compensation Scheme.
d Remuneration policy
Information on the local group’s remuneration policy and practices is disclosed in the Remuneration Report within the Annual Report located on page 46.
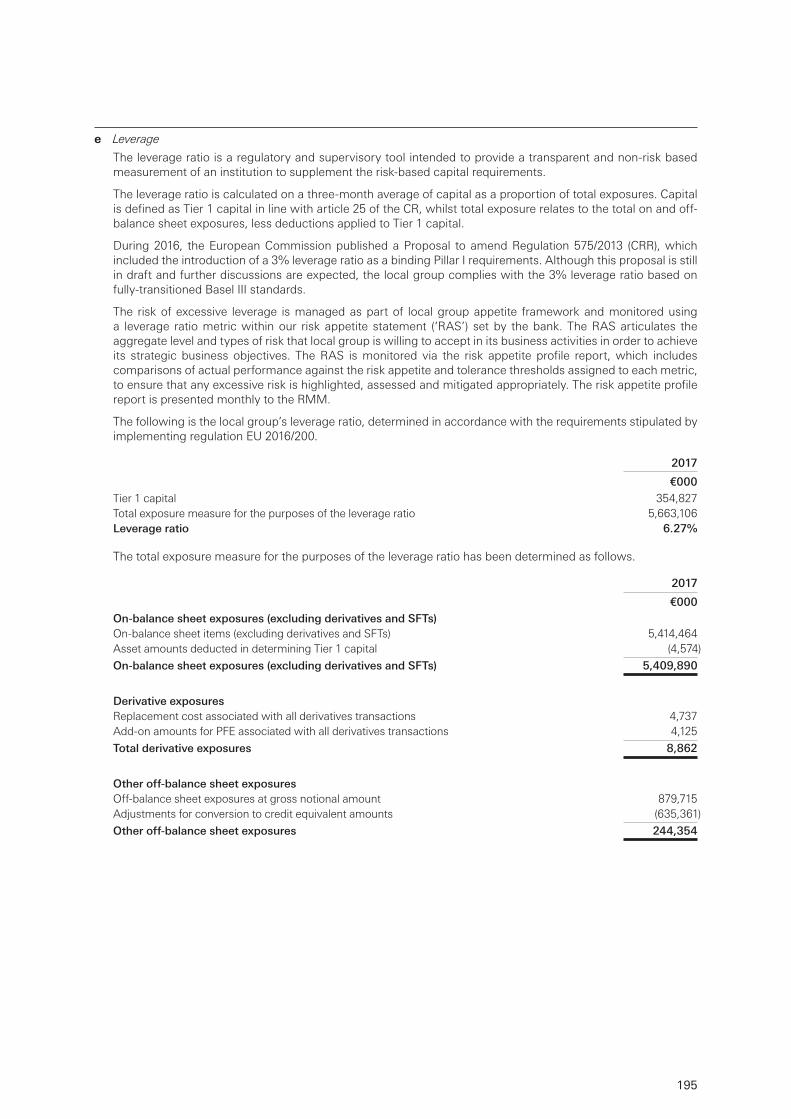
195
e Leverage
The leverage ratio is a regulatory and supervisory tool intended to provide a transparent and non-risk based measurement of an institution to supplement the risk-based capital requirements.
The leverage ratio is calculated on a three-month average of capital as a proportion of total exposures. Capital is defined as Tier 1 capital in line with article 25 of the CR, whilst total exposure relates to the total on and off-balance sheet exposures, less deductions applied to Tier 1 capital.
During 2016, the European Commission published a Proposal to amend Regulation 575/2013 (CRR), which included the introduction of a 3% leverage ratio as a binding Pillar I requirements. Although this proposal is still in draft and further discussions are expected, the local group complies with the 3% leverage ratio based on fully-transitioned Basel III standards.
The risk of excessive leverage is managed as part of local group appetite framework and monitored using a leverage ratio metric within our risk appetite statement (‘RAS’) set by the bank. The RAS articulates the aggregate level and types of risk that local group is willing to accept in its business activities in order to achieve its strategic business objectives. The RAS is monitored via the risk appetite profile report, which includes comparisons of actual performance against the risk appetite and tolerance thresholds assigned to each metric, to ensure that any excessive risk is highlighted, assessed and mitigated appropriately. The risk appetite profile report is presented monthly to the RMM.
The following is the local group’s leverage ratio, determined in accordance with the requirements stipulated by implementing regulation EU 2016/200.
2017
€000Tier 1 capital 354,827 Total exposure measure for the purposes of the leverage ratio 5,663,106 Leverage ratio 6.27%
The total exposure measure for the purposes of the leverage ratio has been determined as follows.
2017
€000On-balance sheet exposures (excluding derivatives and SFTs)On-balance sheet items (excluding derivatives and SFTs) 5,414,464Asset amounts deducted in determining Tier 1 capital (4,574)
On-balance sheet exposures (excluding derivatives and SFTs) 5,409,890
Derivative exposures Replacement cost associated with all derivatives transactions 4,737Add-on amounts for PFE associated with all derivatives transactions 4,125
Total derivative exposures 8,862
Other off-balance sheet exposuresOff-balance sheet exposures at gross notional amount 879,715Adjustments for conversion to credit equivalent amounts (635,361)
Other off-balance sheet exposures 244,354
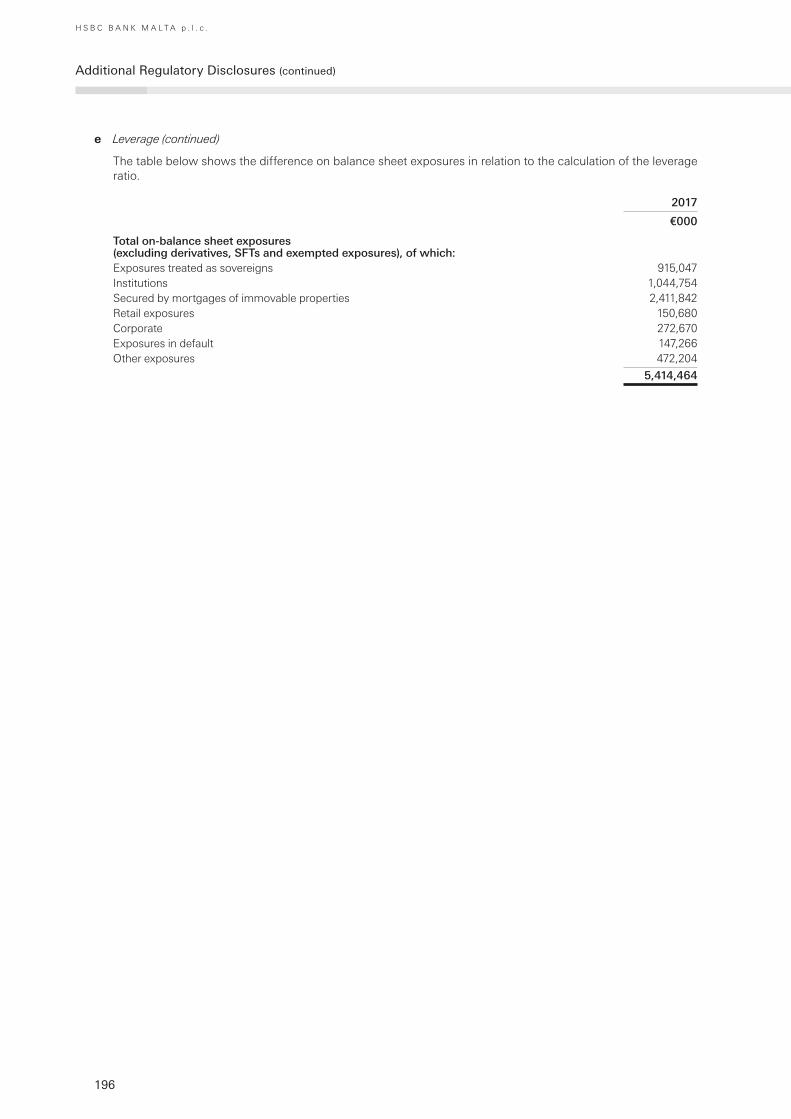
196
H S B C B A N K M A L T A p . l . c .
Additional Regulatory Disclosures (continued)
e Leverage (continued)
The table below shows the difference on balance sheet exposures in relation to the calculation of the leverage ratio.
2017
€000
Total on-balance sheet exposures (excluding derivatives, SFTs and exempted exposures), of which:Exposures treated as sovereigns 915,047Institutions 1,044,754Secured by mortgages of immovable properties 2,411,842Retail exposures 150,680Corporate 272,670Exposures in default 147,266Other exposures 472,204
5,414,464

197
H S B C B A N K M A L T A p . l . c .
Income Statements and Statements of Comprehensive Income: Five-Year Comparison
Group Income Statements
2017 2016 2015 2014 2013
€000 €000 €000 €000 €000
Interest receivable and similar income 132,850 142,062 150,567 155,789 162,106Interest expense (12,190) (15,635) (23,531) (33,227) (37,395)
Net interest income 120,660 126,427 127,036 122,562 124,711
Net non-interest income 40,229 47,115 49,319 50,698 62,301Loan impairment charges 2,968 (9,030) (10,826) (22,545) (3,272)Operating expenses (114,034) (102,291) (118,757) (98,594) (93,263)
Profit before tax 49,823 62,221 46,772 52,121 90,477Tax expense (18,968) (22,008) (17,292) (18,504) (31,760)
Profit for the year 30,855 40,213 29,480 33,617 58,717
Earnings per share 8.6c 11.2c 8.5c 9.7c 18.1c
Group Statements of Comprehensive Income
2017 2016 2015 2014 2013
€000 €000 €000 €000 €000
Profit for the year 30,855 40,213 29,480 33,617 58,717
Other comprehensive income
Items that will be reclassified to profit or loss when specific conditions are met
Available-for-sale investments:– fair value gains (7,290) (585) 4,938 13,656 305
– fair value (gains)/losses reclassified to profit or loss on disposal – (10,787) (682) (1,719) (4,295)
– income taxes 2,551 3,980 (1,489) (4,178) 1,396
(4,739) (7,392) 2,767 7,759 (2,594)
Items that will not be reclassified subsequently to profit or loss:
Properties:
– surplus arising on revaluation net of income taxes – 2,299 – (28) 84
– income taxes determined on the basis applicable to disposals – – 1,199 3 (20)
– 2,299 1,199 (25) 64
Other comprehensive income for the year, net of tax (4,739) (5,093) 3,966 7,734 (2,530)
Total comprehensive income 26,116 35,120 33,446 41,351 56,187
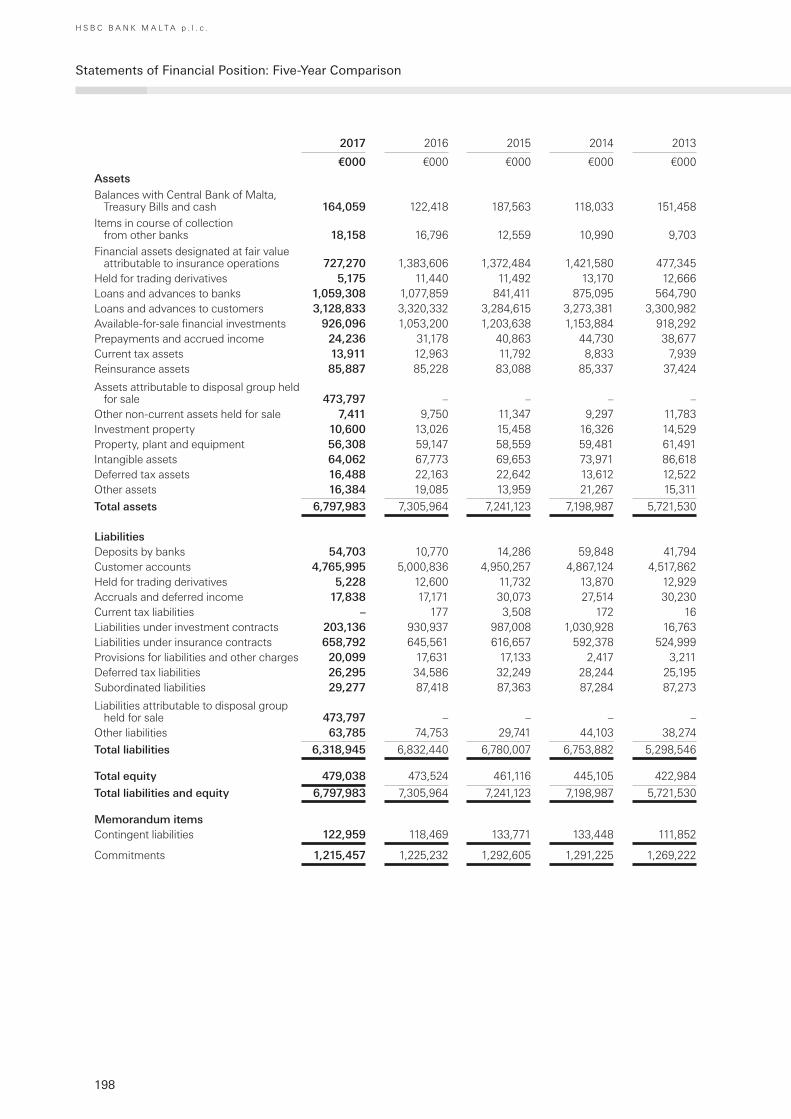
198
H S B C B A N K M A L T A p . l . c .
Statements of Financial Position: Five-Year Comparison
2017 2016 2015 2014 2013
€000 €000 €000 €000 €000
AssetsBalances with Central Bank of Malta,
Treasury Bills and cash 164,059 122,418 187,563 118,033 151,458Items in course of collection
from other banks 18,158 16,796 12,559 10,990 9,703Financial assets designated at fair value
attributable to insurance operations 727,270 1,383,606 1,372,484 1,421,580 477,345Held for trading derivatives 5,175 11,440 11,492 13,170 12,666Loans and advances to banks 1,059,308 1,077,859 841,411 875,095 564,790Loans and advances to customers 3,128,833 3,320,332 3,284,615 3,273,381 3,300,982Available-for-sale financial investments 926,096 1,053,200 1,203,638 1,153,884 918,292Prepayments and accrued income 24,236 31,178 40,863 44,730 38,677Current tax assets 13,911 12,963 11,792 8,833 7,939Reinsurance assets 85,887 85,228 83,088 85,337 37,424
Assets attributable to disposal group held for sale 473,797 – – – –
Other non-current assets held for sale 7,411 9,750 11,347 9,297 11,783Investment property 10,600 13,026 15,458 16,326 14,529Property, plant and equipment 56,308 59,147 58,559 59,481 61,491Intangible assets 64,062 67,773 69,653 73,971 86,618Deferred tax assets 16,488 22,163 22,642 13,612 12,522Other assets 16,384 19,085 13,959 21,267 15,311
Total assets 6,797,983 7,305,964 7,241,123 7,198,987 5,721,530
LiabilitiesDeposits by banks 54,703 10,770 14,286 59,848 41,794Customer accounts 4,765,995 5,000,836 4,950,257 4,867,124 4,517,862Held for trading derivatives 5,228 12,600 11,732 13,870 12,929Accruals and deferred income 17,838 17,171 30,073 27,514 30,230Current tax liabilities – 177 3,508 172 16Liabilities under investment contracts 203,136 930,937 987,008 1,030,928 16,763Liabilities under insurance contracts 658,792 645,561 616,657 592,378 524,999Provisions for liabilities and other charges 20,099 17,631 17,133 2,417 3,211Deferred tax liabilities 26,295 34,586 32,249 28,244 25,195Subordinated liabilities 29,277 87,418 87,363 87,284 87,273
Liabilities attributable to disposal group held for sale 473,797 – – – –
Other liabilities 63,785 74,753 29,741 44,103 38,274
Total liabilities 6,318,945 6,832,440 6,780,007 6,753,882 5,298,546
Total equity 479,038 473,524 461,116 445,105 422,984
Total liabilities and equity 6,797,983 7,305,964 7,241,123 7,198,987 5,721,530
Memorandum itemsContingent liabilities 122,959 118,469 133,771 133,448 111,852
Commitments 1,215,457 1,225,232 1,292,605 1,291,225 1,269,222

199
H S B C B A N K M A L T A p . l . c .
Statements of Cash Flows: Five-Year Comparison
2017 2016 2015 2014 2013
€000 €000 €000 €000 €000
Net cash (used in)/from operating activities (156,694) 16,105 (54,019) 448,298 51,339
Cash flows from investing activitiesDividends received – – – – 21Interest received from financial
investments 32,305 33,435 54,037 39,435 30,255Purchase of other available-for-sale
financial investments (139,115) (100,609) (312,346) (413,566) (277,694)Proceeds from sale and maturity of
financial investments 231,950 227,414 323,562 217,133 334,396
Purchase of property, plant and equipment, investment property and intangible assets (2,999) (990) (4,640) (5,264) (12,087)
Proceeds on sale of property, plant and equipment, intangible assets and liquidation of subsidiary company – 2,639 3 81 476
Proceeds on disposal of card acquiring business – – – – –
Net cash flows from/(used in) investing activities 122,141 177,994 60,616 (162,181) 75,367
Cash flows from financing activitiesDividends paid (20,610) (22,717) (17,455) (19,349) (33,956)Repayment of subordinated liabilities (58,158) – – – –
Net cash used in financing activities (78,768) (22,717) (17,455) (19,349) (33,956)
(Decrease)/increase in cash and cash equivalents (113,321) 155,277 (10,858) 266,768 92,750
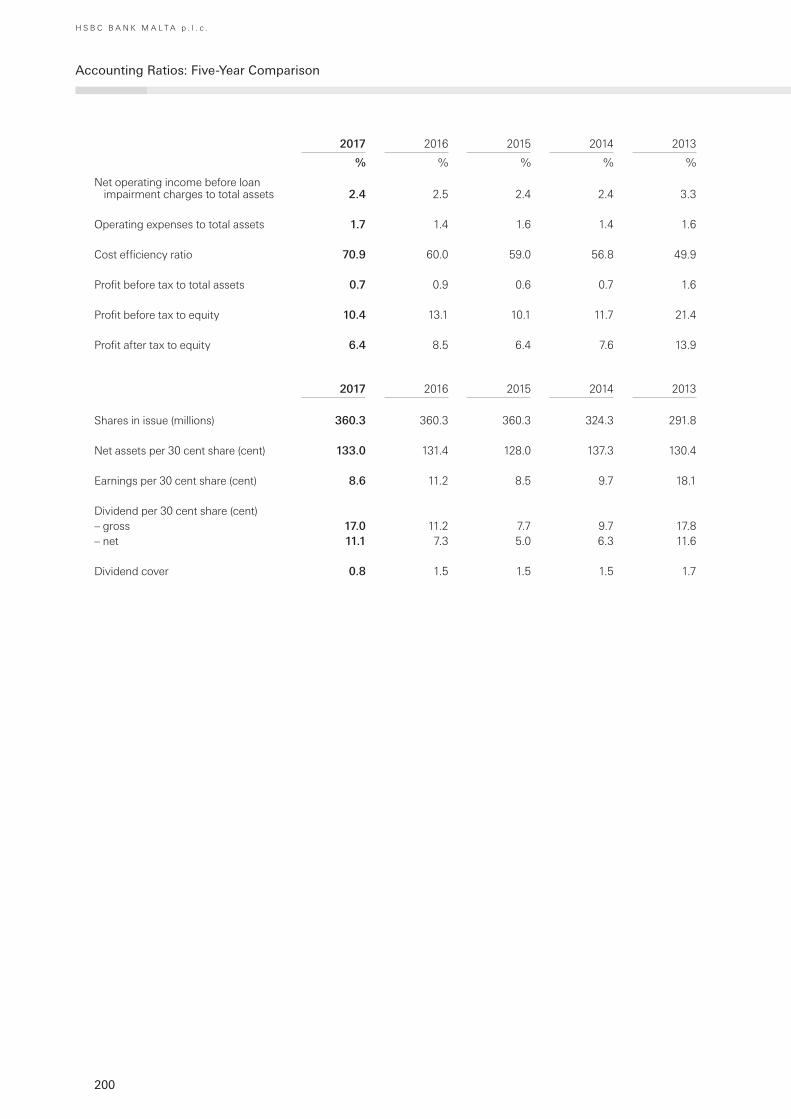
200
H S B C B A N K M A L T A p . l . c .
Accounting Ratios: Five-Year Comparison
2017 2016 2015 2014 2013
% % % % %
Net operating income before loan impairment charges to total assets 2.4 2.5 2.4 2.4 3.3
Operating expenses to total assets 1.7 1.4 1.6 1.4 1.6
Cost efficiency ratio 70.9 60.0 59.0 56.8 49.9
Profit before tax to total assets 0.7 0.9 0.6 0.7 1.6
Profit before tax to equity 10.4 13.1 10.1 11.7 21.4
Profit after tax to equity 6.4 8.5 6.4 7.6 13.9
2017 2016 2015 2014 2013
Shares in issue (millions) 360.3 360.3 360.3 324.3 291.8
Net assets per 30 cent share (cent) 133.0 131.4 128.0 137.3 130.4
Earnings per 30 cent share (cent) 8.6 11.2 8.5 9.7 18.1
Dividend per 30 cent share (cent)– gross 17.0 11.2 7.7 9.7 17.8– net 11.1 7.3 5.0 6.3 11.6
Dividend cover 0.8 1.5 1.5 1.5 1.7

201
H S B C B A N K M A L T A p . l . c .
Branches and Offices
MALTA OFFICES
Registered Office/Head Office116 Archbishop StreetValletta VLT 1444Tel: 2380 2380 Fax: 2380 4923
Retail Banking and Wealth ManagementBusiness Banking Centre80 Mill Street, Qormi QRM 3101Tel: 2380 2380 Fax: 2380 4537
Premier Centre Wealth Management OfficeBusiness Banking Centre 80 Mill Street, Qormi QRM 3101 Tel: 2148 9100 Fax: 2380 2219
Commercial BankingBusiness Banking Centre80 Mill Street, Qormi QRM 3101Tel: 2380 8000 Fax: 2380 4532
International Banking CentreHigh Street, Sliema SLM 1549Tel: 2380 2600 Fax: 2380 2676
Trade ServicesBusiness Banking Centre80 Mill Street, Qormi QRM 3101Tel: 2380 1828 Fax: 2380 4535
Operations Centre80 Mill Street, Qormi QRM 3101Tel: 2380 2380 Fax: 2380 4923
Card OperationsOperations Centre80 Mill Street, Qormi QRM 3101Tel: 2380 2380 Fax: 2380 4924
Contact CentreOperations Centre80 Mill Street, Qormi QRM 3101Tel: 2380 2380 Fax: 2149 0613
Inheritance Unit80 Mill Street, Qormi QRM 3101Tel: 2380 3360/1/2/3/4Fax: 2380 5190
Legal Office32 Merchants StreetValletta VLT 1173Tel: 2380 2411 Fax: 2597 2417Contracts Centre32 Merchants Street, Valletta VLT 1173Tel: 2380 3382 Fax: 2597 3306
BRANCHES
BalzanBertu Fenech Square BZN 1032Tel: 2380 2380 Fax: 2380 1190
Birkirkara 1 Naxxar Road BKR 9049Tel: 2380 2380 Fax: 2334 1690
Birżebbuġa2 Birżebbuġa Road BBG 1508Tel: 2380 2380 Fax: 2361 4790
BuġibbaBay Square SPB 2511Tel: 2380 2380 Fax: 2334 7390
Cospicua50 Pilgrimage Street BML 1580Tel: 2380 2380 Fax: 2293 4090
FguraŻabbar Road FGR 1254Tel: 2380 2380 Fax: 2361 8790
Gżira196 The Strand GZR 1023Tel: 2380 2380 Fax: 2324 3990
Ħamrun121 St Joseph Road HMR 1017Tel: 2380 2380 Fax: 2597 2390
MarsascalaSt Anthony Street MSK 9057Tel: 2380 2380 Fax: 2163 6860
Mellieħa6 Gorg Borg Olivier Street MLH 1027Tel: 2380 2380 Fax: 2334 6890
Mosta63 Constitution Street MST 9058Tel: 2380 2380 Fax: 2334 6190
Msida, University of Malta (Agency)Room 6, Ground FloorHumanities Building MSD 2080Tel: 2380 2380 Fax: 2133 1377
Paola12 Antoine De Paule Square PLA 1261Tel: 2380 2380 Fax: 2361 1390
Qormi38 St Sebastian Street QRM 2331Tel: 2380 2380 Fax: 2380 5490
Rabat 12 Saqqajja Square RBT 1190Tel: 2380 2380 Fax: 2334 5890
San Ġwann198 Naxxar Road SGN 9030Tel: 2380 2380 Fax: 2324 7590
St Julian’sSt George’s Road STJ 3202Tel: 2380 2380 Fax: 2324 2090
St Paul’s BaySt Paul’s Street SPB 3419Tel: 2380 2380 Fax: 2334 6490
SliemaHigh Street SLM 1549Tel: 2380 2380 Fax: 2324 6090
SwieqiSt Andrew’s Road SWQ 9020Tel: 2380 2380 Fax: 2324 8894
Valletta32 Merchants Street VLT 1173Tel: 2380 2380 Fax: 2597 3320
Żabbar19 Sanctuary Street ZBR 1010Tel: 2380 2380 Fax: 2361 4290
Żebbuġ254 Main Street ZBG 1304Tel: 2380 2380 Fax: 2293 4490
Żejtun25th November Avenue ZTN 2018Tel: 2380 2380 Fax: 2361 5690
Żurrieq38 High Street ZRQ 1318Tel: 2380 2380 Fax: 2361 7890
GOZO OFFICES
Victoria90 Republic Street VCT 1017Tel: 2380 2380 Fax: 2293 7192
Nadur (Agency)18 St Peter & St Paul Square NDR 1010Tel: 2380 2380 Fax: 2155 0952
Xagħra (Agency)8th September Avenue XRA 1011 (Corner with Victory Street)Tel: 2380 2380 Fax: 2155 6313
SUBSIDIARY COMPANIES
HSBC Global Asset Management (Malta) LimitedOperations Centre80 Mill Street Qormi QRM 3101Tel: 2380 5128 Fax: 2380 5191
HSBC Life Assurance (Malta) LimitedBusiness Banking Centre 80 Mill Street Qormi QRM 3101Tel: 2380 8699 Fax: 2380 8690


© Copyright HSBC Bank Malta p.l.c. 2018All rights reserved
No part of this publication may be reproduced, stored in a retrieval system, or transmitted, in any form or by any means, electronic, mechanical, photocopying, recording, or otherwise, without the prior written permission of HSBC Bank Malta p.l.c.
Published by HSBC Bank Malta p.l.c., Valletta.
Cover designed by Superunion (formerly Addison Group), London; text pages designed by Group Communications (Asia), The Hongkong and Shanghai Banking Corporation Limited, Hong Kong, and Global Finance, HSBC Holdings plc, London.
Printed by Progress Press Co. Ltd, Mrieħel Malta.
ISSN 1811-7570ISBN 978-99932-12-19-5
PhotographyPages 2, 6, 7, 9, 13 and 14: Andrew Gauci AttardPages 3, 4 and 17: Jean-Marc ZerafaPage 8: HSBC Bank Malta p.l.c.Page 12: Geoffrey Zarb AdamiPage 19: Austin TufignoPages 20 to 24: Jon Wrigley

HSBC Bank Malta p.l.c.
116 Archbishop Street Valletta VLT 1444MaltaTelephone: 356 2380 2380www.hsbc.com.mt