Embed Size (px)
Citation preview
HSBC Holdings plcHSBC Holdings plcStill dancing?
November 2007
0

Legal Notice
PRESENTATION FOR INFORMATION PURPOSES ONLY
This presentation has been prepared by Knight Vinke Asset Management, LLC (“Knight Vinke”).This presentation has been prepared by Knight Vinke Asset Management, LLC ( Knight Vinke ). Knight Vinke is registered as an investment adviser with the Securities and Exchange Commission. Opinions expressed in this document are current opinions as of the date appearing in the material only.
The contents of this document are based on public information and the facts andThe contents of this document are based on public information and the facts and conclusions could be different based on the availability of other information.
No responsibility can be accepted by Knight Vinke for any action taken or not taken as a result of the information herein. No part of the material contained herein may be copied, photocopied or duplicated in any form by any means or reproduced without prior written consent from Knightduplicated in any form, by any means or reproduced without prior written consent from Knight Vinke. Nothing included herein should be construed as an offer to sell or the solicitation of or an offer to buy any security. Knight Vinke is an institutional shareholder of HSBC Holdings plc.
This document is dated as of 20 November, 2007.
1
Knight Vinke’s six key points
1 Perennial stock market underperformance compared to peers1. Perennial stock market underperformance compared to peers
2. Pursuit of geographic diversification instead of comparative advantage
3 Lack of scale in key markets UK USA and France3. Lack of scale in key markets – UK, USA and France
4. Good position in Hong Kong – but franchise at risk due to lack of credible China strategy
5. Lack of credible CIBM strategy – trading assets now tie up a third of the Group’s balance sheet
6. Strategy unchallenged due to poor Board structure and lack of economic incentives for senior management
2
Process of engagement – next few months/ years
1. Discuss underperformance and issues
with management/ Board Jun/ Sept meetings
with shareholders Sept/ Oct presentations
with analysts press other market participants “Open Letter” 16th Octwith analysts, press, other market participants Open Letter” 16th Oct
2. Discuss valuation and strategic options
with management/ Board date not yet fixedg y
with shareholders
with analysts, press, other market participants
3. Detailed critique of each business/ acquisition/ results Q3 results14th Nov
4. Participation at 2008 AGM (governance issues)
5 C ll ti ti th ti
3
5. Collective action, other options
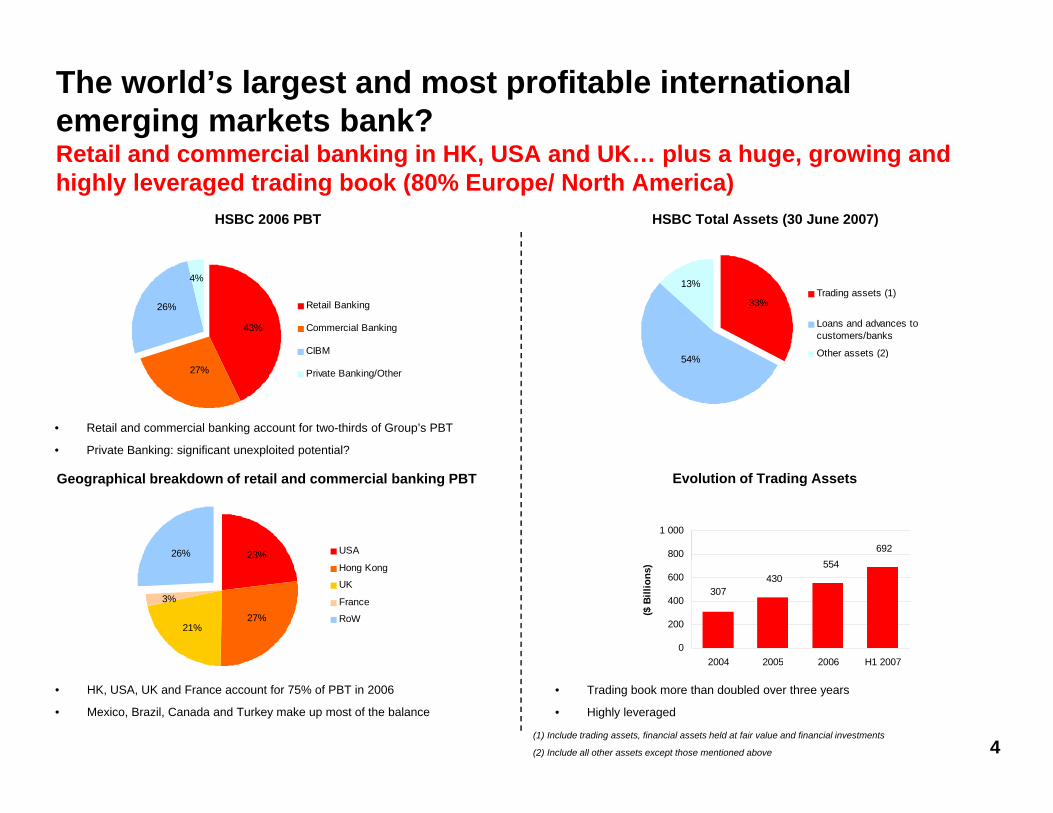
The world’s largest and most profitable international emerging markets bank?Retail and commercial banking in HK USA and UK plus a huge growing and
HSBC 2006 PBTHSBC 2006 PBT HSBC Total Assets (30 June 2007)HSBC Total Assets (30 June 2007)
Retail and commercial banking in HK, USA and UK… plus a huge, growing and highly leveraged trading book (80% Europe/ North America)
4%
26%
CIBM
43%
Retail Banking
Commercial Banking
33%
13%
4%
Trading assets (1)
Loans and advances tocustomers/banks
Other assets (2)
• Retail and commercial banking account for two-thirds of Group’s PBT
• Private Banking: significant unexploited potential?
Private Banking/Other27%54% Other assets (2)
Geographical breakdown of retail and commercial banking PBTGeographical breakdown of retail and commercial banking PBT
23%26% USA 692554
800
1 000
Evolution of Trading AssetsEvolution of Trading Assets
3%
21%27%
Hong Kong
UK
France
RoW
554430
307
0
200
400
600
2004 2005 2006 H1 2007($
Bill
ions
)
4
• HK, USA, UK and France account for 75% of PBT in 2006
• Mexico, Brazil, Canada and Turkey make up most of the balance
(1) Include trading assets, financial assets held at fair value and financial investments
(2) Include all other assets except those mentioned above
• Trading book more than doubled over three years
• Highly leveraged
2004 2005 2006 H1 2007

SECTION 1
PERENNIAL STOCK MARKET UNDERPERFORMANCE
1994 – 20071994 2007
5

HSBC share price performance since 1994
• Despite claims to the contrary, HSBC has underperformed its peers over the t 14 i t f T t l Sh h ld R t (TSR)past 14 years in term of Total Shareholder Return (TSR)
• Generally 3rd quartile vs. selected group of 28 mostly Western banks and 4th quartile vs. 23 emerging markets peers (1)q g g p
• Better performance in year to date (2nd quartile to 16 Nov 2007). Peer group analysis suggests this is due to HSBC’s emerging markets exposure, not its diversification or sizediversification or size
• Dividend growth, which is HSBC’s preferred performance metric, is only one part of Total Shareholder Return; one must also consider movement in the pshare price
6
(1) All would have been part of HSBC’s selected peer group until this was changed in 2005.

HSBC’s selected peer group HSBC’s emerging market peersU d f b h ki f All did t ( til 2005)Used for benchmarking performance All peer group candidates (until 2005)
Market Capitalisation USD billion
G HSBC 233.8G BANK OF AMERICA 214.2G CITIGROUP 208 4
Market Capitalisation USD billion
IND & COMM BK OF CHINA 343.3CHINA CONSTRUCTION BANK 227.9BANK OF CHINA 211 9G CITIGROUP 208.4
G JPMORGAN CHASE 157.9BANCO SANTANDER 135.7UNICREDITO ITALIANO 114.0WELLS FARGO 113.7
G UBS 110.8MITSUBISHI UFJ FINANCIAL 107.4
G ROYAL BANK OF SCOTLAND 107 1
BANK OF CHINA 211.9HSBC 204.8BANK OF COMMUNICATIONS 88.5CHINA MERCHANTS BANK 77.0BANCO BRADESCO 63.5BANCO ITAU HOLDING FIN 62.7CITIC SECURITIES 44.5
G ROYAL BANK OF SCOTLAND 107.1G ABN AMRO HOLDING 103.1
BNP PARIBAS 99.6BANCO BILBAO VIZCAYA ARGENTA 94.2WACHOVIA 90.4
G BARCLAYS 83.7G CREDIT SUISSE 81.7
BANCO DO BRASIL 40.1AL RAJHI BANK 38.6UNIBANCO 36.2HANG SENG BANK 35.7ICICI BANK 33.9CHINA MINSHENG BANKING 31.8STATE BANK OF INDIA 31 1G SOCIETE GENERALE 78.1
ROYAL BANK OF CANADA 75.3MORGAN STANLEY 71.4
G DEUTSCHE BANK 70.7HBOS 67.7CREDIT AGRICOLE 65.0NATIONAL AUSTRALIA BANK 64.9
STATE BANK OF INDIA 31.1SHANGHAI PUDONG DEVEL BANK 31.0BOC HONG KONG HOLDINGS 26.6KOOKMIN BANK 25.9SHINHAN FINANCIAL GROUP 23.0STANDARD BANK GROUP 22.8FIRSTRAND 21.2UNITED OVERSEAS BANK 20 6LLOYDS TSB GROUP 64.9
MIZUHO FINANCIAL GROUP 63.6US BANCORP 57.2BANK OF NEW YORK MELLON 55.6STANDARD CHARTERED 54.6WESTPAC BANKING 52.8
Source: Bloomberg data November 16 2007
UNITED OVERSEAS BANK 20.6Source: Bloomberg data, November 16, 2007
7
We have marked with “G” those banks which are pursuing a diversified global strategy to test the hypothesis that such banks outperform in times of market turmoil.
Source: Bloomberg data, November 16, 2007
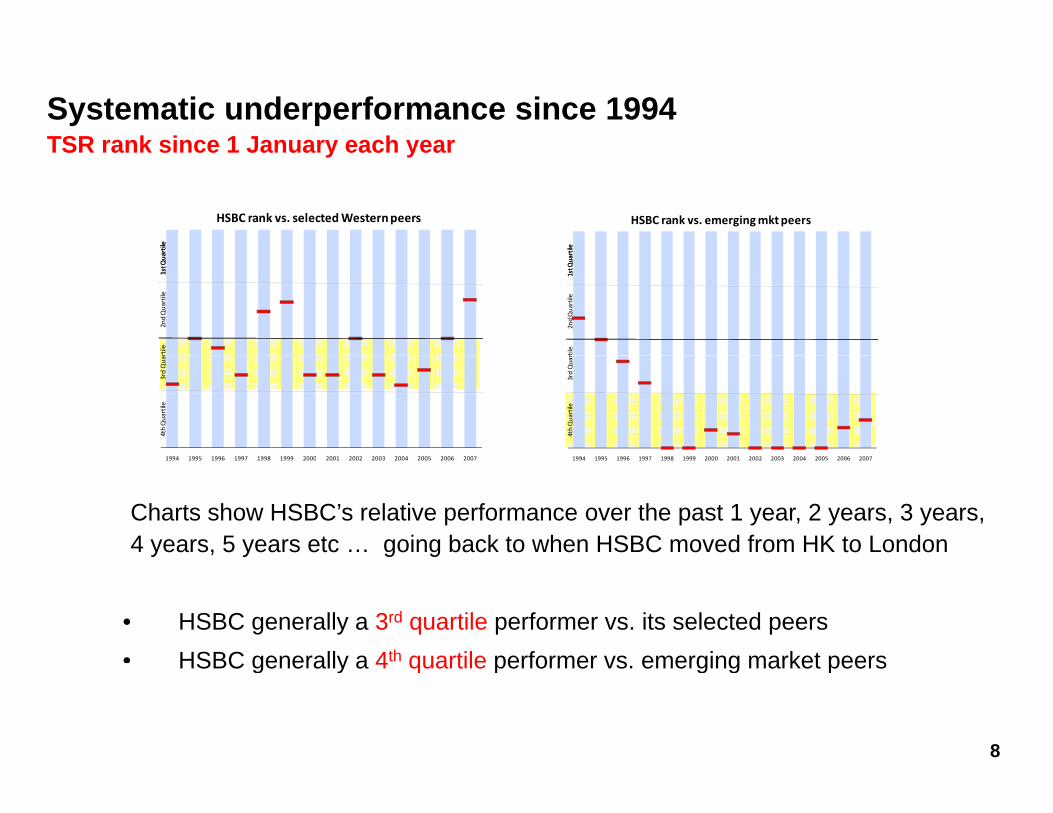
Systematic underperformance since 1994TSR rank since 1 January each year
HSBC rank vs. selected Western peers
rtile
rtile
TSR rank since 1 January each year
HSBC rank vs. emerging mkt peers
tile
tile
1st Q
ua1st Q
ua2nd Quartile
rtile
1st Q
uar
1st Q
uar
2nd Quartile
rtile
1994 1995 1996 1997 1998 1999 2000 2001 2002 2003 2004 2005 2006 2007
4th Quartile
3rd Quar
1994 1995 1996 1997 1998 1999 2000 2001 2002 2003 2004 2005 2006 2007
4th Quartile
3rd Quar
1994 1995 1996 1997 1998 1999 2000 2001 2002 2003 2004 2005 2006 2007
Charts show HSBC’s relative performance over the past 1 year, 2 years, 3 years, 4 years, 5 years etc … going back to when HSBC moved from HK to London
1994 1995 1996 1997 1998 1999 2000 2001 2002 2003 2004 2005 2006 2007
• HSBC generally a 3rd quartile performer vs. its selected peers• HSBC generally a 4th quartile performer vs emerging market peers
8
HSBC generally a 4 quartile performer vs. emerging market peers
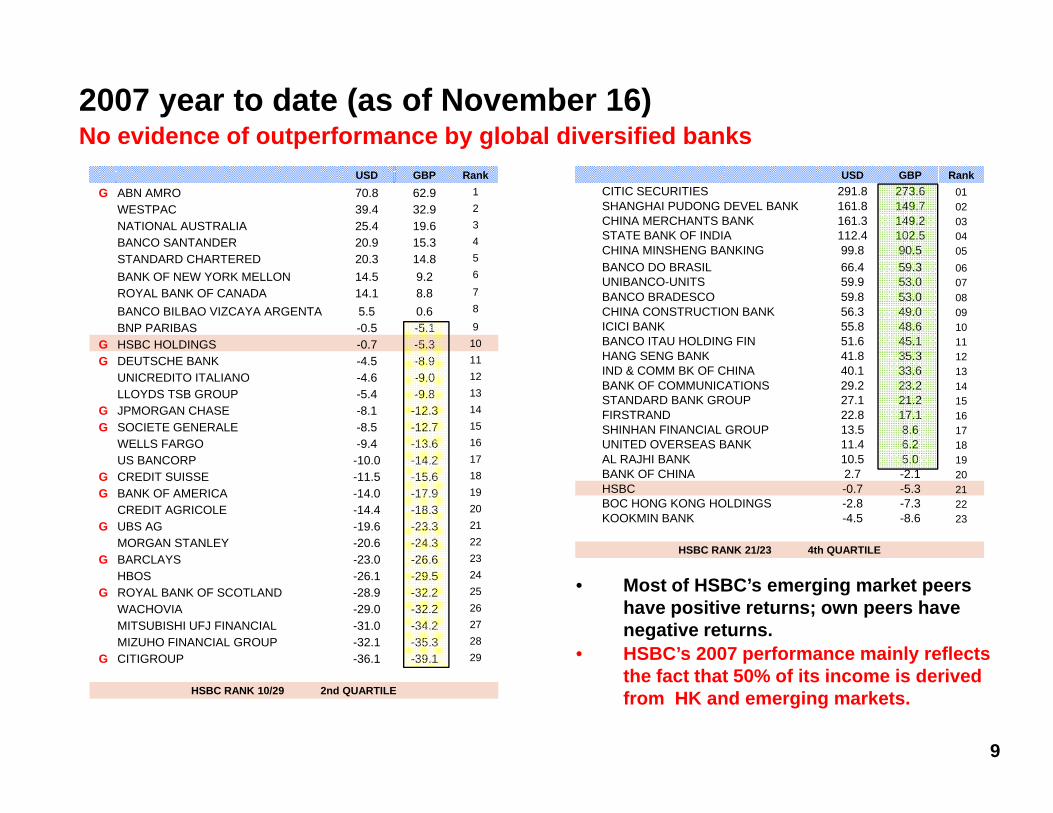
2007 year to date (as of November 16)No evidence of outperformance by global diversified banks
USD GBP RankG ABN AMRO 70.8 62.9 1
WESTPAC 39.4 32.9 2
NATIONAL AUSTRALIA 25.4 19.6 3
BANCO SANTANDER 20.9 15.3 4
USD GBP RankCITIC SECURITIES 291.8 273.6 01SHANGHAI PUDONG DEVEL BANK 161.8 149.7 02CHINA MERCHANTS BANK 161.3 149.2 03STATE BANK OF INDIA 112.4 102.5 04CHINA MINSHENG BANKING 99 8 90 5 05
STANDARD CHARTERED 20.3 14.8 5
BANK OF NEW YORK MELLON 14.5 9.2 6
ROYAL BANK OF CANADA 14.1 8.8 7
BANCO BILBAO VIZCAYA ARGENTA 5.5 0.6 8
BNP PARIBAS -0.5 -5.1 9
G HSBC HOLDINGS -0.7 -5.3 10
CHINA MINSHENG BANKING 99.8 90.5 05BANCO DO BRASIL 66.4 59.3 06UNIBANCO-UNITS 59.9 53.0 07BANCO BRADESCO 59.8 53.0 08CHINA CONSTRUCTION BANK 56.3 49.0 09ICICI BANK 55.8 48.6 10BANCO ITAU HOLDING FIN 51.6 45.1 11HANG SENG BANK 41 8 35 3 12G DEUTSCHE BANK -4.5 -8.9 11
UNICREDITO ITALIANO -4.6 -9.0 12
LLOYDS TSB GROUP -5.4 -9.8 13
G JPMORGAN CHASE -8.1 -12.3 14
G SOCIETE GENERALE -8.5 -12.7 15
WELLS FARGO -9.4 -13.6 16
US BANCORP 10 0 14 2 17
HANG SENG BANK 41.8 35.3 12IND & COMM BK OF CHINA 40.1 33.6 13BANK OF COMMUNICATIONS 29.2 23.2 14STANDARD BANK GROUP 27.1 21.2 15FIRSTRAND 22.8 17.1 16SHINHAN FINANCIAL GROUP 13.5 8.6 17UNITED OVERSEAS BANK 11.4 6.2 18AL RAJHI BANK 10 5 5 0 19US BANCORP -10.0 -14.2 17
G CREDIT SUISSE -11.5 -15.6 18
G BANK OF AMERICA -14.0 -17.9 19
CREDIT AGRICOLE -14.4 -18.3 20
G UBS AG -19.6 -23.3 21
MORGAN STANLEY -20.6 -24.3 22
G BARCLAYS -23 0 -26 6 23
AL RAJHI BANK 10.5 5.0 19BANK OF CHINA 2.7 -2.1 20HSBC -0.7 -5.3 21BOC HONG KONG HOLDINGS -2.8 -7.3 22KOOKMIN BANK -4.5 -8.6 23
HSBC RANK 21/23 4th QUARTILEG BARCLAYS -23.0 -26.6 23
HBOS -26.1 -29.5 24
G ROYAL BANK OF SCOTLAND -28.9 -32.2 25
WACHOVIA -29.0 -32.2 26
MITSUBISHI UFJ FINANCIAL -31.0 -34.2 27
MIZUHO FINANCIAL GROUP -32.1 -35.3 28
G CITIGROUP -36.1 -39.1 29
• Most of HSBC’s emerging market peers have positive returns; own peers have negative returns.
• HSBC’s 2007 performance mainly reflects
9
HSBC RANK 10/29 2nd QUARTILE
p ythe fact that 50% of its income is derived from HK and emerging markets.
SECTION 2
PURSUIT OF GEOGRAPHIC DIVERSIFICATION INSTEAD OFDIVERSIFICATION INSTEAD OF
COMPARATIVE ADVANTAGE
10

What is left of “Managing for Growth (2003-2008)”? N t t i t d d i 2007New strategy introduced in 2007
1. Aim for capital markets and M&A leadership worldwide. Strategy has failed/ “ i k t f ” i t d d d f lt t t“emerging market focus” introduced as default strategy
2. Household’s (consumer finance) model to be applied to retail banking network worldwide. Strategy has failed/ HSBC left with sub-prime mortgage fiasco instead
3. 50/ 50 split between OECD and emerging markets (geographic diversification) Objective apparently still intactdiversification). Objective apparently still intact
Two of three pillars now missing and geographic diversification (beyond what is optimal) for its own sake as a strategic objective
11
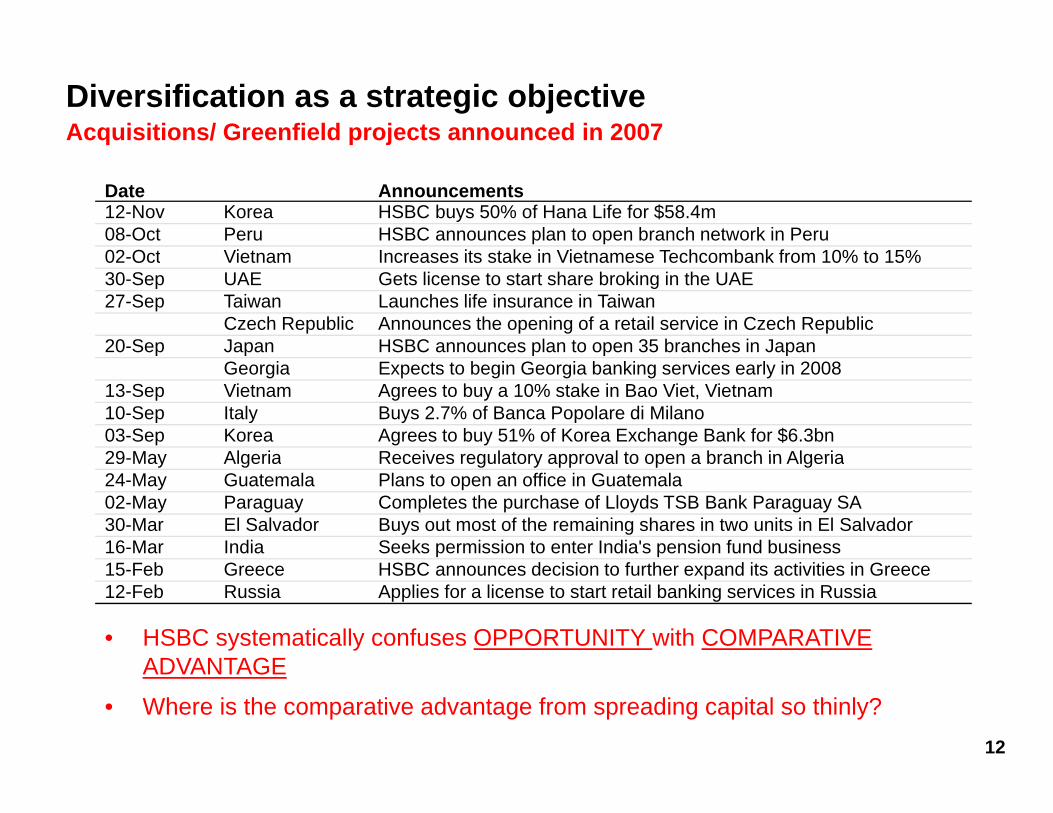
Diversification as a strategic objectiveAcquisitions/ Greenfield projects announced in 2007
Date Announcements12-Nov Korea HSBC buys 50% of Hana Life for $58.4m08-Oct Peru HSBC announces plan to open branch network in Peru02 Oct Vietnam Increases its stake in Vietnamese Techcombank from 10% to 15%02-Oct Vietnam Increases its stake in Vietnamese Techcombank from 10% to 15% 30-Sep UAE Gets license to start share broking in the UAE27-Sep Taiwan Launches life insurance in Taiwan
Czech Republic Announces the opening of a retail service in Czech Republic20-Sep Japan HSBC announces plan to open 35 branches in Japanp p p p p
Georgia Expects to begin Georgia banking services early in 200813-Sep Vietnam Agrees to buy a 10% stake in Bao Viet, Vietnam10-Sep Italy Buys 2.7% of Banca Popolare di Milano03-Sep Korea Agrees to buy 51% of Korea Exchange Bank for $6.3bn29 May Algeria Receives regulatory approval to open a branch in Algeria29-May Algeria Receives regulatory approval to open a branch in Algeria24-May Guatemala Plans to open an office in Guatemala 02-May Paraguay Completes the purchase of Lloyds TSB Bank Paraguay SA 30-Mar El Salvador Buys out most of the remaining shares in two units in El Salvador16-Mar India Seeks permission to enter India's pension fund business
• HSBC systematically confuses OPPORTUNITY with COMPARATIVE ADVANTAGE
15-Feb Greece HSBC announces decision to further expand its activities in Greece12-Feb Russia Applies for a license to start retail banking services in Russia
12
ADVANTAGE
• Where is the comparative advantage from spreading capital so thinly?

Diversification (and a strong capital base) in times of crisisDoes this make any sense at all?y
• Q3/07: additional $4.3 bn sub-prime and trading write-offs (YTD total over $10 bn). Commenting on these results, Mr Geoghegan, HSBC’s CEO, said in an interview on 14 November 2007:
“I think first you should take away that global diversification works. This is a broad-based set of results; strong in Asia, strong in the Middle East, relatively strong in Europe, strong in Latin America, offset by difficult situations in North America. But overall, a very strong set of results.....I think our strategy's been totally vindicated”
• What this means in practice is
o 2007 YTD results only match 2006 because of $1.1 billion one-off gains on dilution in China and $1.3 billion gains on revaluation of HSBC’s own debt.
o HSBC has had to inject additional capital into Household and is now owed $43 bnby Household, with further deterioration expected. At time like this, a “strong y , p , gcapital base” may lead to lack of discipline in capital allocation.
Diversification means that HSBC is taking highly-rated and low-risk cash-flows from HK to invest in a lower rated and high risk business that would normally not
13
from HK to invest in a lower-rated and high-risk business that would normally not be able to fund itself in the market: how does this reduce risk or add value?
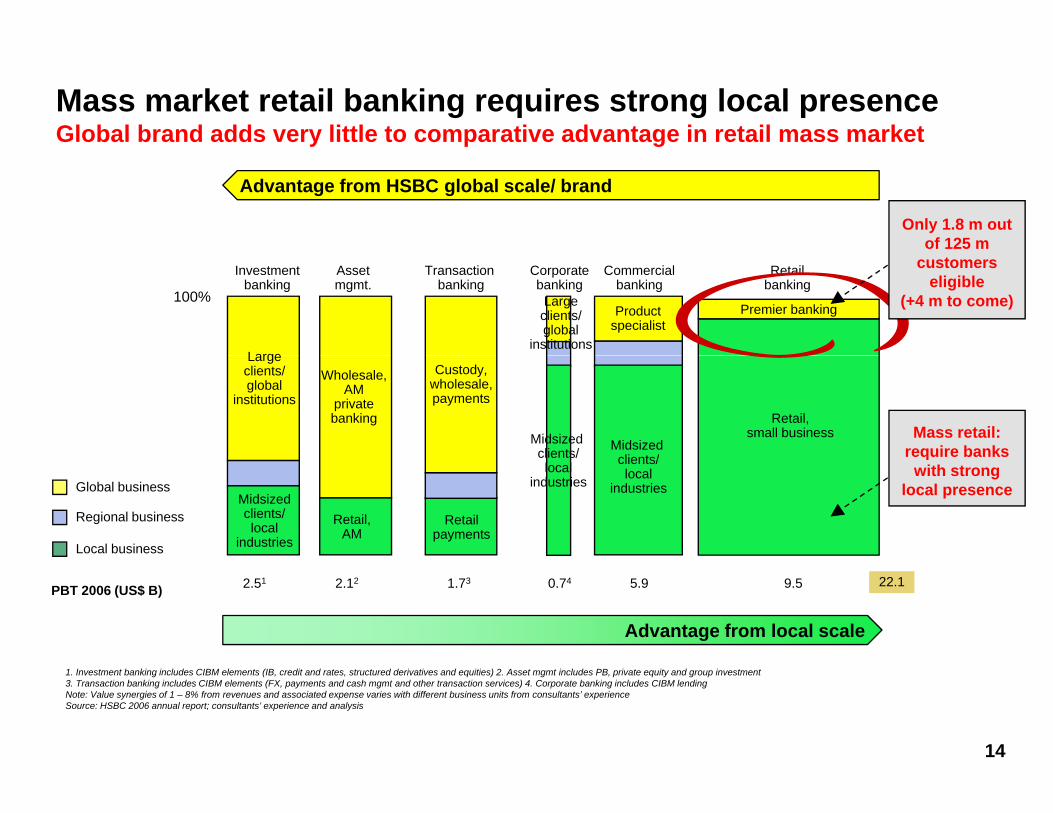
Mass market retail banking requires strong local presenceGlobal brand adds very little to comparative advantage in retail mass market
Advantage from HSBC global scale/ brand
Only 1.8 m out of 125 m
Assetmgmt.
Transaction banking
Commercialbanking
Retailbanking
Investmentbanking
Productspecialist
Large
Corporatebanking
Large clients/global
institutions
Premier banking
customers eligible
(+4 m to come)100%
Midsized clients/
Retail,small business
Wholesale,AM
privatebanking
Large clients/global
institutions
Custody,wholesale,payments
Midsized clients/
Mass retail: require banks
Global business
Regional business
Local business
Midsized clients/local
industries
Retail,AM
Retailpayments
clients/local
industrieslocal
industries
qwith strong
local presence
Advantage from local scale
2.51 2.12 1.73 5.9 9.5PBT 2006 (US$ B) 22.10.74
14
1. Investment banking includes CIBM elements (IB, credit and rates, structured derivatives and equities) 2. Asset mgmt includes PB, private equity and group investment3. Transaction banking includes CIBM elements (FX, payments and cash mgmt and other transaction services) 4. Corporate banking includes CIBM lendingNote: Value synergies of 1 – 8% from revenues and associated expense varies with different business units from consultants’ experienceSource: HSBC 2006 annual report; consultants’ experience and analysis
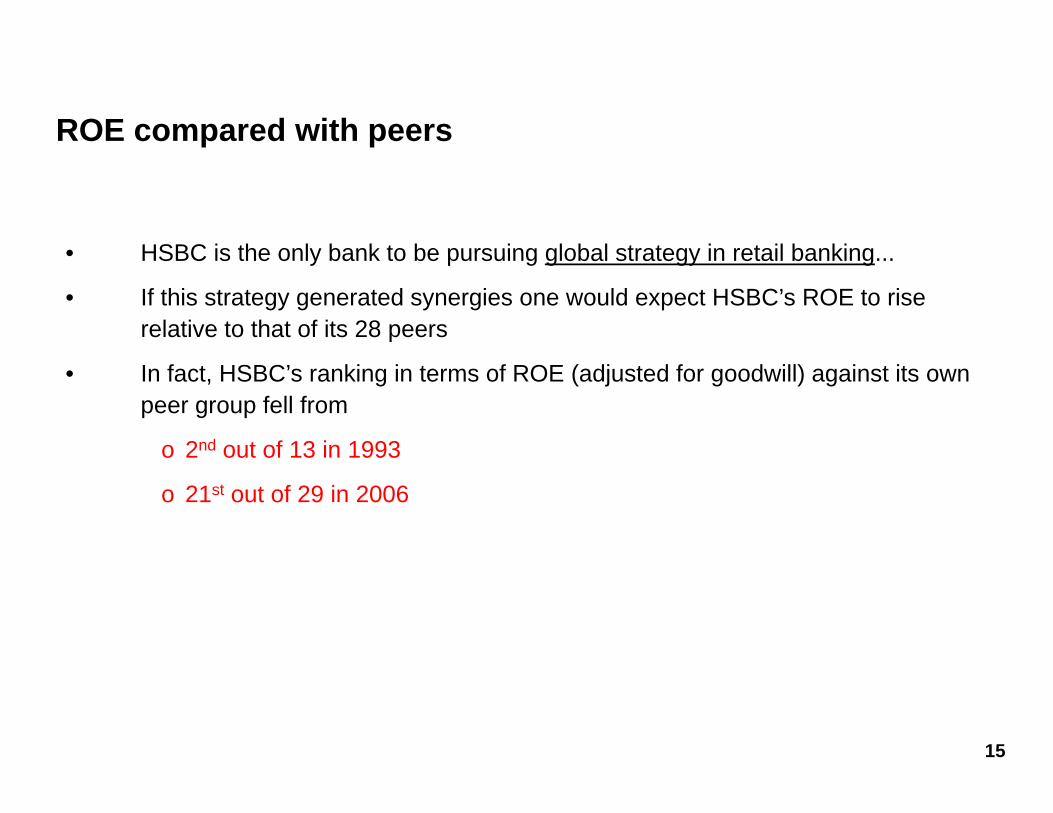
ROE compared with peers
• HSBC is the only bank to be pursuing global strategy in retail banking• HSBC is the only bank to be pursuing global strategy in retail banking...
• If this strategy generated synergies one would expect HSBC’s ROE to rise relative to that of its 28 peers
• In fact, HSBC’s ranking in terms of ROE (adjusted for goodwill) against its own peer group fell from
o 2nd out of 13 in 1993
o 21st out of 29 in 2006
15
SECTION 3
LACK OF SCALE IN KEY MARKETS
16
HSBC not a leading player in its key markets (ex Hong Kong)Asset size, relative market share and total market asset size in key markets
Market size of banking
Asset size, relative market share and total market asset size in key markets
10,000
Market size of banking assets (US$ Bn)
US (HSBC Bank USA only) Ideal position for global banks
571
169
136,000
8,000
China
UK
France
167
492 000
4,000
HK
France
BrazilCanada
Australia58
113
82526
13
7272
2112
0
2,000
0 0.2 0.4 0.6 0.8 1 1.2
MexicoIndia
Egypt
MalaysiaTurkey
Saudi Arabia UAE
Bermuda
HSBC relative
17Note: Data shown include total assets (divisional data not available in most cases)Source: Company reports; analyst reports; central banks; EIU; External analysis
HSBC asset size (US$ Bn)
HSBC relative share to market leader
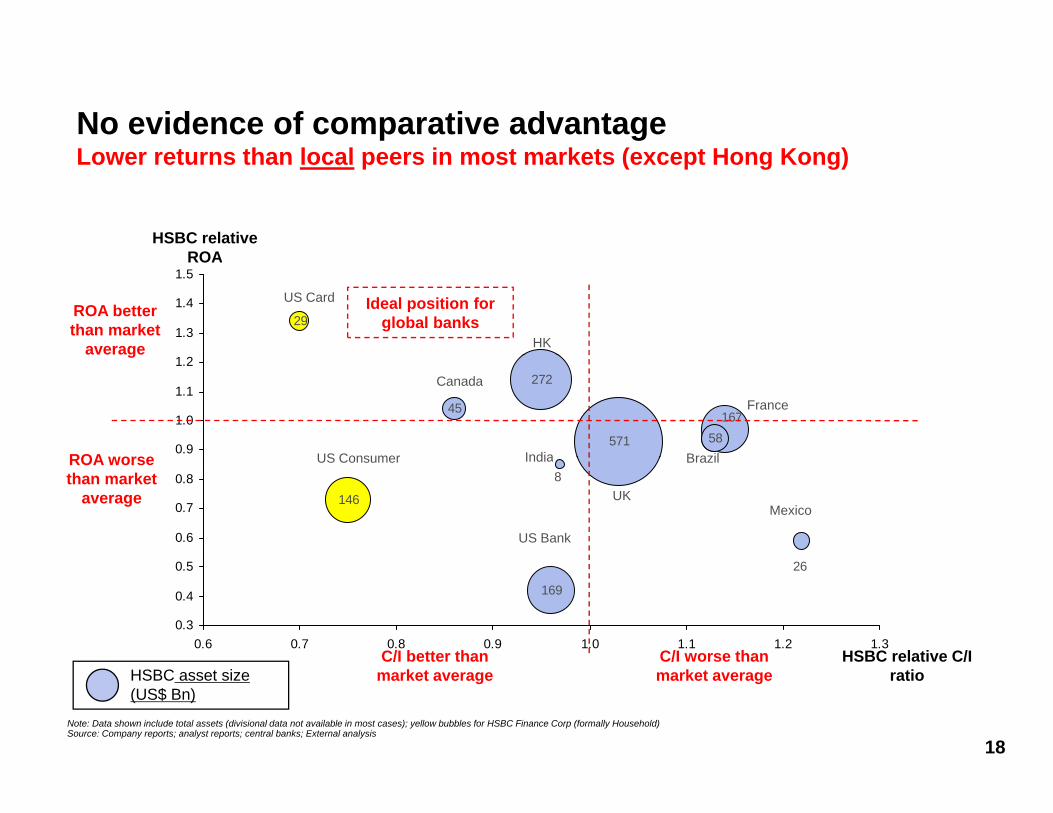
No evidence of comparative advantageL t th l l i t k t ( t H K )Lower returns than local peers in most markets (except Hong Kong)
HSBC relative ROA
291.3
1.4
1.5ROA
ROA better than market
average HK
US Card Ideal position for global banks
45
571
272
58167
0.9
1.0
1.1
1.2g
ROA worse
Canada
BrazilIndiaUS Consumer
France
8
146
0.6
0.7
0.8ROA worse than market
averageMexico
UK
BrazilIndia
US Bank
US Consumer
169
26
0.3
0.4
0.5
0.6 0.7 0.8 0.9 1.0 1.1 1.2 1.3HSBC relative C/I C/I better than C/I worse than
18
ratiomarket average market average
Note: Data shown include total assets (divisional data not available in most cases); yellow bubbles for HSBC Finance Corp (formally Household)Source: Company reports; analyst reports; central banks; External analysis
HSBC asset size (US$ Bn)

Cost reductions from increases in scale in retail banking
Unit cost (%)(rebased)
Retail banking scale curveRetail banking scale curve
Based on our consultants’ experience, global scale effect generates only 1% cost reduction when business volume doubles
Different geographical scale effects
90(rebased)
Cost reductions from increasing global or regional presenceDifferent geographical scale effects
• Global scale effects hindered by complexity of systems and processes, different information capture, regulations and legacy infrastructure
R i l l ff t i l h i f 50
70 Global: 99%
Regional: 98%
• Regional scale effects involve sharing of systems and processes, regional processing centers and distribution practices
• Local scale effects provide domestic 30
50
Local: 86%Cost reductions from increasing local scale
padvantages of similar systems, data capture, streamlining of processing, procurement and distribution channels
0 2 4 6 8 10 12 14 16 18Operating income
(US$ B)
Note: a slope of 85% means that the unit cost (eg, staff cost per operating cost) will decrease by 15% when double the total operating income; Regional and local scale effects on IT/Operations costs per product are
19
differentiated for Europe, North America, Latin America and AsiaSource: HSBC group and country annual reports; consultants’ IT benchmarking and experience

SECTION 4
GOOD POSITION IN HONG KONG Franchise at risk due to lack of credible ChinaFranchise at risk due to lack of credible China
strategy
20
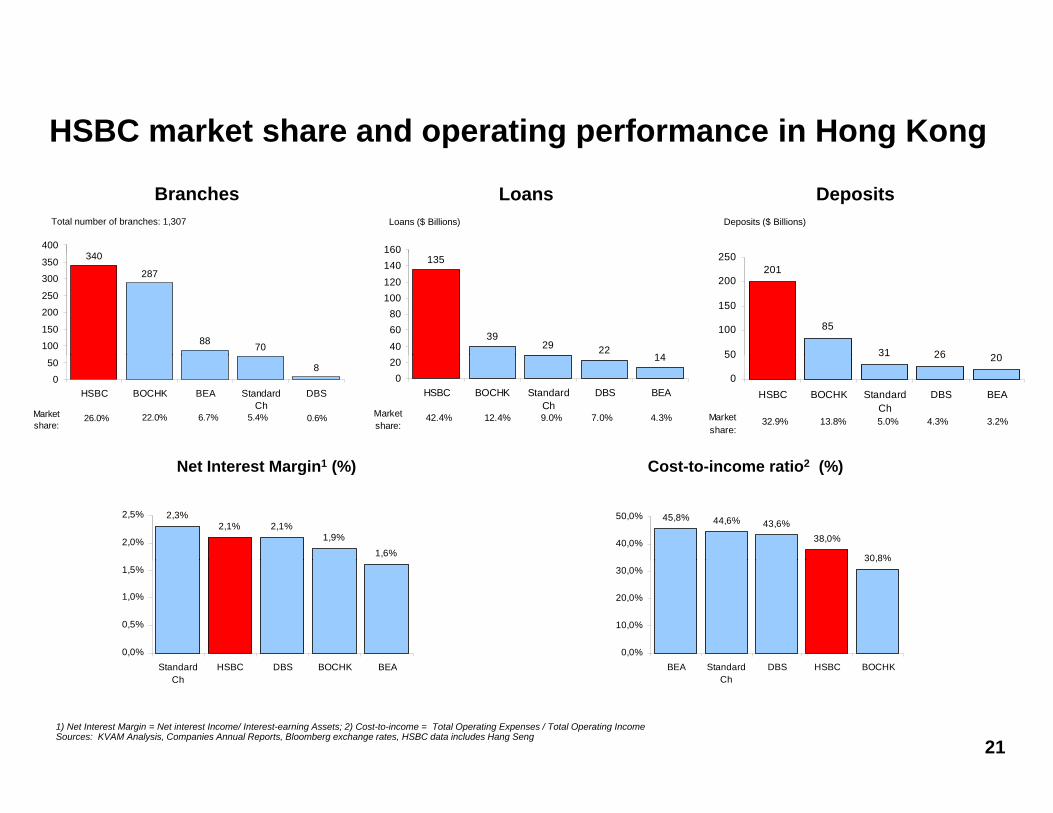
HSBC market share and operating performance in Hong Kong
BranchesBranches LoansLoans DepositsDeposits
340400 160
2 0
Total number of branches: 1,307 Loans ($ Billions) Deposits ($ Billions)
340
287
88 70100
150
200
250
300
350 135
3929 22
14406080
100120140
60
201
85
31 26 2050
100
150
200
250
80
50
HSBC BOCHK BEA StandardCh
DBS
26.0% 22.0% 6.7% 5.4% 0.6%Marketshare:
14
020
HSBC BOCHK StandardCh
DBS BEA
42.4% 12.4% 9.0% 7.0% 4.3%Marketshare:
31 26 20
0
50
HSBC BOCHK StandardCh
DBS BEA
32.9% 13.8% 5.0% 4.3% 3.2%Marketshare:
Cost-to-income ratio2 (%)Cost-to-income ratio2 (%)Net Interest Margin1 (%)Net Interest Margin1 (%)
45,8% 44,6% 43,6%38,0%
30,8%40,0%
50,0%2,3%2,1% 2,1%
1,9%
1,6%2,0%
2,5%
30,8%
0,0%
10,0%
20,0%
30,0%
0,0%
0,5%
1,0%
1,5%
211) Net Interest Margin = Net interest Income/ Interest-earning Assets; 2) Cost-to-income = Total Operating Expenses / Total Operating IncomeSources: KVAM Analysis, Companies Annual Reports, Bloomberg exchange rates, HSBC data includes Hang Seng
BEA StandardCh
DBS HSBC BOCHKStandardCh
HSBC DBS BOCHK BEA
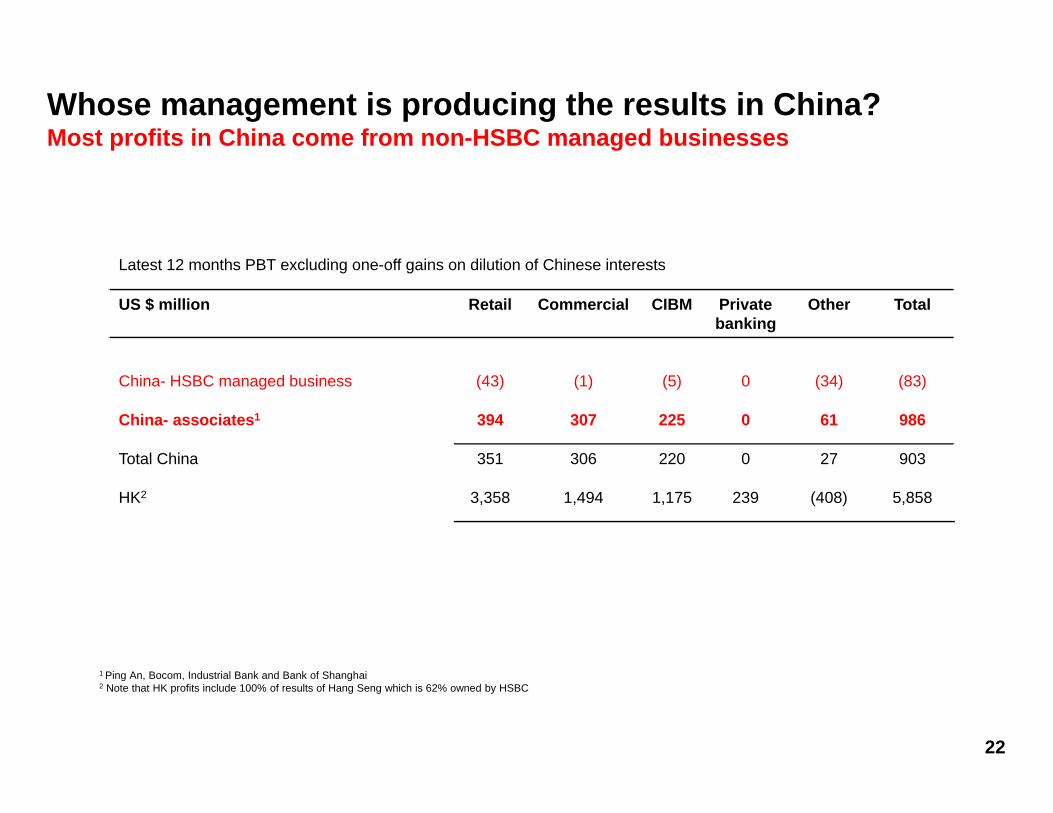
Whose management is producing the results in China?Most profits in China come from non-HSBC managed businessesp g
Latest 12 months PBT excluding one-off gains on dilution of Chinese interests
US $ million Retail Commercial CIBM Private banking
Other Total
China- HSBC managed business (43) (1) (5) 0 (34) (83)
China- associates1 394 307 225 0 61 986
Total China 351 306 220 0 27 903Total China 351 306 220 0 27 903
HK2 3,358 1,494 1,175 239 (408) 5,858
22
1 Ping An, Bocom, Industrial Bank and Bank of Shanghai2 Note that HK profits include 100% of results of Hang Seng which is 62% owned by HSBC

In retail banking, HSBC’s true competitors are the large domestic banksThey benefit from scale, regulatory protection and political sponsorship
1,373 40 2,825
China loans breakdown 2006 (US$ Bn)
22.4 39.6
Selected foreign bank loans breakdown 2006 (US$ Bn)
1.4%
283
48.6%
100%
56.6%
424
367
339
6.1
4.5
3.61.9 1.0
15%
13%
12%
10%100%
11.5%
9.2%4.7%
2.5%
ICBC ABC CCB BOC Otherdomestic
Foreignbanks
TotalHSBC BEA Stanchart BOCHK WHB Others Total
15.5%
23

The major opportunity for foreign banks in China is in the it l k tcapital markets
These are less restricted than retail banking and growing faster
% of total corporate financing% of total corporate financing
22%
43%53% 54%
45%Capital Markets
47%
77%
55%57%
78%
46%
75%
Domestic credit
Source: Bank annual reports and audited financial statements; External analysis and estimates
25% 23%
China (2005) Australia Japan China (2015) South Korea US Singapore
Domestic credit
p ; y
• HSBC’s true international competitors in China are the world’s leading investment banks.
• Most are already larger than HSBC in China in terms of profits (even including profits
24
• Most are already larger than HSBC in China in terms of profits (even including profits booked in Hong Kong).

Major investment banks well positioned in capital marketsHSBC less than 3 pct market share in equity and debt
Rk Bank m/s (%) Rk Bank m/s (%) Rk Bank m/s (%) Rk Bank m/s (%)
2006 2007ytd2002 2004
Rk Bank m/s (%) Rk Bank m/s (%) Rk Bank m/s (%) Rk Bank m/s (%)
1 CITIC Securities Corp 34.1 1 China International Capital Corp 19.1 1 China Construction Bank 11.0 1 ICBC 11.3
2 China Development Bank 25.1 2 China Galaxy Securities Co Ltd 11.0 2 China Everbright 9.9 2 China Everbright 9.4
3 China International Capital Corp 9.6 3 China Construction Bank 10.3 3 CITIC Securities Corp 9.5 3 China Construction Bank 8.9
4 China Finance Power Co Ltd 9.6 4 HSBC 5.4 4 Bank of China 9.0 4 CITIC Securities Corp 8.4
5 Chi Citi B k 5 4 5 BNP P ib G 5 2 5 ICBC 8 9 5 Chi G l S iti C Ltd 6 8
Debt issuance
5 China Citic Bank 5.4 5 BNP Paribas Group 5.2 5 ICBC 8.9 5 China Galaxy Securities Co Ltd 6.8
HSBC (20th) 1.0 HSBC (23rd) 0.8
Total: $5.1bn Total: $11.7bn Total: $59.6bn Total: $71.5bn (as of 20-Nov-07)
Rk Bank m/s (%) Rk Bank m/s (%) Rk Bank m/s (%) Rk Bank m/s (%)
1 China International Capital Corp 19.5 1 China International Capital Corp 13.4 1 Bank of China 8.9 1 Bank of China 7.8
2 CITIC Securities Corp 10.8 2 Goldman Sachs & Co 6.1 2 China International Capital Corp 7.7 2 CITIC Securities Corp 7.1
3 China Development Bank 6.7 3 Morgan Stanley 6.1 3 CITIC Securities Corp 5.9 3 ICBC 6.2
4 Bank of China 6.6 4 Citi 5.1 4 China Construction Bank 5.4 4 UBS 5.9
5 Goldman Sachs & Co 4.6 5 Deutsche Bank AG 4.9 5 UBS 4.8 5 Morgan Stanley 5.7
HSBC (8th) 1.3 HSBC (7th) 4.5 HSBC (19th) 1.6 HSBC (11st) 2.9
IPOs
25
( ) ( ) ( ) ( )
Total: $140.4bn (as of 20-Nov-07)Total: $129.5bnTotal: $33.5bnTotal: $19.0bn
Source: Bloomberg, 20-Nov-07
What is HSBC’s China strategy?Relies on taking control of Bocom, which has a 4% market share… at some pointRelies on taking control of Bocom, which has a 4% market share… at some point in the future… and organic growth starting from a very low base (a two-pronged approach)
• In retail banking, HSBC’s true competitors are the large domestic banks which benefit from scale, regulatory protection and political sponsorship
• Restrictions on foreign investment unlikely to be lifted until domestic banks are able toRestrictions on foreign investment unlikely to be lifted until domestic banks are able to compete on an equal footing (as regulators have done in other countries).
• If HSBC waits for this to happen, it risks completely missing the boat and its Hong Kong business will also be at risk.
• When the market finally opens, the local Chinese banks will, by virtue of their size, have an unassailable competitive advantage.
• Moreover, given the multiples at which their shares trade, they will be able to pay a massive i f t l f B th HSBC ill b bl tprice for control of Bocom – more so than HSBC will be able to pay.
26

What are HSBC’s true strategic options? Buying a minority stake in Bocom is not the only oneBuying a minority stake in Bocom is not the only one
Viable strategy for China needed in order to protect franchise in Hong KongViable strategy for China needed in order to protect franchise in Hong Kong.
Investment restrictions apply to domestic credit market only. This leads to three alternatives
1. Finding some way of competing in capital markets on an equal footing with the major i t t b k ( hi h i i f it ) d/investment banks (which raises issues of its own); and/or
2. Moving HSBC’s legal headquarters back to Hong Kong (or Shanghai); and/or 3. Spinning off all or part of HSBC’s Asian business in order to allow HSBC’s Asian
business to merge with (or be absorbed by) Bocom without restrictionsbusiness to merge with (or be absorbed by) Bocom without restrictions.
Maintaining a London listing should be possible in each case.A listed Asian/ Chinese business should be worth substantially more to HSBC’s shareholdersA listed Asian/ Chinese business should be worth substantially more to HSBC s shareholders than the valuation which is given today.
27
Options for Hang Seng Bank
HSBC has hinted at the possibility of swapping its 62% stake in Hang Seng Bank for additional positions in the Chinese market
U d th t l f i l d Chi b k H S ld b f id bl• Under the control of a mainland Chinese bank, Hang Seng could become a formidable competitor for HSBC in Hong Kong.
• HSBC needs to protect its position in Hong Kong, not weaken it. • We do not believe that the authorities would allow HSBC to acquire control of Bocom in theWe do not believe that the authorities would allow HSBC to acquire control of Bocom in the
near future (even via a swap of HSBC’s stake in Hang Seng).
We have suggested that HSBC buy out the minorities in Hang Seng. • HSBC would then have two separate brands with which to segment mass market retailing
and Premier/ private banking in China and Hong Kong.• The dilution to HSBC shareholders could be avoided by selling an equivalent business (at a
premium) elsewherepremium) elsewhere.
28

SECTION 5SECTION 5
IS CIBM LITTLE MORE THAN A HUGE TRADING OPERATION?Trading assets now tie up a third of the
Group’s balance sheet
29
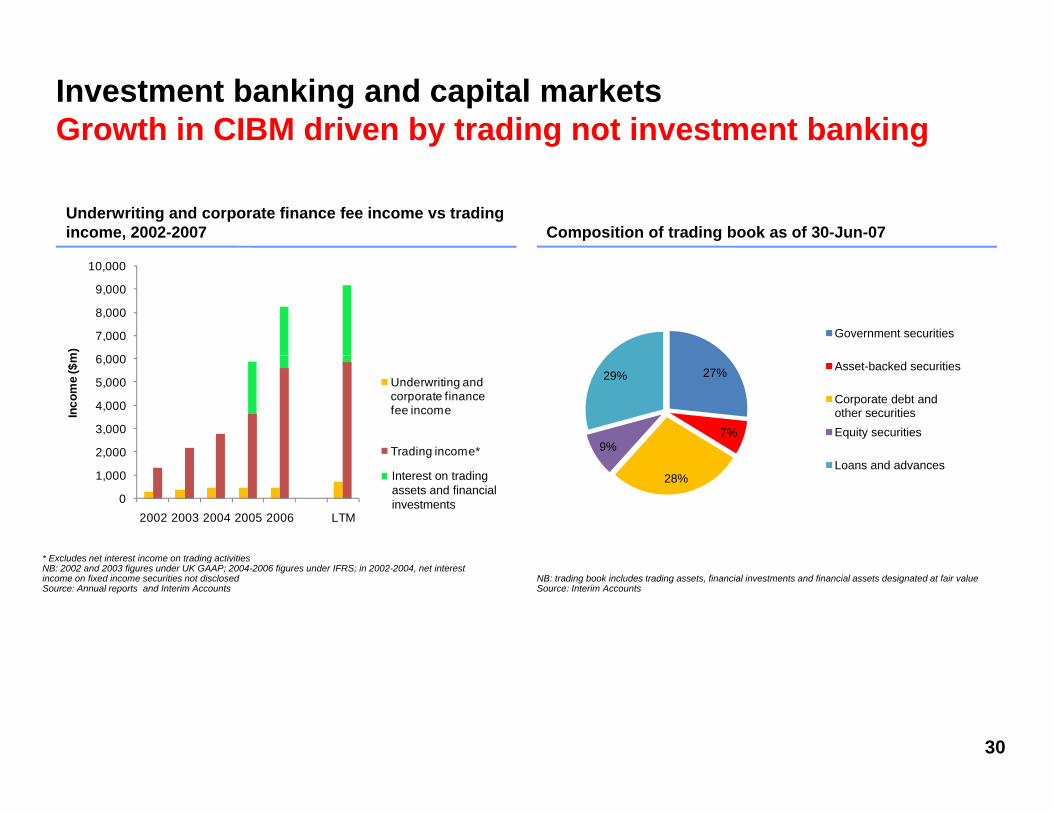
Investment banking and capital marketsGrowth in CIBM driven by trading not investment banking
Underwriting and corporate finance fee income vs trading income, 2002-2007Underwriting and corporate finance fee income vs trading income, 2002-2007 Composition of trading book as of 30-Jun-07Composition of trading book as of 30-Jun-07
Government securities
6 000
7,000
8,000
9,000
10,000
m)
27%
7%9%
29%Asset-backed securities
Corporate debt and other securitiesEquity securities
2,000
3,000
4,000
5,000
6,000
Inco
me
($m
Underwriting and corporate finance fee income
Trading income*
* Excludes net interest income on trading activities
Interest on trading assets and financial investments
28%Loans and advances
0
1,000
,
2002 2003 2004 2005 2006 LTM
Excludes net interest income on trading activitiesNB: 2002 and 2003 figures under UK GAAP; 2004-2006 figures under IFRS; in 2002-2004, net interest income on fixed income securities not disclosedSource: Annual reports and Interim Accounts
NB: trading book includes trading assets, financial investments and financial assets designated at fair valueSource: Interim Accounts
30
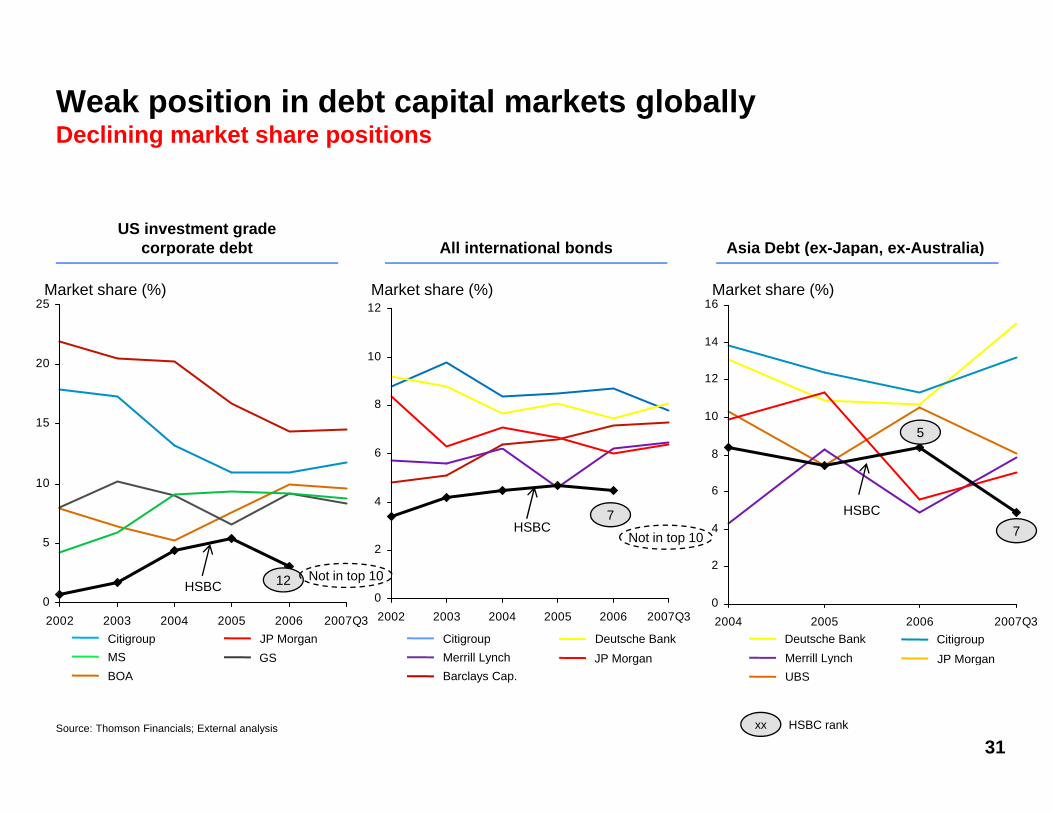
Weak position in debt capital markets globallyDeclining market share positions
US investment gradecorporate debt
US investment gradecorporate debt All international bondsAll international bonds Asia Debt (ex-Japan, ex-Australia)Asia Debt (ex-Japan, ex-Australia)
14
1625
corporate debtcorporate debt All international bondsAll international bonds Asia Debt (ex Japan, ex Australia)Asia Debt (ex Japan, ex Australia)
10
12Market share (%)Market share (%)Market share (%)
8
10
12
15
20
6
8
10
5
2
4
6
5
10
2
47
HSBCHSBC
7Not in top 10
0
2
2004 2005 2006 2007Q3
02002 2003 2004 2005 2006 2007Q3
HSBC 1202002 2003 2004 2005 2006 2007Q3
JP MorganCitigroupMS GS
Deutsche BankJP MorganMerrill Lynch
Citigroup
JP Morgan
Deutsche BankMerrill Lynch
Citigroup
Not in top 10
31
BOAgy
Barclays Cap.
Source: Thomson Financials; External analysis
J o gayUBS
xx HSBC rank
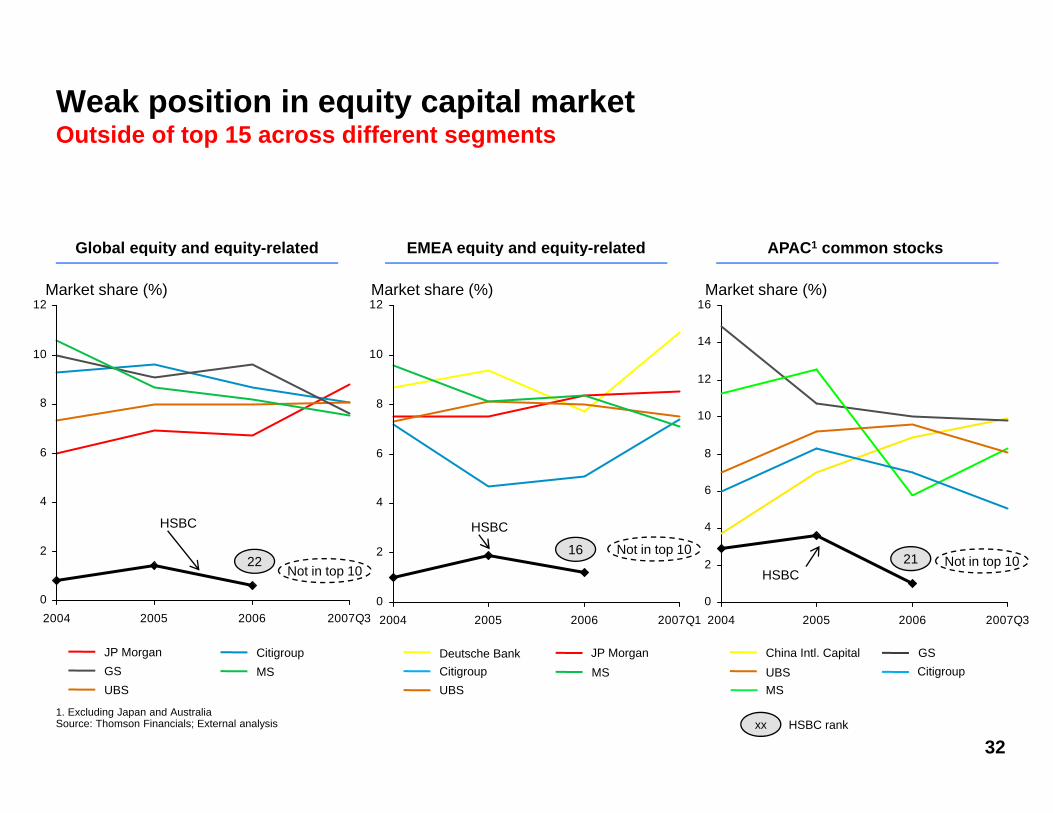
Weak position in equity capital marketOutside of top 15 across different segments
EMEA equity and equity-relatedEMEA equity and equity-related APAC1 common stocksAPAC1 common stocksGlobal equity and equity-relatedGlobal equity and equity-related EMEA equity and equity relatedEMEA equity and equity related APAC common stocksAPAC common stocks
10
12
14
16Market share (%)Market share (%)
10
12
Global equity and equity relatedGlobal equity and equity related
Market share (%)
6
8
10
8
10
12
6
8
10
2
4
162
4
6
21
HSBC
2
4
HSBC
22Not in top 10
Not in top 10
02004 2005 2006 2007Q1
0
2
2004 2005 2006 2007Q3
21HSBC
Deutsche Bank JP Morgan GSChina Intl. Capital
02004 2005 2006 2007Q3
22
CitigroupJP Morgan
Not in top 10Not in top 10
32
MSCitigroupUBS
UBSMS
Citigroup
1. Excluding Japan and AustraliaSource: Thomson Financials; External analysis xx HSBC rank
MSUBSGS

SECTION 6SECTION 6
POOR GOVERNANCE
33
HSBC’s governanceInadequate framework for promoting changeg g
In most major UK companies a strategy that fails to produce results can be challenged by the Chairman by the non executives or by senior managementchallenged by the Chairman, by the non-executives or by senior management
• The independence of the Chairman is fundamental to the proper oversight by a board over managementoversight by a board over management.
• In the case of HSBC the Chairman (who is responsible for strategy and governance and is former CEO) is not independent.
• When strategy fails, HSBC’s Chairman has a conflict of interest.
• Management compensation arrangements (as embodied in the 2005 Sh Pl ) d t t i i ti f ti tShare Plan) do not create economic incentives for executives to challenge strategies they think are failing.
This places HSBC’s non-executive directors in an unusually difficult
34
p yposition and places a greater onus on them to act independently
The HSBC 2005 Share PlanDoes not properly align interests of shareholders and management
• The HSBC long term incentive plan is split into two independent pots (50% each) subject to separate vesting conditions over three year period
o 50% starts vesting on achieving median relative TSR targeto 50% starts vesting on achieving median relative TSR target
o 50% starts vesting on achieving 24% “absolute” EPS target
• Relative TSR element starts vesting when median performance is achieved –Relative TSR element starts vesting when median performance is achieved which HSBC has achieved on only a few occasions in past 14 years, so EPS element is critically important
• Detailed review of the way in which the EPS element of the scheme worksDetailed review of the way in which the EPS element of the scheme works suggests poor alignment of compensation and performance
35

Vesting Conditions - EPS PortionAs described in 2005 and 2006 Annual Reports
• EPS element starts to vest when “incremental EPS” over three years reaches at least 24%; it all vests when “incremental EPS” reaches 52%all vests when incremental EPS reaches 52%
• Definition of “incremental EPS” is very unusual: Sum of A + B + C
A = increase in EPS from base year to end of year 1A = increase in EPS from base year to end of year 1
B = increase in EPS from base year to end of year 2 (i.e. over years 1 and 2)
C = increase in EPS from base year to end of year 3 (i.e. over years 1, 2 and 3)
NB: This point no longer being contested by HSBC
36
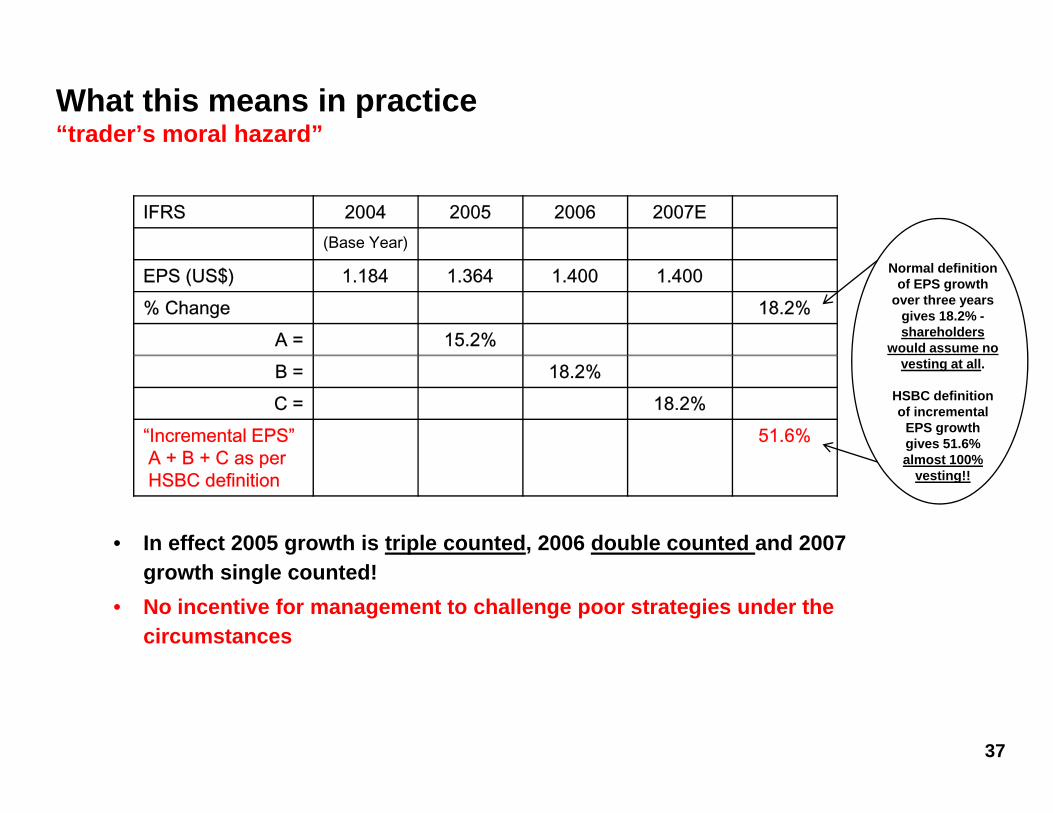
What this means in practice“trader’s moral hazard”
IFRS 2004 2005 2006 2007E(Base Year)
EPS (US$) 1.184 1.364 1.400 1.400% Change 18.2%
A = 15.2%
Normal definition of EPS growth
over three years gives 18.2% -shareholders
would assume no
B = 18.2%C = 18.2%
“Incremental EPS”A + B + C as per
51.6%
vesting at all.
HSBC definition of incremental
EPS growth gives 51.6% almost 100%
• In effect 2005 growth is triple counted, 2006 double counted and 2007
A + B + C as perHSBC definition
almost 100% vesting!!
growth single counted!• No incentive for management to challenge poor strategies under the
circumstances
37
Was the description of the HSBC executive compensation plan used to obtain shareholder approval not misleading?plan used to obtain shareholder approval not misleading?
• No mention of the unusual definition of “incremental” EPS being used by• No mention of the unusual definition of incremental EPS being used by HSBC in the Chairman’s Letter of May 2005 and other documents sent to shareholders to seek their approval (prior to shareholder vote).
• This definition was first disclosed to the market in HSBC’s 2005 accounts which• This definition was first disclosed to the market in HSBC s 2005 accounts which were published AFTER the shareholder resolution was passed. HSBC attributes this to a problem of “communication”.
HSBC l l i th t it EPS l l ti i “ t d th d”• HSBC also claims that its EPS calculation is “an accepted method”.
• Towers Perrin, consultants to HSBC’s remuneration committee recently described the structure as being as “reasonably unusual” and employing “an odd bit of maths” (Daily Telegraph 11 Sept 2007).
• We believe that HSBC’s 2005 proxy materials may have been misleading and that the compensation plan as implemented in effect has lower vesting targets than
38
those communicated to and approved by shareholders.

Final word to HSBCQuestioning HSBC’s synergies
“Despite much talk of the synergies and efficiencies that a larger organisation can achieve … we have to concede that there is a distinct lack of empirical evidence that size equals efficiency…”
Questioning HSBC’s competitive advantageQ g p g
“…The decision to build a global banking platform needs to be a hard-headed one; it needs to be based on a realistic analysis of competitive
d t ”advantage”
“Being a domestic player does not make a bank uncompetitive”
Questioning the global banking modelQuestioning the global banking model
“In seeking a global base, many banks have come severely unstuck. … while global banking can be a successful model, it is not the only
39
one”David Hodgkinson, HSBC Chief Operating Officer, 17 May 2007