Embed Size (px)
Citation preview

HOW TO MEASURE ROI FOR CATMAN
A PRACTICAL GUIDE TO MEASURING THE RETURN
ON INVESTMENT FOR CATEGORY MANAGEMENT
PROJECTS.
[Type here]
Table of Contents
Acknowledgments
Forward
Category Management
ROI Calculation
How to approach ROI calculation
Guideline to supplier & retailer costs
Calculation of incremental turnover
ROI Summary
Acknowledgments
This report was made possible by the contributions of the members of ECR Ireland Category Management & Shopper Marketing Workgroup and particularly the Return on Investment sub-group. Their leadership, direction and willingness to develop a better way of working have added significantly to the content of this Guide. On behalf of the ECR Ireland Board, I would like to thank all of those listed below who willingly gave their time and expertise to this important initiative.
Susan Darcy, JTI
Patricia Garry, Richmond Marketing
Jenny Maybury, Category Solutions
Declan Carolan
General Manager
ECR Ireland

[Type here]
Forward
How to measure Return-on-investment (ROI) for Category Management
Most retailers and manufacturers in the Consumer Product Goods (CPG) sector practice category management. Many have Category Management departments and category strategies with trading partners. During either tough trading times or category growth periods, category management is key to a total company strategy that keeps CPG manufacturers and retailers competitive. A successful category management strategy can differentiate you from your competition, giving you a substantial competitive advantage and helping you "win at shelf."
But at what cost? Do retailers and manufacturers measure the cost of category management and more importantly, do they measure the return on this investment?
Determining the cost of category management is relatively straightforward. However, pinpointing the return that can be directly attributable to the category management function is more challenging. Given that category management is dependent on functions such as shopper marketing, product development, product availability and sales for its success, how can CPG companies calculate the ROI of their particular category management investments?
Furthermore, there are softer benefits to category management such as attaining category captaincy, increasing product distribution or assortment and even developing stronger working relationships with a trading partner at the expense of a competitor doing so that may simply be deemed as a cost of effective business.
Consequently, the calculation of ROI for category management is not widely practiced in Ireland and nor is there a standard metric for doing so. The ECR Ireland Category Management Benchmark Survey 2012 determined that only 13% of respondents used a formula for measuring the ROI of category management. The likelihood is that these formulas were created internally.
To this extent, the ECR Ireland Category Management Workgroup formed a sub-group to create a guide for measuring the ROI of category management.
This guide can be used by retailers & manufacturers alike. It is applicable for businesses large & small. It will allow for the annual measurement and benchmarking of the ROI of Category Management ongoing and can thus serve as a valuable tool for senior managers in evaluating the category management effort year on year.

[Type here]
Category Management
Category Management is a Retailer - Supplier process focusing on categories and the consumer.
Developed in the 1990’s by The Partnering Group, Category Management focuses on delivering consumer needs through a process of evaluating and managing categories.
The ECR 9 – Step Category Management Process
It is a process which defines categories into manageable groups of products that are,
interrelated or substitutable, and fulfill specific consumer needs. The Consumer Decision Tree
is fundamental to Category Management as it delves into the key decision process Shoppers
make when purchasing.
A Category Role is defined based on channel type, retailer importance, current and potential size and growth thus driving objectives and strategies for the Category. Ranging and Planogram building is based on the above understanding and insight; central to this is ensuring the Consumers needs are met, Segmentation is clearly defined and Choice is met. Implementation is a crucial step and without compliance Category Management will fail – the most common reason that Category Management is not successful.
[Type here]
Monitoring and Reviewing demonstrates how the process has performed and leads us into the
reason for the additional focus on Return On Investment. It is vital that we understand what
benefit investing has delivered for not only Categories, Retailers but also Suppliers.
Return on Investment
When to calculate ROI It is recommended that return on investment analysis be performed after each category lead initiative and planogram review and that it is established as an integral part of all category projects Findings of each ROI review should be circulated to key business stakeholders
Finance
Commercial
Sales
Trade marketing
Return on investment reviews will be critical when planning and reviewing budgets. It is important to have actuals/ quantifiable deliverables when demonstrating the return category lead projects can deliver. This is particularly important in the current environment when business units are under pressure to justify spend.
How to approach ROI calculation.
Parameters and ‘watch outs’ to consider Please note the ‘Return on Investment’ calculation is a guideline to be adapted to each situation. Costs and inputs will vary by project and business. Return on Investment ‘…in the broadest sense just attempts to measure profitability of an investment and as such, there is no “right” calculation’1 When partaking in an ROI review, it is recommended that one project owner is appointed. The role of the project owner is to coordinate the supply of and ensure the validity of the information feeding into the calculation.

[Type here]
In order to develop a valid ROI calculation the owner of the project must understand all that, the business as at total has invested in the project. This may require the project owner to collaborate with departments outside of the category team i.e. field sales. All costs included in the calculation should reflect the company guidelines.
It is heavily recommended that the project owner work closely with the finance department.
Determining what is a cost Company guidelines as previously stated will determine what constitutes a cost for your business/project. Cost may be supplier or retailer based. The following checklist is a guide only, costs will vary by business and project.
Considerations: There will be one off costs that can be easily applied to each project. More often than not however there will be resources that overlap between departments & projects. Market data is a good example of an overlapping resource. Market data will be provided by a number of different business units within your organisation i.e. sales, marketing, trade marketing. It is important that costs attributed, in the calculation are in proportion to the actual use of the
resource in the project.

[Type here]
A checklist of retailer & supplier costs
Costs associated with category management planograms
Suppliers Retailers
Data Market data EPOS data Shopper loyalty data
Epos data
Software
Planogram software Planogram software
Research Shopper research Shopper studies
Preparation Category Manager costs. Presentation costs - printing, props, etc.
POS / Fixtures
Bespoke POS to support the initiative
Design Alignment Office Labour Cross Functional – Internal and External team Management
In Store
Organisation & implementation of trial. Labour required to implement the plan. Tools required for implementation.
Retailer interaction and communication. Planogram maintenance.
Review Changes according to retailer feedback
[Type here]
Calculation of incremental turnover
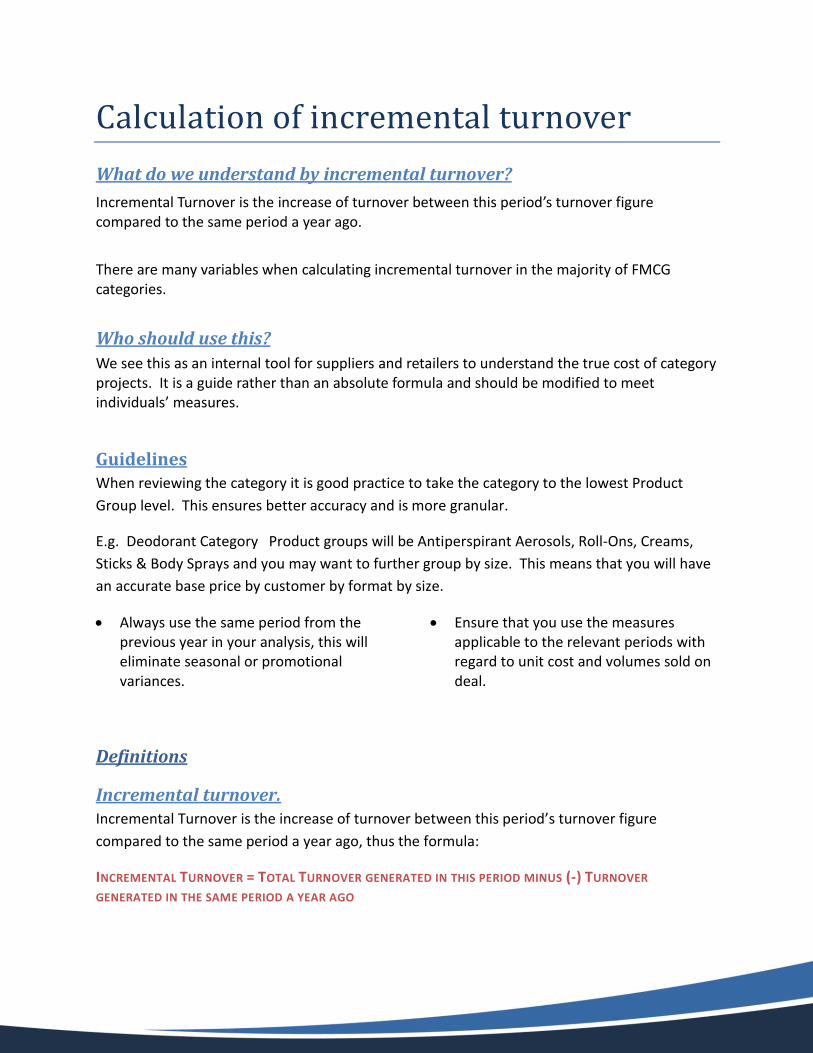
What do we understand by incremental turnover?
Incremental Turnover is the increase of turnover between this period’s turnover figure compared to the same period a year ago.
There are many variables when calculating incremental turnover in the majority of FMCG categories.
Who should use this?
We see this as an internal tool for suppliers and retailers to understand the true cost of category projects. It is a guide rather than an absolute formula and should be modified to meet individuals’ measures.
Guidelines When reviewing the category it is good practice to take the category to the lowest Product
Group level. This ensures better accuracy and is more granular.
E.g. Deodorant Category Product groups will be Antiperspirant Aerosols, Roll-Ons, Creams,
Sticks & Body Sprays and you may want to further group by size. This means that you will have
an accurate base price by customer by format by size.
Always use the same period from the previous year in your analysis, this will eliminate seasonal or promotional variances.
Ensure that you use the measures applicable to the relevant periods with regard to unit cost and volumes sold on deal.
Definitions
Incremental turnover. Incremental Turnover is the increase of turnover between this period’s turnover figure
compared to the same period a year ago, thus the formula:
INCREMENTAL TURNOVER = TOTAL TURNOVER GENERATED IN THIS PERIOD MINUS (-) TURNOVER
GENERATED IN THE SAME PERIOD A YEAR AGO

[Type here]
Units sold Will always be consumer units.
Product Group Products which have similar attributes and are usually priced at same price point. • Example - Category = Female Deodorants - > Product Groups : Antiperspirant Aerosols / Roll-Ons / Sticks / Creams / Body Sprays
-> Size: 100ml, 200ml, 50ml etc.
Base Price Base price should be the standard unit cost - This definition will differ from supplier to supplier and therefore we would recommend that you consult you finance departments for your corporate definition. In terms of calculation you should use the avg. unit cost for the period being evaluated and the avg. unit cost of the same period a year ago.
Volume Sold on Deal: In order to ascertain the average volume sold on deal there are a couple of ways in which you can do this:
If you buy Key Account Data (KAD) for the category and retailer, there is % sold on deal filter
which will allow you calculate the average volume sold on deal OR
If you do not have KAD you can source average volume sold on deal for most categories though
panel data.

[Type here]
It is important that you use the avg. category volume sold on deal applicable to the previous period also.
Time frame / analysed period We would suggest a 2 week bedding down period to make sure that all plans in the project have had a chance to settle. i.e. Missing stock at time of implementation and/or any deleted lines to sell through etc. However orders of any new products added to the plan should be taken into consideration (Warehouse orders in advance of implementation phase.) In non-seasonal categories - a 12 to 16 week period post implementation should be sufficient to calculate the turnover. You compare this to the same period of the previous years. Because of the buying behaviour of retailers (they try to match same weighted promotional phasing YoY) you are most likely to capture similar promotional dynamics for the same period a year ago.
In seasonal categories you might want to compare one season v the season a year ago to capture natural spikes.
[Type here]
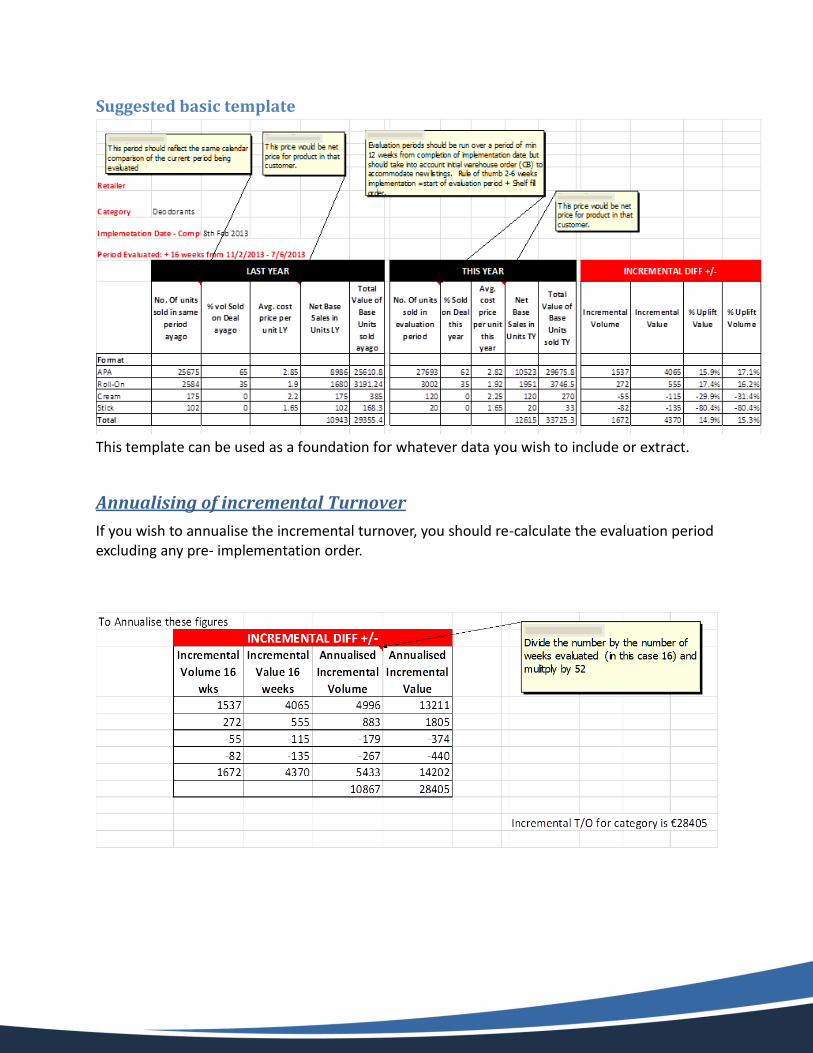
Suggested basic template
This template can be used as a foundation for whatever data you wish to include or extract.
Annualising of incremental Turnover
If you wish to annualise the incremental turnover, you should re-calculate the evaluation period excluding any pre- implementation order.

[Type here]
ROI – summary
As with any balance sheet there is a debit and a credit side to the document. This incremental turnover figure can be used to offset direct costs incurred during the project. Once this stage has been reached, it is important to revisit the original objectives of the project. Where they may be a return of negative incremental growth – it will give you an understanding of the cost of the other objectives of the project.
[Type here]
Disclaimer
This document is promoted by the members of ECR Ireland and has been achieved thanks to the
active support of the participating companies and organizations. However, ECR Ireland member
companies, participating companies, individually or collectively, do not necessarily endorse
every technique, process or principle described herein. The material in this document is for
information only and any use of such material is made solely at the risk of the company or
organisation using the information and without any liability for ECR Ireland, the authors and
member companies and organisations. Companies using the material presented in this
publication should seek to ensure compliance with any applicable laws or regulations, including
data protection and competition legislation.


![Mu - X5 [CatMan, ECR Award 2010]](https://img.dokumen.tips/doc/110x75/5564b9e4d8b42a98268b5520/mu-x5-catman-ecr-award-2010.jpg)


![P&G - X5 [CatMan, ECR Award 2010]](https://img.dokumen.tips/doc/110x75/5564b89dd8b42a3e618b4f5f/pg-x5-catman-ecr-award-2010.jpg)


![Bacardi Real [CatMan, ECR Award 2010]](https://img.dokumen.tips/doc/110x75/54620bc3af7959d61d8b7593/bacardi-real-catman-ecr-award-2010-5584ae766e6fa.jpg)