Embed Size (px)
Citation preview

2015 Hospital IT Service Desk Benchmarks
NIT Health | 90 John Street 7th Floor | New York, NY 10038 | (888) 858-5648 190 John Street 7th Floor | New York, NY 10038 | (888) 858-5648
A Comprehensive Study of Industry-Wide Hospital IT Service
Desk Performance Metrics
Hospital IT Service DeskBenchmarks
2015

2015 Hospital IT Service Desk Benchmarks
NIT Health | 90 John Street 7th Floor | New York, NY 10038 | (888) 858-5648 2
Introduction
Service Desk Budget Benchmarks
Average Service Desk Budget / Bed
Average Service Desk Budget / Physician
Average Service Desk Budget / Hospital FTE
Average Service Desk Budget / Support Case
Service Desk Case Volume
Average Number of Cases / Bed
Average Number of Cases / Physician
Average Number of Cases / Hospital FTE
Average Number of Cases / System Supported
Average Number of Cases / Service Desk FTE
Where Cases are Coming From?
Service Levels
Service Desk Staffing
Average Number of System Supported / Service Desk FTE
Average Number Beds / Service Desk FTE
Average Number of Hospital FTE / Service Desk FTE
Training
Average Training Cost / Service Desk FTE
Conclusion
Table of Contents
3
4
5
6
7
8
9
10
11
12
13
14
14
15
17
18
19
20
21
22
23

2015 Hospital IT Service Desk Benchmarks
NIT Health | 90 John Street 7th Floor | New York, NY 10038 | (888) 858-5648 3
Introduction
Yours truly,
Lior BlikCEO
NIT Health presents the 2015 Hospital IT Service Desk Benchmarks. This in-depth research probes into the performance metrics of dozens of hospitals that work with NIT Health. Our goal is to allow IT professionals to compare themselves to their peers and measure their performance as compared to the industry average.
Nowadays, hospitals run on information and data—from Electronic Medical Records (EMR) to other sensitive systems. All of these systems must work seamlessly. However, every system needs support, and when they need it, that support must be quick and immediate in order to further excellent patient care.
The service desk supports the smooth operations of countless key systems, providing real-time assistance to physicians and staff that drives clinical excellence. However, running an efficient and cost-effective service desk that meets the highest levels of assistance is not an easy task.
At NIT Health, we support countless hospitals and organizations in building cost-effective, scalable, and efficient IT service desks with stellar customer service. Our goal is to enable you to use these metrics to better understand your organization’s performance status.
As always, our team will be happy to answer any questions that you may have about this report. Feel free to reach out to us at (888) 858-5648.

2015 Hospital IT Service Desk Benchmarks
NIT Health | 90 John Street 7th Floor | New York, NY 10038 | (888) 858-5648 4
Service DeskBudget
Benchmarks
In the budget section, we explore how much hospitals spend on their service desks per year. We analyzed the data for the highest 25% of spend, the average,
and the lowest 25%. All budget figures include direct cost and benefits, excluding technology and
hardware.

2015 Hospital IT Service Desk Benchmarks
NIT Health | 90 John Street 7th Floor | New York, NY 10038 | (888) 858-5648 5
Average Service Desk Budget / Bed
*Includes direct cost and benefits, excluding technology and hardware.
On average, hospitals spend $2,059 on IT service desks for every bed annually. Lowest spending hospitals, on average, spend $1,544 annually per bed. Hospitals on the higher end of the spending budget spend $2,574 annually per bed.
Top 25% of Spending Average Bottom 25% of Spending
Annu
al B
udge
t
$2,574
$2,059
$1,544
0
500
$1,000
$1,500
$2,000
$2,500
$3,000

2015 Hospital IT Service Desk Benchmarks
NIT Health | 90 John Street 7th Floor | New York, NY 10038 | (888) 858-5648 6
Average Service Desk Budget / Physician
*Includes direct cost and benefits, excluding technology and hardware.
When examining service desk budgets per physician, we find that on average, hospitals spend $757 annually per physician. The lower spending 25% of hospitals budget only $568 while the higher spending 25% of hospitals budget $946 annually per physician.
Top 25% of Spending Average Bottom 25% of Spending
Annu
al B
udge
t
$946
$757
$568
$0
$200
$400
$600
$800
$1,000

2015 Hospital IT Service Desk Benchmarks
NIT Health | 90 John Street 7th Floor | New York, NY 10038 | (888) 858-5648 7
Average Service Desk Budget / Hospital FTE
*Includes direct cost and benefits, excluding technology and hardware.
When expanding the view to the total number of hospital FTEs, we discover that the average hospital spends $204 per FTE annually. On the lower end, hospitals spend $153 annually per FTE, and on the higher end, hospitals spend $255 per hospital FTE annually.
Annu
al B
udge
t
$255
$204
$153
$0
$50
$100
$150
$200
$250
$300
Top 25% of Spending Average Bottom 25% of Spending
Average Service Desk Budget / Physician

2015 Hospital IT Service Desk Benchmarks
NIT Health | 90 John Street 7th Floor | New York, NY 10038 | (888) 858-5648 8
Average Service Desk Budget / Support Case
*Includes direct cost and benefits, excluding technology and hardware.
When looking at the average cost of a single support case, we found that the average hospital spends $18. This figure is only $13 for the lower spending hospitals and $22 for the higher spending hospitals.
Annu
al B
udge
t
$22
$18
$13
$0
$5
$10
$15
$20
$25
Top 25% of Spending Average Bottom 25% of Spending

2015 Hospital IT Service Desk Benchmarks
NIT Health | 90 John Street 7th Floor | New York, NY 10038 | (888) 858-5648 9
Service DeskCase
Volume
Every hospital is different, each requiring the support of different systems. This section provides insights
around the case volume that the average service desk handles on an annual basis. Again, we looked at the
average hospital, as well as the lower and higher 25% of organizations.
Average Service Desk Budget / Support Case

2015 Hospital IT Service Desk Benchmarks
NIT Health | 90 John Street 7th Floor | New York, NY 10038 | (888) 858-5648 10
Average Number of Cases / Bed
Our analysis shows that on average, IT service desks in a hospital handle 114 cases per bed annually. On the higher end of the spectrum, hospitals handle 143 cases annually and on the lower end the figure drops to 86 cases.
Low 25% Average High 25%
Annu
al #
of C
ases
86
114
143
0
30
60
90
120
150

2015 Hospital IT Service Desk Benchmarks
NIT Health | 90 John Street 7th Floor | New York, NY 10038 | (888) 858-5648 11
Average Number of Cases / Bed
Average Number of Cases / Physician
When looking at the volume of cases per physician, we found that on average, IT service desks handle 42 cases per physician per year. This number increases to 53 cases per physician for the higher 25% of hospitals and drops to only 32 for the lower 25% of hospitals.
Low 25% Average High 25%
Annu
al #
of C
ases
32
42
53
0
10
20
30
40
50
60

2015 Hospital IT Service Desk Benchmarks
NIT Health | 90 John Street 7th Floor | New York, NY 10038 | (888) 858-5648 12
Average Number of Cases / Hospital FTE
We examined the number of cases per hospital FTE. Our analysis establishes that on average, IT service desks handle 11 cases per hospital FTE annually, 14 cases per FTE for the top 25% of organizations and 9 for the lower 25% of organizations.
Low 25% Average High 25%
Annu
al #
of C
ases 9
11
14
0
3
6
9
12
15

2015 Hospital IT Service Desk Benchmarks
NIT Health | 90 John Street 7th Floor | New York, NY 10038 | (888) 858-5648 13
Average Number of Cases / System Supported
The number of systems supported affects the volume of IT support requests. Our analysis of the number of cases per supported system reveals that, on average, each system has 12 support requests. This number increases to 15 requests for the higher 25% of hospitals and drops to only 9 support requests per year for the lower 25% of hospitals.
Low 25% Average High 25%
Annu
al #
of C
ases 9
12
15
0
3
6
9
12
15
Average Number of Cases / Hospital FTE

2015 Hospital IT Service Desk Benchmarks
NIT Health | 90 John Street 7th Floor | New York, NY 10038 | (888) 858-5648 14
Average Number of Cases / Service Desk FTE
Where Cases Are Coming from?
One of the most important measures of efficiency is the number of cases per service desk FTE. Our analysis shows that on average, a service desk FTE handles 3,385 cases per year. This number increases to 4,231 for the top 25% of hospitals, where the workload is the highest. For the lower 25% of hospitals, each FTE handles 2,539 cases annually.
While the vast majority of cases are generated by phone and many service desks only allow the creation of cases by phone, other desks also allow the creation of cases from a web platform.
Phone 89.0%
Other2.3%
Email0.9%
Web7.8%
Case Origination
Low 25% Average High 25%
Annu
al #
of C
ases
2,539
3,385
4,231
0
1,000
2,000
3,000
4,000
5,000

2015 Hospital IT Service Desk Benchmarks
NIT Health | 90 John Street 7th Floor | New York, NY 10038 | (888) 858-5648 15
ServiceLevels
In this section, we analyzed the average service level of the IT service desk. Here are some of the key
metrics to look at:
Average Number of Cases / Service Desk FTE
Where Cases Are Coming from?

2015 Hospital IT Service Desk Benchmarks
NIT Health | 90 John Street 7th Floor | New York, NY 10038 | (888) 858-5648 16
Hold time
2 Minutes, 54 Seconds(average hold-time per answered call):
Call abandonment9.70%
Time to answer
56 Seconds(total time before caller speaks to a person):
Time to resolve case
8:32 Hours(meantime to resolution):
Average case in queue23 Cases

2015 Hospital IT Service Desk Benchmarks
NIT Health | 90 John Street 7th Floor | New York, NY 10038 | (888) 858-5648 17
ServiceDesk
Staffing
Staffing directly affects the service level and effectiveness of every IT service desk, making staffing
a crucial number that every IT executive should scrutinize. We analyze how some of the nation’s top
hospitals staff their help desks.

2015 Hospital IT Service Desk Benchmarks
NIT Health | 90 John Street 7th Floor | New York, NY 10038 | (888) 858-5648 18
Average Number of System Supported / Service Desk FTE
An analysis of the average number of systems supported for every IT Service Desk FTE shows that service desk personnel handle 278 systems on average. This number increases to 347 for the higher 25% of hospitals and drops to 208 for the lower 25% of hospitals.
Low 25% Average High 25%
Syst
ems
Supp
orte
d / F
TE
208
278
347
0
50
100
150
200
250
300
350
2015 Hospital IT Service Desk Benchmarks
NIT Health | 90 John Street 7th Floor | New York, NY 10038 | (888) 858-5648 19
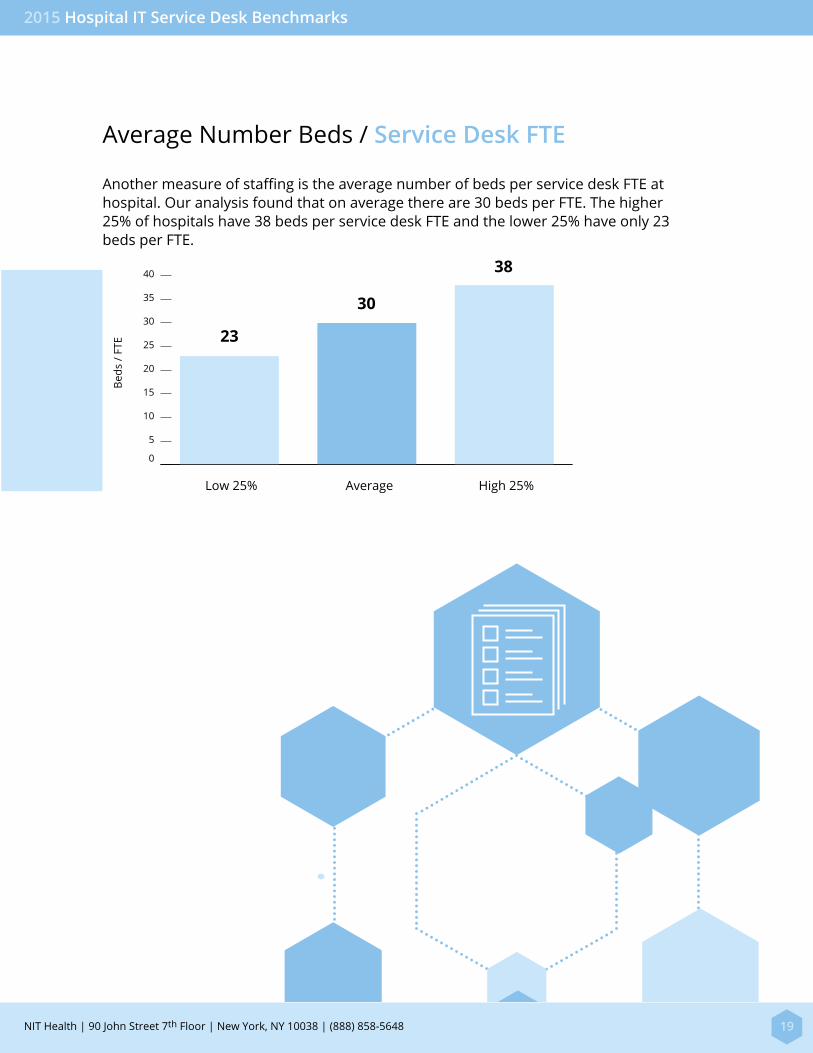
Average Number Beds / Service Desk FTE
Another measure of staffing is the average number of beds per service desk FTE at hospital. Our analysis found that on average there are 30 beds per FTE. The higher 25% of hospitals have 38 beds per service desk FTE and the lower 25% have only 23 beds per FTE.
Low 25% Average High 25%
Beds
/ FT
E 23
30
38
0
5
10
15
20
25
30
35
40
Average Number of System Supported / Service Desk FTE

2015 Hospital IT Service Desk Benchmarks
NIT Health | 90 John Street 7th Floor | New York, NY 10038 | (888) 858-5648 20
Average Number of Hospital FTE / Service Desk FTE
NIT Health also explored the total number of hospital FTEs as compared to the total number of service desk FTEs. Results show that on average there are 304 hospital FTEs per service desk FTE, which increases to 381 for the higher 25% of hospitals and decreases to 228 for the lower 25% of hospitals.
Low 25% Average High 25%
Hos
pita
l FTE
/ Se
rvic
e D
esk
FTE
228
304
381
0
50
100
150
200
250
300
350
400

2015 Hospital IT Service Desk Benchmarks
NIT Health | 90 John Street 7th Floor | New York, NY 10038 | (888) 858-5648 21
Training
As the final segment of the 2015 benchmarks, we compared how much hospitals spend on training
their service desk staff.
Average Number of Hospital FTE / Service Desk FTE

2015 Hospital IT Service Desk Benchmarks
NIT Health | 90 John Street 7th Floor | New York, NY 10038 | (888) 858-5648 22
Average Training Cost / Service Desk FTE
An analysis of the average cost of a service desk FTE shows that hospitals spend $3,361 annually on training per FTE. This figure increases to $4,202 annually for top spending 25% of hospitals and decreases to $2,521 annually for the bottom 25% of hospitals.
Low 25% Average High 25%
Annu
al T
rain
ing
Cost
$2,521
$3,361
$4,202
0
$1,000
$2,000
$3,000
$4,000
$5,000

2015 Hospital IT Service Desk Benchmarks
NIT Health | 90 John Street 7th Floor | New York, NY 10038 | (888) 858-5648 23
Conclusion
In this analysis, we compared the budget, service level, and staffing of some of the nation’s leading hospitals. Our goal
was to enable the IT executive to compare their performance to that of their peers, allowing them to assess their standing
in relation to efficiency and cost effectiveness.
Our team at NIT Health would be happy to answer any questions you may have on this report or on IT service desk
issues in general. Feel free to reach out to us at (888) 858-5648.
Average Training Cost / Service Desk FTE

2015 Hospital IT Service Desk Benchmarks
NIT Health | 90 John Street 7th Floor | New York, NY 10038 | (888) 858-5648 24
About NIT Health
NIT Health is a premier provider of management and technology advisory services for the healthcare industry, serving over 100 healthcare facilities. The company is the leading expert in hospital IT management, EMR implementation, compliance, and service desk management.
NIT’s Service Desk offers a single point of contact to manage communications and issue resolution from commencement to closure. Our sophisticated ticketing allows us to conduct in-depth analysis and address patterns that will reduce future problems. In addition, it allows us to funnel issues to the right person for quick resolution. Most importantly, our team is highly experienced in the hospital environment and maintains a high clinical awareness.
Learn how you can increase the performance of your service desk while lowering its cost.
Call NIT Health today to schedule your introduction – (888) 858-5648.