Embed Size (px)
Citation preview
This project has received funding fromthe European Union’s Horizon 2020research and innovation programmeunder grant agreement No. 690323
Horizon 2020 research and innovation programme
Project: No 690323 SMART-Plant
Full project title:
Scale-up of low-carbon footprint material recovery techniques
in existing wastewater treatment plants (SMART-Plant)
Deliverable D2.2
Construction and commissioning of the Mainstream
SMARTechs
Due date of deliverable: 31 May 2017
Actual submission date: 02 Aug 2017
Ref. Ares(2017)3876211 - 02/08/2017

Project: No 690323
SMART-Plant D1.1V1.0 –June 2016

Project: No 690323
SMART-Plant D2.2 Page 3
DOCUMENT INFORMATION:
Deliverable Number D2.2 Title:Construction and commissioning of the
main-stream SMARTechs
Work Package Number WP3 Title: Main-stream SMARTechnologies
Due date of deliverable Contractual M6 Actual M6
Version number 1.0
Format Pdf file
Creation date 7/7/2017
Version date 27/7/2017
Type R DEM DEC OTHER ETHICS
Dissemination Level PU Public CO Confidential
Rights Copyright “SMART-Plant Consortium”.
During the drafting process, access is generally limited to the SMART-Plant
Partners.
Responsible author Name: Isam Sabbah E-mail: [email protected]
Partner: AGRB Phone: +972 49504523
Other authors Name: Coos Wessels Partner: CirTech
Name: Juan Baeza Partner: UAB
Name: Ana Soarez Partner: CU
Name: Zivko Juznic Zonta Partner: UAB
Brief Description This document describes the progress of the Main stream technologies thathave been already installed at a WWTP. The technologies include; Primary(upstream) dynamic sieving and clean cellulose recovery, Secondarymainstream biogas recovery by polyfoam biofilter, Secondary mainstreamSCEPPHAR and Tertiary nutrient removal and recovery (respectivelySMARTech1, 2a, 2b and 3).
Keywords Construction; installation and integration; commissioning

Project: No 690323
SMART-Plant D2.2 Page 4
Version log Revision history
Rev. No. Issue Date Modified by Comments
Version 1 27/Jul/2017 Isam Sabbah and Juan BaezaFinal version by the responsible
beneficiary
Version 02/Aug/2017 Francesco FatoneMinor revision by coordinator before
submission

Project: No 690323
SMART-Plant D2.2 Page 5
TABLE OF CONTENTS
Document Information:............................................................................................................................ 3Table of Contents..................................................................................................................................... 5List of Tables............................................................................................................................................ 6List of Figures........................................................................................................................................... 7Executive Summary.................................................................................................................................. 8Abbreviations .......................................................................................................................................... 91. Introduction............................................................................................................................... 102. SMARTech1 - TASK 2.1. Primary (upstream) dynamic sieving and clean cellulose recovery ........... 112.1 Technical description............................................................................................................................ 11
2.2 List of the electromechanical equipment............................................................................................. 14
2.3 Practical instructions for the operation................................................................................................ 142.4 Drawings ‘as built’ ................................................................................................................................ 14
3. SMARTech2a – Task 2.2. Secondary mainstream biogas recovery by polyfoam biofilter ............... 173.1 Technical description............................................................................................................................ 17
3.2 List of the electromechanical equipment............................................................................................. 183.3 Practical instructions for the operation................................................................................................ 19
3.4 Drawings ‘as built’ ................................................................................................................................ 234. SMARTECH2b – Task 2.3. Secondary mainstream SCEPPHAR ....................................................... 244.1 Technical description............................................................................................................................ 24
4.2 List of the electromechanical equipment............................................................................................. 274.3 Practical instructions for the operation................................................................................................ 28
4.4 Drawings ‘as built’ ................................................................................................................................ 305. SMARTech3 - Task 2.4. Tertiary nutrient recovery by mesolite and nano ion exchange................. 325.1 Technical description............................................................................................................................ 325.2 List of the electromechanical equipment............................................................................................. 38
5.3 Practical instructions for the operation................................................................................................ 39
5.1 Drawings ‘as built’ ................................................................................................................................ 42

Project: No 690323
SMART-Plant D2.2 Page 6
LIST OF TABLES
Table 3.1 Quality of the inlet of Karmiel WWTP (annual average of year 2013-2015)..................................... 17Table 3.2 Design parameters. ........................................................................................................................... 17Table 3.3 List of operation units and electro-mechanical equipment. ............................................................. 19Table 3.4 Recommended parameters for control system. ............................................................................... 20Table 3.5 Explanation of the parameters.......................................................................................................... 20Table 3.6 Trouble shooting. .............................................................................................................................. 21Table 3.7 Laboratory measurements. ............................................................................................................... 22Table 4.1 State description of the sequential function chart (see Figure 4.2) ................................................. 25Table 4.2 Sample ports used for laboratory measurements. ........................................................................... 29Table 4.3 Timing of when a sample is taken during a working cycle. ............................................................... 29
Project: No 690323
SMART-Plant D2.2 Page 7
LIST OF FIGURES
Figure 1.1 Milestones of WP2. .......................................................................................................................... 10Figure 2.1 Schematic 3D view. .......................................................................................................................... 11Figure 2.2 Grit removal and its schematic 3D view........................................................................................... 12Figure 2.3 Rotary screens and its schematic 2D view. ...................................................................................... 12Figure 2.4 CellCap filter and its schematic 2D view. ......................................................................................... 13Figure 2.5 Drying tumbler (right); hammer mill and pelletizer (left). ............................................................... 13Figure 2.6 Indoor view of the pilot-plant. ......................................................................................................... 14Figure 2.7 Outdoor view of the pilot-plant. ...................................................................................................... 15Figure 2.8 Products of the pilot-plant. .............................................................................................................. 15Figure 2.9 The public opening day of the plant................................................................................................. 16Figure 3.1 Piping and instrumentation diagram (P&ID).................................................................................... 18Figure 3.2 Pilot-plant as build............................................................................................................................ 23Figure 4.1 Process diagram. .............................................................................................................................. 24Figure 4.2 Sequential Function Chart................................................................................................................ 26Figure 4.3 Piping and Instrumentation Diagram (P&ID). .................................................................................. 27Figure 4.4 Location of the SCEPPHAR pilot-plant inside the WWTP of Manresa.............................................. 30Figure 4.5 Pilot-plant full constructed and in operation................................................................................... 30Figure 4.6 Public opening event of the SMARTech2b in Manresa (Spain) the 22th of June 2017..................... 31Figure 5.1 Process diagram. .............................................................................................................................. 32Figure 5.2 Zeolites for ammonia removal produced by BYK............................................................................. 33Figure 5.3 Comparison of BYK zeolites through ammonia adsorption and regeneration tests using wastewater............................................................................................................................................................................ 34Figure 5.4 Comparison of BYK zeolites intense mixing tests to investigate media attrition and effectiveness ofthe granulation process..................................................................................................................................... 34Figure 5.5 Commercial media used for phosphorus removal Lewatit FO 36 (Lanxess, Germany) ................... 35Figure 5.6 Technical specifications of the IEX demonstration plant produced by Miontec (Germany). .......... 36Figure 5.7 Technologies used for recovery of ammonia from the regenerant as ammonium sulphate. ......... 37Figure 5.8 Process used for recovery of phosphorus from the regenerant as calcium phosphate. ................. 37Figure 5.9 Piping and Instrumentation Diagram (P&ID). .................................................................................. 41Figure 5.10 Drawings and assembled IEX pilot-plant at Cranfield Pilot-hall..................................................... 42Figure 5.11 IEX pilot-plant at Cranfield Pilot-hall in operation with wastewater. ............................................ 43

Project: No 690323
SMART-Plant D2.2 Page 8
EXECUTIVE SUMMARY
Deliverable 2.2 is part of WP2 which is related to mainstream SMARTechnologies. More specifically D2.2focuses in four SMARTechnologies that can be integrated in an existing wastewater treatment plant, loweringthe carbon footprint and harvesting resources from municipal wastewater.
SMARTech 1 focuses on harvesting cellulosic screenings from raw municipal wastewater, directly after thecourse screens at an existing plant. From the cellulosic screenings, the pure cellulose will be extracted, cleanedand disinfected to create a marketable product that will be used to produce bio-composites. Besidesharvesting the cellulosic screenings, the dynamic screens used in the mainstream, will remove BOD, causing areduced energy consumption for aeration and the growth of biological sludge. Important is the BOD:N ratio inthe filtrate of the dynamic screens to maintain full biological denitrification in the mainstream.
SMARTech2a is based on an advanced anaerobic technology (AAT) for treating heterogeneous wastewater.The AAT is a “bio-stabilized”, polymer-based matrix impregnated with unique anaerobic microorganisms. Thematrix has large surface area and high capacity that enables the loading of higher number of microorganismscompared to incumbent wastewater treatment methods. In addition, the matrix provides physical protectionfor the microorganisms. The AAT technology increases process stability, decreases energy consumption,lowers operational costs and enhances the efficiency of the anaerobic process for methane production. Thebio-stabilizers are prepared in special, patented, modular units and inserted into a proprietary modified highrate up-flow anaerobic system (HRUA). This hybrid immobilized-HRUA exhibits better performancecharacteristics and lower cost, without the need for the typical expensive three–phase separator.
SMARTech 2b develops a new configuration for wastewater treatment, based on two sequenced batchreactors, one heterotrophic and the other autotrophic. This new configuration allows biological removal oforganic matter, nitrogen and phosphorus with low energy requirements and with recovery of bioplastics (poly-hydroxyalkanoates) and fertilizers (struvite). The aerobic autotrophic reactor nitrifies ammonium to nitrite,avoiding the last step of nitrification, saving oxygen consumption. The heterotrophic reactor performs P-removal with anaerobic/anoxic/aerobic phases. Nitrite produced in the autotrophic reactor is removed duringthe anoxic phase of the heterotrophic reactor and allows simultaneous P uptake. Complete N and P removalis expected, with lower emissions of green-house gases. Sludge extraction during the anaerobic phase allowsthe production of biomass with high content of bioplastics. A P-recovery system fed with wastewater extractedafter the anaerobic phase and producing struvite is also integrated in our configuration.
SMARTech 3 develops a configuration to recover nutrients from wastewater. After removal of solids, ammonia(N) is removed by an ion exchange process, using MesoLite media. Phosphorus is removed with a hybrid ionexchange media (HAIX). By regenerating ion exchange media, both nitrogen and phosphorus are recovered;nitrogen as Ammonium Sulfate and phosphorus as Calcium Phosphate. The installation is installed at CranfieldUniversity campus, which includes offices, student accommodation halls, 2 hotels as well as street and airfieldrun-off.
SMART-Plant has received funding from the European Union’s Horizon 2020 research and innovationprogramme under grant agreement No 690323.

Project: No 690323
SMART-Plant D2.2 Page 9
ABBREVIATIONS
DPAO Denitrifying Polyphosphate-Accumulating Organisms
AOB Ammonia Oxidizing Bacteria
SBR Sequenced Batch Reactor
PHA PolyHydroxy Alkanoate
SCHEPPHAR Short-Cut Enhanced Phosphorus and PHA Recovery
SCADA Supervisory Control and Data Acquisition
UAB Universitat Autonoma de Barcelona
WWTP Waste Water Treatment Plant
P&ID Piping and Instrumentation Diagram
AAT Advanced Anaerobic Technology
TSS Total Suspended Solids
UASB Up flow Anaerobic Sludge Blanket
PVC PolyVinyl Chloride
COD Chemical Oxygen Demand
FOG Fat, Oil and Grease
TKN Total Kjeldahl Nitrogen
XRFS X-Ray Fluorescence Spectroscopy
HFO Hydro Ferric Oxide
EBCT Empty Bed Contact Time
HFMC Hollow Fibre Membrane Contactor

Project: No 690323
SMART-Plant D2.2 Page 10
1. INTRODUCTION
Deliverable 2.2 is part of WP2. The main objective of WP2 is to test and validate four mainstreamSMARTechnologies that can be applied individually or combined to innovate the primary, secondary or tertiarywastewater treatment process, by recovering clean and marketable cellulose, biogas, PHA, phosphorus andnitrogen. The aim is to reduce the energy demand with 50% and the carbon footprint with more than 30%.
WP2 consists of four tasks:
• Task 2.1 test and validate mainstream SMARTech 1 with a duration of 40 months• Task 2.2 test and validate mainstream SMARTech 2a with a duration of 40 months• Task 2.3 test and validate mainstream SMARTech 2b with a duration of 40 months• Task 2.4 test and validate mainstream SMARTech 3 duration of 40 month
Figure 1.1 Milestones of WP2.
The present report is the second of these series of deliverables. D2.2 presents in a photographical and processprogress way the construction and commissioning of the four mainstream SMARTechs. The introductionsection (Chapter 1) presents the objectives of this report and its structure. The construction andcommissioning of the four main-stream SMARTechs is presented in Chapters 2, 3, 4 and 5 for SMARTech 1,SMARTech 2a, SMARTech 2b and SMARTech 3, respectively.
Project: No 690323
SMART-Plant D2.2 Page 11
2. SMARTECH1 - TASK 2.1. PRIMARY (UPSTREAM) DYNAMIC SIEVING AND CLEAN
CELLULOSE RECOVERY
2.1 Technical description
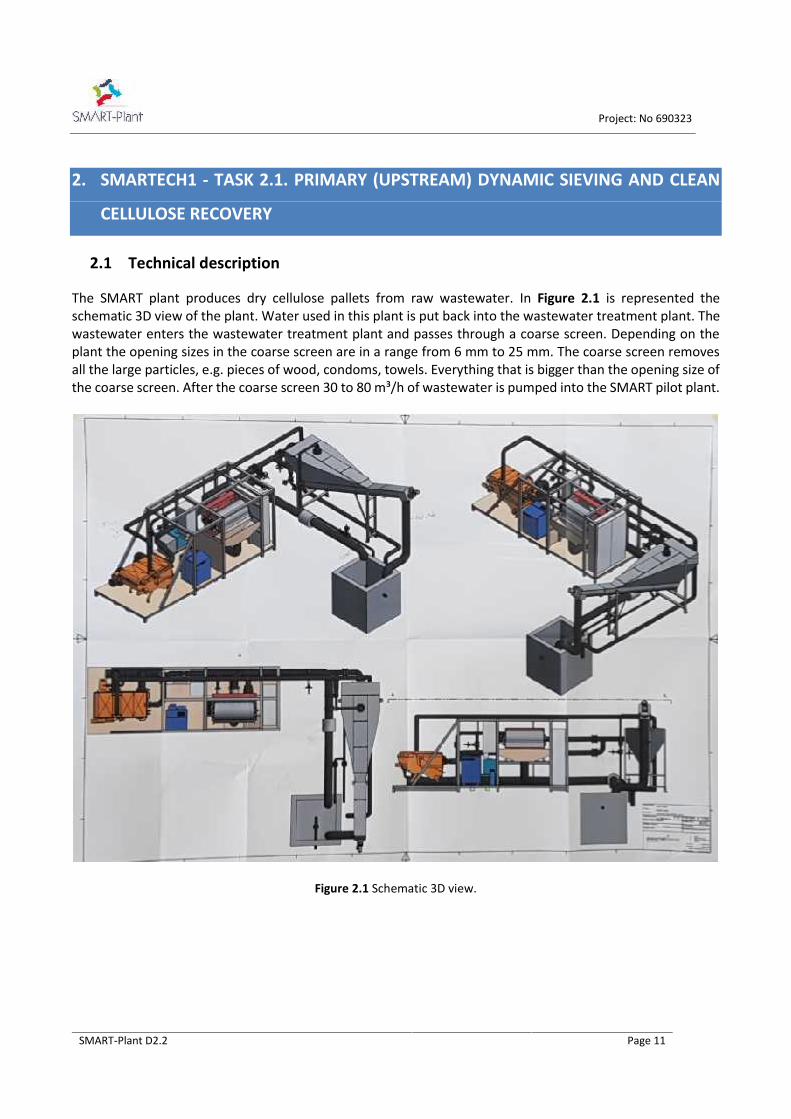
The SMART plant produces dry cellulose pallets from raw wastewater. In Figure 2.1 is represented theschematic 3D view of the plant. Water used in this plant is put back into the wastewater treatment plant. Thewastewater enters the wastewater treatment plant and passes through a coarse screen. Depending on theplant the opening sizes in the coarse screen are in a range from 6 mm to 25 mm. The coarse screen removesall the large particles, e.g. pieces of wood, condoms, towels. Everything that is bigger than the opening size ofthe coarse screen. After the coarse screen 30 to 80 m³/h of wastewater is pumped into the SMART pilot plant.
Figure 2.1 Schematic 3D view.
Project: No 690323
SMART-Plant D2.2 Page 12
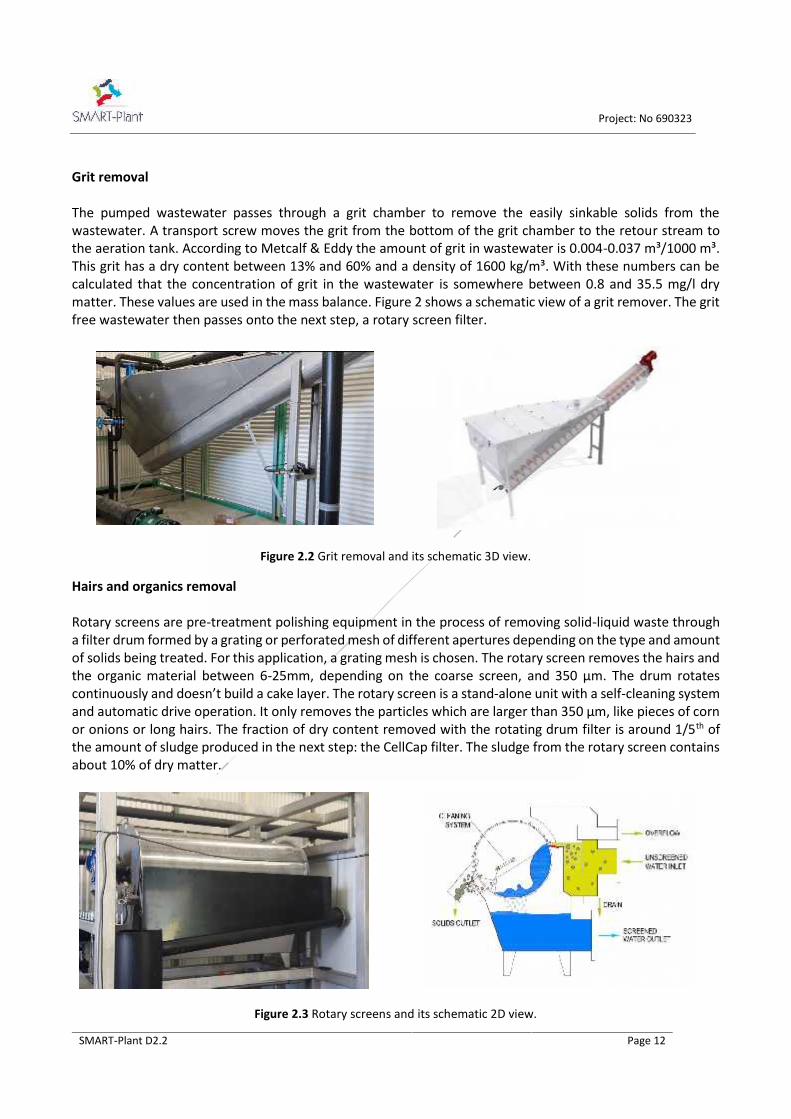
Grit removal
The pumped wastewater passes through a grit chamber to remove the easily sinkable solids from thewastewater. A transport screw moves the grit from the bottom of the grit chamber to the retour stream tothe aeration tank. According to Metcalf & Eddy the amount of grit in wastewater is 0.004-0.037 m³/1000 m³.This grit has a dry content between 13% and 60% and a density of 1600 kg/m³. With these numbers can becalculated that the concentration of grit in the wastewater is somewhere between 0.8 and 35.5 mg/l drymatter. These values are used in the mass balance. Figure 2 shows a schematic view of a grit remover. The gritfree wastewater then passes onto the next step, a rotary screen filter.
Figure 2.2 Grit removal and its schematic 3D view.
Hairs and organics removal
Rotary screens are pre-treatment polishing equipment in the process of removing solid-liquid waste througha filter drum formed by a grating or perforated mesh of different apertures depending on the type and amountof solids being treated. For this application, a grating mesh is chosen. The rotary screen removes the hairs andthe organic material between 6-25mm, depending on the coarse screen, and 350 µm. The drum rotatescontinuously and doesn’t build a cake layer. The rotary screen is a stand-alone unit with a self-cleaning systemand automatic drive operation. It only removes the particles which are larger than 350 µm, like pieces of cornor onions or long hairs. The fraction of dry content removed with the rotating drum filter is around 1/5th ofthe amount of sludge produced in the next step: the CellCap filter. The sludge from the rotary screen containsabout 10% of dry matter.
Figure 2.3 Rotary screens and its schematic 2D view.

Project: No 690323
SMART-Plant D2.2 Page 13
Harvesting the cellulose
The CellCap filter is a rotating belt filter with a filter mesh of 350 µm. This filter can be replaced with a smalleror larger pore size. The TSS in the wastewater creates a pre-coat on the filter mesh which allows the filter toremove particles smaller than the mesh size of the filter. With a filter mesh of 350 µm and a pre-coat particlesup to 90 µm can be removed with a CellCap filter. The speed of the belt can be adjusted to increase or decreasethe amount of pre-coat build on top of the belt. With a lower flux (m³/h·m²) a higher removal could beachieved. The belt speed is controlled automatically. The parameter used by the controller is the level insidethe CellCap filter. The sieved fraction is removed with an air knife and blown onto a transport screw. Thesieved fraction has a dry matter of 4-8%.
Figure 2.4 CellCap filter and its schematic 2D view.
Drying zone
The sieved fraction from the Cell Cap filter enters the drying process. The water is discharged back into theflow to the aeration tank together with the grit and the sludge from the rotary screen. The sieved fraction ispumped to a dewatering press, where the sieved fraction is dewatered to ±40% dm. Afterwards the solids aretransported to a tumbling dryer, which is operated batch wise. The cellulose is dried at high temperatures tomake sure the cellulose is safe according to the EPA class A. To make sure the product is conform this class,every big bag that leaves the facility is tested. After the drying zone the material can be hammered andpelletized depending on the requirements for the follow-up treatment.
Figure 2.5 Drying tumbler (right); hammer mill and pelletizer (left).
Project: No 690323
SMART-Plant D2.2 Page 14
2.2 List of the electromechanical equipment
The main components of the SMARTech1 are: (1) grid removal, (2) rotary drum screen, (3) fine sieve, (4)dewatering machine, (5) drying tumbler, (6) hammer mill, and (7) pelletizer.
2.3 Practical instructions for the operation
The SMARTech1 is a pilot plant which can be bypassed if necessary. The installation is fully automaticallycontrolled with its own control panel, a number of emergency alarms can be sent to external users and processparameters can be adjusted. The following operating modes are adjustable on the control panel of the SMARTplant installation: (1) automatic operation, where the control panel switches on and off and controls thedevice according to the specified conditions; (2) out of function, the devices are not in use; (3) hand operation,the device remains outside of the auto control installation and a device is switched on to a fixed value. Theseselection switches can be used for test and fault search purposes.
Flow
The influent is pumped from the treatment plant to the SMART plant. Entered here it comes first through thesand trap, then the water drops freely to the drum screen, after which the water flows freely into the finesieve. The filtrate from the fine sieve flows to the drain well. The overflows of the sand trap and drum screenare also discharged into the drain well. The sieved material of the fine sieve goes through a transport screw toa dewatering press. From the dewatering press the material falls through a hammer mill and involves a dryerand pelletizer machine.
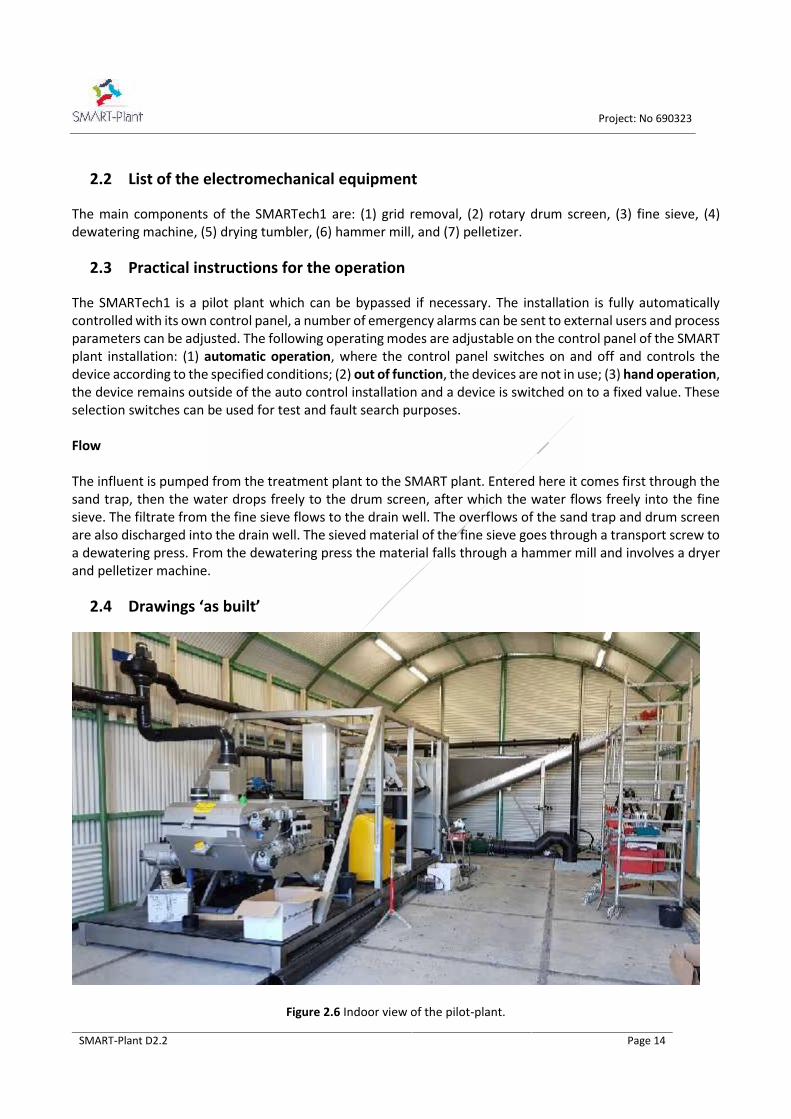
2.4 Drawings ‘as built’
Figure 2.6 Indoor view of the pilot-plant.
Project: No 690323
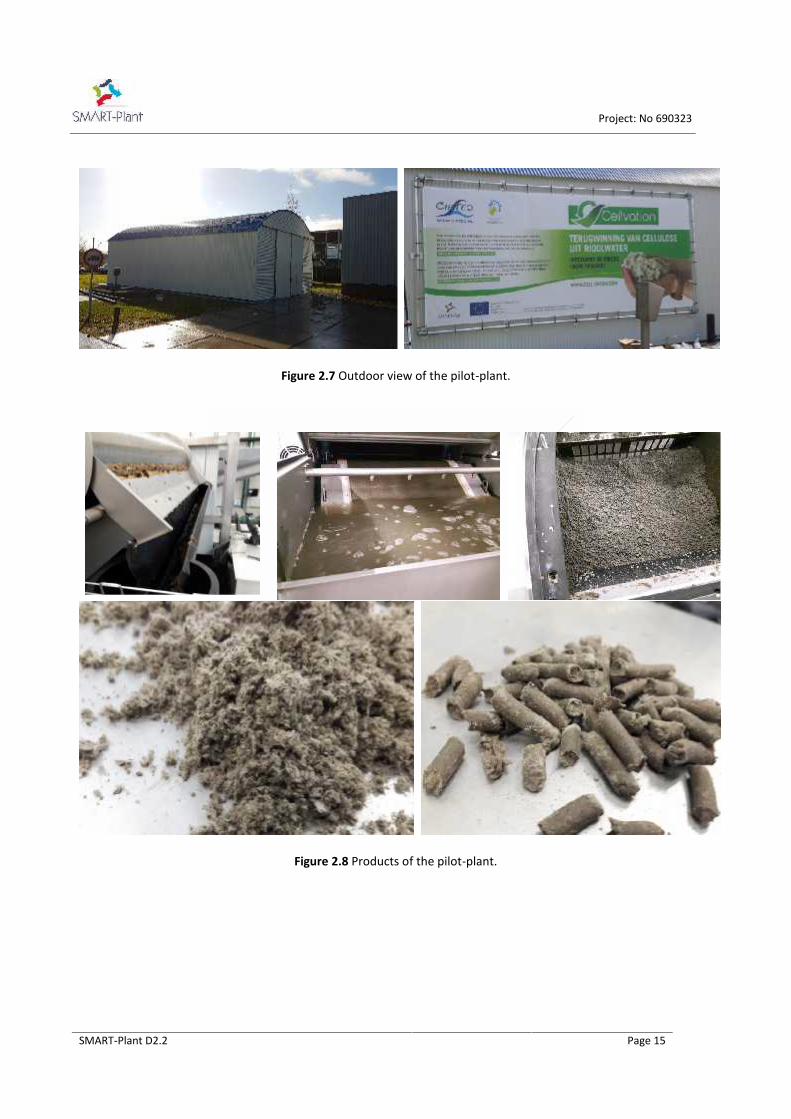
SMART-Plant D2.2 Page 15
Figure 2.7 Outdoor view of the pilot-plant.
Figure 2.8 Products of the pilot-plant.

Project: No 690323
SMART-Plant D2.2 Page 16
Figure 2.9 The public opening day of the plant.
Project: No 690323
SMART-Plant D2.2 Page 17
3. SMARTECH2A – TASK 2.2. SECONDARY MAINSTREAM BIOGAS RECOVERY BY
POLYFOAM BIOFILTER
3.1 Technical description
AgRobics has developed an advanced anaerobic technology (AAT) for treating heterogeneous wastewater. TheAAT is a “bio-stabilized”, polymer-based matrix impregnated with unique anaerobic microorganisms. Thematrix has large surface area and high capacity that enables the loading of higher number of microorganismscompared to incumbent wastewater treatment methods. In addition, the matrix provides physical protectionfor the microorganisms.
Anaerobic wastewater treatment is an indispensable part of many, high organic load, industrial wastewatertreatment plants (WWTP). Because of its inherent ability to treat high strength organic waste with high organicloading rate. Interestingly though, high rate anaerobic treatment is considered an unstable process withnumerous occasions where the microbial biomass or sludge, is washed out or destroyed by high solid content(TSS) and wastewater toxicity, respectively. This lack of stability does not hinder high rate anaerobic reactorssuch as the UASB (Up flow Anaerobic Sludge Blanket) from being installed at thousands of industrial and agro-industrial WWTPs. It does, however, deter municipal clients from adopting this technology. Usually run bymunicipalities or governmental bodies, municipal WWTPs are worried that, despite the inherent advantagesof high rate anaerobic treatment, their characteristic instabilities can cause downtime and operationalproblems. AgRobics’ technology solves these.
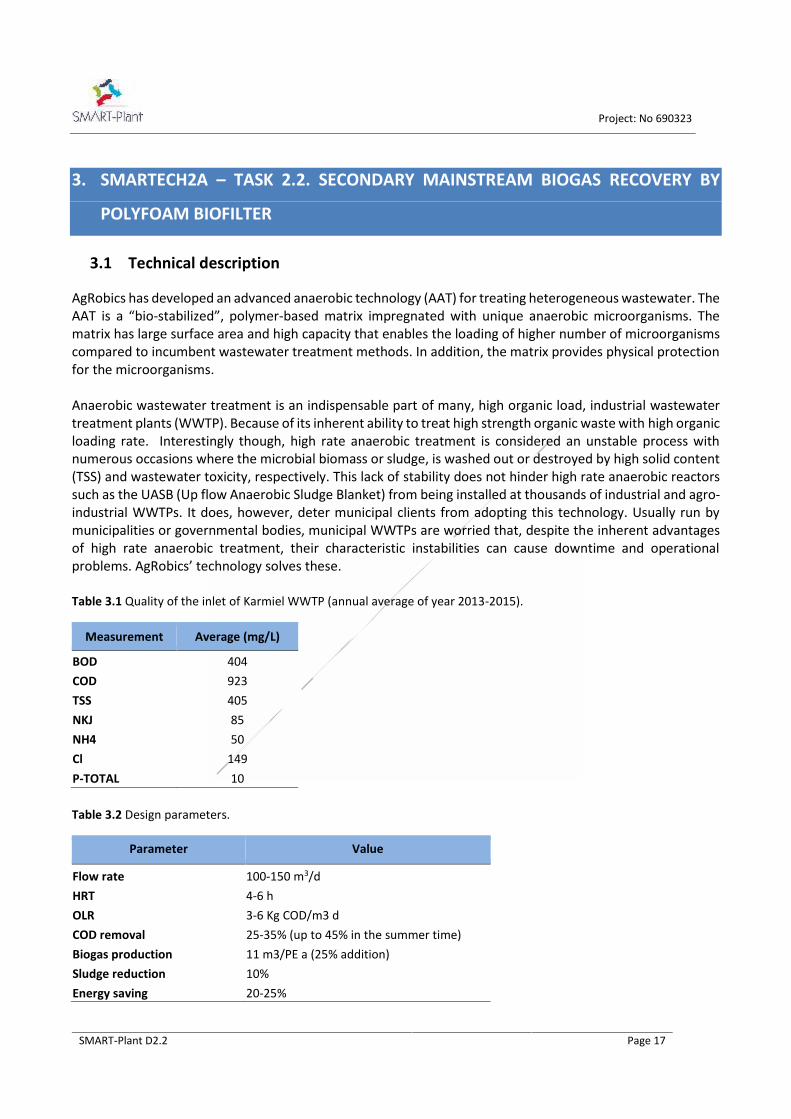
Table 3.1 Quality of the inlet of Karmiel WWTP (annual average of year 2013-2015).
Measurement Average (mg/L)
BOD 404COD 923TSS 405NKJ 85NH4 50Cl 149P-TOTAL 10
Table 3.2 Design parameters.
Parameter Value
Flow rate 100-150 m3/dHRT 4-6 hOLR 3-6 Kg COD/m3 dCOD removal 25-35% (up to 45% in the summer time)Biogas production 11 m3/PE a (25% addition)Sludge reduction 10%Energy saving 20-25%

Project: No 690323
SMART-Plant D2.2 Page 18
AgRobics’ technology increases process stability, decreases energy consumption, lowers operational costs andenhances the efficiency of the anaerobic process for methane production. The bio-stabilizers are prepared inspecial, patented, modular units and inserted into a proprietary modified high rate up-flow anaerobic system.This exhibits better performance characteristics and lower cost, without the need for the typical expensivethree–phase separator. The AAT can be used for either new reactors or for upgrading existing reactors, tanksor settlers to anaerobic reactors.
The design of our new demo-scale system is based on our previous pilot-scale pre-treating municipalwastewater, in collaboration with Mekorot - the Israeli National Water Company. Implementation of thisrobust, affordable, and environmentally sound process guarantees sustainable wastewater treatmentadhering to existing and future effluent quality requirements and energy-saving approaches.
The design of the system was conducted based on the following (Table 3.1) of the inlet characteristics of thewastewater before primary sedimentation where the design parameters as describe in Table 3.2.
3.2 List of the electromechanical equipment
The electromechanical equipment is presented in Figure 2.1. In addition, Table 2.3 summarizes the list ofoperation units and specification of electro-mechanical equipment and sensors/meters.
Figure 3.1 Piping and instrumentation diagram (P&ID).
Project: No 690323
SMART-Plant D2.2 Page 19
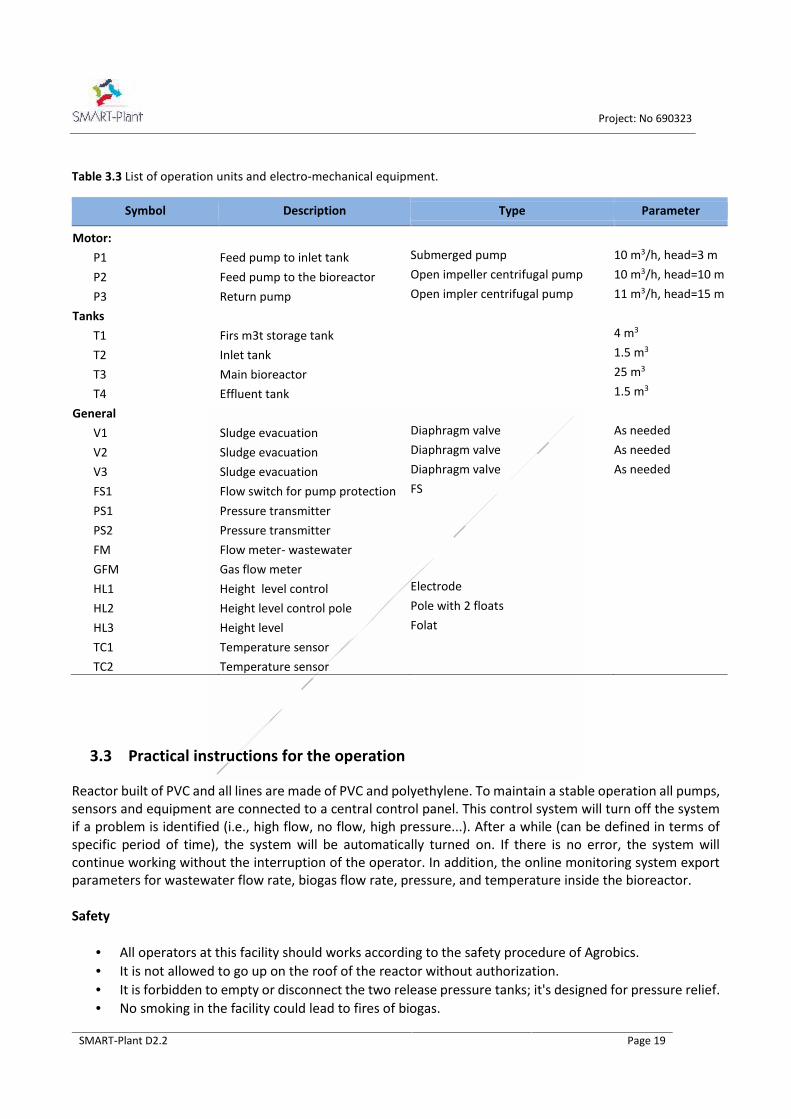
Table 3.3 List of operation units and electro-mechanical equipment.
Symbol Description Type Parameter
Motor:P1 Feed pump to inlet tank Submerged pump 10 m3/h, head=3 m
P2 Feed pump to the bioreactor Open impeller centrifugal pump 10 m3/h, head=10 m
P3 Return pump Open impler centrifugal pump 11 m3/h, head=15 m
TanksT1 Firs m3t storage tank 4 m3
T2 Inlet tank 1.5 m3
T3 Main bioreactor 25 m3
T4 Effluent tank 1.5 m3
GeneralV1 Sludge evacuation Diaphragm valve As neededV2 Sludge evacuation Diaphragm valve As neededV3 Sludge evacuation Diaphragm valve As neededFS1 Flow switch for pump protection FS
PS1 Pressure transmitterPS2 Pressure transmitterFM Flow meter- wastewaterGFM Gas flow meterHL1 Height level control ElectrodeHL2 Height level control pole Pole with 2 floatsHL3 Height level FolatTC1 Temperature sensorTC2 Temperature sensor
3.3 Practical instructions for the operation
Reactor built of PVC and all lines are made of PVC and polyethylene. To maintain a stable operation all pumps,sensors and equipment are connected to a central control panel. This control system will turn off the systemif a problem is identified (i.e., high flow, no flow, high pressure...). After a while (can be defined in terms ofspecific period of time), the system will be automatically turned on. If there is no error, the system willcontinue working without the interruption of the operator. In addition, the online monitoring system exportparameters for wastewater flow rate, biogas flow rate, pressure, and temperature inside the bioreactor.
Safety
All operators at this facility should works according to the safety procedure of Agrobics. It is not allowed to go up on the roof of the reactor without authorization. It is forbidden to empty or disconnect the two release pressure tanks; it's designed for pressure relief. No smoking in the facility could lead to fires of biogas.

Project: No 690323
SMART-Plant D2.2 Page 20
It's not allowed to touch any working equipment (i.e., pumps during the operation)
Environmental protection
All personnel must review their operations with reference to the requirements as noted in AgrobicsEnvironmental Quality Master Specification.
Working procedure
For starting the operation of the SMARTech2a, first it should be insured that inlet wastewater isprovided to the feeding tank (T1) and the submerged pump (P1) is on.
Verify all manual valves are opened, before and after feeding pump (P1). Submerged feed pump has a float inside the tank, if there are no sewage it will be turned off
automatically. Submerged feed pump is connected to a level of feed tank, if it’s full, the pump stops, otherwise, it
works. To operate the plant at an automat mode, verify that all pumps and valves are in automatic mode. The sludge and treated wastewater will be evacuated from Tank 4 by pump 3. This pump connected
to low and high level, it’s on at high level and off at low level. These two levels are controlled byfloating switch inside the tank.
To change the flow of incoming sewage, change the frequency of pump until getting the required flow. Amount and frequency of sludge removal from the system is decided according to tests of TSS and
visual inspection of the outlet of the system.
Filling parameters of control system
In order to operate the plant, parameters and values in the following table are required. These parametersvariable are essential for continuous working of the plant without any stop unless there is real problem andnot false alarm.
Table 3.4 Recommended parameters for control system.
ValueParameterValueParameterValueParameter
600timer interval v1minutes9000water flow high set point0Pressure set point for PS1
600timer v1 on state3000water flow low set point240*Time delay in seconds to stop P1 forno flow FS1
600timer interval v2minutes100gas flow high set point20Stop P1 time period in minutes
1timer v2 on state0gas flow low set point9Number of fails to stop P1 after flowor pressure fail
1timer interval v3minutes10time (seconds) delay for full
tank alarm600Time (minutes) period for continuefails
1timer v3 on state250PS2 over pressure set point mbar* This parameter is recommended to be higher than 240 sec, in order not to stop system in false alarm of flow switch. False alarm could occur whendust or big particles get into the pump. Then the flow switch couldn't identify flow. So if we allow for high delay, the false alarms will be deleted. Thisvalue should be at least 1min, in order to open valve at least for one minute.
Table 3.5 Explanation of the parameters.
Project: No 690323
SMART-Plant D2.2 Page 21
PurposeParametersIf pressure less Pump2 will not try to turn onPressure set point for PS1Delay time to stop P1 after FS alarmTime delay in seconds to stop P1 for no flow FS1Delay time for P2 to turn onStop P2 time period in minutesNumber of allowed failsNumber of fails to stop P2 after flow or pressure failPeriod time for number of fails.Time (minutes) period for continue failsIf pressure on reactor above this value system stoppedPS2 over pressure set point mbarHigh value of incoming flow, no effect to controlsystem, just marked redWater flow high set point
low value of incoming flow, no effect to control system,just marked redWater flow low set point
High value of gas flow, no effect to control system, justmarked redGas flow high set point
low value of gas flow, no effect to control system, justmarked redGas flow low set point
Delay time after high level sensor alertTime (seconds) delay for full tank alarmOff time for valves 1,2,3timer interval v1 minutes or v2 or v3On time for valves 1,2,3timer v1 on state on or v2 or v3
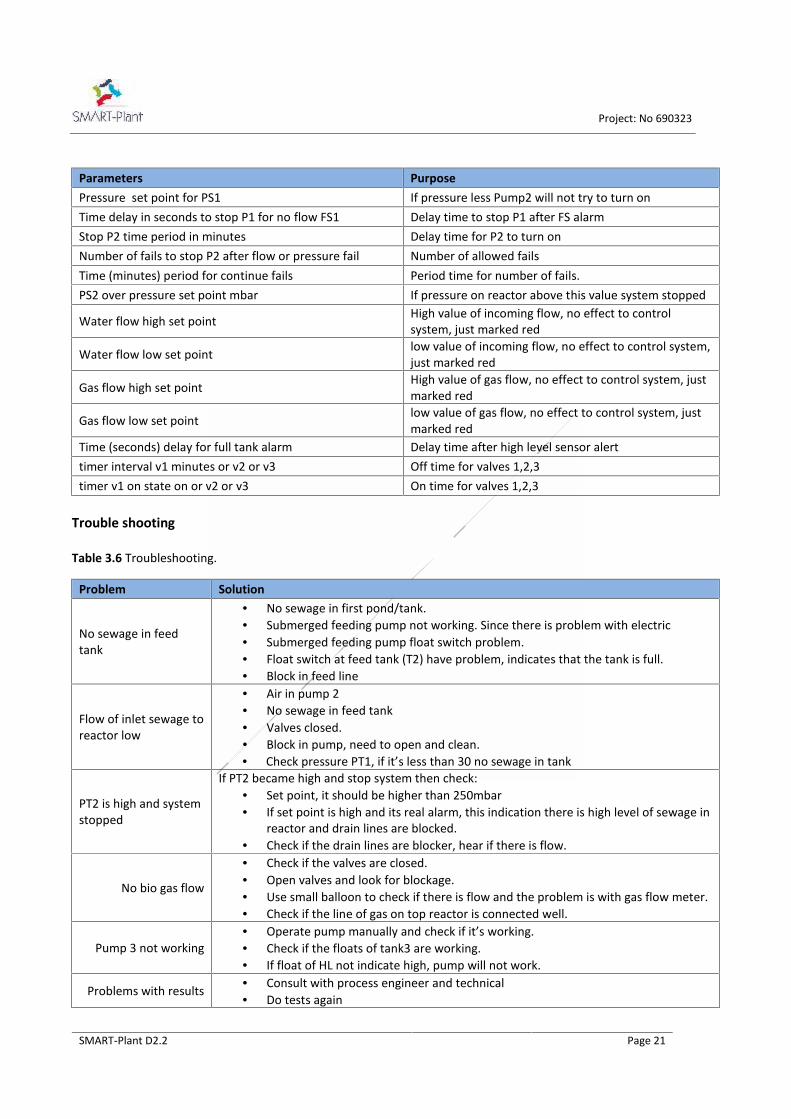
Trouble shooting
Table 3.6 Troubleshooting.
SolutionProblem No sewage in first pond/tank. Submerged feeding pump not working. Since there is problem with electric Submerged feeding pump float switch problem. Float switch at feed tank (T2) have problem, indicates that the tank is full. Block in feed line
No sewage in feedtank
Air in pump 2 No sewage in feed tank Valves closed. Block in pump, need to open and clean. Check pressure PT1, if it’s less than 30 no sewage in tank
Flow of inlet sewage toreactor low
If PT2 became high and stop system then check: Set point, it should be higher than 250mbar If set point is high and its real alarm, this indication there is high level of sewage in
reactor and drain lines are blocked. Check if the drain lines are blocker, hear if there is flow.
PT2 is high and systemstopped
Check if the valves are closed. Open valves and look for blockage. Use small balloon to check if there is flow and the problem is with gas flow meter. Check if the line of gas on top reactor is connected well.
No bio gas flow
Operate pump manually and check if it’s working. Check if the floats of tank3 are working. If float of HL not indicate high, pump will not work.
Pump 3 not working
Consult with process engineer and technical Do tests again
Problems with results

Project: No 690323
SMART-Plant D2.2 Page 22
Laboratory measurements
Samples will be collected twice a week by automatic fraction collector. Two fraction collectors will takesamples from the inlet and outlet of the system.
Table 3.7 Laboratory measurements.
No. Test Frequency Sampling port Parameter1 pH 1/ week Inlet of reactor pH2 pH 1/ week outlet of reactor pH3 CODt 1/ week inlet of reactor mg/L4 CODt 1/ week outlet of reactor mg/L5 CODs 1/ week inlet of reactor mg/L6 CODs 1/ week outlet of reactor mg/L7 TSS 1/ week inlet of reactor mg/L7 TSS 1/ week outlet of reactor mg/L8 Ammonia 1/ week inlet of reactor mg/L9 Ammonia 1/ week outlet of reactor mg/L10 FOG+TKN 1/ 2 weeks inlet of reactor mg/L11 FOG+TKN 1/ 2 weeks outlet of reactor mg/L12 TS 1/ week bottom valve mg/L13 Methane 1/ week Out of GFM %14 Hydrogen sulfide 1/ week Out of GFM ppm15 Total Sulfide 1/ week inlet of reactor mg/L16 Total Sulfide 1/ week outlet of reactor mg/L17 Total Phosphate 1/ week inlet of reactor mg/L18 Total Phosphate 1/ week outlet of reactor mg/L

Project: No 690323
SMART-Plant D2.2 Page 23
3.4 Drawings ‘as built’
Figure 3.2 Pilot-plant as build.
Project: No 690323
SMART-Plant D2.2 Page 24
4. SMARTECH2B – TASK 2.3. SECONDARY MAINSTREAM SCEPPHAR
4.1 Technical description
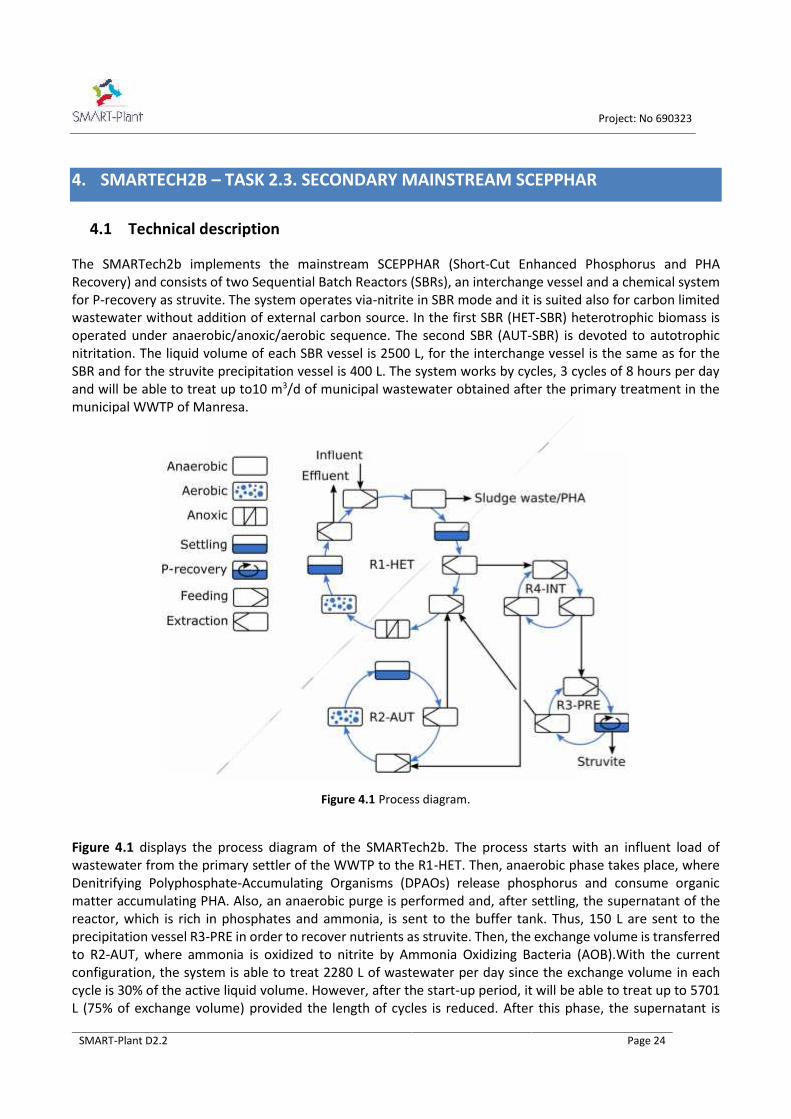
The SMARTech2b implements the mainstream SCEPPHAR (Short-Cut Enhanced Phosphorus and PHARecovery) and consists of two Sequential Batch Reactors (SBRs), an interchange vessel and a chemical systemfor P-recovery as struvite. The system operates via-nitrite in SBR mode and it is suited also for carbon limitedwastewater without addition of external carbon source. In the first SBR (HET-SBR) heterotrophic biomass isoperated under anaerobic/anoxic/aerobic sequence. The second SBR (AUT-SBR) is devoted to autotrophicnitritation. The liquid volume of each SBR vessel is 2500 L, for the interchange vessel is the same as for theSBR and for the struvite precipitation vessel is 400 L. The system works by cycles, 3 cycles of 8 hours per dayand will be able to treat up to10 m3/d of municipal wastewater obtained after the primary treatment in themunicipal WWTP of Manresa.
Figure 4.1 Process diagram.
Figure 4.1 displays the process diagram of the SMARTech2b. The process starts with an influent load ofwastewater from the primary settler of the WWTP to the R1-HET. Then, anaerobic phase takes place, whereDenitrifying Polyphosphate-Accumulating Organisms (DPAOs) release phosphorus and consume organicmatter accumulating PHA. Also, an anaerobic purge is performed and, after settling, the supernatant of thereactor, which is rich in phosphates and ammonia, is sent to the buffer tank. Thus, 150 L are sent to theprecipitation vessel R3-PRE in order to recover nutrients as struvite. Then, the exchange volume is transferredto R2-AUT, where ammonia is oxidized to nitrite by Ammonia Oxidizing Bacteria (AOB).With the currentconfiguration, the system is able to treat 2280 L of wastewater per day since the exchange volume in eachcycle is 30% of the active liquid volume. However, after the start-up period, it will be able to treat up to 5701L (75% of exchange volume) provided the length of cycles is reduced. After this phase, the supernatant is

Project: No 690323
SMART-Plant D2.2 Page 25
returned to R1-HET and anoxic step occurs. During this period, DPAO take up phosphorus anoxically usingnitrite as electron acceptor. Finally, an aerobic phase is required to take up the rest of phosphorus. Aftersettling, part of the supernatant is discharged to the effluent and the cycle starts again. The completesequence of this pilot-plant is shown in Table 4.1.
The main objectives of the pilot-plant implemented as a mainstream treatment for municipal wastewater areto: (1) treat 10 m3/d of wastewater after primary treatment; (2) achieve an effluent with P < 1 mg/L and TN <10 mg/L without addition of external carbon source nor FeCl3 for P precipitation; (3) remove N via nitrite witha removal up to 90%; (4) recover around 50% of P in the influent as struvite; (5) produce a waste sludge withPHA content up to 30% without addition of external carbon source.
Table 4.1 State description of the sequential function chart (see Figure 4.2)
R1-HETState Description Duration (min) Time (min)A1f1/A1f2 Feeding 20.8 20.8A1ana Anaerobic phase 100.0 120.8A1p Sludge purge 3.3 124.1A1s1 Sedimentation phase 40.0 164.1A1e1 Effluent to R4-INT 20.8 185.0A1f3/A1f4 Feeding from R2-AUT 20.8 205.8A1ano Anoxic phase 120.0 325.8A1aer Aerobic phase 90.0 415.8A1s2 Sedimentation phase 40.0 455.8A1e3 Effluent to discharge 20.8 476.6A1idle Wait to start the cycle again 3.4 480.0
R2-AUTState Description Duration (min) Time (min)A2aer1 Aeration phase 130.0 130.0A2s1 Sedimentation phase 45.0 175.0A2idle Wait R1-HET to finish A1e1 10.0 185.0A2e Effluent to R1-HET 20.8 205.8A2f Feeding from R4-INT 20.8 226.6A2aer2/A2s3 Aeration (NH4 control) and sedimentation phase 253.4 480.0
R3-PREState Description Duration (min) Time (min)A3recP Precipitation phase of struvite 185.0 185.0A3s Sedimentation phase 10.0 195.0A3e Effluent to R1-HET 2.4 197.4A3idle Wait R1-HET to finish A1e1 8.4 205.8A3f Feeding from R4-INT 20.8 226.6A3dMg Addition of Mg 1.0 227.6A3recP Precipitation phase of struvite 273.2 480.0

Project: No 690323
SMART-Plant D2.2 Page 26
Figure 4.2 Sequential Function Chart.

Project: No 690323
SMART-Plant D2.2 Page 27
4.2 List of the electromechanical equipment
The piping and instrumentation diagram is represented in Figure 4.3. There are 5 centrifugal pumps (P1, P2,P3, P4 and P6), one piston pump for sludge purge (P5) and one dosing pump for Mg2+ addition (P7). There are3 mixers (M1, M2 and M3) for the bio-chemical reaction vessels.
The vessel R1-HET has the following sensors: level (LT-04), dissolved oxygen and temperature (OD-T-01), pH(pH-02) and oxidation reduction potential (ORP-03). The vessel R2-AUT has the following sensors: level (LT-06), dissolved oxygen and temperature (OD-T-07), pH (pH-08), oxidation reduction potential (ORP-09) and theammonia/ nitrate (NH4-NO3-T-10). The interchange vessel R4-INT has a level sensor (LT-05) and the struviteprecipitation vessel R3-PRE has a pH sensor (pH-11). Aeration flow of the reaction vessels is measured withingas rotameters (GR01, GR02 and GR03).
The gas electric valve GEV01 is regulated by the pH set point in R3-PRE, while the gas proportional valvesGPV01 and GPV02 are regulated by the DO set point values of R1-HET and R2-AUT, respectively. Samples forlaboratory analysis can be taken from port MV04, MV21, MV16 and MV18.
Figure 4.3 Piping and Instrumentation Diagram (P&ID).

Project: No 690323
SMART-Plant D2.2 Page 28
4.3 Practical instructions for the operation
The operation of the pilot-plant is fully automatic thanks to the Supervisory Control and Data Acquisition(SCADA) system installed within the electrical panel. All the parameters (phase duration, controller set-points,minimum and maximum level height of water, etc.) can be changed manually if needed. The SCADA has aninternet connection and thus pilot-plant can be monitored and operated remotely. There are several alarmsthat stop or partially stop the pilot-plant operation in case of malfunctioning. The SCADA automatically restartsfrom the least state of operation when electrical current is recovered after for example an overvoltage event.
The operator of the WWTP of Manresa performs at least two visual inspections per day during 24 hours. Incase of malfunctioning the operator can contact UAB responsible thanks to a contact list that is clearly visibleat the entrance of the pilot-plant. The equipment manuals, the electrical diagram and the P&ID can be foundon site. All the equipment (vessels, pumps, valves, etc.) are provided with a label with an identification codethat is found in the P&ID.
Plant start-up
The inoculum used for both biological reactors (R1-HET and R2-AUT) is obtained from the full scale WWTP ofManresa. The procedure for inoculation consists of placing the feeding flexible tube of R1-HET into the pointwhere the full scale biological reactor receives the recirculation stream (i.e., where reactor is most enrichedin sludge). Then, R1-HET is filled with this sewage. When it is full, the discharge pipe of R1-HET is placed intoR2-AUT and the process continues until both reactors reach the required level of 1.25 m (i.e., 2534 L). Finally,feeding and discharge pipes are returned to the primary settler.
UAB personnel are trained to start-up the plant operation. There are specific initial conditions that should beset-up manually in order to start-up the pilot-plant correctly: (1) inflow pipe and pump P1 should be full ofliquid; (2) R1-HET, R2-AUT and R3-PRE liquid level should be at 100% of its operation regime (level height of1.25 m), while R4-INT should be empty enough in order to receive the feeding from R1-HET; (3) all the pumps,mixers and air blowers must be turned off; (4) the valves that allow to modify the interchange liquid volumeshould be checked (MV03, MV06, MV13 and MV14).
Operational issues
Plant stop. The SCADA has two different routines that allow to stop the plant “cycle 3”and “cycle 4”. The firststops the system and deactivates the controllers but let mixing and aeration active, while the second stopseverything.
pH sensors. Must be calibrated once a week with buffer solutions in the working range pH (7-10).
Ammonium/nitrate sensor. Must be calibrated once a week by taking a sample from R2-AUT and measuringNH4
+ and NO3- in laboratory on site as soon as possible in order to adjust the sensor reference value.
Level sensors. May present measurement problems when the liquid surface is not flat, especially during stirringand/or aeration; values registered during those operational modes should be interpreted with care. When acontroller uses level measures, both stirring and aeration must be turned off. Level sensors may show also abad signal when water condensates over the device. When this occurs the operator must clean, with care, thesurface of the sensor with a piece of paper.

Project: No 690323
SMART-Plant D2.2 Page 29
Feeding pump (P0). If a problem with the flow is detected probably the suction pipe and the pump needs tobe primed. If the R1-HET is already full, it is possible to put the suction pipe inlet into the valve MV08. In orderto prime the pump it is necessary to open the valve MV08, turn on the pump and by hand move up and downthe pipe in order to help the water move along the pipe and displace the air (starting from the pipe inlet placedin MV08).
Foam. Problems related to foam generation are usual during the first cycles of operation after a start-up. Inthis case, the operator can limit the maximum actuation of the aeration valves to 50% of the total apertureduring these first days.
Laboratory measurements
Table 4.2 presents the ports for each reactor where the samples are taken. It is important to let water to flowthrough the valves for 2-5 seconds prior to take the sample. This warrants that the operator is not taking asample from a dead volume placed in the piping/valve, which is not representative of the reactor content.
For each sample the following laboratory measurements are made: phosphate (Phosphax), ammonia (Amtax),nitrite and nitrate (ionic chromatography), COD, TOC, TSS, VSS, SVI and PHA (only in R1-HET).
High intensity measurement campaigns are made in order to characterize a working cycle: Table 4.3 reportsthe sampling times and locations. Composite and single point samples of the influent and effluent are madeonly during the feeding and discharge phases because of the batch working mode of the pilot-plant. Samplesare always taken during mixing or aeration modes in order to increase sample representativeness. All themeasurements are made by duplicate or triplicate and the samples are stored in a refrigerator in the case it isneeded to perform additional or repeated measurements.
Table 4.2 Sample ports used for laboratory measurements.
Reactor Sample port NotesR1-HET MV21 If necessary, MV4 can be usedR2-AUT MV16R3-PRE MV18 Samples can be obtained from the top of vessel
Table 4.3 Timing of when a sample is taken during a working cycle.
Sample ID State Description Time (min)HET1 A1f1/A1f2 Start of the anaerobic phase 21HET2 A1ana End of the anaerobic phase 121HET3 A1f3/A1f4 Start of the anoxic phase 206HET4 A1ano End of the anoxic phase 326HET5 A1aer End of the aerobic phase 416AUT1 A2f Start of the aerobic phase 227AUT2 A2aer1 End of the aerobic phase 130

Project: No 690323
SMART-Plant D2.2 Page 30
4.4 Drawings ‘as built’
Figure 4.4 Location of the SCEPPHAR pilot-plant inside the WWTP of Manresa.
Figure 4.5 Pilot-plant full constructed and in operation.

Project: No 690323
SMART-Plant D2.2 Page 31
Figure 4.6 Public opening event of the SMARTech2b in Manresa (Spain) the 22th of June 2017.

Project: No 690323
SMART-Plant D2.2 Page 32
5. SMARTECH3 - TASK 2.4. TERTIARY NUTRIENT RECOVERY BY MESOLITE AND
NANO ION EXCHANGE
5.1 Technical description
SMARTech3 is based on anion exchange (IEX) process used for the removal and recovery of nutrients fromwastewater as a tertiary treatment process. SMARTech3 is being operated as demonstration plant fed with 10m3/day of secondary effluent at the Cranfield University pilot-hall.
SMARTECH3 includes: 1 micro-screen filtration for secondary effluent solids removal, 1 ion exchange processfor ammonia (N) removal with BYK-zeolite media; 1 ion exchange process for phosphorus (P) removal withhybrid ion exchange media (HAIX) media, regenerant storage tanks (NaCl and NaOH), regenerant rinse watertanks and nutrient recovery processes: liquid-liquid membrane process for ammonia recovery, producingammonium sulphate and a mixing tank and filter for phosphate recovery as calcium phosphate(hydroxyapatite) (Figure 5.1).
Figure 5.1 Process diagram.
The use of IEX for nutrient removal is a completely different approach to traditional wastewater treatment asthis allows full control of the effluent quality and the nutrients are selectively removed by adsorption to

Project: No 690323
SMART-Plant D2.2 Page 33
selective media and then recovered and concentrated in the regenerant. The recovery of the regenerants as,well as respective nutrients, is necessary to ensure the process is economically feasible.
In the case of SMARTech3, the ammonia removal media used was produced by chemical modification of clayminerals and other aluminium-bearing materials to produce a predominately tetrahedrally coordinated Al3+ion enhancing the number of exchange sites. The media used in SMARTech3 was produced by SMART-PLANTpartner BYK and here described as BYK-zeolite. The media regeneration takes place by using a brine solutionof 10% NaCl or KCl.
The screening for the BYK-zeolite to be using in the demonstration plant was initiated during the design phase.BYK produced 2 different formulations of the zeolite that were granulated at 70 and 100°C (Figure 5.2):
MLG6 70°C - 5% sodium silicate binder, 70°C post-granulation heat treatment MLG6 100°C - 5% sodium silicate binder, 100°C post-granulation heat treatment MLG7 70°C - 10% sodium silicate binder, 70°C post-granulation heat treatment MLG7 100°C - 10% sodium silicate binder, 100°C post-granulation heat treatment
Figure 5.2 Zeolites for ammonia removal produced by BYK.
Table 5.1 Compositional analysis of zeolite produced by BYK in compound per wt%.
Zeolite name Na2O MgO K2O CaO TiO2 Fe2O3 SiO2 Al2O3
MLG6 1.56 0.48 23.52 0.58 0.06 1.08 43.21 28.51
MLG7 2.86 0.45 21.69 0.55 0.05 1.02 45.66 26.81
Project: No 690323
SMART-Plant D2.2 Page 34
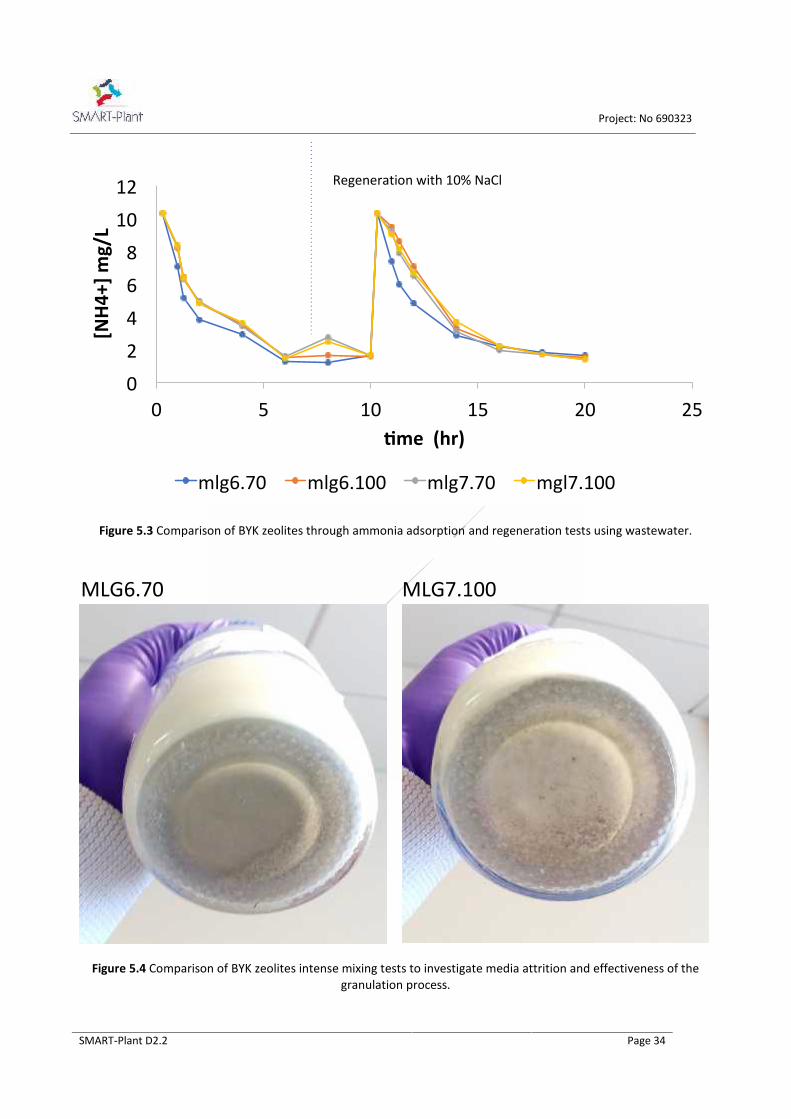
Figure 5.3 Comparison of BYK zeolites through ammonia adsorption and regeneration tests using wastewater.
Figure 5.4 Comparison of BYK zeolites intense mixing tests to investigate media attrition and effectiveness of thegranulation process.
02468
1012
0 5 10 15 20 25
[NH4+]mg/L
me (hr)
mlg6.70 mlg6.100 mlg7.70 mgl7.100
MLG6.70 MLG7.100
Regeneration with 10% NaCl

Project: No 690323
SMART-Plant D2.2 Page 35
Compositional analysis of the materials by X-Ray Fluorescence Spectroscopy (XRFS) of the media was alsocompleted (Table 5.1). Also to note is the high content of potassium (K) that could be favourable towardsusing the spend media (rich in ammonia) as a soil conditioner/fertiliser. This will be tested further in WP4.
The zeolites were then tested for adsorption capacity and regeneration in synthetic solutions (deionised waterand ammonia) as well as wastewater (Figure 5.3).
The for phosphorus removal, HAIX media, a strong basic anion exchange resin impregnated with hydro ferricoxide (HFO) nano-particles was used. This media is very selective uptake of P due to a preferential free energyof adsorption and can be easily regenerated through simple pH adjustment (2% NaOH). There are a numberof suppliers of HAIX media worldwide including Phos-X (SolmeteX, USA) and Lewatit FO 36 (Lanxess, Germany).The media used in SMARTech3 was Lewatit FO 36 (Lanxess, Germany) (Figure 5.4).
The media strength and integrity was tested in intensive mixing tests (media size: 1 mm < d < 2 mm, 20 g ofmedia in 150 ml of d-H20, 10 days of mixing at 210 rpm) (Figure 5.5). After the 10 days all the granules brokendown, but the zeolite MLG7 100°C showed the highest integrity and it was selected to be used SMARTech3. Itis however anticipated that the zeolites testing and development will continue throughout the project towardsusing the most effective media with reduced attrition.
Figure 5.5 Commercial media used for phosphorus removal Lewatit FO 36 (Lanxess, Germany)
Project: No 690323
SMART-Plant D2.2 Page 36
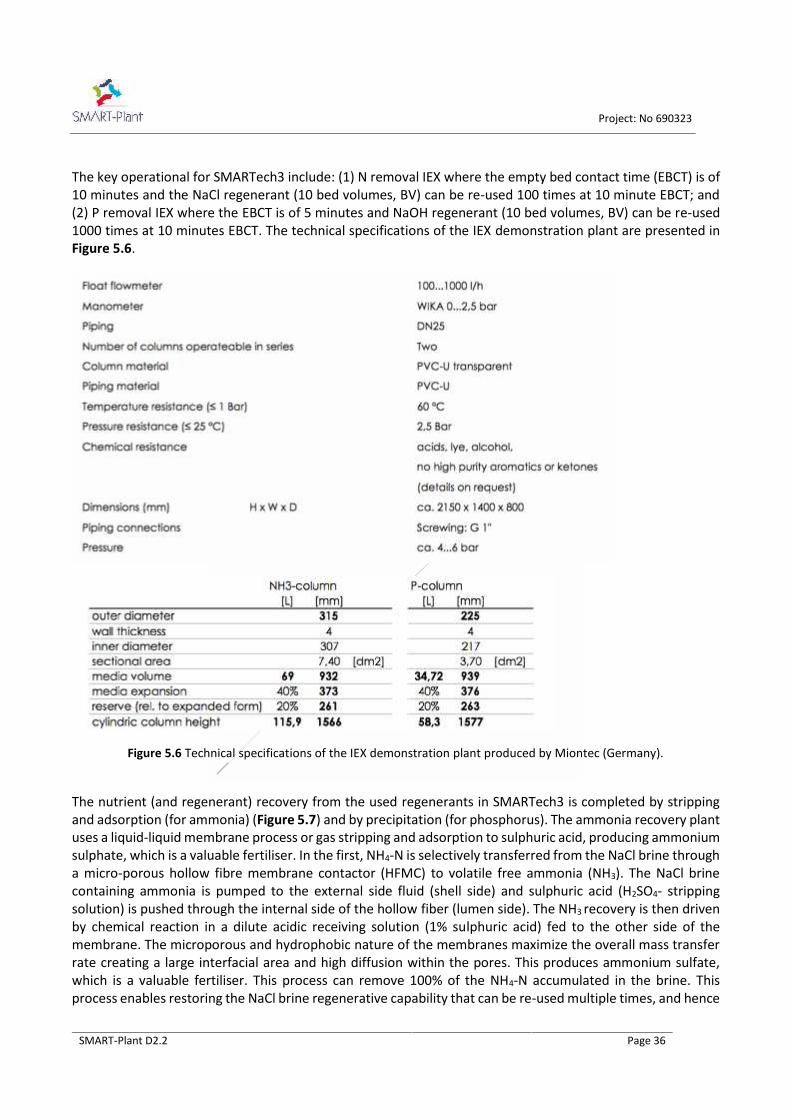
The key operational for SMARTech3 include: (1) N removal IEX where the empty bed contact time (EBCT) is of10 minutes and the NaCl regenerant (10 bed volumes, BV) can be re-used 100 times at 10 minute EBCT; and(2) P removal IEX where the EBCT is of 5 minutes and NaOH regenerant (10 bed volumes, BV) can be re-used1000 times at 10 minutes EBCT. The technical specifications of the IEX demonstration plant are presented inFigure 5.6.
Figure 5.6 Technical specifications of the IEX demonstration plant produced by Miontec (Germany).
The nutrient (and regenerant) recovery from the used regenerants in SMARTech3 is completed by strippingand adsorption (for ammonia) (Figure 5.7) and by precipitation (for phosphorus). The ammonia recovery plantuses a liquid-liquid membrane process or gas stripping and adsorption to sulphuric acid, producing ammoniumsulphate, which is a valuable fertiliser. In the first, NH4-N is selectively transferred from the NaCl brine througha micro-porous hollow fibre membrane contactor (HFMC) to volatile free ammonia (NH3). The NaCl brinecontaining ammonia is pumped to the external side fluid (shell side) and sulphuric acid (H2SO4- strippingsolution) is pushed through the internal side of the hollow fiber (lumen side). The NH3 recovery is then drivenby chemical reaction in a dilute acidic receiving solution (1% sulphuric acid) fed to the other side of themembrane. The microporous and hydrophobic nature of the membranes maximize the overall mass transferrate creating a large interfacial area and high diffusion within the pores. This produces ammonium sulfate,which is a valuable fertiliser. This process can remove 100% of the NH4-N accumulated in the brine. Thisprocess enables restoring the NaCl brine regenerative capability that can be re-used multiple times, and hence
Project: No 690323
SMART-Plant D2.2 Page 37
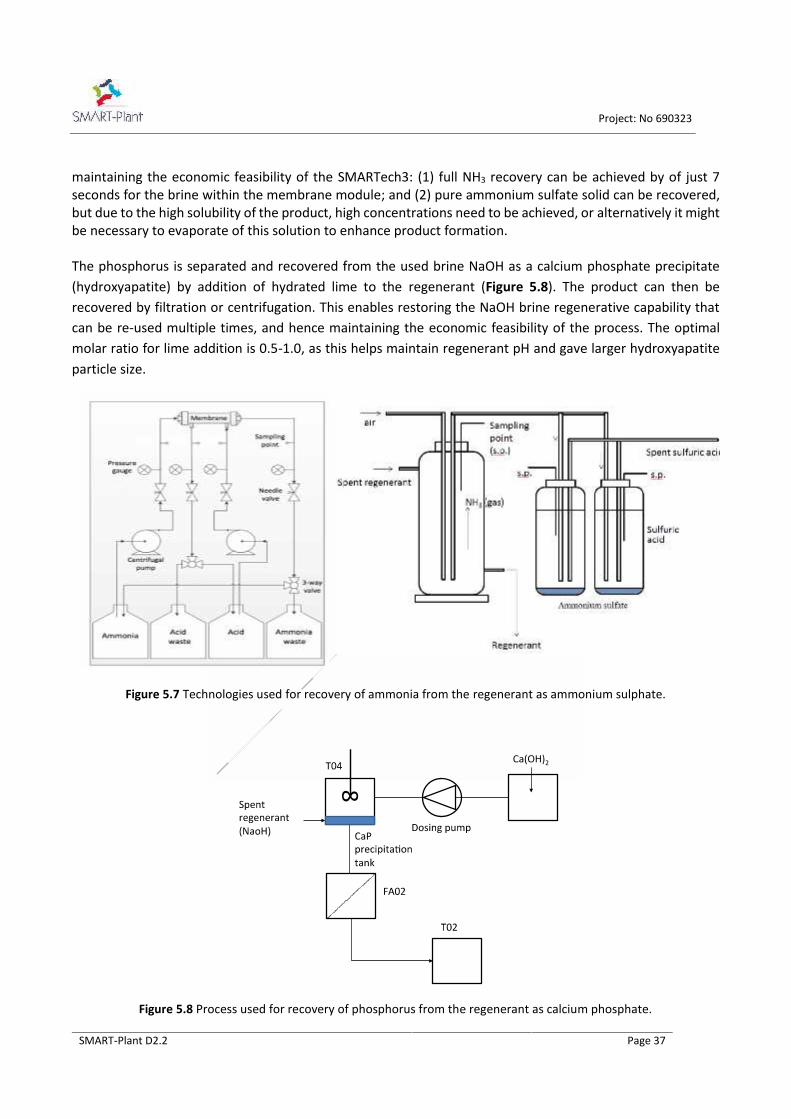
maintaining the economic feasibility of the SMARTech3: (1) full NH3 recovery can be achieved by of just 7seconds for the brine within the membrane module; and (2) pure ammonium sulfate solid can be recovered,but due to the high solubility of the product, high concentrations need to be achieved, or alternatively it mightbe necessary to evaporate of this solution to enhance product formation.
The phosphorus is separated and recovered from the used brine NaOH as a calcium phosphate precipitate(hydroxyapatite) by addition of hydrated lime to the regenerant (Figure 5.8). The product can then berecovered by filtration or centrifugation. This enables restoring the NaOH brine regenerative capability thatcan be re-used multiple times, and hence maintaining the economic feasibility of the process. The optimalmolar ratio for lime addition is 0.5-1.0, as this helps maintain regenerant pH and gave larger hydroxyapatiteparticle size.
Figure 5.7 Technologies used for recovery of ammonia from the regenerant as ammonium sulphate.
Figure 5.8 Process used for recovery of phosphorus from the regenerant as calcium phosphate.

Project: No 690323
SMART-Plant D2.2 Page 38
5.2 List of the electromechanical equipment
Feed pump –CODE DESCRIPTION Unit ValueFeed pump 110 V submersible pump Type capable to deliver up to 250 L/min
Power 0.45 kWDescription
Pump water from secondary effluent from Cranfield WWTPto a tank in the Pilot Hall.
Filter - 2 unitsCODE DESCRIPTION Unit ValueFT01 Drum filter m3/day 10
motor 48 VDC MotorPower 0.768 kW
Description One filter is used to remove solids from the secondary effluent fed to the IEX. The second filter is used to
recover the calcium phosphate from the regenerant. This is a rotating drum filter filter with 60 μm pore size,maximum flow 35 m³/h, L x W x H: 62 x 62 x 55 cm.
CompressorCODE DESCRIPTION Unit ValueCompressor Compressor Air flow m3/day Up to 200 Lt/min (Free Air Delivery)
Max pressure 8barPower 2 hp (1.5 kW)
Description The compressor is required to activate the compressed air diaphragm pump with float flow measurement
that feeds the wastewater to the IEX. A small amount (0.5%) of the air produced by the compressor will alsobe used to driving the ammonia stripping from the regenerant. Compact oil-free compressor with high airdelivery rate, low noise and anti-vibration design, L x W x H: 58 x 31 x 62 cm.
Mixers in tank T02 and T03 – 2 unitsCODE DESCRIPTION Unit ValueMixers 1and 2
Mixers Type Direct drive fixed mount mixer, housingflange mounting 160 mm diameter –complete with 316 stainless steel shaftand E-300 high efficiency impeller
Power 0.75 kW (50 Hz)Description
The mixers are installed in the regenerant tanks T02 and T03 to ensure the regenerant are homogenous acrossthe multiple regenerations.
Mixers in tank T04 – 1 unitCODE DESCRIPTION Unit ValueMixer 3 Mixer Type Direct drive fixed mount mixer with
400V 3PH 50Hz IP55 electricmotor (variable speed) – housingflange mounting 160 mm diameter –

Project: No 690323
SMART-Plant D2.2 Page 39
complete with 316 stainless steel shaftand E-300 high efficiency impeller
Power 0.75 kW (50 Hz)Description
The mixers are installed in the recovery regenerant tanks T04 to mix calcium hydroxide with NaOH regenerantfrom the IEX P column.
Peristaltic pump – 2 unitsCODE DESCRIPTION Unit ValuePump 1 and2
Pump Type Variable speed pumps (flow 1-200 L/h)
Description Pump ammonia rich regenerant through the recovery system (stripping and membrane process) Pump CaOH to regenerant rich in phosphate
Code pH sensor
Description Measurement ofthe pH
Technical description
Differential type digital sensor for the measurement of pH and temperature. Electrode not in contact with the liquidbulk.Component and configuration
Material of the electrode: glass;Type of probe: submergedSensor body: steelRange of measurement: 0 - 14; T=-5° C a 50° CTime of response: pH: < 5 s; T: < 2 minReference electrode for the control of the impedance of the liquid bulkLength of the cable: 10 meterDimensions: 350 x 44 mm (diameter)Other Equipment included
- Fixing system for pH, size 1" steel AISI316
5.3 Practical instructions for the operation
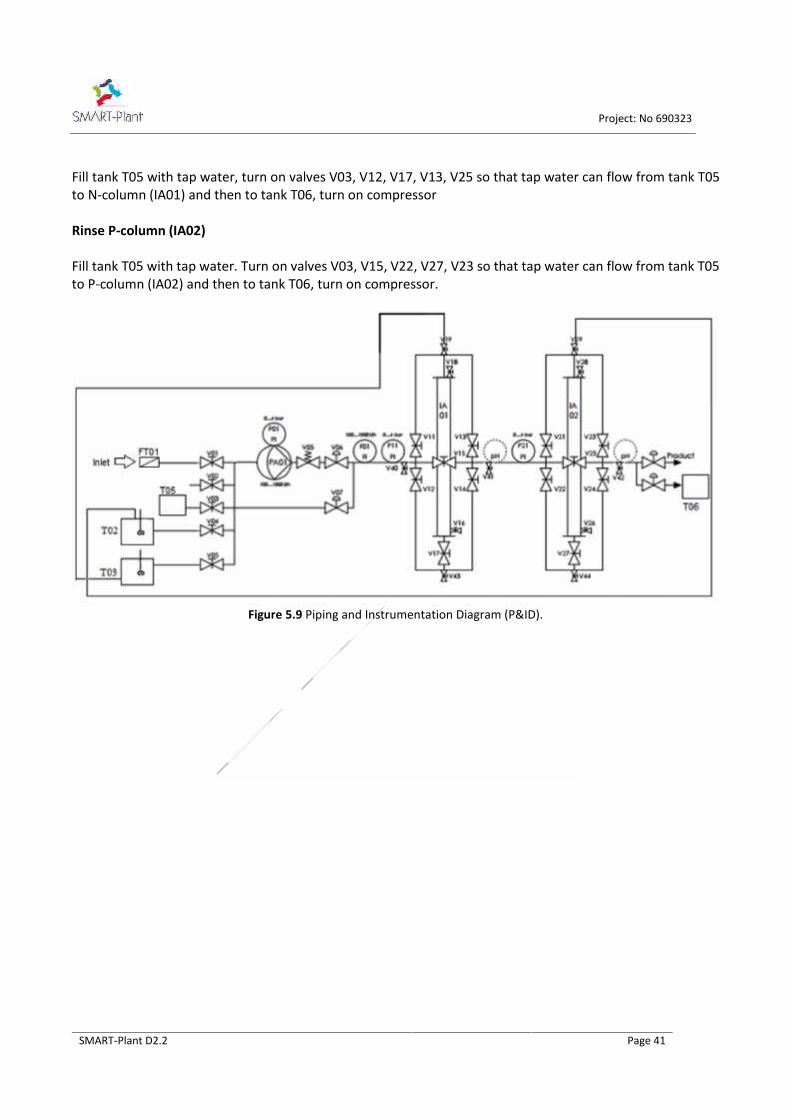
The piping and instrumentation diagram is presented in Figure 5.9. The standard operating procedure for theplant is described in the following.
Commissioning
Unload parts from pallets and assemble plant according to manual; test plant with clean water for leaks andstandard operation. Fill the columns with media (the N-column contains 69L of BYK zeolite and the P-columnwill contain 35L of HAIX.
Normal operation

Project: No 690323
SMART-Plant D2.2 Page 40
Turn on compressor, turn on filter, turn valves V01, V11, V17, V14, V21, V27, V24 so that the wastewater flowsto the filter and then to the N-column and P-column. The flow can be controlled manually with valve V06.Valve V05 is a pressure counter and release valve.
Regenerant preparation
Pre-weight the granules of NaCl and NaOH to achieve the required concentration of chemicals. Add 12kgNaOH in the tank T02 filled with 600L of tap water to obtain the required concentration (NaOH 2%). Add ~60kgNaCl in the tank T03 filled with 600L of tap water to obtain the required concentration (NaCl 10%). Place themixers in the mouth of the tanks, turn on the mixers.
Sampling
Take samples by opening valves V40, V41 and V42. Measure ammonia, phosphate and pH as routine analysis.Ammonia and phosphate are measured in a Smartchem 200 spectrophotometric discrete chemical analyserusing the recommended reagents (Labmedics, Abingdon, UK)
Regenerating the media HAIX in the P-column
Regeneration of the media is done using sodium hydroxide (2%). Assuming 10 bed volumes of sodiumhydroxide are passed through the column, use 1-bed volume to displace the effluent in the column that goesto Tank T06. The next 8 bed volumes are sent back to tank T02. The first bed volume of normal operation alsogoes to tank T06 as the wastewater displaces the sodium hydroxide. The procedure is: turn off compressor,turn on valves V04, V15, V22, V27, V23 so that the first bed volume of sodium hydroxide can flow from tankT02 to P- column (IA02) and then to tank T06. Turn on valves V04, V15, V22, V27, V29 so that 8 bed volumesof sodium hydroxide can flow from tank T02 to P- column (IA02) and then to tank T02 again. Turn on valvesV04, V15, V22, V27, V23 so that the last bed volume of sodium hydroxide can flow from tank T02 to P- column(IA02) and then to tank T06. Turn on compressor. Once the media in the P-column has been regenerated, thecolumn will be put back into normal operation by turning the valves again so that wastewater flows from thepilot hall to the filter and then to the P-column.
Regenerating the media (synthetic zeolite) in the N-column
Regeneration of the BYK-zeolite sodium chloride (10%). Assuming 10 bed volumes of sodium chloride arepassed through the column, use 1-bed volumes displace the effluent in the column and goes to Tank T06.Thenext 8 bed volumes are sent to tank T03.The first bed volume of normal operation goes to tank T06 as thewastewater displaces the sodium chloride. The procedure is: turn off compressor, turn on mixer in the tankT03, turn on valves V05, 12, 17, 13, 25 so that the first bed volume of sodium chloride can flow from tank T03to N-column (IA01) and then to tank T06. Turn on valves V05, 12, 17, 19 so that 8 bed volumes of sodiumchloride can flow from tank T03 to N-column (IA01) and then again to tank T03. Turn on valves V05, 12, 17,13, 25 so that the last bed volume of sodium chloride can flow from tank T03 to tank T06. Turn on compressor.Once the media in the N-column has been regenerated, the column will be put back into normal operation byturning the valves again so that wastewater flows from tank T01 to N-column.
Rinse N-column (IA01)
Project: No 690323
SMART-Plant D2.2 Page 41
Fill tank T05 with tap water, turn on valves V03, V12, V17, V13, V25 so that tap water can flow from tank T05to N-column (IA01) and then to tank T06, turn on compressor
Rinse P-column (IA02)
Fill tank T05 with tap water. Turn on valves V03, V15, V22, V27, V23 so that tap water can flow from tank T05to P-column (IA02) and then to tank T06, turn on compressor.
Figure 5.9 Piping and Instrumentation Diagram (P&ID).

Project: No 690323
SMART-Plant D2.2 Page 42
5.1 Drawings ‘as built’
Figure 5.10 Drawings and assembled IEX pilot-plant at Cranfield Pilot-hall.

Project: No 690323
SMART-Plant D2.2 Page 43
Figure 5.11 IEX pilot-plant at Cranfield Pilot-hall in operation with wastewater.