Embed Size (px)
Citation preview

Section 1: 10-K (10-K)
UNITED STATES SECURITIES AND EXCHANGE COMMISSION
Washington, D.C. 20549
FORM 10-K
☒ ANNUAL REPORT PURSUANT TO SECTION 13 OR 15(d) OF THE SECURITIES EXCHANGE ACT OF 1934
For the fiscal year ended December 28, 2019
OR
☐ TRANSITION REPORT PURSUANT TO SECTION 13 OR 15(d) OF THE SECURITIES EXCHANGE ACT OF 1934
Commission File Number: 1-14225
HNI Corporation Iowa 42-0617510
(State of Incorporation) (I.R.S. Employer No.)
600 East Second Street
P. O. Box 1109
Muscatine , Iowa 52761-0071
( 563 ) 272-7400
Securities registered pursuant to Section 12(b) of the Act:
Title of each class Trading Symbol(s) Name of each exchange on which registered
Common Stock HNI New York Stock Exchange
Securities registered pursuant to Section 12(g) of the Act: None.
Indicate by check mark if the registrant is a well-known seasoned issuer, as defined in Rule 405 of the Securities Act.
Yes ☒ No ☐
Indicate by check mark if the registrant is not required to file reports pursuant to Section 13 or Section 15(d) of the Act.
Yes ☐ No ☒
Indicate by check mark whether the registrant (1) has filed all reports required to be filed by Section 13 or 15(d) of the Securities Exchange Act of 1934 during the preceding 12 months (or for such shorter period that the registrant was required to file such reports), and (2) has been subject to such filing requirements for the past 90 days.
Yes ☒ No ☐
Indicate by check mark whether the registrant has submitted electronically every Interactive Data File required to be submitted pursuant to Rule 405 of Regulation S-T (§232.405 of this chapter) during the preceding 12 months (or for such shorter period that the registrant was required to submit such files).

Yes ☒ No ☐
Indicate by check mark whether the registrant is a large accelerated filer, an accelerated filer, a non-accelerated filer, a smaller reporting company, or an emerging growth company. See the definitions of "large accelerated filer," "accelerated filer," "smaller reporting company," and "emerging growth company" in Rule 12b-2 of the Exchange Act.
Large accelerated filer ☒ Accelerated filer ☐
Smaller reporting company ☐ Non-accelerated filer ☐
Emerging growth company ☐

The aggregate market value of the voting stock held by non-affiliates of the Registrant as of June 29, 2019 was $1,090,014,357 based on the New York Stock Exchange closing price for such shares on that date, assuming for purposes of this calculation that all 10 percent holders and all directors and executive officers of the Registrant are affiliates. The number of shares outstanding of the Registrant's common stock, as of January 31, 2020, was 42,554,705. Documents Incorporated by Reference Portions of the Registrant's Definitive Proxy Statement on Schedule 14A for the Annual Meeting of Shareholders to be held on May 5, 2020 are incorporated by reference into Part III.
If an emerging growth company, indicate by check mark if the registrant has elected not to use the extended transition period for complying with any new or revised financial accounting standards provided pursuant to Section 13(a) of the Exchange Act. ☐
Indicate by check mark whether the registrant is a shell company (as defined in Rule 12b-2 of the Act).
Yes ☐ No ☒

Table of Contents
3
HNI Corporation and Subsidiaries
Annual Report on Form 10-K
Table of Contents
PART I
Page
Item 1. Business 4
Item 1A. Risk Factors 9
Item 1B. Unresolved Staff Comments 17
Item 2. Properties 17
Item 3. Legal Proceedings 17
Item 4. Mine Safety Disclosures 17
Table I - Information about our Executive Officers 18
PART II
Item 5. Market for Registrant's Common Equity, Related Shareholder Matters, and Issuer Purchases of Equity Securities 19
Item 6. Selected Financial Data 20
Item 7. Management’s Discussion and Analysis of Financial Condition and Results of Operations 21
Item 7A. Quantitative and Qualitative Disclosures About Market Risk 29
Item 8. Financial Statements and Supplementary Data 29
Item 9. Changes in and Disagreements with Accountants on Accounting and Financial Disclosure 30
Item 9A. Controls and Procedures 30
Item 9B. Other Information 30
PART III
Item 10. Directors, Executive Officers, and Corporate Governance 31
Item 11. Executive Compensation 31
Item 12. Security Ownership of Certain Beneficial Owners and Management and Related Shareholder Matters 31
Item 13. Certain Relationships and Related Transactions, and Director Independence 31
Item 14. Principal Accounting Fees and Services 31
PART IV
Item 15. Exhibits, Financial Statement Schedules 32
Item 16. Form 10-K Summary 33
Signatures 35
Management Report on Internal Control Over Financial Reporting 36
Report of Independent Registered Public Accounting Firm 37
Financial Statements 39
Notes to Consolidated Financial Statements 44
Table of Contents
PART I Item 1. Business
General HNI Corporation (the ''Corporation'', ''we'', ''us'', or ''our'') is an Iowa corporation incorporated in 1944. The Corporation is a provider of office furniture and hearth products. Office furniture products include panel-based and freestanding furniture systems, seating, storage, tables, and architectural products. These products are sold primarily through a national system of independent dealers, wholesalers, and office product distributors but also directly to end-user customers and federal, state, and local governments. Hearth products include a full array of gas, wood, electric, and pellet fueled fireplaces, inserts, stoves, facings, and accessories. These products are sold through a national system of independent dealers and distributors, as well as Corporation-owned distribution and retail outlets. In fiscal 2019, the Corporation had net sales of $2.2 billion, of which $1.7 billion or 76 percent was attributable to office furniture products and $0.5 billion or 24 percent was attributable to hearth products. See "Note 17. Reportable Segment Information" in the Notes to Consolidated Financial Statements for further information about operating segments. The Corporation is organized into a corporate headquarters and operating units with offices, manufacturing plants, distribution centers, and sales showrooms in the United States, Canada, China, Hong Kong, India, Mexico, Dubai, Taiwan, and Singapore. See "Item 2. Properties" for additional related discussion. Several operating units, marketed under various brand names, participate in the office furniture industry. These include:
The HON Company LLC ("HON") Allsteel Inc. ("Allsteel") Maxon Furniture Inc. ("Maxon") Hickory Business Furniture, LLC (''HBF'') OFM LLC ("OFM") HNI Hong Kong Limited (''Lamex'') HNI Office India Limited ("HNI India")
Each of these operating units provides products, which are sold through various channels of distribution and segments of the industry. The operating unit Hearth & Home Technologies LLC (''Hearth & Home'') participates in the hearth products industry. The retail and distribution brand for this operating unit is Fireside Hearth & Home. The Corporation has been committed to systematically eliminating waste through its process improvement approach known as Rapid Continuous Improvement (''RCI''), which focuses on streamlining design, manufacturing, and administrative processes. The Corporation's RCI program has contributed to increased productivity, lower costs, improved product quality, enhanced workplace safety, and improved lead times. The Corporation's research and development efforts are focused on developing and providing relevant and differentiated solutions, delivering quality, aesthetics, and style. An important element of the Corporation's success has been its member-owner culture, which has enabled it to attract, develop, retain, and motivate skilled, experienced, and efficient members (i.e., employees). Each of the Corporation's eligible members has the opportunity to own stock in the Corporation through a number of stock-based plans, including a member stock purchase plan and a profit-sharing retirement plan. These ownership opportunities drive a unique level of commitment to the Corporation’s success throughout the workforce. Members own approximately 6 percent of the Corporation's stock. For further financial-related information with respect to acquisitions, divestitures, operating segment information, restructuring, and the Corporation’s operations in general, refer to "Item 7. Management’s Discussion and Analysis of Financial Condition and Results of Operations" in Part II of this report and the following sections in the Notes to Consolidated Financial Statements: "Note 1. Nature of Operations", "Note 4. Restructuring and Impairment Charges", "Note 5. Acquisitions and Divestitures", and "Note 17. Reportable Segment Information". Industry The United States office furniture market consists of two primary channels — the contract channel and the supplies-driven channel. The contract channel has traditionally been characterized by sales of office furniture and services to large corporations, primarily for new office facilities, relocations, or office redesigns. Sales to the contract channel are frequently customized to meet
4

Table of Contents specific client and designer preferences. Contract furniture is generally purchased through independent office furniture dealers who prepare a custom-designed office layout emphasizing image and design. The selling process is complex, lengthy, and generally has several manufacturers competing for the same projects. The supplies-driven channel, in which the Corporation is a market leader, primarily represents smaller orders of office furniture purchased by small/medium businesses. Sales in this channel are driven on the basis of price, quality, selection, speed, and reliability of delivery. Office product dealers, national office product distributors, e-Commerce retailers, and wholesalers are the primary distribution channels in this market. The Corporation also competes in the hearth products industry, where it is a market leader. Hearth products are typically purchased by builders during the construction of new homes and homeowners during the renovation of existing homes. Both types of purchases involve seasonality with remodel/retrofit activity being particularly concentrated in the September to December time-frame. Distribution is primarily through independent dealers, who buy direct from the manufacturer or from an intermediate distributor. Strategy The Corporation's strategy is to build on its position as a leading manufacturer of office furniture and hearth products in North America and pursue select global markets where opportunities exist to create shareholder value. The components of this growth strategy are to introduce new products, build brand equity, provide outstanding customer satisfaction, strengthen the distribution network, pursue complementary strategic acquisitions, enter markets not currently served, and continually reduce costs. The Corporation’s strategy has a dual focus: working continuously to extract new growth from its core markets while identifying and developing new, adjacent potential areas of growth. The Corporation focuses on extracting new growth from each of its existing businesses by deepening its understanding of end-users and using the insights gained to refine branding, selling, marketing, and research and development. The Corporation also pursues opportunities in potential growth drivers related to its core business, such as vertical markets or new distribution models. Employees/Members As of December 28, 2019, the Corporation employed approximately 8,500 persons, 8,400 of whom were full-time and 100 of whom were temporary personnel. Products and Solutions Office Furniture The Corporation designs, manufactures, and markets a broad range of workplace furnishings across a range of price points. The Corporation's portfolio includes panel-based and freestanding furniture systems and complementary products such as seating, storage, tables, and architectural products. The Corporation offers a complete line of office panel system products, benching, freestanding tables, storage, and social collaborative products in order to meet the needs of a wide spectrum of organizations. The Corporation offers a variety of storage options designed either to be integrated into the Corporation's office systems products or to function as freestanding furniture in office applications. The Corporation's seating line includes chairs designed for all types of office work, including task seating, multi-purpose seating, and soft upholstery lounge. The chairs are available in a variety of frame colors, coverings, and a wide range of price points. To meet the demands of various markets, the Corporation's products are sold primarily under the Corporation's brands:
HON® Allsteel® Beyond® Gunlocke® Maxon® HBF® OFM® RespawnTM Lamex® HNI India®
5

Table of Contents Hearth Products The Corporation is North America’s largest manufacturer and marketer of prefabricated fireplaces, hearth stoves, and related products. These products are primarily for the home and are sold under the following widely recognized brands:
Heatilator® Heat & Glo® Majestic® Monessen® Quadra-Fire® Harman® Vermont Castings® PelPro® Stellar HearthTM
The Corporation’s line of hearth products includes a full array of gas, wood, electric, and pellet fueled fireplaces, inserts, stoves, facings, and accessories. Heatilator®, Heat & Glo®, Majestic®, Monessen®, and Stellar HearthTM are brand leaders in the two largest segments of the home fireplace market: gas and wood fireplaces. The Corporation is a leader in "direct vent" fireplaces, which replaces the chimney-venting system used in traditional fireplaces with a less expensive vent through the roof or an outer wall. In addition, the Corporation is a market leader in wood and pellet-burning stoves with its Quadra-Fire®, Harman®, Vermont Castings®, and PelPro® product lines, which provide home heating solutions using renewable fuels. See "Intellectual Property" for additional details. Manufacturing The Corporation manufactures office furniture in Georgia, Iowa, New York, North Carolina, China, and India. The Corporation manufactures hearth products in Iowa, Minnesota, Pennsylvania, and Vermont. The Corporation purchases raw materials and components from a variety of suppliers and generally, most items are available from multiple sources. Major raw materials include coil steel, aluminum, zinc, castings, lumber, veneer, particleboard, textiles, paint, hardware, glass, plastic products, shipping cartons, foam, and fiberglass. Since its inception, the Corporation has focused on making its manufacturing facilities and processes more flexible while reducing cost, eliminating waste, and improving product quality. The Corporation applies the principles of RCI and a lean manufacturing philosophy leveraging the creativity of its members to eliminate and reduce costs. To achieve flexibility and attain efficiency goals, the Corporation has adopted a variety of production techniques, including cellular manufacturing, focused factories, just-in-time inventory management, value engineering, business simplification, and 80/20 principles. The application of RCI has increased productivity by reducing set-up, processing times, square footage, inventory levels, product costs, and delivery times, while improving quality and enhancing member safety. The Corporation's RCI process involves members, customers, and suppliers. Manufacturing also plays a key role in the Corporation's concurrent research and development process in order to design new products for ease of manufacturability. Research and Development The Corporation's research and development efforts are primarily focused on developing relevant and differentiated end-user solutions focused on quality, aesthetics, style, sustainable design, and reduced manufacturing costs. The Corporation accomplishes this through improving existing products, extending product lines, applying ergonomic research, improving manufacturing processes, leveraging alternative materials, and providing engineering support to its operating units. The Corporation conducts its research and development efforts at both the corporate and operating unit levels. The Corporation invested in research and development as follows (in thousands):
Intellectual Property As of December 28, 2019, the Corporation owned 141 United States and 138 foreign patents with expiration dates through 2042 and had applications pending for 25 United States and 45 foreign patents. In addition, the Corporation holds 183 United States and 411 foreign trademark registrations and has applications pending for 14 United States and 12 foreign trademarks. The Corporation believes neither any individual office furniture patent nor the Corporation's office furniture patents in the aggregate are material to the Corporation's business as a whole.
6
2019 2018 2017 Research and development investments $ 34,699 $ 33,420 $ 31,846

Table of Contents The Corporation’s patents covering its hearth products protect various technical innovations. While the acquisition of patents reflects Hearth & Home’s position in the market as an innovation leader, the Corporation believes neither any individual hearth product patent nor the Corporation’s hearth product patents in the aggregate are material to the Corporation’s business as a whole. The Corporation applies for patent protection when it believes the expense of doing so is justified and the duration of its registered patents is adequate to protect these rights. The Corporation also pays royalties in certain instances for the use of patents on products and processes owned by others. The Corporation applies for trademark protection for brands and products when it believes the expense of doing so is justified. The Corporation actively protects trademarks it believes have significant value. The Corporation believes neither the loss of any individual trademark nor the loss of the Corporation's trademarks in the aggregate would materially or adversely affect the Corporation's business as a whole, except for HON, Allsteel, Heat & Glo, and Heatilator. Sales and Distribution: Customers The Corporation sells its office furniture products through various distribution channels. A summary of each channel is as follows:
The Corporation's office furniture sales force consists of sales managers, salespersons, and independent manufacturers' representatives who collectively provide national sales coverage. Sales managers and salespersons are compensated by a combination of salary and variable performance compensation. The Corporation also makes export sales through HNI International to independent office furniture dealers and wholesale distributors serving select foreign markets. Distributors are principally located in the Middle East, Mexico, Latin America, and the Caribbean. Through Lamex and HNI India, the Corporation manufactures and distributes office furniture directly to end-users and through independent dealers and distributors in Asia, primarily China and India. Hearth & Home sells its hearth products through independent dealers, distributors, and Corporation-owned distribution and retail outlets. The Corporation has a field sales organization of sales managers, salespersons, and independent manufacturers' representatives. In fiscal 2019, the Corporation's five largest customers represented approximately 21 percent of its consolidated net sales. No single customer accounted for 10 percent or more of the Corporation’s consolidated net sales in fiscal 2019. The substantial purchasing power exercised by large customers may adversely affect the prices at which the Corporation can successfully offer its products. The Corporation has an order backlog, which will be filled in the ordinary course of business. The Corporation's backlog orders are typically cancelable for a period of time and the backlog is typically fulfilled within a quarter. Order backlog in dollars and in terms of percentage of net sales was as follows (in thousands):
7
• Independent, local office products dealers that specialize in the sale of office furniture to business, government, education, and health care entities.
• National office product distributors that sell furniture and office supplies through a national network of dealerships and sales offices. These distributors also sell through on-line and retail office products stores.
• Wholesalers that serve as distributors of the Corporation's products to independent dealers and national office products distributors. These wholesalers maintain inventories of standard product lines for quick delivery to customers.
• e-Commerce focused resellers that sell a wide array of business and consumer products to commercial and non-commercial customers. Orders are fulfilled both by the Corporation and/or directly by the e-Commerce reseller from inventory held in their facilities.
• Direct sales of products to federal, state and local government offices or in certain circumstances a lead selling relationship with an end-user.
2019 2018 Net sales $ 2,246,947 $ 2,257,895 Order backlog $ 166,502 $ 181,522 Percent of net sales 7.4 % 8.0 %

Table of Contents The Corporation’s products are typically manufactured and shipped within a few weeks following receipt of order or later upon customer request. Therefore, the dollar amount of the Corporation’s order backlog is not considered by management to be a leading indicator of the Corporation’s expected sales in any particular fiscal period. Competition The Corporation is a leading global office furniture manufacturer and marketer, and is North America's largest manufacturer and marketer of fireplaces. The office furniture industry is highly competitive, with a significant number of competitors offering similar products. The Corporation competes by emphasizing its ability to deliver compelling value products, solutions, and a high level of tailored customer service. The Corporation competes with large office furniture manufacturers, which cover a substantial portion of the North America market share in the contract-oriented office furniture market, including manufacturers such as Steelcase Inc., Haworth, Inc., Herman Miller, Inc., Knoll, Inc., The Global Group, Kimball International, Inc., Krueger International Inc. (KI), and Teknion Corporation, as well as global importers. The Corporation faces significant price competition from its competitors and may encounter competition from new market entrants. The hearth products industry is also highly competitive. Hearth products are manufactured by a number of national and regional competitors. The Corporation competes against a broad range of manufacturers, including Travis Industries Inc., Innovative Hearth Products, Wolf Steel Ltd. (Napoleon), and FPI Fireplace Products International Ltd. (Regency). Both office furniture and hearth products compete on the basis of performance, quality, price, customer service, and complete and on-time delivery. The Corporation believes it competes principally by providing compelling value products designed to be among the best in their price range for product quality, performance, superior customer service, and short lead-times. This is made possible, in part, by the Corporation's on-going investment in brands, research and development, efficient manufacturing operations, and extensive distribution network. Effects of Inflation Certain business costs may, from time to time, increase at a rate exceeding the general rate of inflation. The Corporation’s objective is to offset the effect of normal inflation primarily through productivity improvements combined with certain adjustments to the selling price of its products as competitive market and general economic conditions permit. Investments are routinely made in modernizing plants, equipment, information technology, and RCI programs. These investments collectively focus on business simplification and increasing productivity, which help to offset the effect of rising material and labor costs. The Corporation also routinely employs ongoing cost control disciplines. In addition, the last-in, first-out ("LIFO") valuation method is used for most of the Corporation's inventories. The use of LIFO ensures changing material and labor costs are recognized in reported income and pricing decisions. Environmental The Corporation is subject to a variety of environmental laws and regulations governing the use of materials and substances in products, the management of wastes resulting from use of certain material, and the remediation of contamination associated with releases of hazardous substances used in the past. Although the Corporation believes it is substantially compliant with all of the various regulations applicable to its business, there can be no assurance requirements will not change in the future or the Corporation will not incur material costs to comply with such regulations. The Corporation has trained staff responsible for monitoring compliance with environmental, health, and safety requirements. The Corporation’s staff works with responsible personnel at each manufacturing facility, the Corporation’s environmental legal counsel, and consultants on the management of environmental, health, and safety issues. The Corporation’s environmental objective is to reduce and, when practical, eliminate the human and ecosystem impacts of materials and manufacturing processes. Over the past several years, the Corporation has expanded its environmental management system and established metrics to influence product design and development, supplier and supply chain performance, energy and resource consumption, and the impacts of its facilities. In addition, the Corporation provides sustainability training to senior decision makers and has assigned resources to documenting and communicating its progress to an increasingly knowledgeable market. Integrating sustainable objectives into core business systems is consistent with the Corporation’s vision, ensures its commitment to being a sustainable enterprise, and remains a priority for all members.
8

Table of Contents Compliance with federal, state, and local environmental regulations has not had a material effect on the capital expenditures, earnings, or competitive position of the Corporation to date. The Corporation does not anticipate financially material capital expenditures will be required during fiscal 2020 for environmental control facilities. In management’s judgment, compliance with current regulations should not have a material effect on the Corporation’s financial condition or results of operations. However, there can be no assurance new environmental legislation, material science, or technology in this area will not result in or require material capital expenditures. Business Development The development of the Corporation's business during the fiscal years ended December 28, 2019, December 29, 2018, and December 30, 2017 is discussed in ''Item 7. Management's Discussion and Analysis of Financial Condition and Results of Operations" in Part II of this report. Available Information Information regarding the Corporation’s annual reports on Form 10-K, quarterly reports on Form 10-Q, current reports on Form 8-K, and any amendments to these reports, will be made available, free of charge, on the Corporation’s website at www.hnicorp.com, as soon as reasonably practicable after the Corporation electronically files such reports with or furnishes them to the Securities and Exchange Commission (''SEC''). The information on the Corporation's website is not, and shall not be, deemed to be a part hereof or incorporated into this or any of the Corporation's other filings with the SEC. The Corporation’s SEC filings are also available on the SEC website at www.sec.gov. Forward-Looking Statements Statements in this report to the extent they are not statements of historical or present fact, including statements as to plans, outlook, objectives, and future financial performance, are "forward-looking" statements, within the meaning of Section 21 of the Securities Exchange Act of 1934, as amended, and the Private Securities Litigation Reform Act of 1995. Words such as "anticipate," "believe," "could," "confident," "estimate," "expect," "forecast," "hope," "intend," "likely," "may," "plan," "possible," "potential," "predict," "project," "should," "will," "would," and variations of such words and similar expressions identify forward-looking statements. Forward-looking statements involve known and unknown risks and uncertainties, which may cause the Corporation’s actual results in the future to differ materially from expected results. The most significant factors known to the Corporation that may adversely affect the Corporation’s business, operations, industries, financial position, or future financial performance are described later in this report under the heading "Item 1A. Risk Factors." The Corporation cautions readers not to place undue reliance on any forward-looking statement, which speaks only as of the date made, and to recognize forward-looking statements are predictions of future results, which may not occur as anticipated. Actual results could differ materially from those anticipated in the forward-looking statements and from historical results due to the risks and uncertainties described elsewhere in this report, including but not limited to: the levels of office furniture needs and housing starts; overall demand for the Corporation's products; general economic and market conditions in the United States and internationally; industry and competitive conditions; the consolidation and concentration of the Corporation's customers; the Corporation's reliance on its network of independent dealers; changes in trade policy; changes in raw material, component, or commodity pricing; market acceptance and demand for the Corporation's new products; changing legal, regulatory, environmental, and healthcare conditions; the risks associated with international operations; the potential impact of product defects; the various restrictions on the Corporation's financing activities; an inability to protect the Corporation's intellectual property; impacts of tax legislation; force majeure events outside the Corporation’s control; and other risks as described under the heading "Item 1A. Risk Factors," as well as others that the Corporation may consider not material or does not anticipate at this time. The risks and uncertainties described in this report, including those under the heading "Item 1A. Risk Factors," are not exclusive and further information concerning the Corporation, including factors that potentially could have a material effect on the Corporation’s financial results or condition, may emerge from time to time. The Corporation assumes no obligation to update, amend, or clarify forward-looking statements, whether as a result of new information, future events, or otherwise, except as required by applicable law. The Corporation advises you, however, to consult any further disclosures made on related subjects in future quarterly reports on Form 10-Q and current reports on Form 8-K filed with or furnished to the SEC. Item 1A. Risk Factors The following risk factors and other information included in this report should be carefully considered. If any of the following risks occur, the Corporation's business, operating results, cash flows, or financial condition could be materially adversely affected.
9

Table of Contents Unfavorable economic and industry factors could adversely affect the Corporation's business, operating results, or financial condition. Office furniture industry sales are impacted by a variety of macroeconomic factors including service-sector employment levels, corporate profits, small business confidence, commercial construction, and office vacancy rates. Industry factors, including corporate restructuring, technology changes, corporate relocations, health and safety concerns, including ergonomic considerations, and the globalization of companies also influence office furniture industry revenues. Hearth products industry sales are impacted by a variety of macroeconomic factors including housing starts, overall employment levels, interest rates, home affordability, consumer confidence, energy costs, disposable income, and changing demographics. Industry factors, such as technology changes, health and safety concerns, and environmental regulation, including indoor air quality standards, also influence hearth products industry revenues. Deterioration of economic conditions or a slowdown in the homebuilding industry and the hearth products market could decrease demand for hearth products and have additional adverse effects on operating results. A deterioration of economic conditions in the Corporation's key international markets, including China and India, could have adverse effects on the Corporation's international office furniture sales and operating results. Deteriorating economic conditions could affect the Corporation's business significantly, including: reduced demand for products; insolvency of independent dealers resulting in increased provisions for credit losses; insolvency of key suppliers resulting in product delays; inability of customers to obtain credit to finance purchases of products; and decreased customer demand, including order delays or cancellations. In a recessionary economy, business confidence, service-sector employment, corporate cash flows and residential and non-residential commercial construction often decrease, which typically leads to a decrease in demand for office furniture and hearth products. The office furniture and hearth products industries are highly competitive and, as a result, the Corporation may not be successful in winning new business. Both the office furniture and hearth products industries are highly competitive. Many of the Corporation's competitors in both industries offer similar products. Competitive factors include price, delivery and service, brand recognition, product design, product quality, strength of dealers and other distributors, and relationships with customers and key influencers, including architects, designers, home-builders, and facility managers. In both industries, most of the top competitors have an installed base of products that can be a source of significant future sales through repeat and expansion orders. The Corporation's main competitors manufacture products with strong acceptance in the marketplace and are capable of developing products that have a competitive advantage, which could make it difficult to win new business. In both the office furniture and hearth products industries, the Corporation faces price competition from competitors and from new market entrants who may manufacture and source products from lower cost countries. Price competition impacts the ability to implement price increases or, in some cases, even maintain prices, which could lower profit margins and adversely affect future financial performance. If customers do not perceive the Corporation's products and services to be of good value, the Corporation's brand and name recognition and reputation could suffer. The Corporation believes that establishing and maintaining good brand and name recognition and a good reputation is critical to its business. In certain parts of the market, promotion and enhancement of the Corporation's name and brands will depend on the effectiveness of marketing and advertising efforts and on successfully providing design-driven, innovative, and high-quality products and superior services. If customers do not perceive the Corporation's products and services to be design-driven, innovative and of high quality, its reputation, brand and name recognition could suffer, which could have a material adverse effect on the Corporation's business. Changes in industry dynamics, including demand and order patterns from customers, distribution changes, or the loss of a significant number of dealers, could adversely affect the Corporation's business, operating results, or financial condition. Consolidation among the Corporation's customers may result in a smaller number or large customers whose size and purchasing power give them increased leverage that may result in, among other things, decreases in average selling prices. In addition, further consolidations may lead to fluctuations in revenue, increases in costs to meet demands of large customers, and pressure to accept onerous contract terms, and the Corporation's business, financial condition, and operating results could be harmed.
10

Table of Contents The Corporation sells products through multiple distribution channels, which primarily include independent dealers, national dealers, wholesalers, and e-Commerce. Within these distribution channels, there has been, and may continue to be, consolidation. The Corporation relies on distribution partners to provide a variety of important specification, installation, and after-market services to customers. Some distribution partners may terminate their relationship with the Corporation at any time and for any reason. The Corporation has experienced demand shift to direct fulfillment, reducing two-step distribution by wholesale partners. The inability to provide increased direct fulfillment and/or the loss or termination of a significant number of reseller relationships could cause difficulties in marketing and distributing products, resulting in a decline in sales, which may adversely affect the business, operating results, or financial condition. In addition, individual dealers may not continue to be viable and profitable and may suffer from the lack of available credit. While the Corporation is not significantly dependent on any single dealer, if dealers go out of business or are restructured, the Corporation may suffer losses as they may not be able to pay the Corporation for products previously delivered to them. The loss of a dealer relationship could also negatively affect the Corporation's ability to maintain market share in the affected geographic market and to compete for and service clients in that market until a new dealer relationship is established. Establishing a viable dealer in a market can take a significant amount of time and resources. The loss or termination of a significant dealer or a significant number of dealer relationships could cause significant difficulties for the business in marketing and distributing the Corporation's products, resulting in a decline in sales. The Corporation's failure to retain its existing management team, maintain its engineering, technical, and manufacturing process expertise, or continue to attract qualified personnel could adversely affect the Corporation's business. The Corporation depends significantly on its executive officers and other key personnel. The Corporation's success is also dependent on keeping pace with technological advancements and adapting services to provide manufacturing capabilities that meet customers' changing needs. To do that, the Corporation must retain qualified engineering and technical personnel and successfully anticipate and respond to technological changes in a cost effective and timely manner. The Corporation focuses on continuous training, motivation, and development of its members, and it strives to attract and retain qualified personnel. Failure to retain the Corporation's executive officers and retain and attract other key personnel could adversely affect the Corporation's business. Evolving trade policy between the United States and other countries may have an adverse effect on the Corporation's business and results of operations. The Corporation has a global supply chain for raw materials and components used in office furniture and hearth products. Actions taken by the United States government to adopt a new approach to trade policy and in some cases to apply tariffs on certain products and materials, could have long-term impacts on existing supply chains. The evolving situation could impact the competitive environment depending on the severity and duration of current and future policy changes. This may manifest in additional costs on the business, including costs with respect to raw materials and components upon which the business depends. The increased costs have lowered and could further lower profit margins as the Corporation may not be able to pass on the additional costs by increasing the prices of its products, and its business and results of operations may be adversely affected. In addition, certain foreign governments have imposed retaliatory tariffs on goods that their countries import from the United States. Changes in United States trade policy could result in one or more foreign governments adopting responsive trade policies that make it more difficult or costly for the Corporation to do business in or import products from those countries. The Corporation cannot predict the extent to which the United States or other countries will impose quotas, duties, tariffs, taxes or other similar restrictions upon the import or export of raw materials or products in the future, nor can the Corporation predict future trade policy or the terms of any renegotiated trade agreements and their impact on the business. The adoption and expansion of trade restrictions, the occurrence of a trade war, or other governmental action related to tariffs or trade agreements or policies has the potential to adversely impact demand for products, costs, customers, suppliers, and the United States economy, which in turn could have a material adverse effect on the business, operating results and financial condition. The Corporation's profitability may be adversely affected by increases in raw material and commodity costs as well as transportation and shipping challenges. Fluctuations in the price, availability, and quality of the commodities, raw materials, and components used in manufacturing could have an adverse effect on costs of sales, profitability, and ability to meet customers' demand. The Corporation sources commodities, raw materials, and components from domestic and international suppliers for both the office furniture and hearth products. From both domestic and international suppliers, the cost, quality, and availability of commodities, raw materials, and components, including steel, have been significantly affected in recent years by, among other things, changes in global supply and demand, changes in laws
11

Table of Contents and regulations (including tariffs and duties), changes in exchange rates and worldwide price levels, natural disasters, labor disputes, terrorism, and political unrest or instability. These factors could lead to further price volatility or supply interruptions in the future. Profit margins could be adversely affected if commodity, raw material, and component costs remain high or escalate further, and the Corporation is either unable to offset such costs through strategic sourcing initiatives and continuous improvement programs or, as a result of competitive market dynamics, unable to pass along a portion of the higher costs to customers. The Corporation relies primarily on third-party freight and transportation providers to deliver products to customers. Increasing demand for freight providers and a shortage of qualified drivers may cause delays in shipments and increase the cost to ship its products, which may adversely affect profitability. Additionally, the Corporation imports and exports products and components, primarily using container ships, which load and unload through North American ports. Port-caused delays in the shipment or receipt of products and components, including labor disputes, could cause delayed receipt of products and components. These delays could cause manufacturing disruptions, increased expense resulting from alternate shipping methods, or the inability to meet customer delivery expectations, which may adversely affect sales and profitability. The Corporation's efforts to introduce new products to meet customer and workplace demands may not be successful, which could limit sales growth or cause its sales to decline. To meet the changing needs of customers and keep pace with market trends and evolving regulatory and industry requirements, including environmental, health, safety, and similar standards for the workplace and for product performance, the Corporation regularly introduces new office furniture and hearth products. The introduction of new products requires the coordination of the design, manufacturing, and marketing of the products, which may be affected by uncontrollable factors. The design and engineering of certain new products varies but can extend beyond a year; further time may be required to achieve client acceptance. The Corporation may face difficulties if it cannot successfully align itself with independent architects, home-builders, and designers who are able to design, in a timely manner, high quality products consistent with the Corporation's image and customers' needs. Accordingly, the launch of a product may be later or less successful than originally anticipated, limiting sales growth or causing sales to decline. The Corporation may not be able to successfully integrate and manage acquired businesses and alliances. One of the Corporation's growth strategies is to supplement its organic growth through acquisitions and strategic alliances. The benefits of acquisitions or alliances may take more time than expected to develop or integrate into operations. In addition, acquisitions and alliances involve a number of risks, including:
The Corporation's ability to grow through future acquisitions will depend, in part, on the availability of suitable acquisition candidates at an acceptable price, the ability to compete effectively for these acquisition candidates, and the availability of capital to complete the acquisitions. Any potential acquisition may not be successful and could adversely affect the business, operating results, or financial condition. Goodwill and other intangible assets represent a significant amount of the Corporation's net worth, and an impairment charge would adversely affect the Corporation's financial results. Goodwill and other acquired intangible assets with indefinite lives are recorded at fair value at the time of acquisition and are not amortized, but reviewed for impairment annually or more frequently if an event occurs or circumstances change making it reasonably
12
• diversion of management’s attention; • difficulties in assimilating the operations and products of an acquired business or in realizing projected efficiencies, cost savings and
revenue synergies; • potential loss of key employees or customers of the acquired businesses or adverse effects on existing business relationships with
suppliers and customers; • negative impact on member morale and performance as a result of job changes and reassignments;• reallocation of amounts of capital from other operating initiatives or an increase in leverage and debt service requirements to pay the
acquisition purchase prices, which could in turn restrict the ability to access additional capital when needed or to pursue other important elements of the business strategy;
• inaccurate assessment of undisclosed, contingent, or other liabilities or problems and unanticipated costs associated with the acquisition;• possible tax costs or inefficiencies associated with integrating the operations of a combined company; and• incorrect estimates made in accounting for acquisitions, incurrence of non-recurring charges, and write-off of significant amounts of
goodwill that could adversely affect the financial results.

Table of Contents possible an impairment may exist. In evaluating the potential for impairment of goodwill and other intangible assets, the Corporation makes assumptions regarding future operating performance, business trends and market and economic performance, and the Corporation’s sales, operating margins, growth rates and discount rates. There are inherent uncertainties related to these factors. If the Corporation experiences disruptions in its business, unexpected significant declines in operating results, a divestiture of a significant component of its business, declines in the market value of equity, or other factors causing the Corporation's goodwill or intangible assets to be impaired, the Corporation could be required to recognize a non-cash impairment charge, which would adversely affect the results of operations. The Corporation is subject to extensive environmental regulation and has exposure to potential environmental liabilities. Through the past and present operation and ownership of manufacturing facilities and real property, the Corporation is subject to extensive and changing federal, state, and local environmental laws and regulations, both domestic and abroad, including those relating to discharges in air, water, and land, the handling and disposal of solid and hazardous waste, and the remediation of contamination associated with releases of hazardous substances. In addition, the increased prevalence of global climate issues may result in new regulations that may negatively impact the Corporation. Compliance with environmental regulations has not had a material effect on capital expenditures, earnings, or competitive position to date; however, compliance with current laws or more stringent laws or regulations which may be imposed in the future, stricter interpretation of existing laws or discoveries of contamination at the Corporation's real property sites which occurred prior to ownership, or the advent of environmental regulation may require additional expenditures in the future, some of which may be material. Increasing healthcare costs could adversely affect the Corporation's business, operating results, and financial condition. The Corporation provides healthcare benefits to the majority of its members and is self-insured. Healthcare costs have continued to rise over time, which increases the annual spending on healthcare and could adversely affect the Corporation's business, operating results, and financial condition. The Corporation's international operations expose it to risks related to conducting business in multiple jurisdictions outside the United States. The Corporation manufactures, markets, and sells products in international markets, including China and India and plans to continue to grow internationally. The Corporation primarily sells products and reports the financial results in United States dollars; however, increased business in countries outside the United States creates exposure to fluctuations in foreign currency exchange rates. Paying expenses in other currencies can result in a significant increase or decrease in the amount of those expenses in terms of United States dollars, which may affect profits. In the future, any foreign currency appreciation relative to the United States dollar would increase expenses that are denominated in that currency. Additionally, as the Corporation reports currency in the United States dollar, the financial position is affected by the strength of the currencies in countries where the Corporation has operations relative to the strength of the United States dollar. Further, certain countries have complex regulatory systems that impose administrative and legal requirements, which make managing international operations more difficult, including approvals to transfer funds among certain countries. If the Corporation is unable to provide financial support to the international operations in a timely manner, business, operating results, and financial condition could be adversely affected. The Corporation periodically reviews foreign currency exposure and evaluates whether it should enter into hedging transactions. The Corporation's international sales and operations are subject to a number of additional risks, including:
13
• social and political turmoil, official corruption, and civil and labor unrest;• restrictive government actions, including the imposition of trade quotas and tariffs and restrictions on transfers of funds;• changes in labor laws and regulations affecting the ability to hire, retain, or dismiss employees;• the need to comply with multiple and potentially conflicting laws and regulations, including environmental and corporate laws and
regulations; • the failure of the Corporation's compliance programs and internal training to prevent violations of the United States Foreign Corrupt
Practices Act and similar anti-bribery laws; • preference for locally branded products and laws and business practices favoring local competition;• less effective protection of intellectual property and increased possibility of loss due to cyber-theft;• unfavorable business conditions or economic instability in any particular country or region;• infrastructure disruptions;
Table of Contents
Restrictions imposed by the terms of the Corporation's debt agreements limit the Corporation's operating and financial flexibility. The Corporation's credit facility and other financing arrangements limits the ability of the Corporation to finance operations, service debt, or engage in other business activities that may be in its interests. Specifically, the debt agreements restrict its ability to incur additional indebtedness, create or incur certain liens with respect to any properties or assets, engage in lines of business substantially different than those currently conducted by us, sell, lease, license, or dispose of any assets, enter into certain transactions with affiliates, make certain restricted payments or take certain restricted actions, and enter into certain sale-leaseback arrangements. The debt agreements also require the Corporation to maintain certain financial covenants. The failure to comply with the obligations under the debt agreements may result in an event of default, which, if not cured or waived, may cause accelerated repayment of the indebtedness under the agreements. The Corporation cannot be certain it will have sufficient funds available to pay any accelerated repayments or will have the ability to refinance accelerated repayments on favorable terms or at all. Phase-out of the London Interbank Offered Rate (LIBOR), or the replacement of LIBOR with a different reference rate or modification of the method used to calculate LIBOR, may adversely affect interest rates affecting the Corporation.
In July 2017, the United Kingdom’s Financial Conduct Authority announced its intention to stop compelling banks to submit LIBOR rates after 2021. It is unclear whether or not LIBOR will cease to exist at that time or if new methods of calculating LIBOR will be established following 2021.
At this time the Corporation cannot predict the future impact of a departure from LIBOR as a reference rate, however, if future rates based upon the successor rate (or a new method of calculating LIBOR) are higher than LIBOR rates as currently determined, it may have a material adverse effect on the Corporation's financial condition and results of operations. Costs related to product defects could adversely affect the Corporation's profitability. The Corporation incurs various expenses related to product defects, including product warranty costs, product recall and retrofit costs, and product liability costs. These expenses relative to product sales vary and could increase. The Corporation uses chemicals and materials in products and includes components in products from external suppliers, which are believed to be safe and appropriate for their designated use; however, harmful effects may become known, which could subject the Corporation to litigation and significant losses. The Corporation maintains reserves for product defect-related costs but there can be no certainty these reserves will be adequate to cover actual claims. Incorrect estimates or any significant increase in the rate of product defect expenses could have a material adverse effect on operations. The Corporation may require additional capital in the future, which may not be available or may be available only on unfavorable terms. The Corporation's capital requirements depend on many factors, including its need for capital improvements, tooling, research and development, and acquisitions. To the extent existing capital is insufficient to meet these requirements and cover any losses, the Corporation may need to raise additional funds through financings or curtail its growth and reduce the Corporation's assets. Future borrowings or financings may not be available under the credit facility or otherwise in an amount sufficient to enable the Corporation to pay its debt or meet its liquidity needs. Any equity or debt financing, if available, could have unfavorable terms. In addition, financings could result in dilution to shareholders or the securities may have rights, preferences, and privileges senior to those of the Corporation's common stock. If the need for capital arises because of significant losses, the occurrence of these losses may make it more difficult to raise the necessary capital. The Corporation's sales to the United States federal, state, and local governments are subject to uncertain future funding levels and federal, state, and local procurement laws and are governed by restrictive contract terms; any of these factors could limit current or future business. The Corporation derives a portion of its revenue from sales to various United States federal, state, and local government agencies and departments. The ability to compete successfully for and retain business with the United States government, as well as with state and local governments, is highly dependent on cost-effective performance. This government business is highly sensitive to
14
• potentially conflicting cultural and business practices; • difficulty in obtaining distribution and support; and • changes to border taxes or other international tax reforms.

Table of Contents changes in procurement laws; national, international, state, and local public priorities; and budgets at all levels of government, which frequently experience downward pressure and, in the case of the federal budget, are subject to uncertainty. The Corporation's contracts with government entities are subject to various statutes and regulations that apply to companies doing business with the government. The United States government, as well as state and local governments, can typically terminate or modify their contracts either for their convenience or if the Corporation defaults by failing to perform under the terms of the applicable contract. A termination arising out of default could expose the Corporation to liability and impede its ability to compete in the future for contracts and orders with agencies and departments at all levels of government. Moreover, the Corporation is subject to investigation and audit for compliance with the requirements governing government contracts, including requirements related to procurement integrity, export controls, employment practices, the accuracy of records, and reporting of costs. If the Corporation were found to not be a responsible supplier or to have committed fraud or certain criminal offenses, it could be suspended or debarred from all further federal, state, or local government contracting. The Corporation relies on information technology systems to manage numerous aspects of the business and a disruption or failure of these systems could adversely affect business, operating results, and financial condition. The Corporation relies upon information technology networks and systems to process, transmit, and store electronic information, as well as to manage numerous aspects of the business and provide information to management. Additionally, the Corporation collects and stores sensitive data of its customers, suppliers, and employees in data centers and on information technology networks. The secure operation of these information technology networks and the processing and maintenance of this information is critical to business operations and strategy. These networks and systems, despite security and precautionary measures, are vulnerable to natural events and malicious activity. Though the Corporation attempts to detect and prevent these incidents, it may not be successful. In addition, the Corporation is subject to data privacy and other similar laws in various jurisdictions. If the Corporation is the target of a cybersecurity attack, computer virus, physical or electronic break-in or similar disruption resulting in unauthorized disclosure of sensitive data of customers, suppliers, and employees, the Corporation may be required to undertake costly notification procedures. The Corporation may also be required to expend significant additional resources to protect against the threat of security breaches or to alleviate problems, including reputational harm and litigation, caused by any breaches. Any disruption of information technology networks or systems, or access to or disclosure of information stored in or transmitted by systems, could result in legal claims and damages and loss of intellectual property or other proprietary information. The Corporation's results of operations and earnings may not meet guidance or expectations.
The Corporation provides public guidance on the expected results of operations for future periods. This guidance is comprised of forward-looking statements subject to risks and uncertainties, including the risks and uncertainties described in this Annual Report on Form 10-K and in other public filings and public statements, and is based necessarily on assumptions made at the time the Corporation provides such guidance. The guidance may not always be accurate. If, in the future, the results of operations for a particular period do not meet its guidance or the expectations of investment analysts or if the Corporation reduces its guidance for future periods, the market price of common stock could decline significantly. Iowa law and provisions in the Corporation's charter documents may have the effect of preventing or hindering a change in control and adversely affecting the market price of its common stock.
The Corporation's Articles of Incorporation give the Corporation's Board of Directors ("Board") the authority to issue up to two million shares of preferred stock and to determine the rights and preferences of the preferred stock without obtaining shareholder approval. The existence of this preferred stock could make it more difficult or discourage an attempt to obtain control of the Corporation by means of a tender offer, merger, proxy contest, or otherwise. Furthermore, this preferred stock could be issued with other rights, including economic rights, senior to common stock, thereby having a potentially adverse effect on the market price of common stock.
The Board is divided into three classes. The Corporation's classified Board, along with other provisions of the Corporation's Articles of Incorporation and Bylaws and Iowa corporate law, could make it more difficult for a third party to acquire the Corporation or remove the Corporation's directors by means of a proxy contest, even if doing so would be beneficial to shareholders. Additionally, the Corporation may, in the future, adopt measures (such as a shareholder rights plan or "poison pill") that could have the effect of delaying, deferring, or preventing an unsolicited takeover, even if such a change in control were at a premium price or favored by a majority of unaffiliated shareholders. These measures may be adopted without any further vote or action by the shareholders.
15

Table of Contents An inability to protect the Corporation's intellectual property could have a significant impact on the business.
The Corporation attempts to protect its intellectual property rights, both in the United States and in foreign countries, through a combination of patent, trademark, copyright, and trade secret laws, as well as licensing agreements and third-party nondisclosure and assignment agreements. Because of the differences in foreign trademark, copyright, patent, and other laws concerning proprietary rights, intellectual property rights do not generally receive the same degree of protection in foreign countries as they do in the United States. In some parts of the world, the Corporation has limited protections, if any, for its intellectual property. The degree of protection offered by the claims of the various patents, copyrights, trademarks, and service marks may not be broad enough to provide significant proprietary protection or competitive advantages to us, and patents, copyrights, trademarks, or service marks may not be issued on pending or contemplated applications. In addition, not all of the Corporation's products are covered by patents or similar intellectual property protections. It is also possible that patents, copyrights, trademarks, and service marks may be challenged, invalidated, canceled, narrowed, or circumvented.
In the past, certain products have been copied and sold by others. The Corporation tries to enforce its intellectual property rights, but has to make choices about where and how to pursue enforcement and where to seek and maintain intellectual property protection. In many cases, the cost of enforcing rights is substantial, and the Corporation may determine that the costs of enforcement outweigh the potential benefits.
If third parties claim that the Corporation infringes upon their intellectual property rights, the Corporation may incur liabilities and costs and may have to redesign or discontinue an infringing product.
The Corporation faces the risk of claims that it has infringed upon third parties’ intellectual property rights. Companies operating in the Corporation's industry routinely seek patent protection for their product designs, and many of the principal competitors have large patent portfolios. Prior to launching major new products in the key markets, the Corporation normally evaluates existing intellectual property rights. However, competitors and suppliers may have filed for patent protection which is not, at the time of the evaluation, a matter of public knowledge. The Corporation's efforts to identify and avoid infringing upon third parties’ intellectual property rights may not always be successful. Any claims of patent or other intellectual property infringement, even those without merit, could be expensive and time consuming to defend; cause the Corporation to cease making, licensing, or using products that incorporate the challenged intellectual property; require the Corporation to redesign, re-engineer, or re-brand the products or packaging, if feasible; or require the Corporation to enter into royalty or licensing agreements in order to obtain the right to use a third party’s intellectual property.
Natural disasters, acts of God, force majeure events, or other catastrophic events may impact the Corporation's production capacity and, in turn, negatively impact profitability. Natural disasters, acts of God, force majeure events, or other catastrophic events, including severe weather, military action, terrorist attacks, power interruptions, and fires, could disrupt operations and likewise, the ability to produce or deliver products. Several of the Corporation's production facilities, members, and key management are located within a small geographic area in eastern Iowa located near the Mississippi River and a natural disaster or catastrophe in the area, such as flooding or severe storms, could have a significant adverse effect on the results of operations and business conditions. Further, several of the Corporation's production facilities are single-site manufacturers of certain products, and an adverse event affecting any of those facilities could significantly delay production of certain products and adversely affect the operations and business conditions. Members are an integral part of the business and events including an epidemic could reduce the availability of members reporting for work. In the event the Corporation experiences a temporary or permanent interruption in its ability to produce or deliver product, revenues could be reduced, and business could be materially adversely affected. In addition, any continuing disruption in the Corporation's computer system could adversely affect the ability to receive and process customers' orders, procure materials, manufacture products and ship products on a timely basis, and could adversely affect relations with customers, potentially resulting in reduction in orders from customers or loss of customers. The Corporation’s financial condition and results of operation could be adversely affected by a pandemic or epidemic health crisis. In late 2019, a strain of coronavirus was reported to have surfaced in China. At the time of this filing, the outbreak has been largely concentrated in China, although cases have been confirmed in other countries. The Corporation conducts operations at various facilities throughout the world, including in China, and the inability to manufacture at a facility, either temporarily or permanently, may result in increased costs, adverse impacts to the Corporation's supply chain, lower revenues, and the loss of customers. In addition, the impact of a pandemic or epidemic on the Corporation’s members and the global economy could adversely impact the Corporation’s sales and operations. At this point, the extent to which the current coronavirus outbreak may impact the Corporation’s results is uncertain and depends on future developments, which are highly uncertain and cannot be predicted.
16
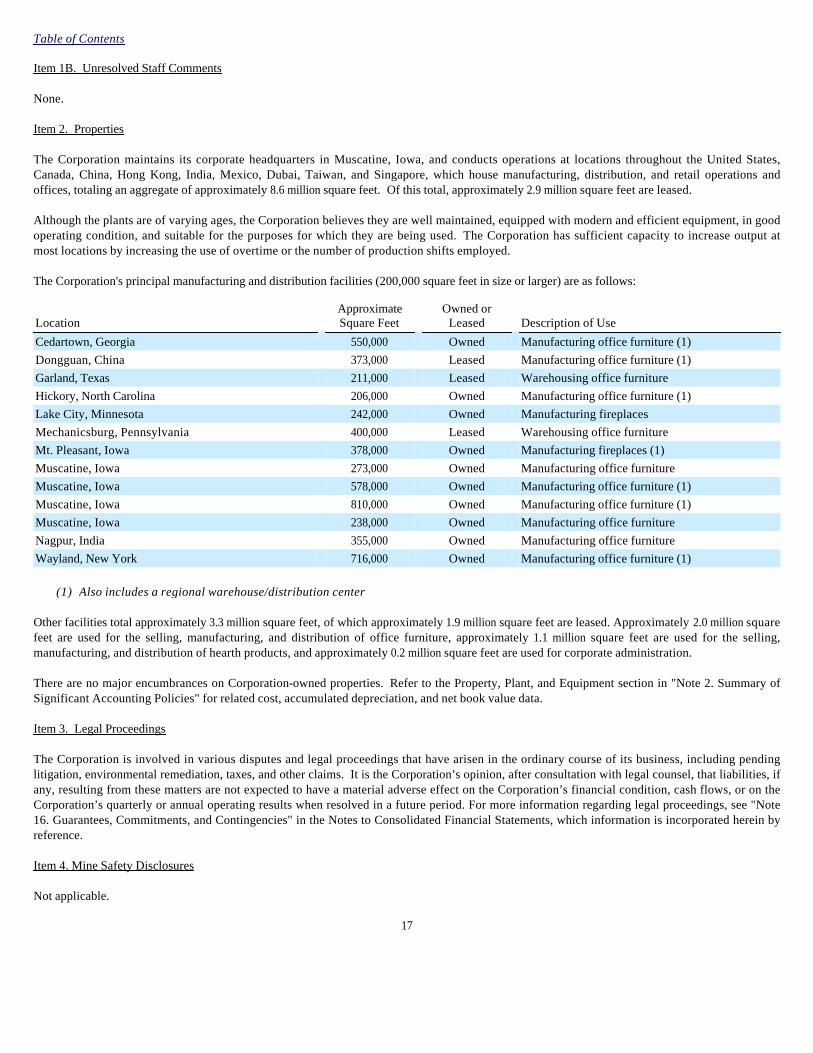
Table of Contents Item 1B. Unresolved Staff Comments None. Item 2. Properties The Corporation maintains its corporate headquarters in Muscatine, Iowa, and conducts operations at locations throughout the United States, Canada, China, Hong Kong, India, Mexico, Dubai, Taiwan, and Singapore, which house manufacturing, distribution, and retail operations and offices, totaling an aggregate of approximately 8.6 million square feet. Of this total, approximately 2.9 million square feet are leased. Although the plants are of varying ages, the Corporation believes they are well maintained, equipped with modern and efficient equipment, in good operating condition, and suitable for the purposes for which they are being used. The Corporation has sufficient capacity to increase output at most locations by increasing the use of overtime or the number of production shifts employed. The Corporation's principal manufacturing and distribution facilities (200,000 square feet in size or larger) are as follows:
Other facilities total approximately 3.3 million square feet, of which approximately 1.9 million square feet are leased. Approximately 2.0 million square feet are used for the selling, manufacturing, and distribution of office furniture, approximately 1.1 million square feet are used for the selling, manufacturing, and distribution of hearth products, and approximately 0.2 million square feet are used for corporate administration. There are no major encumbrances on Corporation-owned properties. Refer to the Property, Plant, and Equipment section in "Note 2. Summary of Significant Accounting Policies" for related cost, accumulated depreciation, and net book value data. Item 3. Legal Proceedings The Corporation is involved in various disputes and legal proceedings that have arisen in the ordinary course of its business, including pending litigation, environmental remediation, taxes, and other claims. It is the Corporation’s opinion, after consultation with legal counsel, that liabilities, if any, resulting from these matters are not expected to have a material adverse effect on the Corporation’s financial condition, cash flows, or on the Corporation’s quarterly or annual operating results when resolved in a future period. For more information regarding legal proceedings, see "Note 16. Guarantees, Commitments, and Contingencies" in the Notes to Consolidated Financial Statements, which information is incorporated herein by reference. Item 4. Mine Safety Disclosures Not applicable.
17
Location Approximate Square Feet
Owned or Leased Description of Use
Cedartown, Georgia 550,000 Owned Manufacturing office furniture (1)
Dongguan, China 373,000 Leased Manufacturing office furniture (1)
Garland, Texas 211,000 Leased Warehousing office furniture
Hickory, North Carolina 206,000 Owned Manufacturing office furniture (1)
Lake City, Minnesota 242,000 Owned Manufacturing fireplaces
Mechanicsburg, Pennsylvania 400,000 Leased Warehousing office furniture
Mt. Pleasant, Iowa 378,000 Owned Manufacturing fireplaces (1)
Muscatine, Iowa 273,000 Owned Manufacturing office furniture
Muscatine, Iowa 578,000 Owned Manufacturing office furniture (1)
Muscatine, Iowa 810,000 Owned Manufacturing office furniture (1)
Muscatine, Iowa 238,000 Owned Manufacturing office furniture
Nagpur, India 355,000 Owned Manufacturing office furniture
Wayland, New York 716,000 Owned Manufacturing office furniture (1)
(1) Also includes a regional warehouse/distribution center

Table of Contents
Table I
Information about our Executive Officers
18
Name Age Family
Relationship Position Position Held
Since Other Business Experience During Past Five Years
Vincent P. Berger
47
None
Executive Vice President, HNI Corporation President, Hearth & Home Technologies
2018
2016
Senior Vice President, Sales and Operations, Hearth & Home Technologies (2014-2016)
Steven M. Bradford
62
None
Senior Vice President, General Counsel and Secretary
2015
Vice President, General Counsel and Secretary (2008-2015)
Marshall H. Bridges
50
None
Senior Vice President and Chief Financial Officer
2018
Vice President and Chief Financial Officer (2017-2018); Vice President, Finance, HNI Contract Furniture Group (2014-2017)
B. Brandon Bullock
42
None
President, The HON Company
2018
Advanced Development and Innovation Leader, Whirlpool Corporation (2017-2018); Global Platform Leader and General Manager, Microwaves, Hong Kong, Whirlpool Corporation (2016-2017); General Manager, Air and Water Platforms, Whirlpool Corporation (2014-2016)
Jeffrey D. Lorenger
54
None
Chairman President and Chief Executive Officer
2020 2017
President, Office Furniture, HNI Corporation (2017 - 2018) Executive Vice President, HNI Corporation (2014-2017); President, HNI Contract Furniture Group (2014-2017)
Donna D. Meade
54
None
Vice President, Member and Community Relations
2014
Kurt A. Tjaden
56
None
President, HNI International Senior Vice President, HNI Corporation
2017
2015
Senior Vice President and Chief Financial Officer (2015-2017); Vice President and Chief Financial Officer (2008-2015)
Kristin L. Yates
54
None
President, Allsteel, Inc.
2019
President, The Gunlocke Company L.L.C. (2017 - 2019); Vice President, Sales, Allsteel Inc. (2015-2017); Vice President and General Manager, Architectural Product (2014-2015)

Table of Contents
PART II Item 5. Market for Registrant's Common Equity, Related Shareholder Matters, and Issuer Purchases of Equity Securities The Corporation’s common stock is listed for trading on the New York Stock Exchange (NYSE) under the trading symbol HNI. As of December 28, 2019, the Corporation had 5,487 shareholders of record. EQ Shareowner Services, St. Paul, Minnesota, serves as the Corporation’s transfer agent and registrar of its common stock. Shareholders may report a change of address or make inquiries by writing or calling: EQ Shareowner Services, P.O. Box 64874, St. Paul, MN 55164-0854, or 800-468-9716. The Corporation expects to continue its policy of paying regular quarterly cash dividends. Dividends have been paid each quarter since the Corporation paid its first dividend in 1955. The average dividend payout percentage for the most recent three-year period has been 57 percent of prior year earnings. Future dividends are dependent on future earnings, capital requirements, and the Corporation’s financial condition, and are declared in the sole discretion of the Board. Issuer Purchases of Equity Securities: The following is a summary of share repurchase activity during the fourth quarter of fiscal 2019:
(1) No shares were purchased outside of a publicly announced plan or program.
The Corporation repurchases shares under previously announced plans authorized by the Board as follows:
19
Period
Total Number of Shares (or Units)
Purchased (1)
Average Price Paid per Share
(or Unit)
Total Number of Shares (or Units)
Purchased as Part of Publicly Announced
Plans or Programs
Maximum Number (or Approximate Dollar Value) of Shares (or Units) that May Yet be Purchased Under
the Plans or Programs
09/29/19 - 10/26/19 66,758 $ 36.04 66,758 $ 181,302,370 10/27/19 - 11/23/19 192,000 $ 39.34 192,000 $ 173,748,255 11/24/19 - 12/28/19 229,994 $ 39.44 229,994 $ 164,677,495
Total 488,752 488,752
• The Corporation's share purchase program ("Program") announced November 9, 2007, providing share repurchase authorization of $200,000,000 with no specific expiration date, with increases announced November 7, 2014 and February 13, 2019, providing additional share repurchase authorizations each of $200,000,000 with no specific expiration date.
• No repurchase plans expired or were terminated during the fourth quarter of fiscal 2019, nor do any plans exist under which the Corporation does not intend to make further purchases. The Program does not obligate the Corporation to purchase any shares and the authorization for the Program may be terminated, increased, or decreased by the Board at any time.

Table of Contents Item 6. Selected Financial Data - Five Year Summary
Reflects OFM acquisition in Q1 2016, Artcobell divestiture in Q4 2016, and Paoli closure in Q1 2018.
20
(In thousands, except per share data) 2019 2018 2017 2016 2015 Operating Results
Net Sales $ 2,246,947 $ 2,257,895 $ 2,175,882 $ 2,203,489 $ 2,304,419 Gross Profit as a Percentage of Net Sales 37.1 % 37.0 % 36.0 % 37.9 % 36.8 %
Net Income Attributable to HNI Corporation $ 110,505 $ 93,377 $ 89,795 $ 85,577 $ 105,436 Net Income Attributable to HNI Corporation as a Percentage of Net Sales 4.9 % 4.1 % 4.1 % 3.9 % 4.6 %
Share and Per Share Data (Basic and Dilutive)
Net Income Attributable to HNI Corporation – basic $ 2.56 $ 2.14 $ 2.05 $ 1.93 $ 2.38 Net Income Attributable to HNI Corporation – diluted $ 2.54 $ 2.11 $ 2.00 $ 1.88 $ 2.32 Cash Dividends $ 1.21 $ 1.17 $ 1.13 $ 1.09 $ 1.045 Average Number of Common Shares Outstanding – basic 43,101 43,639 43,839 44,414 44,285 Average Number of Common Shares Outstanding – diluted 43,495 44,328 44,840 45,502 45,441
Financial Position Current Assets $ 528,834 $ 531,883 $ 488,880 $ 433,041 $ 438,370 Current Liabilities $ 478,705 $ 434,308 $ 489,703 $ 463,473 $ 435,900 Working Capital $ 50,129 $ 97,575 $ (823 ) $ (30,432 ) $ 2,470 Total Assets $ 1,452,512 $ 1,401,844 $ 1,391,550 $ 1,330,234 $ 1,263,925 Percent Return on Beginning Assets Employed 10.8 % 9.2 % 5.8 % 10.6 % 13.2 %
Long-Term Debt $ 174,439 $ 249,355 $ 240,000 $ 180,000 $ 185,000 Shareholders’ Equity $ 584,044 $ 562,933 $ 514,068 $ 500,603 $ 476,954 Percent Return on Average Shareholders’ Equity 19.3 % 17.3 % 17.7 % 17.5 % 23.7 %

Table of Contents Item 7. Management's Discussion and Analysis of Financial Condition and Results of Operations The following discussion of the Corporation’s historical results of operations and of its liquidity and capital resources should be read in conjunction with the Consolidated Financial Statements of the Corporation and related notes. Statements that are not historical are forward-looking and involve risks and uncertainties. See "Item 1A. Risk Factors" and the Forward-Looking Statements section within "Item 1. Business" for further information. Overview The Corporation has two reportable segments: office furniture and hearth products. The Corporation is a leading global office furniture manufacturer and marketer, and a leading manufacturer and marketer of hearth products. The Corporation utilizes a decentralized business model to deliver value to customers via various brands and selling models. The Corporation is focused on growing its existing businesses while seeking out and developing new opportunities for growth. Consolidated net sales for 2019 decreased 0.5 percent or $10.9 million compared to the prior year. The change was driven by a decrease in both the office furniture and hearth products segments. The decrease in office furniture was driven by lower sales in the office furniture supplies-driven business, partially offset by a small increase in the office furniture contract business. Included in the sales results for the office furniture contract business was a $23.1 million negative impact from closing and divesting small office furniture companies. The hearth products segment saw decreases in both the new construction and retail businesses. Net income attributable to the Corporation in 2019 was $110.5 million compared to net income of $93.4 million in 2018. The change was primarily driven by lower restructuring, transition, and impairment charges, price realization, net productivity and improved SG&A efficiency. These factors were partially offset by lower volume and higher input costs. Results of Operations The following table presents certain key highlights from the results of operations (in thousands):
21
2019 Change 2018 Change 2017 Net sales $ 2,246,947 (0.5 )% $ 2,257,895 3.8 % $ 2,175,882 Cost of sales 1,413,185 (0.7 )% 1,422,857 2.2 % 1,391,894
Gross profit 833,762 (0.2 )% 835,038 6.5 % 783,988 Selling and administrative expenses 680,049 (1.6 )% 691,140 2.9 % 671,831 Gain on sale, disposal, and license of assets, net — — % — (100.0 )% (1,949 )
Restructuring and impairment charges 2,371 (84.9 )% 15,725 (58.0 )% 37,416 Operating income 151,342 18.1 % 128,173 67.1 % 76,690
Interest expense, net 8,628 (8.7 )% 9,448 55.4 % 6,078 Income before income taxes 142,714 20.2 % 118,725 68.1 % 70,612
Income tax expense (benefit) 32,211 26.8 % 25,399 (231.7 )% (19,286 )
Net income (loss) attributable to non-controlling interest (2 ) (96.1 )% (51 ) (149.5 )% 103
Net income attributable to HNI Corporation $ 110,505 18.3 % $ 93,377 4.0 % $ 89,795
As a Percentage of Net Sales:
Net sales 100.0 % 100.0 % 100.0 %
Gross profit 37.1 10 bps 37.0 100 bps 36.0 Selling and administrative expenses 30.3 -30 bps 30.6 -30 bps 30.9 Gain on sale, disposal, and license of assets, net — — — 10 bps (0.1 )
Restructuring and impairment charges 0.1 -60 bps 0.7 -100 bps 1.7 Operating income 6.7 100 bps 5.7 220 bps 3.5
Income tax expense (benefit) 1.4 30 bps 1.1 200 bps (0.9 )
Net income attributable to HNI Corporation 4.9 80 bps 4.1 — 4.1

Table of Contents Net Sales Consolidated net sales for 2019 decreased 0.5 percent or $10.9 million compared to the prior year. The change was driven by a decrease in both the office furniture and hearth products segments. The decrease in office furniture was driven by lower sales in the office furniture supplies-driven business, partially offset by a small increase in the office furniture contract business. Included in the sales results for the office furniture contract business was a $23.1 million negative impact from closing and divesting small office furniture companies. The hearth products segment saw decreases in both the new construction and retail businesses. Consolidated net sales for 2018 increased 3.8 percent or $82.0 million compared to 2017. The change was driven by an increase in both the office furniture and hearth products segments. Office furniture segment sales increased in both the supplies-driven and contract businesses which were partially offset by a $57.6 million negative net impact of closing and divesting small office furniture companies. The hearth products segment saw increases in both the new construction and retail businesses. Gross Profit Gross profit as a percentage of net sales increased 10 basis points in 2019 compared to 2018 primarily driven by price realization and net productivity, offset by lower volume and higher input costs. Gross profit as a percentage of net sales increased 100 basis points in 2018 compared to 2017 primarily driven by lower restructuring and transition costs, price realization, net productivity and cost savings, partially offset by higher input costs. Cost of sales in 2018 included $2.3 million of transition costs related to the previously announced closures of the hearth manufacturing facilities in Paris, Kentucky and Colville, Washington, the office furniture manufacturing facility in Orleans, Indiana, and structural realignments in China. Specific items incurred include production move costs. Cost of sales in 2017 included $10.3 million of restructuring costs and $17.0 million of transition costs related to the previously announced closures of the hearth manufacturing facilities in Paris, Kentucky and Colville, Washington and the office furniture manufacturing facility in Orleans, Indiana and structural realignments in China and between office furniture facilities in Muscatine, Iowa. Specific items incurred include accelerated depreciation and production move costs. Selling and Administrative Expenses Selling and administrative expenses as a percentage of net sales decreased 30 basis points in 2019 compared to 2018 primarily driven by improved SG&A efficiency. Selling and administrative expenses as a percentage of net sales decreased 30 basis points in 2018 compared to 2017 primarily driven by increased efficiency and the impact of closing and divesting small office furniture companies, partially offset by the amortization and implementation costs from the Business System Transformation initiative, strategic investments, and higher variable compensation. Selling and administrative expenses include freight expense for shipments to customers, research and development costs, and amortization expense of intangible assets. Refer to "Note 2. Summary of Significant Accounting Policies" and "Note 7. Goodwill and Other Intangible Assets" in the Notes to Consolidated Financial Statements for further information regarding the comparative expense levels for these items. Gain on Sale, Disposal, and License of Assets, Net The Corporation recorded a net $1.9 million gain in 2017, which included a $6.0 million nonrecurring gain from the sale and license of an intangible asset, a $0.8 million gain on the sale of a closed facility, and a $4.8 million loss on the disposal of a manufacturing facility, in addition to other gains and losses incurred in the ordinary course of business. Restructuring and Impairment Charges Restructuring and impairment charges as a percentage of net sales decreased 60 basis points in 2019 compared to 2018. In 2019, the Corporation recorded $2.4 million of restructuring charges and $0.2 million of transition costs primarily associated with structural realignments in the office furniture segment.
22
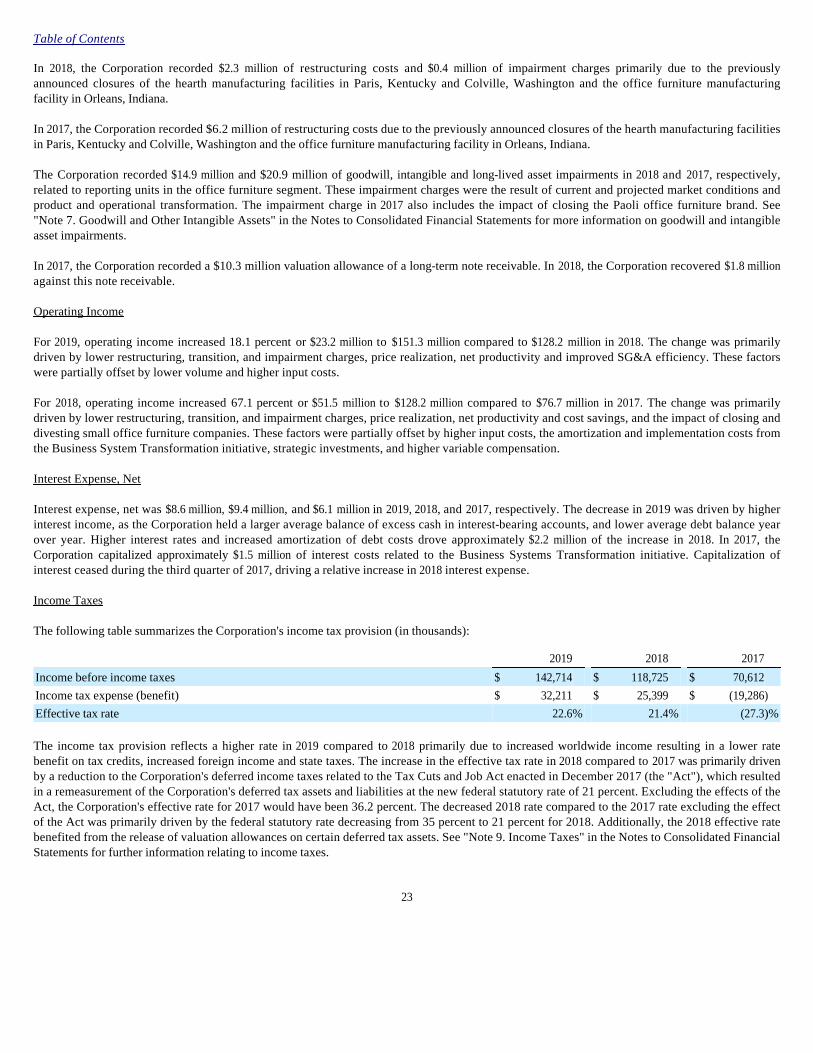
Table of Contents In 2018, the Corporation recorded $2.3 million of restructuring costs and $0.4 million of impairment charges primarily due to the previously announced closures of the hearth manufacturing facilities in Paris, Kentucky and Colville, Washington and the office furniture manufacturing facility in Orleans, Indiana. In 2017, the Corporation recorded $6.2 million of restructuring costs due to the previously announced closures of the hearth manufacturing facilities in Paris, Kentucky and Colville, Washington and the office furniture manufacturing facility in Orleans, Indiana. The Corporation recorded $14.9 million and $20.9 million of goodwill, intangible and long-lived asset impairments in 2018 and 2017, respectively, related to reporting units in the office furniture segment. These impairment charges were the result of current and projected market conditions and product and operational transformation. The impairment charge in 2017 also includes the impact of closing the Paoli office furniture brand. See "Note 7. Goodwill and Other Intangible Assets" in the Notes to Consolidated Financial Statements for more information on goodwill and intangible asset impairments. In 2017, the Corporation recorded a $10.3 million valuation allowance of a long-term note receivable. In 2018, the Corporation recovered $1.8 million against this note receivable. Operating Income For 2019, operating income increased 18.1 percent or $23.2 million to $151.3 million compared to $128.2 million in 2018. The change was primarily driven by lower restructuring, transition, and impairment charges, price realization, net productivity and improved SG&A efficiency. These factors were partially offset by lower volume and higher input costs. For 2018, operating income increased 67.1 percent or $51.5 million to $128.2 million compared to $76.7 million in 2017. The change was primarily driven by lower restructuring, transition, and impairment charges, price realization, net productivity and cost savings, and the impact of closing and divesting small office furniture companies. These factors were partially offset by higher input costs, the amortization and implementation costs from the Business System Transformation initiative, strategic investments, and higher variable compensation. Interest Expense, Net Interest expense, net was $8.6 million, $9.4 million, and $6.1 million in 2019, 2018, and 2017, respectively. The decrease in 2019 was driven by higher interest income, as the Corporation held a larger average balance of excess cash in interest-bearing accounts, and lower average debt balance year over year. Higher interest rates and increased amortization of debt costs drove approximately $2.2 million of the increase in 2018. In 2017, the Corporation capitalized approximately $1.5 million of interest costs related to the Business Systems Transformation initiative. Capitalization of interest ceased during the third quarter of 2017, driving a relative increase in 2018 interest expense. Income Taxes The following table summarizes the Corporation's income tax provision (in thousands):
The income tax provision reflects a higher rate in 2019 compared to 2018 primarily due to increased worldwide income resulting in a lower rate benefit on tax credits, increased foreign income and state taxes. The increase in the effective tax rate in 2018 compared to 2017 was primarily driven by a reduction to the Corporation's deferred income taxes related to the Tax Cuts and Job Act enacted in December 2017 (the "Act"), which resulted in a remeasurement of the Corporation's deferred tax assets and liabilities at the new federal statutory rate of 21 percent. Excluding the effects of the Act, the Corporation's effective rate for 2017 would have been 36.2 percent. The decreased 2018 rate compared to the 2017 rate excluding the effect of the Act was primarily driven by the federal statutory rate decreasing from 35 percent to 21 percent for 2018. Additionally, the 2018 effective rate benefited from the release of valuation allowances on certain deferred tax assets. See "Note 9. Income Taxes" in the Notes to Consolidated Financial Statements for further information relating to income taxes.
23
2019 2018 2017 Income before income taxes $ 142,714 $ 118,725 $ 70,612 Income tax expense (benefit) $ 32,211 $ 25,399 $ (19,286 )
Effective tax rate 22.6 % 21.4 % (27.3 )%

Table of Contents Net Income Attributable to HNI Corporation Net income attributable to the Corporation was $110.5 million or $2.54 per diluted share in 2019 compared to $93.4 million or $2.11 per diluted share in 2018 and $89.8 million or $2.00 per diluted share in 2017. Office Furniture The following table presents certain key highlights from the results of operations in the office furniture segment (in thousands):
Net sales in 2019 for the office furniture segment decreased 0.5 percent or $8.9 million compared to 2018. The change was driven by a decrease in both the office furniture and hearth products segments. The decrease in office furniture was driven by lower sales in the office furniture supplies-driven business, partially offset by a small increase in the office furniture contract business. Included in the sales results for the office furniture contract business was a $23.1 million negative impact from closing and divesting small office furniture companies. Net sales in 2018 for the office furniture segment increased 2.7 percent or $45.4 million compared to 2017. Sales increased in both the supplies-driven and contract businesses. The sales increase was partially offset by a decrease of $57.6 million from the impact of closing and divesting small office furniture companies. Operating profit as a percentage of net sales increased 160 basis points in 2019 compared to 2018. The increase was primarily driven by lower restructuring, impairment and transition charges, along with price realization, net productivity, and improved SG&A efficiency. These factors were partially offset by lower volume and higher input costs. Operating profit as a percentage of net sales increased 150 basis points in 2018 compared to 2017. The increase was primarily driven by lower restructuring, impairment and transition charges, along with price realization, net productivity and cost savings, and the impact of closing and divesting small office furniture companies. These factors were partially offset by higher input costs, amortization and implementation costs from the Business Systems Transformation initiative, and strategic investments. In 2019, the office furniture segment recorded $2.4 million of restructuring costs and $0.2 million of transition costs primarily associated with structural realignments in the office furniture segment. Specific items incurred include severance and member relocation costs. In 2018, the office furniture segment recorded $1.5 million of restructuring costs and $1.6 million of transition costs primarily associated with the previously announced closure of the office furniture manufacturing facility in Orleans, Indiana and structural realignments in China. Specific items incurred include severance, production move costs, and final facility closing costs. Of these charges, $1.6 million was included in cost of sales. The office furniture segment also recorded impairments of $14.9 million of goodwill and long-lived assets related to reporting units in the segment. In 2017, the office furniture segment recorded $11.6 million of restructuring costs and $13.7 million of transition costs associated with the previously announced closure of the office furniture manufacturing facility in Orleans, Indiana and structural realignments in China and between office furniture facilities in Muscatine, Iowa. Specific items incurred include severance, accelerated depreciation, and production move costs. Of these charges, $21.5 million was included in cost of sales. The office furniture segment also recorded a loss of $4.8 million related to the disposal of a manufacturing facility and $20.9 million of goodwill and intangible asset impairments related to reporting units in the office furniture segment, of which $16.1 million of the goodwill and intangible asset impairment charges related to the closure of the Paoli office furniture brand.
24
2019 Change 2018 Change 2017 Net sales $ 1,697,186 (0.5 )% $ 1,706,092 2.7 % $ 1,660,723 Operating profit $ 103,894 36.8 % $ 75,965 51.4 % $ 50,176 Operating profit % 6.1 % 160 bps 4.5 % 150 bps 3.0 %

Table of Contents Hearth Products The following table presents certain key highlights from the results of operations in the hearth products segment (in thousands):
Net sales in 2019 for the hearth products segment decreased 0.4 percent or $2.0 million compared to 2018. The change was driven by decreases in both the new construction and retail businesses. Net sales in 2018 for the hearth products segment increased 7.1 percent or $36.6 million compared to 2017. The change was driven by an increase in both the new construction and retail businesses. Operating profit as a percentage of net sales increased 60 basis points in 2019 compared to 2018. The increase in operating profit was primarily driven by price realization, lower variable compensation, and improved SG&A efficiency. These factors were partially offset by lower volume and higher input costs. Operating profit as a percentage of net sales increased 40 basis points in 2018 compared to 2017. The increase in operating profit was primarily driven by higher volume, net productivity and cost savings, and price realization. These factors were partially offset by higher input costs and higher variable compensation. In 2018, the hearth products segment recorded $0.8 million of restructuring and $0.4 million of impairment charges along with $0.6 million of transition costs associated with the previously announced closures of the hearth manufacturing facilities in Paris, Kentucky and Colville, Washington. Specific items incurred include an impairment charge from the sale of the closed manufacturing facility in Paris, Kentucky, severance, production move costs, and final facility closing costs. Of these charges, $0.6 million was included in cost of sales. In 2017, the hearth products segment recorded $4.9 million of restructuring costs and $3.3 million of transition costs associated with the previously announced closures of the hearth manufacturing facilities in Paris, Kentucky and Colville, Washington. Specific items incurred include severance, accelerated depreciation, and production move costs. Of these charges, $5.8 million was included in cost of sales. The hearth products segment also recorded a $6.0 million nonrecurring gain from the sale and license of an intangible asset and a $0.8 million gain on the sale of a closed facility. Liquidity and Capital Resources Cash, cash equivalents, and short-term investments totaled $53.2 million at the end of 2019 compared to $78.1 million at the end of 2018 and $25.4 million at the end of 2017. These funds, coupled with cash flow from future operations, borrowing capacity under the existing credit agreement, and the ability to access capital markets, are expected to be adequate to fund operations and satisfy cash flow needs for at least the next twelve months. Additionally, based on current earnings before interest, taxes, depreciation and amortization generation, the Corporation can access the full remaining $375 million of borrowing capacity available under the revolving credit facility and maintain compliance with applicable covenants. As of the end of 2019, $12.3 million of cash was held overseas and considered permanently reinvested. If such amounts were repatriated, it could result in additional foreign withholding and state tax expense to the Corporation. The Corporation does not believe treating this cash as permanently reinvested will have any impact on the ability of the Corporation to meet its obligations as they come due. Cash Flow – Operating Activities Operating activities were a source of $219.4 million of cash in 2019 compared to a source of $186.4 million cash in 2018. The higher cash generation compared to the prior year was primarily due to improved earnings and changes in working capital timing, driven by higher accrued expenses. Changes in working capital balances resulted in a $3.3 million use of cash in 2019 compared to a $10.7 million use of cash in the prior year. Cash generated from operating activities in 2017 totaled $133.1 million and changes in working capital balances resulted in a $29.4 million use of cash. The Corporation places special emphasis on management and control of working capital, including accounts receivable and inventory. Management believes recorded trade receivable valuation allowances at the end of 2019 are adequate to cover the risk of potential bad debts. Allowances for non-collectible trade receivables, as a percent of gross trade receivables, totaled 1.3 percent,
25
2019 Change 2018 Change 2017 Net sales $ 549,761 (0.4 )% $ 551,803 7.1 % $ 515,159 Operating profit $ 94,329 3.2 % $ 91,367 9.2 % $ 83,649 Operating profit % 17.2 % 60 bps 16.6 % 40 bps 16.2 %

Table of Contents 1.5 percent, and 0.7 percent at the end of fiscal years 2019, 2018, and 2017, respectively. The Corporation’s inventory turns were 8.8, 9.1, and 8.9, for fiscal years 2019, 2018, and 2017, respectively. Cash Flow – Investing Activities Capital expenditures, including capitalized software, were $66.9 million in 2019, $63.7 million in 2018, and $127.4 million in 2017. These expenditures are primarily focused on machinery, equipment, and tooling required to support new products, continuous improvements, and cost savings initiatives in manufacturing processes. The decrease between 2018 and 2017 was primarily due to the completion of the Corporation's operational transformations and the launch of the Business Systems Transformation initiative which included an integrated information system. The Corporation anticipates capital expenditures for 2020 in an estimated range of $60 million to $70 million. Real Estate Transaction – In the first quarter of 2018, the Corporation entered into a sale-leaseback transaction, selling a manufacturing facility and subsequently leasing back a portion of the facility for a term of 10 years. The net proceeds from the sale of the facility of $16.9 million are reflected in "Proceeds from sale and license of property, plant, equipment, and intangibles" in the Consolidated Statements of Cash Flows. See "Note 15. Leases" in the Notes to Consolidated Financial Statements for further information. Cash Flow – Financing Activities Long-Term Debt - The Corporation maintains a revolving credit facility as the primary source of committed funding from which the Corporation finances its planned capital expenditures, strategic initiatives, and seasonal working capital needs. Cash flows included in financing activities represent periodic borrowings and repayments under the revolving credit facility. During the second quarter of 2018, the Corporation issued $100 million of private placement notes. The proceeds were used to repay outstanding borrowings under the revolving credit facility. See "Note 8. Long-Term Debt" in the Notes to Consolidated Financial Statements for further information. Dividend - The Corporation is committed to maintaining or modestly growing the quarterly dividend. Cash dividends declared and paid per share are as follows (in dollars):
The last quarterly dividend increase was from $0.295 to $0.305 per common share effective with the June 3, 2019 dividend payment for shareholders of record at the close of business on May 17, 2019. The average dividend payout percentage for the most recent three-year period has been 57 percent of prior year earnings or 28 percent of prior year cash flow from operating activities. Stock Repurchase - The Corporation’s capital strategy related to stock repurchase is focused on offsetting the dilutive impact of issuances for various compensation related matters. The Corporation may elect to opportunistically purchase additional shares based on excess cash generation and/or share price considerations. The Board authorized $200 million on November 9, 2007 and an additional $200 million each on November 7, 2014 and February 13, 2019 for repurchases of the Corporation’s common stock. See "Note 11. Accumulated Other Comprehensive Income (Loss) and Shareholders' Equity" in the Notes to Consolidated Financial Statements for further information. Contractual Obligations The following table discloses the Corporation's obligations and commitments to make future payments, by period, under contracts (in thousands):
26
2019 2018 2017 Common shares $ 1.21 $ 1.17 $ 1.13
Less than
1 Year 1 – 3 Years
3 – 5 Years
More than 5 Years Total
Long-term debt obligations, including estimated interest (1) $ 8,066 $ 14,388 $ 84,489 $ 108,396 $ 215,339 Finance lease obligations 630 1,118 548 — 2,296 Operating lease obligations 25,181 31,651 15,751 17,609 90,192 Purchase obligations (2) 73,626 7,046 2,353 2,455 85,480 Other long-term obligations (3) 1,931 9,144 2,709 23,004 36,788
Total $ 109,434 $ 63,347 $ 105,850 $ 151,464 $ 430,095

Table of Contents
Litigation and Uncertainties See "Note 16. Guarantees, Commitments, and Contingencies" in the Notes to Consolidated Financial Statements for further information. Looking Ahead Management remains optimistic about the long-term prospects in the office furniture and hearth markets. Management believes the Corporation continues to compete well and remains confident the investments made in the business will continue to generate strong returns for shareholders. Off-Balance Sheet Arrangements The Corporation does not have any off-balance sheet arrangements that have or are reasonably likely to have a current or future material effect on the Corporation's financial condition, revenues or expenses, results of operations, liquidity, capital expenditures, or capital resources.
27
(1) Interest has been included for all debt at the fixed or variable rate in effect as of December 28, 2019, as applicable. See "Note 8. Long-Term Debt" in the Notes to Consolidated Financial Statements for further information.
(2) Purchase obligations include agreements to purchase goods or services that are enforceable, legally binding, and specify all significant terms, including the quantity to be purchased, the price to be paid, and the timing of the purchase.
(3) Other long-term obligations represent payments due to members who are participants in the Corporation’s deferred and long-term incentive compensation programs, liability for unrecognized tax liabilities, and contribution and benefit payments expected to be made pursuant to the Corporation’s post-retirement benefit plans. It should be noted the obligations related to post-retirement benefit plans are not contractual and the plans could be amended at the discretion of the Corporation. The disclosure of contributions and benefit payments has been limited to 10 years, as information beyond this time period was not available. Other long-term obligations of $33.1 million, primarily insurance allowances and long-term warranty, are not included in the table above due to the Corporation's inability to predict their timing.

Table of Contents Critical Accounting Policies and Estimates General Management’s Discussion and Analysis of Financial Condition and Results of Operations is based upon the Consolidated Financial Statements, prepared in accordance with Generally Accepted Accounting Principles ("GAAP"). The preparation of these financial statements requires management to make estimates and assumptions that affect the reported amounts of assets, liabilities, revenue and expenses, and related disclosure of contingent assets and liabilities. Management bases its estimates on historical experience and on various other assumptions that are believed to be reasonable under the circumstances, the results of which form the basis for making judgments about the carrying values of assets and liabilities that are not readily apparent from other sources. Senior management has discussed the development, selection, and disclosure of these estimates with the Audit Committee of the Board. Actual results may differ from these estimates under different assumptions or conditions. An accounting policy is deemed to be critical if it requires an accounting estimate to be made based on assumptions about matters uncertain at the time the estimate is made, and if different estimates that reasonably could have been used, or changes in the accounting estimates that are reasonably likely to occur periodically, could materially impact the financial statements. Management believes the following critical accounting policy reflects its more significant estimates and assumptions used in the preparation of the Consolidated Financial Statements. Goodwill The Corporation evaluates its goodwill for impairment on an annual basis during the fourth quarter or whenever indicators of impairment exist. Asset impairment charges associated with the Corporation’s goodwill impairment testing are discussed in "Note 7. Goodwill and Other Intangible Assets" in the Notes to Consolidated Financial Statements. The Corporation reviews goodwill at the reporting unit level within its office furniture and hearth products operating segments. These reporting units constitute components for which discrete financial information is available and regularly reviewed by segment management. The accounting standards for goodwill permit entities to first assess qualitative factors to determine whether it is more likely than not the fair value of a reporting unit is less than its carrying amount as a basis for determining whether it is necessary to perform a quantitative goodwill impairment test. If the quantitative test is required, the Corporation estimates the fair value of its reporting units. In estimating the fair value, the Corporation relies on an average of the income approach and the market approach. In the income approach, the estimate of fair value of each reporting unit is based on management’s projection of revenues, gross margin, operating costs, and cash flows considering historical and estimated future results, general economic and market conditions, as well as the impact of planned business and operational strategies. The valuations employ present value techniques to measure fair value and consider market factors. In the market approach, the Corporation utilizes the guideline company method, which involves calculating valuation multiples based on operating data from guideline publicly-traded companies. These multiples are then applied to the operating data for the reporting units and adjusted for factors similar to those used in the discounted cash flow analysis. Management believes the assumptions used for the impairment test are consistent with those utilized by a market participant in performing similar valuations of its reporting units. Management bases its fair value estimates on assumptions they believe to be reasonable at the time, but such assumptions are subject to inherent uncertainty. Actual results may differ from those estimates. Additionally, the Corporation compares the estimated aggregate fair value of its reporting units to its overall market capitalization. Assessing the fair value of goodwill includes, among other things, making key assumptions for estimating future cash flows and appropriate market multiples. These assumptions are subject to a high degree of judgment and complexity. The Corporation makes every effort to estimate future cash flows as accurately as possible with the information available at the time the forecast is developed. However, changes in assumptions and estimates may affect the estimated fair value of the reporting unit, and could result in an impairment charge in future periods. Factors that have the potential to create variances in the estimated fair value of the reporting unit include, but are not limited to, economic conditions in the United States and other countries where the Corporation has a presence, competitor behavior, the mix of product sales, commodity costs, wage rates, the level of manufacturing capacity, the pricing environment, and currency exchange fluctuations. In addition, estimates of fair value are impacted by estimates of the market-participant derived weighted average cost of capital. The key to recoverability of goodwill is the forecast of economic conditions and its impact on future revenues, operating profit, and cash flows. Management’s projection for the United States office furniture and domestic hearth markets and global economic conditions is inherently subject to a number of uncertain factors, such as global economic improvement, the U.S housing market, credit availability and borrowing rates, and overall consumer confidence. In the near term, as management monitors the above factors, it is possible it may change the revenue and cash flow projections of certain reporting units, which may require the recording of additional goodwill impairment charges.
28

Table of Contents Recently Issued Accounting Standards Not Yet Adopted In June 2016, the FASB issued ASU No. 2016-13, Measurement of Credit Losses on Financial Instruments and also issued subsequent amendments to the initial guidance: ASU 2018-09, ASU 2019-04, ASU 2019-05, and ASU 2019-11 (collectively, Topic 326). Topic 326 replaces the incurred loss impairment methodology in current GAAP with a methodology that reflects expected credit losses by requiring consideration of a broader range of reasonable and supportable information and is intended to provide financial statement users with more useful information about expected credit losses on financial instruments. Topic 326 becomes effective for the Corporation in fiscal 2020 and requires a cumulative effect adjustment in retained earnings as of the beginning of the year of adoption. The Corporation anticipates the standard will not have a material effect on consolidated financial statements and related disclosures. In December 2019, the FASB issued ASU No. 2019-12, Simplifying the Accounting for Income Taxes. This update simplifies various aspects related to accounting for income taxes, removes certain exceptions to the general principles in ASC 740, and clarifies and amends existing guidance to improve consistent application. The new standard becomes effective for the Corporation in fiscal 2021. The Corporation is currently evaluating the effect the standard will have on consolidated financial statements and related disclosures. Item 7A. Quantitative and Qualitative Disclosures About Market Risk During the normal course of business, the Corporation is subjected to market risk associated with interest rate movements. Interest rate risk arises from variable interest debt obligations. The interest rate swap derivative instruments are held and used by the Corporation as a tool for managing interest rate risk. They are not used for trading or speculative purposes. As of December 28, 2019, the Corporation had $75 million of debt outstanding under the Corporation's $450 million revolving credit facility, which bore variable interest based on one month LIBOR. As of December 28, 2019, the Corporation had an interest rate swap agreement in place to fix the interest rate on $75 million of the Corporation's revolving credit facility. Under the terms of this interest rate swap, the Corporation pays a fixed rate of 1.42 percent. As of December 28, 2019 the Corporation had no borrowings on the revolving credit facility in excess of the amount covered by the interest rate swap agreement. The Corporation expects to utilize additional borrowings over the course of the year which will be subject to the variable borrowings rate as defined. The Corporation monitors market interest rate risk exposures. As the Corporation holds no borrowings subject to variable interest rate exposure as of December 28, 2019 there is not current exposure given the current borrowings outstanding. The impacts of any hypothetical changes in interest rates will be directly correlated to any necessary future borrowings above the current levels outstanding. For information related to the Corporation’s long-term debt, refer to "Note 8. Long-Term Debt" in the Notes to Consolidated Financial Statements. For information related to the Corporation's interest rate swap activity, refer to "Note 11. Accumulated Other Comprehensive Income (Loss) and Shareholders’ Equity" in the Notes to Consolidated Financial Statements. The Corporation currently does not have significant foreign currency exposure. The Corporation is exposed to risks arising from price changes and/or tariffs for certain direct materials and assembly components used in its operations. The most significant material purchases and cost for the Corporation are for steel, plastics, textiles, wood particleboard, and cartoning. The market price of plastics and textiles, in particular, are sensitive to the cost of oil and natural gas. The cost of wood particleboard has been impacted by continued industry downsizing of production capacity as well as increased volatility in input and transportation costs. All of these materials are impacted increasingly by global market pressure. The Corporation works to offset these increased costs through global sourcing initiatives, product re-engineering, and price increases on its products. Margins have been negatively impacted in the past due to the lag between cost increases and the Corporation’s ability to increase its prices. The Corporation believes future market price increases on its key direct materials and assembly components are likely. Consequently, it views the prospect of such increases as a risk to the business. Item 8. Financial Statements and Supplementary Data The financial statements listed under Item 15(a)(1) and (2) are filed as part of this report and are incorporated herein by reference. The Summary of Quarterly Results of Operations (Unaudited) follows the Notes to Consolidated Financial Statements filed as part of this report and are incorporated herein by reference.
29
Table of Contents Item 9. Changes in and Disagreements with Accountants on Accounting and Financial Disclosure None. Item 9A. Controls and Procedures Evaluation of Disclosure Controls and Procedures Disclosure controls and procedures are designed to ensure that information required to be disclosed by the Corporation in the reports it files or submits under the Securities Exchange Act of 1934 (the "Exchange Act") is recorded, processed, summarized, and reported within the time periods specified in the Securities and Exchange Commission's rules and forms. Disclosure controls and procedures are also designed to ensure information is accumulated and communicated to management, including the Chief Executive Officer and Chief Financial Officer, as appropriate, to allow timely decisions regarding required disclosure. Under the supervision and with the participation of the Chief Executive Officer and Chief Financial Officer of the Corporation, the Corporation's management carried out an evaluation of the Corporation’s disclosure controls and procedures pursuant to Exchange Act Rules 13a – 15(e) and 15d – 15(e) as of the end of the period covered by this Annual Report on Form 10-K. As of December 28, 2019, based on this evaluation, the Chief Executive Officer and Chief Financial Officer have concluded these disclosure controls and procedures are effective. Changes in Internal Controls The Corporation implemented ASU No. 2016-02, Leases (Topic 842), at the beginning of fiscal 2019 using the modified-retrospective transition approach. The new standard requires lessees to recognize most leases, including operating leases, on-balance sheet via a right of use asset and lease liability. The Corporation selected a technology tool to assist with the accounting and disclosure requirements of the new standard. All necessary changes required by the new standard, including those to the Corporation's accounting policies, business process, systems, controls, and disclosures, were identified and implemented as of the first quarter 2019. Except for the implementation of the new lease standard, there have been no changes in the Corporation's internal control over financial reporting during the fiscal year ended December 28, 2019 that have materially affected, or are reasonably likely to materially affect, its internal control over financial reporting. Management's Report on Internal Control over Financial Reporting Management’s annual report on internal control over financial reporting and the attestation report of the Corporation’s independent registered public accounting firm are included in Item 15. Exhibits, Financial Statement Schedules of this report under the headings "Management Report on Internal Control Over Financial Reporting" and "Report of Independent Registered Public Accounting Firm," respectively, and management's annual report is incorporated herein by reference. Item 9B. Other Information None.
30

Table of Contents
PART III Item 10. Directors, Executive Officers, and Corporate Governance The information under the caption "Corporate Governance and Board Matters" of the Corporation's Definitive Proxy Statement on Schedule 14A for the Annual Meeting of Shareholders to be held on May 5, 2020 (the "2020 Proxy Statement") is incorporated herein by reference. For information with respect to executive officers of the Corporation, see "Table I - Information about our Executive Officers" included in Part I of this report. Information relating to the identification of the audit committee and audit committee financial expert of the Corporation is contained under the caption "Directors" of the 2020 Proxy Statement and is incorporated herein by reference. Code of Ethics The information under the caption "Code of Ethics" of the 2020 Proxy Statement is incorporated herein by reference. Item 11. Executive Compensation The information under the captions "Executive Compensation" and "Director Compensation" of the 2020 Proxy Statement is incorporated herein by reference. Item 12. Security Ownership of Certain Beneficial Owners and Management and Related Shareholder Matters The information under the captions "Beneficial Ownership of the Corporation's Stock" and "Equity Compensation Plan Information" of the 2020 Proxy Statement is incorporated herein by reference. Item 13. Certain Relationships and Related Transactions, and Director Independence The information under the caption "Corporate Governance and Board Matters" of the 2020 Proxy Statement is incorporated herein by reference. Item 14. Principal Accounting Fees and Services The information under the caption "Audit and Non-Audit Fees" of the 2020 Proxy Statement is incorporated herein by reference.
31

Table of Contents
PART IV Item 15. Exhibits, Financial Statement Schedules
(a)(1) Financial Statements
The following consolidated financial statements of the Corporation and its subsidiaries included in the Corporation's 2019 Annual Report on Form 10-K are filed as a part of this Report pursuant to Item 8:
(2) Financial Statement Schedules
All other schedules for which provision is made in the applicable accounting regulation of the SEC are not required under the related instructions or are inapplicable and, therefore, have been omitted.
(b) Exhibits
32
Page
Management Report on Internal Control Over Financial Reporting 36
Report of Independent Registered Public Accounting Firm 37
Consolidated Statements of Comprehensive Income for the Years Ended December 28, 2019, December 29, 2018, and December 30, 2017
39
Consolidated Balance Sheets - December 28, 2019 and December 29, 2018 40
Consolidated Statements of Equity for the Years Ended December 28, 2019, December 29, 2018, and December 30, 2017 42
Consolidated Statements of Cash Flows for the Years Ended December 28, 2019, December 29, 2018, and December 30, 2017
43
Notes to Consolidated Financial Statements 44
Summary of Quarterly Results of Operations (Unaudited) 73
(3.1) Amended and Restated Articles of Incorporation of HNI Corporation (incorporated by reference to Exhibit 3.1 to the Registrant's Annual Report on Form 10-K for the year ended January 2, 2010)
(3.2) Second Amended and Restated By-laws of HNI Corporation (incorporated by reference to Exhibit 3.1 to the Registrant's Current Report on Form 8-K filed August 7, 2018)
(4.1) Description of Securities of HNI Corporation+
(10.1) Third Amended and Restated Credit Agreement, dated April 20, 2018, among HNI Corporation, as borrower, certain domestic subsidiaries of HNI Corporation, as guarantors, certain lenders and Wells Fargo Bank, National Association, as administrative agent (incorporated by reference to Exhibit 10.1 to the Registrant's Current Report on Form 8-K filed April 24, 2018)
(10.2) Note Purchase Agreement, dated May 31, 2018, among HNI Corporation and the purchasers named therein (incorporated by reference to Exhibit 10.1 to the Registrant's Current Report on Form 8-K filed May 31, 2018)
(10.3) Guaranty Agreement, dated May 31, 2018, made by each of the guarantors named therein (incorporated by reference to Exhibit 10.2 to the Registrant's Current Report on Form 8-K filed May 31, 2018)
(10.4) HNI Corporation 2007 Stock-Based Compensation Plan, as amended (incorporated by reference to Appendix A to the Corporation's Definitive Proxy Statement filed with the SEC March 23, 2015)*
(10.5) Amended Form of HNI Corporation 2007 Stock-Based Compensation Plan Stock Option Award Agreement (incorporated by reference to Exhibit 10.1 to the Registrant's Current Report on Form 8-K filed March 22, 2018)*
(10.6) Form of HNI Corporation 2007 Stock-Based Compensation Plan Restricted Stock Unit Award Agreement (incorporated by reference to Exhibit 10.1 to the Registrant's Quarterly Report on Form 10-Q for the quarter ended April 3, 2010)*
(10.7) HNI Corporation 2017 Stock-Based Compensation Plan (incorporated by reference to Exhibit 4.3 to the Corporation's Form S-8 filed May 9, 2017)*

Table of Contents
* Indicates management contract or compensatory plan. + Filed or furnished herewith.
Item 16. Form 10-K Summary None.
33
(10.8) Amended form of HNI Corporation 2017 Stock-Based Compensation Plan Stock Option Award Agreement (incorporated by reference to Exhibit 10.2 to the Registrant’s Current Report on Form 8-K filed March 22, 2018)*
(10.9) Form of HNI Corporation 2017 Stock-Based Compensation Plan Restricted Stock Unit Award Agreement (incorporated by reference to Exhibit 10.2 to the Registrant’s Quarterly Report on Form 10-Q for the quarter ended September 30, 2017)*
(10.10) 2017 Equity Plan for Non-Employee Directors of HNI Corporation (incorporated by reference to Exhibit 4.4 to the Registrant’s Form S-8 filed May 9, 2017)*
(10.11) Form of 2017 Equity Plan for Non-Employee Directors of HNI Corporation Participation Agreement (incorporated by reference to Exhibit 10.3 to the Registrant's Quarterly Report on Form 10-Q for the quarter ended September 30, 2017)*
(10.12) Form of HNI Corporation Change In Control Employment Agreement (incorporated by reference to Exhibit 10.1 to the Registrant’s Current Report on Form 8-K filed June 29, 2018)*
(10.13) Form of HNI Corporation Amended and Restated Indemnity Agreement (incorporated by reference to Exhibit 10.1 to the Registrant’s Current Report on Form 8-K filed November 14, 2007)*
(10.14) HNI Corporation Supplemental Income Plan (f/k/a HNI Corporation ERISA Supplemental Retirement Plan), as amended and restated (incorporated by reference to Exhibit 10.4 to the Registrant's Current Report on Form 8-K filed February 22, 2010)*
(10.15) HNI Annual Incentive Plan, as amended (incorporated by reference to Appendix B to the Corporation's Definitive Proxy Statement filed with the SEC March 23, 2015)*
(10.16) HNI Corporation Long-Term Performance Plan, as amended (incorporated by reference to Appendix C to the Corporation’s Definitive Proxy Statement filed with the SEC March 23, 2015)*
(10.17) HNI Corporation Executive Deferred Compensation Plan, as amended (incorporated by reference to Exhibit 10.1 to the Registrant's Quarterly Report on Form 10-Q for the quarter ended July 4, 2015)*
(10.18) Form of HNI Corporation Executive Deferred Compensation Plan Deferral Election Agreement (incorporated by reference to Exhibit 10.25 to the Registrant's Annual Report on Form 10-K for the year ended January 2, 2010)*
(10.19) HNI Corporation Directors Deferred Compensation Plan, as amended (incorporated by reference to Exhibit 10.2 to the Registrant's Quarterly Report on Form 10-Q for the quarter ended July 4, 2015)*
(10.20) Form of HNI Corporation Directors Deferred Compensation Plan Deferral Election Agreement (incorporated by reference to Exhibit 10.6 to the Registrant's Annual Report on Form 10-K for the year ended January 2, 2010)*
(10.22) Amended form of HNI Corporation 2017 Stock-Based Compensation Plan Restricted Stock Unit Award Agreement*+
(10.23) Form of HNI Corporation 2017 Stock-Based Compensation Plan Performance Share Unit Award Agreement*+
(21) Subsidiaries of the Registrant+
(23.1) Consent of Independent Registered Public Accounting Firm+
(31.1) Certification of CEO pursuant to Section 302 of the Sarbanes-Oxley Act of 2002+
(31.2) Certification of CFO pursuant to Section 302 of the Sarbanes-Oxley Act of 2002+
(32.1) Certification of CEO and CFO Pursuant to 18 U.S.C. Section 1350, as Adopted Pursuant to Section 906 of the Sarbanes-Oxley Act of 2002+
101 The following materials from HNI Corporation's Annual Report on Form 10-K for the fiscal year ended December 28, 2019 are formatted in Inline XBRL (eXtensible Business Reporting Language) and filed electronically herewith: (i) Consolidated Statements of Comprehensive Income; (ii) Consolidated Balance Sheets; (iii) Consolidated Statements of Equity; (iv) Consolidated Statements of Cash Flows; and (v) Notes to Consolidated Financial Statements
104 Cover Page Interactive Data File (formatted as Inline XBRL and contained in Exhibit 101)

Table of Contents
34

Table of Contents
Signatures Pursuant to the requirements of Section 13 or 15(d) of the Securities Exchange Act of 1934, the registrant has duly caused this Annual Report on Form 10-K to be signed on its behalf by the undersigned, thereunto duly authorized.
Pursuant to the requirements of the Securities Exchange Act of 1934, this report has been signed below by the following persons on behalf of the registrant and in the capacities and on the dates indicated. Each Director whose signature appears below authorizes and appoints Jeffrey D. Lorenger as his or her attorney-in-fact to sign and file on his or her behalf any and all amendments and post-effective amendments to this report.
35
HNI Corporation
Date: February 25, 2020 By: /s/ Jeffrey D. Lorenger
Name: Jeffrey D. Lorenger
Title: Chairman, President, and Chief Executive Officer
Signature Title Date
/s/ Jeffrey D. Lorenger Chairman, President, and CEO, Principal Executive Officer, and Director February 25, 2020
Jeffrey D. Lorenger
/s/ Marshall H. Bridges
Senior Vice President, Chief Financial Officer, Principal Financial Officer, and Principal Accounting Officer February 25, 2020
Marshall H. Bridges
/s/ Mary A. Bell Director February 25, 2020
Mary A. Bell
/s/ Miguel M. Calado Director February 25, 2020
Miguel M. Calado
/s/ Cheryl A. Francis Director February 25, 2020
Cheryl A. Francis
/s/ John R. Hartnett Director February 25, 2020
John R. Hartnett
/s/ Mary K. W. Jones Director February 25, 2020
Mary K. W. Jones
/s/ Larry B. Porcellato Lead Director February 25, 2020
Larry B. Porcellato
/s/ Dhanusha Sivajee Director February 25, 2020
Dhanusha Sivajee
/s/ Abbie J. Smith Director February 25, 2020
Abbie J. Smith
/s/ Brian E. Stern Director February 25, 2020
Brian E. Stern
/s/ Ronald V. Waters, III Director February 25, 2020
Ronald V. Waters, III

Table of Contents
Management Report on Internal Control Over Financial Reporting Management of HNI Corporation is responsible for establishing and maintaining adequate internal control over financial reporting as defined in Rules 13a-15(f) and 15d-15(f) under the Securities Exchange Act of 1934. HNI Corporation’s internal control over financial reporting is a process designed to provide reasonable assurance regarding the reliability of financial reporting and the preparation of financial statements for external purposes in accordance with accounting principles generally accepted in the United States of America. HNI Corporation’s internal control over financial reporting includes those written policies and procedures that:
Internal control over financial reporting includes the controls themselves, monitoring (including internal auditing practices), and actions taken to correct deficiencies as identified. Because of its inherent limitations, internal control over financial reporting may not prevent or detect misstatements. Also, projections of any evaluation of effectiveness to future periods are subject to the risk controls may become inadequate because of changes in conditions, or the degree of compliance with the policies or procedures may deteriorate. Management assessed the effectiveness of HNI Corporation’s internal control over financial reporting as of December 28, 2019. Management based this assessment on criteria for effective internal control over financial reporting described in Internal Control – Integrated Framework (2013) issued by the Committee of Sponsoring Organizations of the Treadway Commission. Management’s assessment included an evaluation of the design of HNI Corporation’s internal control over financial reporting and testing of operational effectiveness of HNI Corporation’s internal control over financial reporting. Management reviewed the results of its assessment with the Audit Committee of the Board of Directors. Based on this assessment, management determined, as of December 28, 2019, HNI Corporation maintained effective internal control over financial reporting. The effectiveness of HNI Corporation’s internal control over financial reporting as of December 28, 2019 has been audited by KPMG LLP, an independent registered public accounting firm, as stated in its report which appears herein. February 25, 2020
36
• pertain to the maintenance of records that, in reasonable detail, accurately and fairly reflect the transactions and dispositions of the assets of HNI Corporation;
• provide reasonable assurance that transactions are recorded as necessary to permit preparation of financial statements in accordance with accounting principles generally accepted in the United States of America, and that receipts and expenditures of HNI Corporation are being made only in accordance with authorizations of management and directors of HNI Corporation; and
• provide reasonable assurance regarding prevention or timely detection of unauthorized acquisition, use, or disposition of assets that could have a material effect on the consolidated financial statements.

Table of Contents
Report of Independent Registered Public Accounting Firm The Shareholders and Board of Directors HNI Corporation: Opinions on the Consolidated Financial Statements and Internal Control Over Financial Reporting
We have audited the accompanying consolidated balance sheets of HNI Corporation and subsidiaries (the Company) as of December 28, 2019 and December 29, 2018, the related consolidated statements of comprehensive income, equity, and cash flows for each of the years in the three-year period ended December 28, 2019, and the related notes (collectively, the consolidated financial statements). We also have audited the Company’s internal control over financial reporting as of December 28, 2019, based on criteria established in Internal Control - Integrated Framework (2013) issued by the Committee of Sponsoring Organizations of the Treadway Commission.
In our opinion, the consolidated financial statements referred to above present fairly, in all material respects, the financial position of the Company as of December 28, 2019 and December 29, 2018, and the results of its operations and its cash flows for each of the years in the three-year period ended December 28, 2019, in conformity with U.S. generally accepted accounting principles. Also in our opinion, the Company maintained, in all material respects, effective internal control over financial reporting as of December 28, 2019 based on criteria established in Internal Control - Integrated Framework (2013) issued by the Committee of Sponsoring Organizations of the Treadway Commission.
Change in Accounting Principle
As discussed in Note 2 to the consolidated financial statements, the Company has changed its method of accounting for Leases in 2019 due to the adoption of Accounting Standards Update (ASU) No. 2016-02, “Leases”.
As discussed in Note 2 to the consolidated financial statements, the Company has changed its method of accounting for revenue recognition in 2018 due to the adoption of ASU No. 2014-09, "Revenue from Contracts with Customers".
Basis for Opinions
The Company’s management is responsible for these consolidated financial statements, for maintaining effective internal control over financial reporting, and for its assessment of the effectiveness of internal control over financial reporting, included in the accompanying Management Report on Internal Control over Financial Reporting. Our responsibility is to express an opinion on the Company’s consolidated financial statements and an opinion on the Company’s internal control over financial reporting based on our audits. We are a public accounting firm registered with the Public Company Accounting Oversight Board (United States) (PCAOB) and are required to be independent with respect to the Company in accordance with the U.S. federal securities laws and the applicable rules and regulations of the Securities and Exchange Commission and the PCAOB.
We conducted our audits in accordance with the standards of the PCAOB. Those standards require that we plan and perform the audits to obtain reasonable assurance about whether the consolidated financial statements are free of material misstatement, whether due to error or fraud, and whether effective internal control over financial reporting was maintained in all material respects.
Our audits of the consolidated financial statements included performing procedures to assess the risks of material misstatement of the consolidated financial statements, whether due to error or fraud, and performing procedures that respond to those risks. Such procedures included examining, on a test basis, evidence regarding the amounts and disclosures in the consolidated financial statements. Our audits also included evaluating the accounting principles used and significant estimates made by management, as well as evaluating the overall presentation of the consolidated financial statements. Our audit of internal control over financial reporting included obtaining an understanding of internal control over financial reporting, assessing the risk that a material weakness exists, and testing and evaluating the design and operating effectiveness of internal control based on the assessed risk. Our audits also included performing such other procedures as we considered necessary in the circumstances. We believe that our audits provide a reasonable basis for our opinions.
Definition and Limitations of Internal Control Over Financial Reporting
A company’s internal control over financial reporting is a process designed to provide reasonable assurance regarding the reliability of financial reporting and the preparation of financial statements for external purposes in accordance with generally accepted accounting principles. A company’s internal control over financial reporting includes those policies and procedures that (1) pertain to the maintenance of records that, in reasonable detail, accurately and fairly reflect the transactions and dispositions of the assets of the company; (2) provide reasonable assurance that transactions are recorded as necessary to permit preparation of financial statements in accordance with generally accepted accounting principles, and that receipts and expenditures of the company are being
37

Table of Contents made only in accordance with authorizations of management and directors of the company; and (3) provide reasonable assurance regarding prevention or timely detection of unauthorized acquisition, use, or disposition of the company’s assets that could have a material effect on the financial statements.
Because of its inherent limitations, internal control over financial reporting may not prevent or detect misstatements. Also, projections of any evaluation of effectiveness to future periods are subject to the risk that controls may become inadequate because of changes in conditions, or that the degree of compliance with the policies or procedures may deteriorate.
Critical Audit Matter
Assessment of the carrying value of goodwill in three of the Company’s reporting units
As discussed in Note 7 of the consolidated financial statements, the Company’s goodwill balance as of December 28, 2019 was $270.8 million or 19% of total assets. Of this amount, the goodwill associated with the three reporting units within the office furniture segment was $28.5 million, or 11% of goodwill. Annually, or whenever events and circumstances indicate that goodwill might be impaired, the Company performs goodwill impairment testing. Impairment occurs when the carrying value of a reporting unit exceeds its fair value. In performing the assessment of the carrying value, the Company estimates the fair value of each reporting unit using an average of values derived from an income approach (discounted projected cash flow method) and a market approach (guideline company method).
We identified the assessment of the carrying value of goodwill in three of the Company’s reporting units as a critical audit matter. The evaluation of projected revenue and gross margin, discount rate, and market multiple assumptions used in the income or market approaches to measure the estimated fair value of each of the three reporting units required challenging auditor judgment. Changes to those assumptions could have a significant effect on the estimated fair value of each of these three reporting units.
The primary procedures we performed to address this critical audit matter included the following. We tested certain internal controls over the Company’s goodwill impairment process, including controls related to development of the projected revenue and gross margin, discount rate, and market multiple assumptions. We evaluated the projected revenue for each of the three reporting units by comparing expected volume growth and price increases to market data, including third-party industry projections and economic forecasts, and historical Company growth rates and price increases. We evaluated the projected gross margin for each of the three reporting units by comparing expected gross margin changes to historical Company and peer company gross margin rates. We compared the Company’s historical revenue and gross margin projections to actual results to assess the Company’s ability to accurately forecast. We performed a sensitivity analysis over the Company’s discount rate assumptions to assess the impact on the Company’s estimate of the fair value of the reporting units. We involved a valuation professional with specialized skills and knowledge, who assisted in:
/s/ KPMG LLP
We have served as the Company’s auditor since 2015.
Chicago, Illinois February 25, 2020
38
• Evaluating the discount rate used by the Company in the income approach by comparing the Company’s inputs to the discount rate to publicly available data for comparable companies and assessing the resulting discount rate;
• Testing the estimated reporting unit fair value, using the Company’s discount rate and forecasted cash flows, and comparing the results to the reporting unit’s carrying value per the Company’s impairment tests.
• Assessing the guideline public companies and the selected multiples based on consideration of revenue growth, profitability, and size.

Table of Contents
Financial Statements
The accompanying notes are an integral part of the consolidated financial statements.
39
HNI Corporation and Subsidiaries Consolidated Statements of Comprehensive Income
(In thousands, except per share data)
2019 2018 2017 Net sales $ 2,246,947 $ 2,257,895 $ 2,175,882 Cost of sales 1,413,185 1,422,857 1,391,894
Gross profit 833,762 835,038 783,988 Selling and administrative expenses 680,049 691,140 671,831 Gain on sale, disposal, and license of assets, net — — (1,949)
Restructuring and impairment charges 2,371 15,725 37,416 Operating income 151,342 128,173 76,690
Interest expense, net 8,628 9,448 6,078 Income before income taxes 142,714 118,725 70,612
Income tax expense (benefit) 32,211 25,399 (19,286)
Net income 110,503 93,326 89,898 Less: Net income (loss) attributable to non-controlling interest (2) (51) 103
Net income attributable to HNI Corporation $ 110,505 $ 93,377 $ 89,795
Average number of common shares outstanding – basic 43,101 43,639 43,839
Net income attributable to HNI Corporation per common share – basic $ 2.56 $ 2.14 $ 2.05
Average number of common shares outstanding – diluted 43,495 44,328 44,840
Net income attributable to HNI Corporation per common share – diluted $ 2.54 $ 2.11 $ 2.00
Foreign currency translation adjustments $ 61 $ (3,004) $ 1,219 Change in unrealized gains (losses) on marketable securities, net of tax 251 (24) (27)
Change in pension and post-retirement liability, net of tax (2,833) 2,701 (463)
Change in derivative financial instruments, net of tax (1,953) 339 660
Other comprehensive income (loss), net of tax (4,474) 12 1,389 Comprehensive income 106,029 93,338 91,287
Less: Comprehensive income (loss) attributable to non-controlling interest (2) (51) 103
Comprehensive income attributable to HNI Corporation $ 106,031 $ 93,389 $ 91,184

Table of Contents
The accompanying notes are an integral part of the consolidated financial statements.
40
HNI Corporation and Subsidiaries Consolidated Balance Sheets
(In thousands)
December 28,
2019 December 29,
2018
Assets
Current Assets:
Cash and cash equivalents $ 52,073 $ 76,819 Short-term investments 1,096 1,327 Receivables 274,565 255,207 Inventories 163,465 157,178 Prepaid expenses and other current assets 37,635 41,352
Total Current Assets 528,834 531,883
Property, Plant, and Equipment:
Land and land improvements 29,394 28,377 Buildings 295,517 290,263 Machinery and equipment 581,225 565,884 Construction in progress 20,881 28,443
927,017 912,967 Less accumulated depreciation 545,510 528,034
Net Property, Plant, and Equipment 381,507 384,933
Right-of-use Operating / Finance Leases 75,012 —
Goodwill and Other Intangible Assets 445,709 463,290
Deferred Income Taxes 176 1,569
Other Assets 21,274 20,169
Total Assets $ 1,452,512 $ 1,401,844

Table of Contents
The accompanying notes are an integral part of the consolidated financial statements.
41
HNI Corporation and Subsidiaries Consolidated Balance Sheets
(In thousands, except par value)
December 28,
2019 December 29,
2018
Liabilities and Equity Current Liabilities:
Accounts payable and accrued expenses $ 453,202 $ 428,865 Current maturities of long-term debt 790 679 Current maturities of other long-term obligations 1,931 4,764 Current lease obligations - operating / finance 22,782 —
Total Current Liabilities 478,705 434,308
Long-Term Debt 174,439 249,355
Long-Term Lease Obligations - Operating / Finance 59,814 —
Other Long-Term Liabilities 67,990 72,767
Deferred Income Taxes 87,196 82,155
Equity:
HNI Corporation shareholders' equity:
Capital Stock:
Preferred stock - $1 par value, authorized 2,000 shares, no shares outstanding — — Common stock - $1 par value, authorized 200,000 shares, outstanding:
December 28, 2019 - 42,595 shares; December 29, 2018 - 43,582 shares 42,595 43,582
Additional paid-in capital 19,799 18,041 Retained earnings 529,723 504,909 Accumulated other comprehensive income (loss) (8,073) (3,599)
Total HNI Corporation shareholders' equity 584,044 562,933
Non-controlling interest 324 326
Total Equity 584,368 563,259
Total Liabilities and Equity $ 1,452,512 $ 1,401,844

Table of Contents
HNI Corporation and Subsidiaries Consolidated Statements of Equity
(In thousands, except per share data)
The accompanying notes are an integral part of the consolidated financial statements.
42
Common
Stock
Additional Paid-in Capital
Retained Earnings
Accumulated Other
Comprehensive Income (Loss)
Non-controlling
Interest
Total Shareholders'
Equity Balance, December 31, 2016 $ 44,079 $ — $ 461,524 $ (5,000) $ 406 $ 501,009 Comprehensive income:
Net income (loss) — — 89,795 — 103 89,898 Other comprehensive income (loss), net of tax — — — 1,389 — 1,389
Cash dividends; $1.130 per share — — (49,557) — — (49,557)
Common shares – treasury:
Shares purchased (1,463) (22,958) (34,466) — — (58,887)
Shares issued under Members' Stock Purchase Plan and stock awards, net of tax 738 29,987 — — — 30,725
Balance, December 30, 2017 $ 43,354 $ 7,029 $ 467,296 $ (3,611) $ 509 $ 514,577 Comprehensive income:
Net income (loss) — — 93,377 — (51) 93,326 Other comprehensive income (loss), net of tax — — — 12 — 12
Change in ownership of non-controlling interest — — (43) — (132) (175)
Cash dividends; $1.170 per share — — (51,085) — — (51,085)
Common shares – treasury: Shares purchased (755) (24,033) (4,636) — — (29,424)
Shares issued under Members' Stock Purchase Plan and stock awards, net of tax 983 35,045 — — — 36,028
Balance, December 29, 2018 $ 43,582 $ 18,041 $ 504,909 $ (3,599) $ 326 $ 563,259 Comprehensive income:
Net income (loss) — — 110,505 — (2) 110,503 Other comprehensive income (loss), net of tax — — — (3,735) — (3,735)
Reclassification of Stranded Tax Effects (ASU 2018-02) — — 739 (739) — — Impact of Implementation of Lease Guidance — — 2,999 — — 2,999 Cash dividends; $1.210 per share — — (52,232) — — (52,232)
Common shares – treasury:
Shares purchased (2,286) (44,424) (37,197) — — (83,907)
Shares issued under Members' Stock Purchase Plan and stock awards, net of tax 1,299 46,182 — — — 47,481
Balance, December 28, 2019 $ 42,595 $ 19,799 $ 529,723 $ (8,073) $ 324 $ 584,368

Table of Contents
The accompanying notes are an integral part of the consolidated financial statements.
43
HNI Corporation and Subsidiaries Consolidated Statements of Cash Flows
(In thousands)
2019 2018 2017 Net Cash Flows From (To) Operating Activities:
Net income $ 110,503 $ 93,326 $ 89,898 Non-cash items included in net income:
Depreciation and amortization 77,427 74,788 72,872 Other post-retirement and post-employment benefits 1,475 1,767 1,592 Stock-based compensation 6,830 7,317 7,750 Operating / finance lease interest and amortization 22,936 — — Deferred income taxes 6,750 3,197 (33,606 )
Loss on sale and retirement of long-lived assets, net 2,014 16,264 30,892 Other – net 3,593 (1,736 ) (1,949 )
Net increase (decrease) in operating assets and liabilities, net of divestitures (3,280 ) (10,729 ) (29,409 )
Increase (decrease) in other liabilities (8,868 ) 2,236 (4,891 )
Net cash flows from (to) operating activities 219,380 186,430 133,149 Net Cash Flows From (To) Investing Activities:
Capital expenditures (60,826 ) (55,648 ) (109,243 )
Proceeds from sale and license of property, plant, and equipment, and intangibles 327 23,767 9,009 Acquisition spending, net of cash acquired — (2,850 ) (898 )
Capitalized software (6,059 ) (8,048 ) (18,148 )
Purchase of investments (6,702 ) (2,676 ) (3,451 )
Sales or maturities of investments 4,845 3,100 3,197 Other – net 5,520 1,135 1,510
Net cash flows from (to) investing activities (62,895 ) (41,220 ) (118,024 )
Net Cash Flows From (To) Financing Activities:
Payments of long-term debt (215,934 ) (348,987 ) (276,736 )
Proceeds from long-term debt 141,035 323,075 339,337 Dividends paid (52,232 ) (51,085 ) (49,557 )
Purchase of HNI Corporation common stock (83,887 ) (30,452 ) (57,505 )
Proceeds from sales of HNI Corporation common stock 30,473 19,606 14,224 Other – net (686 ) (3,896 ) 2,148
Net cash flows from (to) financing activities (181,231 ) (91,739 ) (28,089 )
Net increase (decrease) in cash and cash equivalents (24,746 ) 53,471 (12,964 )
Cash and cash equivalents at beginning of period 76,819 23,348 36,312
Cash and cash equivalents at end of period $ 52,073 $ 76,819 $ 23,348

Table of Contents
HNI Corporation and Subsidiaries
Notes to Consolidated Financial Statements December 28, 2019
Note 1. Nature of Operations HNI Corporation with its subsidiaries (the "Corporation") is a provider of office furniture and hearth products. Refer to "Note 17. Reportable Segment Information" in the Notes to Consolidated Financial Statements for further information. Office furniture products include panel-based and freestanding furniture systems, seating, storage, tables, and architectural products. These products are sold primarily through a national system of independent dealers, wholesalers, and office product distributors but also directly to end-user customers and federal, state, and local governments. Hearth products include a full array of gas, wood, electric, and pellet fueled fireplaces, inserts, stoves, facings, and accessories. These products are sold through a national system of independent dealers and distributors, as well as Corporation-owned distribution and retail outlets. The Corporation’s products are marketed predominantly in the United States and Canada. The Corporation exports select products through its export subsidiary to a limited number of markets outside North America, principally the Middle East, Mexico, Latin America, and the Caribbean. The Corporation also manufactures and markets office furniture in Asia, primarily China and India. Fiscal year-end – The Corporation follows a 52/53-week fiscal year, which ends on the Saturday nearest December 31. Fiscal year 2019 ended on December 28, 2019, fiscal year 2018 ended on December 29, 2018, and fiscal year 2017 ended on December 30, 2017. The financial statements for fiscal years 2019, 2018, and 2017 are on a 52-week basis. A 53-week year occurs approximately every sixth year. Note 2. Summary of Significant Accounting Policies Principles of Consolidation The consolidated financial statements include the accounts and transactions of the Corporation and its subsidiaries. Intercompany accounts and transactions have been eliminated in consolidation. Cash, Cash Equivalents, and Investments Cash and cash equivalents generally consist of cash and money market accounts. The fair value approximates the carrying value due to the short duration of the securities. These securities have original maturity dates not exceeding three months. The Corporation has short-term investments with maturities of less than one year, as well as investments with maturities between one and five years. Management classifies investments in marketable securities at the time of purchase and reevaluates such classification at each balance sheet date. Debt securities, including government and corporate bonds, are classified as available-for-sale and stated at current market value with unrealized gains and losses included as a separate component of equity, net of any related tax effect. The specific identification method is used to determine realized gains and losses on the trade date. The Corporation's equity investment consists of an investment in a private entity and is carried at cost, as it does not have a readily determinable fair value. Cash, cash equivalents, and investments are reflected in the Consolidated Balance Sheets and were as follows (in thousands):
The following table summarizes the amortized cost basis of the debt securities (in thousands):
44
December 28, 2019 December 29, 2018
Cash and cash
equivalents Short-term
investments Other Assets Cash and cash
equivalents Short-term
investments Other Assets
Debt securities $ — $ 1,096 $ 11,566 $ — $ 1,327 $ 10,677 Equity investment — — 1,500 — — — Cash and money market accounts 52,073 — — 76,819 — —
Total $ 52,073 $ 1,096 $ 13,066 $ 76,819 $ 1,327 $ 10,677
December 28,
2019 December 29,
2018
Amortized cost basis of debt securities $ 12,542 $ 12,202
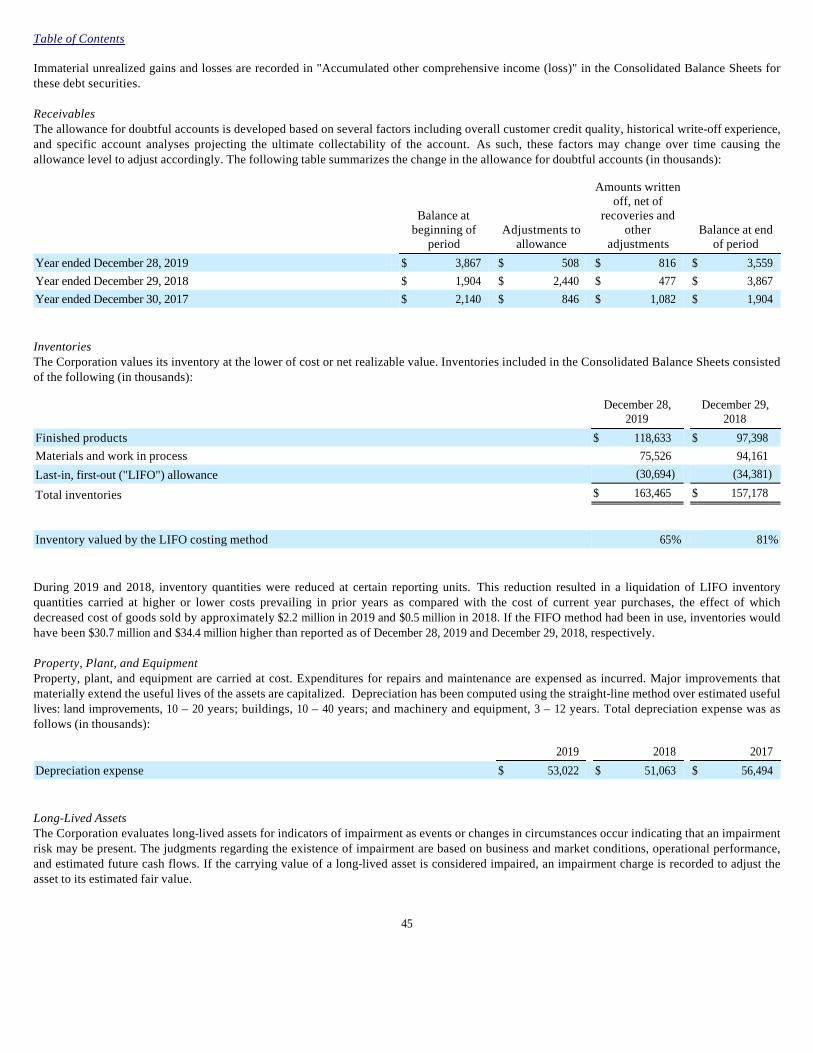
Table of Contents Immaterial unrealized gains and losses are recorded in "Accumulated other comprehensive income (loss)" in the Consolidated Balance Sheets for these debt securities. Receivables The allowance for doubtful accounts is developed based on several factors including overall customer credit quality, historical write-off experience, and specific account analyses projecting the ultimate collectability of the account. As such, these factors may change over time causing the allowance level to adjust accordingly. The following table summarizes the change in the allowance for doubtful accounts (in thousands):
Inventories The Corporation values its inventory at the lower of cost or net realizable value. Inventories included in the Consolidated Balance Sheets consisted of the following (in thousands):
During 2019 and 2018, inventory quantities were reduced at certain reporting units. This reduction resulted in a liquidation of LIFO inventory quantities carried at higher or lower costs prevailing in prior years as compared with the cost of current year purchases, the effect of which decreased cost of goods sold by approximately $2.2 million in 2019 and $0.5 million in 2018. If the FIFO method had been in use, inventories would have been $30.7 million and $34.4 million higher than reported as of December 28, 2019 and December 29, 2018, respectively. Property, Plant, and Equipment Property, plant, and equipment are carried at cost. Expenditures for repairs and maintenance are expensed as incurred. Major improvements that materially extend the useful lives of the assets are capitalized. Depreciation has been computed using the straight-line method over estimated useful lives: land improvements, 10 – 20 years; buildings, 10 – 40 years; and machinery and equipment, 3 – 12 years. Total depreciation expense was as follows (in thousands):
Long-Lived Assets The Corporation evaluates long-lived assets for indicators of impairment as events or changes in circumstances occur indicating that an impairment risk may be present. The judgments regarding the existence of impairment are based on business and market conditions, operational performance, and estimated future cash flows. If the carrying value of a long-lived asset is considered impaired, an impairment charge is recorded to adjust the asset to its estimated fair value.
45
Balance at beginning of
period Adjustments to
allowance
Amounts written off, net of
recoveries and other
adjustments Balance at end
of period
Year ended December 28, 2019 $ 3,867 $ 508 $ 816 $ 3,559 Year ended December 29, 2018 $ 1,904 $ 2,440 $ 477 $ 3,867 Year ended December 30, 2017 $ 2,140 $ 846 $ 1,082 $ 1,904
December 28,
2019 December 29,
2018
Finished products $ 118,633 $ 97,398 Materials and work in process 75,526 94,161 Last-in, first-out ("LIFO") allowance (30,694) (34,381)
Total inventories $ 163,465 $ 157,178
Inventory valued by the LIFO costing method 65% 81%
2019 2018 2017 Depreciation expense $ 53,022 $ 51,063 $ 56,494

Table of Contents Goodwill and Other Intangible Assets The Corporation evaluates its goodwill for impairment on an annual basis during the fourth quarter or whenever indicators of impairment exist. Asset impairment charges associated with the Corporation’s goodwill impairment testing are discussed in "Note 7. Goodwill and Other Intangible Assets" in the Notes to Consolidated Financial Statements. The Corporation reviews goodwill at the reporting unit level within its office furniture and hearth products operating segments. These reporting units constitute components for which discrete financial information is available and regularly reviewed by segment management. The accounting standards for goodwill permit entities to first assess qualitative factors to determine whether it is more likely than not the fair value of a reporting unit is less than its carrying amount as a basis for determining whether it is necessary to perform a quantitative goodwill impairment test. If the quantitative test is required, the Corporation estimates the fair value of its reporting units. In estimating the fair value, the Corporation relies on an average of the income approach and the market approach. This estimated fair value is compared to the carrying value of the reporting unit and an impairment is recorded if the estimate is less than the carrying value. In the income approach, the estimate of fair value of each reporting unit is based on management’s projection of revenues, gross margin, operating costs, and cash flows considering historical and estimated future results, general economic and market conditions, as well as the impact of planned business and operational strategies. The valuations employ present value techniques to measure fair value and consider market factors. In the market approach, the Corporation utilizes the guideline company method, which involves calculating valuation multiples based on operating data from guideline publicly-traded companies. These multiples are then applied to the operating data for the reporting units and adjusted for factors similar to those used in the discounted cash flow analysis. Management believes the assumptions used for the impairment test are consistent with those utilized by a market participant in performing similar valuations of its reporting units. Management bases its fair value estimates on assumptions they believe to be reasonable at the time, but such assumptions are subject to inherent uncertainty. Actual results may differ from those estimates. The Corporation also evaluates the fair value of indefinite-lived trade names on an annual basis during the fourth quarter or whenever an indication of impairment exists. The estimate of the fair value of the trade names is based on a discounted cash flows model using inputs which include: projected revenues, assumed royalty rates that would be payable if the trade names were not owned, and discount rates. The Corporation has definite-lived intangible assets that are amortized over their estimated useful lives. Impairment losses are recognized if the carrying amount of an intangible asset subject to amortization is not recoverable from expected future cash flows and its carrying amount exceeds its fair value. Accounts Payable and Accrued Expenses Accounts payable and accrued expenses are reflected in the Consolidated Balance Sheets and were as follows (in thousands):
Product Warranties The Corporation issues certain warranty policies on its office furniture and hearth products that provide for repair or replacement of any covered product or component that fails during normal use because of a defect in design, materials, or workmanship. Allowances have been established for the anticipated future costs associated with the Corporation's warranty programs. A warranty allowance is determined by recording a specific allowance for known warranty issues and an additional allowance for unknown claims expected to be incurred based on historical claims experience. Actual claims incurred could differ from the original estimates, requiring adjustments to the allowance.
46
December 28,
2019 December 29,
2018
Trade accounts payable $ 227,557 $ 221,395 Compensation 53,147 52,227 Profit sharing and retirement expense 28,264 28,300 Marketing expenses 46,344 36,529 Freight 15,998 13,892 Other accrued expenses 81,892 76,522
$ 453,202 $ 428,865

Table of Contents Activity associated with warranty obligations was as follows (in thousands):
The current and long-term portions of the allowance for the estimated settlements are included within "Accounts payable and accrued expenses" and "Other Long-Term Liabilities", respectively, in the Consolidated Balance Sheets. The following table summarizes when these estimated settlements are expected to be paid (in thousands):
Revenue Recognition The Corporation implemented ASU No. 2014-09, Revenue from Contracts with Customers (Topic 606), at the beginning of fiscal 2018 using the modified-retrospective method, which required this guidance to be applied prospectively to revenue transactions completed on or after the effective date. Given the nature of the Corporation's revenue transactions, this guidance did not have a material impact on the Corporation's results of operations or financial position. Performance Obligations - The Corporation recognizes revenue for sales of office furniture and hearth products at a point in time following the transfer of control of such products to the customer, which typically occurs upon shipment of the product. In certain circumstances, transfer of control to the customer does not occur until the goods are received by the customer or upon installation and/or customer acceptance, depending on the terms of the underlying contracts. Contracts typically have a duration of less than one year and normally do not include a significant financing component. Generally, payment is due within 30 days of invoicing. Significant Judgments - The amount of consideration the Corporation receives and revenue recognized varies with changes in rebate and marketing program incentives, as well as early pay discounts, offered to customers. The Corporation uses significant judgment throughout the year in estimating the reduction in net sales driven by variable consideration for rebate and marketing programs. Judgments made include expected sales levels and utilization of funds. However, this judgment factor is significantly reduced at the end of each year when sales volumes and the impact to rebate and marketing programs are known and recorded as the programs typically end near the Corporation's fiscal year end. Accounting Policies and Practical Expedients Elected: Shipping and Handling Activities - The Corporation elected to apply the accounting policy election permitted in the revenue accounting standard, which allows an entity to account for shipping and handling activities that occur after control is transferred as fulfillment activities. The Corporation accrues for shipping and handling costs at the same time revenue is recognized, which is in accordance with the policy election. When shipping and handling activities occur prior to the customer obtaining control of the good(s), they are considered fulfillment activities rather than a performance obligation and the costs are accrued for as incurred.
Sales Taxes - The Corporation elected to apply the accounting policy election permitted in the revenue accounting standard, which allows an entity to exclude from the measurement of the transaction price all taxes assessed by a governmental authority associated with the transaction, including sales, use, excise, value-added, and franchise taxes (collectively referred to as sales taxes). This allows the Corporation to present revenue net of these certain types of taxes. Incremental Costs of Obtaining a Contract - The Corporation elected the practical expedient permitted in the revenue accounting standard, which permits an entity to recognize incremental costs to obtain a contract as an expense when incurred if the amortization period will be less than one year.
47
2019 2018 2017 Balance at beginning of period $ 15,450 $ 15,388 $ 15,250 Accruals for warranties issued during period 19,600 22,697 20,075 Adjustments related to pre-existing warranties 906 233 194 Settlements made during the period (20,091) (22,868) (20,131)
Balance at end of period $ 15,865 $ 15,450 $ 15,388
December 28,
2019 December 29,
2018
Current - in the next twelve months $ 7,940 $ 9,455 Long-term - beyond one year 7,925 5,995
$ 15,865 $ 15,450

Table of Contents Significant Financing Component - The Corporation elected the practical expedient permitted in the revenue accounting standard, which allows an entity to not adjust the promised amount of consideration for the effects of a significant financing component if a contract has a duration of one year or less. As the Corporation's contracts are typically less than one year in length, consideration will not be adjusted.
Remaining Performance Obligation - The Corporation's backlog orders are typically cancelable for a period of time and almost all contracts have an original duration of one year or less. As a result, the Corporation elected the practical expedient permitted in the revenue accounting standard not to disclose the unsatisfied performance obligation as of period end. The backlog is typically fulfilled within a quarter. These accounting policies and practical expedients have been applied consistently to all revenue transactions. See "Note 3. Revenue from Contracts with Customers" in the Notes to Consolidated Financial Statements for further information. Research and Development Costs Research and development costs relating to development of new products and processes, including significant improvements and refinements to existing products, are expensed as incurred. These costs include salaries, contractor fees, prototype costs, and administrative fees. The amounts charged against income and recorded in "Selling and administrative expenses" on the Consolidated Statements of Comprehensive Income were as follows (in thousands):
Freight Expense Freight expense on shipments to customers was recorded in "Selling and administrative expenses" on the Consolidated Statements of Comprehensive Income as follows (in thousands):
Stock-Based Compensation The Corporation measures the cost of employee services in exchange for an award of equity instruments based on the grant-date fair value of the award and recognizes cost over the requisite service period. See "Note 12. Stock-Based Compensation" in the Notes to Consolidated Financial Statements for further information. Income Taxes The Corporation uses an asset and liability approach that takes into account guidance related to uncertain tax positions and requires the recognition of deferred tax assets and liabilities for the expected future tax consequences of events that have been recognized in the Corporation’s financial statements or tax returns. Deferred income taxes are provided to reflect differences between the tax bases of assets and liabilities and their reported amounts in the consolidated financial statements. On December 22, 2017, the Tax Cuts and Jobs Act of 2017 (the "Act") was signed into law, making significant changes to the Internal Revenue Code. In January 2018, the FASB released guidance on the accounting for tax on the global intangible low-taxed income ("GILTI") provisions of the Act. The GILTI provisions impose a tax on foreign income in excess of a deemed return on tangible assets of foreign corporations. The guidance indicates that either accounting for deferred taxes related to GILTI inclusions or treating any taxes on GILTI inclusions as a period cost are both acceptable methods subject to an accounting policy election. Effective in the first quarter of fiscal 2018, the Corporation elected to treat any potential GILTI inclusions as a period cost, as no material impact is projected from GILTI inclusions and any deferred taxes related to any inclusion would not be material. Also under the Act, a corporation’s foreign earnings accumulated under legacy tax laws are deemed repatriated. The Corporation will continue to evaluate its ability to assert indefinite reinvestment to determine recognition of a deferred tax liability for other items such as Section 986(c) currency gain/loss, foreign withholding, and state taxes. See "Note 9. Income Taxes" in the Notes to Consolidated Financial Statements for further information. Earnings Per Share Basic earnings per share are based on the weighted-average number of common shares outstanding during the year. Shares potentially issuable under stock options, restricted stock units, and common stock equivalents under the Corporation's deferred compensation plans have been considered outstanding for purposes of the diluted earnings per share calculation.
48
2019 2018 2017 Research and development costs $ 34,699 $ 33,420 $ 31,846
2019 2018 2017 Freight expense $ 123,667 $ 134,190 $ 119,096
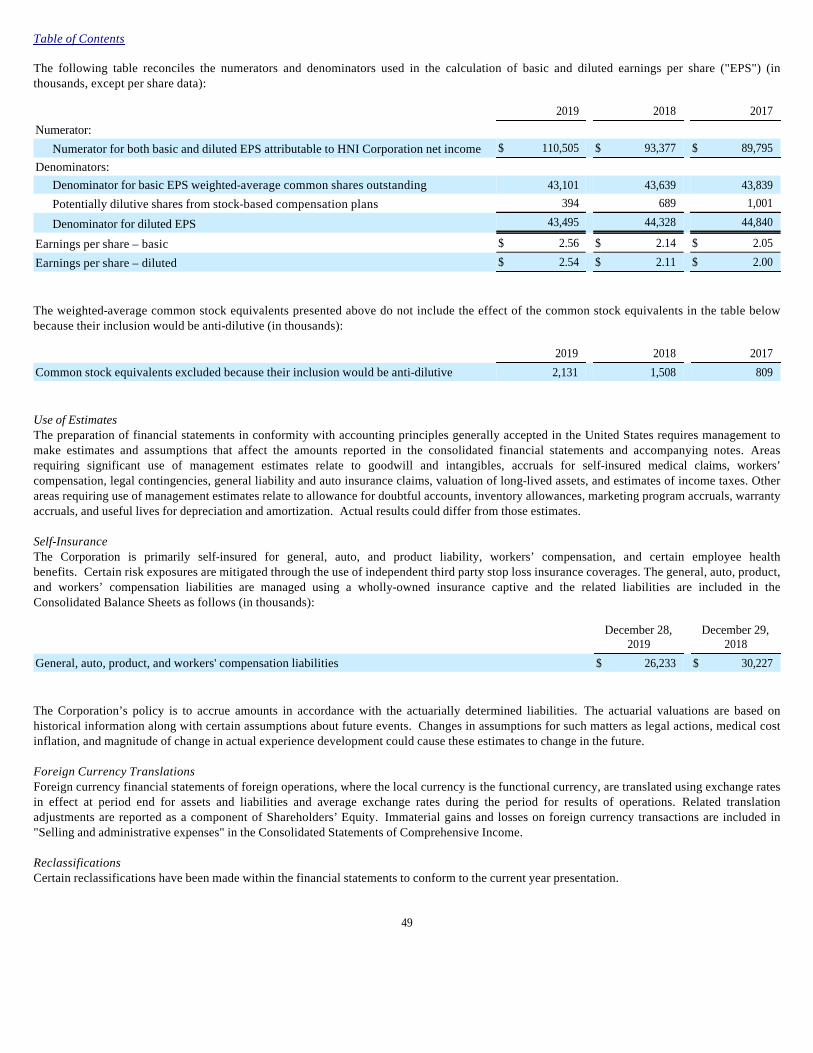
Table of Contents The following table reconciles the numerators and denominators used in the calculation of basic and diluted earnings per share ("EPS") (in thousands, except per share data):
The weighted-average common stock equivalents presented above do not include the effect of the common stock equivalents in the table below because their inclusion would be anti-dilutive (in thousands):
Use of Estimates The preparation of financial statements in conformity with accounting principles generally accepted in the United States requires management to make estimates and assumptions that affect the amounts reported in the consolidated financial statements and accompanying notes. Areas requiring significant use of management estimates relate to goodwill and intangibles, accruals for self-insured medical claims, workers’ compensation, legal contingencies, general liability and auto insurance claims, valuation of long-lived assets, and estimates of income taxes. Other areas requiring use of management estimates relate to allowance for doubtful accounts, inventory allowances, marketing program accruals, warranty accruals, and useful lives for depreciation and amortization. Actual results could differ from those estimates. Self-Insurance The Corporation is primarily self-insured for general, auto, and product liability, workers’ compensation, and certain employee health benefits. Certain risk exposures are mitigated through the use of independent third party stop loss insurance coverages. The general, auto, product, and workers’ compensation liabilities are managed using a wholly-owned insurance captive and the related liabilities are included in the Consolidated Balance Sheets as follows (in thousands):
The Corporation’s policy is to accrue amounts in accordance with the actuarially determined liabilities. The actuarial valuations are based on historical information along with certain assumptions about future events. Changes in assumptions for such matters as legal actions, medical cost inflation, and magnitude of change in actual experience development could cause these estimates to change in the future. Foreign Currency Translations Foreign currency financial statements of foreign operations, where the local currency is the functional currency, are translated using exchange rates in effect at period end for assets and liabilities and average exchange rates during the period for results of operations. Related translation adjustments are reported as a component of Shareholders’ Equity. Immaterial gains and losses on foreign currency transactions are included in "Selling and administrative expenses" in the Consolidated Statements of Comprehensive Income. Reclassifications Certain reclassifications have been made within the financial statements to conform to the current year presentation.
49
2019 2018 2017 Numerator:
Numerator for both basic and diluted EPS attributable to HNI Corporation net income $ 110,505 $ 93,377 $ 89,795 Denominators:
Denominator for basic EPS weighted-average common shares outstanding 43,101 43,639 43,839 Potentially dilutive shares from stock-based compensation plans 394 689 1,001
Denominator for diluted EPS 43,495 44,328 44,840
Earnings per share – basic $ 2.56 $ 2.14 $ 2.05
Earnings per share – diluted $ 2.54 $ 2.11 $ 2.00
2019 2018 2017 Common stock equivalents excluded because their inclusion would be anti-dilutive 2,131 1,508 809
December 28,
2019 December 29,
2018
General, auto, product, and workers' compensation liabilities $ 26,233 $ 30,227

Table of Contents Recently Adopted Accounting Standards In February 2016, the FASB issued ASU No. 2016-02, Leases. The new standard requires lessees to recognize most leases, including operating leases, on-balance sheet via a right of use asset and lease liability. The new standard became effective for the Corporation in fiscal 2019 and was implemented using a modified-retrospective transition approach. The Corporation selected a technology tool to assist with the accounting and disclosure requirements of the new standard. All necessary changes required by the new standard, including those to the Corporation's accounting policies, business process, systems, controls, and disclosures, were identified and implemented as of the first quarter 2019. See "Note 15. Leases" in the Notes to Consolidated Financial Statements for financial impacts, accounting elections, and further information. In February 2018, the FASB issued ASU No. 2018-02, Reclassification of Certain Tax Effects from Accumulated Other Comprehensive Income. The new standard allows entities to reclassify certain stranded tax effects from accumulated other comprehensive income to retained earnings resulting from the Act. The standard also requires certain disclosures about stranded tax effects. The new standard became effective for the Corporation in fiscal 2019. See "Note 9. Income Taxes" in the Notes to Consolidated Financial Statements for further information. In August 2017, the FASB issued ASU No. 2017-12, Targeted Improvements to Accounting for Hedging Activities. The new standard improves the financial reporting of hedging relationships to better portray the economic results of an entity's risk management activities in its financial statements and make certain targeted improvements to simplify the application of the hedge accounting guidance through changes to both the designation and measurement guidance for qualifying hedging relationships and the presentation of hedge results. The new standard became effective for the Corporation in fiscal 2019. The standard requires a cumulative effect adjustment to the opening balance of retained earnings as of the beginning of the fiscal year of adoption for the previously recorded ineffectiveness included in retained earnings related to existing net investment hedges as of the date of adoption. The Corporation did not record a cumulative effect adjustment to retained earnings as no net investment hedges existed as of the ASU adoption date. New hedging relationships entered after the adoption date have been presented in the financial statements using the guidance of the ASU. The standard did not have a material effect on consolidated financial statements and related disclosures. Note 3. Revenue from Contracts with Customers Disaggregation of Revenue Revenue from contracts with customers disaggregated by sales channel and by segment is as follows (in thousands):
Sales by channel type are subject to similar economic factors and market conditions regardless of the channel under which the product is sold. See “Note 17. Reportable Segment Information” in the Notes to Consolidated Financial Statements for further information about operating segments. Contract Assets and Contract Liabilities In addition to trade receivables, the Corporation has contract assets consisting of funds paid to certain office furniture dealers in exchange for their multi-year commitment to market and sell the Corporation’s products. These contract assets are amortized over the term of the contracts and recognized as a reduction of revenue. For contracts less than one year, the Corporation has elected the practical expedient to recognize incremental costs to obtain a contract as an expense when incurred. The Corporation has contract liabilities consisting of customer deposits and rebate and marketing program liabilities.
50
Segment 2019 2018 Supplies-driven channel Office Furniture $ 891,997 $ 904,292 Contract channel Office Furniture 805,189 801,800 Hearth Hearth Products 549,761 551,803
Net sales $ 2,246,947 $ 2,257,895

Table of Contents Contract assets and contract liabilities were as follows (in thousands):
The index below indicates the line item in the Consolidated Balance Sheets where contract assets and contract liabilities are reported:
(1) "Receivables" (2) "Prepaid expenses and other current assets" (3) "Other Assets" (4) "Accounts payable and accrued expenses"
Changes in contract asset and contract liability balances during the year ended December 28, 2019 were as follows (in thousands):
Changes in contract asset and contract liability balances during the year ended December 29, 2018 were as follows (in thousands):
Contract liabilities for customer deposits paid to the Corporation prior to the satisfaction of performance obligations are recognized as revenue upon completion of the performance obligations. The amount of revenue recognized during the year ended December 28, 2019 that was included in the December 29, 2018 contract liabilities balance was $8.3 million. The amount of revenue recognized during the year ended December 29, 2018 that was included in the December 30, 2017 contract liabilities balance was $12.5 million, respectively.
51
December 28,
2019 December 29,
2018
Trade receivables (1) $ 278,124 $ 259,075 Contract assets (current) (2) $ 857 $ 529 Contract assets (long-term) (3) $ 2,700 $ 2,188 Contract liabilities (4) $ 54,972 $ 44,858
Contract assets increase
(decrease)
Contract liabilities (increase) decrease
Contract assets recognized $ 1,313 $ — Reclassification of contract assets to contra-revenue (473) — Contract liabilities recognized and recorded to contra-revenue as a result of performance obligations satisfied — (147,830)
Contract liabilities paid — 138,015 Cash received in advance and not recognized as revenue — (67,938)
Reclassification of cash received in advance to revenue as a result of performance obligations satisfied — 67,639
Net change $ 840 $ (10,114)
Contract assets increase
(decrease)
Contract liabilities (increase) decrease
Contract assets recognized $ 2,100 $ — Reclassification of contract assets to contra-revenue (483) — Contract asset impairment (1,550) — Contract liabilities recognized and recorded to contra-revenue as a result of performance obligations satisfied — (127,454)
Contract liabilities paid — 132,909 Cash received in advance and not recognized as revenue — (54,167)
Reclassification of cash received in advance to revenue as a result of performance obligations satisfied — 58,304 Impact of business combination — 77
Net change $ 67 $ 9,669

Table of Contents Note 4. Restructuring and Impairment Charges Restructuring costs, goodwill and long-lived asset impairments, and a valuation allowance recorded in the Consolidated Statements of Comprehensive Income are as follows (in thousands):
Restructuring costs in 2019 related to a structural realignment in the office furniture segment and were primarily comprised of severance costs. Restructuring costs in 2018 were primarily incurred as part of the previously announced closures of the hearth manufacturing facilities in Paris, Kentucky and Colville, Washington and the office furniture manufacturing facility in Orleans, Indiana. Impairment charges include the impairment of goodwill and long-lived assets for office furniture companies and an impairment charge from the sale of the closed manufacturing facility in Paris, Kentucky. The Corporation also recovered a portion of a long-term note receivable previously impaired. Restructuring costs in 2017, which include accelerated depreciation recorded in "Cost of sales" in the Consolidated Statements of Comprehensive Income, were primarily incurred as part of the previously announced closures of the hearth manufacturing facilities in Paris, Kentucky and Colville, Washington and the office furniture manufacturing facility in Orleans, Indiana. The accrued restructuring expenses are expected to be paid in the next twelve months and are reflected in "Accounts payable and accrued expenses" in the Consolidated Balance Sheets. The following is a summary of changes in restructuring accruals (in thousands):
Note 5. Acquisitions and Divestitures As part of the Corporation's ongoing business strategy, it continues to acquire and divest small office furniture dealerships and small hearth products companies, for which the impact is not material to the Corporation's financial statements.
52
2019 2018 2017 Cost of sales - accelerated depreciation $ — $ — $ 10,327
Restructuring charges $ 2,371 $ 2,325 $ 6,205 Goodwill and long-lived asset impairments — 15,200 20,947 Valuation allowance of long-term note receivable — (1,800) 10,264
Restructuring and impairment charges $ 2,371 $ 15,725 $ 37,416
Severance Costs Facility Exit
Costs & Other Total
Restructuring allowance as of December 31, 2016 $ 2,704 $ — $ 2,704 Restructuring charges 1,436 4,769 6,205 Cash payments (2,797) (4,253) (7,050)
Restructuring allowance as of December 30, 2017 1,343 516 1,859 Restructuring charges 355 1,970 2,325 Cash payments (1,562) (2,336) (3,898)
Restructuring allowance as of December 29, 2018 136 150 286 Restructuring charges 1,977 394 2,371 Cash payments (1,451) (272) (1,723)
Restructuring allowance as of December 28, 2019 $ 662 $ 272 $ 934

Note 6. Supplemental Cash Flow Information The Corporation's cash payments for interest, income taxes, and non-cash investing and financing activities are as follows (in thousands):
Note 7. Goodwill and Other Intangible Assets Goodwill and other intangible assets included in the Consolidated Balance Sheets consisted of the following (in thousands):
Goodwill The changes in the carrying amount of goodwill, by reporting segment, are as follows (in thousands):
53
2019 2018 2017 Cash paid for:
Interest paid, net of capitalized interest $ 9,867 $ 9,882 $ 6,236 Income taxes paid $ 21,181 $ 11,465 $ 13,733 Changes in accrued expenses due to:
Purchases of property and equipment $ (8,476) $ 5,895 $ (10,370)
Purchases of capitalized software $ 653 $ (2,497) $ (237)
December 28,
2019 December 29,
2018
Goodwill $ 270,820 $ 270,788 Definite-lived intangible assets 146,040 163,714 Indefinite-lived intangible assets 28,849 28,788
Total goodwill and other intangible assets $ 445,709 $ 463,290
Office Furniture Hearth Products Total
Balance as of December 30, 2017
Goodwill $ 128,657 $ 183,199 $ 311,856 Accumulated impairment losses (32,208) (143) (32,351)
Net goodwill balance as of December 30, 2017 $ 96,449 $ 183,056 $ 279,505
Goodwill acquired during the year — 3,463 3,463 Impairment losses (12,168) — (12,168)
Foreign currency translation adjustment (12) — (12)
Balance as of December 29, 2018 Goodwill 128,645 186,662 315,307 Accumulated impairment losses (44,376) (143) (44,519)
Net goodwill balance as of December 29, 2018 $ 84,269 $ 186,519 $ 270,788
Foreign currency translation adjustment 32 — 32
Balance as of December 28, 2019 Goodwill 128,677 186,662 315,339 Accumulated impairment losses (44,376) (143) (44,519)
Net goodwill balance as of December 28, 2019 $ 84,301 $ 186,519 $ 270,820

Table of Contents The changes in goodwill in fiscal 2018 primarily relate to completed acquisitions in the hearth products segment, and impairment charges in the office furniture segment. Definite-lived intangible assets The table below summarizes amortizable definite-lived intangible assets, which are reflected in "Goodwill and Other Intangible Assets" in the Corporation’s Consolidated Balance Sheets (in thousands):
Amortization expense is reflected in "Selling and administrative expenses" in the Consolidated Statements of Comprehensive Income and was as follows (in thousands):
The occurrence of events such as acquisitions, dispositions, or impairments may impact future amortization expense. Based on the current amount of intangible assets subject to amortization, the estimated amortization expense for each of the following five fiscal years is as follows (in millions):
Indefinite-lived intangible assets The Corporation also owns certain intangible assets, which are deemed to have indefinite useful lives because they are expected to generate cash flows indefinitely. These indefinite-lived intangible assets are reflected in "Goodwill and Other Intangible Assets" in the Consolidated Balance Sheets (in thousands):
The immaterial change in the indefinite-lived intangible assets balances shown above is related to foreign currency translation impacts. As a result of the required annual impairment assessment performed in the fourth quarter of 2019, the Corporation did not record any impairment charges related to indefinite-lived intangible assets, as the estimated fair values were significantly in excess of the respective carrying values. Sale and License of an Intangible Asset In the third quarter of 2017, the Corporation recorded a $6.0 million nonrecurring gain from the sale and license of an intangible asset, which had a zero carrying value. This nonrecurring gain is reflected in "Gain on sale, disposal, and license of assets, net" in the Consolidated Statements of Comprehensive Income. Impairment Analysis As a result of the required annual goodwill impairment assessment performed in the fourth quarter of 2019, the Corporation determined the fair value of its reporting units exceeded the respective carrying value and, therefore, no impairment of goodwill was recorded. The projections used in the impairment model reflected management's assumptions regarding revenue growth rates, economic and market trends, cost structure, investments required for product enhancements, and other expectations about the anticipated short-
54
December 28, 2019 December 29, 2018
Gross Accumulated Amortization Net Gross
Accumulated Amortization Net
Patents $ 40 $ 40 $ — $ 40 $ 34 $ 6 Software 176,836 67,541 109,295 170,274 49,561 120,713 Trademarks and trade names 7,564 3,381 4,183 7,564 2,721 4,843 Customer lists and other 104,004 71,442 32,562 103,840 65,688 38,152 Net definite-lived intangible assets $ 288,444 $ 142,404 $ 146,040 $ 281,718 $ 118,004 $ 163,714
2019 2018 2017 Capitalized software $ 18,130 $ 17,109 $ 9,389 Other definite-lived intangibles $ 6,275 $ 6,615 $ 6,989
2020 2021 2022 2023 2024 Amortization expense $ 23.8 $ 22.7 $ 19.7 $ 17.5 $ 16.5
December 28,
2019 December 29,
2018
Trademarks and trade names $ 28,849 $ 28,788

Table of Contents term and long-term operating results of the reporting units. For three reporting units in the office furniture segment, the concluded fair values included in the respective annual quantitative impairment test contain a higher degree of sensitivity to changes in estimates, and therefore an increased risk of future impairment charges, relative to the Corporation's other reporting units for which the estimated fair value is significantly in excess of the carrying value. These three reporting units have goodwill of $6.9 million, $7.5 million and $14.1 million, respectively, and an estimated fair value that exceeded carrying value by approximately 68 percent, 15 percent, and 11 percent, respectively. The reporting unit that exceeded its carrying value by approximately 15 percent in the current year assessment recorded a goodwill impairment charge of $12.2 million pretax in 2018. In connection with the current year impairment assessment, the Corporation assumed a discount rate of 14 percent, near term growth rates ranging from 2 percent to 5.5 percent, and a terminal growth rate of 3 percent. Holding other assumptions constant, a 100 basis point increase in the discount rate would result in a $2.8 million decrease in the estimated fair value of the reporting unit. Holding other assumptions constant, a 100 basis point decrease in the long-term growth rate would result in a $1.1 million decrease in the estimated fair value of the reporting unit. Both of these scenarios individually would result in the estimated fair value exceeding carrying value. For the reporting unit that exceeded its carrying value by approximately 11 percent, the Corporation assumed a discount rate of 15 percent, near term growth rates ranging from 10 percent to 51 percent, and a terminal growth rate of 3 percent. Holding other assumptions constant, a 100 basis point increase in the discount rate would result in a $7.9 million decrease in the estimated fair value of the reporting unit. This scenario would result in the estimated fair value being below carrying value. Holding other assumptions constant, a 100 basis point decrease in the long-term growth rate would result in a $1.8 million decrease in the estimated fair value of the reporting unit. This scenario would result in the estimated fair value exceeding carrying value. Note 8. Long-Term Debt Long-term debt is as follows (in thousands):
Aggregate maturities of long-term debt are as follows (in thousands):
The carrying value of the Corporation's outstanding variable-rate, long-term debt obligations at December 28, 2019 was $75 million, which approximated fair value. The fair value of the fixed rate notes was estimated based on a discounted cash flow method (Level 2) to be $116 million at December 28, 2019. As of December 28, 2019, the Corporation’s revolving credit facility borrowings were under the credit agreement entered into on April 20, 2018 with a scheduled maturity of April 20, 2023. The Corporation deferred the debt issuance costs related to the credit agreement, which are classified as assets, and is amortizing them over the term of the credit agreement. The current portion of debt issuance costs of $0.4 million is the amount to be amortized over the next twelve months based on the current credit agreement and is reflected in "Prepaid expenses and other current assets" in the Consolidated Balance Sheets. The long-term portion of debt issuance costs of $1.0 million is reflected in "Other Assets" in the Consolidated Balance Sheets.
55
December 28,
2019 December 29,
2018
Revolving credit facility with interest at a variable rate (December 28, 2019 - 2.8%; December 29, 2018 - 3.5%) $ 75,000 $ 150,000 Fixed rate notes due in 2025 with an interest rate of 4.22% 50,000 50,000 Fixed rate notes due in 2028 with an interest rate of 4.40% 50,000 50,000 Other amounts 790 679 Deferred debt issuance costs (561 ) (645 )
Total debt 175,229 250,034 Less: Current maturities of long-term debt 790 679
Long-term debt $ 174,439 $ 249,355
2020 2021 2022 2023 2024 Thereafter Maturities of long-term debt $ 790 $ — $ — $ 75,000 $ — $ 100,000

Table of Contents As of December 28, 2019, there was $75 million outstanding under the $450 million revolving credit facility. The entire amount drawn under the revolving credit facility is considered long-term as the Corporation assumes no obligation to repay any of the amounts borrowed in the next twelve months. Based on current earnings before interest, taxes, depreciation and amortization, the Corporation can access the full remaining $375 million of borrowing capacity available under the revolving credit facility and maintain compliance with applicable covenants. In addition to cash flows from operations, the revolving credit facility under the credit agreement is the primary source of daily operating capital for the Corporation and provides additional financial capacity for capital expenditures, repurchases of common stock, and strategic initiatives, such as acquisitions. In addition to the revolving credit facility, the Corporation also has $100 million of borrowings outstanding under private placement note agreements entered into on May 31, 2018. Under the agreements, the Corporation issued $50 million of seven-year fixed rate notes with an interest rate of 4.22 percent, due May 31, 2025, and $50 million of ten-year fixed rate notes with an interest rate of 4.40 percent, due May 31, 2028. The Corporation deferred the debt issuance costs related to the private placement note agreements, which are classified as a reduction of long-term debt in accordance with ASU No. 2015-03, and is amortizing them over the terms of the private placement note agreements. The deferred debt issuance costs do not reduce the amount owed by the Corporation under the terms of the private placement note agreements. As of December 28, 2019 the debt issuance costs balance of $0.6 million related to the private placement note agreements is reflected in "Long-Term Debt" in the Consolidated Balance Sheets. The credit agreement and private placement notes both contain financial and non-financial covenants. The covenants under both are substantially the same. Non-compliance with covenants under the agreements could prevent the Corporation from being able to access further borrowings, require immediate repayment of all amounts outstanding, and/or increase the cost of borrowing. Covenants require maintenance of financial ratios as of the end of any fiscal quarter, including:
The most restrictive of the financial covenants is the consolidated leverage ratio requirement of 3.5 to 1.0. Under the credit agreement, consolidated EBITDA is defined as consolidated net income before interest expense, income taxes, and depreciation and amortization of intangibles, as well as non-cash items that increase or decrease net income. As of December 28, 2019, the Corporation was below the maximum allowable ratio and was in compliance with all of the covenants and other restrictions in the credit agreement. The Corporation expects to remain in compliance with all of the covenants and other restrictions in the credit agreement over the next twelve months. Note 9. Income Taxes Significant components of the provision for income taxes, including those related to non-controlling interest, are as follows (in thousands):
56
• a consolidated interest coverage ratio (as defined in the credit agreement) of not less than 4.0 to 1.0, based upon the ratio of (a) consolidated EBITDA for the last four fiscal quarters to (b) the sum of consolidated interest charges; and
• a consolidated leverage ratio (as defined in the credit agreement) of not greater than 3.5 to 1.0, based upon the ratio of (a) the quarter-end consolidated funded indebtedness to (b) consolidated EBITDA for the last four fiscal quarters.
2019 2018 2017 Current:
Federal $ 20,122 $ 15,663 $ 9,501 State 5,418 4,877 3,408 Foreign 662 936 789
Current provision 26,202 21,476 13,698 Deferred:
Federal 4,140 4,002 (35,914)
State 1,634 1,320 2,552 Foreign 235 (1,399) 378
Deferred provision 6,009 3,923 (32,984)
Total income tax expense $ 32,211 $ 25,399 $ (19,286)

Table of Contents The differences between the actual tax expense and tax expense computed at the statutory United States federal tax rate are explained as follows (in thousands):
On December 22, 2017, the Act was signed into law, making significant changes to the Internal Revenue Code. Changes include, but are not limited to, a corporate tax rate decrease from 35 percent to 21 percent effective for tax years beginning after December 31, 2017, the transition of United States international taxation from a worldwide tax system to a territorial system, and a one-time transition tax on the mandatory deemed repatriation of cumulative foreign earnings as of December 31, 2017. Staff Accounting Bulletin No. 118 ("SAB 118") was issued to address the application of United States GAAP in the reporting period that includes December 22, 2017 in situations when a registrant does not have the necessary information available, prepared, or analyzed (including computations) in reasonable detail to complete the accounting for certain income tax effects of the Act. In accordance with SAB 118, the Corporation determined as of the end of fiscal 2017, the $45.4 million of the deferred tax benefit recorded in connection with the remeasurement of certain deferred tax assets and liabilities and the $0.1 million of current tax expense recorded in connection with the transition tax on the mandatory deemed repatriation of foreign earnings was a provisional amount and a reasonable estimate as of December 30, 2017. Additional work was necessary to complete a more detailed analysis of historical foreign earnings as well as potential correlative adjustments. Subsequent adjustments to these amounts, which were not material, were recorded to current tax expense in the third quarter of 2018 when the analysis was completed. During the third quarter of 2019, the 2018 federal income tax return was completed resulting in a $0.3 million benefit related to a change in estimate of state income taxes, research and development credit and other items. Deferred income taxes reflect the net tax effects of temporary differences between the carrying amounts of assets and liabilities for financial reporting purposes and the amounts used for income tax purposes.
57
2019 2018 2017 Federal statutory tax expense $ 29,970 $ 24,943 $ 24,678 State taxes, net of federal tax effect 5,159 3,997 2,197 Credit for increasing research activities (4,050) (3,950) (3,407)
Deduction related to domestic production activities — — (1,537)
Valuation allowance 98 (1,141) 4,232 Federal rate adjustment to deferred taxes — — (45,386)
Equity based compensation 639 (666) (1,544)
Change in uncertain tax positions (357) 766 (163)
Foreign income tax rate differential 596 124 2,094 Other – net 156 1,326 (450)
Total income tax expense $ 32,211 $ 25,399 $ (19,286)

Table of Contents Significant components of the Corporation’s deferred tax liabilities and assets are as follows (in thousands):
The valuation allowance for deferred tax assets is as follows (in thousands):
The current year increase in the valuation allowance of $3.1 million primarily relates to an increase of deferred tax assets related to foreign tax due to adjustments for prior tax years. As of December 28, 2019, the Corporation had approximately $0.2 million of United States state tax net operating losses and $1.3 million of United States state tax credits, which expire over the next twenty years.
58
December 28,
2019 December 29,
2018
Deferred Taxes
Allowance for doubtful accounts $ 746 $ 897 Compensation 7,243 6,419 Inventory differences 1,445 2,498 Marketing accrual 1,238 1,260 Stock-based compensation 7,680 8,456 Accrued post-retirement benefit obligations 6,287 5,500 Vacation accrual 2,687 2,783 Warranty accrual 3,842 3,761 Net operating loss carryforward 4,522 4,790 Capital loss carryforward 2,011 2,001 Lease liability 17,212 — Other – net 8,916 11,413
Total deferred tax assets $ 63,829 $ 49,778 Deferred income (4,838) (4,707)
Goodwill and other intangible assets (54,951) (52,468)
Prepaids (6,867) (6,536)
Right of use asset (16,251) — Tax over book depreciation (57,682) (59,500)
Total deferred tax liabilities $ (140,589) $ (123,211)
Valuation allowance (10,260) (7,153)
Total net deferred tax liabilities $ (87,020) $ (80,586)
Long-term net deferred tax assets 176 1,569 Long-term net deferred tax liabilities (87,196) (82,155)
Total net deferred tax liabilities $ (87,020) $ (80,586)
Balance at beginning of
period Charged to expenses
Adjustments to balance sheet
Balance at end of period
Year ended December 28, 2019 $ 7,153 $ 98 $ 3,009 $ 10,260 Year ended December 29, 2018 $ 8,664 $ (839) $ (672) $ 7,153 Year ended December 30, 2017 $ 4,159 $ 4,505 $ — $ 8,664

Table of Contents A reconciliation of the beginning and ending amount of unrecognized tax benefits is as follows (in thousands):
The amount of unrecognized tax benefits, which would impact the Corporation's effective tax rate, if recognized, was $2.6 million as of December 28, 2019 and $2.9 million as of December 29, 2018. As of December 28, 2019, it is reasonably possible the amount of unrecognized tax benefits may increase or decrease within the twelve months following the reporting date. These increases or decreases in the unrecognized tax benefits would be due to new positions that may be taken on income tax returns, settlement of tax positions, and the closing of statutes of limitation. It is not expected any of the changes will be material individually, or in total, to the results or financial position of the Corporation. The Corporation recognized interest accrued related to unrecognized tax benefits in interest expense, and penalties in operating expenses, consistent with the recognition of these items in prior reporting periods. Interest, penalties, and benefits recognized in the Consolidated Statements of Comprehensive Income were as follows (in thousands):
The Corporation recorded a liability for interest and penalties related to unrecognized tax benefits in the Consolidated Balance Sheets as follows (in thousands):
Tax years 2016 through 2018 remain open for examination by the Internal Revenue Service ("IRS"). The Corporation is currently under examination in one state jurisdiction; however, years 2014 through 2018 remain open for examination in various state jurisdictions. Under the Act, a corporation’s foreign earnings accumulated under legacy tax laws are deemed repatriated. There were approximately $37 million of accumulated earnings considered permanently reinvested in Hong Kong and Canada as of December 28, 2019. The Corporation believes the tax costs on accumulated unremitted foreign earnings would be approximately $0.02 million if the amounts were not considered permanently reinvested.
59
2019 2018 Balance at beginning of period $ 2,937 $ 2,524 Increases in positions taken in a prior period 14 262 Decreases in positions taken in a prior period (127) — New positions taken in a current period 562 529 Decrease due to settlements — (9)
Decrease due to lapse of statute of limitations (808) (369)
Balance at end of period $ 2,578 $ 2,937
2019 2018 2017 Interest, penalties, and (benefits) $ 4 $ 92 $ (25)
December 28,
2019 December 29,
2018
Liability related to unrecognized tax benefits $ 279 $ 275

Table of Contents Note 10. Fair Value Measurements of Financial Instruments For recognition purposes, on a recurring basis, the Corporation is required to measure at fair value its marketable securities, derivative financial instruments, and deferred stock-based compensation. The marketable securities are comprised of money market funds, government securities, and corporate bonds. When available, the Corporation uses quoted market prices to determine fair value and classifies such measurements within Level 1. Where market prices are not available, the Corporation makes use of observable market-based inputs (prices or quotes from published exchanges and indexes) to calculate fair value using the market approach, in which case the measurements are classified within Level 2. Financial instruments measured at fair value were as follows (in thousands):
The index below indicates the line item in the Consolidated Balance Sheets where the financial instruments are reported:
(1) "Cash and cash equivalents" (2) Current portion - "Short-term investments"; Long-term portion - "Other Assets" (3) Current portion - "Prepaid expenses and other current assets"; Long-term portion - "Other Assets" (4) Current portion - "Current maturities of other long-term obligations"; Long-term portion - "Other Long-Term Liabilities"
60
Fair value as of
measurement date
Quoted prices in active markets for identical assets
(Level 1)
Significant other observable inputs
(Level 2)
Significant unobservable
inputs (Level 3)
Balance as of December 28, 2019
Cash and cash equivalents (including money market funds) (1) $ 52,073 $ 52,073 $ — $ — Government securities (2) $ 6,339 $ — $ 6,339 $ — Corporate bonds (2) $ 6,323 $ — $ 6,323 $ — Derivative financial instruments (3) $ 276 $ — $ 276 $ — Deferred stock-based compensation (4) $ 7,503 $ — $ 7,503 $ —
Balance as of December 29, 2018
Cash and cash equivalents (including money market funds) (1) $ 76,819 $ 76,819 $ — $ — Government securities (2) $ 7,384 $ — $ 7,384 $ — Corporate bonds (2) $ 4,620 $ — $ 4,620 $ — Derivative financial instruments (3) $ 3,797 $ — $ 3,797 $ — Deferred stock-based compensation (4) $ 7,857 $ — $ 7,857 $ —

Table of Contents Note 11. Accumulated Other Comprehensive Income (Loss) and Shareholders’ Equity The following table summarizes the components of accumulated other comprehensive income (loss) and the changes in accumulated other comprehensive income (loss), net of tax, as applicable (in thousands):
Amounts in parentheses indicate reductions to equity.
Interest Rate Swap In March 2016, the Corporation entered in to an interest rate swap transaction to hedge $150 million of outstanding variable rate revolver borrowings against future interest rate volatility. Under the terms of the interest rate swap, the Corporation paid a fixed rate of 1.29 percent and received one month LIBOR on a $150 million notational value. In August 2019, the agreement governing this interest rate swap was terminated and the Corporation received cash proceeds of $0.5 million, the fair value of the interest rate swap on the termination date. The proceeds were recorded as cash provided by operating activities in the Consolidated Statement of Cash Flows. The $0.5 million gain from the termination of this interest rate swap agreement was recorded to "Accumulated other comprehensive income (loss)" and will be amortized as an offset to interest expense through January 2021, the remaining term of the original interest rate swap agreement. In August 2019, concurrent with the termination of the previous interest rate swap, the Corporation entered into a new interest rate swap transaction to hedge $75 million of outstanding variable rate revolver borrowings against future interest rate volatility. Under the terms of this interest rate swap, the Corporation pays a fixed rate of 1.42 percent and receives one month LIBOR on a $75 million notional value expiring August 2023. As of December 28, 2019, the fair value of the Corporation's interest rate swap asset was $0.3 million. The unrecognized change in value of the interest rate swap, which includes the unamortized gain on the termination of the 2016 interest rate swap, is reported net of tax as $0.5 million in "Accumulated other comprehensive income (loss)" in the Consolidated Balance Sheets.
61
Foreign Currency
Translation Adjustment
Unrealized Gains
(Losses) on Debt
Securities
Pension and Post-retirement Liabilities
Derivative Financial
Instruments
Accumulated Other
Comprehensive Income (Loss)
Balance as of December 31, 2016 $ (1,188) $ (105) $ (5,167) $ 1,460 $ (5,000)
Other comprehensive income (loss) before reclassifications 1,219 (6) (733) 714 1,194 Tax (expense) or benefit — (21) 270 (263) (14)
Amounts reclassified from accumulated other comprehensive income (loss), net of tax — — — 209 209
Balance as of December 30, 2017 $ 31 $ (132) $ (5,630) $ 2,120 $ (3,611)
Other comprehensive income (loss) before reclassifications (3,004) (31) 3,531 1,488 1,984 Tax (expense) or benefit — 7 (830) (350) (1,173)
Amounts reclassified from accumulated other comprehensive income (loss), net of tax — — — (799) (799)
Balance as of December 29, 2018 $ (2,973) $ (156) $ (2,929) $ 2,459 $ (3,599)
Other comprehensive income (loss) before reclassifications 61 318 (2,254) (1,739) (3,614)
Tax (expense) or benefit — (67) 606 403 942 Reclassification of stranded tax impact — — (1,185) 446 (739)
Amounts reclassified from accumulated other comprehensive income (loss), net of tax — — — (1,063) (1,063)
Balance as of December 28, 2019 $ (2,912) $ 95 $ (5,762) $ 506 $ (8,073)

Table of Contents The following table details the reclassifications from accumulated other comprehensive income (loss) (in thousands):
Amounts in parentheses indicate reductions to profit.
In May 2017, the Corporation registered 300,000 shares of its common stock under its 2017 Equity Plan for Non-Employee Directors of HNI Corporation (the "2017 Director Plan"). The 2017 Director Plan replaced the 2007 Equity Plan for Non-Employee Directors of HNI Corporation (the "2007 Director Plan" and together with the 2017 Director Plan, the "Director Plans"). After approval of the 2017 Director Plan, no awards were granted under the 2007 Director Plan. The 2017 Director Plan permits the Corporation to issue to its non-employee directors options to purchase shares of Corporation common stock, restricted stock or restricted stock units of the Corporation, and awards of Corporation common stock. The 2017 Director Plan also permits non-employee directors to elect to receive all or a portion of their annual retainers and other compensation in the form of shares of Corporation common stock. Common stock was issued under the Director Plans as follows:
Dividend The Corporation declared and paid cash dividends per common share as follows (in dollars):
During 2017, shareholders approved the HNI Corporation Members' Stock Purchase Plan (the "2017 MSPP") to replace the expired 2007 Members' Stock Purchase Plan (the "2007 MSPP" and together with the 2017 MSPP, the "MSPPs"). Under the 2017 MSPP, 800,000 shares of common stock were registered for issuance to participating members. After approval of the 2017 MSPP, no awards were granted under the 2007 MSPP. Under the 2017 MSPP, rights to purchase stock are granted on a quarterly basis to all participating members who customarily work 20 hours or more per week and for five months or more in any calendar year. The price of the stock purchased under the MSPP is 85 percent of the closing price on the exercise date. No member may purchase stock under the MSPP in an amount which exceeds a maximum fair value of $25,000 in any calendar year. The following table provides the details of stock under the MSPPs:
An additional 593,223 shares were available for issuance under the 2017 MSPP as of December 28, 2019. The Corporation has entered into change in control employment agreements with certain officers. According to the agreements, a change in control occurs when a third person or entity becomes the beneficial owner of 20 percent or more of the Corporation’s common stock, when more than one-third of the Board is composed of persons not recommended by at least three-fourths of the incumbent Board, upon certain business combinations involving the Corporation, or upon approval by the Corporation’s shareholders of a complete liquidation or dissolution. Upon a change in control, a key member is deemed to have a two-year employment agreement with the Corporation, and all of his or her benefits vest under the Corporation’s compensation plans. If, at any time within two years of the change in control, his or her employment is terminated by the Corporation for any reason other than cause or disability, or by the key member for good reason, as such terms are defined in the agreement, then the key member is entitled to receive, among other benefits, a severance payment equal to two times (three times for the Corporation’s Chairman, President, and CEO) annual salary and the average of the prior two years' bonuses.
62
Details about Accumulated Other Comprehensive Income (Loss) Components
Affected Line Item in the Statement Where Net Income is Presented 2019 2018 2017
Derivative financial instruments
Interest rate swap Interest expense, net $ 1,392 $ 1,045 $ (330 )
Income tax expense (329 ) (246 ) 121
Net of tax $ 1,063 $ 799 $ (209 )
2019 2018 2017 Director Plan issued shares of common stock 37,269 27,745 27,196
2019 2018 2017 Dividends per common shares $ 1.21 $ 1.17 $ 1.13
2019 2018 2017 Shares of common stock issued 76,041 74,020 74,694 Average price per share $ 30.67 $ 32.19 $ 35.22

Table of Contents Stock Repurchase The par value method of accounting is used for common stock repurchases. The following table summarizes shares repurchased and settled by the Corporation (in thousands, except share and per share data):
As of December 28, 2019, approximately $164.7 million of the Board's current repurchase authorization remained unspent. Note 12. Stock-Based Compensation Under the Corporation’s 2017 Stock-Based Compensation Plan (the "Plan"), effective May 9, 2017, the Corporation may award options to purchase shares of the Corporation’s common stock and grant other stock awards to executives, managers, and key personnel. Upon shareholder approval of the Plan in May 2017, no future awards were granted under the Corporation’s 2007 Stock-Based Compensation Plan, but all outstanding awards previously granted under that plan shall remain outstanding in accordance with their terms. As of December 28, 2019, there were approximately 2.1 million shares available for future issuance under the Plan. The Plan is administered by the Human Resources and Compensation Committee of the Board. Restricted stock units awarded under the Plan are expensed ratably over the vesting period of the awards. Stock options awarded to members under the Plan must be at exercise prices equal to or exceeding the fair market value of the Corporation’s common stock on the date of grant. Stock options are generally subject to four-year cliff vesting and must be exercised within 10 years from the date of grant. The Corporation measures stock-based compensation expense at grant date, based on the fair value of the award, and recognizes expense over the employees' requisite service periods. Stock-based compensation expense is the cost of stock options and time-based restricted stock units issued under the shareholder approved stock-based compensation plans and shares issued under the shareholder approved member stock purchase plans. Compensation cost charged against operations for the Plan and the 2017 MSPP described in "Note 11. Accumulated Other Comprehensive Income (Loss) and Shareholders' Equity" in the Notes to Consolidated Financial Statements was as follows (in thousands):
The total income tax benefit recognized in the Consolidated Statements of Comprehensive Income for share-based compensation arrangements was as follows (in thousands):
63
2019 2018 2017 Shares repurchased 2,286,200 755,221 1,462,936 Average price per share $ 36.70 $ 38.96 $ 40.25
Cash purchase price $ (83,907 ) $ (29,424 ) $ (58,887 )
Purchases unsettled as of quarter end 374 354 1,382 Prior year purchases settled in current year (354 ) (1,382 ) —
Shares repurchased per cash flow $ (83,887 ) $ (30,452 ) $ (57,505 )
2019 2018 2017 Compensation cost $ 6,830 $ 7,317 $ 7,750
2019 2018 2017 Income tax benefit $ 1,545 $ 1,582 $ 2,581

Table of Contents Stock-based compensation expense was estimated on the date of grant using the Black-Scholes option-pricing model with the following assumptions by grant year:
Expected volatilities were based on historical volatility as the Corporation does not expect that future volatility over the expected term of the options is likely to differ from the past. The Corporation used a calculation method based on the historical daily frequency for a period of time equal to the expected term. The Corporation used the current dividend yield as there are no plans to substantially increase or decrease its dividends. The Corporation used historical exercise experience to determine the expected term. The risk-free interest rate was selected based on yields from treasury securities as published by the Federal Reserve equal to the expected term of the options. The amount of stock-based compensation expense recognized during a period is also based on the portion of the stock options that are ultimately expected to vest. The Corporation estimates pre-vesting forfeitures at the time of grant by analyzing historical data and revises those estimates in subsequent periods if actual forfeitures differ from those estimates. The following table summarizes the changes in outstanding stock options:
A summary of the Corporation’s non-vested stock options and changes during the year are presented below:
As of December 28, 2019, there was $3.1 million of unrecognized compensation cost net of estimated forfeitures related to non-vested stock option awards, which the Corporation expects to recognize over a weighted-average period of 1.1 years.
64
2019 2018 2017 Expected term 5 years 5 years 6 years Expected volatility (weighted-average) 33.86 % 34.12 % 38.07 %
Expected dividend yield (weighted-average) 2.98 % 2.97 % 2.36 %
Risk-free interest rate (weighted-average) 2.52 % 2.66 % 2.17 %
Number of
Shares
Weighted Average
Exercise Price
Outstanding as of December 31, 2016 3,504,335 $ 31.68 Granted 537,795 46.61 Exercised (446,817 ) 25.55 Forfeited or Expired (33,029 ) 40.81
Outstanding as of December 30, 2017 3,562,284 $ 34.63 Granted 788,301 38.53 Exercised (647,759 ) 26.28 Forfeited or Expired (75,821 ) 38.36
Outstanding as of December 29, 2018 3,627,005 $ 36.89 Granted 637,763 39.64 Exercised (921,900 ) 30.29 Forfeited or Expired (120,143 ) 39.29
Outstanding as of December 28, 2019 3,222,725 $ 39.24
Number of
Shares
Weighted Average Grant-Date Fair Value
Non-vested as of December 29, 2018 2,001,418 $ 11.46 Granted 637,763 9.84 Vested (920,133 ) 12.47 Forfeited (116,475 ) 10.27
Non-vested as of December 28, 2019 1,602,573 $ 10.32

Table of Contents Information about stock options expected to vest or currently exercisable is as follows:
Other information for the last three years is as follows (in thousands):
The Corporation has occasionally issued restricted stock units ("RSUs") to executives, managers, and key personnel. The RSUs vest three years after the grant date. No dividends are accrued on the RSUs. The share-based compensation expense associated with the RSUs is based on the quoted market price of HNI Corporation shares on the date of grant less the discounted present value of dividends not received on the shares and is amortized using the straight-line method from the grant date through the vesting date. The following table summarizes the changes in outstanding RSUs:
As of December 28, 2019, there was $0.4 million of unrecognized compensation cost related to RSUs, which the Corporation expects to recognize over a weighted-average period of 1.0 year. The total value of shares vested was as follows (in thousands):
65
December 28, 2019
Number of
Shares
Weighted-Average
Exercise Price
Weighted-Average
Remaining Exercisable
Period (years)
Aggregate Intrinsic Value
($000s)
Expected to vest 1,484,810 $ 38.95 8.0 $ 1,597 Exercisable 1,620,152 $ 39.46 5.1 $ 3,901
2019 2018 2017 Total fair value of shares vested $ 11,470 $ 7,204 $ 8,057 Total intrinsic value of options exercised $ 5,981 $ 8,917 $ 7,270 Cash received from exercise of stock options $ 27,926 $ 17,021 $ 11,418 Tax benefit realized from exercise of stock options $ 1,353 $ 1,928 $ 2,423 Weighted-average grant-date fair value of options granted $ 9.84 $ 9.72 $ 14.41
Number of
Shares
Weighted-Average Grant Date Fair Value
Outstanding as of December 31, 2016 60,500 $ 38.54 Granted — — Vested (18,500 ) 35.36 Forfeited (5,000 ) 51.54
Outstanding as of December 30, 2017 37,000 $ 38.38 Granted 23,224 40.44 Vested (12,000 ) 51.54 Forfeited (2,500 ) 28.90
Outstanding as of December 29, 2018 45,724 $ 36.49 Granted 10,000 36.05 Vested (24,823 ) 33.30 Forfeited (9,289 ) 40.22
Outstanding as of December 28, 2019 21,612 $ 38.41
2019 2018 2017 Value of shares vested $ 827 $ 618 $ 654

Table of Contents The following table details deferred compensation, which is a combination of cash and stock, and the affected line item in the Consolidated Balance Sheets where deferred compensation is presented (in thousands):
Note 13. Retirement Benefits The Corporation has a defined contribution retirement plan covering substantially all employees. The Corporation's annual contribution to the plan is based on employee eligible earnings. A portion of the contribution is also based on results of operations, and a portion is contributed in the form of common stock of the Corporation. The following table reconciles the annual contribution (in thousands):
Note 14. Post-Retirement Health Care The Corporation offers a fixed subsidy to certain retirees who choose to participate in a third party insurance plan selected by the Corporation. Guidance on employers’ accounting for other post-retirement plans requires recognition of the overfunded or underfunded status on the balance sheet. Under this guidance, gains and losses, prior service costs and credits, and any remaining transition amounts under previous guidance not yet recognized through net periodic benefit cost are recognized in accumulated other comprehensive income (loss), net of tax effects, until they are amortized as a component of net periodic benefit cost. Also, the measurement date – the date at which the benefit obligation and plan assets are measured – is required to be the Corporation’s fiscal year-end.
66
December 28,
2019 December 29,
2018
Current maturities of other long-term obligations $ 850 $ 2,356 Other long-term liabilities 9,740 8,729
Total deferred compensation $ 10,590 $ 11,085
Total fair-market value of deferred compensation $ 7,503 $ 7,857
2019 2018 2017 Stock contribution $ 7,237 $ 7,174 $ 7,327 Cash contribution 21,171 21,413 23,834
Total annual contribution $ 28,408 $ 28,587 $ 31,161

Table of Contents The following table sets forth the activity and reporting location of the benefit obligation and plan assets (in thousands):
Estimated future benefit payments are as follows (in thousands):
Expected contributions are as follows (in thousands):
67
2019 2018 Change in benefit obligation
Benefit obligation at beginning of year $ 19,552 $ 22,933 Service cost 680 853 Interest cost 795 789 Benefits paid (1,607 ) (1,570 )
Actuarial (gain) loss 2,398 (3,453 )
Benefit obligation at end of year $ 21,818 $ 19,552 Change in plan assets
Fair value at beginning of year $ — $ — Actual return on assets — — Employer contribution 1,607 1,570 Transferred out — — Benefits paid (1,607 ) (1,570 )
Fair value at end of year $ — $ —
Funded Status of Plan $ (21,818 ) $ (19,552 )
Amounts recognized in the Statement of Financial Position consist of: Current liabilities $ 1,081 $ 1,057 Non-current liabilities $ 20,737 $ 18,495
Amounts recognized in Accumulated Other Comprehensive Income (Loss) (before tax) consist of: Actuarial (gain) loss $ 2,384 $ (14 )
Change in Accumulated Other Comprehensive Income (before tax):
Amount disclosed at beginning of year $ (14 ) $ 3,565 Actuarial (gain) loss 2,398 (3,453 )
Amortization of transition amount — (126 )
Amount disclosed at end of year $ 2,384 $ (14 )
Fiscal 2020 $ 1,081 Fiscal 2021 $ 1,069 Fiscal 2022 $ 1,069 Fiscal 2023 $ 1,083 Fiscal 2024 $ 1,098 Fiscal 2025 – 2029 $ 5,933
Fiscal 2020 $ 1,081

Table of Contents The discount rate is set at the measurement date to reflect the yield of a portfolio of high quality, fixed income debt instruments. The discount rate used was as follows:
The Corporation's payment for these benefits is a fixed subsidy per the plan; therefore, healthcare trend rates have no impact on the Corporation’s cost. There were no funds designated as plan assets. A discount rate of 3.2 percent was used to determine net periodic benefit costs for 2020. The following table sets forth the components of net periodic benefit costs (in thousands):
Note 15. Leases The Corporation implemented ASU No. 2016-02, Leases (Topic 842), at the beginning of fiscal 2019 using the modified-retrospective transition approach. The new standard requires lessees to recognize most leases, including operating leases, on-balance sheet via a right of use ("ROU") asset and lease liability. The Corporation selected a technology tool to assist with the accounting and disclosure requirements of the new standard. All necessary changes required by the new standard, including those to the Corporation's accounting policies, business process, systems, controls, and disclosures, were identified and implemented as of the first quarter 2019. Implementation of ASU No. 2016-02 increased retained earnings by $3.0 million. This included an increase of $3.3 million driven by the recognition of the remaining deferred gain on a 2018 sale-leaseback directly into retained earnings. An offsetting decrease of $0.3 million was driven by the calculation of beginning ROU assets and lease liabilities. The Corporation recognized $73.8 million in ROU assets and $82.0 million in lease liabilities as a result of the implementation of this standard. The Corporation leases certain showrooms, office space, manufacturing facilities, distribution centers, retail stores and equipment and determines if an arrangement is a lease at inception. ROU assets represent the right to use an underlying asset for the lease term and lease liabilities represent the obligation to make lease payments arising from the lease. Leases with an initial term of twelve months or less are not recorded on the Consolidated Balance Sheets; expense for these leases is recognized on a straight-line basis over the lease term. As the rates implicit in its leases cannot be readily determined, the Corporation uses a secured incremental borrowing rate based on the information available at the commencement date in determining the present value of lease payments. The Corporation uses separate discount rates for its United States operations and overseas operations. Certain real estate leases include one or more options to renew with renewal terms that can extend the lease term from one to ten years. The exercise of lease renewal options is at the Corporation's sole discretion. Certain real estate leases include an option to terminate the lease term earlier than the specified lease term for a fee. These options are not included as part of the lease term unless they are reasonably certain to be exercised. Many of the Corporation's real estate lease agreements include periods of rent holidays and payments that escalate over the lease term by specified amounts. While not significant, certain equipment leases have variable lease payments based on machine hours and certain real estate leases have rate changes based on the Consumer Price Index. The Corporation's lease agreements do not contain any material residual value guarantees. The Corporation has lease agreements with lease and non-lease components, which are generally accounted for as a single lease component. On occasion, the Corporation rents or subleases certain real estate to third parties. This sublease portfolio consists mainly of operating leases for office furniture showrooms and is not significant.
68
2019 2018 2017 Discount rate 3.2 % 4.2 % 3.5 %
2020 Service cost $ 777 Interest cost 675 Amortization of net (gain) loss 20
Net periodic post-retirement benefit cost $ 1,472

Table of Contents Leases included in the Consolidated Balance Sheets consisted of the following (in thousands):
Approximately 86 percent of the value of the leased assets is for real estate. The remaining 14 percent of the value of the leased assets is for equipment. Lease costs included in the Consolidated Statements of Comprehensive Income consisted of the following (in thousands):
69
Classification December 28,
2019
Assets
Right-of-use operating leases $ 72,883 Right-of-use finance leases 2,129
Total Right-of-use operating / finance leases $ 75,012
Liabilities
Current lease obligations - operating $ 22,219 Current lease obligations - finance 563 Total Current lease obligations - operating / finance 22,782
Long-term lease obligations - operating 58,233 Long-term lease obligations - finance 1,581 Total Long-term lease obligations - operating / finance 59,814
Total lease obligations - operating / finance $ 82,596
Classification 2019 Operating lease costs
Fixed Cost of sales $ 1,803 Selling and administrative expenses 24,149
Short-term / variable Cost of sales 700 Selling and administrative expenses 1,140 Finance lease costs
Amortization Cost of sales, selling and administrative, and interest expense 480 Less: Sublease income 181
Total lease costs $ 28,091

Table of Contents Maturity of lease liabilities as of December 28, 2019 is as follows (in thousands):
The following table summarizes the weighted-average discount rates and weighted-average remaining lease terms for operating and finance leases as of December 28, 2019:
The following table summarizes cash paid for amounts included in the measurements of lease liabilities and the leased assets obtained in exchange for new operating and finance lease liabilities (in thousands):
Accounting Policies and Practical Expedients Elected The Corporation elected to use the modified-retrospective method of adopting ASU 2016-02. It has been applied to all leases active on or after December 30, 2018, the start of the Corporation's fiscal year. The Corporation elected the following practical expedients as a result of adopting ASU 2016-02:
70
Operating Leases
(a) Finance Leases
(b) Total
2020 $ 25,181 $ 630 $ 25,811 2021 18,597 602 19,199 2022 13,054 516 13,570 2023 10,006 436 10,442 2024 5,745 112 5,857 Thereafter 17,609 — 17,609 Total lease payments 90,192 2,296 92,488 Less: Interest 9,742 150 9,892
Present value of lease liabilities $ 80,450 $ 2,146 $ 82,596
(a) At this time there are no operating lease options to extend lease terms that are reasonably certain of being exercised. Currently the Corporation has $0.2 million of legally binding minimum lease payments for operating leases signed but not yet commenced, which are excluded from operating lease liabilities.
(b) At this time there are no finance lease options to extend lease terms that are reasonably certain of being exercised. Currently the Corporation has $0.4 million of legally binding minimum lease payments for finance leases signed but not yet commenced, which are excluded from finance lease liabilities.
Weighted-Average
Discount Rate (percent)
Weighted-Average Remaining Lease Term
(years)
Operating leases 4.1 % 5.4
Finance leases 3.6 % 4.0
2019 Cash paid for amounts included in the measurements of lease liabilities
Operating cash flows from operating / finance leases $ 26,446 Financing cash flows from finance leases $ 419
Leased assets obtained in exchange for new operating / finance lease liabilities $ 25,268
• The Corporation has made an accounting election by class of underlying assets to not separate non-lease components of a contract from the lease components to which they relate for all classes of assets except for embedded leases.
• The Corporation has elected not to restate prior period financial statements for the effects of the new standard. Required ASC 840 disclosures for periods prior to 2019 have been provided.
• The Corporation has elected not to use hindsight in determining the lease term and in assessing the likelihood that a lessee purchase option will be exercised.

Table of Contents
Presented below are the final disclosures utilizing ASC 840 treatment which was provided in the Corporation's Annual Report on Form 10-K for the fiscal year ended December 29, 2018: Commitments for minimum rentals as of December 29, 2018 under non-cancelable leases were as follows (in thousands):
There were no capitalized leases as of December 29, 2018 and December 30, 2017. Rent expense under ASC 840 was as follows (in thousands):
There was no contingent rent expense under operating leases for the years 2018 and 2017. As part of the Corporation's continued efforts to drive efficiency and simplification, the Corporation entered into a sale-leaseback transaction in the first quarter of 2018, selling a manufacturing facility and subsequently leasing back a portion of the facility for a term of 10 years. The net proceeds from the sale of the facility of $16.9 million were reflected in "Proceeds from sale and license of property, plant, equipment, and intangibles" in the Consolidated Statements of Cash Flows in 2018. In accordance with ASC 840, the $5.1 million gain on the sale of the facility was deferred and was amortized as a reduction to rent expense evenly over the term of the lease. In accordance with the ASU No. 2016-02 adoption, the remaining unamortized deferred gain related to the sale-leaseback as of December 29, 2018 was recognized directly in "Retained earnings" in the Condensed Consolidated Balance Sheets in the first quarter of 2019 as a cumulative-effect adjustment as the Corporation transferred control of the asset. Note 16. Guarantees, Commitments, and Contingencies The Corporation utilizes letters of credit and surety bonds in the amount of approximately $24 million to back certain insurance policies and payment obligations. The Corporation utilizes trade letters of credit and banker's acceptances in the amount of approximately $1 million to guarantee certain payments to overseas suppliers. The letters of credit, bonds, and banker's acceptances reflect fair value as a condition of their underlying purpose and are subject to competitively determined fees. The Corporation has contingent liabilities which have arisen in the ordinary course of its business, including liabilities relating to pending litigation, environmental remediation, taxes, and other claims. It is the Corporation's opinion, after consultation with legal counsel, that liabilities, if any, resulting from these matters are not expected to have a material adverse effect on the Corporation's financial condition, cash flows, or on the Corporation's quarterly or annual operating results when resolved in a future period.
71
• The Corporation has elected for all asset classes to not recognize ROU assets and lease liabilities for leases that at the acquisition date have a remaining lease term of twelve months or less.
Operating
Leases
2019 $ 24,387 2020 18,250 2021 13,324 2022 9,082 2023 6,228 Thereafter 10,469
Total minimum lease payments $ 81,740
2018 2017 Rent expense $ 31,027 $ 32,158
Table of Contents Note 17. Reportable Segment Information Management views the Corporation as being in two reportable segments based on industries: office furniture and hearth products, with the former being the principal segment. The aggregated office furniture segment manufactures and markets a broad line of commercial and home office furniture which includes panel-based and freestanding furniture systems, seating, storage, tables, and architectural products. The hearth products segment manufactures and markets a full array of gas, wood, electric, and pellet fueled fireplaces, inserts, stoves, facings, and accessories. For purposes of segment reporting, intercompany sales between segments are not material, and operating profit is income before income taxes exclusive of certain unallocated corporate expenses. These unallocated general corporate expenses include the net costs of the Corporation’s corporate operations. Management views interest income and expense as corporate financing costs and not as a reportable segment cost. In addition, management applies an effective income tax rate to its consolidated income before income taxes so income taxes are not reported or viewed internally on a segment basis. Identifiable assets by segment are those assets applicable to the respective industry segments. Corporate assets consist principally of cash and cash equivalents, short-term investments, long-term investments, IT infrastructure, and corporate office real estate and related equipment. No geographic information for revenues from external customers or for long-lived assets is disclosed since the Corporation’s primary market and capital investments are concentrated in the United States.
72

Table of Contents Reportable segment data reconciled to the Corporation's consolidated financial statements was as follows (in thousands):
The Corporation's net sales by product category were as follows (in thousands):
Summary of Quarterly Results of Operations (Unaudited) In the opinion of the Corporation’s management, the following information has been prepared on the same basis as the consolidated financial statements appearing elsewhere in this report and includes all adjustments (consisting only of normal recurring accruals) necessary to state fairly the financial results set forth herein. Results of operations for any previous quarter are not necessarily indicative of results for any future period.
2019 2018 2017 Net Sales:
Office furniture $ 1,697,186 $ 1,706,092 $ 1,660,723 Hearth products 549,761 551,803 515,159
Total $ 2,246,947 $ 2,257,895 $ 2,175,882
Income Before Income Taxes: Office furniture (a) $ 103,894 $ 75,965 $ 50,176 Hearth products (b) 94,329 91,367 83,649 General corporate (46,881 ) (39,159 ) (57,135 )
Operating income 151,342 128,173 76,690 Interest expense, net 8,628 9,448 6,078
Total $ 142,714 $ 118,725 $ 70,612
Depreciation and Amortization Expense: Office furniture $ 44,887 $ 44,303 $ 48,435 Hearth products 8,884 8,171 10,109 General corporate 23,656 22,314 14,328
Total $ 77,427 $ 74,788 $ 72,872
Capital Expenditures (including capitalized software): Office furniture $ 41,137 $ 47,860 $ 79,458 Hearth products 12,225 8,854 17,356 General corporate 13,523 6,982 30,577
Total $ 66,885 $ 63,696 $ 127,391
Identifiable Assets: Office furniture $ 874,913 $ 797,574 $ 821,767 Hearth products 364,653 352,060 347,189 General corporate 212,946 252,210 222,594
Total $ 1,452,512 $ 1,401,844 $ 1,391,550
(a) Included in operating profit for the office furniture segment are pretax charges of $2.4 million, $16.4 million, and $32.5 million, for restructuring and impairment charges in 2019, 2018, and 2017, respectively.
(b) Included in operating profit for the hearth products segment are pretax charges of $1.2 million and $4.9 million for closing facilities in 2018 and 2017.
2019 2018 2017 Systems and storage $ 951,965 $ 1,015,900 $ 1,069,518 Seating 583,245 598,722 536,501 Other 161,976 91,470 54,704 Hearth products 549,761 551,803 515,159
$ 2,246,947 $ 2,257,895 $ 2,175,882

The following tables present certain unaudited quarterly financial information for each of the past eight quarters (in thousands, except per share data):
73
2019
First
Quarter Second Quarter
Third Quarter
Fourth Quarter
Net sales $ 479,456 $ 526,026 $ 625,386 $ 616,079 Cost of sales 309,842 333,437 387,715 382,192
Gross profit 169,614 192,589 237,671 233,887 Selling and administrative expenses 165,937 168,411 176,731 168,969 Restructuring and impairment charges — 930 284 1,157
Operating income 3,677 23,248 60,656 63,761 Interest expense, net 2,111 2,480 2,205 1,833 Income before income taxes 1,566 20,768 58,451 61,928
Income tax expense 546 4,957 12,375 14,333 Net income 1,020 15,811 46,076 47,595
Less: Net income (loss) attributable to non-controlling interest (2 ) 1 (2 ) 0
Net income attributable to HNI Corporation $ 1,022 $ 15,810 $ 46,078 $ 47,595
Average number of common shares outstanding - basic 43,534 43,218 42,899 42,755
Net income attributable to HNI Corporation per common share – basic $ 0.02 $ 0.37 $ 1.07 $ 1.11
Average number of common shares outstanding - diluted 44,089 43,634 43,186 43,137 Net income attributable to HNI Corporation per common share – diluted $ 0.02 $ 0.36 $ 1.07 $ 1.10
As a Percentage of Net Sales: Net sales 100.0 % 100.0 % 100.0 % 100.0 %
Gross profit 35.4 36.6 38.0 38.0 Selling and administrative expenses 34.6 32.0 28.3 27.4 Restructuring and impairment charges — 0.2 0.0 0.2 Operating income 0.8 4.4 9.7 10.3 Income tax expense 0.1 0.9 2.0 2.3 Net income attributable to HNI Corporation 0.2 3.0 7.4 7.7

Table of Contents
74 (Back To Top)
Exhibit 4.1
DESCRIPTION OF SECURITIES
The following description of the Corporation’s common stock, par value $1.00 (the “Common Stock”) is a summary and does not purport to be complete. It is subject to and qualified in its entirety by reference to the Corporation’s amended and restated articles of incorporation (the “Charter”) and amended and restated by-laws (the “By-Laws”), which are filed as exhibits to this Annual Report on Form 10-K. The Corporation encourages you to read these documents and applicable Iowa law for additional information. Authorized Capital Shares
The Corporation’s authorized capital stock consists of 200,000,000 shares of common stock, $1.00 par value per share and 2,000,000 shares of preferred stock, $1.00 par value per share. On January 31, 2020, the Corporation had 42,554,705 outstanding shares of Common Stock. There are no shares of preferred stock outstanding.
2018
First
Quarter Second Quarter
Third Quarter
Fourth Quarter
Net sales $ 505,069 $ 543,614 $ 611,120 $ 598,092 Cost of sales 328,150 342,744 377,789 374,174
Gross profit 176,919 200,870 233,331 223,918 Selling and administrative expenses 171,895 172,973 179,577 166,695 Restructuring and impairment charges 1,338 837 128 13,422
Operating income 3,686 27,060 53,626 43,801 Interest expense, net 2,224 2,629 2,522 2,073 Income before income taxes 1,462 24,431 51,104 41,728
Income tax expense (benefit) (999 ) 5,835 11,197 9,366 Net income 2,461 18,596 39,907 32,362
Less: Net loss attributable to non-controlling interest (49 ) (1 ) — (1 )
Net income attributable to HNI Corporation $ 2,510 $ 18,597 $ 39,907 $ 32,363
Average number of common shares outstanding - basic 43,360 43,665 43,823 43,708
Net income attributable to HNI Corporation per common share – basic $ 0.06 $ 0.43 $ 0.91 $ 0.74
Average number of common shares outstanding - diluted 44,134 44,290 44,679 44,311 Net income attributable to HNI Corporation per common share – diluted $ 0.06 $ 0.42 $ 0.89 $ 0.73
As a Percentage of Net Sales: Net sales 100.0 % 100.0 % 100.0 % 100.0 %
Gross profit 35.0 37.0 38.2 37.4 Selling and administrative expenses 34.0 31.8 29.4 27.9 Restructuring and impairment charges 0.3 0.2 0.0 2.2 Operating income 0.7 5.0 8.8 7.3 Income tax expense (benefit) (0.2 ) 1.1 1.8 1.6 Net income attributable to HNI Corporation 0.5 3.4 6.5 5.4
Section 2: EX-4.1 (EXHIBIT 4.1)
Dividends
Subject to the rights of the holders of any outstanding shares of preferred stock, holders of Common Stock are entitled to receive dividends when, as and if declared by the Corporation’s Board of Directors out of funds legally available thereof. Voting Rights
Each holder of Common Stock is entitled to one vote for each share held on all matters voted upon by the Corporation’s stockholders, including the election of directors. The Common Stock does not have cumulative voting rights. Election of directors is decided by holders of a majority of the shares entitled to vote and present in person or by proxy at a meeting for the election of directors. Other Rights
In the event of the Corporation’s involuntary liquidation, dissolution or winding up, after the payment or provision for payment of the Corporation’s debts and other liabilities and the preferential amounts to which holders of our preferred stock are entitled if any shares of preferred stock are then outstanding), the holders of Common Stock are entitled to share ratably in the Corporation’s remaining assets. Fully Paid and Nonassessable
The outstanding shares of the Corporation’s Common Stock are fully paid and nonassessable. Preemptive or Other Rights
The Common Stock has no preemptive or conversion rights and there are no redemption or sinking fund provisions applicable to it. Listing
The Common Stock is listed on the New York Stock Exchange under the trading symbol “HNI.” Anti-Takeover Effects of the Corporation’s Charter and By-Laws and Iowa Law
Certain provisions of the Corporation’s Charter and By-Laws and Iowa law could make the Corporation’s acquisition by a third party, a change in the Corporation’s incumbent management, or a similar change in control more difficult, including:
These provisions, which are summarized below, are likely to discourage certain types of coercive takeover practices and inadequate
takeover bids. These provisions are also designed to encourage persons seeking to acquire control of the Corporation to first negotiate with its Board of Directors. The Corporation believes these provisions help to protect the
• an acquisition of the Corporation by means of a tender or exchange offer;• an acquisition of the Corporation by means of a proxy contest or otherwise; or• the removal of a majority or all of the Corporation’s incumbent officers and directors.

Corporation’s potential ability to negotiate with the proponent of an unfriendly or unsolicited proposal to acquire or restructure the Corporation, and that this benefit outweighs the potential disadvantages of discouraging such a proposal because the ability to negotiate with the proponent could result in an improvement of the terms of the proposal. This description is intended as a summary only and is qualified in its entirety by reference to the Charter and By-Laws and Iowa law.
Blank Check Preferred Stock
The Corporation’s Board of Directors, without stockholder approval, has the authority under the Charter to issue preferred stock with rights superior to the rights of the holders of Common Stock. As a result, preferred stock could be issued quickly and easily, could impair the rights of holders of Common Stock and could be issued with terms calculated to delay or prevent a change in control or make removal of management more difficult.
Number of Directors; Removal; Filling Vacancies
The Charter provides that the number of directors shall be fixed by the By-Laws, which the Corporation’s Board of Directors can amend without stockholder approval. The By-Laws default to Iowa law with respect to the removal of directors. Iowa law provides that directors may be removed with or without cause where the votes cast by stockholders favoring the action exceed the votes cast by stockholders opposing the action at a stockholder’s meeting at which a quorum is present where one of the purposes of the meeting is to remove one or more directors. A director cannot be removed by written consent of stockholders unless written consents are obtained from the holders of all the outstanding shares entitled to vote on the removal of the director. The By-Laws provide that vacancies on the Corporation’s Board of Directors may be filled by a majority vote of the remaining directors, even though less than a quorum. Iowa law also provides that stockholders may fill any vacancy on the Board of Directors.
Stockholder Action
Iowa law provides that stockholders may act outside of a meeting if one or more written consents describing the action taken are signed by the holders of outstanding shares having not less than ninety percent (90%) of the votes entitled to be cast at a meeting at which all shares entitled to vote on the action were present and voted.
Stockholder Meetings
The By-Laws provide that stockholders can only call a special meeting with the approval of holders of not less than fifty percent (50%) of all votes entitled to be cast on any issue proposed to be considered at the proposed special meeting and subject to compliance with the procedures set forth in the By-Laws, including submitting a request in writing to the Board of Directors to fix a record date for purpose of determining stockholders entitled to demand a special meeting. The By-Laws also provide that the business of special meetings of stockholders shall be confined to the purposes stated in the notice of the meeting. These provisions may discourage another person or entity from making a tender offer, unless it acquired a majority of the Corporation’s outstanding voting stock, because the person or entity could only take action at a duly called stockholders’ meeting relating to the business specified in the notice of meeting and not by written consent.
Requirements for Advance Notification of Stockholder Nominations and Proposals
The By-Laws provide that a stockholder seeking to bring business before an annual meeting of stockholders, or to nominate candidates for election as directors at an annual meeting of stockholders, must provide timely notice of this intention in writing. To be timely, a stockholder must deliver the notice in writing to the Corporation’s Corporate Secretary at the Corporation’s principal executive offices not less than 90 and nor more than 120 days prior to the first anniversary of the preceding year’s annual meeting of stockholders, subject to certain exceptions. The By-Laws also specify requirements as to the form and content of the stockholder’s notice. These provisions could delay stockholder actions that are favored by the holders of a majority of the Corporation’s outstanding shares until the next stockholders’ meeting.
Classified Board of Directors
The Corporation’s Board of Directors is divided into three classes, as nearly equal in number as is reasonably possible, serving staggered terms. One class of directors is elected at each annual meeting to serve a term of three years. The effect of a classified Board of Directors may be to make it more difficult to acquire control of the Corporation.

Iowa Business Combination Statute The Corporation is subject to the provisions of Section 490.1110 of the Iowa Business Corporation Act (the “Business Combination
Statute”). Under the Business Combination Statute, certain “business combinations” between an Iowa corporation whose stock is listed on a national securities exchange or authorized for quotation on the national association of securities dealers automated quotations or held of record by more than 2,000 stockholders and an “interested shareholder” are prohibited for a three-year period following the date that such person became an interested shareholder, unless: (i) prior to the time the interested shareholder became an interested shareholder, the board of directors of the corporation approved either the business combination or the transaction which resulted in the interested shareholder becoming an interested shareholder; (ii) at or subsequent to the time the interested shareholder became an interested shareholder, the business combination is approved by the board of directors and authorized at an annual or special meeting of stockholders (such approval shall not be by written consent) by the affirmative vote of at least sixty-six and two-thirds percent (66-2/3%) of the outstanding voting stock which is not owned by the interested shareholder; or (iii) upon consummation of the transaction that made it an interested shareholder, the interested shareholder owned at least 85% of the voting stock of the corporation outstanding at the commencement of the transaction (excluding voting stock owned by directors and officers, and by employee stock plans in which employee participants do not have the right to determine confidentially whether shares held subject to the plan will be tendered in a tender or exchange offer). The three-year prohibition also does not apply to certain business combinations proposed by an interested shareholder following the announcement or notification of certain extraordinary transactions involving the corporation and a person who had not been an interested shareholder during the previous three years. The term “business combination” is defined generally to include mergers or consolidations between an Iowa corporation and an “interested shareholder,” transactions with an “interested shareholder” involving the assets or stock of the corporation or its majority-owned subsidiaries and transactions which increase an interested shareholder’s percentage ownership of stock. The term “interested shareholder” is defined generally as a shareholder who, together with affiliates and associates, owns (or, within three years prior, did own) 10% or more of an Iowa corporation’s voting stock. (Back To Top)
HNI Corporation 2017 Stock-Based Compensation Plan:
Restricted Stock Unit Award Agreement
Congratulations on your selection as a Participant who will receive Restricted Stock Units under the HNI Corporation 2017 Stock-Based
Compensation Plan. This Award Agreement provides a brief summary of your rights under the Plan. Capitalized terms found but not defined in this
Award Agreement are defined in the Plan.
The Plan provides complete details of all your rights under the Plan and this Award Agreement, as well as all the conditions and limitations
affecting your rights. If there is any inconsistency between the terms of this Award Agreement and the terms of the Plan, the Plan's terms shall
completely supersede and replace the conflicting terms of this Award Agreement.
Overview of Your Restricted Stock Unit Grant
Section 3: EX-10.22 (EXHIBIT 10.22)
1. Number of Restricted Stock Units Granted: __________
2. Grant Date: __________
3. Vesting of Restricted Stock Units: Subject to the terms of Section 7 and 8 below, 1/3 of the total number of Restricted Stock Units granted
above, rounded up or down to the nearest whole share, will vest on each of the first, second, and third anniversaries of the Grant Date (each
such date, a “Vesting Date”), provided that you remain continuously employed by the Corporation through such Vesting Date.

4. Impact of Vesting of Restricted Stock Units: On each Vesting Date, you will be issued a number of Shares equal to the number of Restricted
Stock Units that become vested on that Vesting Date. A portion of these Shares will be withheld to pay applicable withholding taxes due on
such Vesting Date. To the extent that payroll taxes are required to be withheld prior to a Vesting Date, the Corporation may withhold such taxes
from your cash compensation payable by the Corporation in accordance with Section 3121(v) of the Code.
5. Stockholder Rights: Prior to the time that your Restricted Stock Units vest and the Corporation has issued Shares relating to such Restricted
Stock Units, you will not be deemed to be the holder of, or to have any of the rights of a holder with respect to, any Shares deliverable with
respect to such Restricted Stock Units. However, as of each date on which a cash dividend is paid to holders of Shares, a Divided Equivalent in
an amount equal to the cash dividend that is paid on each Share, multiplied by the number of Restricted Stock Units that remain unvested and
outstanding or otherwise have not been settled as of the dividend payment date (the “Dividend Equivalent Amount”) shall be credited to an
unfunded account for your benefit. The aggregate Dividend Equivalent Amount, if any, credited to such account shall vest and be paid in cash
at the same time and subject to the same vesting conditions as the corresponding Restricted Stock Units to which the Dividend Equivalent
Amount relates. From and after the date Shares are actually issued or delivered upon settlement of the Restricted Stock Units, you then will
have dividend rights with respect to those Shares.

6. Non-Transferability of Restricted Stock Units:
(a) No assignment or transfer of Restricted Stock Units, whether voluntary or involuntary, by operation of law or otherwise, can be made
except by will or the laws of descent and distribution or pursuant to beneficiary designation procedures approved by the Corporation.
(b) Notwithstanding the preceding paragraph, you may transfer your Restricted Stock Units to one or more family members (as such term
is used in the Plan) or to one or more trusts established solely for the benefit of one or more family members or to one or more
partnerships in which the only partners are family members; provided, however, that (i) no such transfer shall be effective unless you
deliver reasonable prior notice thereof to the Corporation and such transfer is thereafter effected subject to the specific authorization
of, and in accordance with any terms and conditions that shall have been made applicable thereto by, the Committee or the Board, (ii)
any such transferee shall be subject to the same terms and conditions hereunder as you are and (iii) such transfer cannot be made for
value.
7. Termination of Employment:
(a) Death or Disability: If your employment terminates due to your death or you become Disabled, as defined below, your outstanding
Restricted Stock Units which are outstanding as of the date of your death or Disability shall become immediately 100% vested, provided
that you are employed by the Corporation on the date of your death or Disability. The Shares subject to the Restricted Stock Units that
become vested pursuant to this Section 7(a) shall be issued to you or your beneficiary or estate within 60 days after the date of your
death or Disability. For purposes of this Award Agreement, and notwithstanding the terms of the Plan, you will be considered
“Disabled” or to have a “Disability” if you are, by reason of any medically determinable physical or mental impairment that can be
expected to result in death or can be expected to last for a continuous period of not less than 12 months, receiving income replacement
benefits for a period of not less than three months under an accident and health plan covering employees of the Corporation.
(b) By Retirement: If your employment terminates after your Retirement Eligible Date for a reason other than Cause, as defined below, your
outstanding Restricted Stock Units shall continue to vest in accordance with Section 3 as though your employment had continued
through each remaining vesting date. The Shares subject to the Restricted Stock Units that become vested pursuant to this Section 7(b)
shall be issued to you within 60 days after the applicable vesting date.
(c) For Other Reasons: Restricted Stock Units which are not vested as of the date of employment termination for reasons other than those
specified in Section 7(a) or 7(b) and which have not become vested pursuant to Section 8 shall immediately terminate and shall be
forfeited to the Corporation.
(d) Definition of Cause: For purposes of this Award Agreement, “Cause” shall have the meaning described in your employment or
severance agreement with the Corporation, or if no such agreements exists, then it shall mean your:

(i) repeated failure to perform a substantial part of your duties and responsibilities; (ii) willful misconduct, illegal act, fraud or dishonesty;
(iii) material violation of the rules of conduct of the Corporation or (iv) violation of your duty of confidentiality and loyalty to the
Corporation, which in each case shall be determined by the Corporation in its sole and absolute discretion.
Please acknowledge your agreement to participate in the Plan and this Award Agreement, and to abide by all of the governing terms and provisions,
by providing your digital signature on the Agreement to Participate. Please print a copy of the Agreement to Participate for your files.
Refer any questions you may have regarding your grant of Restricted Stock Units to the Vice President, Member and Community Relations. Once
again, congratulations on the receipt of your restricted stock unit award.
Sincerely,
Jeff Lorenger
Chairman, President, and CEO
HNI Corporation
8. Change in Control: In the event of a Change in Control, all outstanding Restricted Stock Units shall become fully vested and Section 10.1 of
the Plan will apply. The Shares subject to the Restricted Stock Units that become vested pursuant to this Section 8 shall be issued to you
within 30 days after the date of the Change in Control; provided that if the Change in Control does not constitute a “change in control event,”
within the meaning of Section 409A of the Code, then the Restricted Stock Units shall become fully vested as of the date of the Change in
Control, but the Shares subject to such Restricted Stock Units shall not be issued to you until the dates on which the Restricted Stock Units
otherwise would have become vested and issuable pursuant to Section 3 of this Award Agreement.
9. Section 409A. The Restricted Stock Units are intended to be exempt from or comply with Section 409A of the Code, and this Award Agreement
shall be interpreted and construed accordingly.
HNI Corporation 2017 Stock-Based Compensation Plan:
Restricted Stock Unit Award
Agreement to Participate
By signing this Agreement to Participate, I acknowledge that I have read the Award Agreement and the Plan, and that I fully understand all of my
rights thereunder, as well as all of the terms and conditions which may limit the vesting of the Restricted Stock Units.
Electronic Signature Date of Signature
Participant Name
(Back To Top)
HNI Corporation 2017 Stock-Based Compensation Plan:
Performance Share Unit Award Agreement
Congratulations on your selection as a Participant who will receive Performance Share Units under the HNI Corporation 2017 Stock-Based
Compensation Plan. This Award Agreement provides a brief summary of your rights under the Plan. Capitalized terms found but not defined in this
Award Agreement are defined in the Plan.
The Plan provides complete details of all your rights under the Plan and this Award Agreement, as well as all the conditions and limitations
affecting your rights. If there is any inconsistency between the terms of this Award Agreement and the terms of the Plan, the Plan's terms shall
completely supersede and replace the conflicting terms of this Award Agreement.
Overview of Your Performance Share Unit Grant
Section 4: EX-10.23 (EXHIBIT 10.23)
1. Number of Performance Share Units Granted: __________
2. Grant Date: __________
3. Vesting of Performance Share Units: Subject to the terms of Section 7 and 8 below, the Performance Share Units shall vest on __________
(the “Vesting Date”), provided that (i) you remain continuously employed by the Corporation through such Vesting Date and (ii) the
Performance Measures determined by the Committee and set forth on Exhibit A for the period between __________ and the Vesting Date (the
“Performance Period”) have been met as of such Vesting Date.
4. Impact of Vesting of Performance Share Units: Within 2½ months after the Vesting Date, or such earlier date on which the Performance Share
Units vest pursuant to Section 8 below, the Company shall issue or deliver to you, subject to the achievement or deemed achievement of the

Performance Measures set forth on Exhibit A and the other conditions of this Award Agreement, unrestricted Shares equal to the number of
Performance Share Units that become vested, rounded up or down to the nearest whole number. A portion of these Shares will be withheld to
pay applicable withholding taxes.
5. Stockholder Rights: Prior to the time that your Performance Share Units vest and the Corporation has issued Shares relating to such
Performance Share Units, you will not be deemed to be the holder of, or to have any of the rights of a holder with respect to, any Shares
deliverable with respect to such Performance Share Units. However, as of each date on which a cash dividend is paid to holders of Shares, a
Divided Equivalent in an amount equal to the cash dividend that is paid on each Share, multiplied by the number of Performance Share Units
that remain unvested and outstanding or otherwise have not been settled as of the dividend payment date (the “Dividend Equivalent
Amount”) shall be credited to an unfunded account for your benefit. The aggregate Dividend Equivalent Amount, if any, credited to such
account shall vest and be paid in cash at the same time and subject to the same vesting and performance conditions as the corresponding
Performance Share Units to which the Dividend Equivalent Amount relates. From and after the date Shares are actually issued or delivered
upon settlement of the Performance Share Units, you then will have dividend rights with respect to those Shares.

6. Non-Transferability of Performance Share Units:
(a) No assignment or transfer of Performance Share Units, whether voluntary or involuntary, by operation of law or otherwise, can be
made except by will or the laws of descent and distribution or pursuant to beneficiary designation procedures approved by the
Corporation.
(b) Notwithstanding the preceding paragraph, you may transfer your Performance Share Units to one or more family members (as such
term is used in the Plan) or to one or more trusts established solely for the benefit of one or more family members or to one or more
partnerships in which the only partners are family members; provided, however, that (i) no such transfer shall be effective unless you
deliver reasonable prior notice thereof to the Corporation and such transfer is thereafter effected subject to the specific authorization
of, and in accordance with any terms and conditions that shall have been made applicable thereto by, the Committee or the Board, (ii)
any such transferee shall be subject to the same terms and conditions hereunder as you are and (iii) such transfer cannot be made for
value.
7. Termination of Employment:
(a) By Death or Disability: If your employment terminates due to your death or Disability, a prorated number of your outstanding
Performance Share Units shall become vested at the end of the Performance Period, which prorated number shall be determined by
multiplying the number of Performance Share Units that are earned at the end of the Performance Period, based on the extent to which the
Performance Measures set forth on Exhibit A are achieved, by a fraction, the numerator of which is the number of months in the
Performance Period that occurred prior to such termination of employment, and the denominator of which is the total number of months
in the Performance Period. For this purpose, you will be credited with a month of employment during the Performance Period only if you
are employed for at least 15 days during such month. Any Performance Share Units that do not become vested pursuant to this Section 7
(a) shall be forfeited. The Performance Share Units that become vested pursuant to this Section 7(a) shall be issued to you or your
beneficiary or estate within 2½ months after the last day of the Performance Period.
(b) By Retirement: If your employment terminates after your Retirement Eligible Date for a reason other than Cause, as defined below, a
prorated number of your outstanding Performance Share Units shall become vested as of the end of the Performance Period. The
prorated number shall be determined by multiplying the number of Performance Share Units that are earned at the end of the Performance
Period, based on the extent to which the Performance Measures set forth on Exhibit A are achieved, by a fraction, the numerator of which
is the number of months in the Performance Period that occurred prior to such termination of employment, and the denominator of which
is the total number of months in the Performance Period. For this purpose, you will be credited with a month of employment during the
Performance Period only if you are employed for at least 15 days during such month. Any Performance Share Units that do not become
vested pursuant to this Section 7(b) shall be forfeited. The Performance Share Units that become vested pursuant to this Section 7(b)
shall be issued to you within 2½ months after the last day of the Performance Period.

Please acknowledge your agreement to participate in the Plan and this Award Agreement, and to abide by all of the governing terms and provisions,
by providing your digital signature on the Agreement to Participate attached hereto as Exhibit B. Please print a copy of the Agreement to Participate
for your files.
Refer any questions you may have regarding your grant of Performance Share Units to the Vice President, Member and Community Relations. Once
again, congratulations on the receipt of your Performance Share Unit award.
Sincerely,
Jeff Lorenger
Chairman, President, and CEO
HNI Corporation
(c) For Other Reasons: Performance Share Units which are not vested as of the date of employment termination for reasons other than those
specified in Section 7(a) or 7(b) and which have not become vested pursuant to Section 8 shall immediately terminate and shall be
forfeited to the Corporation.
(d) Definition of Cause: For purposes of this Award Agreement, “Cause” shall have the meaning described in your employment or
severance agreement with the Corporation, or if no such agreements exists, then it shall mean your: (i) repeated failure to perform a
substantial part of your duties and responsibilities; (ii) willful misconduct, illegal act, fraud or dishonesty; (iii) material violation of the
rules of conduct of the Corporation or (iv) violation of your duty of confidentiality and loyalty to the Corporation, which in each case
shall be determined by the Corporation in its sole and absolute discretion.
8. Change in Control: In the event of a Change in Control, the achievement of the Performance Measures shall be determined, and the
Performance Share Units shall vest in accordance with the terms of the Plan.
9. Section 409A. The Performance Share Units are intended to be exempt from Section 409A of the Code, and this Award Agreement shall be
interpreted and construed accordingly.

EXHIBIT A
Performance Share Unit Award
Performance Measures for the Performance Period
[Insert Performance Metrics]

EXHIBIT B
HNI Corporation 2017 Stock-Based Compensation Plan:
Performance Share Unit Award
Agreement to Participate
By signing this Agreement to Participate, I acknowledge that I have read the Award Agreement and the Plan, and that I fully understand all of my
rights thereunder, as well as all of the terms and conditions which may limit the vesting of the Performance Share Units.
Electronic Signature Date of Signature
Participant Name
(Back To Top)
EXHIBIT 21 SUBSIDIARIES OF THE REGISTRANT
Section 5: EX-21 (EXHIBIT 21)
Subsidiary Country/State of Incorporation Doing Business As
Allsteel Inc. Illinois Allsteel Inc.; HNI Global; HNI One; HNI One - Global Accounts; One from HNI; HNI Canada
Contract Resource Group LLC Delaware Contract Resource Group LLC
Dongguan Lamex Furniture Co. Ltd. PRC Dongguan Lamex Furniture Co. Ltd.
Global Known Ltd. Hong Kong Global Known Ltd.
The Gunlocke Company L.L.C. Iowa The Gunlocke Company L.L.C.
HBF Asia Pacific Limited Hong Kong HBF Asia Pacific Limited
Hearth & Home Technologies LLC Iowa Hearth & Home Technologies; Stellar Hearth; Fireside Hearth & Home
HFM Partners Iowa HFM Partners
Hickory Business Furniture, LLC North Carolina Hickory Business Furniture, LLC; HBF Furniture LLC
HNI Asia L.L.C. Iowa HNI Asia L.L.C.
HNI Asia Technology Services (Shenzhen) Limited PRC HNI Asia Technology Services (Shenzhen) Limited
HNI Holdings Inc. Iowa HNI Holdings Inc.
HNI Hong Kong Limited Hong Kong HNI Hong Kong Limited
HNI International Inc. Iowa HNI International Inc.
HNI International (Mexico) L.L.C. Iowa HNI International (Mexico) L.L.C.
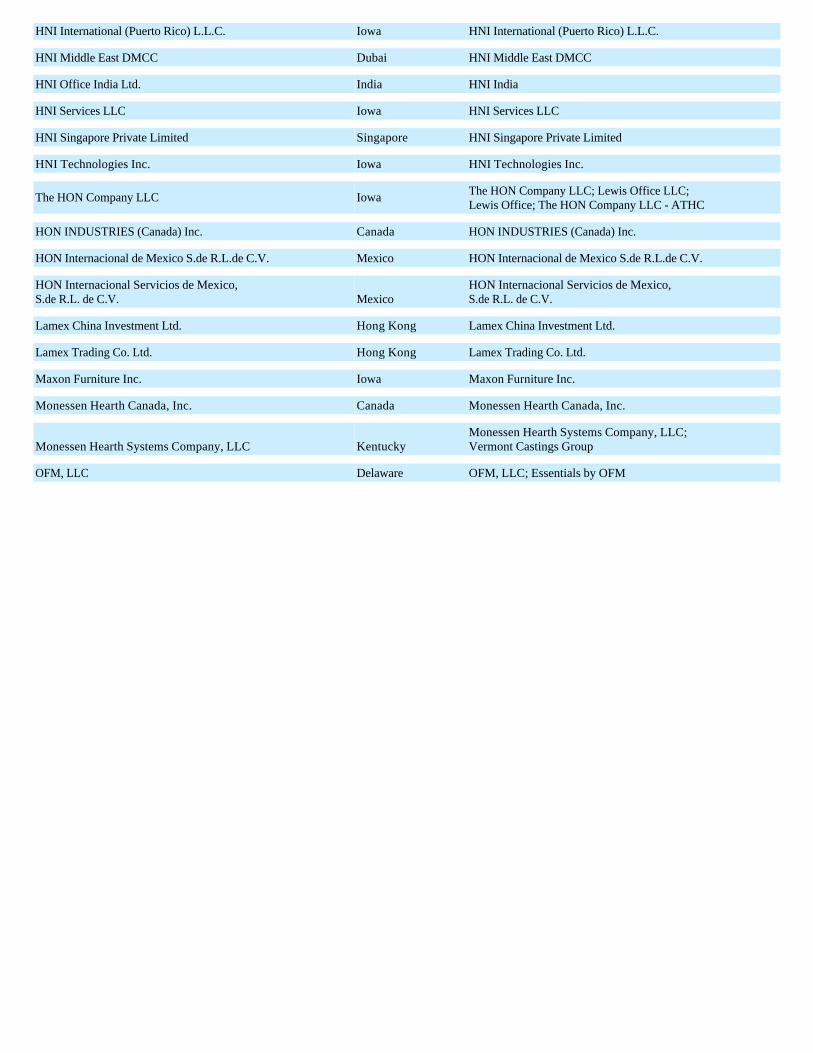
HNI International (Puerto Rico) L.L.C. Iowa HNI International (Puerto Rico) L.L.C.
HNI Middle East DMCC Dubai HNI Middle East DMCC
HNI Office India Ltd. India HNI India
HNI Services LLC Iowa HNI Services LLC
HNI Singapore Private Limited Singapore HNI Singapore Private Limited
HNI Technologies Inc. Iowa HNI Technologies Inc.
The HON Company LLC Iowa The HON Company LLC; Lewis Office LLC; Lewis Office; The HON Company LLC - ATHC
HON INDUSTRIES (Canada) Inc. Canada HON INDUSTRIES (Canada) Inc.
HON Internacional de Mexico S.de R.L.de C.V. Mexico HON Internacional de Mexico S.de R.L.de C.V.
HON Internacional Servicios de Mexico, S.de R.L. de C.V. Mexico
HON Internacional Servicios de Mexico, S.de R.L. de C.V.
Lamex China Investment Ltd. Hong Kong Lamex China Investment Ltd.
Lamex Trading Co. Ltd. Hong Kong Lamex Trading Co. Ltd.
Maxon Furniture Inc. Iowa Maxon Furniture Inc.
Monessen Hearth Canada, Inc. Canada Monessen Hearth Canada, Inc.
Monessen Hearth Systems Company, LLC Kentucky Monessen Hearth Systems Company, LLC; Vermont Castings Group
OFM, LLC Delaware OFM, LLC; Essentials by OFM

(Back To Top)
EXHIBIT 23.1
CONSENT OF INDEPENDENT REGISTERED PUBLIC ACCOUNTING FIRM To the Board of Directors and Shareholders HNI Corporation: We consent to the incorporation by reference in the registration statements (No. 333-190646, No. 333-168761, No. 333-168760, No. 333-168758, No. 333-31366, No. 333-91682, No. 333-142742, No. 333-159935, and No. 333-217793) on Form S-8 and (No. 333-159127) on Form S-3 of HNI Corporation and subsidiaries of our report dated February 25, 2020, with respect to the consolidated balance sheets of HNI Corporation and subsidiaries as of December 28, 2019 and December 29, 2018, and the related consolidated statements of comprehensive income, equity, and cash flows for each of the years in the three-year period ended December 28, 2019, and the related notes (collectively, the "consolidated financial statements"), and the effectiveness of internal control over financial reporting as of December 28, 2019, which report appears in the December 28, 2019 annual report on Form 10-K of HNI Corporation.
As discussed in Note 2 to the consolidated financial statements, the Company changed its method of accounting for Leases in 2019 due to the adoption of Accounting Standards Update (ASU) No. 2016-02, "Leases" and changed its method of accounting for revenue recognition in 2018 due to the adoption of ASU No. 2014-09, "Revenue from Contracts with Customers".
/s/ KPMG LLP
Chicago, Illinois February 25, 2020
(Back To Top)
EXHIBIT 31.1 CERTIFICATION OF CHIEF EXECUTIVE OFFICER
Sarbanes-Oxley Act Section 302 I, Jeffrey D. Lorenger, certify that: 1. I have reviewed this Annual Report on Form 10-K of HNI Corporation; 2. Based on my knowledge, this report does not contain any untrue statement of a material fact or omit to state a material fact necessary to make the
Paoli LLC Iowa Paoli LLC; Paoli Furniture LLC; Paoli LLC of Iowa
Pearl City Insurance Company Arizona Pearl City Insurance Company
Section 6: EX-23.1 (EXHIBIT 23.1)
Section 7: EX-31.1 (EXHIBIT 31.1)

statements made, in light of the circumstances under which such statements were made, not misleading with respect to the period covered by this report; 3. Based on my knowledge, the financial statements, and other financial information included in this report, fairly present in all material respects the financial condition, results of operations, and cash flows of the registrant as of, and for, the periods presented in this report; 4. The registrant's other certifying officer and I are responsible for establishing and maintaining disclosure controls and procedures (as defined in Exchange Act Rules 13a – 15(e) and 15d – 15(e)) and internal control over financial reporting (as defined in Exchange Act Rules 13a – 15(f) and 15d – 15(f)) for the registrant and have: a. designed such disclosure controls and procedures, or caused such disclosure controls and procedures to be designed under our supervision, to ensure that material information relating to the registrant, including its consolidated subsidiaries, is made known to us by others within those entities, particularly during the period in which this report is being prepared; b. designed such internal control over financial reporting, or caused such internal control over financial reporting to be designed under our supervision, to provide reasonable assurance regarding the reliability of financial reporting and the preparation of financial statements for external purposes in accordance with generally accepted accounting principles; c. evaluated the effectiveness of the registrant's disclosure controls and procedures and presented in this report our conclusions about the effectiveness of the disclosure controls and procedures, as of the end of the period covered by this report based on such evaluation; and d. disclosed in this report any change in the registrant's internal control over financial reporting that occurred during the registrant's most recent fiscal quarter (the registrant's fourth fiscal quarter in the case of an annual report) that has materially affected, or is reasonably likely to materially affect, the registrant's internal control over financial reporting; and 5. The registrant's other certifying officer and I have disclosed, based on our most recent evaluation of internal control over financial reporting, to the registrant's auditors and the audit committee of the registrant's board of directors (or persons performing the equivalent functions): a. all significant deficiencies and material weaknesses in the design or operation of internal control over financial reporting which are reasonably likely to adversely affect the registrant's ability to record, process, summarize, and report financial information; and b. any fraud, whether or not material, that involves management or other employees who have a significant role in the registrant's internal control over financial reporting.
(Back To Top)
EXHIBIT 31.2 CERTIFICATION OF CHIEF FINANCIAL OFFICER
Sarbanes-Oxley Act Section 302 I, Marshall H. Bridges, certify that: 1. I have reviewed this Annual Report on Form 10-K of HNI Corporation; 2. Based on my knowledge, this report does not contain any untrue statement of a material fact or omit to state a material fact necessary to make the statements made, in light of the circumstances under which such statements were made, not misleading with respect to the period covered by this report; 3. Based on my knowledge, the financial statements, and other financial information included in this report, fairly present in all material respects the financial condition, results of operations, and cash flows of the registrant as of, and for, the periods presented in this report; 4. The registrant's other certifying officer and I are responsible for establishing and maintaining disclosure controls and procedures (as defined in Exchange Act Rules 13a – 15(e) and 15d – 15(e)) and internal control over financial reporting (as defined in Exchange Act Rules 13a – 15(f) and 15d – 15(f)) for the registrant and have: a. designed such disclosure controls and procedures, or caused such disclosure controls and procedures to be designed under our supervision,
Date: February 25, 2020 By: /s/ Jeffrey D. Lorenger
Name: Jeffrey D. Lorenger
Title: Chairman, President, and Chief Executive Officer
Section 8: EX-31.2 (EXHIBIT 31.2)

to ensure that material information relating to the registrant, including its consolidated subsidiaries, is made known to us by others within those entities, particularly during the period in which this report is being prepared; b. designed such internal control over financial reporting, or caused such internal control over financial reporting to be designed under our supervision, to provide reasonable assurance regarding the reliability of financial reporting and the preparation of financial statements for external purposes in accordance with generally accepted accounting principles; c. evaluated the effectiveness of the registrant's disclosure controls and procedures and presented in this report our conclusions about the effectiveness of the disclosure controls and procedures, as of the end of the period covered by this report based on such evaluation; and d. disclosed in this report any change in the registrant's internal control over financial reporting that occurred during the registrant's most recent fiscal quarter (the registrant's fourth fiscal quarter in the case of an annual report) that has materially affected, or is reasonably likely to materially affect, the registrant's internal control over financial reporting; and 5. The registrant's other certifying officer and I have disclosed, based on our most recent evaluation of internal control over financial reporting, to the registrant's auditors and the audit committee of the registrant's board of directors (or persons performing the equivalent functions): a. all significant deficiencies and material weaknesses in the design or operation of internal control over financial reporting which are reasonably likely to adversely affect the registrant's ability to record, process, summarize, and report financial information; and b. any fraud, whether or not material, that involves management or other employees who have a significant role in the registrant's internal control over financial reporting.
(Back To Top)
EXHIBIT 32.1 Certification of CEO and CFO Pursuant to
18 U.S.C. Section 1350, as Adopted Pursuant to
Section 906 of the Sarbanes-Oxley Act of 2002 In connection with the Annual Report on Form 10-K of HNI Corporation (the "Corporation") for the period ended December 28, 2019, as filed with the Securities and Exchange Commission on the date hereof (the "Report"), Jeffrey D. Lorenger, as Chairman, President, and Chief Executive Officer of the Corporation, and Marshall H. Bridges, as Senior Vice President and Chief Financial Officer of the Corporation, each hereby certifies, pursuant to 18 U.S.C. Section 1350, as adopted pursuant to Section 906 of the Sarbanes-Oxley Act of 2002, that, to the best of his knowledge: 1. The Report fully complies with the requirements of Section 13(a) or 15(d) of the Securities Exchange Act of 1934; and 2. The information contained in the Report fairly presents, in all material respects, the financial condition and results of operations of the Corporation as of the dates and for periods expressed in the Report.
This certification accompanies the Report pursuant to Section 906 of the Sarbanes-Oxley Act of 2002 and shall not, except to the extent required by the Sarbanes-Oxley Act of 2002, be deemed filed by the Corporation for purposes of Section 18 of the Securities Exchange Act of 1934, as amended.
Date: February 25, 2020 By: /s/ Marshall H. Bridges
Name: Marshall H. Bridges
Title: Senior Vice President and Chief Financial Officer
Section 9: EX-32.1 (EXHIBIT 32.1)
Date: February 25, 2020 By: /s/ Jeffrey D. Lorenger
Name: Jeffrey D. Lorenger
Title: Chairman, President, and Chief Executive Officer
Date: February 25, 2020 By: /s/ Marshall H. Bridges
Name: Marshall H. Bridges
Title: Senior Vice President and Chief Financial Officer

(Back To Top)