Embed Size (px)
Citation preview

Towards Equity and Excellence
Highlights from TIMSS 2011 The South African perspective
2
What is TIMSS?
The Trends in International Mathematics and Science Study (TIMSS) is a cross-national assessment of the
mathematics and science knowledge of fourth and eighth Grade learners, conducted by the International Association
for the Evaluation of Educational Achievement (IEA) since 1995. It uses results from achievement tests and
questionnaires conducted with principals, teachers and learners to ascertain achievement scores and contextual
factors relevant to achievement. A stratified sampling methodology is used in which schools are selected on the
basis of province, the language of teaching and learning and public or private status.
TIMSS was designed to align broadly with mathematics and science curricula in the participating countries. The
results, therefore, can be used to determine the degree to which learners have acquired the mathematics and
science concepts and skills likely to have been taught in school. The tests are constructed to measure achievement
to help inform governments, policy makers and educators about the proficiency of their learners at key points in the
educational process. The findings from TIMSS provide an indication of the health of an education system.
TIMSS Conceptual Framework
TIMSS uses the curriculum as the organising principle of how educational opportunities are provided to learners. The
curriculum model has three aspects: (i) the intended curriculum, (ii) the implemented curriculum and (iii) the attained
curriculum. The intended curriculum refers to the mathematics and science knowledge that society intends learners
to learn (the 2002 Revised National Curriculum Statement in South Africa); the implemented curriculum refers to
how the educational system is organised (curriculum coverage) and the attained curriculum refers to what learners
have learnt (learner achievement scores).
TIMSS in South Africa
TIMSS was first administered in South Africa in 1995, and subsequently in 1999 to Grade 8 learners. In 2002 it was
administered to Grade 8 and 9 learners, and in 2011 to Grade 9 learners. Together, the assessments provide data
to analyse trends over almost a decade. For TIMSS 2011 in South Africa, the Human Sciences Research Council
(HSRC) conducted the study in 285 schools among 11969 learners.
Why TIMSS in South Africa?
Mathematics and science are key areas of knowledge for the development of individuals and the society. Public and
private sector, families and households have made major investments in mathematics and science. Performance in
these areas is one of the key indicators to assess the performance of our schooling system. TIMSS allows
participating nations to compare learner educational achievement across borders and offers South Africa an
opportunity to benchmark itself against other countries.
Trends in South African mathematics & science achievement: 1995 to 2011
Figure 1 opposite illustrates the trends in mathematics and science achievement distributions between the bottom
and upper ends at the 5th and 95th percentile for TIMSS 1995, 1999 and 2002 at the Grade 8 level and for TIMSS
2002 and 2011 at the Grade 9 level. It shows an overall improvement in achievement scores.

3
The average national scale score for mathematics and science remained static over the years 1995, 1999 and
2002. This is likely attributable to the structural and educational changes made as the country moved from
apartheid to a democratic state after 1994.
In contrast, from 2002 to 2011, in the public school sector the national average mathematics score increased by 63
points and the national average science score by 60 points. TIMSS estimates that within a 4-year testing cycle a
country could improve by a maximum of up to 40 points (i.e. one grade level). The increases over the two cycles of
TIMSS in South Africa mean that learner performance has improved by one and a half grade levels.
For the period 1995 to 2002, the South African score distribution for both mathematics and science, from the 5th to
95th percentile, was one of the widest of all countries participating in TIMSS. This reflects the wide disparities in
society and in schools, and is evident in the educational outcomes of the learners. In 2011, the variance in the range
of mathematics and science scores in South Africa decreases, suggesting that the country is moving towards more
equitable educational outcomes.
The achievement scores at the 5thpercentile, generally those of learners from low-income households and the most
disadvantaged schools, have increased between 2002 and 2011.
MATHEMATICS Ave scale score (SE) Achievement distribution
Grade 9 TIMSS 2011 352 (2.5)
Grade 9 TIMSS 2002 285 (4.2)
Grade 8 TIMSS 2002 264 (5.5)
Grade 8 TIMSS 1999 275 (6.8)
Grade 8 TIMSS 1995 276 (6.7)
SCIENCE
Grade 9 TIMSS 2011 332 (3.7)
Grade 9 TIMSS 2002 268 (5.5)
Grade 8 TIMSS 2002 244 (6.7)
Grade 8 TIMSS 1999 243 (7.8)
Grade 8 TIMSS 1995 260 (7.9)
0 100 200 300 400 500 600
95% Confidence Interval for Average (±2SE)
Percentiles of Performance
5th 25th 75th 95th
Figure 1: Trends in South African Mathematics and Science Achievement: 1995 to 2011

4
International Mathematics and Science Achievement
Forty-two countries participated in TIMSS 2011 at the Grade 8 level.
The average mathematics country scale scores (Table 1 on the left) and
the average science country scale scores (table 2 on the right) are
ranked from highest to lowest.
For mathematics, five Asian countries – Korea, Singapore, Chinese
Taipei, Hong Kong SAR and Japan – have the highest achievement
score at the Grade 8 level.
For science, Singapore, Chinese Taipei, Republic of Korea, Japan and
Finland are the five countries with the highest achievement score at the
Grade 8 level.
The top five countries have average achievement scores above the high
international benchmark of 550, for both mathematics and science.
Fourteen countries performed above the centrepoint of 500 points in
mathematics and 18 did so in science. While there were small
differences from country to country, there was a substantial range of
performance from the top-performing to the lower-performing countries.
At the Grade 8 level, the six lowest performing countries for
mathematics who perform below the low benchmark score (less than
400) are Saudi Arabia, Indonesia, Syrian Arab Republic, Morocco, Oman
and Ghana. The six lowest performing countries, for science, are Qatar,
Republic of Macedonia, Lebanon, Indonesia, Morocco and Ghana.
Morocco and Ghana are two countries that have average scale scores
below the low benchmark score (less than 400).
Three countries, South Africa, Botswana and Honduras, administered
the assessments at the Grade 9 level. All three continued to
demonstrate low performances at this level, for both mathematics and
science. Their national scores were among the bottom six countries at
the Grade 8 level and below the low-performance benchmark. For
mathematics, Botswana achieved an average scale score of 397 (2.5);
South Africa achieved at 352 (2.5) and Honduras achieved at 338 (3.7).
For science Botswana achieved a score of 404 (3.6); Honduras
achieved 369 (4.0) and South Africa achieved 332 (3.7).
Table 1: Mathematics Achievement
AverageScale Score
Korea, Rep. of 613 2,9
Singapore 611 3,8
Chinese Taipei 609 3,2
Hong Kong SAR 586 3,8
Japan 570 2,6
Russian Federation
539 3,6
Israel 516 4,1
Finland 514 2,5
United States 509 2,6
England 507 5,5
Hungary 505 3,5
Australia 505 5,1
Slovenia 505 2,2
Lithuania 502 2,5
Italy 498 2,4
New Zealand 488 5,5
Kazakhstan 487 4
Sweden 484 1,9
Ukraine 479 3,9
Norway 475 2,4
Armenia 467 2,7
Romania 458 4
United Arab Emirates
456 2,1
Turkey 452 3,9
Lebanon 449 3,7
Malaysia 440 5,4
Georgia 431 3,8
Thailand 427 4,3
Macedonia, Rep. of
426 5,2
Tunisia 425 2,8
Chile 416 2,6
Iran, Islamic Rep. of
415 4,3
Qatar 410 3,1
Bahrain 409 2
Jordan 406 3,7
Palestinian Nat'l Auth.
404 3,5
Saudi Arabia 394 4,6
Indonesia 386 4,3
Syrian Arab Republic
380 4,5
Morocco 371 2
Oman 366 2,8
Ghana 331 4,3
Botswana 397 2,5
South Africa 352 2,5
Honduras 338 3,7
Country SE
Ninth Grade Participants
TIMSS Scale Centerpoint 500

5
A striking feature of the mathematics and science scores is that the
average scale score of the top seven countries exceeds South African
performance at the 95th percentile. This means that the most proficient
learners in South Africa approached the average performance in
Singapore, Chinese Taipei, Republic of Korea Japan, Finland, Slovenia
and Russian Federation.
Five African countries, Tunisia, Morocco, Ghana, Botswana and South
Africa, participated in TIMSS 2002 and TIMSS 2011. It is therefore
possible to track the change in mathematics and science performance
for these countries. Ghana and South Africa show the greatest
improvement in average scores with Ghana improving by 51 scale score
points and South Africa improving by 65 scale score points, for
mathematics between 2002 and 2011. Both countries started with very
low scores in 2002 and have high levels of disadvantage and inequality.
The context of mathematics and science learning in South Africa
Education and learning is shaped by learners’ school, home and
community environments. This section reports on South African home
and school dynamics, and contrasts these with international findings. In
addition it provides information on public schools by province and on the
independent school sector, comparing the changes that occurred
between 2002 and 2011. Figure 2 on the following page illustrates the
change in provincial mathematics and science achievement in the nine
years from 2002 to 2011. It also illustrates the provincial variation in the
contextual dynamics underpinning achievement.
Improvement in achievement scores Between TIMSS 2002 to TIMSS 2011, there has been an improvement in
the Grade 9 mathematics achievement scores in the public school
sector, with the average scale score increasing 63 points, from 285 to
348. For Grade 9 science, the average scale score increased by 60
points, from 267 to a score of 327.
Country Average Scale Score
SE
Singapore 590 4,3
Chinese Taipei 564 2,3
Korea, Rep. of 560 2
Japan 558 2,4
Finland 552 2,5
Slovenia 543 2,7
Russian Federation
542 3,2
Hong Kong SAR 535 3,4
England 533 4,9
United States 525 2,6
Hungary 522 3,1
Australia 519 4,8
Israel 516 4
Lithuania 514 2,6
New Zealand 512 4,6
Sweden 509 2,5
Italy 501 2,5
Ukraine 501 3,4
Norway 494 2,6
Kazakhstan 490 4,3
Turkey 483 3,4
Iran, Islamic Rep. of
474 4
Romania 465 3,5
United Arab Emirates
465 2,4
Chile 461 2,5
Bahrain 452 2
Thailand 451 3,9
Jordan 449 4
Tunisia 439 2,5
Armenia 437 3,1
Saudi Arabia 436 3,9
Malaysia 426 6,3
Syrian Arab Republic
426 3,9
Palestinian Nat'l Auth.
420 3,2
Georgia 420 3
Oman 420 3,2
Qatar 419 3,4
Macedonia, Rep. of
407 5,4
Lebanon 406 4,9
Indonesia 406 4,5
Morocco 376 2,2
Ghana 306 5,2
Botswana 404 3,6
Honduras 369 4
South Africa 332 3,7
Ninth Grade Participants
TIMSS Scale Centrepoint 500
Table 2: Science Achievement
7 6
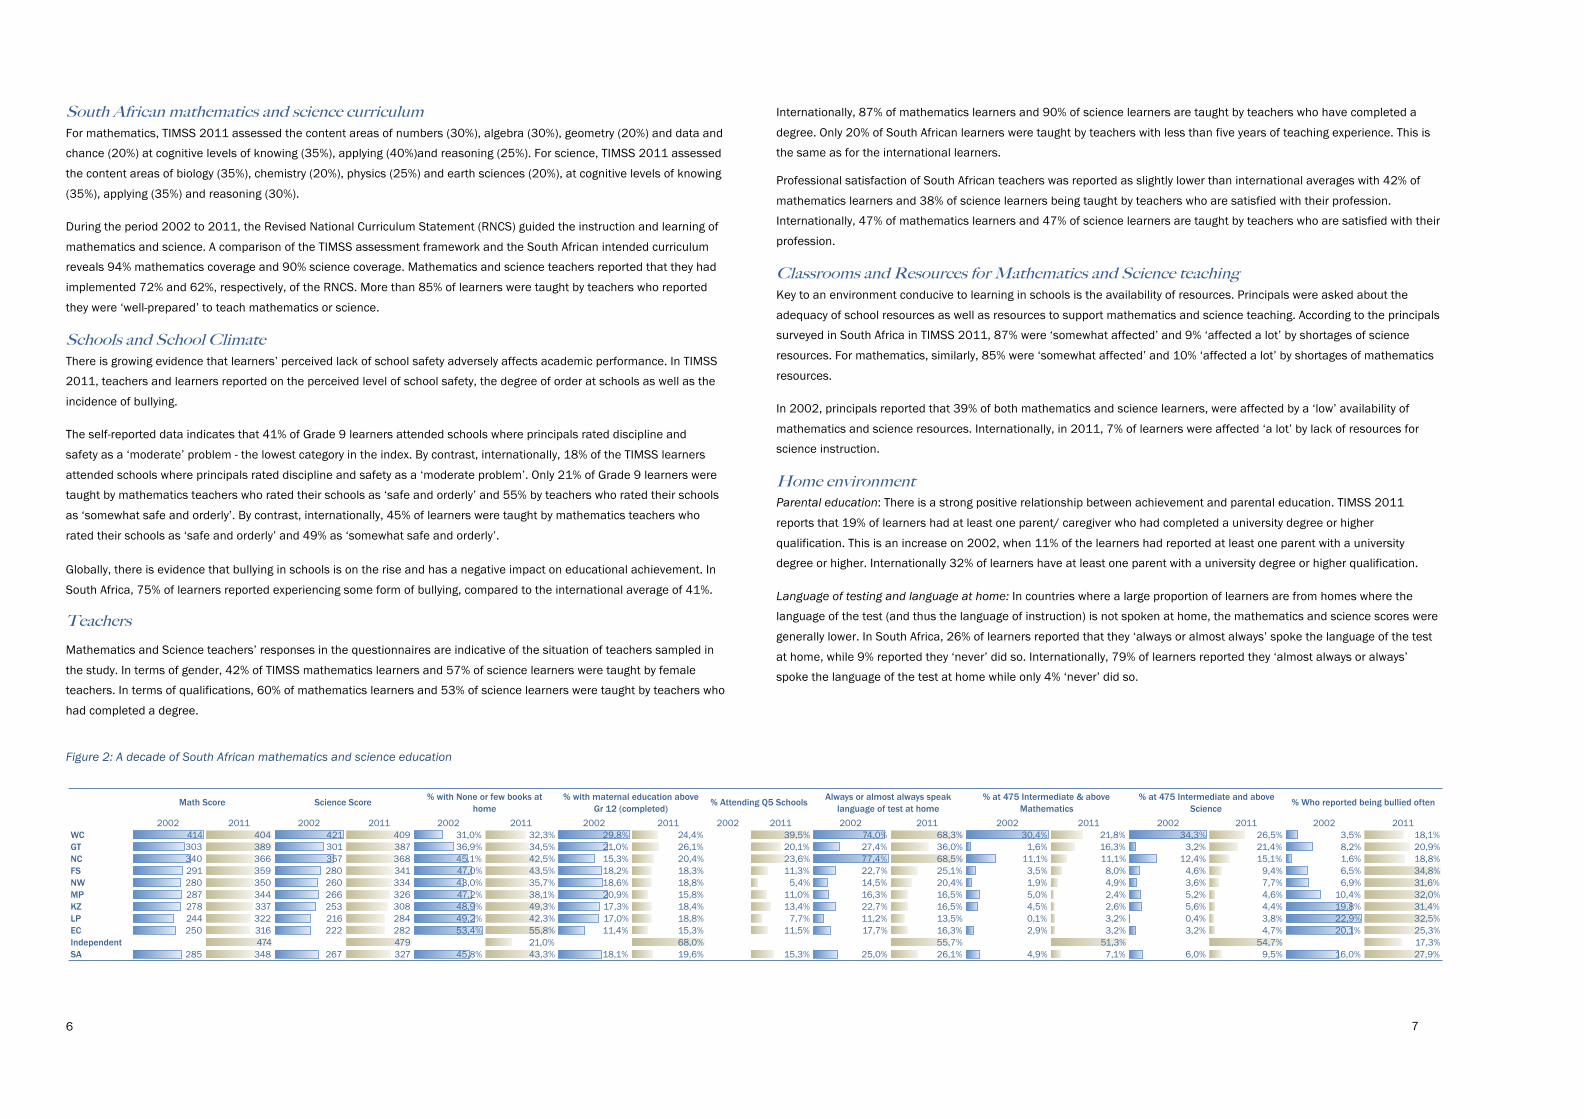
South African mathematics and science curriculum For mathematics, TIMSS 2011 assessed the content areas of numbers (30%), algebra (30%), geometry (20%) and data and
chance (20%) at cognitive levels of knowing (35%), applying (40%)and reasoning (25%). For science, TIMSS 2011 assessed
the content areas of biology (35%), chemistry (20%), physics (25%) and earth sciences (20%), at cognitive levels of knowing
(35%), applying (35%) and reasoning (30%).
During the period 2002 to 2011, the Revised National Curriculum Statement (RNCS) guided the instruction and learning of
mathematics and science. A comparison of the TIMSS assessment framework and the South African intended curriculum
reveals 94% mathematics coverage and 90% science coverage. Mathematics and science teachers reported that they had
implemented 72% and 62%, respectively, of the RNCS. More than 85% of learners were taught by teachers who reported
they were ‘well-prepared’ to teach mathematics or science.
Schools and School Climate There is growing evidence that learners’ perceived lack of school safety adversely affects academic performance. In TIMSS
2011, teachers and learners reported on the perceived level of school safety, the degree of order at schools as well as the
incidence of bullying.
The self-reported data indicates that 41% of Grade 9 learners attended schools where principals rated discipline and
safety as a ‘moderate’ problem - the lowest category in the index. By contrast, internationally, 18% of the TIMSS learners
attended schools where principals rated discipline and safety as a ‘moderate problem’. Only 21% of Grade 9 learners were
taught by mathematics teachers who rated their schools as ‘safe and orderly’ and 55% by teachers who rated their schools
as ‘somewhat safe and orderly’. By contrast, internationally, 45% of learners were taught by mathematics teachers who
rated their schools as ‘safe and orderly’ and 49% as ‘somewhat safe and orderly’.
Globally, there is evidence that bullying in schools is on the rise and has a negative impact on educational achievement. In
South Africa, 75% of learners reported experiencing some form of bullying, compared to the international average of 41%.
Teachers
Mathematics and Science teachers’ responses in the questionnaires are indicative of the situation of teachers sampled in
the study. In terms of gender, 42% of TIMSS mathematics learners and 57% of science learners were taught by female
teachers. In terms of qualifications, 60% of mathematics learners and 53% of science learners were taught by teachers who
had completed a degree.
Internationally, 87% of mathematics learners and 90% of science learners are taught by teachers who have completed a
degree. Only 20% of South African learners were taught by teachers with less than five years of teaching experience. This is
the same as for the international learners.
Professional satisfaction of South African teachers was reported as slightly lower than international averages with 42% of
mathematics learners and 38% of science learners being taught by teachers who are satisfied with their profession.
Internationally, 47% of mathematics learners and 47% of science learners are taught by teachers who are satisfied with their
profession.
Classrooms and Resources for Mathematics and Science teaching Key to an environment conducive to learning in schools is the availability of resources. Principals were asked about the
adequacy of school resources as well as resources to support mathematics and science teaching. According to the principals
surveyed in South Africa in TIMSS 2011, 87% were ‘somewhat affected’ and 9% ‘affected a lot’ by shortages of science
resources. For mathematics, similarly, 85% were ‘somewhat affected’ and 10% ‘affected a lot’ by shortages of mathematics
resources.
In 2002, principals reported that 39% of both mathematics and science learners, were affected by a ‘low’ availability of
mathematics and science resources. Internationally, in 2011, 7% of learners were affected ‘a lot’ by lack of resources for
science instruction.
Home environment Parental education: There is a strong positive relationship between achievement and parental education. TIMSS 2011
reports that 19% of learners had at least one parent/ caregiver who had completed a university degree or higher
qualification. This is an increase on 2002, when 11% of the learners had reported at least one parent with a university
degree or higher. Internationally 32% of learners have at least one parent with a university degree or higher qualification.
Language of testing and language at home: In countries where a large proportion of learners are from homes where the
language of the test (and thus the language of instruction) is not spoken at home, the mathematics and science scores were
generally lower. In South Africa, 26% of learners reported that they ‘always or almost always’ spoke the language of the test
at home, while 9% reported they ‘never’ did so. Internationally, 79% of learners reported they ‘almost always or always’
spoke the language of the test at home while only 4% ‘never’ did so.
Figure 2: A decade of South African mathematics and science education
2002 2011 2002 2011 2002 2011 2002 2011 2002 2011 2002 2011 2002 2011 2002 2011 2002 2011WC 414 404 421 409 31,0% 32,3% 29,8% 24,4% 39,5% 74,0% 68,3% 30,4% 21,8% 34,3% 26,5% 3,5% 18,1%GT 303 389 301 387 36,9% 34,5% 21,0% 26,1% 20,1% 27,4% 36,0% 1,6% 16,3% 3,2% 21,4% 8,2% 20,9%NC 340 366 357 368 45,1% 42,5% 15,3% 20,4% 23,6% 77,4% 68,5% 11,1% 11,1% 12,4% 15,1% 1,6% 18,8%FS 291 359 280 341 47,0% 43,5% 18,2% 18,3% 11,3% 22,7% 25,1% 3,5% 8,0% 4,6% 9,4% 6,5% 34,8%NW 280 350 260 334 43,0% 35,7% 18,6% 18,8% 5,4% 14,5% 20,4% 1,9% 4,9% 3,6% 7,7% 6,9% 31,6%MP 287 344 266 326 47,2% 38,1% 20,9% 15,8% 11,0% 16,3% 16,5% 5,0% 2,4% 5,2% 4,6% 10,4% 32,0%KZ 278 337 253 308 48,9% 49,3% 17,3% 18,4% 13,4% 22,7% 16,5% 4,5% 2,6% 5,6% 4,4% 19,8% 31,4%LP 244 322 216 284 49,2% 42,3% 17,0% 18,8% 7,7% 11,2% 13,5% 0,1% 3,2% 0,4% 3,8% 22,9% 32,5%EC 250 316 222 282 53,4% 55,8% 11,4% 15,3% 11,5% 17,7% 16,3% 2,9% 3,2% 3,2% 4,7% 20,1% 25,3%Independent 474 479 21,0% 68,0% 55,7% 51,3% 54,7% 17,3%SA 285 348 267 327 45,8% 43,3% 18,1% 19,6% 15,3% 25,0% 26,1% 4,9% 7,1% 6,0% 9,5% 16,0% 27,9%
Always or almost always speak language of test at home
% at 475 Intermediate & above Mathematics
% at 475 Intermediate and above Science
% Who reported being bullied oftenMath Score Science Score % with None or few books at home
% with maternal education above Gr 12 (completed)
% Attending Q5 Schools

8
Mathematics and Science Provincial Performance
The increase in the national
average mathematics and
science scale score from TIMSS
2002 to TIMSS 2011 is
reflected by a similar increase in
the scores of most provinces
over the same time period.
Mathematics In TIMSS 2011, the top three
performing provinces are
Western Cape, Gauteng and
Northern Cape. The three lowest
performing provinces are
KwaZulu-Natal, Limpopo and
the Eastern Cape.
In the majority of provinces, the average score has increased since 2002, with the highest increases in Gauteng (86
points), Limpopo (78 points), North West (70 points), Free State (68 points) and Eastern Cape (66 points). The
average score for the Western Cape decreased from 2002 to 2011, although it is not a statistically significant drop.
Science As for mathematics, the top
three performing provinces in
science are Western Cape,
Gauteng and Northern Cape,
and the lowest performing
provinces are KwaZulu-Natal,
Limpopo and the Eastern Cape.
In the majority of the provinces,
the average scale score has
increased since 2002, with the
highest increases in Gauteng
(86 points), North West (74),
Limpopo (68) and Eastern Cape
(60). The average scale score in
the Western Cape dropped by 12 points and in Northern Cape increased by 11 points. These changes are not
statistically significant.
In 2002, the difference in performance between the highest and lowest performing provinces was 170 points for
mathematics and 205 points for science. This difference decreases in 2011, with an 88-point difference for
mathematics and 127 points difference for science. This suggests a move towards more equitable educational
outcomes.
414
303
340
291 280 285 287 278
244 250
404 389
366 359 350 348 344 337 322 316
0
50
100
150
200
250
300
350
400
450
WC G NC FS NW National M KZN L EC
TIMSS 2002 TIMSS 2011
421
301
357
280 260 267 266
253
216 222
409
387 368
341 334 327 326 308
284 282
0
50
100
150
200
250
300
350
400
450
WC G NC FS NW National M KZN L EC
TIMSS 2002 TIMSS 2011

9
Schools in South Africa
For TIMSS 2011, the sample was drawn from public ordinary schools (256 schools) and independent schools (29
schools) to assess if there were differences in how they performed. Additional variables on the basis of each school’s
quintile ranking and former racial categorisation were also included as these normally serve as a proxy for privilege
and resourcing.
Public and independent Table 3 compares the Mathematics and Science achievement
averages for the different types of schools. Independent schools
achieved higher average scores, in both mathematics and science,
than public schools (close to 1.5 standard deviation). For
mathematics, the public schools score was 348 (2.5) and the
independent schools score was 474 (17.1); for science the public
scores score was 327 (3.7) and the independent schools score was
479 (19.0).
Poverty index of the school As expected, there was a relationship between the poverty index of the school and achievement in mathematics and
science. Quintile 1 and 2 schools performed at similar achievement levels, lower than the achievement levels of the
better-resourced Quintile 3, 4 and 5 schools. Quintile 5 schools achieved a much higher average achievement score
than the other quintiles.
Independent schools are generally better resourced and as a group would be categorised closer to the Quintile 5
ranked public schools. The independent and Quintile 5 public schools scored 479 and 445 respectively in science,
and 474 and 438 for mathematics.
Former racial categorisation of schools Analysis of the average achievement scores of learners in schools
described according to their pre-1994 racial categorisation provides
insights into the changes pertaining to each historically different
group. The average achievement scores for the former House of
Assembly (HOA - White) administered schools show that they were
the highest performing group and the former House of
Representatives (HOR – Coloured) and ex-African administered
schools were the lowest performing.
Though learners from the former African administered schools
achieved the lowest scores in the 2011 study, they also
demonstrated the greatest improvement between 2002 and 2011,
by 63 points for science and 70 point for mathematics.
By contrast, the average achievement scores, for mathematics and science, for learners in former HoA administered
schools do not show improvement over the TIMSS 2002 and TIMSS 2011 periods. These are schools that, in
general, are better resourced, generate higher school fees and generally serve learners from middle class homes.
The public former HOA-administered schools and the private independent schools achieved at similar levels in
mathematics and science and both performed at or below the centrepoint score of 500 points.
School Type Math ScienceIndependent 474 (17.1) 479 (19.0)Public 348 (2.5) 327 (3.7)South Africa 352 (2.5) 332 (3.7)Quintile 1 316 (5.7) 279 (7.9)Quintile 2 318 (3.6) 285 (6.4)Quintile 3 336 (4.0) 314 (5.9)Quintile 4 360 (5.6) 348 (7.6)Quintile 5 438 (9.7) 445 (12.6)
0 100 200 300 400 500 600
2002 2011 centrepoint

10
Learners, mathematics and science
Information provided by learners is used to report on achievement by age and gender and on learners’ attitudes to mathematics and science, and their educational aspirations.
Age The average age of Grade 9 learners overall, at the time of administration of the study, was 16.0 years. The average
age of the girls was 15.8 years and the average age of the boys was 16.3 years. There is a relationship between age
and achievement. Mathematics and science achievement is highest for age-grade appropriate learners. For younger
and over-age learners the achievement scores decreases.
Gender Nationally, in both mathematics and science, girls outperform boys but this difference is not statistically significant.
In eight of the nine provinces, there is no significant gender difference in the performance of boys and girls in
mathematics or science, while in the Western Cape boys outperform girls in both mathematics and science.
Gender and Age The patterns of performance by gender and age are the same for mathematics and science achievement: (i) at
younger ages, girls outperform boys, (ii) at age-grade appropriate levels boys outperform girls and (iii) for over-age
learners there is no gender difference in mathematics and science achievement scores.
Figure 6: Achievement by gender and age, for mathematics (light = lower 95%; dark = upper 95%; – = mean)
Learner attitudes to mathematics and science South African learners reported they valued and enjoyed learning mathematics and science. However their
confidence in learning these subjects was low and it decreased between 2002 and 2011. In 2002, 10% of learners
reported ‘low confidence’ in learning mathematics and science, and in 2011 this increased to 24%.
Learner aspirations South African learners have high aspirations. The majority of Grade 9 learners (54%, compared to 56% of the
International group) aspired to proceed to a university education after school, while 14% (compared to 15%
internationally) aspired to a post-secondary education and 25% (compared to 15% internationally) aspired to a
senior secondary or less education.
0
50
100
150
200
250
300
350
400
450
boy girl boy girl boy girl boy girl boy girl boy girl boy girl
14 and younger 15 16 17 18 19 20 and older
!"#$%&'()& *++$%&'()& ,$-.&

11
Towards Equity and Excellence
Equity South African mathematics and science achievement are still low but have improved from TIMSS 2002 to TIMSS
2011. The greatest improvement was among learners who can be described as the ‘most disadvantaged’ and who
scored the lowest initially. This finding coincides with data on the learners and schools receiving the highest number
of interventions aimed at improving the quality of education, from both public and private sector service providers.
Figure 7 illustrates the level of achievement and the profile of learners that underpins the achievement by the
Quintile rank of a school.
The results suggest the value of the continued investments in low-income households (to improve educational levels
of the household and encourage the channelling of more resources to education) and in less-resourced schools (to
improve school climate, resources and quality of teaching). It is through the multiple investments and effort of
learners and teachers, with support from households and the departments of education that South Africa will
continue to increase the mathematics and science achievement scores of lower-performing learners.
Math Score Science Score% None or few books
% Always speak language of test at home
% Maternal Education above Gr12 (Completed) % Bullied Often
% At or above 475 Science
% At or above 475 Math
Quintile 1 315,6 279,0 48,5 6,5 16,5 35,5 1,8 1,1Quintile 2 318,3 285,0 46,6 8,9 16,6 34,2 1,6 0,6Quintile 3 335,9 314,1 46,4 7,8 21,3 27,3 3,2 1,6Quintile 4 360,2 348,1 42,8 14,3 28,1 22,5 7,6 4,3Quintile 5 438,0 445,1 27,5 41,6 50,0 16,1 43,5 36,3Independent 473,5 479,0 21,0 32,8 68,1 17,3 54,7 51,3
Figure 7: South African mathematics and science achievement and its context, by Quintile ranking of school
Excellence The quantity and quality of performance at the higher ends provides an indicator of the pool of learners who could
progress to tertiary education and who could participate in science and technology-based careers.
Though performing at the top level in South Africa, the ex-House of Assembly, Quintile 5 and Independent schools
are not globally competitive. The average scale scores for these groups are at or below the centrepoint of 500.
The performance of the top end performers was analysed using the TIMSS international performance benchmarks
and the changes tracked over time. Table 4 below describes the proportion of learners who performed at scores of
400 and above.
From 2002 to 2011, the number of learners scoring above the low benchmark of 400 more than doubled, from
10.5% to 24%. Nevertheless, the number of those performing at the top end must improve to compare to
international achievement profiles. Schools that have been traditionally well resourced need to be challenged and
supported to improve
the performance of
learners in their
schools. South Africa
needs to re-affirm the
agenda for excellence in
educational outcomes.
Advanced High Intermediate Low
Total >400 >625 625-550 550-475 475-400
TIMSS 2002 10,50% 0,6 1,5 2,8 5,6
TIMSS 2011 24% 1 2 6 15
Highlights from TIMSS 2011 The South African perspective
The Trends in International Mathematics and Science Study (TIMSS) is cross-national assessment of the
mathematics and science knowledge of fourth Grade and eighth Grade learners. TIMSS was developed by the
International Association for the Evaluation of Educational Achievement (IEA) to allow participating nations to
compare learner educational achievement across borders.
TIMSS was first administered in South Africa in 1995, and has continued to be administered in 1999, 2002 and
2011. This publication reports on South Africa’s performance in TIMSS 2011 relative to other countries and
examines the trends in mathematics and science achievement from 1995 to 2011.
Related Publications
Martin, M.O, Mullis, I.V.S., Foy, P and Stanco, G M. (2012). TIMSS 2011 International Results in Science. Chestnut Hill, MA: Boston College
Mullis, I.V.S., Martin, M.O., Foy, P and Arora, A. (2012). TIMSS 2011 International Results in Mathematics. Chestnut Hill, MA: Boston College
Reddy, V; Prinsloo, C; Visser, M; Arends, F; Winnaar, L; Rogers, S; Janse van Rensburg, D; Juan, A; Feza, N and Mthethwa, M. Mathematics and Science Achievement at South African Schools in TIMSS 2011. (forthcoming)
Reddy, V (Ed). (2006). Mathematics and Science Achievement at South African Schools in TIMSS 2003.Cape Town: HSRC Press.
HSRC team
Vijay Reddy
Cas Prinsloo
Fabian Arends
Mariette Visser
Lolita Winnaar
Nosisi Feza
Shawn Rogers
Dean Janse van Rensburg
Andrea Juan
Menziwokhule Mthethwa
Maria Ngema
Matselane Maja
Contact Details
Pretoria Private Bag X41 Pretoria 0001 012 302 2024
Cape Town Private Bag X9183 Cape Town 8000 021 466 8001
Durban Private Bag X07 Dalbridge 4014 031242 5400
Cover image: A section of the representation of the Square Kilometre Array (SKA) layout on the ground. SKA represents the global heights of scientific achievement to which South African learners can aspire given the opportunity to realise their academic potential. Reproduced courtesy of SKA Organisation/Swinburne Astronomy Productions, skatelescope.org