Embed Size (px)
Citation preview

www.parliament.uk/commons-library | intranet.parliament.uk/commons-library | [email protected] | @commonslibrary
BRIEFING PAPER
Number 7393, 14 June 2017
Higher education funding in England
By Paul Bolton
Inside: 1. Background 2. Public spending on higher
education in England 3. Funding for institutions from
HEFCE
Number 7393, 14 June 2017 2
Contents Summary 3
1. Background 5 1.1 ‘2012’ reforms 5 1.2 Comprehensive Spending Review 2010 and later spending rounds 5 1.3 Summer Budget 2015 and Spending Review/Autumn Statement 2015 6
2. Public spending on higher education in England 7 2.1 Direct funding through the funding council 7
Teaching 8 Research 9 Other 9
2.2 Student loans 9 Subsidy elements of loans 10 Estimates of the resource costs of loans from 2012 10 Impact of loans on the national debt 11
2.3 Student support 12 2.4 Overall spending 13
Up to 2018-19 13
3. Funding for institutions from HEFCE 13
Cover page image copyright: Spread of £50 notes by Bank of England. Licensed under CC BY-NC-ND 2.0 / image cropped.

3 Higher education funding in England
Summary The Government raised the cap on tuition fees for new student to £9,000 in 2012/13 and cut most ongoing direct public funding for teaching in England. This shifted the balance of higher education funding further away from the state and further towards the individual who benefits.
In his summer Budget 2015 the Chancellor announced the biggest changes to student finance since 2012:
• Maintenance grants will end for new students from 2016/17 and be replaced by loans.
• A consultation on freezing the student loan repayment threshold for five years
• Allowing universities offering ‘high teaching quality’ to increase fees in line with inflation from 2017
• A review of the discount rate applied to the accounting treatment of loans.
After consultation the Government decided to freeze the repayment threshold for all post-2012 borrowers. The discount rate used for the public accounting of loans was reduced from 2.2% to 0.7%. These changes are expected to result in savings to current spending when grants are ended and a substantial cut in the subsidy element of loans.
Students can take out publicly subsided loans to pay for tuition fees. Lending to students has increased substantially since 2012 and is expected to be more than £15 billion this year, compared less than £4 billion which goes to universities through the funding council. The Government’s decision to replace maintenance grants with loans means that even more support for higher education will come through loans rather than direct spending.
The subsidy element of loans is not included in the Government’s main measure of public spending on services and hence does not count towards the fiscal deficit. The total face value of loans do count towards the national debt.
There is considerable uncertainty about the final size of the subsidy element of loans and the Government’s estimate of it increased sharply after the 2012 reforms were first announced. Subsequent changes to loan terms and accounting methods are expected to reduce the size of this subsidy to an even greater degree. These calculations affect the size of any saving in public expenditure and the extent of the shift in costs from the state to the individual beneficiary.
This paper looks at recent levels of funding for higher education in England, particularly the period from 2015 onwards. It builds on and replaces Changes to higher education funding and student support in England from 2012/13 and HE in England from 2012:
0
2
4
6
8
2010-11 2011-12 2012-13 2013-14 2014-15 2015-16 2016-17 2017-18 2018-19
HEFCE funding£ billion 2015-16 prices
Teaching Research Capital Other
0
2
4
6
8
10
12
2010-11 2011-12 2012-13 2013-14 2014-15 2015-16 2016-17 2017-18
Funding for higher education institutions£ billion 2015-16 prices
HEFCE Fees

Number 7393, 14 June 2017 4
Funding and finance which looked in detail at the impact of the 2012 reforms and subsequent announcements on graduates, universities and public spending.
The briefing paper Higher education student numbers looks at how student numbers have changed over time, gives some insight into the impact of the 2012 higher education reforms on different types of students and courses and summarises the last evidence on applications. Readers may also be interested in the following briefing papers:
• Higher education finance statistics
• Student loan statistics
• Tuition fee statistics
• The value of student maintenance support
• Support for postgraduate students in England

5 Higher education funding in England
1. Background
1.1 ‘2012’ reforms The Independent Review of Higher Education Funding – the Browne Report1- was published in October 2010. It made recommendations on the future funding and organisation of the higher education sector and on student finance. The main recommendations directly connected to funding were:
• Remove direct public funding for most undergraduate courses and retain a much smaller amount for higher cost subjects.
• Remove the cap from tuition fees. Institutions would keep all the income up to £6,000 per year and share any more with Government.
• Extend student loans to part-time students • Increase the loans repayment threshold from £15,000 to £21,000 and
increase it in line with earnings in the future. • Introduce a real interest rate on loans for those earning above the
threshold equal to the Government’s cost of borrowing (inflation plus 2.2%) and ensure no one repaying their loan sees its real value increase.
• Extend the write-off period of loans from 25 to 30 years • Increase student numbers by 10% to remove excess demand
The report concluded that, with static number of students, the reforms would eventually cut core public spending on undergraduate study by around £1.8 billion or almost 30%, graduates would repay more (55% more with fees of £8,000) but additional repayments would come from higher earning graduates and institutions could see an increase in their income2 with fees of around £7,000 or more (10% with fees of £8,000).3
The Government announced its plans for reform of higher education and student finance in November 2010.4 These followed many of the recommendations set out in the Browne Report. The major differences with an impact on funding were:
• A cap on fees of £9,000, no levy on fees above this level, but obligations on the institution to spend more on access for disadvantaged students
• A real interest of 3% above inflation for graduates earning above £41,000 (in 2016) with a sliding scale rising from 0% (real) at £21,000
• Annual uprating of both thresholds in line with growth in average earnings 5
• No growth in student number
1.2 Comprehensive Spending Review 2010 and later spending rounds
The Comprehensive Spending Review 2010 (CSR) set out the parameters for public spending over the period 2011-12 to 2014-15. Total resources for higher education (excluding research) was to fall
1 Securing a sustainable future for higher education –An independent review of
higher education funding & student finance 2 Income from these fees and teaching grants only 3 ibid. pp43-44 4 Reform for higher education and student finance, BIS (3 November 2010) 5 The initial proposal was for five-yearly upratings.
The 2012 reforms increased the cap on fees to £9,000. Student loans increased to pay for this but the reforms made repayments more ‘progressive’
Funding for higher education was cut dramatically in the 2010 CSR as funding reforms shifted the balance from taxpayers to graduates
Number 7393, 14 June 2017 6
from £7.1 billion in 2010-11 to £4.2 billion in 2014-15;6 a cut of 41% in cash terms and 44% in real terms.7
The Spending Round 2013 announced a series of further savings from the higher education budget –the continued cuts in funding for teaching as the 2012 system applies to more students, freezing grants, requiring HEFCE to make additional savings and cutting access spending. .
8 Autumn Statement 2013 announced the cap on student numbers would be raised in 2014-15 and lifted in 2015-16 which would increase spending compared to what it would otherwise have been. The Government expected to fund this through the sale of some older student loan debt.
1.3 Summer Budget 2015 and Spending Review/Autumn Statement 2015
In his Summer Budget 2015 the Chancellor announced that maintenance grants would end for new students from 2016/17 and be replaced by loans. He also announced consultations on freezing the repayment threshold for five years, allowing some universities to increase fees in line with inflation from 2017 and a review of the discount rate applied to the accounting treatment of loans.9 These are the biggest changes to student finance since the 2012 reforms.
The Government published a consultation on freezing the loan repayment threshold in July 2015. This set out two options for change:
• Option 1 (preferred): Freeze the threshold at £21,000 from April 2016 for all existing and new borrowers for five years. Reviews the threshold from April 2021
• Option 2: Freeze the threshold for new borrowers only for five years from April 2020
The consultation estimated that option 1 would generate £3.2 billion (current/discounted values) in additional graduate repayments from existing borrowers. On top of this one-off amount there would be an additional £0.9 billion for each £15 billion of loans to new students.10 Under Option 2 only the amount for new students (put at £1.0 billion per £15 billion of loans) would apply.11
The Government published its response to the consultation in November 2015.12 It accepted that most responses did not support freezing the threshold, but said it would implement its preferred option –freeze the repayment threshold for all post-2012 borrowers at £21,000 until at 6 BIS news release 20 October 2010, The Department for Business Innovation and
Skills Spending Review Settlement 7 Adjusted using March 2015 GDP deflators and OBR projections. 8 Spending Round 2013, HM Treasury 9 Summer Budget 2015, HM Treasury 10 This volume of loans is approximately the amount that might be lent to each cohort
of new students. 11 Consultation on freezing the student loan repayment threshold, BIS (July 2015) 12 Freezing the student loan repayment threshold Government response to the
consultation on freezing the student loan repayment threshold, BIS (November 2015)
Further smaller scale cuts were announced in 2013 alongside the decision to remove the cap on student numbers
2015 saw the announcement of the biggest reform of student finance since the 2012 reforms. Grants would be ended, the fee cap raised and the loan repayment threshold would be frozen –making the system less ‘progressive’.

7 Higher education funding in England
least April 2021. An equality analysis was produced alongside the consultation response.13 This looked at the impact on different types of ‘protected characteristics’ such as age, sex, disability and ethnicity.
The Spending Review and Autumn Statement 2015 made some headline announcements about funding paid through the funding council, the extension of maintenance loans to part-time students and new loans for Master’s degrees. It also announced that the discount rate applied to loans would be reduced to 0.7% and set the spending totals for the Department for Business, Innovation and Skills which will eventually feedthrough to annual funding allocations for higher education.
The notes on maintenance support and loans look at the impact of these changes on students/graduates. Some estimates of the impact on public spending are included in the next sections which look at each main element in turn.
2. Public spending on higher education in England
There are three main elements of public spending on higher education –direct funding through the Higher Education Funding Council for England (HEFCE) which covers both teaching and research, student maintenance grants and student loans.
2.1 Direct funding through the funding council
The Secretary of State writes to HEFCE around the turn of each year to set out funding, priorities, student numbers and related matters for the following financial year. Occasionally these letters cover more than one year and sometimes revised versions are published. The most recent full funding letter was published at the end of February 2017. It covered funding in 2017-18 and gave indicative allocations for the following year. All these funding letters from the mid-1990s onwards can be found at: http://www.hefce.ac.uk/funding/annallocns/Archive/
The following table summarises HEFCE funding and estimated fee loans from the latest funding letters. Changes to the main elements in real terms are illustrated opposite. More details are given in the table at the end of this paper.
13 Freezing the student loan repayment threshold. Equality analysis, BIS (November
2015)
0
2
4
6
8
2010-11 2011-12 2012-13 2013-14 2014-15 2015-16 2016-17 2017-18 2018-19
HEFCE funding£ billion 2015-16 prices
Teaching Research Capital Other
Number 7393, 14 June 2017 8
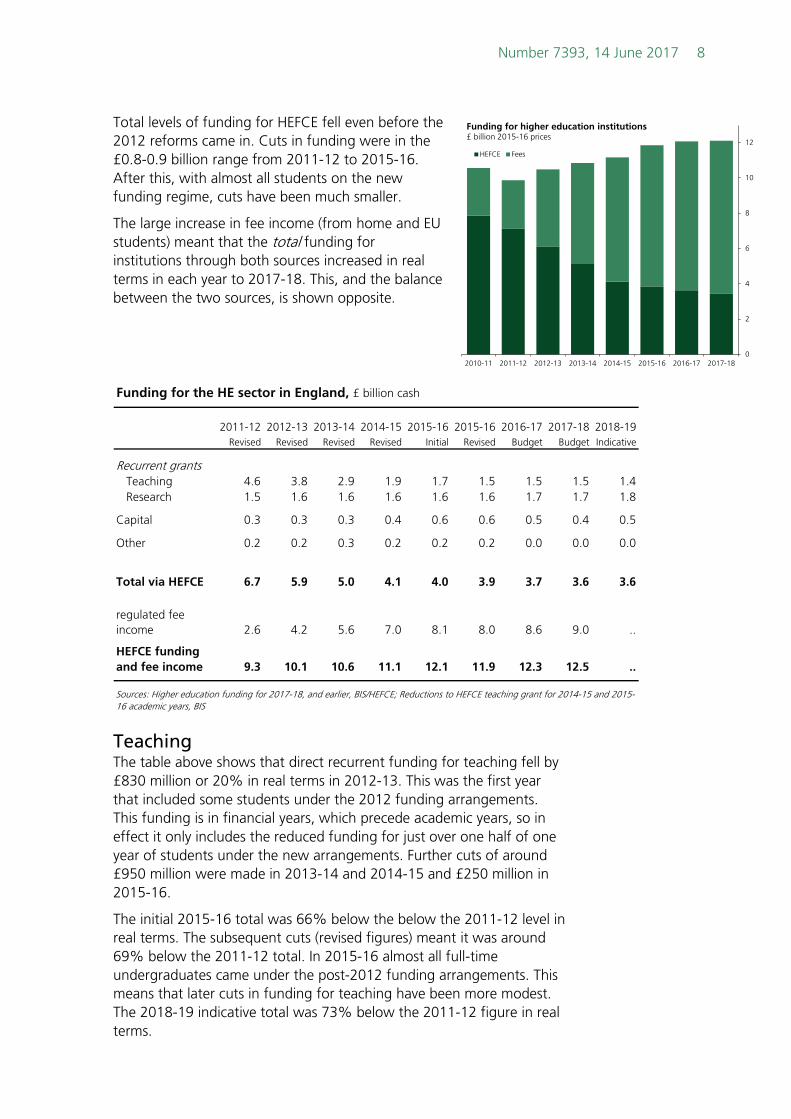
Total levels of funding for HEFCE fell even before the 2012 reforms came in. Cuts in funding were in the £0.8-0.9 billion range from 2011-12 to 2015-16. After this, with almost all students on the new funding regime, cuts have been much smaller.
The large increase in fee income (from home and EU students) meant that the total funding for institutions through both sources increased in real terms in each year to 2017-18. This, and the balance between the two sources, is shown opposite.
Teaching The table above shows that direct recurrent funding for teaching fell by £830 million or 20% in real terms in 2012-13. This was the first year that included some students under the 2012 funding arrangements. This funding is in financial years, which precede academic years, so in effect it only includes the reduced funding for just over one half of one year of students under the new arrangements. Further cuts of around £950 million were made in 2013-14 and 2014-15 and £250 million in 2015-16.
The initial 2015-16 total was 66% below the below the 2011-12 level in real terms. The subsequent cuts (revised figures) meant it was around 69% below the 2011-12 total. In 2015-16 almost all full-time undergraduates came under the post-2012 funding arrangements. This means that later cuts in funding for teaching have been more modest. The 2018-19 indicative total was 73% below the 2011-12 figure in real terms.
Funding for the HE sector in England, £ billion cash
2011-12 2012-13 2013-14 2014-15 2015-16 2015-16 2016-17 2017-18 2018-19Revised Revised Revised Revised Initial Revised Budget Budget Indicative
Recurrent grantsTeaching 4.6 3.8 2.9 1.9 1.7 1.5 1.5 1.5 1.4Research 1.5 1.6 1.6 1.6 1.6 1.6 1.7 1.7 1.8
Capital 0.3 0.3 0.3 0.4 0.6 0.6 0.5 0.4 0.5
Other 0.2 0.2 0.3 0.2 0.2 0.2 0.0 0.0 0.0
Total via HEFCE 6.7 5.9 5.0 4.1 4.0 3.9 3.7 3.6 3.6
regulated fee income 2.6 4.2 5.6 7.0 8.1 8.0 8.6 9.0 ..
HEFCE funding and fee income 9.3 10.1 10.6 11.1 12.1 11.9 12.3 12.5 ..
Sources: Higher education funding for 2017-18, and earlier, BIS/HEFCE; Reductions to HEFCE teaching grant for 2014-15 and 2015-16 academic years, BIS
0
2
4
6
8
10
12
2010-11 2011-12 2012-13 2013-14 2014-15 2015-16 2016-17 2017-18
Funding for higher education institutions£ billion 2015-16 prices
HEFCE Fees
9 Higher education funding in England
The impact on what HEFCE plans to distribute up to academic year 2017/18 is given later in this note.
Spending Review 2015 announced that the teaching grant would be cut by £120 million in cash terms by 2019-20, but within this reduced total funding for high cost subjects will be protected in real terms. The student opportunity fund, which supports institutions in their efforts to widen access, will be cut by “…up to half.”14
Research The 2012 changes in university funding directly affect teaching rather than research. Plans were set out for each year to 2014-15 soon after the 2010 CSR was published. The earlier table shows that recurrent funding for research broadly maintained its cash value up to 2014-15. The 2013 Spending Round kept the total resource (recurrent) science budget for 2015-16, which includes funding for Research Councils and other areas, at the same cash level as earlier years. Total capital funding for science was increased, partially reversing earlier cuts.15
Spending Review 2015 announced that total science funding, which includes HEFCE research grant and funding paid through the Research Councils, will be protected in real terms to the end of the (then) current Parliament.16
Research funding paid to higher education institutions through HEFCE funds the research capacity and infrastructure –such as the salaries of permanent academic staff, premises, libraries etc- while the Research Councils fund specific research projects.
Other The 2014-15 letter incorporated the cut to the National Scholarship Programme announced in the Spending Round 2013, ended separate funding for the Access to Learning Fund (which provided hardship payments), directed HEFCE to combine this with its student opportunity funding17 for institutions and also included the implications of the Autumn Statement 2013 for funding through HEFCE. The 2015-16 letter confirmed earlier allocations.
2.2 Student loans There are two types of student loans –fees and maintenance. Full-time home and EU students on qualifying courses can take out a loan to cover the tuition fees for their course. From 2012 new part-time students on courses with an intensity of 25% or greater became eligible for loans. From 2016-17 postgraduates could apply for fee loans of up to £10,000.
14 Department for Business, Innovation and Skills’ settlement at the Spending Review
2015, 25 November 2015 15 Spending Round 2013, HM Treasury 16 Department for Business, Innovation and Skills’ settlement at the Spending Review
2015, 25 November 2015 17 The student opportunity stream is meant to support institutions’ efforts to widen
participation and allow then to meet the higher costs of supporting disadvantaged and under-represented students through their courses

Number 7393, 14 June 2017 10
Maintenance loans are available to home students only. The amount someone can take out as a maintenance loan depends on their household income, where they live and where they study. From 2016/17 maintenance loans will entirely replace grants. The value of student maintenance support gives more details and Student loan statistics gives more background about the system.
The Office for Budget Responsibility has forecast that the total value of new loans in England will increase from £12.0 billion in 2015-16 to £20.4 billion in 2021-22.18 This is driven by replacing grants with loans, but also by maintenance loans for part-time students, fee loans for Master’s degrees and replacing nursing bursaries with loans.20
Subsidy elements of loans The earlier table gave BIS estimates of the face value of fee loans to English students and EU students studying at English institutions. Only part of the face value of fee and maintenance loans paid out in any one year counts as public expenditure. This is what the Government expects the subsidy element to be and is viewed as the permanent costs of the loan to the taxpayer. This system is known as resource accounting and budgeting (RAB) or accruals accounting and has been in place in the public sector for more than a decade. The subsidy element is calculated as the face value of loans made in any one year less the discounted or present value of future repayments. This can be thought of as the amount of money lent to students that the Government does not expect to get back. It is frequently expressed as a proportion of the value of loans, the so-called RAB charge.
The subsidy element of loans is classed as a financial transaction and not included in the Government’s main measure of public spending on services. It therefore hence does not count towards the fiscal deficit. It is, however, estimated and published in reports from the Government and the Office for Budget Responsibility. The total face value of loans do count towards the national debt.
Estimates of the resource costs of loans from 2012 Pre-2015 reforms
The Government made estimates of the percentage RAB rate on new loans from 2012 when it published proposals for changes to funding. These are discussed in some detail in Changes to higher education funding and student support in England from 2012/13. The estimated RAB rate on new loans was put at ‘around 30%’, but subsequently increased to ‘around 35%’ 21 then to 35%-40%22, revised upwards again to ‘around 40%’23 and later to ‘around 45%’. 24 These increases were largely due to changes in economic forecasts, particularly on
18 Economic and fiscal outlook – November 2015, OBR (Supplementary table 2.47) 19 Economic and fiscal outlook – March 2017, OBR (table 2.49) 20 ibid and Spending Review and Autumn Statement 2015, HM Treasury (Table 3.2) 21 HC Deb 4 July 2013 c775-6W 22 HC Deb 9 December 2013 c5W 23 HC Deb 19 December 2013 c780W 24 HC Deb 20 March 2014 c706W
The accounting treatment of student loans means they are not included in the deficit, but do count in full towards the national debt.

11 Higher education funding in England
earnings.25 These less optimistic forecast reduce the expected cash value of repayments and or delay when they will be made. Other factors behind the increase in the RAB rate include the higher than expected level of average tuition fee loans, a change to the timing of repayment threshold uprating, lower assumed repayments from the extra students who start higher education because the numbers cap is lifted26 and improvements to the Governments loan repayment model which is used to forecast repayments and hence calculate the resource costs of loans.27Much more detail on these increases are given in the paper HE in England from 2012: Funding and finance
Post 2015 reforms
The different elements of the changes to student finance announced in the Summer Budget all have an impact on student loan outlays and the RAB rate/charge. Replacing maintenance grants with loans will increase the cash amount loaned. This on its own would increase the RAB rate, but as the increase will be largely for those from lower income backgrounds –which is linked to some extent to lifetime earnings- the increase will be larger still as a smaller amount is expected to be repaid.
Freezing the repayment threshold will increase repayments and hence cut the RAB rate. Allowing some institutions to charge above £9,000 will increase tuition fee loan amounts and increase the RAB rate slightly.
Reviewing the discount rate applied to loans is meant to bring this in line with the Government’s long-term cost of borrowing. It has no impact on loan outlays or the cash value of repayments and hence no impact on borrowers. It is an accounting change that has a large impact on the RAB rate, cutting it substantially.
The Government’s estimates of the savings from freezing the repayment threshold from 2016 were set out earlier; £3.2 billion additional repayments from existing borrowers plus £0.9 billion for each £15 billion of loans to new students. It did not include any estimate of the combined savings from the Summer 2015 ‘package’ in Spending Review 2015, but a subsequent written answer estimated that the RAB charge would be reduced to 20-25%.28
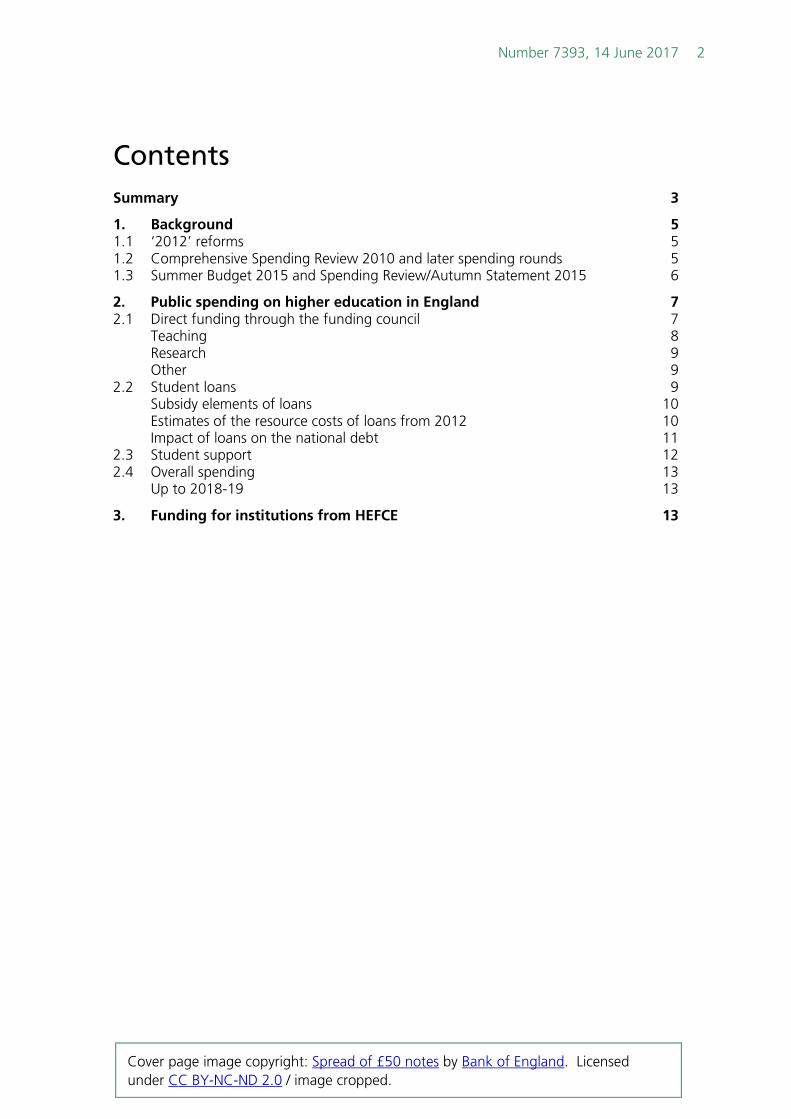
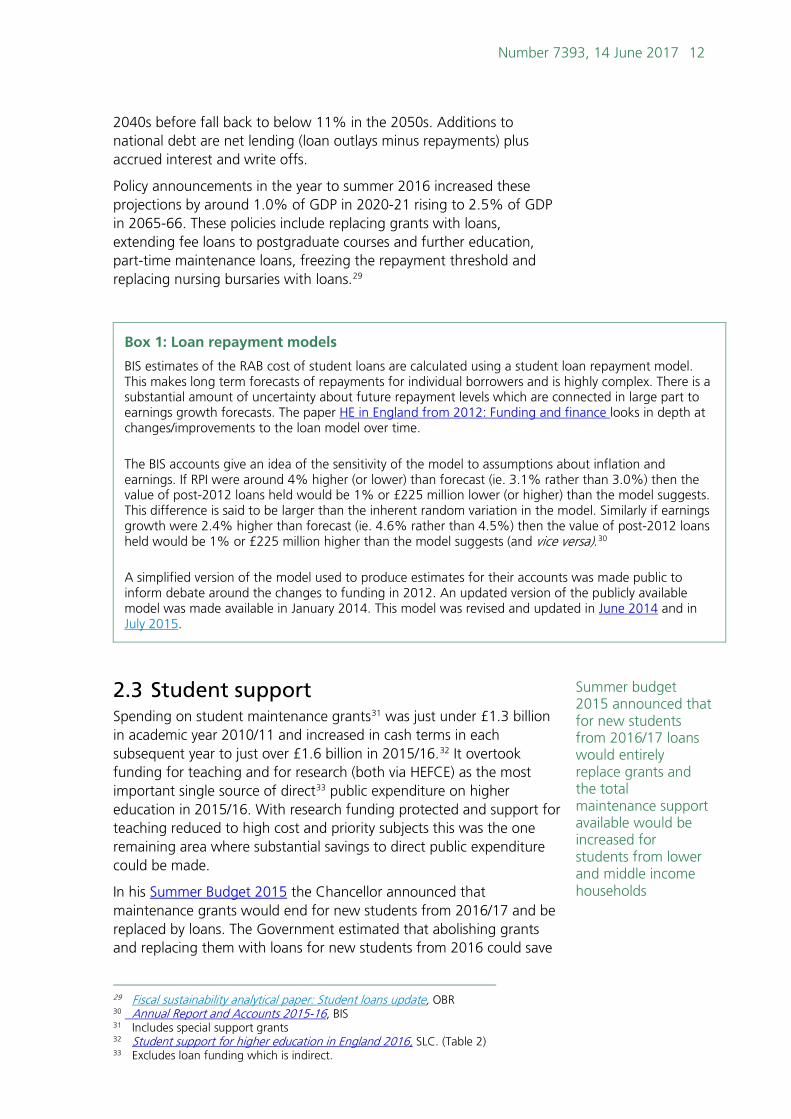
Impact of loans on the national debt The latest Office of Budget Responsibility projections of the impact of all (UK) loans on the national debt are illustrated in the chart opposite. The (cumulative) addition to debt increases rapidly from 4.0% of GDP to a peak of 11.5% in the early
25 The OBR links lower earnings growth to “…much weaker-than-expected growth in
productivity.” They also note that the data now used for modelling repayments, including that from the Student Loans Company, have widened the modelled distribution of earnings among graduates. This wider distribution cuts expected repayments, even if average earnings remain unchanged. Fiscal Sustainability Report – July 2014, OBR
26 HC Deb 10 December 2013 c130W 27 These are summarised in the National Audit Office report Student loan repayments 28 PQ HL 5098 [on Mature students: Loans] 18 January 2016
0%
2%
4%
6%
8%
10%
12%
2015-16 2025-26 2035-36 2045-46 2055-56 2065-66
Additions to net debt from student loans, % of GDP
Source: Fiscal Stability Report 2016, OBR
Number 7393, 14 June 2017 12
2040s before fall back to below 11% in the 2050s. Additions to national debt are net lending (loan outlays minus repayments) plus accrued interest and write offs.
Policy announcements in the year to summer 2016 increased these projections by around 1.0% of GDP in 2020-21 rising to 2.5% of GDP in 2065-66. These policies include replacing grants with loans, extending fee loans to postgraduate courses and further education, part-time maintenance loans, freezing the repayment threshold and replacing nursing bursaries with loans.29
Box 1: Loan repayment models
BIS estimates of the RAB cost of student loans are calculated using a student loan repayment model. This makes long term forecasts of repayments for individual borrowers and is highly complex. There is a substantial amount of uncertainty about future repayment levels which are connected in large part to earnings growth forecasts. The paper HE in England from 2012: Funding and finance looks in depth at changes/improvements to the loan model over time. The BIS accounts give an idea of the sensitivity of the model to assumptions about inflation and earnings. If RPI were around 4% higher (or lower) than forecast (ie. 3.1% rather than 3.0%) then the value of post-2012 loans held would be 1% or £225 million lower (or higher) than the model suggests. This difference is said to be larger than the inherent random variation in the model. Similarly if earnings growth were 2.4% higher than forecast (ie. 4.6% rather than 4.5%) then the value of post-2012 loans held would be 1% or £225 million higher than the model suggests (and vice versa).30 A simplified version of the model used to produce estimates for their accounts was made public to inform debate around the changes to funding in 2012. An updated version of the publicly available model was made available in January 2014. This model was revised and updated in June 2014 and in July 2015.
2.3 Student support Spending on student maintenance grants31 was just under £1.3 billion in academic year 2010/11 and increased in cash terms in each subsequent year to just over £1.6 billion in 2015/16.32 It overtook funding for teaching and for research (both via HEFCE) as the most important single source of direct33 public expenditure on higher education in 2015/16. With research funding protected and support for teaching reduced to high cost and priority subjects this was the one remaining area where substantial savings to direct public expenditure could be made.
In his Summer Budget 2015 the Chancellor announced that maintenance grants would end for new students from 2016/17 and be replaced by loans. The Government estimated that abolishing grants and replacing them with loans for new students from 2016 could save
29 Fiscal sustainability analytical paper: Student loans update, OBR 30 Annual Report and Accounts 2015-16, BIS 31 Includes special support grants 32 Student support for higher education in England 2016, SLC. (Table 2) 33 Excludes loan funding which is indirect.
Summer budget 2015 announced that for new students from 2016/17 loans would entirely replace grants and the total maintenance support available would be increased for students from lower and middle income households

13 Higher education funding in England
£2.5 billion (cumulatively) by 2020-21.34 Early data for academic year 2016/17 showed the amount awarded at mid-November 2016 was £1.0 billion; a drop of almost £0.6 billion or 36%.35 This spending is likely to fall by a similar (absolute) amount in the following two years as more of the student population moves to the post 2016 arrangements..
2.4 Overall spending Overall spending levels (including the subsidy element of loans) up to 2015-16 are given in HE in England from 2012: Funding and finance.
The shift in expenditure away from direct funding in the period from 2010 to 2016 was marked. Overall spending changed little in cash terms as higher loan subsidy amounts outweighed cuts in funding for teaching.
Up to 2018-19 Estimated overall spending levels up to 2018-19 are given opposite. Again they include the subsidy element or economic cost of loans, but here they use the current RAB rate estimate of 20-25% of their face value. Cuts in maintenance grants have been projected forward and converted to financial year figures. The HEFCE funding data is that shown in the earlier table.
The main pattern over these years is the shift from (maintenance) grants to loans. The real value of total public spending falls slightly in real terms (on this basis) in 2017-18 and 2018-19. After 2018-19 we would expect no major change in the real value of these figures without any further policy changes, RAB charge revisions or unexpected patterns in student numbers
3. Funding for institutions from HEFCE
Links to details of final allocations from the funding council to individual institutions are given below:
• 2012/13 • 2013/14 • 2014/15 • 2015/16 • 2016/17
High level decisions for 2017/18 have set the total budget for teaching at £1.32 billion and overall recurrent grant at £3.08 billion. Allocations for individual institutions are not expected until later in the year.
34 Summer Budget 2015, HM Treasury 35 Student support for higher education in England 2016, SLC. (Table 6.3)
HEFCEteaching
HEFCE research
Studentloans
Grants and other
0
2
4
6
8
2015-16 2016-17 2017-18 2018-19
Planned spending on HE£ billion

Number 7393, 14 June 2017 14
Funding for the HE sector in England through HEFCE and tuition fee loans
£ million cash £ million 2015-16 pricesa
2011-12 2012-13 2013-14 2014-15 2015-16 2015-16 2016-17 2017-18 2018-19 2011-12 2012-13 2013-14 2014-15 2015-16 2015-16 2016-17 2017-18 2018-19Revised
allocationRevised
allocationRevised
allocationRevised
allocation Initial Revised Budget Budget IndicativeRevised
allocationRevised
allocationRevised
allocationRevised
allocation Initial Revised Budget Budget Indicative
Recurrent grantsTeaching 4,645 3,815 2,861 1,915 1,671 1,521 1,539 1,457 1,386 4,928 3,964 2,925 1,929 1,671 1,521 1,509 1,406 1,317Research 1,549 1,587 1,573 1,573 1,573 1,573 1,695 1,716 1,755 1,643 1,649 1,608 1,585 1,573 1,573 1,662 1,656 1,667Total 6,194 5,402 4,434 3,488 3,244 3,094 3,234 3,173 3,141 6,571 5,613 4,533 3,514 3,244 3,094 3,171 3,062 2,984
Higher Education Innovation Funding 113 119 113 113 113 113 0 0 0 120 124 116 114 113 113 0 0 0
Additional fundingVoluntary matched giving 63 0 0 0 0 0 0 0 0 67 0 0 0 0 0 0 0 0Access to Learning Fund 40 37 37 0 0 0 0 0 0 42 38 38 0 0 0 0 0 0National Scholarship Programmeb 0 50 100 50 0 0 0 0 0 0 52 102 50 0 0 0 0 0Postgraduate provisionb 0 0 0 0 50 50 0 0 0 0 0 0 0 50 50 0 0 0
Capital fundingTeaching 95 90 79 154 300 300 140 150 150 101 94 81 155 300 300 137 145 143Research 204 195 251 286 303 303 338 203 303 216 203 257 288 303 303 331 196 288Total 299 286 330 440 603 603 478 353 453 317 297 337 443 603 603 469 341 430
All funding for institutions via HEFC 6,709 5,893 5,014 4,091 4,010 3,860 3,712 3,552 3,604 7,118 6,123 5,125 4,121 4,010 3,860 3,640 3,427 3,424
Estimated fee income from home/EU
students subject to regulated feesc 2,600 4,200 5,600 7,000 8,100 8,000 8,600 9,000 .. 2,758 4,364 5,724 7,052 8,100 8,000 8,433 8,684 ..
Total funding for institutions via HEFCE and regulated fee income 9,309 10,093 10,614 11,100 12,100 11,860 12,300 12,500 .. 9,876 10,488 10,850 11,182 12,100 11,860 12,061 12,061 ..
(a) Adjusted using March 2017 2016 GDP deflators and forecasts from the OBR
(b) The Spending Round 2013 announced the the NSP, which was to be worth £150 million in 2014-15 would be cut and replaced by a £50 million fund to help postgraduate students from 2015-16.
(c) The 2011-12 figure is fee loans only, as used in the 2012-13 funding letter.
Sources: Higher education funding for 2017-18, and earlier, BIS/HEFCE; Reductions to HEFCE teaching grant for 2014-15 and 2015-16 academic years, BIS

BRIEFING PAPER Number 7393, 14 June 2017
The House of Commons Library research service provides MPs and their staff with the impartial briefing and evidence base they need to do their work in scrutinising Government, proposing legislation, and supporting constituents.
As well as providing MPs with a confidential service we publish open briefing papers, which are available on the Parliament website.
Every effort is made to ensure that the information contained in these publically available research briefings is correct at the time of publication. Readers should be aware however that briefings are not necessarily updated or otherwise amended to reflect subsequent changes.
If you have any comments on our briefings please email [email protected]. Authors are available to discuss the content of this briefing only with Members and their staff.
If you have any general questions about the work of the House of Commons you can email [email protected].
Disclaimer - This information is provided to Members of Parliament in support of their parliamentary duties. It is a general briefing only and should not be relied on as a substitute for specific advice. The House of Commons or the author(s) shall not be liable for any errors or omissions, or for any loss or damage of any kind arising from its use, and may remove, vary or amend any information at any time without prior notice.
The House of Commons accepts no responsibility for any references or links to, or the content of, information maintained by third parties. This information is provided subject to the conditions of the Open Parliament Licence.