Embed Size (px)
Citation preview

Presentation
Jakarta, June 2015
High shipping costs in Indonesia – Is it getting better?

2 Jun2015_ConfPresentation v1.pptx
This document shall be treated as confidential. It has been compiled for the exclusive, internal use by our client and is not complete without the underlying detail analyses and the oral presentation. It may
not be passed on and/or may not be made available to third parties without prior written consent from Roland Berger Strategy Consultants. RBSC does not assume any responsibility for the completeness
and accuracy of the statements made in this document.
© Roland Berger Strategy Consultants
Contents Page
Introducing our ports practice
Indonesia's shipping challenges
Developments in the port sector
Developments in the domestic shipping sector
How to reduce shipping costs
What can private investors do
Agenda today
3 Jun2015_ConfPresentation v1.pptx
3
Roland Berger is a leading global strategy firm with successful operations in all major international markets
50 offices in 36 countries,
with approx. 2,400 employees
1) By revenues in the strategy consulting market, based on internal and available public reports
Our global presence
1969 Milan
1982 Düsseldorf
1987 Stuttgart
1990 Berlin Hamburg Lisbon London Paris
1992 Bucharest
1994 Moscow
1997 Budapest Zürich
2000 Warsaw
2003 Zagreb
2007 Beirut Chicago HongKong
São Paulo 1976
Madrid 1986
Frankfurt Vienna 1989
Tokyo 1991
Brussels Kyiv Prague 1993
Beijing 1995
Detroit Shanghai 1998
Amsterdam 2002
Manama 2006
Casablanca Istanbul Taipei 2008
Munich 1967
1
2009 Doha
Gothenburg Singapore Stockholm 2010
2011-12 Dubai Jakarta
Kuala Lumpur Lagos Boston Guangzhou Montreal New Delhi Seoul
Clients
Over 220 partners with specific
expertise organized in 14 competence centers
Serving over 1,000 international clients
75% repeat clients
30% of top 1,000 global companies
40% of Europe's leading companies
Mumbai 2013 50
Offices Today
2014 Bangkok Pune
Source: Roland Berger Strategy Consultants

4 Jun2015_ConfPresentation v1.pptx
Roland Berger was a first-mover into Asia and has been active in the region for over 25 years
Roland Berger's presence in Asia Pacific
Mumbai
Jakarta
Hong Kong
Kuala Lumpur
Beijing Seoul
Shanghai
Singapore
Taipei
Tokyo
Guangzhou
> Asia-Pacific regional presence spans over 25 years: Today we have a team of over 600 consultants in Greater China, India, Japan, Korea and Southeast Asia
> Southeast Asia managed as an integrated region by a team of 10 partners/principals and 70 consulting staff spanning 6 locations (Singapore, Kuala Lumpur, Jakarta, Nay Pyi Taw, Yangon and Bangkok)
Roland Berger Position
New Delhi
Bangkok
Nay Pyi Taw
Office Project Office
Yangon
Roland Berger Position
Source: Roland Berger Strategy Consultants

5 Jun2015_ConfPresentation v1.pptx
Our global ports practice covers the various key aspects of port development
Focus areas of ports practice
Source: Roland Berger Strategy Consultants
Development Operations
Regulation
Feasibility studies
National port policies / strategies
Market studies, traffic forecasting
Port master planning
Re-development planning
Regulatory review / reform
Privatization studies
Business model design
Concession design
Tender process management
Due diligence, strategic reviews
Corporate / business strategy
Pricing strategies, tariff studies
Business planning
Operating performance
improvement

6 Jun2015_ConfPresentation v1.pptx
Our team has successfully completed a large number of port projects in Asia… and beyond
Credentials – Port projects (selection only)
Weifang > Market study,, technical review
and master planning
Kaoshiung > Port development plan
Haiphong > Port and marine services
market assessment
Tg. Manis, Samalaju > Port development master plans
Laem Chabang > Commercial due diligence
Penang > Port turnaround strategy
Klang > Performance improvement
strategies
Gwadar
> Master plan and development strategy
Maldives > Port re-development plans
Johor, Tg. Bin, Pengerang > Business rationalization, port policy,
strategic re-development plan, cargo warehousing strategy
Tg. Priok > Container market assessment, cargo forecast-
ing feasibility studies, operations improvement
> Container forecast breakdown by commodity and by region
Busan > Financing strategy
Tg. Perak > Container market study Estonia
> Market assessment study
Casablanca > Business plan review
Tokyo > Container port market study
Outside Asia
Source: Roland Berger

7 Jun2015_ConfPresentation v1.pptx
We have supported numerous ports in defining their master plans – Samples
Source: Roland Berger

8 Jun2015_ConfPresentation v1.pptx
Indonesia's shipping challenges

9 Jun2015_ConfPresentation v1.pptx
Domestic shipping costs are very high, especially in the Eastern part of the country
Source: World Bank, Roland Berger
> Shipping a container from Shanghai is cheaper than shipping one from Jakarta to Banjar Masin … not to mention Jayapura
Route-to-market challenges
Root causes:
small volumes
no/small return cargos
shipping network eco-system
high port charges
red tape
port infra limitations
road connections
road design
10 Jun2015_ConfPresentation v1.pptx
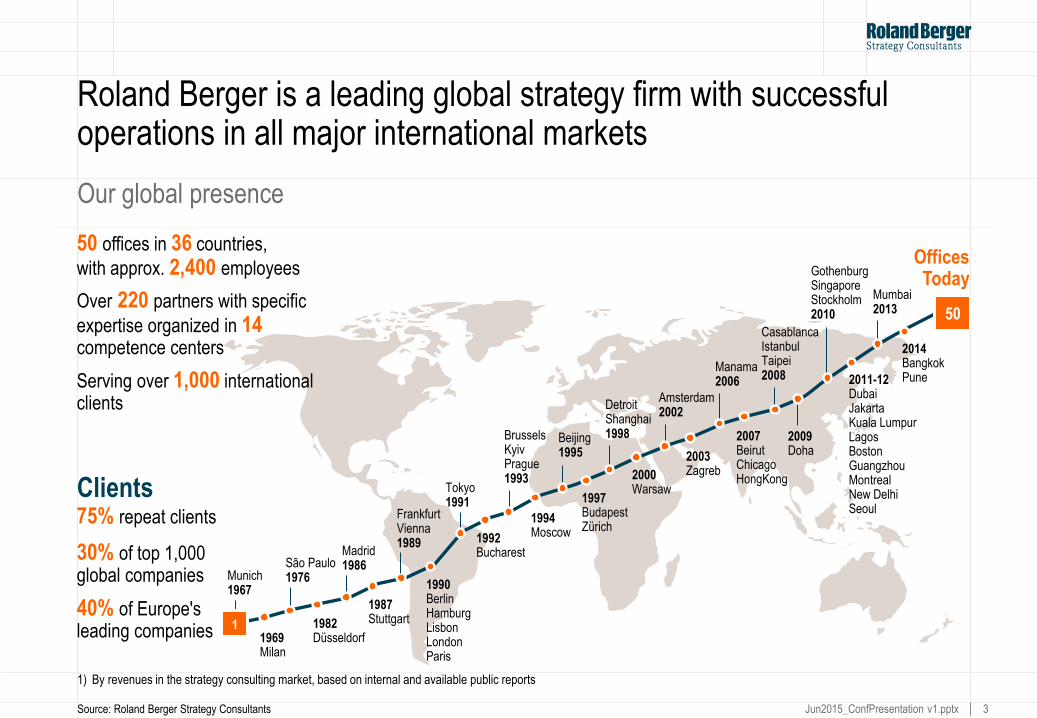
Logistics performance in ASEAN trails behind more developed economies as it correlates to the poor quality of overall infrastructure
1.0
1.5
2.0
2.5
3.0
3.5
4.0
4.5
5.0
1.0 1.5 2.0 2.5 3.0 3.5 4.0 4.5 5.0
Philippines
Cambodia
Myanmar Lo
gis
tics
Per
form
ance
Ind
ex, 2
014
Thailand
Vietnam
Indonesia
India
Germany
Malaysia
Netherlands
Quality of Overall Infrastructure, 2014
Japan United States
United Kingdom
Singapore
China
Lao PDR
Source: World Bank
Logistics performance and infrastructure assessment

11 Jun2015_ConfPresentation v1.pptx
Infrastructure remains a major hurdle for SEA despite efforts at both the national and regional level to improve quality and connectivity
2.10
2.40
2.20
2.80
2.87
2.54
2.68
3.08
3.43
3.61
4.11
4.14
4.15
4.15
4.26
3.95
2012
2.14
2.21
2.58
2.60
2.88
2.92
3.11
3.40
3.56
3.67
4.16
4.16
4.18
4.23
4.28
4.32
2014
Germany
Singapore
Netherlands
United States
United Kingdom
Japan
China
Malaysia
Thailand
Vietnam
Indonesia
India
Philippines
Cambodia
Lao PDR
Myanmar
Overall infrastructure assessment index, [ 5 = High, 1 = Low ]
0.07
0.13
0.08
0.05
0.21
0.05
0.06
0.13
0.32
0.43
0.38
0.01
-0.20
0.39
-0.20
0.04
Index improvement
Source: World Bank
12 Jun2015_ConfPresentation v1.pptx
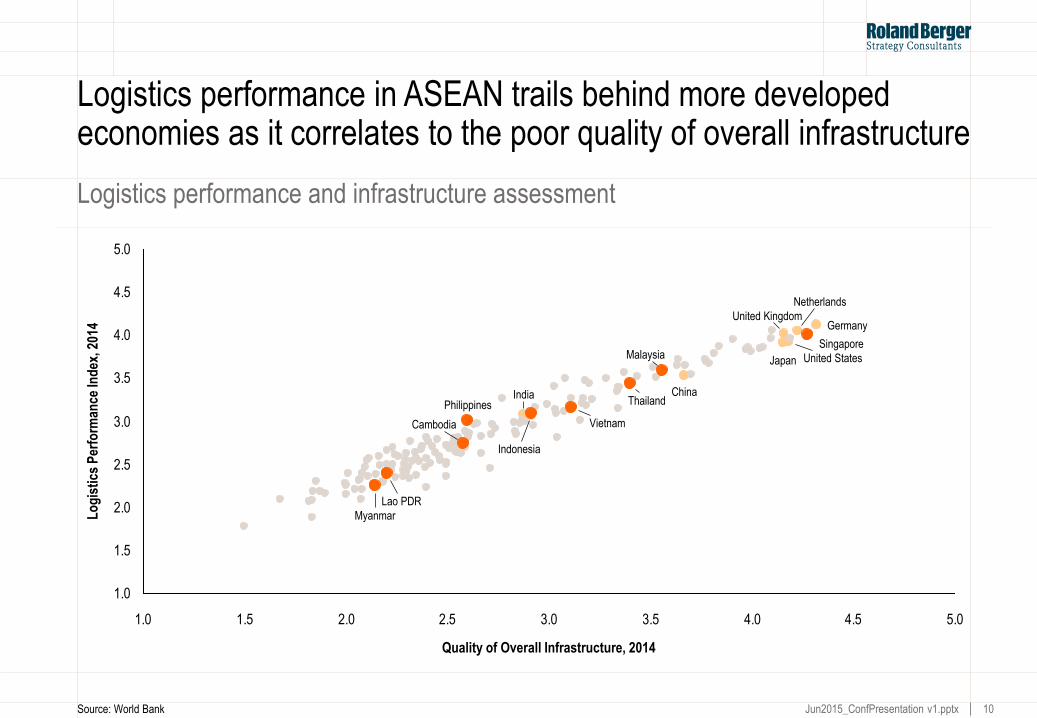
Road networks form the backbone of development. Indonesia (like most of ASEAN) has a long way to go to catch up
World1) average SEA average non-SEA countries SEA countries Best and worst countries
1) Information was collected from 144 countries worldwide.
Source: World Economic Forum, World Bank, ASEAN Secretariat
Road network density, 2011 (km/ 1,000 sq. km) Quality of roads (rank, value)
105178231254274337440452478546717
970
1,5781,847
3,327
4,871
Vie
tnam
Indi
a
Ger
man
y
Japa
n
Sin
gapo
re
Phi
lippi
nes
Lao
PD
R
Mya
nmar
Cam
bodi
a
Indo
nesi
a
AS
EA
N
Chi
na
Tha
iland
Mal
aysi
a
Bru
nei
Uni
ted
Sta
tes
1 – Extremely underdeveloped
7 – Extensive and efficient
Singapore (6, 6.1)
China (49, 4.6)
Myanmar (134, 2.4)
UAE (1, 6.6)
Malaysia (19, 5.6) Germany (13, 5.9)
Indonesia (72, 3.9)
Thailand (50, 4.5)
Lao PDR (68, 4.0) India (76, 3.8)
Philippines (87, 3.6) Cambodia (93, 3.4)
Vietnam (104, 3.2)
Japan (49, 4.6)
13 Jun2015_ConfPresentation v1.pptx
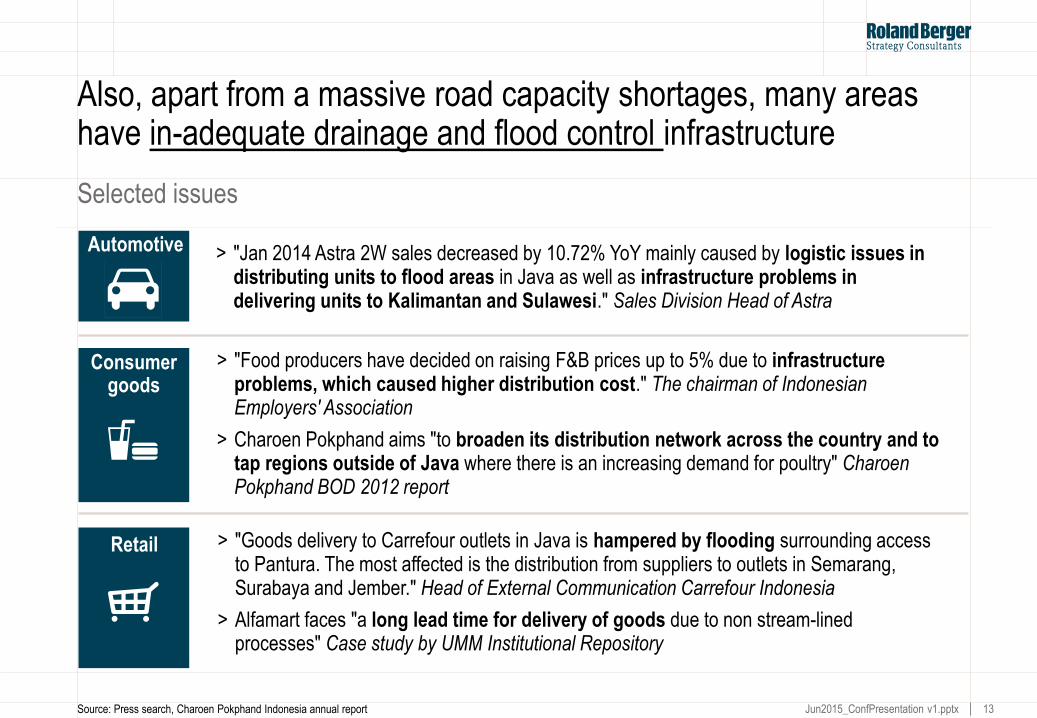
Also, apart from a massive road capacity shortages, many areas have in-adequate drainage and flood control infrastructure
Selected issues
Automotive > "Jan 2014 Astra 2W sales decreased by 10.72% YoY mainly caused by logistic issues in distributing units to flood areas in Java as well as infrastructure problems in delivering units to Kalimantan and Sulawesi." Sales Division Head of Astra
> "Food producers have decided on raising F&B prices up to 5% due to infrastructure problems, which caused higher distribution cost." The chairman of Indonesian Employers' Association
> Charoen Pokphand aims "to broaden its distribution network across the country and to tap regions outside of Java where there is an increasing demand for poultry" Charoen Pokphand BOD 2012 report
Consumer goods
> "Goods delivery to Carrefour outlets in Java is hampered by flooding surrounding access to Pantura. The most affected is the distribution from suppliers to outlets in Semarang, Surabaya and Jember." Head of External Communication Carrefour Indonesia
> Alfamart faces "a long lead time for delivery of goods due to non stream-lined processes" Case study by UMM Institutional Repository
Retail
Source: Press search, Charoen Pokphand Indonesia annual report

14 Jun2015_ConfPresentation v1.pptx
0
50
100
150
200
250
300
350
400
450
500
550
600
650
55 50 45 40 35 30 25 20 15 10 5 0
Pas
sen
ger
Car
s in
Use
(p
er 0
00 p
eop
le)
Gross National Income (GNI) per capita
USA
United Kingdom
Singapore
Netherlands
Malaysia
Japan
Indonesia
Germany
The immanent boom in car market expansion requires a massive expansion of the road network around the country
2.3
8.7
Laos
Philippines
India 18.9
27.4
Vietnam 22.2
Cambodia
Thailand 95.8
Indonesia 46.8
China 78.4
Singapore 120.7
Malaysia 373.0
USA 397.1
Netherlands 472.9
United Kingdom 496.9
Germany 544.6
Passenger car penetration rate, 2013 [units / 1000 people]
Source: World Bank, ASEAN Secretariat, Euromonitor
Car penetration growth correlation
Indonesia – car boom is coming

15 Jun2015_ConfPresentation v1.pptx
ASEAN's background as a trade-focused region is reflected in growth of port throughput though quality of port infra remains a concern
1) Information was collected from 144 countries worldwide. Data for Brunei was unavailable 2) Data for 2012 is unavailable
Quality of ports1) (rank, value) Port throughput, 2004 – 2012 (m tons)
Source: World Economic Forum, ASEAN Stats Database
World1) average SEA average non-SEA countries SEA countries Best and worst countries
7 – Extensive and efficient
1 – Extremely underdeveloped
the Netherlands (1, 6.8)
India (76, 4.0) Vietnam (88, 3.7)
Philippines (101, 3.5) Cambodia (97, 3.6)
Lao PDR (129, 2.6) Myanmar (125, 2.6)
Kyrgyz Republic (144, 1.3)
Singapore (2, 6.7)
Germany (14, 5.7)
Japan (26, 5.3)
China (53, 4.6) Thailand (54, 4.5)
Indonesia (77, 4.0)
Malaysia (19, 5.6)
2004 2005 2006 2007 2008 2009 2010 2011 2012
0
100
200
300
400
500
600
700
800
900
1,000
Vietnam
Indonesia
Singapore
Thailand
Myanmar
Malaysia
Philippines
Cambodia
CAGR
5%
4%
5%
10%
6%
3%
12%
5%
16 Jun2015_ConfPresentation v1.pptx
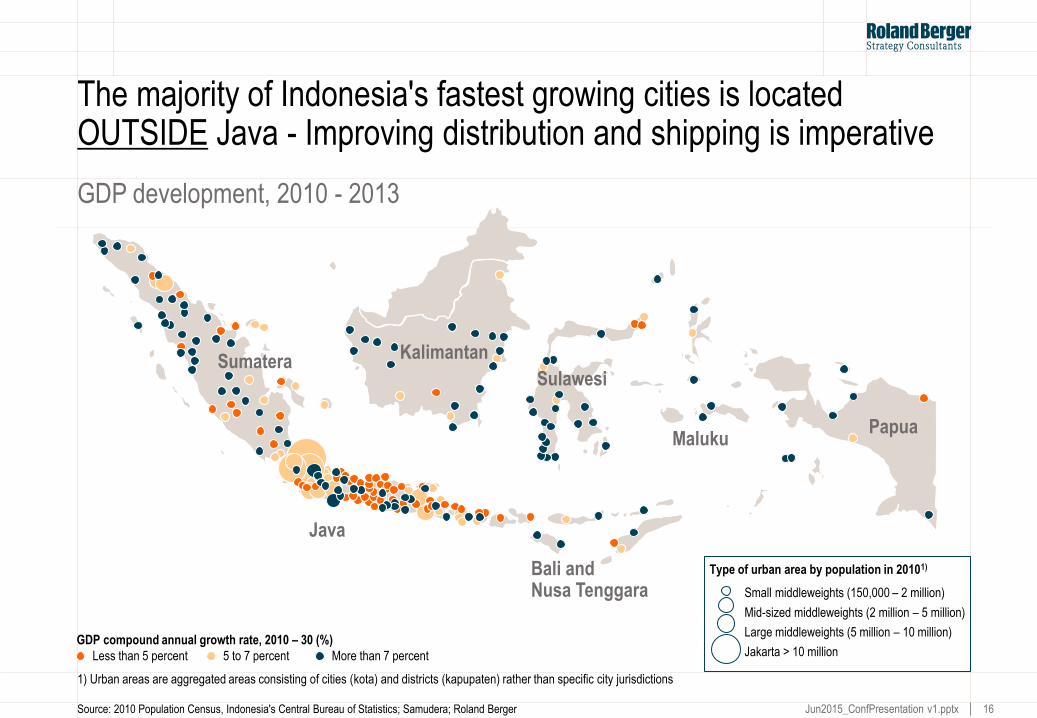
GDP development, 2010 - 2013
The majority of Indonesia's fastest growing cities is located OUTSIDE Java - Improving distribution and shipping is imperative
Less than 5 percent 5 to 7 percent More than 7 percent
GDP compound annual growth rate, 2010 – 30 (%)
Source: 2010 Population Census, Indonesia's Central Bureau of Statistics; Samudera; Roland Berger
1) Urban areas are aggregated areas consisting of cities (kota) and districts (kapupaten) rather than specific city jurisdictions
Sumatera Kalimantan
Sulawesi
Maluku Papua
Bali and Nusa Tenggara
Java
Small middleweights (150,000 – 2 million)
Mid-sized middleweights (2 million – 5 million)
Large middleweights (5 million – 10 million)
Jakarta > 10 million
Type of urban area by population in 20101)

17 Jun2015_ConfPresentation v1.pptx
Though growth rates are now generally higher, markets in the "outer" regions are relatively small compared to Java …
Route-to-market challenges (1/2)
Source: BPS, Roland Berger
Population spread in Indonesia [m people]
Java 136.6 (57%)
Sumatera 50.6 (21%)
Bali, Nusa Tenggara 13.0 (6%)
Maluku, Papua 6.2 (3%)
Kalimantan 13.8 (6%) Sulawesi
17.4 (7%)
Island Population (% of total population)

18 Jun2015_ConfPresentation v1.pptx
… while population densities are mostly low and shipping distances are mostly long…
12
25
92Sulawesi
Sumatera 105
Nusa Tenggara 136
Bali 673
Java 1.055
Ø 124
Papua & Maluku
Kalimantan
Source: BPS
Jakarta
Medan
1412 km Balikpapan
Makassar
Padang
Surabaya
Jayapura
Bali
629 km 1235 km
3143 km 775 km
298 km
Geographical distance per major cities (km) Population density (per km2)
Route-to-market challenges (2/2)

19 Jun2015_ConfPresentation v1.pptx
In-efficiencies in Indonesia's maritime industry also contribute to high inter-island logistics costs
Source: Press Search
Port infrastructure & equipment
Vessels
Shipbuilding
Human Resources
> Lack of proper port equipment and facilities, resulting in long ship turn-around times
– Long waiting times for ships prior to berthing
– Congestion, overload of port facilities in some cases
– Under-utilization in others
> Many ports have design constraints:
– Insufficient draft along berths
– In-efficient of in-adequate handling equipment
> Many vessels are too small to be economical
> Large part of domestic fleet is still outdated
> Domestic shipbuilding companies often lack capability to develop modern vessels
> Lack of financial support for shipbuilding industry?
> Domestic shipping companies face shortage of qualified mariners
– Sharp growth of domestic fleet, causing shortages
– Salaries offered by foreign shipping companies are much higher
Customs & regulation
> Port rates are generally very high
> Illegal fees/rates are common and often high
> Stevedoring rates are generally very high as well

20 Jun2015_ConfPresentation v1.pptx
Developments in the port sector

21 Jun2015_ConfPresentation v1.pptx
The Government has taken steps to improve port infrastructure via new port & shipping laws that has sparked private sector investment
21
Evolution of port sector regulations
Port sector "privatization"
PMBs were restructured into
> Public Port Corporations (PELINDO) I–IV
for commercial ports
> Directorate General of Sea Transportation
for non-commercial ports
1983
Port Authorities to
handle operational
matters and NPCs
to handle
commercial
1964
1969
Government
Regulation No. 1:
Port Management
Boards (PMB) to
manage public
ports
Eight National Port
Companies (NPC)
for port
management and
administration
1960
Categorisation of general and special
ports:
> PELINDO - ~70 commercial ports
> UPTs/ Regional Administrations – small
ports
> Owners – special ports
1992 2009
> National and Local Port Master
Plans,
> Port/ terminal development &
operational approvals
> Permits and tariffs
> Foreign-trading ports promotion
> Port information systems
2008
Shipping and Port Act No. 17: PELINDO
removed as regulator only to act as
operator setting tariffs freely, subject to
local port authorities’ approval
Source: Roland Berger

22 Jun2015_ConfPresentation v1.pptx
On the bright side, following new regulations, capital investment to further develop and expand the port industry has rapidly increased
15
Belawan > IDR 3 trn investment > Dock and equipment addition being done urgently > Additional CY space, to be fully ready by 2015
Kuala Tanjung > IDR 6.5 trn investment > Capacity of 1.5 m TEUs/ year > With a 2.5 m ton/ year CPO terminal > Ready by 2015
Teluk Bayur > Procurement of
equipments and expansion of dock
> Projected cost of IDR 675 bn
> Capacity of 4k TEUs
Dumai > Investment of IDR 6 trn > Yard storage, container, dry bulk,
liquid and passenger terminal including warehouse space
> Primarily serving commodities E.g. CPO
Tanjung priok > Development of new Priok
Port in North Kalibaru adding an additional capacity of 9 m TEUs by 2023
Cilamaya > Proposed investment of USD 1.03 bn > Capacity of 10 m TEUs > Operators still to be chosen > Scheduled completion in 2019
Gresik > Increase the general cargo, liquid bulk,
channel and basin over two stages > Scheduled final completion is 2014 > IPC III to jointly build an industrial estate
and deep water port with AKR of Gresik
Madura > Privately developed industrial city
(Lamicitra Nusantara Tbk) > 10k ha land as an integrated seaport > USD 600 m/ project x 10 projects
Pontianak > The proposed port would be able to
process up to 3 million TEU pa as well as 15 million tonnes of bulk cargo and over 20 million tonnes of liquids
Banjarmasin > New channel built by
private company increasing throughput greatly
> Revenue earned by users on /MT basis
Makassar > IDR 7 trn investment > Starting in 2014 with Pelindo IV > Looking for private/ state run companies
to construct the port or foreign entity
Bitung > National strategic port under
country Masterplan (MP3EI) > Incl. 500 ha industrial zone > Road works to port is IDR 2 trn > Would increase regions GDP to
IDR 50 trn by 2025
Ambon > Land reclamation > New dock > Quay extension > Increased container volume
~320k TEUs by 2025/ month > Currently 36k TEUs per month > Expansion delayed due to
financial problems (gov't budget)
Sorong > IPC II would work on the plan to
build a new Sorong to be one of the hub in Eastern region of Indonesia.
Pekanbaru > Investment in dock
area, CY space, container port terminal, road access and also access within the harbor
14
13
12 9
8 7 6
5
4
3
2
1
10
11
Source: Roland Berger, July 2014

23 Jun2015_ConfPresentation v1.pptx
The new legislation is expected to have a positive impact on the maritime sector – though new concerns have emerged
Concerns
Impacts of changes in legislation
Lack of coordination between different agencies within the port sector
Slow yielding projects – Port projects take significant amount of investment and long time to realize returns
New Port Authorities staff have poor expertise in port sectors.
The overlap and ambiguity over the role of new Port Authorities versus Operators (especially the Pelindos)
Multiple modes of implementation of the law
Lack of clear master plan for the country’s port sector
Source: Roland Berger
Widespread expansion of development across the archipelago through:
> Competition in the development and operation of ports thus breaking state monopoly
> Improvement in inter-island transport connectivity
> Some reduction in transport costs

24 Jun2015_ConfPresentation v1.pptx
The new government has last year announced a major new capex program for 24 priority ports, to be spent within the next 5 years
Source: SEAISI; Indonesian Statistics Body; Roland Berger analysis
Maluku
Bali & Nusa Tenggara
Irian Jaya
Java
Sumatra
Kalimantan
Sulawesi
Banda Aceh Rp 2 trillion
Padang Rp 1.5t
Kuala Tanjung Rp 3t
Pontianak Rp 1.5t
Maloy Rp 1t
Jayapura
Rp 1t
Kupang Rp 1.5t
Ambon Rp 1t
Palangkaraya
Rp 1t
Banjarmasin Rp 1.5t
Belawan Rp 3t
Dumai Rp 1t
Batam Rp 3t
Panjang Rp 1.5t
Tanjung Priok Rp 1.5t
Pangkal Pinang Rp 1.5t
Cilacap Rp 1.5t
Makassar Rp 1t
Bitung Rp 5t
Surabaya Rp 1.5t
Lombok Rp 1.5t
Sorong Rp 1.5t
Halmahera Rp 1.5t
Merauke Rp 1.6t
Sorong Rp 1.5t
24 priority ports, including 2 new / additional gateways
25 Jun2015_ConfPresentation v1.pptx
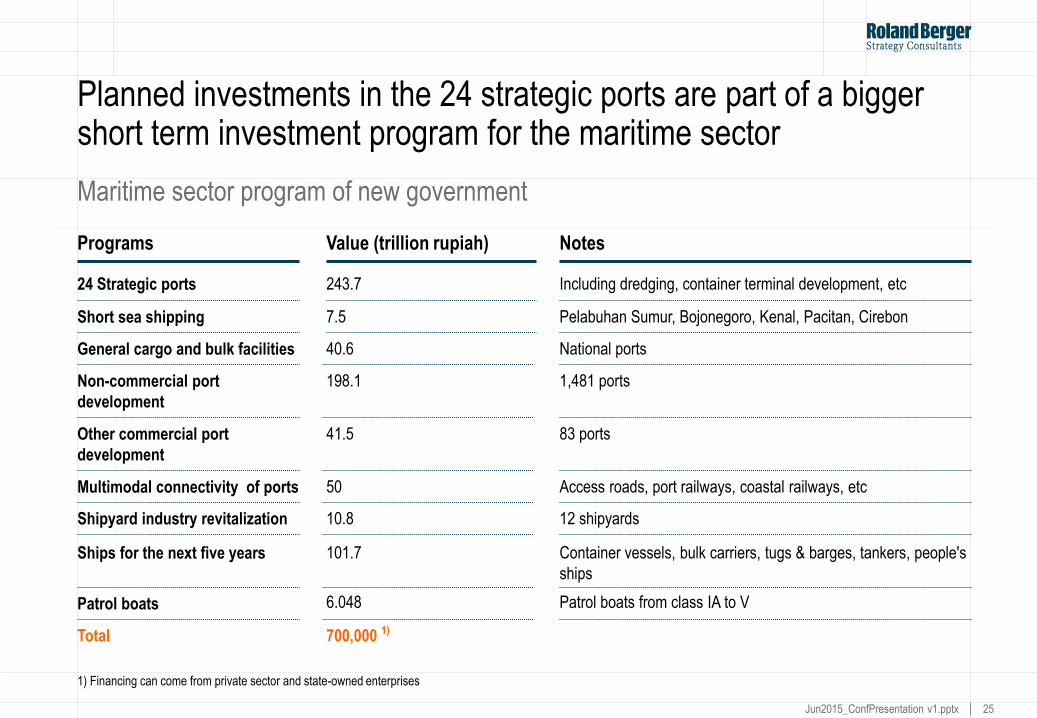
Programs Value (trillion rupiah) Notes
24 Strategic ports 243.7 Including dredging, container terminal development, etc
7.5 Short sea shipping Pelabuhan Sumur, Bojonegoro, Kenal, Pacitan, Cirebon
40.6 General cargo and bulk facilities National ports
198.1
Non-commercial port
development
1,481 ports
41.5 Other commercial port
development
83 ports
50 Multimodal connectivity of ports Access roads, port railways, coastal railways, etc
10.8 Shipyard industry revitalization 12 shipyards
101.7 Ships for the next five years Container vessels, bulk carriers, tugs & barges, tankers, people's
ships
6.048 Patrol boats Patrol boats from class IA to V
700,000 1) Total
1) Financing can come from private sector and state-owned enterprises
Planned investments in the 24 strategic ports are part of a bigger short term investment program for the maritime sector
Maritime sector program of new government

26 Jun2015_ConfPresentation v1.pptx
Domestic shipping sector

27 Jun2015_ConfPresentation v1.pptx
In addition, the government has announced a number of other financial incentives for the shipping sector
Shipping sector incentives
1 Soft loan facility for national procurement financing through special allocation fund for the
procurement of vessels
4 Reduce shipbuilding costs by reviewing Ministerial Decree No. 7/ 2013 on the classification of
Indonesian-flagged vessels
2 Reviewing the regulations for free import duties, value added tax, income tax for shipyard
industries and other supporting industries
3 More flexible rulings on bank guarantees in shipping
5 Up to 40% increase local content provisions in shipping industry for new vessels
Final objective: Reduce national logistics costs from 23.5 % of GDP to 19.2 % of GDP

28 Jun2015_ConfPresentation v1.pptx
The total tonnage handled by ports has experienced annual growth of 4.2% to reach 565 m MT in 2013 (IPC's only)
72
138
774
194
2012 2013
+4.2%
2011
518
130
195
66
127
2010
489
116
195
59
119
2009
453
100
184
61
108
2008
465
104
175
69
117
2007
425
93
148
71
113
2006
400
84
136
63
117
2005
405
81
130
71
123
540
2020
136
203
69
132
565
142
213
189
+36.9%
99
291
Container Dry Bulk Liquid Bulk General Cargo
Source: IPC I, II, III, IV
CAGR 05-13 [%]
1.5%
0.2%
6.3%
7.2%
Port throughput evolution in Indonesia [m MT]

29 Jun2015_ConfPresentation v1.pptx
The number of registered shipping companies in Indonesia has also increased strongly especially in the recent years
Source: Samudara Indonesia, Roland Berger
Indonesia's shipping line sector
2,655
2,273
0
500
1,000
1,500
2,000
2,500
3,000
17%
2012 2010
Growth of shipping companies [#]
Growth in no. of ship-owners registered in Indonesia's National Ship-owners' Association
2013 (1.293) 2011
(1.168) 2009 (1.064)
1999 (747)
1989 (306)

30 Jun2015_ConfPresentation v1.pptx
The number of shipping companies listed in the IDX stock exchange has risen strongly – Mainly linked to growth in the off-shore industry
Source: Roland Berger
21
7
5
0
2
4
6
8
10
12
14
16
18
20
22
2013 2005 2000
+40%
+200% No. Company name Activity
Year of registration
1 Berlian Laju Tanker Transport - Marine 1990
2 Rig Tenders Indonesia Transport - Marine 1990
3 AKR Corporindo Distribution/Wholesale 1994
4 Mitra Internasional Resources Transport - Marine 1997
5 Samudera Indonesia Transport - Marine 1999
6 Tanah Laut Infrastructure, Utilities, and Transport 2001
7 Arpeni Pratama Ocean Line Transport - Marine 2005
8 Ancora Indonesia Resources Petrochemicals 2006
9 Radiant Utama Interinsco Oil Comp- Explor & Production 2006
10 Humpuss Intermoda Trans Transport - Marine 2007
11 Elnusa Oil-field services 2008
12 Trada Maritime Transport - Marine 2008
13 Pelayaran Tempuran Emas Transport - Marine 2009
14 Wintarmar offshore Marine Transport - Marine 2010
15 Mitrabahtera Segara Sejati Transport - Marine 2011
16 Buana Listya Tama Transport - Marine 2011
17 Indo Straits Transport - Marine 2011
18 ABM Investama Diversified Operations 2011
19 Pelayaran Nelly Dwi Putri Transport - Marine 2012
20 Pelayaran Nasional Bina Guna Raya Transport - Marine 2013
21 Trans Power Marine Transport - Marine 2013
No. of Shipping companies listed on IDX stock exchange [#]
Shipping companies listed on the IDX stock exchange, 2013

31 Jun2015_ConfPresentation v1.pptx
Main players in domestic container shipping are emerging, eg. Tanto Intim (45 container vessels), Meratus Line (56), Samudera (32)
Source: Company websites; Roland Berger
Key players
> Est. in 1971
> Over 45 container vessels
> Revenue: Rp. 555.0 billion (2011)
> Est. 1957
> Operates 27 container liner services
> Over 56 container vessels
> Revenue: Rp. 495.0 billion (2011)
> Est. in 1950s
> 32 container vessels
> Revenue: Rp. 4,621.0 billion (2011)
Tanto Intim
Meratus Line
Temas Line
Samudera Indonesia
Djakarta Lyod
> Est. in 1987
> 22 vessels
> Revenue: Rp. 846.6 billion (2011)
> Est. in 1950
> 14 vessels
> Revenue: Rp. 585.0 billion (2011)
Salam Pacific Indonesia Lines
> Est. in 1970
> 24 vessels
> Revenue: Rp. 255.0 billion (2011)

32 Jun2015_ConfPresentation v1.pptx
Historically, Surabaya is the main distribution hub for Eastern Indonesia – a blessing as well as a "curse"
Source: Samudera; Roland Berger
Jaka
rta-
bas
ed r
ou
tes
Su
rab
aya
-bas
ed r
ou
tes
> Surabaya has more domestic
shipping connections than
Jakarta
> Further, Indonesia’s major
shipping lines: Tanto Intim,
Meratus and Salam Pacific
Indonesia – are home-based in
Surabaya
> Connections are mainly direct.
Ships are small and mostly
slow, resulting in high costs per
product unit. Many return empty
> This "system" has its roots in
colonial days. It is critical that
this be changed if shipping
costs are to be reduced
Comments

33 Jun2015_ConfPresentation v1.pptx
How to reduce shipping costs

34 Jun2015_ConfPresentation v1.pptx
A re-thinking of the shipping system – now being studied – might provide part of the solution for the East
Pendulum Nusantara concept

35 Jun2015_ConfPresentation v1.pptx
Picking hub locations should be done with an eye on the long term development potential of international shipping across the country
Drawing international shipping lanes into territorial waters
Source: Roland Berger
100mi
200km
Aceh
North Sumatra
West Sumatra
Riau
South Sumatra
Jambi
Bengkulu
Lampung
Banten
Jakarta
West Java
Central Java East
Java Special Reg. of Yogyakarta
Bali West Nusa Tenggara East Nusa
Tenggara
West Kalimantan
Central Kalimantan
South Kalimantan
East Kalimantan
North Kalimantan
North Sulawesi North
Maluku
Gorontalo
Central Sulawesi
West Sulawesi
South Sulawesi
East Sulawesi
Papua
West Papua
Maluku
?
?

36 Jun2015_ConfPresentation v1.pptx
We believe that more can be achieved faster if a more comprehen-sive and more integrated ports-shipping strategy is adopted
Reducing maritime shipping costs – What more the Government can do
Source: Roland Berger
Complication: How to ensure that cost-effective loops will indeed emerge in "remote" areas?
1.
2.
3.
4.
5.
6.
7.
Bring maritime safety levels in territorial waters to levels acceptable to international liners, then ..
Facilitate emergence of international shipping lanes inside territorial waters
Designate more international port hubs – in addition to the current "de facto 4-5" (Kuala Tanjung, Jakarta,
Surabaya, Makassar, Bitung) at the natural hub locations along these lanes – Total of 8!
Set and enforce specific and higher (world-class) performance standards for the hub ports
Create warehousing and distribution-center hubs in these hub-ports – both custom-made and for general usage
Re-think cabotage regulations with a view towards "creation" of international shipping lanes and driving down
short-loop distribution and feeder shipping costs
Engage intensively with the main existing domestic (container) shipping lines – to push them towards a more
efficient hub/spoke/loops approach to domestic shipping and feedering

37 Jun2015_ConfPresentation v1.pptx
What can private investors do

38 Jun2015_ConfPresentation v1.pptx
More aggressive, more direct involvement of shippers in the logistics chain will uncover various cost savings opportunities
Direct involvement in logistics chain management – Suggestions for discussion
> Sourcing – Buy "local" … as close to end-user as possible and sensible
> Forwarding – Stop outsourcing, do it in-house (or buy forwarders), which would provide far more control and
insights in the logistics chain and more leverage over transport providers and shipping lines
> Forwarding – If not in-house, work towards full visibility of your logistics flows by adopting modern SCM
information systems so as to have better visibility on improvement opportunities
> Forwarding – Traditionally local/regional businesses. Facilitate creation of national-level forwarders
> Engage directly with shipping lines relevant to your logistics flow - in view of your own (future) logistics needs,
of up-coming changes in shipping patterns etc
> Lobby with Government – Get organized, lobby to focus on all elements of the shipping value chain
> Invest or co-invest in larger and modern distribution center facilities in relevant hub ports
> Continuously analyze in-depth your own distribution flow path / system / methods in view of up-coming
changes in shipping patterns
> (Work with ports to reduce administrative bottlenecks and streamlining of information flows)
Source: Roland Berger