Embed Size (px)
Citation preview

L--77qlNASA Technical Memorandum 106187AIAA-93-2252
High Reynolds Number and Turbulence Effectson Aerodynamics and Heat Transfer in aTurbine Cascade
Frederick C. Yeh, Steven A. Hippensteele, G. James Van Fossen, Philip E. Poinsatte,and Ali AmeriLewis Research CenterCleveland, Ohio
Prepared for the29th Joint Propulsion Conference and Exhibitcosponsored by the AIA.A, SAE, ASME, and ASEEMonterey, California, June 28-30, 1993
NAFDA
https://ntrs.nasa.gov/search.jsp?R=19930019968 2018-08-26T07:36:11+00:00Z

HIGH REYNOLDS NUMBER AND TURBULENCE EFFECTS ON AERODYNAMICS
AND HEAT TRANSFER IN A TURBINE CASCADE
Frederick C. Yeh, Steven A. Hippensteele, G. James VanFossen,Philip E. Poinsatte, and Ali Ameri
National Aeronautics and Space AdministrationLewis Research CenterCleveland, Ohio 44135
Abstract
Experimental data on pressure distribution andheat transfer on a turbine airfoil were obtained over arange of Reynolds numbers from 0.75 to 7.0x10 6 and arange of turbulence intensities from 1.8 to about 15 per-cent. The purpose of this study was to obtain fundamen-tal heat transfer and pressure distribution data over awide range of high Reynolds numbers and to extend theheat transfer data base to include the range of Reynoldsnumbers encountered in the Space Shuttle main engine(SSME) turbopump turbines. Specifically, the studyaimed to determine (1) the effect of Reynolds number onheat transfer, (2) the effect of upstream turbulence onheat transfer and pressure distribution, and (3) the rela-tionship between heat transfer at high Reynolds num-bers and the current data base. The results of this studyindicated that Reynolds number and turbulence intens-ity have a large effect on both the transition from lami-nar to turbulent flow and the resulting heat transfer.For a given turbulence intensity, heat transfer for allReynolds numbers at the leading edge can be correlatedwith the Frossling number developed for lower Reynoldsnumbers. For a given turbulence intensity, heat transferfor the airfoil surfaces downstream of the leading edgecan be approximately correlated with a dimensionlessparameter. Comparison of the experimental resultswere also made with a numerical solution from a two-dimensional Navier-Stokes code.
k thermal conductivity of air,:0.0147 Btu/(hr/ft/°F)
L total length of airfoil pressure or suctionsurface, in.
Nu Nusselt number, h d/k
P pressure, psia
Pr Prandtl number
Q heat flow rate, Btu/hr
Reexit Reynolds number, based on axial chord andairfoil exit conditions
Reinlet Reynolds number, based on leading edgediameter and inlet conditions
r recovery factor, (Pr) 1/3 0.89
S
blade pitch, in.
s distance along airfoil pressure or suctionsurface from airfoil stagnation point, in.
T
temperature, 'R
Tu turbulence intensity, percent
V
fluid velocity, ft/sec
W
flow rate, lb/sec
0
flow angle, rad or deg
Ax longitudinal integral length scale
dynamic viscosity, lb/ft-sec
fluid density, lb/ft3
Nomenclatureis
A area, ft 2 p
B curve-fitting polynomial coefficient Subscripts:
C chord length, ft 0,1,2,3,4
d leading edge diameter, ft c
E mean voltage, volts d
Fr(0) Frossling number at stagnation point, gNu e o.s
d/(R inlet ih heat transfer coefficient, Btu /hr/ft2/°F
curve-fitting polynomial coefficients
chord length
leading edge diameter
gas
input
Resident Research Associate, NASA Lewis Research Center.
1

in inlet from this facility. Experimental heat transfer data are
L lossalso compared with a numerical solution from theTRAFC21) 2 code.
LC liquid crystal
R recoveryFacility
s surface distance from airfoil stagnation point General Description
st static
t total
Superscript:
fluctuating velocity component
Introduction
The turbines used in the Space Shuttle main engine(SSME) run at very high pressures and Reynolds num-bers. At these extreme conditions, the heat transfer ratesto the turbine airfoils are expected to be significantlyhigher than those of current aeropropulsion turbines. Adetailed knowledge of heat transfer at these extreme con-ditions is necessary to predict airfoil surface tempera-tures and satisfy life goals.
A large body of flow and heat transfer data overairfoils for current aeropropulsion turbines at lowerReynolds numbers on the order of 10 6 is available in theliterature. However, very little information is availablefor the range of higher Reynolds numbers found in theSSME turbopump turbines.
A Variable Reynolds Number Heat TransferCascade Facility was constructed at the NASA LewisResearch Center. Its purpose was to conduct a funda-mental study on heat transfer at Reynolds numbersranging from current aeropropulsion gas turbine levelsto those found in the SSME turbopump turbines. Theeffect of free-stream turbulence on heat transfer and therelationship between heat transfer data at high Reynoldsnumbers and the current data base was investigated.Turbulence-generating grids were used to vary the tur-bulence intensity levels in the test section. The facilityis capable of operating over a range of Reynolds num-bers from 0.75 to over 7.0x10 6 (based on axial chordand airfoil exit conditions) and a range of turbulenceintensities from 1.8 to about 15 percent.
Heat transfer and airfoil pressure distribution datawere obtained at Reynolds numbers of 0.75, 1.5, 3.0, 5.0,and 7.0x10⁶ . The measured turbulence intensity levelsranged from 1.8 percent at a Reynolds number of7.0x10 6 with no grid (clear tunnel case) to 15.1 percentat a Reynolds number of 0.75x10 6 with 1/4-111. grid.Preliminary results from this facility were reported inSchobeiri, McFarland, and Yeh. 1 This paper presents thelatest heat transfer and pressure distribution results
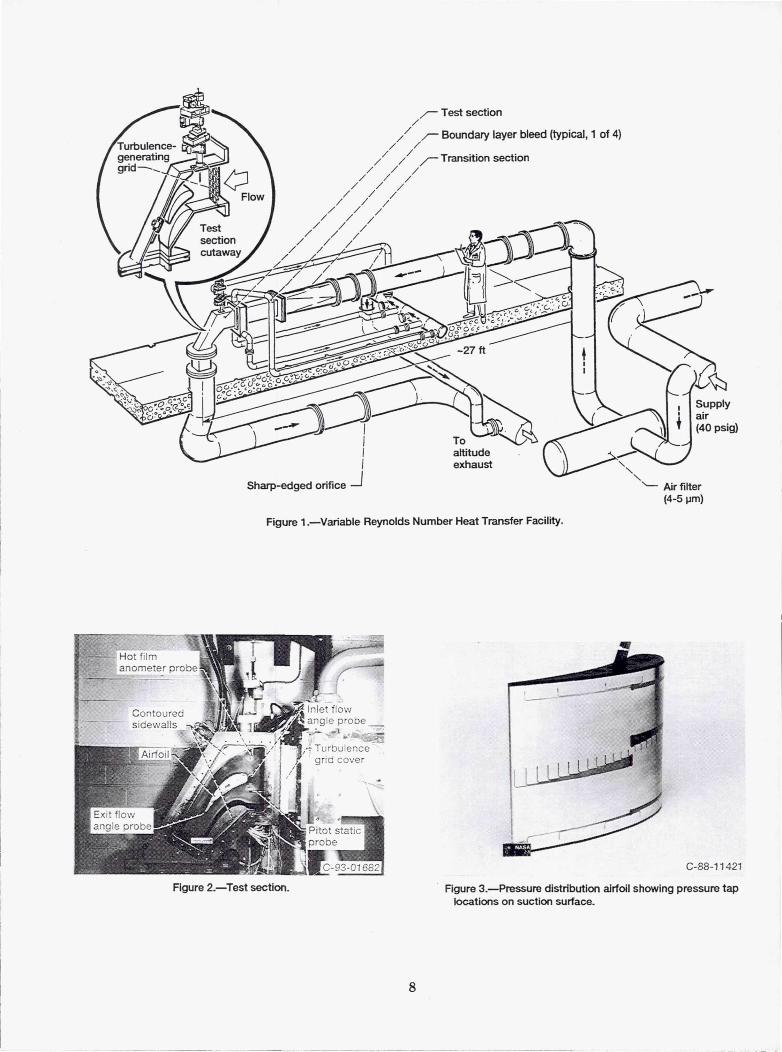
Figure 1 is an illustration of the test facility,including a cutaway view of the test section. Com-pressed air at 40 psig and ambient temperature flowsthrough an 18-in.-diameter pipe which houses screensand perforated plates for flow conditioning. The maxi-mum flow rate of the facility is about 38 lb/sec; the airflow exits to the laboratory exhaust system at 1.93 psia.Upstream of the test section, boundary layer air is bledfrom four sides to provide a uniform velocity profile atthe test section entrance. The main air, flow as well aseach individual bleed air flow, is measured with a sharp-edged orifice.
Test Section
The test section with the cover plate removed isshown in Fig. 2. Visible in this photograph are theairfoil, the contoured sidewalls, the hot film anemometerprobe, the inlet and exit flow angle measurement probes,and the Pitot static probe. A turbulence grid, notvisible, is located behind the grid cover. Two turbulencegrids were used to vary the turbulence intensity in thetest section. The grids were of the square-mesh, bi-planetype with square bars, one having 1/8-in. square barsand the other having 1/4-in. square bars. Tests werealso conducted using a clear tunnel only (no grid). Theratio of mesh-to-bar width spacing was 4.5, giving a60-percent open flow area. The traversing anemometerprobe, mounted on the test section, is located 3.6 lead-ing edge diameters (6.19 in.) downstream from the gridand 0.77 diameter (1.31 in.) in front of the airfoilleading edge. The anemometer probe was used to surveythe turbulence intensity in the pitchwise direction.
Airfoil
The airfoil used in these tests has an axial chord of8.5 in., an actual chord of 11.09 in., a span of 8.5 in., asolidity of 1.32, a camber angle of 51.7°, and a two-dimensional, constant-section vane to provide a uniformflow field. Coordinates of the airfoil and other geometricinformation are given in Schobeiri, McFarland, andYeh. l Two airfoils were fabricated: one was used forpressure distribution tests and the other for heat transfertests. The pressure distribution airfoil is shown in thephotograph of Fig. 3. Of the 90 pressure taps on the air-foil, 52 were located at the midspan, and 19 each werelocated at the hub and tip sections to record any three-dimensionality of the flow field around the airfoil.

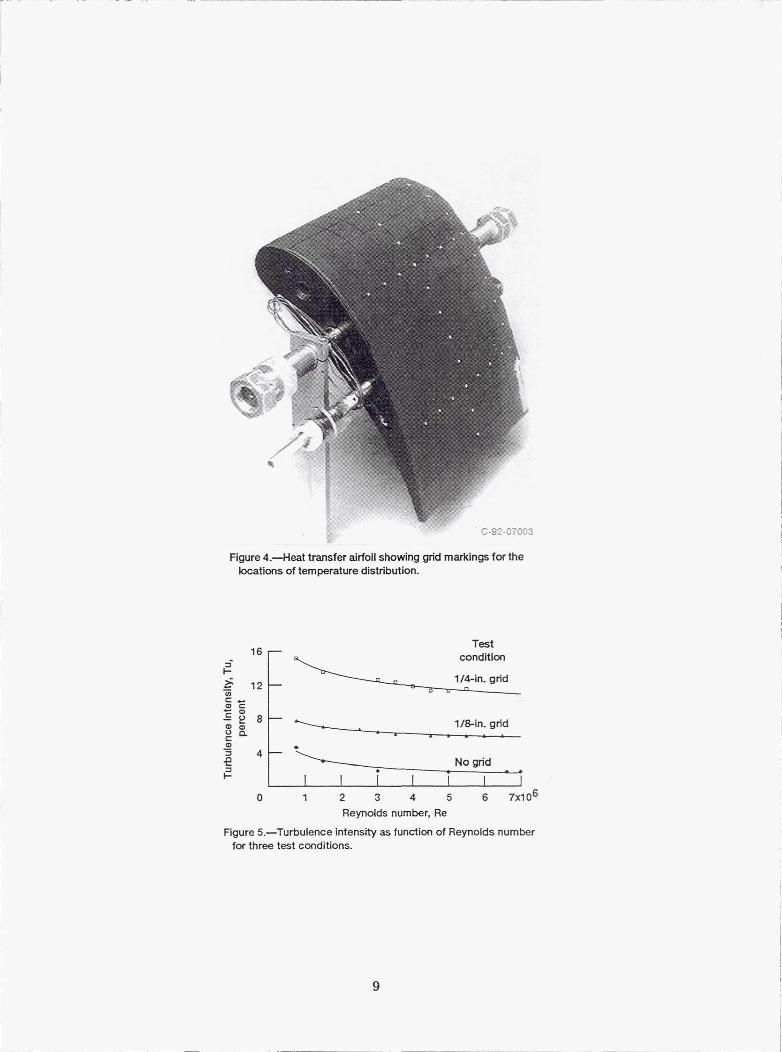
The airfoil used for heat transfer tests is shown inFig. 4. It is overlayed with a thin (0.001-in.) Inconelsheet. Passing an electric current through the Inconelsheet gave a constant heat flux boundary condition. TheInconel sheet was first coated with black paint, thensprayed with a liquid crystal and clear binder mixture.Grid lines were drawn on the airfoil surface to locate thetemperature field in the data reduction process. Whitedots were added as an aid to locate the temperaturesindicated by the liquid crystals. Details on the use of theliquid crystal technique on airfoils are given byHippensteele, Russell, and Torres. 3,4 A thermocouplewas also installed on the airfoil to verify the temperatureon the Inconel sheet beneath the liquid crystal coating.
Test. Prnrednre
The Reynolds numbers were obtained by varyingthe inlet flow rate while keeping the inlet pressureapproximately constant. Turbulence intensity meas-urements were obtained by using a constant temperaturehot film anemometer, which was installed in a traversingactuator on top of the test section to survey the flowchannel in a pitchwise direction at midspan. Heattransfer tests were conducted for Reynolds numbers of0.75, 1.5, 3.0, 5.0, and 7.0x10⁶ . The inlet Mach num-bers ranged from 0.027 to 0.27; exit Mach numbersranged from 0.058 to 0.71.
Data for turbulence intensity, pressure distribution(using the pressure distribution airfoil), and heat trans-fer (using the heat transfer airfoil) were recorded atReynolds numbers of 0.75, 1.5, 3.0, 5.0, and 7.0x10⁶.The fast series of tests were conducted with a cleartunnel (no turbulence grid installed); the second seriesused the 1/8-in. grid; and the last series used the 1/4 -111.
grid.
Data Reduction Procedure
Heat Transfer
Surface heat transfer coefficients were obtainedfrom the energy balance
h = Q1 QL (1)A ( TLC — TR)
where the local heat transfer coefficient h was calculatedat the location of the calibrated color band (an isothermwhich, in this case, also represents a uniform heat trans-fer coefficient). The heat energy Q i supplied to theInconel heater sheet was calculated from the measuredvoltage across the sheet and the current through a shuntresistor in series with the sheet. The heat loss Q L wasthe calculated radiation loss from the surface. The very
low thermal conductivity material used for the airfoilmakes interior heat conduction loss negligible, and thusit is neglected. The area A was the measured area of theInconel heater sheet. The temperature of the test surface
TLC was the calibrated liquid crystal temperature. Thelocal recovery temperature T R of the free-stream airaround the airfoil was calculated as
TR. = Tgt + r (Tt — Tst) (2)
where Tst and Tt are the local static and total air tem-peratures around the airfoil, and r is the recovery factor,defined as the cube root of the Prandtl number.
Reynolds Number Measurement
The Reynolds number is based on the axial chordand the exit conditions:
Re = C ( pV)exit (3)
A
where C is the chord length, p is the fluid density, V isthe fluid velocity, and µ is the dynamic viscosity,
( pV)exit = W/Aexit, and
A,.it = S cos 0 (4)
S is the blade pitch, and B is the flow exit angle. In thispaper, the flow angle is taken as equal to the camberangle (61.7'), which is approximately the case for sub-sonic flow. W is measured by a sharp-edged orificedownstream of the test section.
Turbulence Measurements
Turbulence intensity was measured with a TSImodel 1210-20 hot film probe located 6.19 in. down-stream of the turbulence grid. Flow was normal to theprobe axis. The probe was calibrated in the tunnel, up-stream of the turbulence grid and boundary layer bleeds,by varying the Reynolds number over the range used inthis study. The probe voltage was plotted against thecalculated density-velocity product, and a fourth-order,least-squares curve fit was obtained:
pV = Bo + B 1E + B2 ,F2+ B3E3 + B4E4 (5)
where pV is the density-velocity product, B is thepolynomial coefficient, and E is the mean voltage readfrom an integrating voltmeter. The turbulence intensitywas then obtained from the calibration curve as
3

Tu = pV 1 _ d[pV(E)] dE (6)PV dE pV (E)
where dE is taken as the root mean square of the fluctu-ating voltage read from a true rms meter. The turbu-lence intensity was measured in midchannel because itrepresented the location in the flow channel leastaffected by the airfoil leading edge and the sidewall.
Results and Discussion
Figure 5 presents turbulence intensities as a func-tion of Reynolds number for three test conditions: cleartunnel (no grid), 1/8- and 1/4-in. grids. In general, theturbulence intensities show a stronger Reynolds numberdependency at lower Reynolds numbers. In all cases, theturbulence intensities decreased only slightly forReynolds numbers greater than 3.0x 10⁶ . The turbulenceintensities for the clear tunnel (no grid) shown here arehigher than those obtained from a typical quiescentwind tunnel because of the turbulent pipe flow conditionthat exists ahead of the test section. For the cases of the1/8- and 1/4-in. bar grids, the turbulence intensities arein general agreement with those calculated from Bainesand Peterson for Reynolds numbers greater than3.0x106
Pressure Distribution
Both the airfoil and the contoured sidewalls wereinstrumented with the same number of pressure taps tocheck the effect of periodicity, as well as the three-dimensionality, of the flow in the cascade.
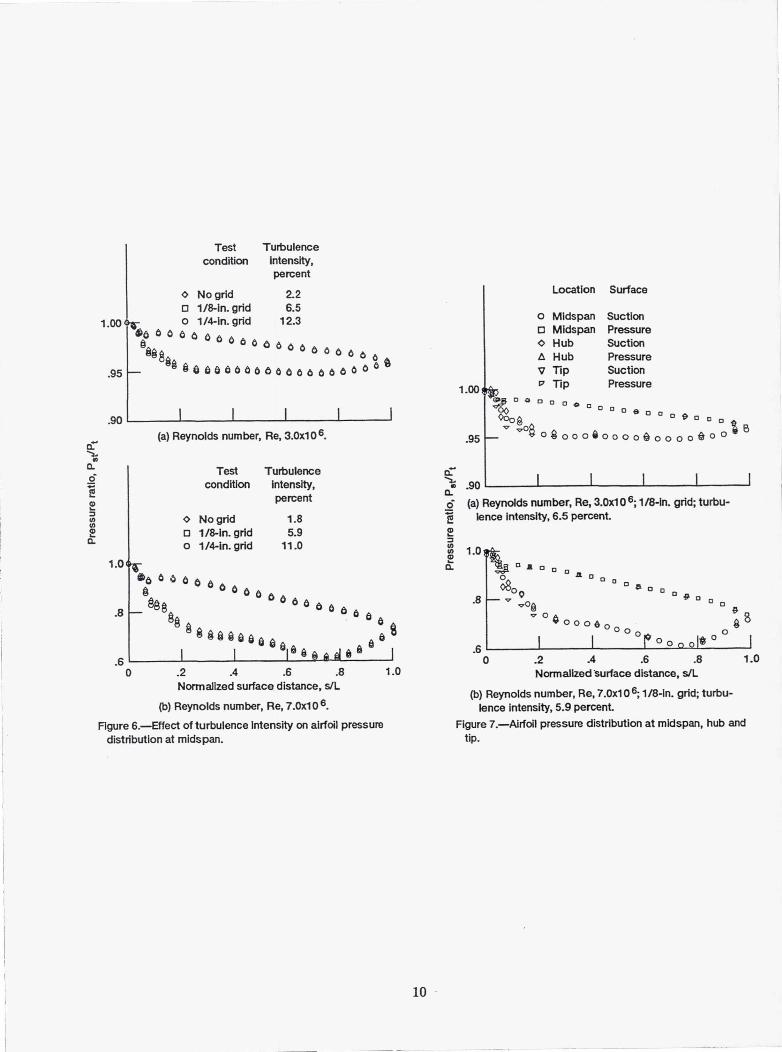
Figures 6(a) and (b) show the effect of turbulenceintensity on the airfoil pressure distribution at midspanat Reynolds numbers of 3.0 and 7.0x10 6 , respectively.The turbulence levels varied from 12.3 to 1.8 percentdepending on the Reynolds numbers and the turbulencegrids used in these tests. The figures indicated that tur-bulence intensity has little or no effect on the airfoilpressure distribution. The turbulence intensity effects atother Reynolds numbers are also negligible. Similar plotsfor the airfoil hub and tip regions of the present experi-ment also show little or no turbulence intensity depen-dency on pressure distribution. These findings are ingeneral agreement with Dring et al., s who reported onthe aerodynamic and heat transfer characteristics of alarge-scale rotating turbine model. They found that themidspan pressure distributions were essentially unaf-fected by the turbulence generating grid.
Figure 7(a) compares the airfoil pressure distribu-tion at the hub, midspan, and tip for a Reynolds num-ber of 3.0x10⁶ and a turbulence intensity of 6.5 percent(1/8-in. grid). The figures show that, except near the
suction surface leading edge, there is no variation in thespanwise pressure distribution. This is an indication thatthe flow on the airfoil is mostly two-dimensional. Simi-lar results are noted in Fig. 7(b) for a Reynolds numberof 7.0x10 6 and a turbulence intensity of 5.9 percent.
For the 1/8-in. grid case, Figs. 8(a) to (c) comparethe pressure distribution between the airfoil and the con-toured sidewall at midspan for Reynolds numbers of 3.0,5.0, and 7.Ox 106 . The agreement between the airfoil andthe contoured sidewall is good on the pressure surfacefor all the Reynolds numbers shown. For the suctionsurface, the agreement is also good for about 50 percentof the airfoil. From about 50 percent of the chord to thetrailing edge, there is deviation between the airfoil andsidewall pressure distribution. The deviation increasesprogressively with Reynolds number. The deviation isespecially obvious at a Reynolds number of 7.0x10 6 . Itis speculated here that the reason for the deviation atthe suction surface near the trailing edge is that thefacility is not a true cascade. In a true cascade, theairfoil suction surface would be uncovered downstreamof the throat. In this facility the continuation of thecontoured sidewall pressure surface that forms the cas-cade wall would cause the air to continue to acceleratedownstream of the throat, thereby causing the pressureto decrease. This effect is seen at all Reynolds numbers;however, it was especially pronounced at Re = 7.0x 10⁶.
Heat Transfer
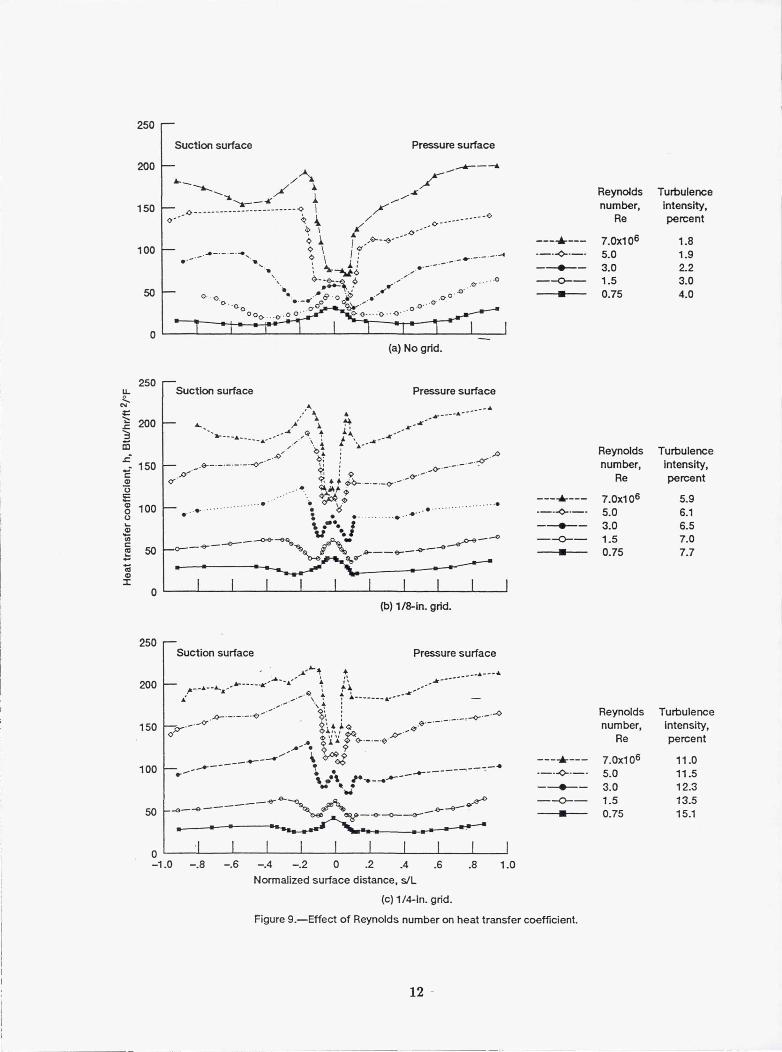
In Fig. 9(a) the heat transfer coefficient is plottedagainst the normalized surface distance s/L for Reynoldsnumbers of 0.75, 1.5, 3.0, 5.0, and 7.0x10⁶ for the cleartunnel (no grid) case. As seen in the figure, heat transferincreases with Reynolds number, as expected. On thepressure surface, the transition (as evidenced by thesharp rise in the heat transfer coefficient) appears tooccur near an s/L of 0.09, which is near the point oftangency of the leading edge circle. Examination of theliquid crystal photographs reveals the presence of a weakseparation at this point. The pressure distribution con-tour also indicates a small adverse gradient near thisregion. It is speculated that flow separation at this pointtriggers the transition for the three highest Reynoldsnumbers; this is the reason why the transition point doesnot change with increasing Reynolds number. After theinitial rise due to transition, the heat transfer coefficientcontinues to increase at a reduced rate; this is caused bythe flow acceleration on the pressure surface.
On the suction surface, the location of the transi-tion moves upstream with increasing Reynolds numbers,indicating that no flow separation is present. This issupported by the fact that the pressure distribution onthe suction surface does not show any adverse pressure
4

gradient and that the liquid crystal photographs do notshow evidence of flow separation.
Near the suction surface trailing edge, the heattransfer coefficient for a Reynolds number of 7.0x10⁶shows an increasing trend, which is incompatible withthe diffusion in this region shown in Fig. 8(c). Thereason for this anomaly is not known at this time.
Figures 9 (b) and (c) present the heat transfercoefficients for the moderate and high turbulence cases(1/8- and 1/4-in. grids). On the pressure surface, theseparation at s/L = 0.09 is still present and can be seenas a small dip in the heat transfer coefficient at the twolowest Reynolds numbers. As the Reynolds number isincreased, the transition moves upstream from thispoint. For the two highest Reynolds numbers, there isan abnormal drop in the heat transfer coefficient at theend of the transition region that corresponds to theseparation point. This drop was also observed byHippensteele, Russell, and Torres.4
In comparison with Fig. 9(a) for the clear tunnelcase, heat transfer for the suction surface and at theleading edge region is higher because of the higher tur-bulence intensity resulting from the 1/8- and 1/4-in.grids used. Also, transition from laminar to turbulentflow occurs sooner and over shorter distances. For thesame reason, heat transfer for both the pressure andsuction surfaces is also higher than that for the cleartunnel case. These trends were also noted by Dringet al.s
At the leading edge, where the flow is laminar,heat transfer varies as Re0 * 5 . A Frossling number (Nud/(Red,in1et) 0 5) plot is useful: Frossling numbers forsimilar turbulence levels should fall on the same curve.Figure 10(a) is a plot of the Frossling numbers at theleading edge region for the clear tunnel case. The figureshows that, with some exceptions, the Frossling numbersin the leading edge region do generally fall on a singlecurve. The reason why some Frossling numbers arelower is not known at this time. Figure 10(a) also showsthat there is a sharp increase in heat transfer in thistransition regime, especially for the higher Reynoldsnumbers. Aft of the leading edge region, heat transferdeparts from laminar behavior and will no longer varyas the square root of the Reynolds number.
Figure 10(b) shows Frossling numbers with moder-ate turbulence intensity (1/8-in. grid) upstream of thevane. Frossling numbers for the leading edge regionagain generally fall on a single curve. Because the stag-nation region heat transfer is augmented by higher free-stream turbulence intensity, the level of this curve ishigher than that for the lower turbulence case ofFig. 10(a). Figure 10(b) also shows that transition from
laminar to turbulent flow also occurs sooner, especiallyfor those at higher Reynolds numbers. Figure 10(c)shows Frossling numbers for high turbulence intensity(1/4-in. grid) upstream of the vane. The characteristicsare similar to those of Fig. 10(b).
It would be reasonable to raise the question that,if laminar heat transfer at the leading edge with similarturbulence intensity levels can be normalized by theFrossling number, is it possible, for similar turbulenceintensities, to normalize the turbulent heat transfer forthe remaining airfoil surfaces? One possible approachwould be to use the Nusselt number (based on the dis-tance from the stagnation point) divided by theReynolds number (based on the axial chord and exitconditions) raised to the 0.8 power (Nue/(Rec,e.it)0 *8)•Such an attempt was made using data from the 1/8-in.grid (see Fig. 11). In this figure, heat transfer values atthe leading edge should be disregarded because theplotting parameter is not valid for the leading edge area.For the remaining airfoil surfaces, the figure shows adata spread of approximately f6 percent on both thesuction and pressure surface trailing edges. The dataspread is larger near the transition region becausetransition occurs at different locations and over differenttransition lengths at different Reynolds numbers.
From the foregoing discussions, it may be con-cluded that, for similar turbulence intensities, heattransfer for high Reynolds numbers at the leading edgecan be correlated by using the Frossling equation devel-oped for lower Reynolds numbers. For the rest of theairfoil, heat transfer for similar turbulence intensitiesmay be approximately correlated by using the parameterNue/(Rec,exit)
0 8
Figure 12(a) compares the effect of turbulence in-tensity at Re numbers of 0.75 x 10⁶ for the clear tunnel,1/8- and 1/4-in. grid cases, respectively. The increase instagnation region heat transfer from the clear tunnel tothe 1/8-in. grid (higher levels of turbulence) case is veryevident. However, there seemed to be no difference be-tween the 1/8- and 1/4-in. grid cases at the leading edgeregion. The fact that the heat transfer coefficient for the1/8- and the 1/4-in. grid cases falls on the same curve issomewhat unexpected, considering the 1/8-in. grid pro-duces a turbulence level of about 6 percent and the1/4-in. grid about 11 percent. The reason for this resultis not known, but it could possibly be attributed to thelarger turbulent length scale for the 1/4-in. grid. Theheat transfer coefficient in the stagnation region is pro-portional to the turbulence intensity, and it has beenshown to be inversely proportional to the ratio of thelength scale to the leading edge diameter (G. JamesVanFossen and Chan Y. Ching, "Measurement of theInfluence of Turbulence Integral Length Scales on Stag-nation Region Heat Transfer," to be published in 1993,
5

NASA Lewis Research Center, Cleveland, Ohio). Thefigure also shows that higher turbulence levels movetransition further upstream.
Figure 12(b) compares the effect of turbulenceintensity at Re = 7.0x10⁶ . At this high Reynolds num-ber, the transition point has moved upstream almost tothe stagnation point. The heat transfer coefficients forthe 1/8-in. grid are still higher than those for the cleartunnel (no grid), but the heat transfer coefficients forthe 1/8- and the 1/4-in. grid cases are no longer coinci-dent in the stagnation region; the 1/4-in. grid has thehighest heat transfer coefficients there.
In Fig. 13 the Frossling number at the stagnationpoint is plotted against a parameter developed byV&nFossen and Ching. This parameter involves turbu-lence intensity, Reynolds number, and integral lengthscale. The solid curve is their correlation and the dashedcurve is a ±8-percent error band. Length scales for thepresent data were estimated from VanFossen andChing's curve fit of the length scale versus the distance;they used 1/2-, 1/4-, 1/8-, and 1/16-in. grids which hadthe same ratio of bar width to mesh spacing as that ofthe present test. For the data with clear tunnels (nogrid), the length scale was set to the width of the testsection, 8.5 in. Agreement with the correlation is reason-able especially at the high Reynolds numbers for the twoturbulence grids. Agreement for the clear tunnel case isnot quite as good but is still reasonable considering thegreater uncertainty in the length scale used.
Figure 14 compares the pressure distributions ofthe airfoil and the contoured sidewall at Re = 7.0x10⁶with the computed pressure distribution fromTRAFC2D superimposed. The predicted values agreewell with the contoured sidewall experimental data, ex-cept that near the suction surface leading edge area. Thesmall disagreement on the suction surface leading edgearea is probably caused by the three-dimensional effect.Because the code used was a two-dimensional version, itwas not able to follow the three-dimensional pressuredistribution. The agreement is good for the rest of thesidewall surface. Agreement is generally good with theexperimental pressure distribution on the airfoil, exceptin certain areas: near the suction surface leading edge,there is again the possible three-dimensional flow fieldeffect, as just discussed; near the suction surface trailingedge area, the airfoil pressure was decreased because ofthe presence of the contoured sidewall (see the earlierdiscussion in the Pressure Distribution section).
A comparison of the predicted and experimentalheat transfer coefficients is presented in Fig. 15 forReynolds numbers of 1.5, 3.0, and 7.0x10⁶ for the cleartunnel case. The predictive tool used was again
TRAFC2D. As can be seen from the figure, the heattransfer coefficients on the suction surface are relativelywell predicted. On the pressure surface, the heat transfercoefficients are underpredicted for all the Reynolds num-bers. The predicted heat transfer values show encourag-ing results; however, it is evident that additional workon the predictive techniques is required.
Uncertainty Analysis
An uncertainty analysis, based on the work ofAbernathy and Benedict ? showed that the uncertaintyis a function of Reynolds numbers. For all Reynoldsnumbers and all turbulence levels tested in this facility,a conservative estimate of the uncertainty of the heattransfer coefficients is approximately 6 percent, with theexception of two cases (Re = 3.0 and 5.0 x 10⁶ , for theclear tunnel). The uncertainty of the heat transfer coef-ficients for these two worst cases is 11 and 8.7 percent,respectively. The high uncertainty level of these twocases is attributed to the extremely warm air tempera-ture in these tests (91 °F), resulting in a temperaturedifference of only 10 °F between the air and the liquidcrystal.
Conclusions
Aerodynamic and heat transfer data were presentedfor Reynolds numbers ranging from 0.75 to 7.0x 10⁶ andturbulence intensities ranging from 1.8 to 15.1 percent.The range of Reynolds numbers encompassed those en-countered in current aeropropulsion turbines and in theSpace Shuttle main engine (SSME) turbopump turbines.
From the pressure distribution plots presented, itcan be concluded that
1. The flow in the cascade was nonperiodic at theairfoil suction surface near the trailing edge. Thisnonperiodicity was evident in all Reynolds numbersalthough it was not very pronounced except at Re= 7.0x10⁶
2. The flow over the airfoil was primarily two-dimensional.
3. The turbulence intensity had a minimal effect onthe pressure distribution, as expected.
4. A numerical solution using the TRAFC2D codefor pressure distribution agreed well with the contouredsidewall data.
With respect to heat transfer, the results of thisstudy indicated that
6

1. Reynolds number had a large effect on heat tion Turbulence Closures," AIAA Paper 92-3067,
transfer and on the transition from laminar to turbulent
1992.flow.
3. For a given turbulence intensity level, heattransfer at the leading edge for all Reynolds numberscan be correlated with the Frossling number developed 4.for lower Reynolds numbers.
2. For the high Reynolds numbers typical of theSpace Shuttle main engine turbopump, heat transfer wasdominated by transitional and turbulent flow down-stream of the stagnation region.
4. For a given turbulence intensity, heat transferon the airfoil downstream of the leading edge can beapproximately correlated by using a dimensionlessparameter (Nusselt number, based on the distance fromthe stagnation point, divided by the Reynolds number,based on the axial chord and exit conditions, raised tothe 0.8 power) to within f6 percent at the trailing edge.'
5. A comparison of the experimental heat transferdata with the numerical solution of the TRAFC2D codeshowed encouraging results.
References
1. Schobeiri, T., McFarland, E.R., and Yeh, F.C.,"Aerodynamic and Heat Transfer Investigations ona High Reynolds Number Turbine Cascade,"ASME Paper 91—GT-157. (Also, NASATM-103260, 1991.)
2. Ameri, A.A., and Arnone, A., "Navier-Stokes Tur-bine Heat Transfer Predictions Using Two Equa-
3 Hippensteele, S.A., Russell, L.M., and Stepka,F.S., "Evaluation of a Method for Heat TransferMeasurements and Thermal Visualization Using aComposite of a Heater Element and Liquid Crys-tals," Journal of Heat Transfer, Vol. 105, No. 1,Feb. 1983, pp. 184-189. (Also, NASA TM-81639,1981.)
Hippensteele, S.A., Russell, L.M., and Torres, F.J.,"Use of a Liquid-Crystal, Heater Element Compos-ite for Quantitative, High Resolution Heat Trans-fer Coefficients on a Turbine Airfoil, IncludingTurbulence and Surface Roughness Effects,"Pressure Temperature Measurements, edited byJ.H. Kim and R.J. Moffat, ASME, New York,1987, pp. 105-120. (Also, NASA TM-87355, 1987.)
5. Baines, W.D., and Peterson, E.G.,"An Investiga-tion of Flow Through Screens," Transactions of theASME, Vol. 72, July 1951, pp. 468-480.
6. Dring, R.P., Blair, M.F., Joslyn, H.D.,Power, G.D., and Verdon, J.M., "The Effects ofInlet Turbulence and Rotor/Stator Interactions onthe Aerodynamics and Heat Transfer of a Large-Scale Rotating Turbine Model," Vol. 1, NASACR-4079, May 1986.
7. Abernathy, R.B., and Benedict, R.P., Measure-ment Uncertainty: A Standard Methodology, ISA,Research Triangle Park, NC, 1984.
7
(4-5 pm)
ig)
Figure 2.—Test section.
C-88-11421
Figure 3 —Pressure distribution airfoil showing pressure taplocations on suction surface_
Figure 1.—Variable Reynolds Number Heat Transfer Facility.
8
C-92-07003
Figure 4.—Heat transfer airfoil showing grid markings for thek>cations of temperature distribution.
16
t-12
NCm CC
m © 8
c a
m4
0 2 3 4 5
Reynolds number, Re
Testcondition
1/4-In. grid
1/8-in. grid
No grid
1 I
6 7x10⁶
Figure 5.—Turbulence intensity as function of Reynolds numberfor three test conditions.
9
a
a0
d
N0a`
Test Turbulencecondition intensity,
percent
O No grid 2.2 Location Surface
q 1/8-in. grid 6.50 1/4-In. grid 12.3 o Midspan Suction
6 6 0 6 6 q Midspan Pressure
6 0 6 0 0 O Hub Suctioni 0 a 0 a 0 8 p 0 0 A Hub PressureX46 ® 8 880000006 06 00 6 0 8 0 v Tip Suction
1.00
Tip Pressure
II I I I ^ ° q °°9°° q s qqqQBvOi3°
(a) Reynolds number, Re, 3.0x10⁶. .95 0 0 0 0 6 0 0 0 0 0 0 0 0 0 0
00 0g9a
@
006660a6666666e.8
666
.61®66
0 .2 .4 .6 .8 1.0
Normalized surface distance, s/L
(b) Reynolds number, Re, 7.0x10 6.
Figure 6.-Effect of turbulence Intensity on airfoil pressuredistribution at midspan.
1.00
.95
90
Test Turbulencecondition intensity,
percent
O No grid 1.8q 1/8-in. grid 5.90 1/4-in. grid 11.0
1.0
90 1 I I I f IaCT (a) Reynolds number, Re, 3.0x10 6 ;1/8-In. grid; turbu-
lence Intensity, 6.5 percent.m
N 1.0m
0 a ° ° °°
.8 08o°a0 ° °$ q °
oo® q $o^ 0O0600p0 gg
0
6`
0 .2 .4 .6 .8 1.0
Normalized surface distance, s/L
(b) Reynolds number, Re, 7.0x10 6;1/8-in. grid; turbu-lence intensity, 5.9 percent.
Figure 7.-Airfoil pressure distribution at midspan, hub andtip.
10

Location Surface
o Airfoil Suctionq Airfoil Pressure
o Contoured sidewall Suctionn Contoured sidewall Pressure
1.00'su-
r966°°° a a ° a a a a a°° g o
.9 5 60000000600A688888P®o®
90 , 1 1 1 1
(a) Reynolds number, Re, 3.0x10 6 ; turbulence Intensity,6.5 percent.
o~ 1.0
2®AO 9 9 ° ° c ° ° ° ° ° a6 8 $ a a
.9 oo$ aOe 80 ^®®000000®® 8888000 0 88
to®
y 1 1 I I I
0- .8
(b) Reynolds number, Re, 5,0x10 6; turbulence intensity6.1 percent_
1.0®O e e e a °
a®On ° a g g $
.8^®
as a
0000®®88000000p40
.60 0 0 0 0 0 0
0 .2 .4 .6 .8 1.0
Normalized surface distance, s/L
(c) Reynolds number, Re, 7.0x10 6; turbulence intensity,5.9 percent.
Figure 8.—Comparislon of airfoil and contoured sidewallpressure distribution at midspan for 1/8-In. grid.
11
250
Suction surface Pressure surface
200 ,+---•
r Reynolds Turbulence150
Y^1-xo ^^/------------------ number, intensity,
0 ------Q 0o---_ Re percent
tv
7.0X10⁶ 1.8100 - ^- -- ^` 0 1t 5.0 1.9^.-
`^ 4a •-" --^-- 3.0 2.2b d r.-'
ro-^Q.....o --0-- 1.5 3.0
So 0 0 '. f a o ,b , 1 0 0 . -- ^- o.7s a.oO.. a •-f C0 0
o -0..-a000._o.00. o-a....o..a_
0(a) No grid.
250u Suction surface Pressure surfaceN
200 AA4 r'r_\L
.ai Reynolds Turbulence150 -.0-- - - ----- - -"-04 -0. number, intensity,
Re percent
m ------ 7.0x10 6 5.9100 ^............_. ............. .
•d ^.............. - -0 - 5.0 6.13.0 6-5
^- o^ useu :. o e-'" --^- 1.5 7-05 o--^- ^^ - e^a -- e - e n 0.75 7.7mm2
0(b) 1/8-in. grid.
250Suction surface Pressure surface
200
Reynolds Turbulence150 A-' ^ a a number, intensity,
0 0- ", ri .o - --e Re percent
"Op ------ 7.0x10 6 11.0100 ^,,,.--
_ ---. _.-^------- -•-o---- 5.0 11.5.0 % Ju ---- 3.0 12-3
___ -a Q yo O - 4-- 1.5 13.5so °-^- J^e- -o- o-^^^ n 0.75 15.1
0-1.0 -.8 -.6 -.4 -.2 0 .2 .4 .6 .8 1.0
Normalized surface distance, s/L
(c) 1/4-in. grid.
Figure 9.-Effect of Reynolds number on heat transfer coefficient.
12

Reynolds Turbulencenumber, Intensity,
Re percent
- 0 0.75x10⁶ 15.1-•-•--• 1.5 13.5
- o - 3.0 12.3------ 5.0 11.5
2.0
1.6
1.2
110
8 01
.4
Suction surface Pressure surface
0 -(a) No grid.
1.s
2.0b ^
i' 0
•• $b
'b 1.2 0* o .•
Z
E 8Eccy .4N
I? Suction surfaceLL
0
Reynolds Turbulencenumber, Intensity,
Re percent
-- 0 0.75x10⁶ 4.0.......♦ ------• 1.5 3.0- o- - 3.0 2.2------ 5.0 1.9--^- 7.0 1.8
Reynolds Turbulencenumber, Intensity,
Re percent
i} 0.75x10⁶ 7.7-------♦------- 1.5 7.0- o- - 3.0 6.5------ 5.0 6.1--a - 7.0 5.9
0
mcc
Pressure surface
(b) 1/8-in. grid.
2.0 .b 41A
1.6 b Q 0- 1Jis
q c3 - 0 -
^ p1-2
.8
.4 7.0 11.0Suction surface Pressure surface
0-.4 -.2 0 .2 .4
Normalized surface distance, s/L
(c)1/4-in. grid.
Figure 10 -Frossling correlation of variable Reynolds number heat transfer data at leading edge.
13

Reynoldsnumber,
Re
-^ -- 0.75x10⁶•------ ------• 1.5- - 3.0
50x103 -'-^ "- 5.0--o- - 7.0
0 40 Itxm 30
20
Z
10 Suction surface Pressure surface
0-1.0 -.8 -.6 -.4 -.2 0 .2 .4 .6 .8 1.0
Normalized surface distance, s/L
Figure 11.--Correlation of variable Reynolds number heat transfer data for 1/8-in. grid case.
50
Suction surface Pressure surface
40 0b0 0 0
0 0 0 Test Turbulencecondition intensity,
30n
' no m 20' 0 0.^ i q o
o' n °0 percent
V\ o S En n n nq
o qn q No grid 4.6
N o 0 00q
O 118-In. grid 7.70 n 1/4-in. grid 15.1
L
q= 10
(a) Reynolds number, Re, 0.75x10⁶.mU
°0 250 a.n 0 ^n
0' q0 0 0
o n130
N200
q ° q 0 CO
q q 0.0 is 00 q' q
a e n o nq
Test Turbulenceo 0 0condition intensity,
150
° q
O.M. percent
0IPI ° q No grid 1.8q m0 q®0 O 1/8-In. grid 5.9
100 n 1/4-in- grid 11.0q q
Suction surface q 9b^ Pressure surface
50
-1.0 -.8 -.6 -.4 -.2 0 .2 .4 .6 .8 1.0
Normalized surface distance, s/L
(b) Reynolds number, Re, 7.0x10⁶.
Figure 12.-Effect of turbulence intensity on heat transfer coefficient.
14

2.1
Fr(0) = A(fuRe0.812 (Ax/d)-0576 ) 0.5 + C
r A = 0.00732ILL 1.9 C = 0.945c0 O
g 1.7 ^.
c orn ^.'
H 1.5i Test
condition
E 1.3A No grid0 1/8-in. grid
1.1 O 1/4-in. grido Van Fossen/Ching fit
U ----- ±8-percent error band
.90 7 000 14 000
Tune0.81 2(AX/d) -0576
Figure 13.-Heat transfer at stagnation point.
Pressure
distribution
0 Airfoilq Contoured sidewall
Calculated
0 1.0'
Za
o .8
om 6 0 0 0 0 0 0 0N
a .4
0 .2 .4 .6 .8 1.0
Normalized surface distance, s/L
Figure 14.-Comparison of computed and experimentalpressure distributions of airfoil and contoured sidewall atReynolds number of 7.0x10⁶.
Reynoldsnumber,
Re
O 1.5x10⁶ 1
q 3.0 1l Experiment300 O 7.0
1.5x10⁶ 1LL ----- 3.0 r ComputedN -- 7.0 JF ° O
OOO °
co 200__ O-^_^ Q~^ JI O O °
L ^^
mI^ l o o
100
q qm q ------- -- 1 El
------
q l d ^^ q
0 00
Suction00000
0 O O Pressure0-1.0 -.5 0 .5 1.0
Normalized surface distance, s/LFigure 15.--Comparison of computed and experimental airfoil heat transfer coefficients for clear
tunnel (no grid) condition.
15

Form ApprovedREPORT DOCUMENTATION PAGE OMB No. 0704-0188
Public reporting burden for this collection of information is estimated to average 1 hour per response, including the time for reviewing instructions, searching existing data sources,gathering and maintaining the data needed, and completing and reviewing the collection of information. Send comments regarding this burden estimate or any other aspect of thiscollection of information, including suggestions for reducing this burden, to Washington Headquarters Services. Directorate for Information Operations and Reports, 1215 JeffersonDavis Highway, Suite 1204, Arlington. VA 22202-4302, and to the Office of Management and Budget, Paperwork Reduction Project (0704-0188), Washington, DC 20503.
1_ AGENCY USE ONLY (Leave blank) 2. REPORT DATE 3. REPORT TYPE AND DATES COVERED
June 1993 Technical Memorandum4. TITLE AND SUBTITLE 5. FUNDING NUMBERS
High Reynolds Number and Turbulence Effects on Aerodynamics and HeatTransfer in a Turbine Cascade
WU-505-62-526. AUTHOR(S)
Frederick C. Yeh, Steven A. Hippensteele, G. James Van Fossen,Philip E. Poinsatte, and Ali Ameri
7. PERFORMING ORGANIZATION NAME(S) AND ADDRESS(ES) 8. PERFORMING ORGANIZATIONREPORT NUMBER
National Aeronautics and Space AdministrationLewis Research Center E-7791Cleveland, Ohio 44135-3191
9_ SPONSORINGIMONITORING AGENCY NAME(S) AND ADDRESS(ES) 10. SPONSORING/MONITORINGAGENCY REPORT NUMBER
National Aeronautics and Space Administration NASA TM— 106187Washington, D.C. 20546-0001 AIAA-93-2252
11. SUPPLEMENTARY NOTESPrepared for the 29th Joint Propulsion Conference and Exhibit cosponsored by the AIAA, SAE, ASME, and ASEE, Monterey, California, June 28-30,1993. Frederick C. Yeh, Steven A. Hippensteele, G. James Van Fossen, and Philip E. Poinsatte, NASA Lewis Research Center. Ali Ameri, NASA
Research Associate, University of Kansas, Center for Research, Inc., Lawrence, Kansas 66044. Responsible person, Frederick C. Yeh, (216) 433-5872.
12a. DISTRIBUTIONIAVAILABILITY STATEMENT 12b. DISTRIBUTION CODE
Unclassified - UnlimitedSubject Category 34
13_ ABSTRACT (Maximum 200 words)
Experimental data on pressure distribution and heat transfer on a turbine airfoil were obtained over a range of Reynoldsnumbers from 0.75 to 7.5 X 10⁶ and a range of turbulence intensities from 1.8 to about 15 percent. The purpose of thisstudy was to obtain fundamental heat transfer and pressure distribution data over a wide range of high Reynoldsnumbers and to extend the heat transfer data base to include the range of Reynolds numbers encountered in the SpaceShuttle main engine (SSME) turbopump turbines. Specifically, the study aimed to determine (1) the effect of Reynoldsnumber on heat transfer, (2) the effect of upstream turbulence on heat transfer and pressure distribution, and (3) therelationship between heat transfer at high Reynolds numbers and the current data base. The results of this studyindicated that Reynolds number and turbulence intensity have a large effect on both the transition from laminar toturbulent flow and the resulting heat transfer. For a given turbulence intensity, heat transfer for all Reynolds numbersat the leading edge can be correlated with the Frossling number developed for lower Reynolds numbers. For a giventurbulence intensity, heat transfer for the airfoil surfaces downstream of the leading edge can be approximatelycorrelated with a dimensionless parameter. Comparison of the experimental results were also made with a numericalsolution from a two-dimensional Navier-Stokes code.
14. SUBJECT TERMS 15. NUMBER OF PAGES17
Heat transfer; Pressure distribution; High Reynolds number 16. PRICE CODEA03
17_ SECURITY CLASSIFICATION 18. SECURITY CLASSIFICATION 19. SECURITY CLASSIFICATION 20. LIMITATION OF ABSTRACTOF REPORT OF THIS PAGE OF ABSTRACT
Unclassified Unclassified Unclassified
NSN 7540-01-280-5500 Standard Form 298 (Rev. 2-89)
Prescribed by ANSI Std. Z39-18298-102

National Aeronautics andSpace Administration
Lewis Research CenterCleveland, Ohio 44135
ofMclal &"naqPana" to PrNet Use 93N
FOURTH CLASS MAIL
ADDRESS CORRECTION REQUESTED
0,