Embed Size (px)
Citation preview

Under consideration for publication in J. Fluid Mech. 1
Turbulence statistics in Couette flowat high Reynolds number
SERGIO PIROZZOLI, MATTEO BERNARDINIand PAOLO ORLANDI
Dipartimento di Ingegneria Meccanica e Aerospaziale, Universita di Roma ‘La Sapienza’Via Eudossiana 18, 00184 Roma, Italy
(Received 8 September 2014)
We investigate the behavior of the canonical turbulent Couette flow at computationallyhigh Reynolds number through a series of large-scale direct numerical simulations (DNS).We achieve a Reynolds number Reτ = h/δv ≈ 1000, where h is the channel half-height,and δv is the viscous length scale) at which some phenomena representative of the asymp-totic Reynolds number regime manifest themselves. While a logarithmic mean velocityprofile is found to provide a reasonable fit of the data, including the skin friction, closerscrutiny shows that deviations from the log law are systematic, and probably increasingat the higher Reynolds numbers.
The Reynolds stress distribution shows the formation of a secondary outer peak inthe streamwise velocity variance, which is associated with significant excess of turbulentproduction as compared to the local dissipation. This excess is related to the forma-tion of large-scale streaks/rollers, which are responsible for a substantial fraction of theturbulent shear stress in the channel core, and for significant increase of the turbulenceintermittency in the near-wall region.
1. Introduction
Turbulent Couette flow, which is physically realized by differential motion of two par-allel infinite flat plates, is probably the most prototypical among canonical wall-boundedflows, being homogeneous in two space directions, and having no imposed mean pressuregradient. Hence, it is the only flow to experience exactly constant total stress across thethickness, which is one of the hypothesis requested by Prandtl’s classical arguments forthe existence of a logarithmic layer. Because of its (apparent) simplicity, Couette flow isfrequently taken as an illustrative example for the structure of turbulent wall-boundedflows in classical books (Schlichting & Gersten 2000), and it has been the subject ofseveral theoretical investigations, aimed at clarifying the mechanisms responsible for theself-sustainment of near-wall turbulence (Hamilton et al. 1995; Waleffe 1997), and forthe onset of outer-layer energy-containing modes (Hwang & Cossu 2010). Also, becauseof the establishment of strong large-scale outer-scaled motions, Couette flow is an idealtestbed for probing inner-outer wall turbulence interaction phenomena of imprinting andmodulation (Pirozzoli et al. 2011).Despite its apparent simplicity, Couette flow poses significant challenges to experi-
mental investigations, typically carried out by means of moving belts which are proneto deform, especially at high speed. As a consequence, pure Couette flow has receivedmuch less attention as compared to, e.g. Poiseuille pressure flow in channels and pipes.Relevant early studies include those of Reichardt (1956); Robertson (1959); El Telbany

2 S. Pirozzoli, M. Bernardini, P. Orlandi
& Reynolds (1982); Aydin & Leutheusser (1991); Tillmark & Alfredsson (1992), whichare all limited to Rec . 20000, where Rec = uch/ν is the Reynolds number based onthe half velocity difference between the two walls (uc), and the channel half-height (h).Experiments have allowed to clarify some peculiar features of Couette flow, namely theonset of large-scale motions in the form of rolls/streaks pairs, which occupy the wholechannel, and whose typical streamwise and spanwise wavelengths are λx = 40 − 65h,λz = 4 − 5h, respectively (Tillmark & Alfredsson 1998; Kitoh et al. 2005). However,as also apparent in recent studies (Kitoh & Umeki 2008), there is very little consensusamong different experimental set-ups, even for global quantities such as skin friction.Over the years, the origin of the formation and sustainment of the h-scaled rolls hasbeen traced to mechanisms of nonlinear feedback caused by streaks instability (Hamiltonet al. 1995), or to transient growth phenomena (Hwang & Cossu 2010).Given the difficulties encountered by experiments, DNS constitutes an invaluable tool
for the study of turbulence in Couette flow. Indeed, early numerical experiments (Lee& Kim 1991; Bech et al. 1995) confirmed the existence of large-scale structures whichqualitatively resemble those observed in experiments. However, it soon became clear thatthe size and the persistence of those large eddies poses stringent demand to DNS in termsof the size of the computational box, which shall be large enough to contain at least arepresentative ensemble of them. Detailed studies in this respect (Komminaho et al.
1996; Tsukahara et al. 2006) have shown that, in order to alleviate spurious effects offlow confinement, boxes with size Lx ≈ 60h, Lz ≈ 16h are needed. Since the size of the h-scaled eddies is not expected to depend significantly on the Reynolds number (the effectof viscosity being mainly concentrated in the thin near-wall sublayer), and since the meshresolution for DNS should stay constant in wall units, it follows that the total numberof grid points should roughly grow as Re3τ , a more accurate estimate being Re11/4τ (Pope2000). It is then clear that huge computational resources are required even at moderateReynolds numbers. For this reason, the upper limit of Reynolds number achieved so farin DNS is Rec ≈ 3000 (Lee & Kim 1991), corresponding to friction Reynolds numberReτ ≈ 170 (here Reτ = huτ/ν, where uτ =
√
τw/ρ is the friction velocity), althoughin rather narrow computational box, having length 4πh and width 8/3πh. Therefore, inthis respect it is more relevant to cite the study of Tsukahara et al. (2006), in whichReτ ≈ 130 was achieved in large computational boxes. Results of Couette flow at Reτup to 550 in wide boxes have recently been presented by Avsarkisov et al. (2014).
The main goal of this paper is to widen the Reynolds number envelope for turbulentCouette flow, thus analysing physical phenomena not accessible so far. A special effortwill be made to clarify the reasons for the observed deviations from a ‘canonical’ behavior,and to highlight the contribution of the large-scale motions to the overall dynamics.
2. Computational setup
We solve the Navier-Stokes equations for a divergence-free velocity field, which are dis-cretized in an orthogonal coordinate system (x, y, z denote the streamwise, wall-normaland spanwise directions) using staggered central second-order finite-difference approx-imations, so as to guarantee that kinetic energy is globally conserved in the limit ofinviscid flow. Time advancement is carried out by means of a hybrid third-order low-storage Runge-Kutta algorithm, coupled with the second-order Crank-Nicolson scheme,combined in the fractional-step procedure, whereby the convective and the diffusive termsare treated explicitly and implicitly, respectively. The Poisson equation for the pressurefield, stemming from the incompressibility condition, is efficiently solved through Fourier

3
Flow case Line style Rec Reτ Nx Ny Nz ∆x+ ∆z+ Tuτ/h
C1 Dashed 3000 171 1280 256 896 7.55 4.80 113.9C2 Dash-dot 4800 260 2048 256 1280 7.18 5.10 72.2C3 Dash-dot-dot 10133 507 4096 384 2560 7.00 4.99 74.9C4 Solid 21333 986 8192 512 5120 6.80 4.84 54.1
Table 1: List of parameters for turbulent Couette flow cases. Rec = huc/ν is the bulkReynolds number, and Reτ = huτ/ν is the friction Reynolds number, with uc the center-line velocity. Nx, Ny, Nz are the number of grid points in the streamwise, wall-normal,and spanwise directions. ∆x+, ∆z+ are the grid spacings in the wall-parallel direction,in wall units. The time window used for collecting the flow statistics T is given in termsof eddy turnover times h/uτ .
transform-based methods (Kim & Moin 1985). A full description of the numerical methodis provided in Orlandi (2000).
For the sake of convenience (Bernardini et al. 2013) the computations are carried outin a reference frame in which the bulk velocity is zero, hence the lower wall moves ata speed −uc, and the upper wall with a speed +uc. The DNS have been carried out ina (Lx × Ly × Lz) = (18πh × 2h × 8πh) computational box, which based on previousexperiences (Komminaho et al. 1996; Tsukahara et al. 2006) at much lower Reynoldsnumber is expected to be sufficient to prevent spurious dynamics from developing. Here-inafter, the nondimensional wall-normal coordinate η will be used, in such a way thatη = 0 corresponds to the channel centerline, and η = ±1 corresponds to the two walls,whereas the distance from the nearest wall will be denoted with y. The mesh spacing inthe wall-parallel directions has been kept approximately the same in wall units for all thesimulations, accounting for grid refinement tests carried out in previous studies (Bernar-dini et al. 2014). An error-function mapping (η(ξ) = erf(αξ/2)/erf(α/2), ξ = [−1; 1],with α = 4) has been used to cluster points in the wall-normal direction, in such a waythat the first point off the wall is at ∆y+w 6 0.08. Details on the computational mesh andon the flow parameters for the DNS are provided in table 1.
The simulations have been initiated with a linear velocity profile, with superposedrandom disturbances. After the initial transient, spatial averages of the flow fields inwall-parallel planes are collected at time intervals of ∆t ≈ h/uc. The time window usedfor the averaging procedure (see table 1) was selected by monitoring the running averagesof the velocity variances at the channel centerline. In the worst case, the running averageof the streamwise velocity variance ranges within a band of no more that 1% with respectto its final value. A validation study of the solver for Couette flow is reported in Pirozzoliet al. (2011), and not repeated here.
As frequently quoted in the literature (Komminaho et al. 1996; Tsukahara et al. 2006),numerical simulations of plane Couette flow using periodic boundary conditions in thestreamwise and in the spanwise direction tend to be significantly affected by the sizeof the computational box, which may yield unnatural confinement effects. This effectis monitored through the two-point correlation of the streamwise velocity fluctuations(Ruu), which is shown in figure 1, at the channel centerline. Regarding the streamwisedirection (panel (a)), similar conclusions can be drawn as by Tsukahara et al. (2006),

4 S. Pirozzoli, M. Bernardini, P. Orlandi
(a)
0 3 6 9
-0.2
0
0.2
0.4
0.6
0.8
1C
uu
x/(πh)
(b)
0 1 2 3 4
-0.6
-0.4
-0.2
0
0.2
0.4
0.6
0.8
1
Cuu
z/(πh)
Figure 1: Streamwise (a) and spanwise (b) two-point correlation coefficient (Ruu) ofstreamwise velocity fluctuations at the channel centerline. See table 1 for nomenclatureof the DNS data.
in that the box size is at least sufficient to have inversion in the sign of the correlationcoefficient, which means that at least one streamwise wavelength is captured withinthe computational box. Contrary to the observations of Tsukahara et al. (2006), we donot note significant Reynolds number dependence for these statistics. The correlationcoefficients in the spanwise direction are shown in figure 1(b). Results very similar asTsukahara et al. (2006) are found at the lower Reynolds numbers (flow cases C1, C2),with the correlation decaying sufficiently fast away from the origin. However, at higherReynolds numbers the first negative peak, which yields a typical spanwise size of the large-scale motions developing in the channel core, shifts to higher values, and the correlationdoes not drop off to zero at the maximum separation. This observation can be interpretedwith the emergence of large-scale streaks/rollers in the core flow, which become strongeras the Reynolds number is increased. As discussed later, these streaks/rollers have atypical spanwise size of about 5h, and they have a nearly sinusoidal dependence onthe spanwise coordinate. Hence, their correlation length scale is nominally infinite. Thisimplies that any simulation with finite spanwise extent is contaminated by confinementeffects, and the case is also likely to be in experiments. The results shown in the following(and probably all experimental and numerical results for Couette flow) should then beinterpreted with this caveat in mind.
3. Results
3.1. Velocity statistics
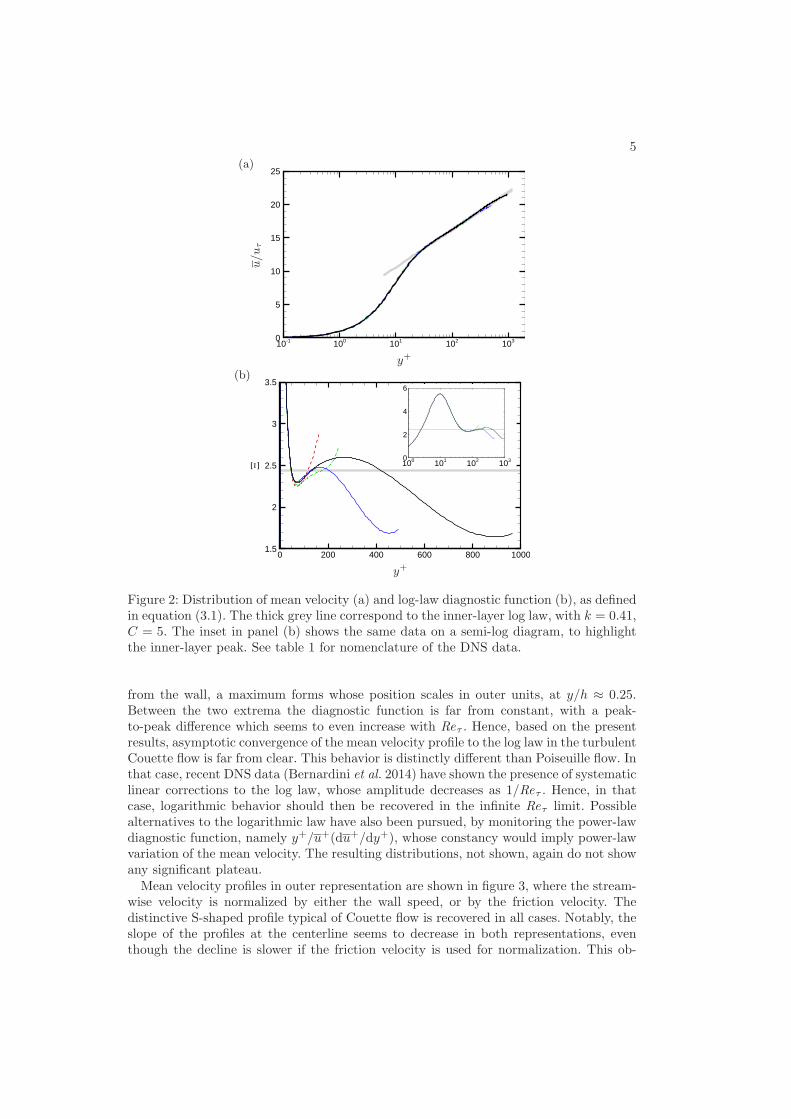
The mean streamwise velocity profiles for the C1-4 simulations are shown in figure 2(a),which well highlights the onset of a layer with nearly logarithmic velocity variation,whose width apparently increases with Reτ . Visually fitting the Couette data with alogarithmic velocity distribution u+ = 1/k log y+ + C suggests that the classical set oflog-law coefficients k ≈ 0.41, C ≈ 5, adequately reproduces the DNS data. More refinedinformation on the behavior of the mean velocity profile can be gained from inspectionof the log-law diagnostic function
Ξ = y+ du+/dy+, (3.1)
shown in figure 2(b), whose constancy would imply the presence of a genuine logarithmiclayer in the mean velocity profile. The figure supports universality of the mean velocityin inner units, with a near-wall maximum of about 5.5, which is nearly identical as inPoiseuille flow (Bernardini et al. 2014), followed by a minimum at y+ ≈ 60. Further away
5
(a)
10-1 100 101 102 1030
5
10
15
20
25
y+
u/uτ
(b)
0 200 400 600 800 10001.5
2
2.5
3
3.5
100 101 102 1030
2
4
6
y+
Ξ
Figure 2: Distribution of mean velocity (a) and log-law diagnostic function (b), as definedin equation (3.1). The thick grey line correspond to the inner-layer log law, with k = 0.41,C = 5. The inset in panel (b) shows the same data on a semi-log diagram, to highlightthe inner-layer peak. See table 1 for nomenclature of the DNS data.
from the wall, a maximum forms whose position scales in outer units, at y/h ≈ 0.25.Between the two extrema the diagnostic function is far from constant, with a peak-to-peak difference which seems to even increase with Reτ . Hence, based on the presentresults, asymptotic convergence of the mean velocity profile to the log law in the turbulentCouette flow is far from clear. This behavior is distinctly different than Poiseuille flow. Inthat case, recent DNS data (Bernardini et al. 2014) have shown the presence of systematiclinear corrections to the log law, whose amplitude decreases as 1/Reτ . Hence, in thatcase, logarithmic behavior should then be recovered in the infinite Reτ limit. Possiblealternatives to the logarithmic law have also been pursued, by monitoring the power-lawdiagnostic function, namely y+/u+(du+/dy+), whose constancy would imply power-lawvariation of the mean velocity. The resulting distributions, not shown, again do not showany significant plateau.
Mean velocity profiles in outer representation are shown in figure 3, where the stream-wise velocity is normalized by either the wall speed, or by the friction velocity. Thedistinctive S-shaped profile typical of Couette flow is recovered in all cases. Notably, theslope of the profiles at the centerline seems to decrease in both representations, eventhough the decline is slower if the friction velocity is used for normalization. This ob-

6 S. Pirozzoli, M. Bernardini, P. Orlandi
(a)
-1 -0.8 -0.6 -0.4 -0.2 0 0.2 0.4 0.6 0.8 1-1
-0.8
-0.6
-0.4
-0.2
0
0.2
0.4
0.6
0.8
1
η
u/uc
(b)
-1 -0.8 -0.6 -0.4 -0.2 0 0.2 0.4 0.6 0.8 1-10
-5
0
5
10
η
u/uτ
Figure 3: Mean velocity profiles scaled with uc (a) and with uτ (b). See table 1 fornomenclature of the DNS data.
servation has some interesting theoretical impact, as it relates to the asymptotic shapeof the velocity profile in the Reτ → ∞ limit. In this respect, several (often conflicting)statements have been made. According to some studies, the centerline velocity slopein outer units, S = h/uc(du/dy), should asymptote to a constant, typically quoted tobe S ≈ 0.2 (Busse 1970), whereas according to other the inner-scaled velocity slopeRs = h/uτ (du/dy) should approach a limit value (Townsend 1976). However, none ofthe two scenarios has received any convincing support either in DNS or experiments (Ki-toh et al. 2005), and different authors report different trends with Re. This is probably aconsequence of experimental difficulties in measuring small velocity differences in internalflows. The slope parameters from the present DNS are shown in figure 4, as a function ofRec, with additional data from earlier studies. Overall, we find substantial decrease of S,but we also notice slight decline of Rs. This observation seems to suggest that the defectlaw u(y)/uτ = g(η) is not fully established (at least in this Reynolds number range),and thus the correct outer velocity scale is not simply uτ . The issue of whether the innerslope parameter Rs attains a constant value cannot be sorted out based on the presentdata. Nevertheless, either if the decreasing trend continues or an asymptote is reached, itappears that the asymptotic core profile of Couette flow shall be flat in inner units (andin outer units as well), since uc/uτ → ∞ as Reτ → ∞, and all the velocity difference iseventually supported in infinitely thin viscous layers adjacent to the walls.Strictly related to the behavior of the mean velocity profile is the friction law. Most
studies of Couette flow refer to empirical approximations for the friction law, as thatgiven by Robertson (1959),
Cf =G
logRe2c, (3.2)
where Cf = 2τw/(ρu2c), and various choices for the constant have been proposed, in-
cluding G = 0.383 (Robertson 1959), G = 0.351 (El Telbany & Reynolds 1982), G =0.420 (Tsukahara et al. 2006), G = 0.382 (Kitoh et al. 2005). Using the log-law repre-sentation of the mean velocity profile the following friction law is obtained (Schlichting& Gersten 2000)
√
2
Cf=
1
klog
(
Rec
√
Cf
2
)
+ C + C, (3.3)
where C depends on the deviation of the core velocity profile from the log law. In figure 5we show the present DNS data together with experimental data from several sources,

7
(a)
102 103 104 1050
0.05
0.1
0.15
0.2
0.25
0.3
Rec
S(b)
102 103 104 1050
1
2
3
4
5
6
Rec
Rs
Figure 4: Mean velocity slope at centerline, scaled with uc/h (a) and with uτ/h (b), as afunction of Reynolds number. The solid circles denote the present DNS data. The opensymbols denote experimental data from Komminaho et al. (1996) (squares); Tsukaharaet al. (2006) (diamonds); El Telbany & Reynolds (1982) (up-triangles); Kitoh et al. (2005)(down-triangles) The solid line denotes the fit S = 0.34/ log10 Rec (Robertson 1959).
*******************
102 103 104 1050
0.002
0.004
0.006
0.008
0.01
0.012
Rec
Cf
Figure 5: Comparison of skin friction coefficient with correlations and experiments. Thesolid circles denote DNS from the C1-4 datasets. Filled symbols refer to previous DNSdata by Bech et al. (1995) (squares); Komminaho et al. (1996) (triangles); Tsukaharaet al. (2006) (diamonds). Open symbols refer to experimental data by El Telbany &Reynolds (1982) (up-triangles); Kitoh et al. (2005) (down-triangles); Reichardt (1956)(diamonds); Robertson (1959) (stars). The solid line indicates the logarithmic frictionlaw (3.3) with k = 0.41, C = 5, C = 0; the dashed line indicates the friction law (3.2)with G = 0.424.
compared with formulas (3.2),(3.3). It appears that our data are consistent with previousDNS data at lower Reynolds number, altough they seem to be out of trend with respectto most experimental data (differences with respect to El Telbany & Reynolds (1982) areup to 20%), except for those of Reichardt (1956). Furthermore, our DNS data appear tobe well consistent with the logarithmic friction law, by selecting k ≈ 0.41, C ≈ 5, C = 0(see figure 2), at least for Rec & 103, sufficient to observe a sensible near-logarithmiclayer. The power-law fit (3.2) also appears to deliver adequate representation of the DNSdata, by setting G = 0.424.
The second-order velocity fluctuations statistics are shown in inner coordinates in

8 S. Pirozzoli, M. Bernardini, P. Orlandi
(a)
100 101 102 1030
2
4
6
8
10
y+
u′2/u2 τ
(b)
100 101 102 1030
0.5
1
1.5
2
2.5
3
y+
w′2/u2 τ
(c)
100 101 102 1030
0.5
1
1.5
y+
v′2/u2 τ
(d)
100 101 102 1030
0.2
0.4
0.6
0.8
1
y+
−u′v′/u2 τ
Figure 6: Distribution of Reynolds stress components across the channel in wall units.Refer to table 1 for nomenclature of the DNS data.
5000 10000 15000 200000.9
1
1.1
1.2
1.3
1.4
Rec
max(u
′ iu′ j)/
max(u
′ iu′ j)(C1)
Figure 7: Peak Reynolds stress components as a function of Rec, normalized by theirvalue for the C1 flow case. Symbols: i = j = 1, circles; i = j = 2, diamonds; i = j = 3,squares; i = 1, j = 2, triangles.
figure 6, and their peaks reported in figure 7 as a function of Rec. The main impressiongained from the figures is that the trends observed in Poiseuille flow (Hoyas & Jimenez2006; Bernardini et al. 2014) continue to hold. Specifically, the longitudinal (a) andthe transverse (b) normal stresses show clear lack of universality, and their amplitudesincrease nearly logarithmically with Reτ . This behavior has been attributed (Metzger& Klewicki 2001; del Alamo et al. 2004; Mathis et al. 2009) to the increasing influenceof inactive outer-layer modes. It is noteworthy that in the C4 flow case the Reynolds

9
number is high enough that a secondary outer peak of u′2 appears around y+ ≈ 300(y/h ≈ 0.33). The existence of a secondary peak of the streamwise velocity variance hasbeen the subject of significant disputes in recent years (Hultmark et al. 2012), and it hassometimes been attributed to limited probe resolution effects in experiments. Alfredssonet al. (2011, 2012) proposed that in pipes, channel flows, and boundary layers, a secondarypeak in u′2 should arise at Reτ & 15000, thus explaining why it has not been observedin recent plane channel flow DNS at Reτ ≈ 4000 (Bernardini et al. 2014). Those authors
noticed that the position of the outer peak scales as Re1/2τ , hence it is proportional tothe position of the turbulent shear stress peak. As a consequence, the secondary peakshould rather be interpreted as a second inner peak than a real outer peak. The natureof the secondary peak here observed for Couette flow is probably different than in othercanonical wall-bounded flows, occurring much earlier in term of Reynolds number, andresiding at much larger distance from the wall.
The wall-normal velocity fluctuations and the turbulent shear stress (see panels (c),(d))exhibit near-universality in inner scaling. This behavior is entirely consistent with Townsend’sattached-eddy hypothesis (Townsend 1976), however, it is somewhat different from thecase of Poiseuille flow, in which the wall-normal stress exhibits slow but consistent growthwith Reτ (Bernardini et al. 2014), consistent with the continuing growth of the peak tur-bulent shear stress.
3.2. Velocity spectra
The emergence of an outer peak of the streamwise Reynolds stress can be well understoodby monitoring the pre-multiplied spectral densities of u, shown in figure 8. The figurehighlights the presence of a main energetic inner-layer site at y+ ≈ 15, corresponding toinner-layer streaks with a typical wavelength of about 100 wall units, which is roughlyuniversal across the Reynolds number range, for all wall-bounded flows (Monty et al.
2009). Similar to other canonical flows, the spectra also exhibit a secondary energetic sitein the outer layer, whose intensity increases in wall units, and which has been traditionallyassociated with boundary layer superstructures (Hutchins & Marusic 2007), and large-scale and very-large-scale motions in internal flows (Hoyas & Jimenez 2006; Kim &Adrian 1999). In the case of the Couette flow we find that the spectral footprint of theseorganized structures consists of a nearly pure tone at the wavelength λz ≈ 5h, with aweaker secondary harmonic spectral line visible in the C3 and C4 flow cases. The intensityof the outer peak appears to be much higher than in other wall-bounded flows at the sameReynolds number. Apparently, the effect of the peak is felt all the way down to the wall,especially at the higher Reynolds numbers. It is noteworthy that the spectral signaturein the core part of the flow is consistent with simple inviscid models of rollers (Waleffe1997; Papavassiliou & Hanratty 1997), which predict u(y, z) ∼ cos(π/2η) cos(βz), whereβ = 2π/λz is the roll wavenumber in the spanwise direction.
The observed structural flow changes with Reτ can be interpreted by monitoring thelocal excess of kinetic energy production (P = −(du/dy)u′v′) over its dissipation rate(ε = 2νs′ijs
′
ij). This is shown in figure 9, where we report the distributions of P−ε in pre-multiplied form, so that equal areas underneath the curves correspond to equal integralcontributions. Figure 9 confirms the presence of a strong excess of production centeredat y+ ≈ 15, which corresponds to the near-wall turbulence self-sustainment cycle, andwhich is universal in wall units. However, the figure also shows the onset of a secondaryspot with excess production, whose position moves outwards in wall units. Notably, in theC4 flow case, the peak location coincides with the position of the secondary peak of thestreamwise velocity variance (see figure 6a). At the highest Reynolds number achievedin the present study, that peak accounts for an integrated production excess which is

10 S. Pirozzoli, M. Bernardini, P. Orlandi
(a) (b)
(c) (d)
Figure 8: Variation of pre-multiplied spanwise spectral density of u (kzEuu/u2τ ) with wall
distance, for flow cases C1 (a), C2 (b), C3 (c), C4 (d). Twelve contour levels are shown,from 0.32 to 3.8.
10-1 100 101 102 103-1.5
-1
-0.5
0
0.5
1
1.5
y+
y+(P
+−
ε+)
Figure 9: Distribution of pre-multiplied turbulence kinetic energy production excess. Seetable 1 for nomenclature of the DNS data.
about 20% as the inner production site. Hence, its effect on the overall wall dynamics iscertainly not negligible, and it is observed to increase with Reτ . A similar (even thoughmuch less evident) effect has also been observed in Poiseuille flow (Hoyas & Jimenez2008; Bernardini et al. 2014). The presence of the outer peak implies that the excess

11
(a)
100 101 102 103-0.5
0
0.5
1
1.5
y+
S(u)
(b)
100 101 102 1032
4
6
y+
F(u)
Figure 10: Skewness (a-b) and flatness (c-d) of streamwise velocity fluctuations. Seetable 1 for nomenclature of the DNS data.
turbulence kinetic energy is transferred toward the channel core and to the underlyinglayers, mainly because of the action of turbulent diffusion, and indeed we have verifiedthat the contributions of pressure and viscous diffusion are negligible. This observationpoints to the activation of top-down mechanisms of influence of wall-distant eddies onthe near-wall ones, in addition to the conventional bottom-up scenario (Hunt & Morrison2001).
The presence of a top-down mechanism of influence is further evident in the streamwisevelocity skewness and flatness maps, shown in figure 10. An increasing trend of bothindicators is observed in the near-wall region, which suggests a more strongly intermittentcharacter of the velocity signal. The increased near-wall intermittency in wall-boundedflows has been related (Mathis et al. 2009) to the modulation imparted by large-scaleouter structures. In particular (Pirozzoli et al. 2011), it has been shown that in Couetteflow large-scale high-speed events are connected to increased near-wall small-scale activity(and vice-versa), mainly because of locally increased wall friction. More quantitativelySchlatter & Orlu (2010) have shown that the local skewness of the streamwise velocityfluctuations is strongly correlated with the one-point amplitude modulation coefficient.
3.3. Large-scale motions
A visual impression of the large-scale eddies which form in the channel core is providedin figure 11(a), where we show streamwise velocity fluctuation contours in the channelsymmetry plane (η = 0). A distinctive organization into h-scaled high- and low-speedstreaks is evident, which maintain some coherence along the whole length of the channel,while also showing some meandering. The same type of representation is used for across-stream plane in figure 11(b), which shows that the core flow is mainly organizedinto ‘towering’ eddies which are attached to the walls, and which reach out to the oppositewall. Large-scale coherence is made clearer by averaging the flow fields in the streamwisedirection, thus effectively filtering out small-scale fluctuations, as well as the streaksmeandering (Papavassiliou & Hanratty 1997). In figure 11(c),(d) we show contours of thestreamwise-averaged velocity fluctuations (u), and of the averaged streamwise vorticity(ωx), respectively. A clearer pattern emerges, with streaks having width of about 5hand occupying the whole channel thickness, and associated rollers, which show up in theform of alternating positive/negative streamwise vorticity zones. This pattern has beenthe subject of several previous studies (Waleffe 1997; Papavassiliou & Hanratty 1997;Tsukahara et al. 2006; Hwang & Cossu 2010), at much lower Reynolds number.
The quantitative effect of the core-flow rollers is considered next, by taking statisticsof the velocity fluctuations associated with the streamwise-averaged fields. The resulting

12 S. Pirozzoli, M. Bernardini, P. Orlandi
(a)
(b)
(c)
(d)
Figure 11: Visualization of instantaneous streamwise velocity in the channel centerplane(a) and in a cross-stream plane (b). Streamwise averages of u and of streamwise vorticityωx are given in frames (c) and (d). Note that axes in panels a-c are not to scale. Contourlevels of u below −uτ are shown in black, and contour levels above uτ are shown in grey.Contour levels of ωx below −uτ/h are shown in black, and contour levels above uτ/h areshown in grey.

13
(a)
100 101 102 1030
0.5
1
1.5
2
2.5
3
3.5
4
y+
(u−
u)2/u2 τ
(b)
100 101 102 1030
0.05
0.1
0.15
0.2
y+
w2/u2 τ
(c)
100 101 102 1030
0.05
0.1
y+
v2/u2 τ
(d)
100 101 102 1030
0.2
0.4
0.6
0.8
y+
−uv/u2 τ
Figure 12: Distribution of coherent Reynolds stress components. The tilde symbol denotesinstantaneous averaging in the streamwise direction. See table 1 for nomenclature of theDNS data.
‘coherent-stress’ components are shown in figure 12. The coherent part of the streamwisevelocity variance is found to grow toward the channel centerline, attaining a peak at adistance y/h ≈ 0.4 for flow cases C3, C4, which one can tentatively connect with thesecondary peak of the streamwise Reynolds stress observed in figure 6. Its magnitudeis found to account for about 50% of the overall velocity variance in the core part ofthe flow. Similar reasonings apply to the coherent turbulent shear stress, which if foundto peak at the channel centerline, and which accounts for about half of the total shearstress. On the other hand, the rollers are found to contain little wall-normal and spanwisevelocity fluctuations, probably because the v- and w-bearing eddies are less coherent inthe streamwise direction, and undergo cancellation because of the averaging procedure.All the coherent stresses appear to increase with Reτ when expressed in wall units, thusindicating increased importance of the core mode in the global dynamics.
4. Conclusions
Flow statistics from DNS of turbulent Couette flow at computationally high Reynoldsnumber have been presented, in a range of Reτ which well exceeds previous datasets. AtReτ & 500 effects which are believed to be typical of the asymptotic high-Re regime startto manifest themselves. Visual fit of the mean velocity profiles suggests the formation of arange with near logarithmic behavior of the mean velocity, which is compatible with theclassical set of coefficients, namely k = 0.41, C = 5. This fit is also adequate for practicalpurposes, in that the skin friction data are consistent with the classical logarithmicfriction law, with zero value of the outer-layer constant. However, close inspection of the

14 S. Pirozzoli, M. Bernardini, P. Orlandi
log-law indicator function shows, rather than a plateau, significant excursions betweentwo extrema, which become more severe as Reτ is increased. Hence, extrapolation of thepresent data would suggest that a genuine log layer is not going to be found in Couetteflow, even at extreme Reynolds number. This is in contrast with recent data for Poiseuilleflow, which supports convergence to the logarithmic law, although only in the infiniteReynolds number limit. Data at yet higher Reτ are certainly welcome to further verifythis trend. The core velocity profile is found to be linear over a narrow interval acrossthe centerline, and its minimum slope is found to slowly decrease in wall units. This is astrong hint that the asymptotic state of turbulent Couette flow consists of a flat velocityprofile with finite slip at the two walls. Similar to other wall-bounded flows, the wall-parallel velocity variances exhibit a near-wall peak which seems to diverge logarithmicallywith Reτ , and connected in the classical scenario with Townsend’s attached eddies.
Notably, a secondary outer peak of the streamise velocity variance is observed in thehighest Re simulation, which has not been observed so far in DNS of other canonicalwall-bounded flows. This outer peak if found to occur at y/h ≈ 0.3, and to well matchthe position of the outer site at which turbulence kinetic energy production exceeds dis-sipation. From a structural viewpoint, the emergence of excess energy in the outer layerhas been traced to the presence of rollers/streaks which occupy the whole channel, andwhose spectral signature consists of a sharp peak at a wavelength of about five channelhalf-heights. Conditional statistics have shown that these large eddies are responsible fora substantial fraction of the streamwise Reynolds stress, hence contributing to the forma-tion of the outer peak of u′, and to account for about a half of the turbulent shear stressin the channel core. Hence, they are likely to be responsible for the observed deviations ofthe mean velocity profile from a genuine logarithmic behavior. A side consequence of ourobservations is that, given the nearly sinusoidal behavior of the rollers in the spanwisedirection, their correlation length scale is nominally infinite. Hence, data from both DNSand experiments of Couette flow are likely to be always contaminated by side effects,which would explain the large scatter observed in the existing literature, even for verybasic flow properties.
Given this caveat, we believe that the present findings reinforce the statements madein Pirozzoli et al. (2011), that Couette flow can be regarded as an extreme state ofwall turbulence, which can be used to explore with clarity phenomena of imprinting andmodulation, without necessarily reverting to extreme-Reynolds-number simulations.
We acknowledge that some of the results reported in this paper have been achieved us-ing the PRACE Research Infrastructure resource FERMI based at CINECA, Casalecchiodi Reno, Italy.
REFERENCES
del Alamo, J. C., Jimenez, J., Zandonade, P. & Moser, R. D. 2004 Scaling of the energyspectra of turbulent channels. J. Fluid Mech. 500, 135–144.
Alfredsson, P.H., Orlu, R. & Segalini, A. 2012 A new formulation for the streamwiseturbulence intensity distribution in wall-bounded turbulent flows. Europ. J. Mech.-B/Fluids36, 167–175.
Alfredsson, P.H., Segalini, A. & Orlu, R. 2011 A new scaling for the streamwise turbulenceintensity in wall-bounded turbulent flows and what it tells us about the ‘outer’ peak.Phys. Fluids 23, 041702.
Avsarkisov, V., Hoyas, S., Oberlack, M. & Garcıa-Galache, J.P. 2014 Turbulent planeCouette flow at moderately high Reynolds number. J. Fluid Mech. 751, R1.

15
Aydin, E.M. & Leutheusser, H.J. 1991 Plane-Couette flow between smooth and rough walls.Exp. Fluids 11, 302–312.
Bech, K.H., Tillmark, N., Alfredsson, P.H. & Andersson, H.I. 1995 An investigation ofturbulent plane Couette flow at low Reynolds numbers. J. Fluid Mech. 286, 291–325.
Bernardini, M, Pirozzoli, S & Orlandi, P 2014 Velocity statistics in turbulent channel flowup to Reτ = 4000. J. Fluid Mech. 742, 171–191.
Bernardini, M, Pirozzoli, S, Quadrio, M & Orlandi, P 2013 Turbulent channel flowsimulations in convecting reference frames. J. Comput. Phys. 232, 1–6.
Busse, F.H. 1970 Bounds for turbulent shear flow. J. Fluid Mech. 41, 219–240.
El Telbany, M. M. M. & Reynolds, A. J. 1982 Velocity distributions in plane turbulentchannel flows. Trans. ASME: J. Fluids Engng. 104, 367–372.
Hamilton, J. M., Kim, J. & Waleffe, F. 1995 Regeneration mechanisms of near-wall turbu-lent structures. J. Fluid Mech. 287, 317348.
Hoyas, S. & Jimenez, J. 2006 Scaling of velocity fluctuations in turbulent channels up toReτ = 2003. Phys. Fluids 18, 011702.
Hoyas, S. & Jimenez, J. 2008 Reynolds number effects on the Reynolds-stress budgets inturbulent channels. Phys. Fluids 20, 101511.
Hultmark, M., Vallikivi, M., Bailey, S.C.C. & Smits, A.J. 2012 Turbulent pipe flow atextreme Reynolds numbers. Phys. Rev. Lett. 108, 094501.
Hunt, J.C.R. & Morrison, J.F. 2001 Eddy structure in turbulent boundary layers.Eur. J. Mech. B Fluids 19, 673–694.
Hutchins, N. & Marusic, I. 2007 Evidence of very long meandering features in the logarithmicregion of turbulent boundary layers. J. Fluid Mech. 579, 1–28.
Hwang, Y. & Cossu, C. 2010 Amplification of coherent streaks in the turbulent Couette flow:an input-output analysis at low Reynolds number. J. Fluid Mech. 643, 333–348.
Kim, J. & Moin, P. 1985 Application of a fractional-step method to incompressible Navier-Stokes equations. J. Comput. Phys. 59, 308–323.
Kim, K.C. & Adrian, R.J. 1999 Very large-scale motion in the outer layer. Phys. Fluids 11,417–422.
Kitoh, O., Nakabayashi, K. & Nishimura, F. 2005 Experimental study on mean velocityand turbulence characteristics of plane Couette flow: low-Reynolds-number effects and largelongitudinal vortical structure. J. Fluid Mech. 539, 199–227.
Kitoh, O. & Umeki, M. 2008 Experimental study on large-scale streak structure in the coreregion of turbulent plane Couette flow. Phys. Fluids 20, 025107.
Komminaho, J., Lundbladh, A. & Johansson, A.V. 1996 Very large structures in planeturbulent Couette flow. J. Fluid Mech. 320, 259–285.
Lee, M.J. & Kim, J. 1991 The structure of turbulence in a simulated plane Couette flow. pp.5.3.1–5.3.6. Munich: Proc. 8th Symp. Turbulent Shear Flows.
Mathis, R., Hutchins, N. & Marusic, I. 2009 Large-scale amplitude modulation of the small-scale structures in turbulent boundary layers. J. Fluid Mech. 628, 311–337.
Metzger, M.M. & Klewicki, J.C. 2001 A comparative study of near-wall turbulence in highand low Reynolds number boundary layers. Phys. Fluids 13, 692–701.
Monty, J.P., Hutchins, N., Ng, H.C.H., Marusic, I. & Chong, M.S. 2009 A comparisonof turbulent pipe, channel and boundary layer flows. J. Fluid Mech. 632, 431–442.
Orlandi, P. 2000 Fluid fow phenomena: a numerical toolkit . Kluwer.
Papavassiliou, D.V. & Hanratty, T.J. 1997 Interpretation of large-scale structures observedin a turbulent planet Couette flow. Int. J. Heat Fluid Flow 18, 55–69.
Pirozzoli, S., Bernardini, M. & Orlandi, P. 2011 Large-scale organization and inner-outerlayer interactions in turbulent Couette-Poiseuille flows. J. Fluid Mech. 680, 534-563.
Pope, S.B. 2000 Turbulent flows. Cambridge University Press.
Reichardt, H. 1956 Uber die Geschwindigkeitsverteilung in einer geradlinigen turbulentenCouettestromung. Z. Angew. Math. Mech. 36, 26–29.
Robertson, J.M. 1959 On turbulent plane Couette flow. In Proc. Sixth Midwestern Conf. onFluid Mechanics, pp. 169–182. Univ. of Texas, Austin.
Schlatter, P. & Orlu, R. 2010 Quantifying the interaction between large and small scalesin wall-bounded turbulent flows: a note of caution. Phys. Fluids 22, 051704.
16 S. Pirozzoli, M. Bernardini, P. Orlandi
Schlichting, H. & Gersten, K. 2000 Boundary layer theory . 8th edn. Springer-Verlag.Tillmark, N. & Alfredsson, P.H. 1992 Experiments on transition in plane Couette flow. J.
Fluid Mech. 235, 89–102.Tillmark, N. & Alfredsson, P.H. 1998 Large scale structures in turbulent plane Couette
flow pp. 59–62.Townsend, A.A. 1976 The Structure of Turbulent Shear Flow . 2nd edn. Cambridge University
Press.Tsukahara, T., Kawamura, H. & Shingai, K. 2006 DNS of turbulent Couette flow with
emphasis on the large-scale structure in the core region. J. Turbul. 7, 1–16.Waleffe, F. 1997 On a self-sustaining process in shear flows. Phys. Fluids 9, 883–900.


![University of Surreyepubs.surrey.ac.uk/810776/1/Accepted_manuscript[1].docx · Web viewKinetic theories for granular flow: inelastic particles in couette flow and slightly inelastic](https://img.dokumen.tips/doc/110x75/60c9ca1a97e7a81a0626a1ec/university-of-1docx-web-view-kinetic-theories-for-granular-iow-inelastic.jpg)


